1. Introduction
Acoustic motion in nanoscale objects induced by light is of importance for both fundamental science and applications. This interest is due to various potential applications in acousto-optical devices which can be used for ultrafast manipulation and control of electromagnetic waves by hypersonic (GHz) acoustic waves [
1]. Colloidal crystals, formed by the self-assembly method, have shown phononic band gaps in the GHz frequency range [
2,
3,
4,
5,
6,
7]. Due to the recent progress in the fabrication of high-quality colloids, this provides an opportunity to produce inexpensive phononic crystals.
Dynamics in submicrometer colloidal crystals was investigated using different techniques such as Raman scattering [
8], Brillouin light scattering [
2], and optical pump-probe spectroscopy [
4,
5,
6,
7]. However, these methods have limited spatial resolution and are not suitable for the observation of the detailed structure of the sample. Furthermore, for some materials obtaining a sufficient refractive index is a challenging task, if not impossible.
At the same time, newly-developed X-ray free-electron lasers (XFELs) produce X-rays with unprecedented brightness, pulse duration and coherence, which are ideal for performing time-resolved experiments on various materials with a time resolution that outperforms that of third-generation synchrotron sources [
9,
10,
11]. Moreover, the femtosecond X-ray pulses from free-electron laser sources allow an investigation of transient states of time-dependent processes [
12,
13,
14,
15,
16,
17]. In this respect, XFELs are especially well suited for investigating ultrafast structural dynamics of colloidal crystals.
The vibrations of the colloidal crystals were recently measured at free-electron laser FLASH in Hamburg [
18]. The polystyrene colloidal crystals were pumped by an infrared (IR) laser of 800 nm and probed by an X-ray pulse with a wavelength of 8 nm. This pump-probe experiment indicated the possibility of observation of the dynamics in the colloidal crystals by diffraction with a FEL. To give a reliable interpretation of the observed results, it was necessary to investigate the dynamics with a larger time interval and better statistics.
Here we present the results of a time-resolved pump-probe diffraction experiment in which the ultrafast dynamics in colloidal crystals induced by an IR laser was investigated. A theoretical analysis of the vibrations of the colloidal crystals was performed, and the vibrational frequency was calculated. This analysis was applied to the experimental results.
2. Experiment
The pump-probe experiments were performed at the Linac Coherent Light Source (LCLS) [
9] in Stanford, USA at the X-ray Pump Probe (XPP) beamline [
19]. LCLS was operated in the Self Amplified Spontaneous Emission (SASE) mode [
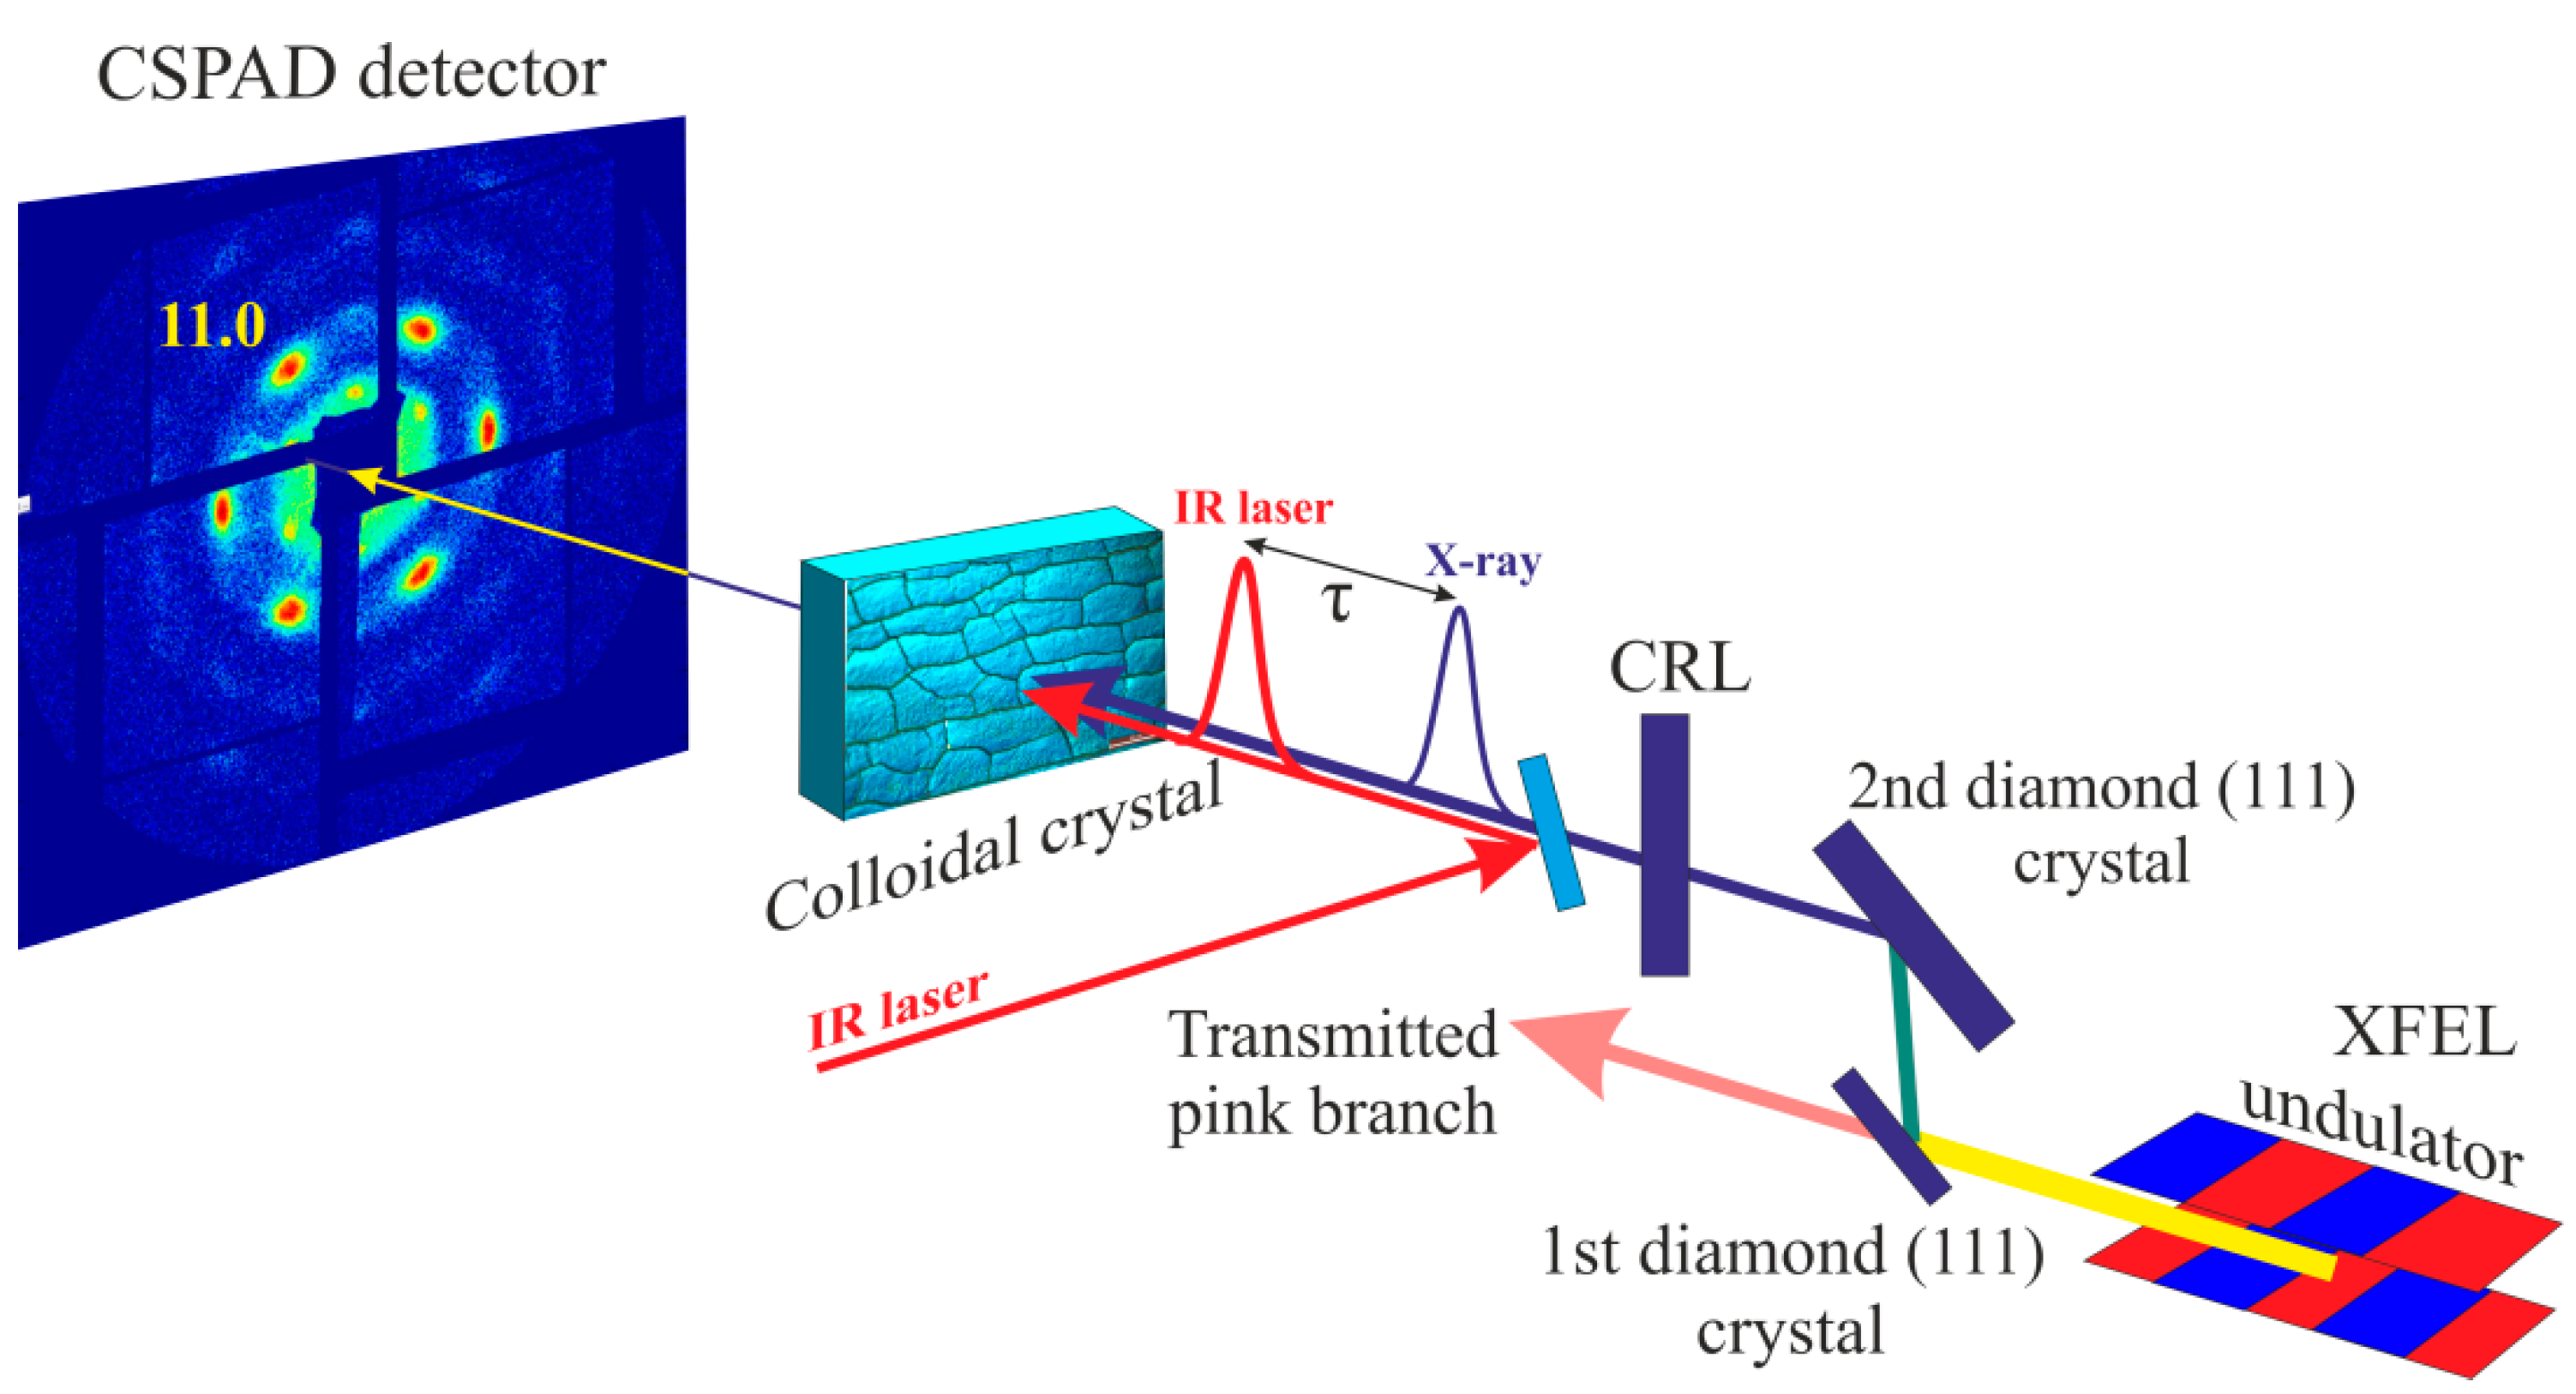
20]. A sketch of the experiment is shown in
Figure 1. A double-crystal diamond (111) monochromator with the thicknesses of the monochromator crystals of 100 µm and 300 µm, enabled splitting of the primary X-ray beam into a pink (transmitted) and a monochromatic (reflected) branches and simultaneous operation of two beamlines (see
Figure 1) [
21]. We employed the monochromatic regime of LCLS with the energy of a single XFEL pulse of 8 keV (1.5498 Å), energy bandwidth of 4.3 × 10
−5 [
22], and a pulse duration of about 50 fs as provided by electron bunch measurements at a repetition rate of 120 Hz.
The X-ray beam was focused using the compound refractive lenses (CRLs) on the sample down to 50 μm full width at half maximum (FWHM). The photon flux of the beam at the sample position was about 109 ph/pulse. This allowed us to perform measurements in a non-destructive regime. In the experiment, the colloidal crystal was oriented vertically, with its surface perpendicular to the incoming XFEL pulse in the transmission diffraction geometry.
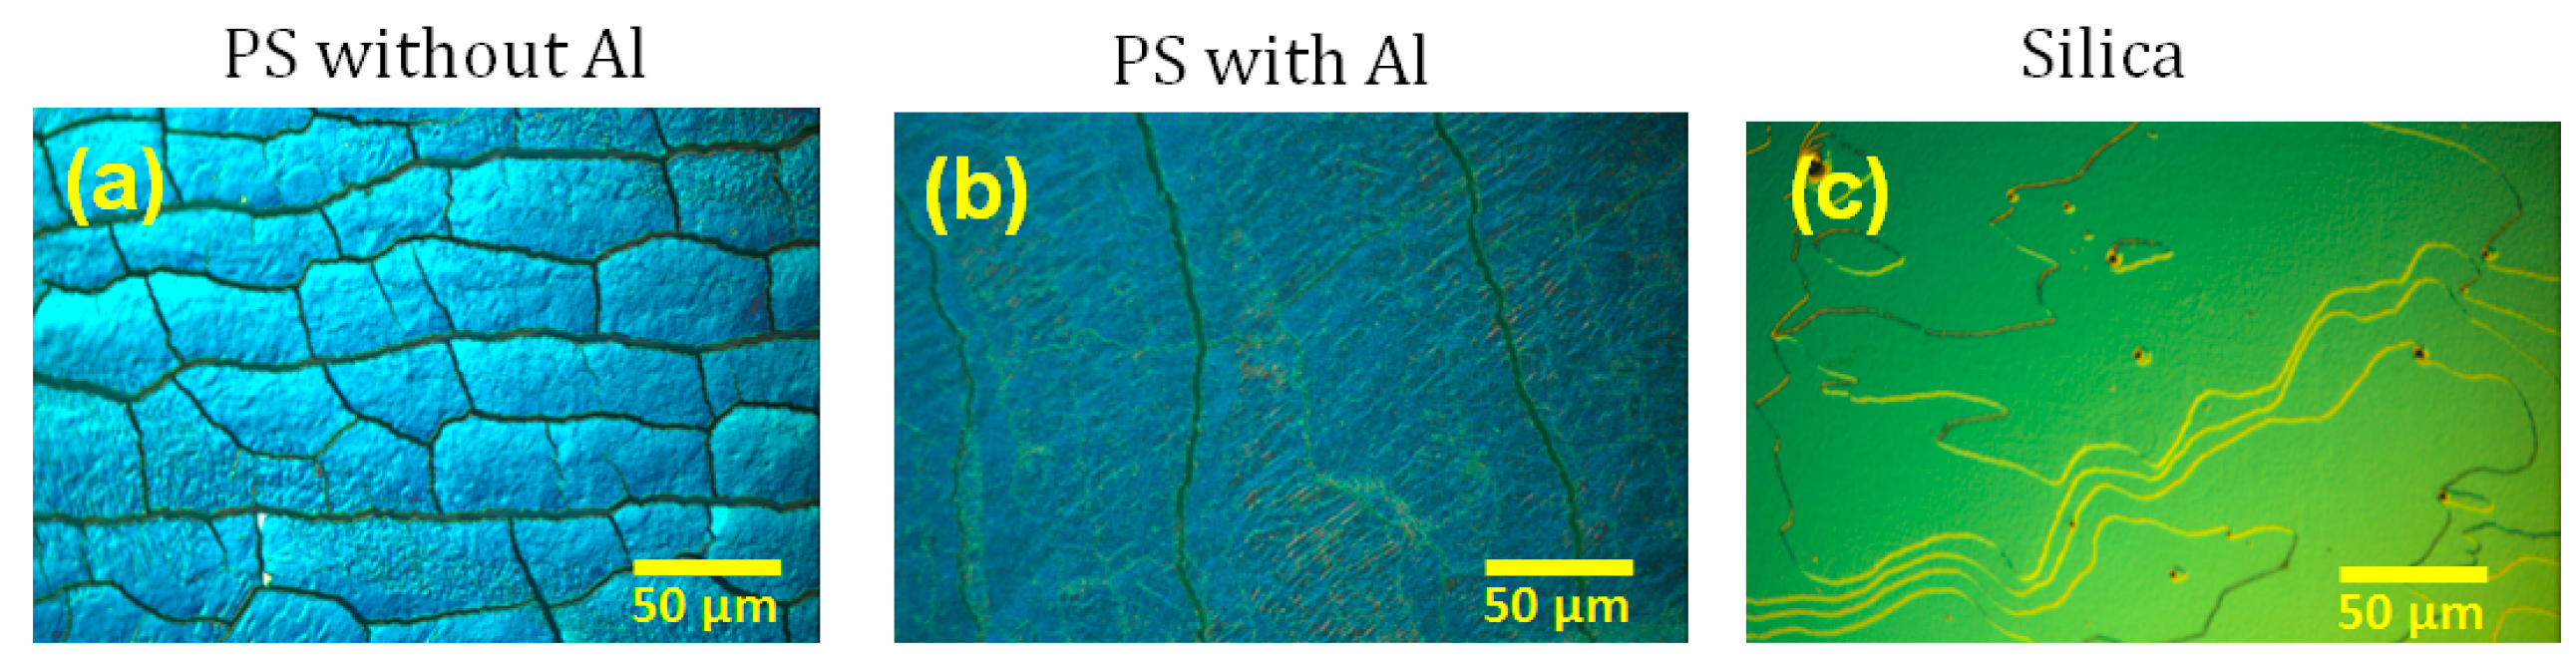
Colloidal crystal films were prepared using the vertical deposition method [
23] from spherical colloids consisting of two different materials, either polystyrene (PS) or silica. The crystalline films consisted of 30–40 particle layers, depending on the position on the film along the growth direction (the number of crystal layers increases at later growth times). After crystal growth, some of the films were covered with a 20–50 nm thick aluminum layer to increase interaction with the IR laser. In total, three types of samples were investigated: PS colloidal crystals, PS colloidal crystals covered by Al, and silica crystals, with different sphere diameters of 420 ± 9 nm, 376 ± 8 nm and 238 ± 7 nm, respectively. Due to the growing method, the dried colloidal crystal films used in our experiment contain cracks between single-crystal regions of about 50 µm in size. Microscopic images of these samples are shown in
Figure 2.
Series of X-ray diffraction images were recorded using the Cornell-SLAC Pixel Array Detector (CSPAD) megapixel X-ray detector [
24], positioned 10 m downstream from the sample, that is comprised of 32 silicon sensors with the pixel size of 110 × 110 µm
2 covering an area approximately 17 × 17 cm
2. This experimental arrangement provided resolution of 0.5 µm
−1 per pixel in reciprocal space. The 2.3 megapixels of the detector were read out at 120 Hz, encoded at 14 bits per pixel. In order to prevent damage of the detector, a 5 × 5 mm
2 Al beamstop was placed in front of it. To reduce air scattering, a 10 m long flight tube filled with He was mounted between the sample and the detector.
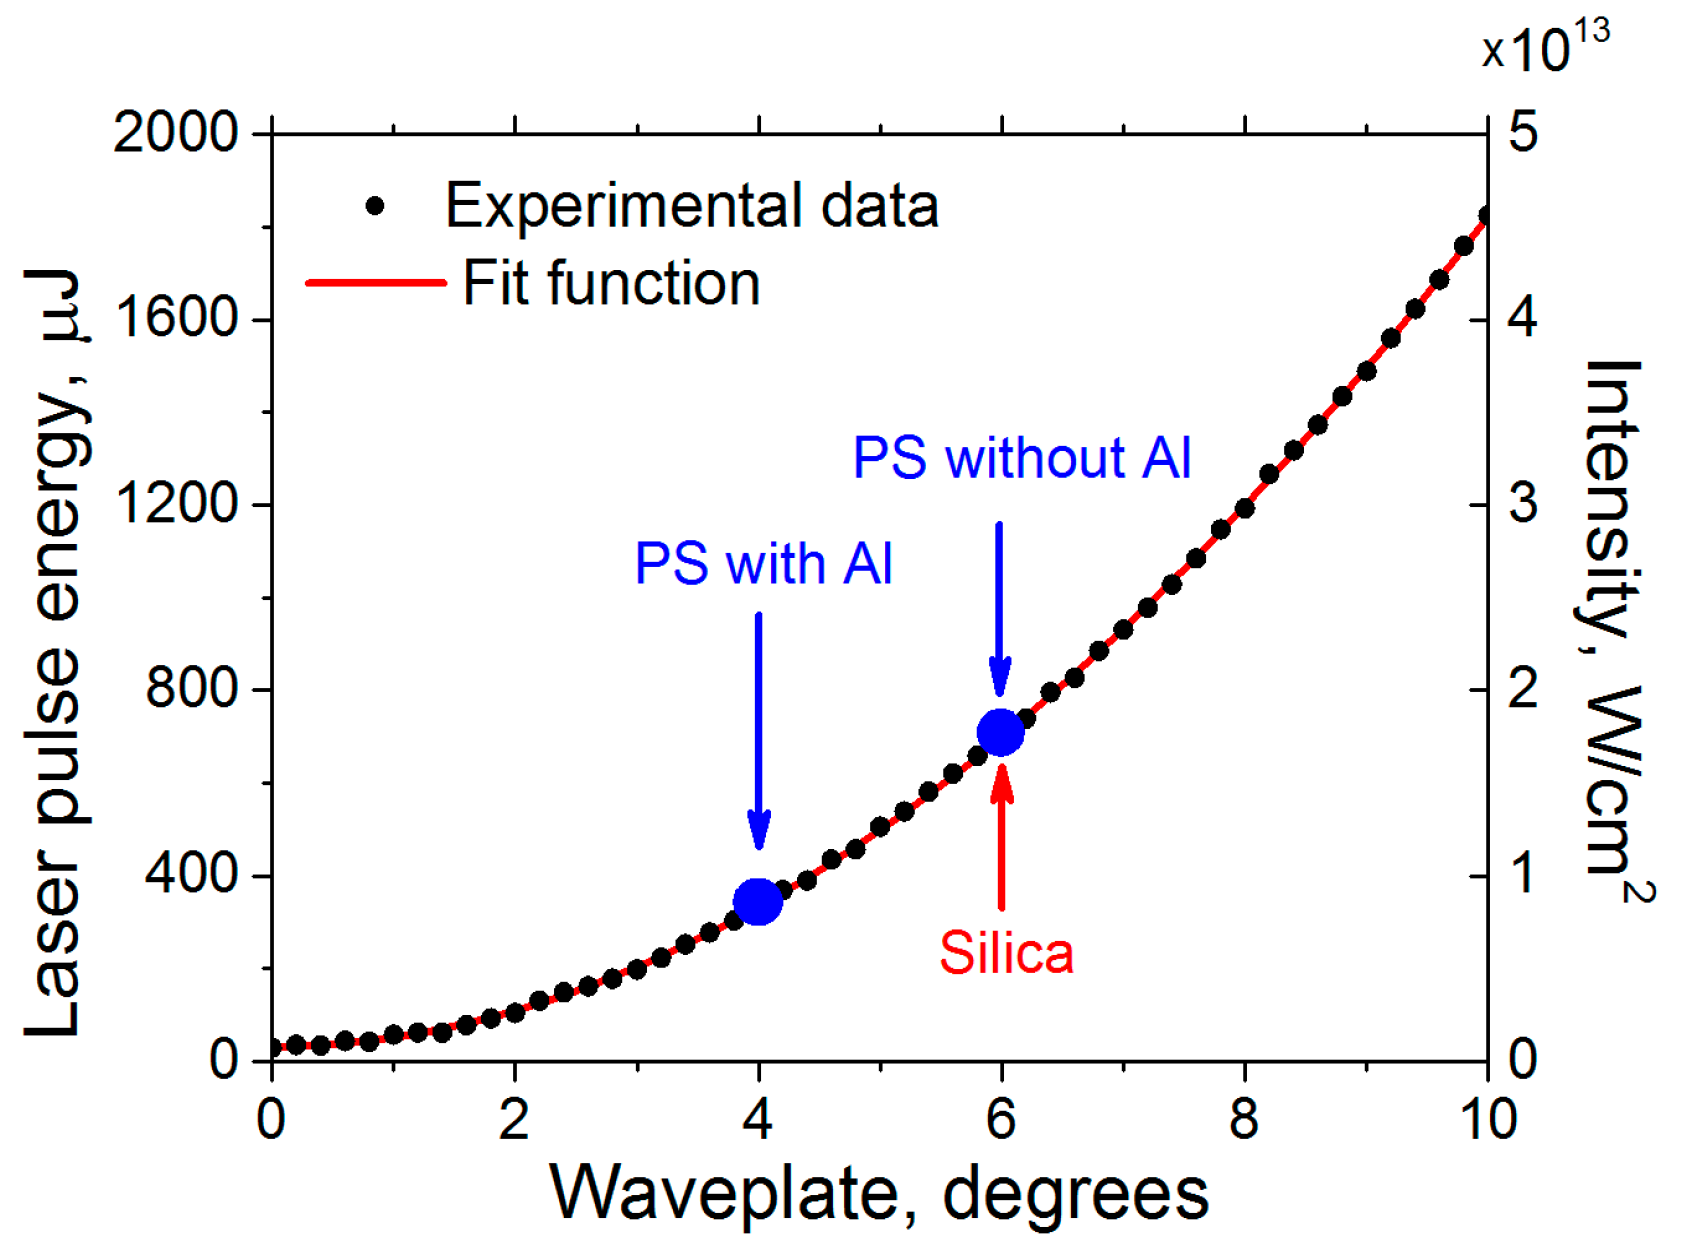
A Ti:sapphire IR laser was used to excite the colloidal crystal film. The pump pulses were generated with a wavelength λ = 800 nm (1.5497 eV) and duration about 50 fs (FWHM). The size of the laser footprint on the sample was 100 μm (FWHM) and, thus, twice larger in comparison to the X-ray beam. The corresponding intensity of the laser pulses was on the order of 1013 W/cm2” The IR laser pulses were propagating along the XFEL pulses and were synchronized to the pulses from the XFEL with less than 0.5 ps jitter.
The IR laser energy was controlled by rotation of the optical axis of a waveplate (see
Figure 1), and was calibrated by power sensor at the position of the sample. The measured calibration curve is presented in
Figure 3. Zero degrees of waveplate angle corresponds to the minimum and 10 degrees correspond to the maximum calibrated energy and intensity of the IR laser.
A series of pump-probe experiments were performed with the variation of the IR laser energy from 195 µJ to 691 µJ (3.2 × 10
13–1.1 × 10
14 W/cm
2) for PS and silica samples and from 195 µJ to 326 µJ (3.2 × 10
13–5.4 × 10
13 W/cm
2) for PS films covered by Al. Measurements with different IR laser energies were performed at the new position of the sample to avoid sample damage. The upper limit of IR laser energies was set due to the damage threshold of the colloidal crystals and was lower for Al-covered samples due to enhanced absorption of IR light by the Al film. The results for the highest non-destructive IR laser energies, which are marked with arrows on the calibration curve, are presented in this work. At energies higher than 1 mJ, ultrafast melting of the colloidal crystals was observed and was investigated in a separate work [
25].
The pump-probe experiment was performed with a time delay variation
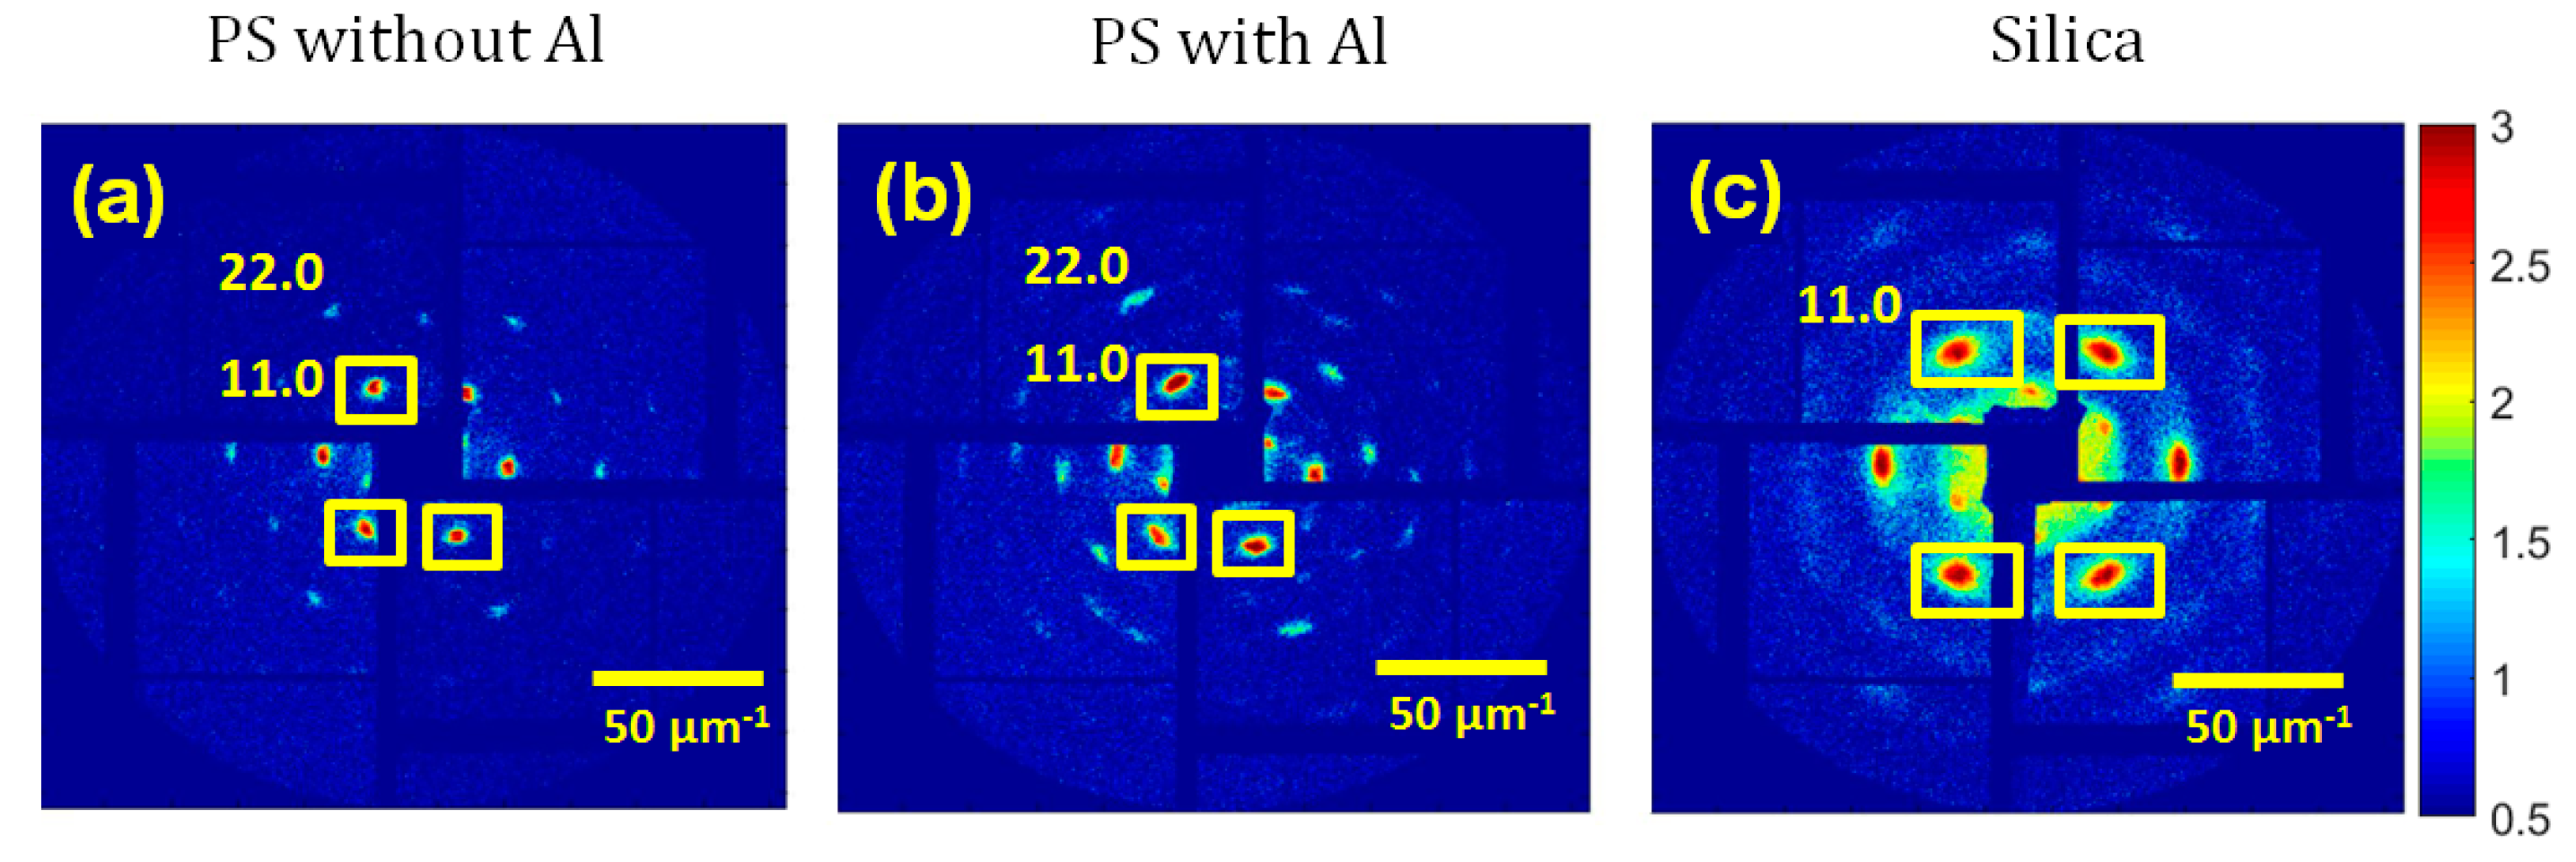
τ from −50 ps to +1000 ps, with a 10 ps time increment. This time delay region and the time interval were considered in order to resolve GHz frequency dynamics of colloidal crystals. In order to obtain sufficient statistics of the measured data, for each time delay a large number of diffraction patterns (600 for polystyrene and 120 for silica) with and without the IR laser were measured. Typical single-shot diffraction patterns for three different samples are shown in
Figure 4. The six-fold symmetry of the diffraction pattern is due to the hexagonal close-packed structure of the colloidal crystals. Two orders of Bragg peaks can be seen in single diffraction patterns shown in
Figure 4. A family of 11.0 Bragg reflections, indicated in
Figure 4 by squares, was used in further analysis. Indices of the structure are adopted from the hexagonal structure and the point symbolizes the fourth index equal to the negative sum of the first two indices (11.0 equals to 11
0).
3. Data Analysis
The following strategy was implemented for the data analysis. First, for the patterns with sufficiently high intensity (more than 5000 counts per single diffraction pattern) of the XFEL pulse, we selected Bragg peaks located far away from the detector gaps (see
Figure 4). Patterns with a lower signal were not treated. Using this procedure, typically three to four Bragg peaks were selected for the analysis (see
Figure 4). Next, the Bragg peak positions were extracted using the center of mass of their intensity distributions as well as the relative distances between the opposite Bragg peaks. The change of the relative positions of the Bragg peaks as a function of the time delay allowed us to probe the lattice dynamics along specific crystal directions. The following parameters as a function of time delay were analyzed in order to reveal the dynamics of the colloidal crystals, induced by the IR laser: Bragg peak position
q(
τ), as well as FWHMs in the radial
wq(
τ) and azimuthal
wφ(
τ) directions in reciprocal space. The temporal variation of the momentum transfer vector
q(
τ) is related to the dynamics in the inter-particle spacing, while
wq(
τ) corresponds to the dynamics of the average particle size, and
wφ(
τ) defines angular misorientation of coherent scattering domains [
26].
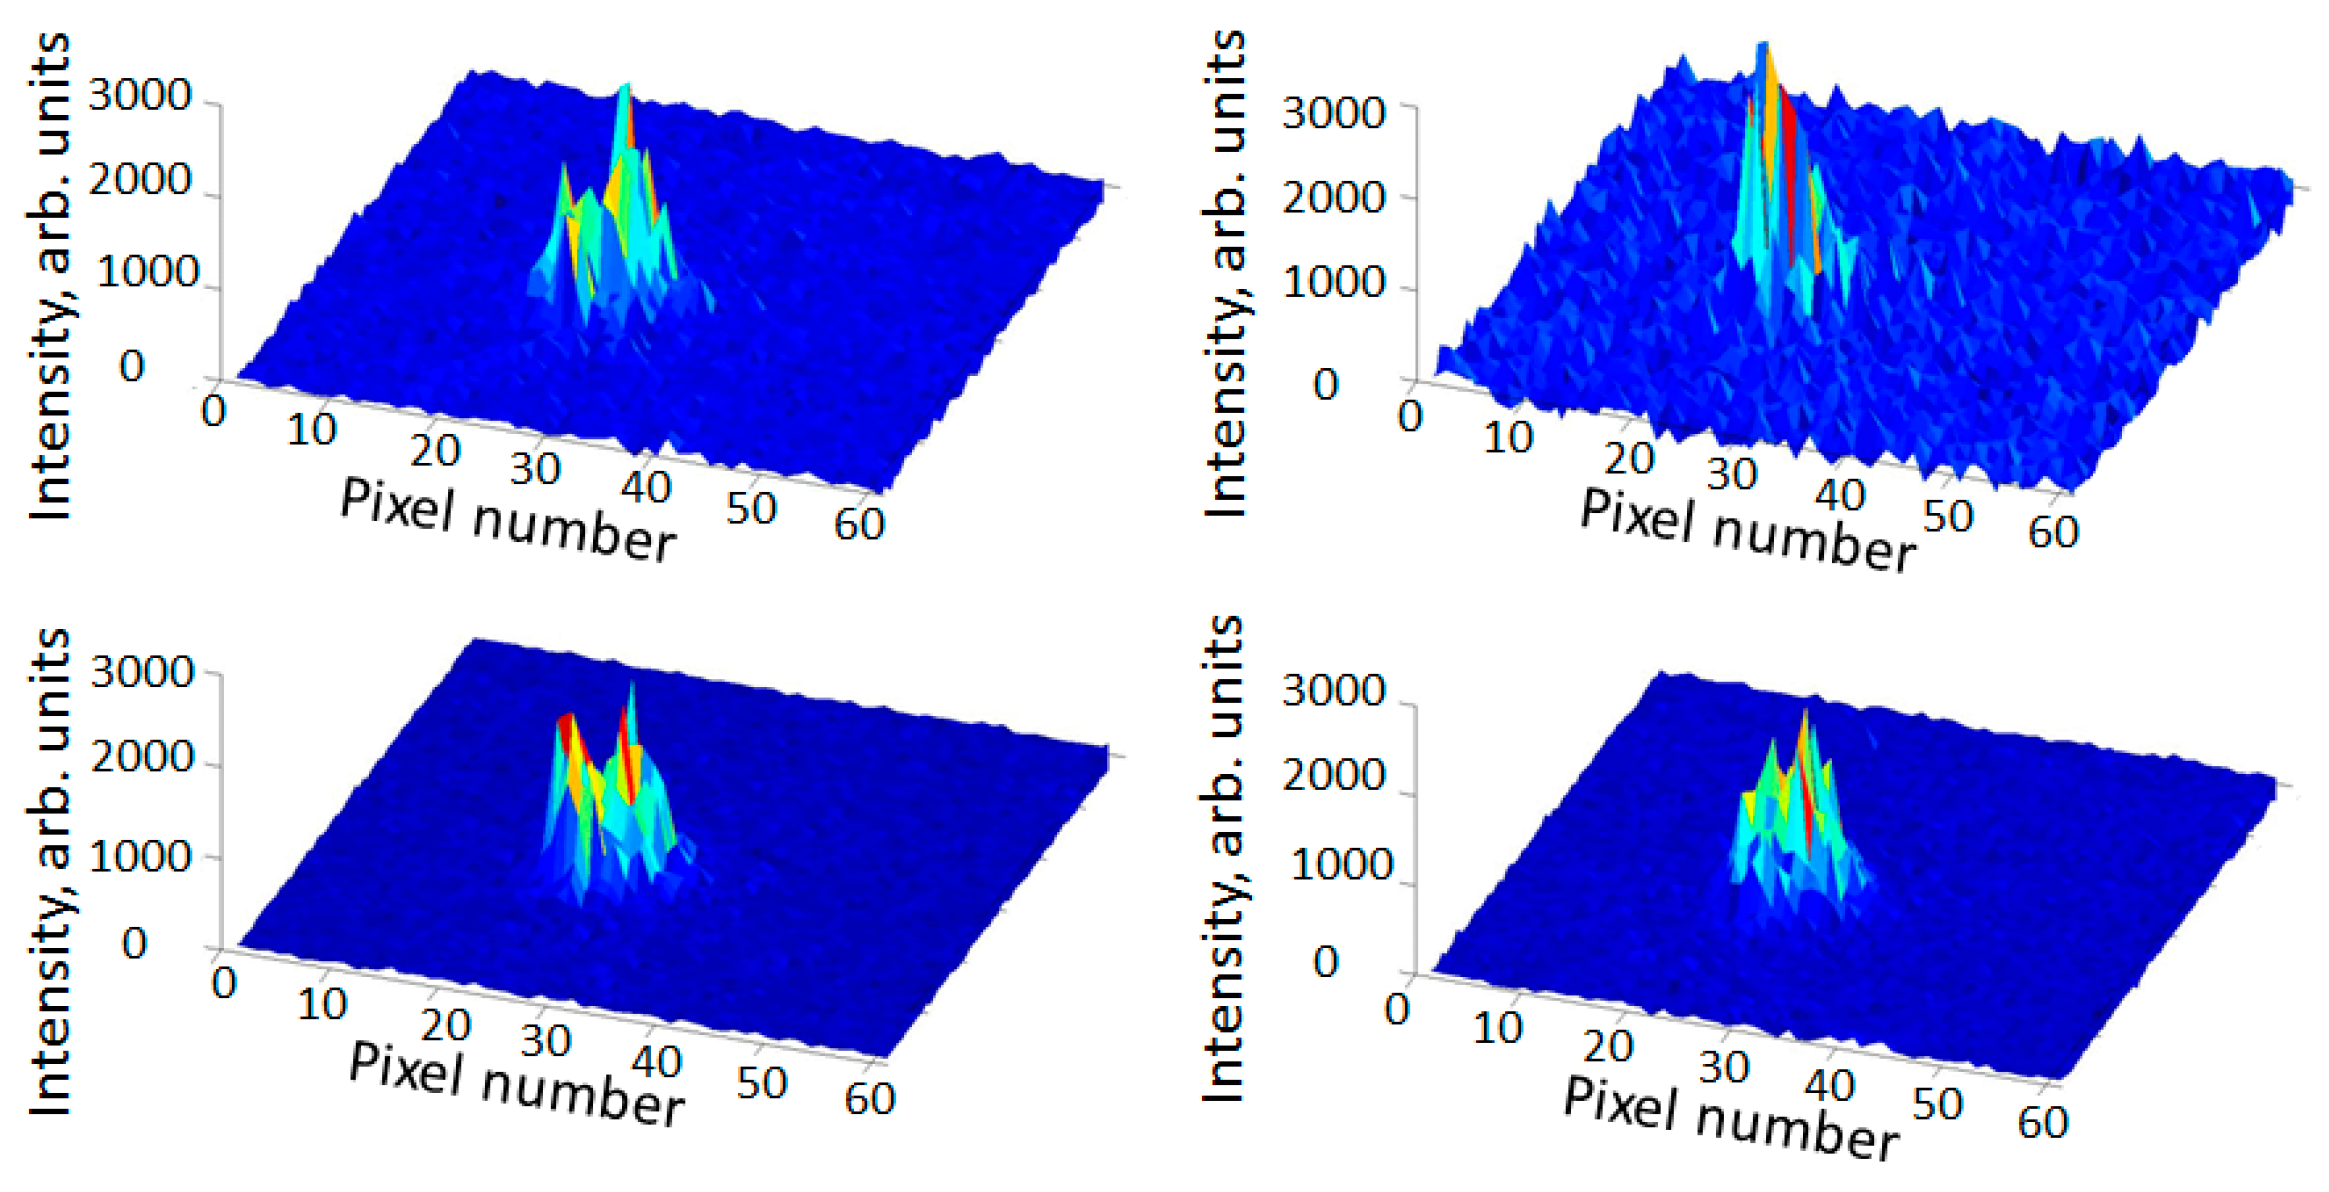
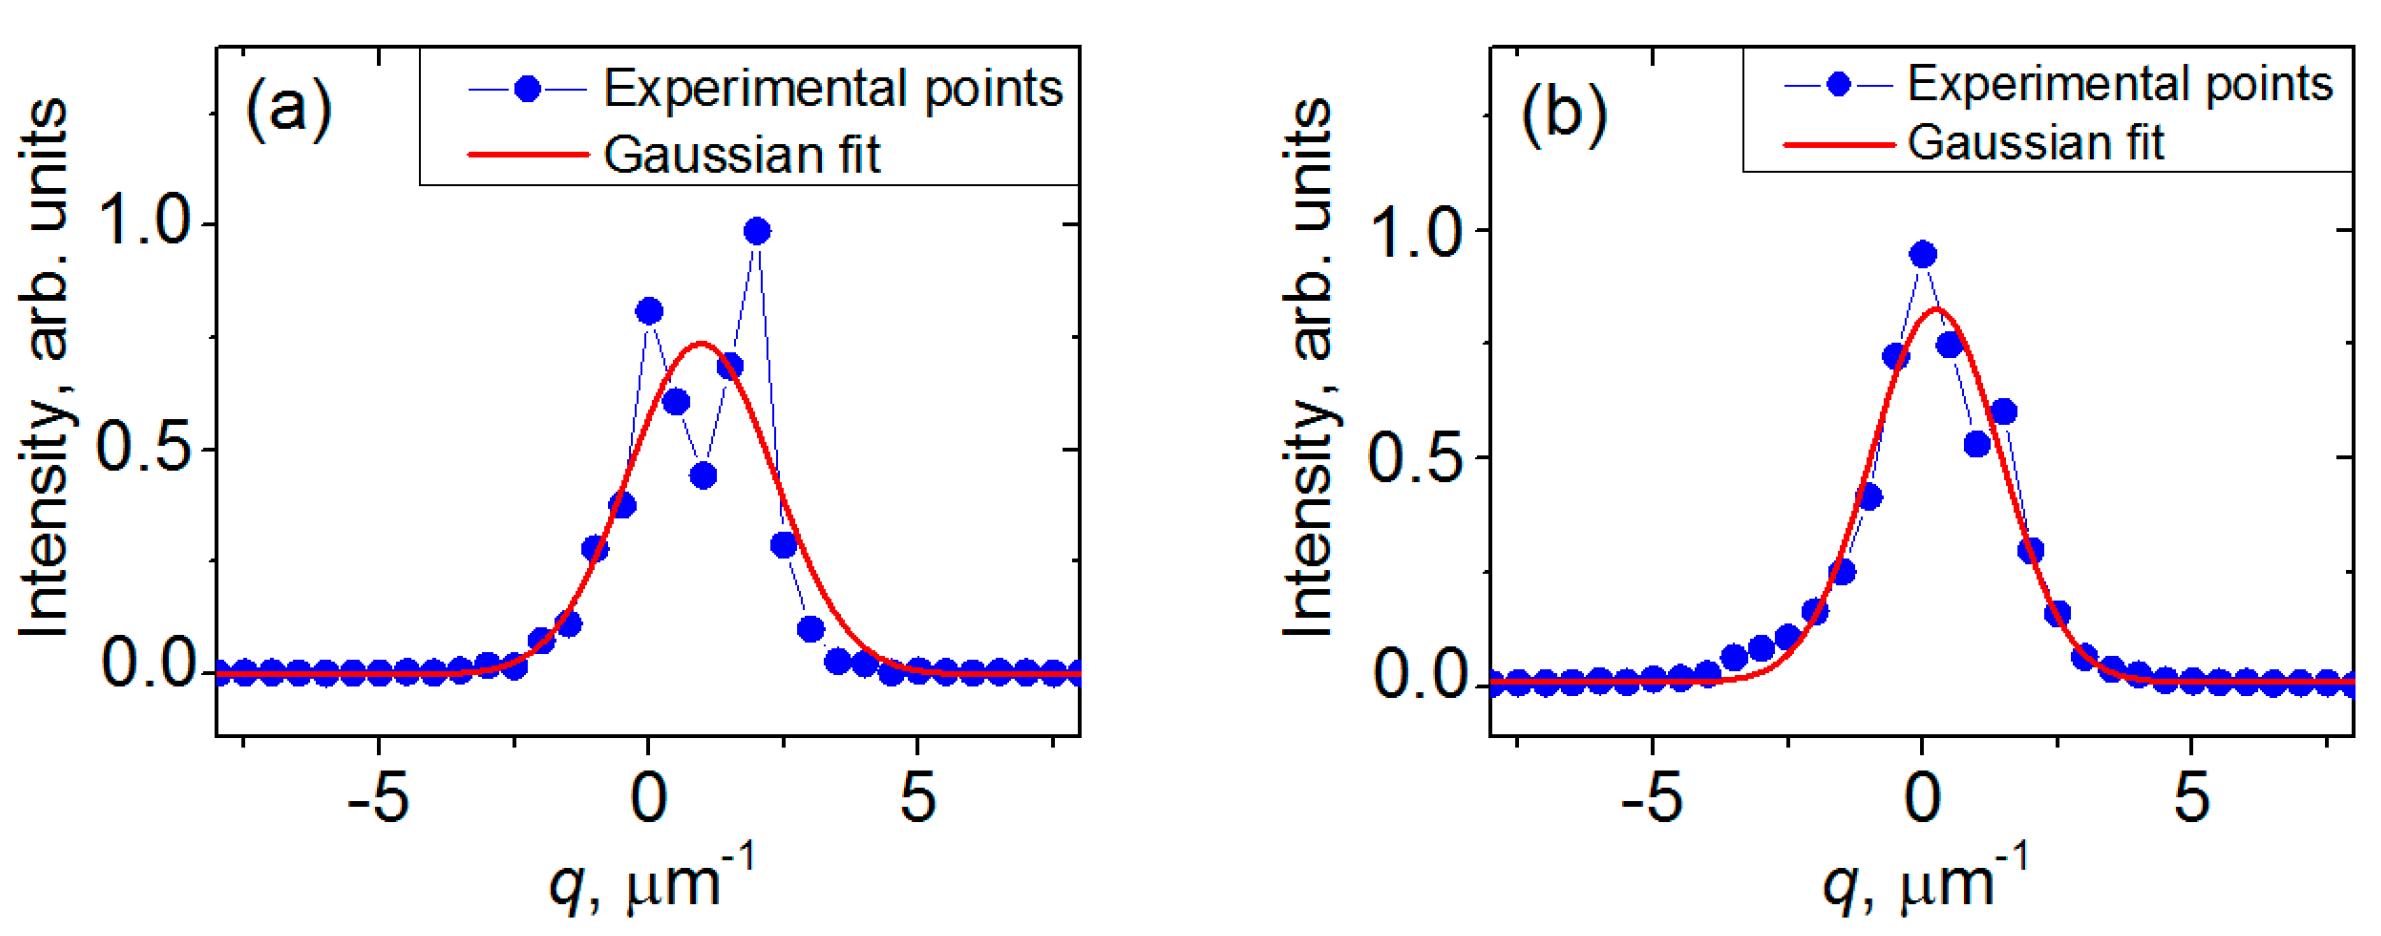
Due to the nature of the SASE process, each XFEL pulse has a unique fine spatial structure that was mapped by the intensity distribution at each Bragg position. A multi-spiked structure of the Bragg peaks varying from pulse to pulse was observed in our experiment (see
Figure 5). From these diffraction patterns spatial and temporal coherence properties of hard XFEL could be determined by spatial correlation analysis [
27]. Due to the different shape of each FEL pulse (see
Figure 5), it was not possible to perform deconvolution of each scattered pulse shape. For the same reason (non-Gaussian structure of Bragg peaks) fitting of the peaks with the two-dimensional Gaussian function was not reliable (see
Figure 6a). In order to improve Bragg peak characterization, projections of their intensities on azimuthal and radial directions were performed. These data were fitted with the one-dimensional Gaussian function (see
Figure 6b), and peak broadening in the radial (
wq) and azimuthal (
wφ) directions was determined.
In order to compare dynamics of the collected data as a function of the time delay
τ for different samples and IR laser energies, the following dimensionless parameters were used:
where
q(
τ) is the distance between the opposite Bragg peaks, and
w(
τ) is the radial or azimuthal FWHM of the Bragg peak. Subscripts “on” and “off” define measurements with and without the IR laser, respectively. Brackets <…> denote ensemble averaging of the chosen Bragg peak parameter for each time delay
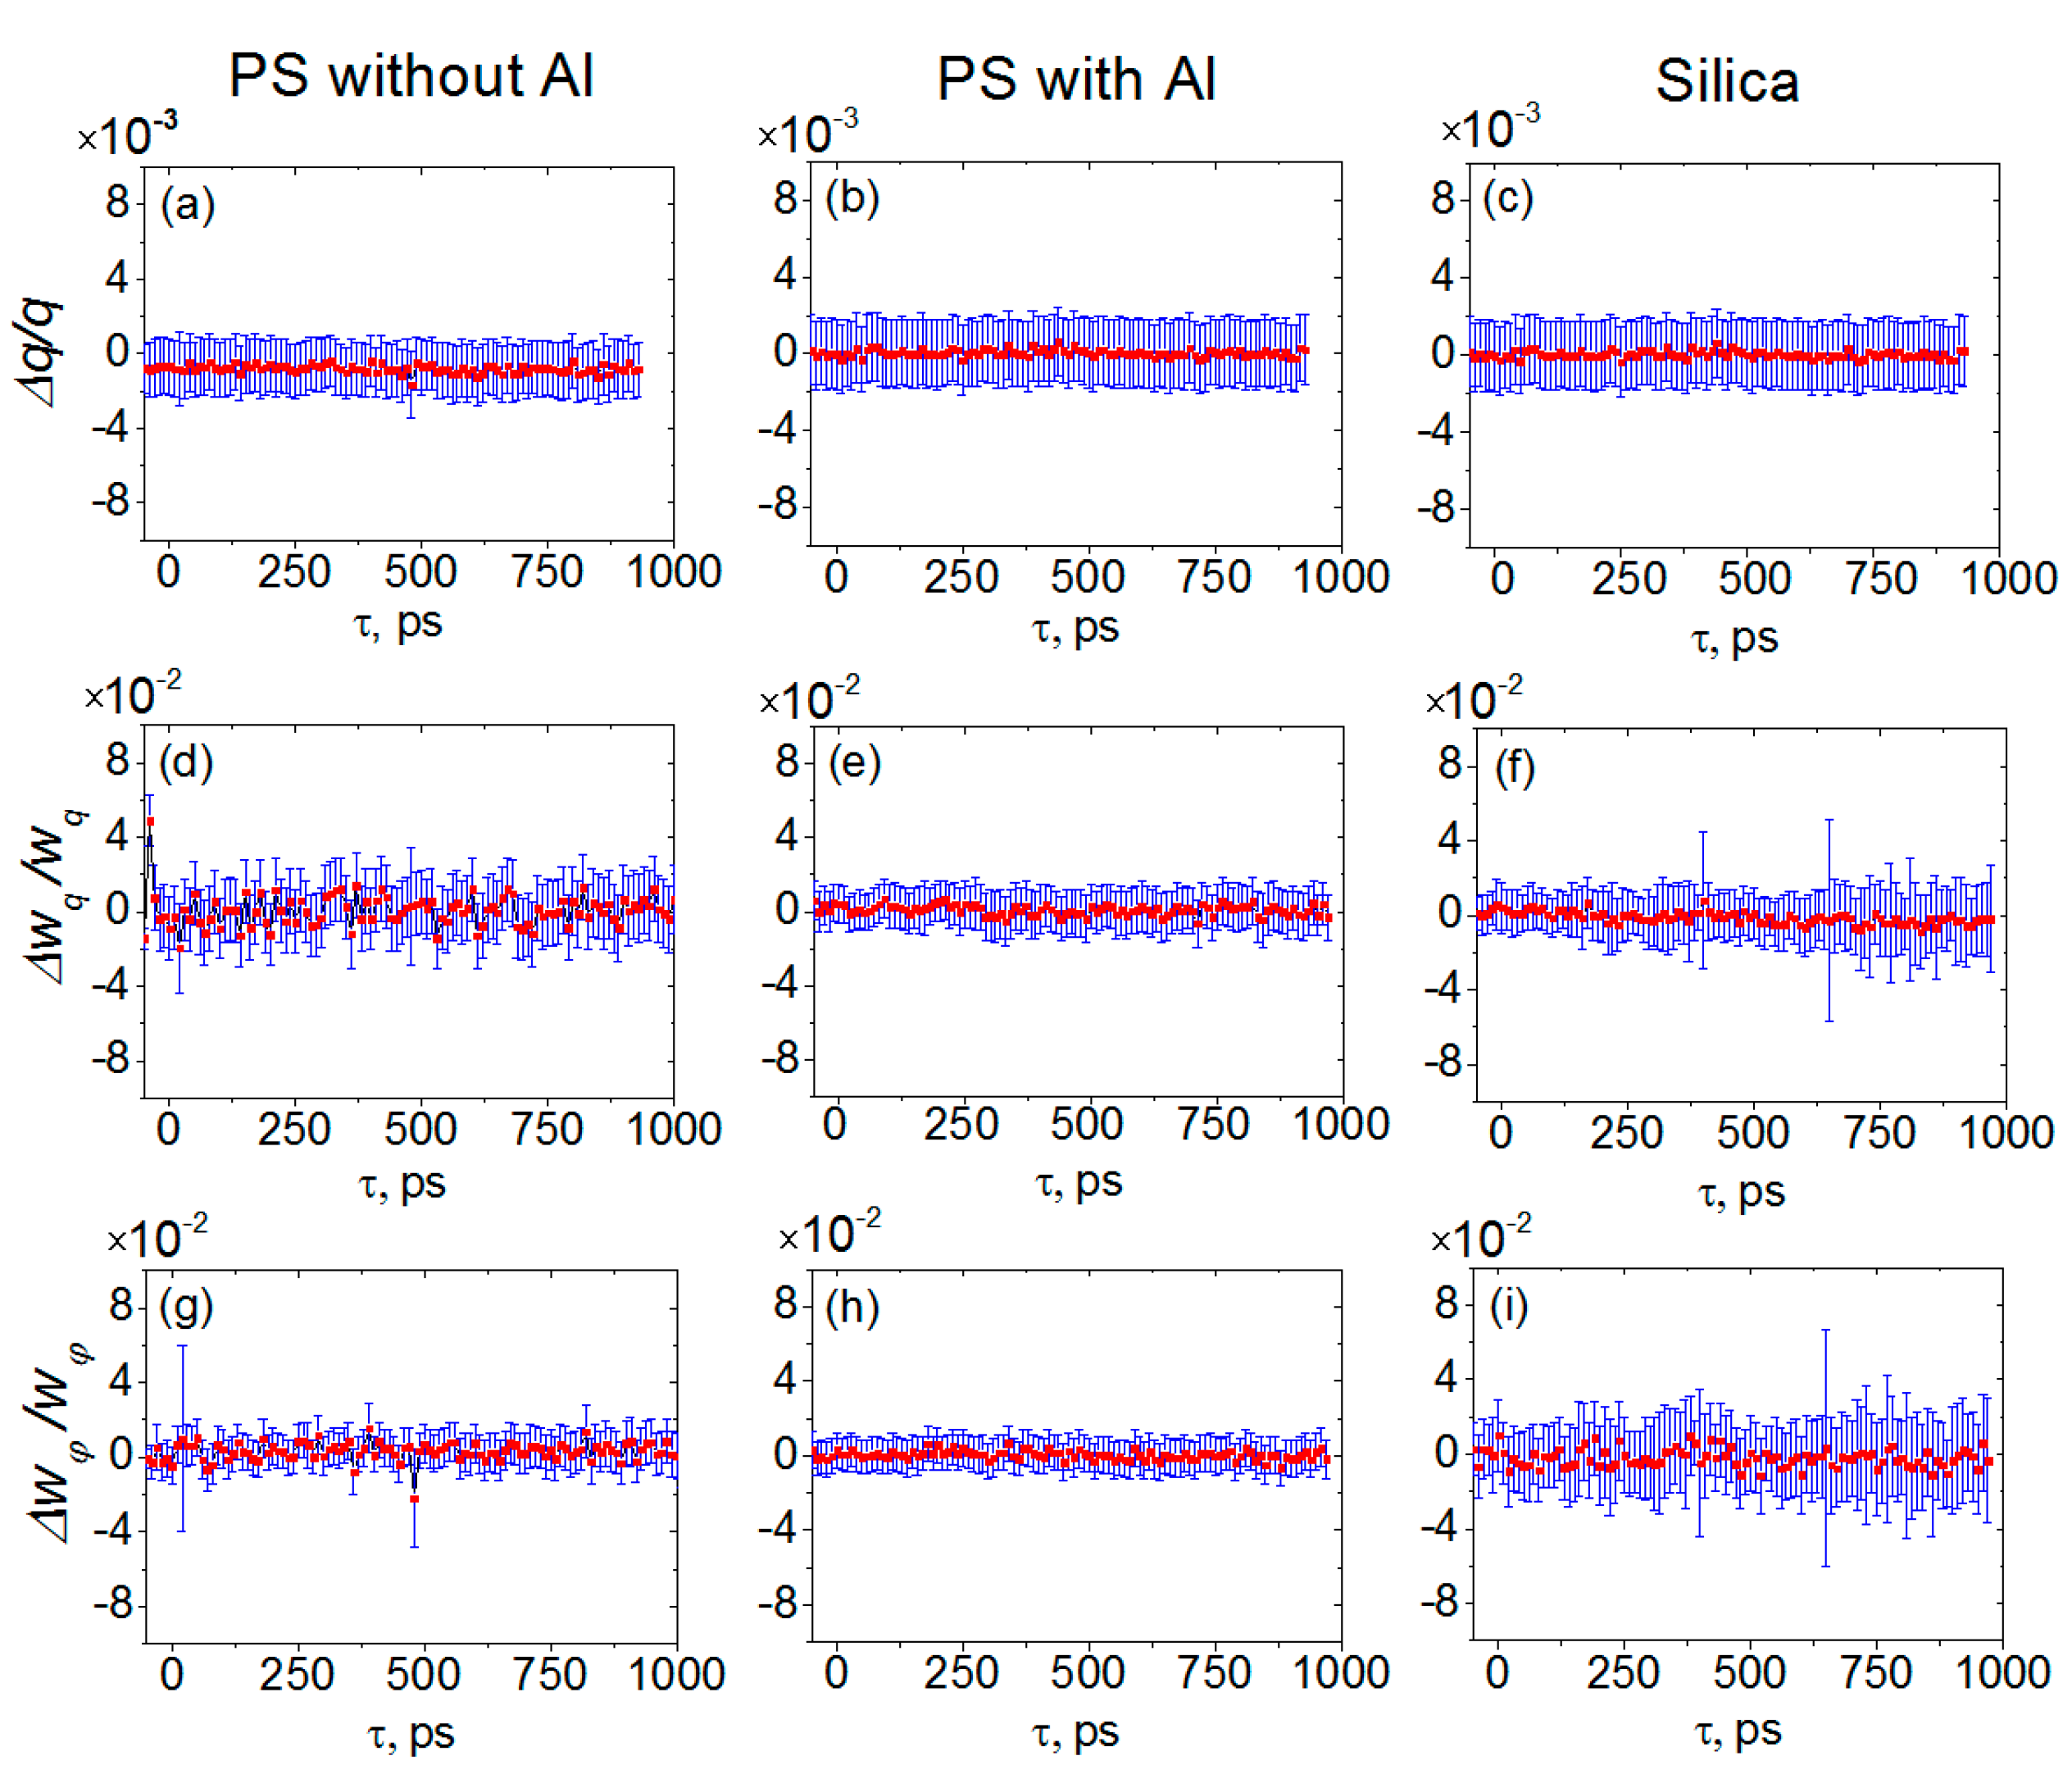
τ over all XFEL pulses. Time dependencies of the momentum transfer vector
q(
τ), as well as radial
wq(
τ) and azimuthal
wφ(
τ) broadening of the Bragg peaks for three measured samples, are shown in
Figure 7. Some points in this figure are excluded due to the unexpected drops of intensity of the XFEL (such drops of intensity were observed when operation of some clystrons in the accelerator complex was failing). The statistical error of these parameters was determined using the standard approach for the error determination in the multi-parameter equation [
28]. As clearly seen in
Figure 7, an error of the ∆
q(
τ)/
q values is one order of magnitude lower than for the Bragg peaks broadening parameters. This could be explained by the influence of the XFEL pulse shape on the shape of the Bragg peaks with a relatively stable position of each pulse. Due to this, the Gaussian fit of the Bragg peaks shape was not accurate, while the influence of the XFEL pulse shape on the variation of the center of mass was insignificant. The error values for the silica sample are higher than for the PS due to lower statistics (for the PS crystals 600 shots and for the silica crystals 120 shots were collected with the IR laser).
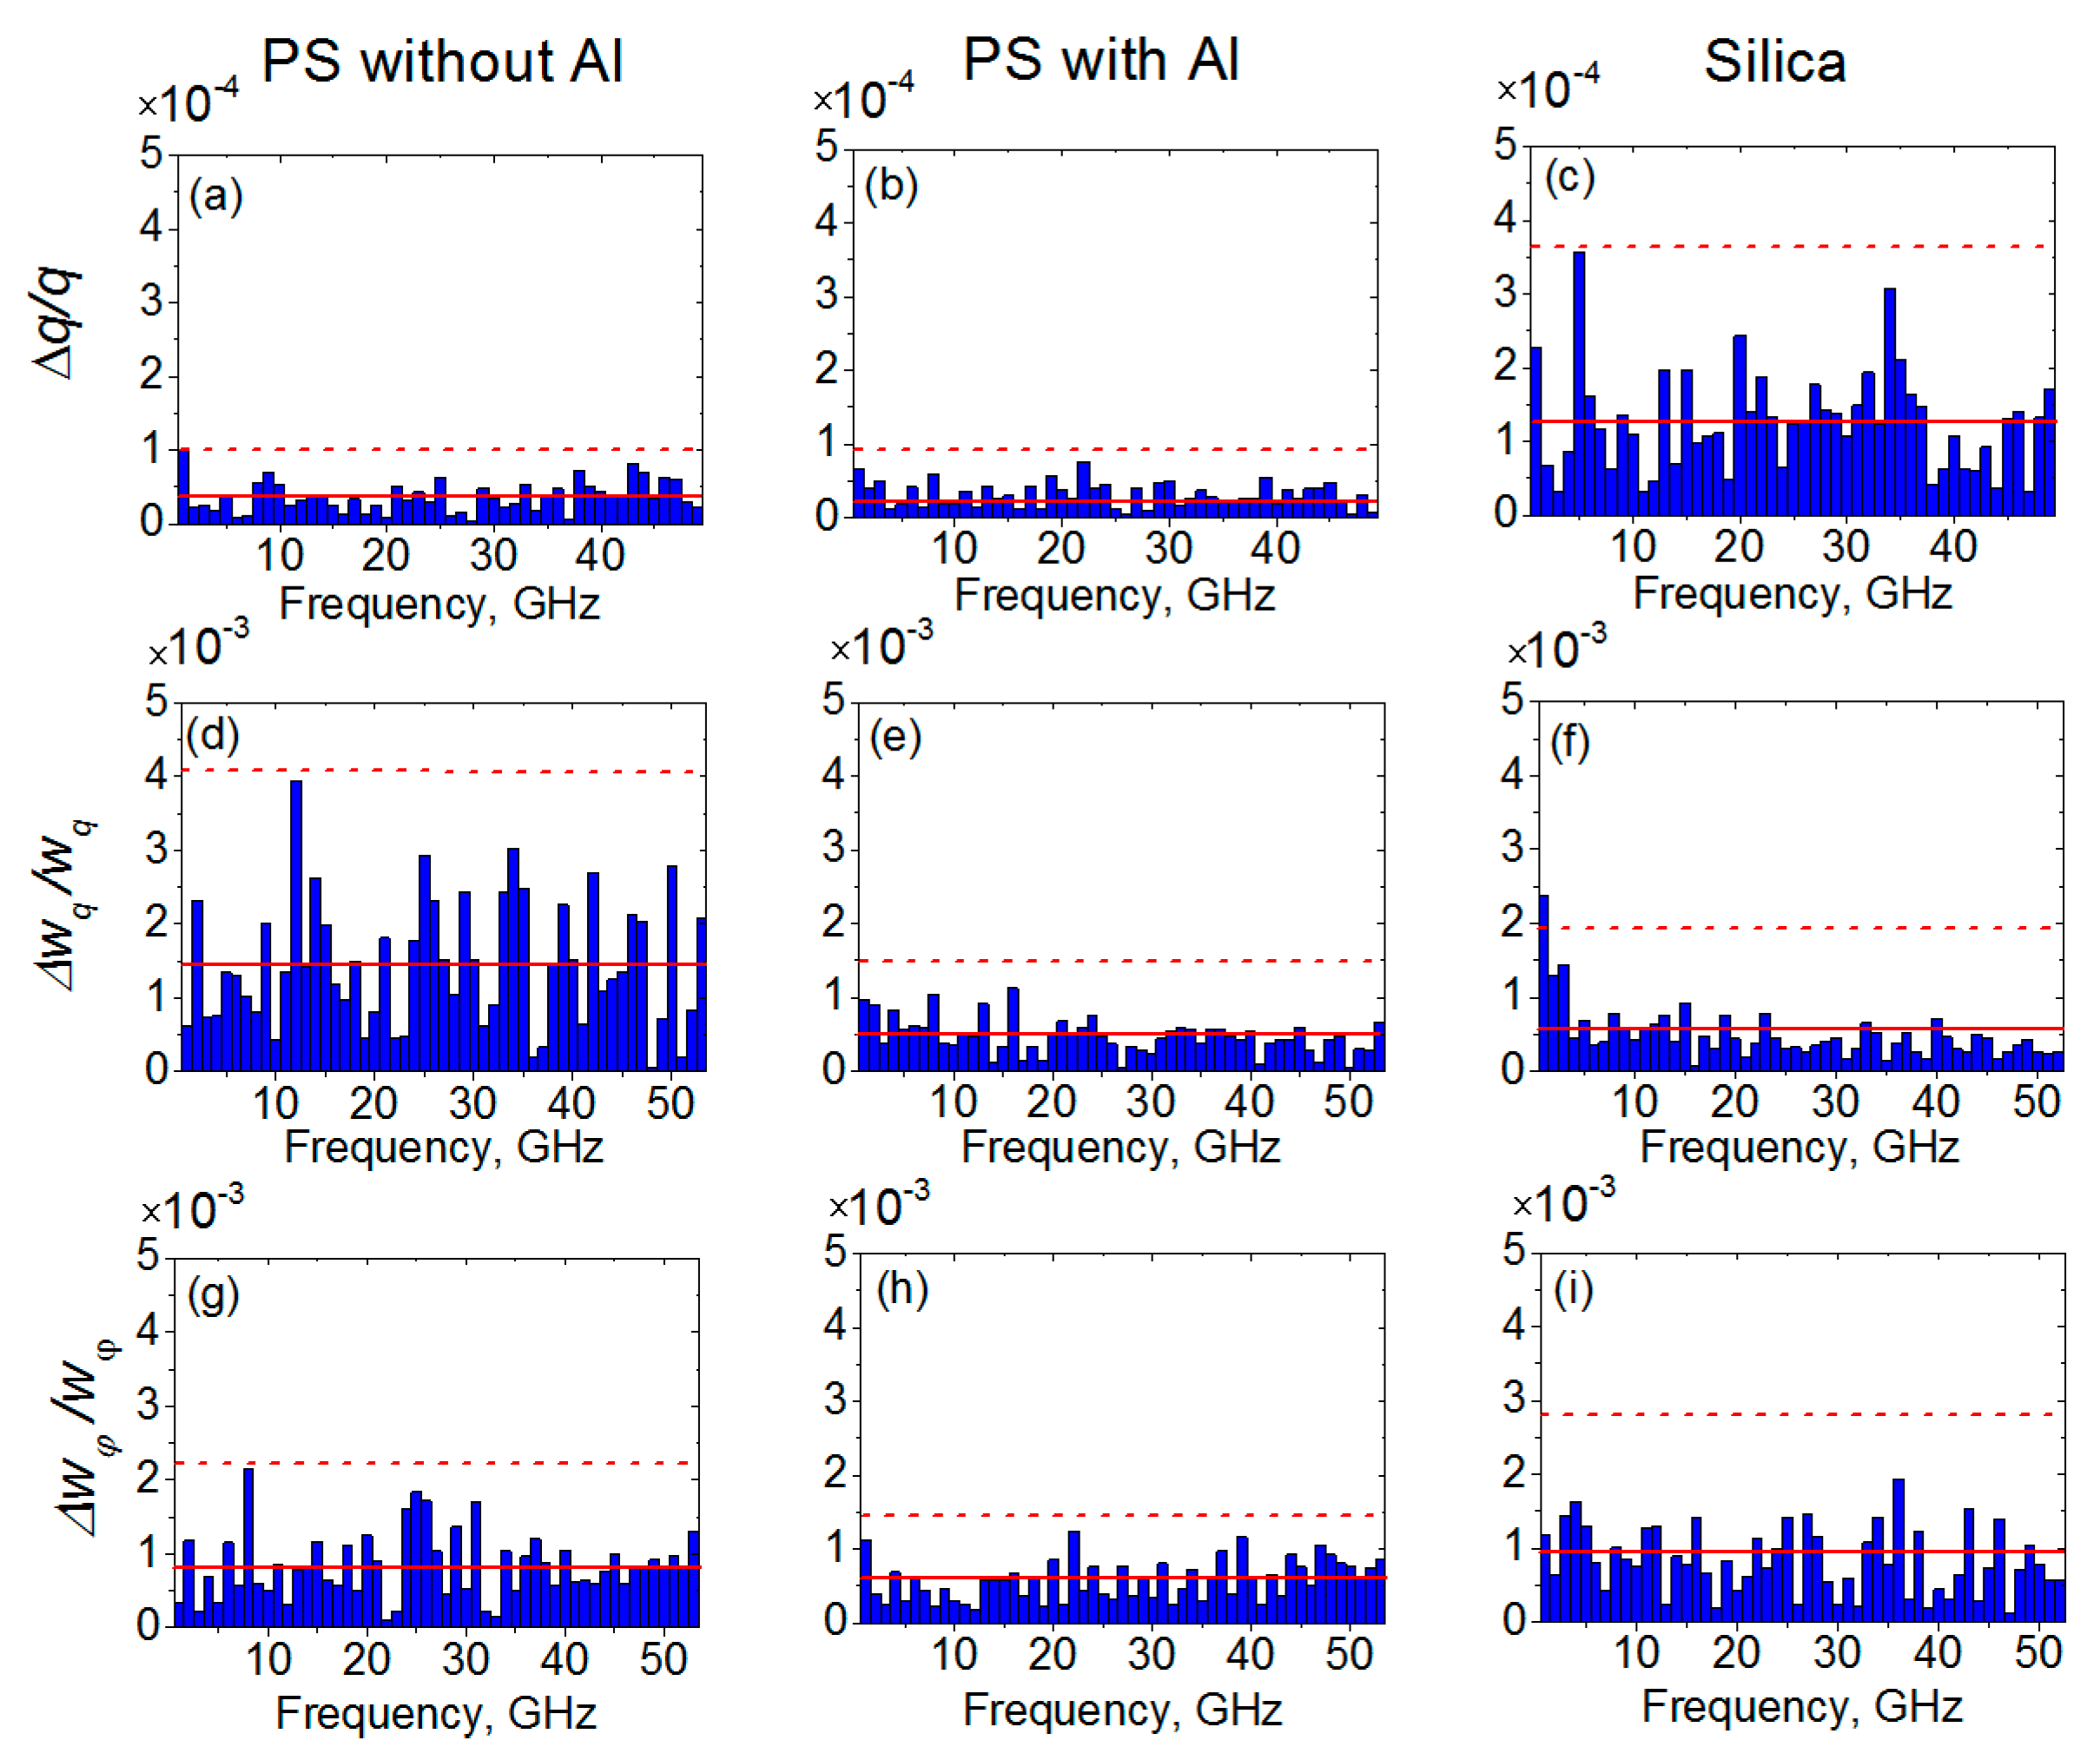
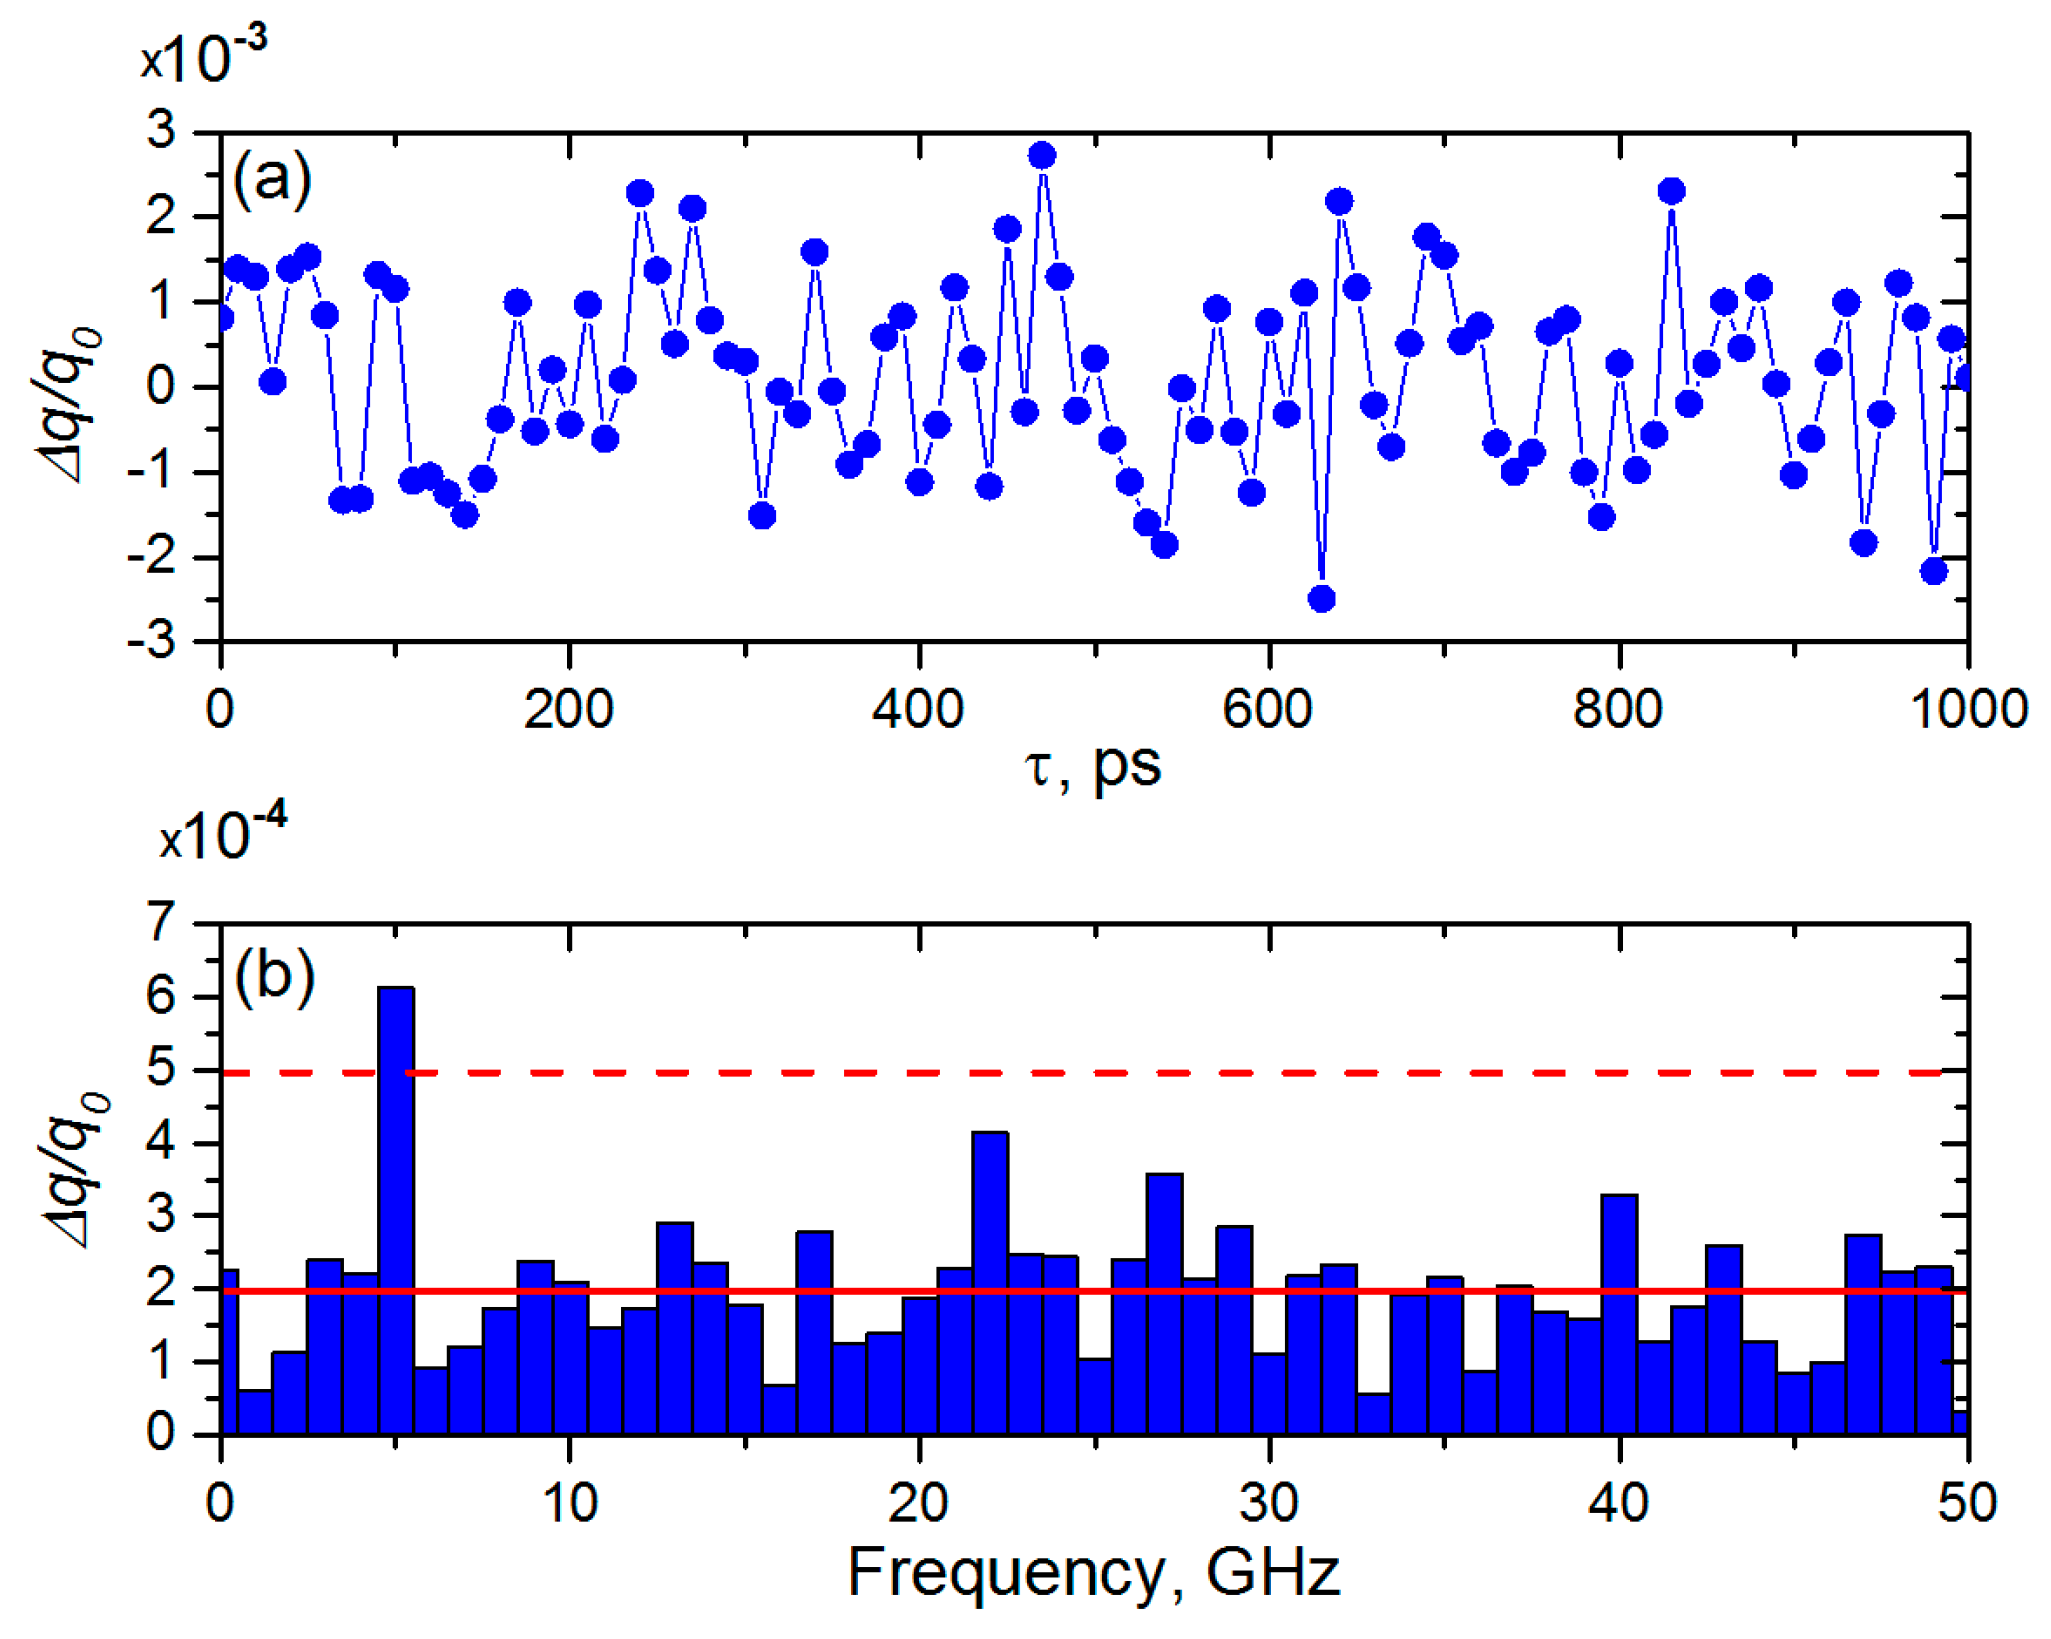
Figure 7 also clearly shows that variations of all parameters are around zero and in all cases, the signal is lower than the statistical error. To reveal characteristic frequencies excited by the IR laser, we performed the Fourier analysis of the time dependencies of the Bragg peak parameters described above. The corresponding Fourier spectra are shown in
Figure 8. Due to the more precise measurements of the momentum transfer vector
q(
τ), the average value of the Fourier components of
q(
τ) is one order of magnitude lower than for the Bragg peaks broadening
w(
τ). There was no significant enhancement of any particular Fourier component, for all Fourier spectra. We determined an average value of the Fourier components and the standard deviation
σ from the distribution of these Fourier components. For all Fourier spectra shown in
Figure 8, there is no Fourier component higher than 3
σ above the average Fourier component value, which indicates that the periodic signal could not be reliably detected in these conditions.
4. Model Simulations
To have better understanding of the obtained results, we performed simulations of the colloidal crystal dynamics induced by an external IR pulse excitation. In our model colloidal crystals consist of isotropic homogeneous spheres. The characteristic frequencies of vibration of a colloidal particle were determined using the Lamb theory describing vibrations of an isotropic elastic sphere [
29]. Theoretically, two families of Lamb modes, namely spheroidal and torsional ones, can be derived from the equations of motion. The spheroidal modes cause the change of the sphere volume, and the torsional modes leave the sphere volume unperturbed. During the IR pulse propagation through a sphere, the changes of the sphere volume are expected and, therefore, we used spheroidal modes in our simulations. We determined the frequencies of the first spheroidal mode for all three measured samples using reference [
30]. Sphere diameter, longitudinal
cL and transverse
cT sound velocities of PS and silica were obtained from reference [
31]. These parameters, as well as the frequencies of the first spheroidal mode for the colloidal crystals, are summarized in
Table 1.
The values of ∆
q(
τ)/
q were obtained from the experimental data with the smallest error in comparison to other Bragg peak parameters for all investigated samples (see
Figure 7a–c). Therefore, the parameter ∆
q(
τ)/
q was considered for our simulations. Assuming an ideal close-packed crystal with the interparticle distances equal to the particles diameter, the unperturbed momentum transfer modulus of the 11.0 Bragg reflection can be described as
q0 = 2
π/
d11.0 = 4
π/
d0, where
d0 is the unperturbed particle diameter. We simulated vibrations of the colloidal spheres with the diameter
d0 as a periodic sinusoidal signal:
where
S is the relative amplitude and
ω is the characteristic frequency of the vibration. The dynamics of the experimentally-observed 11.0 diffraction peak can be described as:
where we used the Taylor series expansion of the momentum transfer vector
q(
τ) due to the small values of the amplitude
S << 1.
As a result, measured changes in the Bragg peak positions and ∆
q(
τ)/
q can be simulated as a periodic sinusoidal signal. We should also take into account systematic errors of the measurement as an additional noise. Finally, simulations of the parameter ∆
q(
τ)/
q in our model were described using the following expression:
where
N is the amplitude of a noise and
ηnoise(
τ) is a random noise function with normal distribution and standard deviation value equal to one. The signal-to-noise ratio in this case is assumed to be equal to the ratio of the amplitudes
S/
N.
Next, we defined criterion when the periodic signal is detected by the algorithm in our simulations. Due to the random behavior of the noise function
ηnoise(
τ), each realization of the signal ∆
q(
τ)/
q0 (see Equation (5)) for a constant
S/
N is different. As an example, we demonstrate this for the experimental data of the polystyrene sample without aluminum. This sample was considered as one with the lowest noise level in our experiment. The time interval and increment of the simulated signal ∆
q(
τ)/
q0 were chosen the same as in our pump-probe experiment. One of the typical realizations of the ∆
q(
τ)/
q0 with the signal level
S = 0.7 × 10
−3 and noise level
N = 1.4 × 10
−3 is shown in
Figure 9a. From this figure it is difficult to conclude on the presence or absence of the signal.
Similar to the analysis of the experimental data, the Fourier spectra were calculated for the simulated signal with the noise (see
Figure 9b). Next, the behavior of the Fourier component amplitude (
Aω) corresponding to the first spheroidal mode frequency
ω = 4.97 GHz was studied. The criterion of detecting the signal was considered as:
where
is the mean and
is the standard deviation of all Fourier components in the spectrum. The Fourier spectrum of the simulated data (see
Figure 9a), as well as its 3
σ level are shown in
Figure 9b. It can be seen that the contribution of the vibrational mode in the Fourier spectrum is higher than the criterion stipulated by Equation (6). Therefore, the algorithm detected the presence of the 4.97 GHz frequency signal.
We calculated the probability of successful signal detection as a function of signal-to-noise ratio
S/
N in the range of (
S/
N) from 0 to 1.5 with 0.01 increment. During the simulations the amplitude of the signal
S was changing, while the noise level
N was kept constant. The probability of detecting signal
P(
S/
N) was defined as:
where
ndetected(
S/
N) is a number of simulations with successful detection of signal (according to the criterion stipulated by Equation (6)) and
n = 10,000 is the total number of simulations for each
S/
N step. Results of these simulations for the experimental data of the polystyrene sample without aluminum are shown in
Figure 10. As one can see from
Figure 10 that, according to our criterion stipulated by Equation (6), the signal is 100% detectable if it is on the level of the noise (
S/
N = 1).
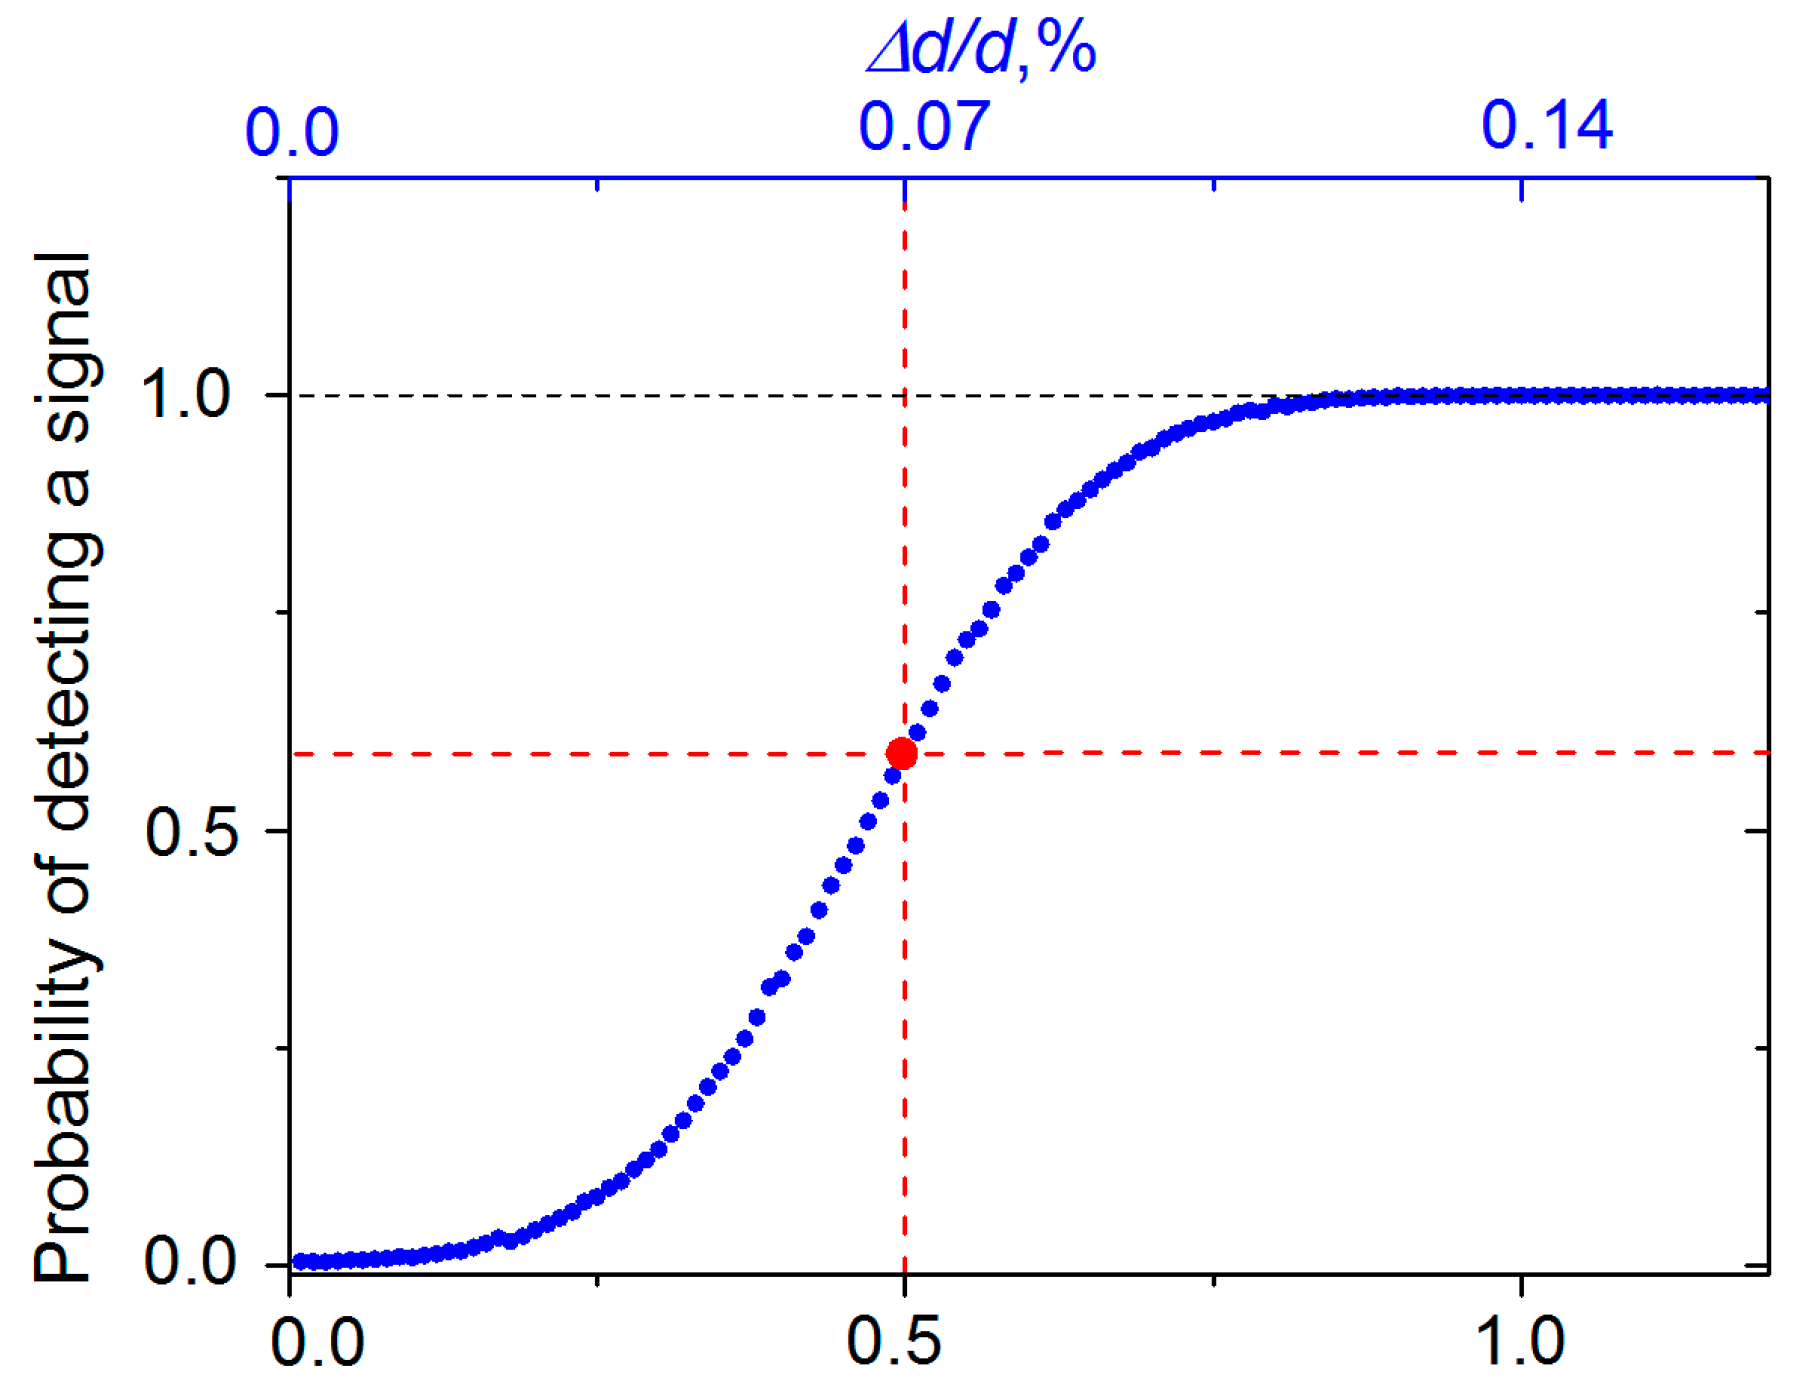
5. Results and Discussion
Simulations, described in the previous section, were performed for each sample (polystyrene sample without aluminum, polystyrene sample with aluminum, and silica samples) to derive the probability function
P(
S/
N) of detecting the periodic signal (see
Figure 10) in each case. It is clearly visible from
Figure 10 that even the value of the signal-to-noise ratio
S/
N = 0.5 gives 60% probability of detecting the signal. This condition was considered as a criterion for the minimum measurable signal. Using well-known relations between the deviations of the momentum transfer vectors and interparticle distances ∆
q(
τ)/
q0 =
−∆
d(
τ)/
d0, as well as Equation (5), we can determine the relative (and absolute) values of the changes of the interparticle distances ∆
d(
τ)/
d0 (∆
d(
τ)) for the given values of the experimental noise
N. As a result of this analysis, we can obtain the minimum values of these parameters which could be detected in our experimental conditions with the probability of 60%. For all measured samples results of this analysis are summarized in
Table 1.
As it follows from
Table 1, the minimum relative changes of the interparticle distance Δ
d/
d0 that can be detected with the probability of 60% for all samples were about 10
−3. Such values correspond to relatively large amplitudes of the deviations in interparticle distances of about 0.2–0.4 nm. Clearly, in our experimental conditions excited vibrations were lower than the noise level of the experiment that prevented us from their experimental determination.
For the successful measurement of vibrations of colloidal crystals at the FEL sources, some further improvements of the experiment may be suggested. First, the accuracy of the measurement of the incoming X-ray beam intensity from pulse to pulse should be improved, as this would allow measurement of the Bragg peak intensity with higher precision. In our experiment such an accurate measurement of the Bragg peak intensity variation was not possible due to the complicated structure of each XFEL pulse and a relatively low accuracy (about 3%) in the measurement of the incoming X-ray beam intensity from pulse to pulse. Second, colloidal crystals may be covered by a thicker aluminum layer which could lead to a more efficient energy transfer from an IR laser to the colloidal crystal [
32]. This would lead to a higher amplitude of vibrations of a PS colloidal crystal, and enable their detection in IR pump and X-ray probe experiments.
6. Conclusions
We performed experiments at the LCLS to investigate dynamics in the colloidal crystals. The diffraction patterns from the colloidal crystals, which were pumped by IR laser pulses and probed by XFEL radiation, were collected. The measurements were performed in a non-destructive regime at the different positions of the samples. The pump-probe experiments were performed in the wide range of the IR laser energies, from 195 µJ up to the upper limit of the non-destructive threshold of 691 µJ.
Through the analysis of the Bragg peaks, extracted from the diffraction patterns, changes in the colloidal crystals caused by the IR laser were investigated. The dynamics at different timescales was studied by the Fourier analysis of parameters associated with the momentum transfer and Bragg peak broadening in the radial and angular directions. Simulations of the colloidal crystal dynamics were performed and the probability function P(S/N) was derived. Relative and absolute deviations in the interparticle distance (Δd/d0 and Δd), which could be detected in such an experiment with the probability of 60% (corresponding to the signal to noise level of 0.5), were calculated for all measured samples. From the experiment and simulations, we were able to conclude that, for all measured samples, the amplitudes of vibrational modes excited in colloidal crystals were less than the systematic error caused by the noise level.
In future experiments with XFEL sources different scattering geometries may be foreseen. For example, performing scattering experiments on colloidal crystals in grazing incidence small-angle X-ray scattering (GISAXS) [
33,
34] may increase the sensitivity of the scattered radiation to changes induced by the IR pump laser.

 ,
, 


