
Direct-Current Forced Interruption and Breaking Performance of Spiral-Type Contacts in Aero Applications


1
School of Automation Science and Electrical Engineering, Beihang University, Beijing 100191, China
2
Institute of Spacecraft System Engineering CAST, Beijing 100191, China
*
Author to whom correspondence should be addressed.
Appl. Sci. 2017, 7(6), 512; https://doi.org/10.3390/app7060512
Submission received: 21 March 2017
/
Revised: 3 May 2017
/
Accepted: 10 May 2017
/
Published: 26 May 2017
Abstract
:This paper analyses the transient characteristics and breaking performance of direct-current (DC) forced-interruption vacuum interrupters in 270 V power-supply systems. Three stages are identified in forced interruption: the DC-arcing stage, current-commutation stage, and voltage-recovery stage. During the current-commutation stage, the reverse peak-current coefficient k, which is a key design factor, is used to calculate the rate of current at zero-crossing (di/dt). MATLAB/Simulink simulation models are established to obtain the transient characteristics influenced by the forced-commutation branch parameters and the coefficient k. To study the breaking performance of spiral-type contacts, experiments are conducted for different contact materials and arcing times for currents less than 3.5 kA. During the DC-arcing stage, a locally intensive burning arc is observed in the CuW80 contact; however, it is not observed in the CuCr50 contact. On examining the re-ignition interruption results of the CuW80 contact, the intensive burning arc is found to be positioned within a possible re-ignition region. When the arcing time is longer than 1 ms, the intensive burning arc occurs and affects the breaking performance of the spiral-type contacts. If the DC-arcing stage is prolonged, the total arcing energy increases, which leads to a lower breaking capacity.
1. Introduction
With the increase in the use of electrical equipment, there is a possibility that high-power DC distribution systems will be needed, such as the 270 V DC power-supply system developed by More/All Electric Aircraft. If electrical power can be transmitted at a high voltage, resulting in low current and low conduction losses, the cable weight can be reduced. An investigation [1] showed that the ±270 V DC power distribution system architecture is the most reliable configuration that can sustain an operation, even under severe supply transients [2]. The 270 V DC electrical power is used primarily in military vehicles and military aircrafts. It is advantageous in terms of the ease of paralleling DC electrical bus bars and integration with loads such as actuators. To satisfy the growing demand for high-capacity short-circuit protection, several methods that interrupt direct currents have been extended [3,4,5,6]. Forced current zero (FCZ) is a common method used to interrupt the DC current. This method for DC interruption forces the current to zero by injecting a high-frequency current of the opposite polarity [7]. In the FCZ method, an oscillating current is generated by the resonance of a precharged capacitor and an inductor, and by superimposing this oscillating current over the current in the main circuit, a current zero is produced. Thus, the burning arc in the vacuum interrupter (VI) [8] can be extinguished by the FCZ. Then, the breaker in the main circuit can successfully interrupt the DC current [9,10]. A successful interruption is significantly influenced by the transient characteristics of the current-commutation process, such as the rates of the current and voltage at zero-crossing (|di/dt| and |dv/dt|). To reduce the size and cost of the forced-commutation branch, a high frequency is usually selected for the commutation branch. However, this condition is unfavorable for the recovery of dielectric strength, as well as for the thermal interruption capability of the VI after current zero [11]. Thus, an optimal design for the forced-commutation branch is important. It is known that the transient characteristics are influenced by the commutating capacitor, commutating inductor, precharged voltage, etc. As these parameters may demonstrate coupling effects, the apparent relationships among the transient characteristics and the parameters of the forced-commutation branch are mostly worthy of investigation, during the design.
Since VIs have excellent insulating and arc-quenching capabilities, the vacuum circuit breaker is often used as the main circuit breaker for DC interruption. Substantial research has been carried out on the axial magnetic field (AMF) contacts, based on FCZ. It is suggested that, when the current falls to zero very rapidly during DC interruption, the vacuum arc characteristics mainly depend on the characteristics before the instant of the countercurrent injection. However, the AMF has an inhibiting effect on the initial expansion stage. The vacuum arc is constricted by the magnetic field, while the arc columns in the butt electrodes expand much faster [12]. The AMF VI can maintain the diffusion of ions and electrons to the entire electrode; however, it is harmful for deionization [13].
The structure of the vacuum circuit breaker contact has been of paramount importance for vacuum arc modes and successful current interruptions. Two different versions of transverse magnetic field (TMF) contacts are being used—spiral-type and cup-shaped contacts. Schneider patented the spiral design in the USA in the late 1950s [14], and the cup-shaped design was patented by Lake and Reece in the early 1960s [15]. Several previous papers [16,17,18,19,20,21,22,23] have dealt with the investigation of the behavioral patterns of vacuum arcs on TMF and butt contacts at line frequencies (50 Hz). The interrupting ability of VI has been proven for currents up to several tens of kiloamperes, using TMF contacts, and until now, much research has been done on the TMF contacts at line frequencies and intermediate frequencies [24]. A constricted electric arc formed at higher currents is forced into motion by a self-induced magnetic field created by the breaking current, to reduce local overheating and severe erosion on the contact surface [25]. Very limited amounts of research work have been conducted on vacuum arcs with TMF contacts applied to FCZ vacuum circuit breakers. This paper focuses on the arc behaviors during the DC-arcing stage, the breaking performance influenced by the arc behavior, and the breaking capacity with different contact materials and arcing times, for spiral-type contacts under FCZ in aero applications. It is expected to provide a theoretical basis for industrial applications.
Based on the FCZ vacuum circuit breakers used in aviation DC power-supply systems, the transient characteristics of DC forced interruption are analyzed, using both theory and simulations. The theoretical calculations for di/dt are obtained by defining the reverse peak-current coefficient k. The characteristics of VI voltage during interruption are researched through simulations. The results can provide guidance for the experimental scheme and vacuum circuit breaker design. In order to research the vacuum arc behavior and breaking performance of the spiral-type VI, experiments are conducted with different contact materials, arcing times, and current ratings. The appearances of the vacuum arc in the designed TMF contacts are observed using high-speed photography, in the case of currents less than 3.5 kA. The arc re-ignition is analyzed based on the obtained arc appearances, and the breaking capacities with different arcing times are obtained experimentally. Finally, the influences of arc behavior and arcing time on the current interruption performance are discussed.
2. Transient Characteristics of DC Forced Interruption
2.1. DC Interrupion Scheme and Simulation Model
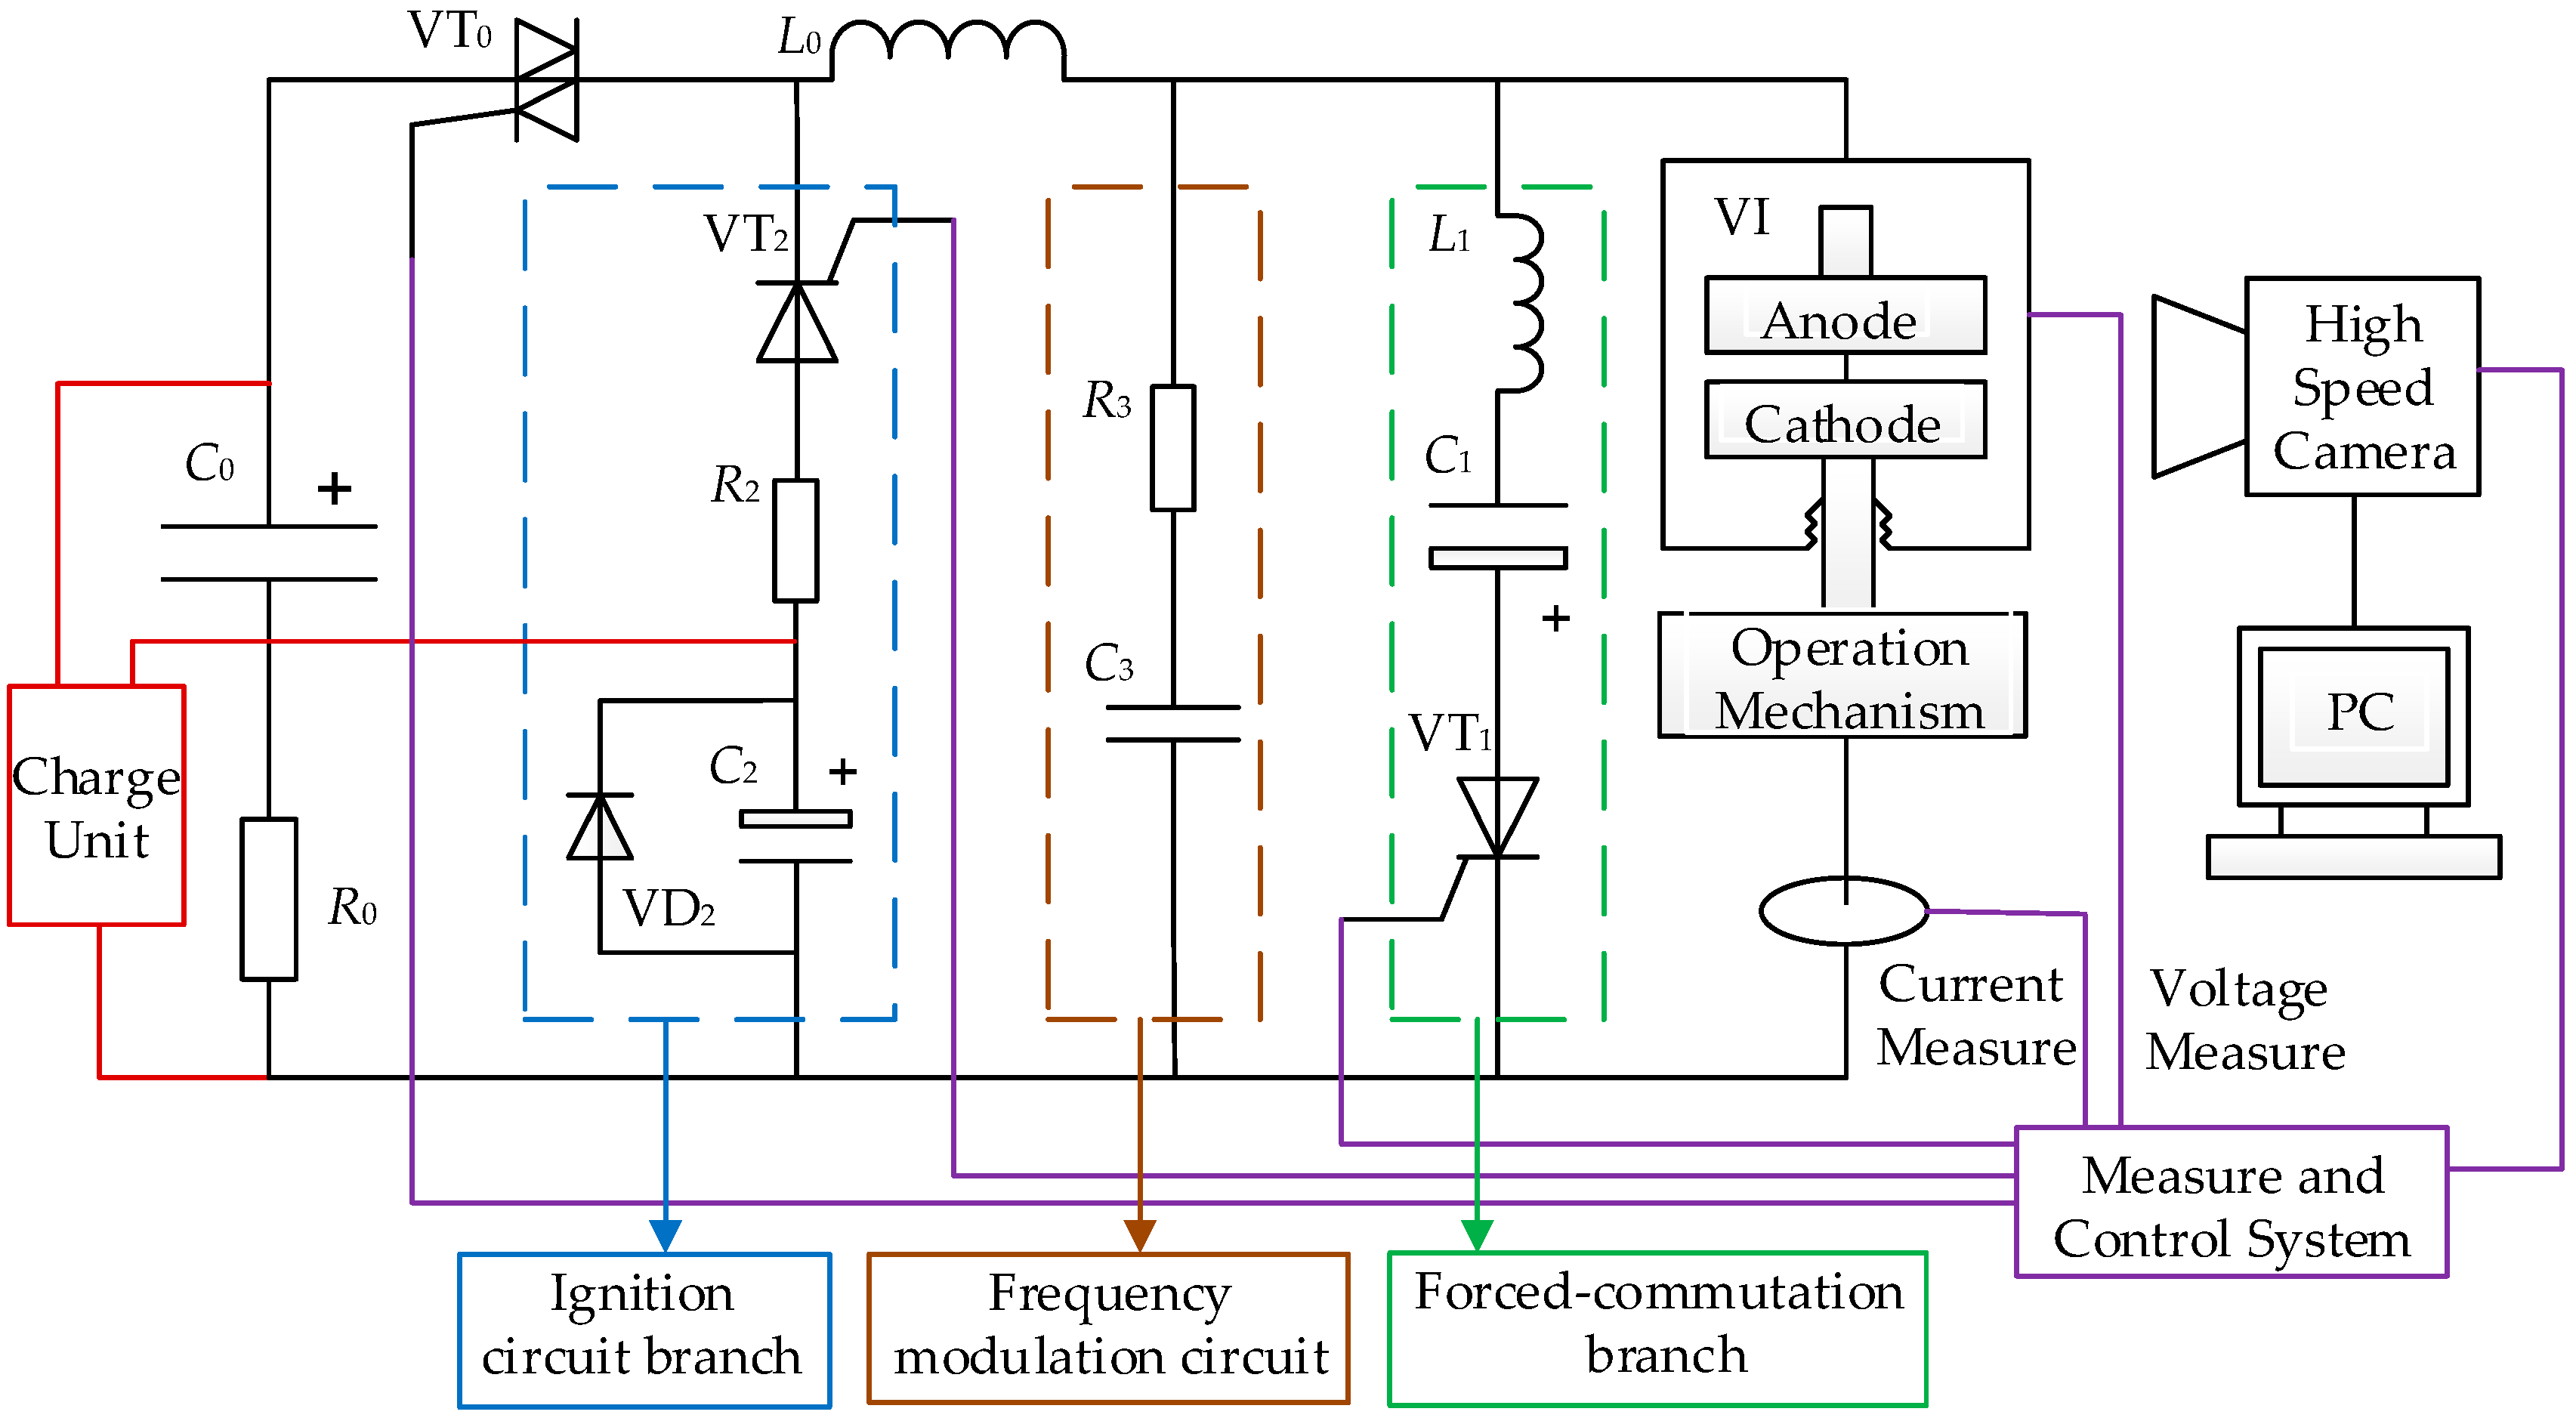
The most well-known DC vacuum circuit-breaker scheme has a forced-commutation branch connected in parallel to a VI; the DC forced interruption schematic is shown in Figure 1. The forced-commutation branch contains a precharged commutating capacitor C1, a commutating inductor L1, and a thyristor VT1. The capacitor polarity is chosen such that the first capacitor discharge current wave IC is in the direction opposite to that of the arc current IA in the VI. If the amplitude of the commutating capacitor current IC exceeds that of the main circuit, I0, the arc current in the VI goes through zero, and the current is interrupted. After the interruption, the polarity of the commutating capacitor C1 is reversed to the primary polarity. The RC frequency-modulation circuit composed by R3 and C3 has two functions. First, the capacitor in the RC branch, whose capacitance is much higher than the stray capacitance of the VI, can uniformly distribute the transient recovery voltage across the break of each interruption. Second, the resistor in the RC branch can dampen the high-frequency oscillations in the transient recovery voltage, and can consequently suppress the rising rate of the transient recovery voltage [11].
Based on the forced-commutation interruption, a simulation model is established using MATLAB/Simulink. The main circuit breaker VI is set as an ideal switch, and the contact resistance is ignored when the switch is closed. The ideal switch is closed in the DC-arcing stage, and different currents are obtained by adjusting the resistance R0. At the beginning of the simulation, the ideal switch is closed, and the thyristor VT1 is triggered in the forced-commutation branch after a delay of 1 ms. The current flowing through the main circuit breaker decreases, and when the current is less than a preset value, the ideal switch is opened. In the forced-commutation branch in the simulation model, L1 is set as 3.4 μH and C1 is 1620 μF. The frequency-modulation circuit consists of a resistor R3 and capacitor C3, with values of 0.1 Ω and 0.1 μF, respectively. The L0, which has a value of 12 μH, is the stray inductance generated during accrual situations.
2.2. Direct-Current Forced Interruption Process
From the typical waveforms of DC forced interruption, shown in Figure 2, it can be observed that the interruption process consists of three stages: the DC-arcing stage, current-commutation stage, and voltage-recovery stage. The DC-arcing stage occurs from the beginning of the simulation to the beginning of the forced-commutation-branch conduction. In this stage, the current through the ideal switch is constant. When the thyristor VT1 is trigged, the second stage—the current-commutation stage—begins. The arc current IA decreases rapidly by virtue of the current commutation to the forced-commutation branch. After this, the voltage of the VI starts decreasing within several microseconds, and the VI voltage starts oscillating at a high frequency. From then, the main circuit current I0 begins to decrease, and the voltage-recovery stage begins. The voltage between the contacts of VI increases. This process is actually the reverse charging process of the capacitor, which ends when the contact voltage reaches the power-supply voltage.
2.3. di/dt in Current-Commutation Stage
di/dt and dv/dt are important parameters in the current-commutation stage. We calculate di/dt as the average current-change rate over the time from the start of forced commutation to the current zero condition, and dv/dt as the average voltage-change rate over the time from the current zero condition to the first peak of the recovery voltage [26].
In the current-commutation stage, when the arc resistance is ignored, the commutating current IC can be approximated as per the following equation:
where ; the reverse peak current is shown in Equation (2):
The reverse peak-current coefficient k is set by the equation:
i0 is the main circuit current. U0 is the precharged voltage of the commutating capacitor in the forced-commutation branch, which should satisfy:
As the arc current decreases approximately linearly in the current-commutation stage in Figure 2, di/dt is calculated using the following equation [27]:
where L is the inductance of the commutating inductor in the forced-commutation branch. As can be seen from Equation (5), when the forced-commutation branch parameters are certain, di/dt can be reduced through the appropriate reduction of the precharged voltage. Similarly, when U0 and C are fixed, the increase of L is beneficial to the reduction of di/dt. In fact, the above two methods to reduce di/dt lead to the reduction of the reverse peak current in Equation (2). It can be concluded that the magnitude of di/dt is directly related to the reverse peak-current coefficient, when the main circuit current I0 is fixed. The selection of the charging margin directly affects the value of di/dt. When the circuit parameters are determined, the precharged voltage U0 is determined by the value of k, which affects the transient characteristics in the interruption process. Substituting Equation (4) into Equation (5), we obtain Equation (6), as follows:
If the decay of the oscillation current in the current-commutation stage is ignored, di/dt can be determined from the oscillation frequency and the coefficient k under the same breaking current level. Under the same oscillation frequency, the selection of the reverse peak-current coefficient k directly determines the value of di/dt. In order to ensure reliable commutation, the value of k is generally chosen to be between 1.3 and 2. In practical applications, in order to calculate the di/dt in the current-commutation stage accurately, the following formula is used:
Here, , , , and R is the equivalent stray resistance in the forced-commutation branch, which is 22 mΩ in our research.
Table 1 shows the comparisons of the di/dt obtained through the methods of Formulation (7), simulation, and experiments. The results calculated using Equation (7) are in good agreement with the simulation and experimental results.
2.4. Voltage Transient Characteristics in Forced-Commutation Interruption
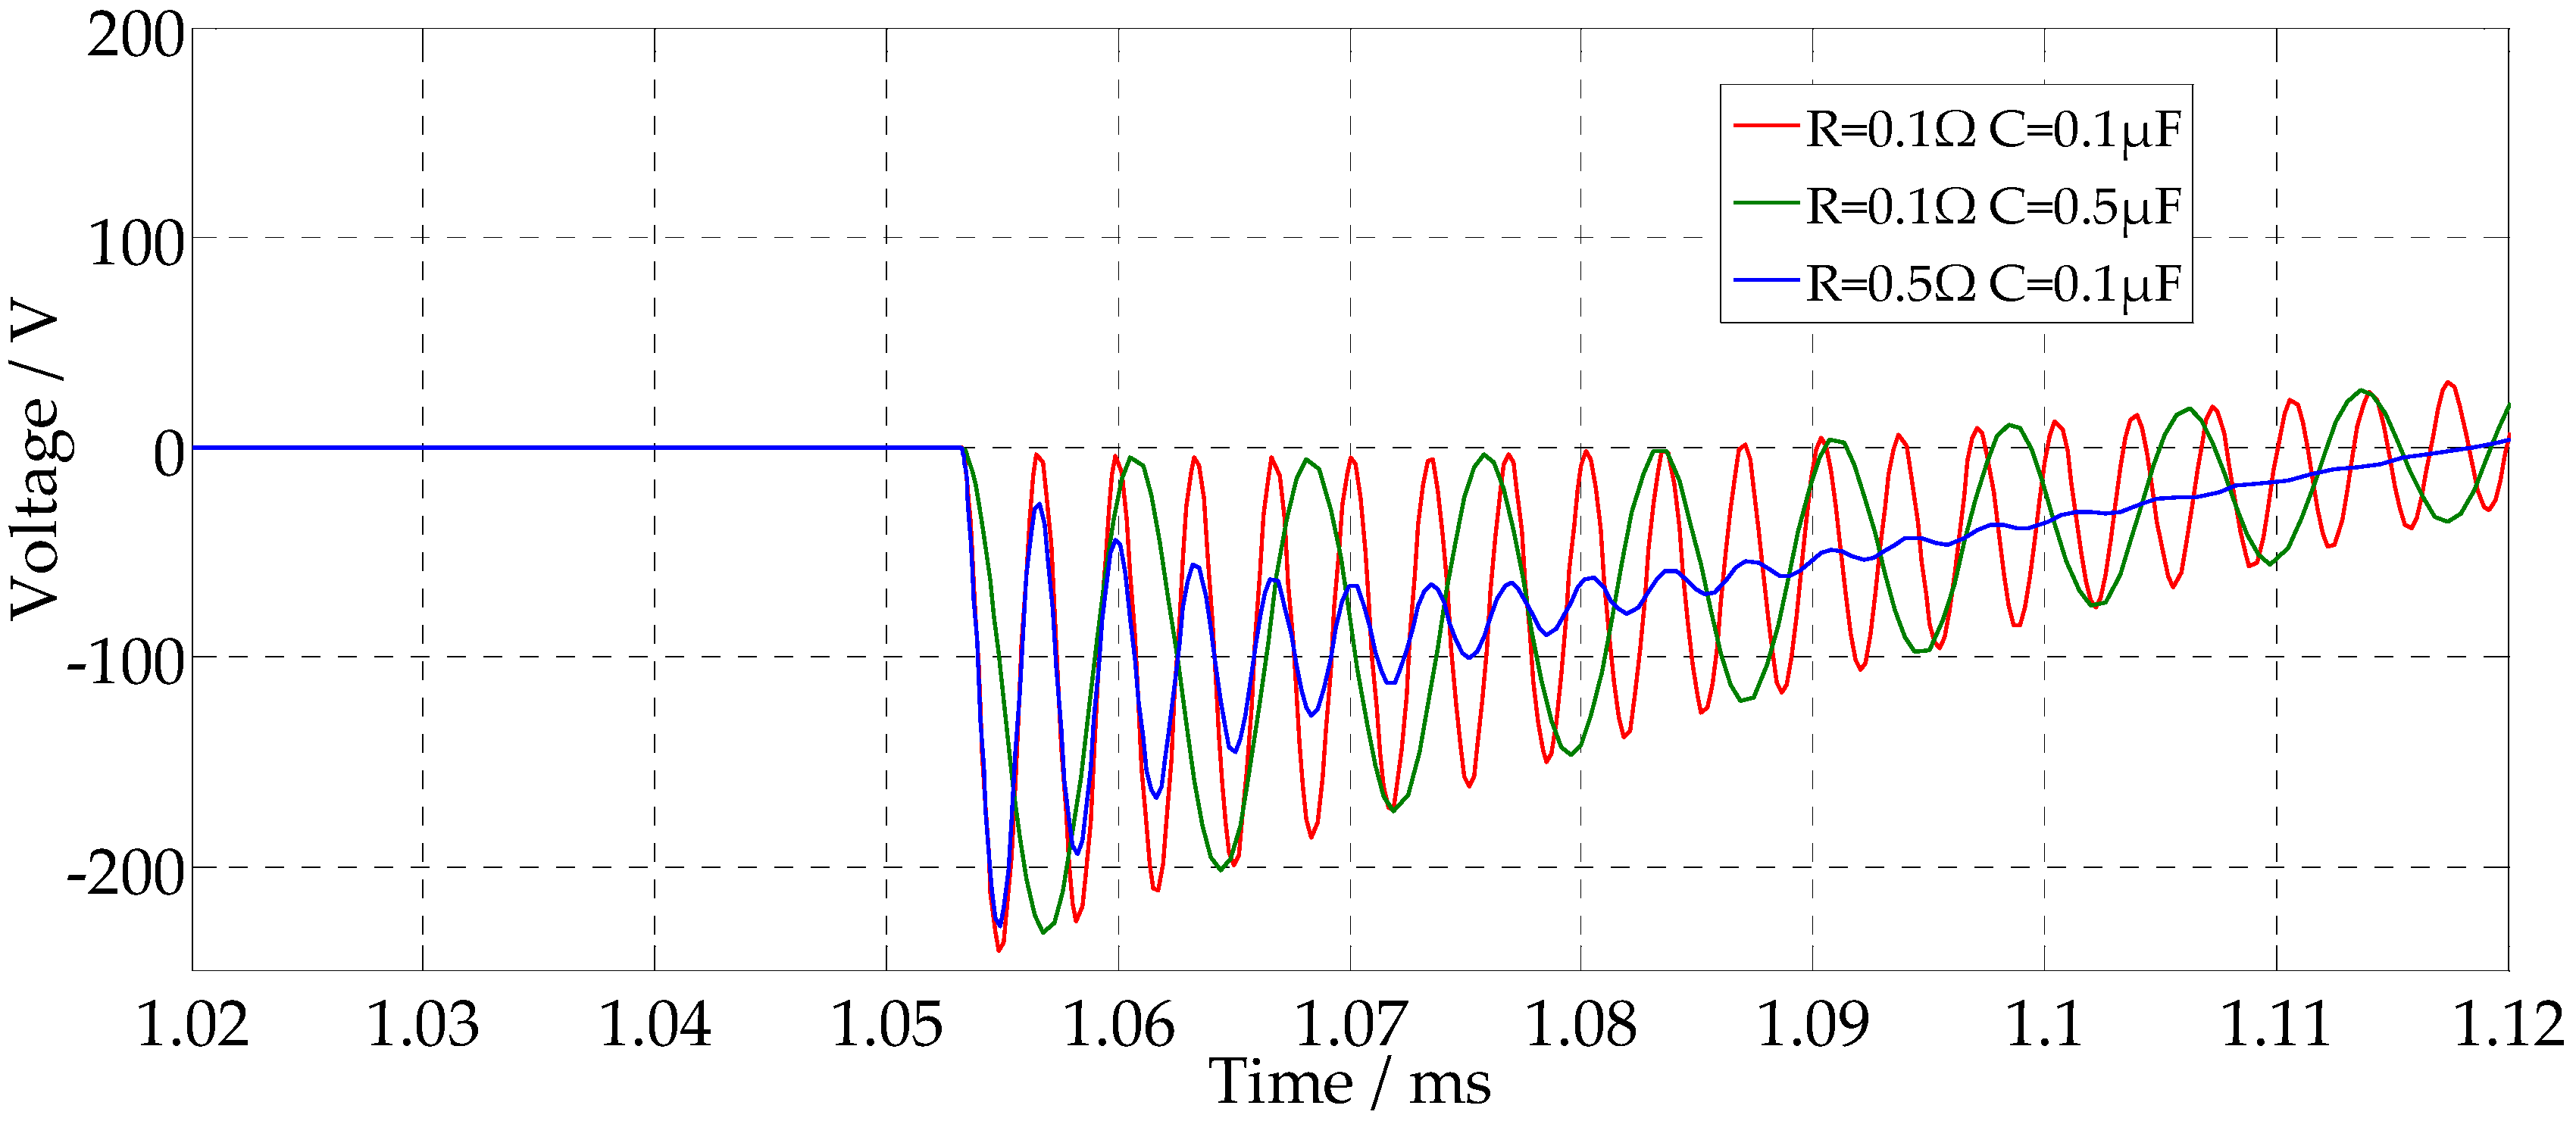
The voltages in the current-commutation stage demonstrate two types of waveforms with different frequencies. Only the low-frequency vibrations are determined by inductance L1. There are two high-frequency oscillations. The first high frequency is influenced by the frequency-modulation circuit and the forced-commutation branch. When the parameters in the forced-commutation branch are fixed, dv/dt is determined by the R and C in the frequency-modulation circuit alone, in the current-commutation stage. The voltage of the VI in the current-commutation stage for different frequency-modulation circuit parameters is shown in Figure 3. It is suggested that the decreased value of C3 will lead to a rise in dv/dt and in the oscillation frequency. The change in R3 does not affect the slope of dv/dt, but it affects the oscillation amplitude. When the circuit is not connected parallel to the frequency-modulation circuit, the transient recovery voltage is mainly influenced by the capacitance C of the forced-commutation branch and the main circuit current i0 [28].
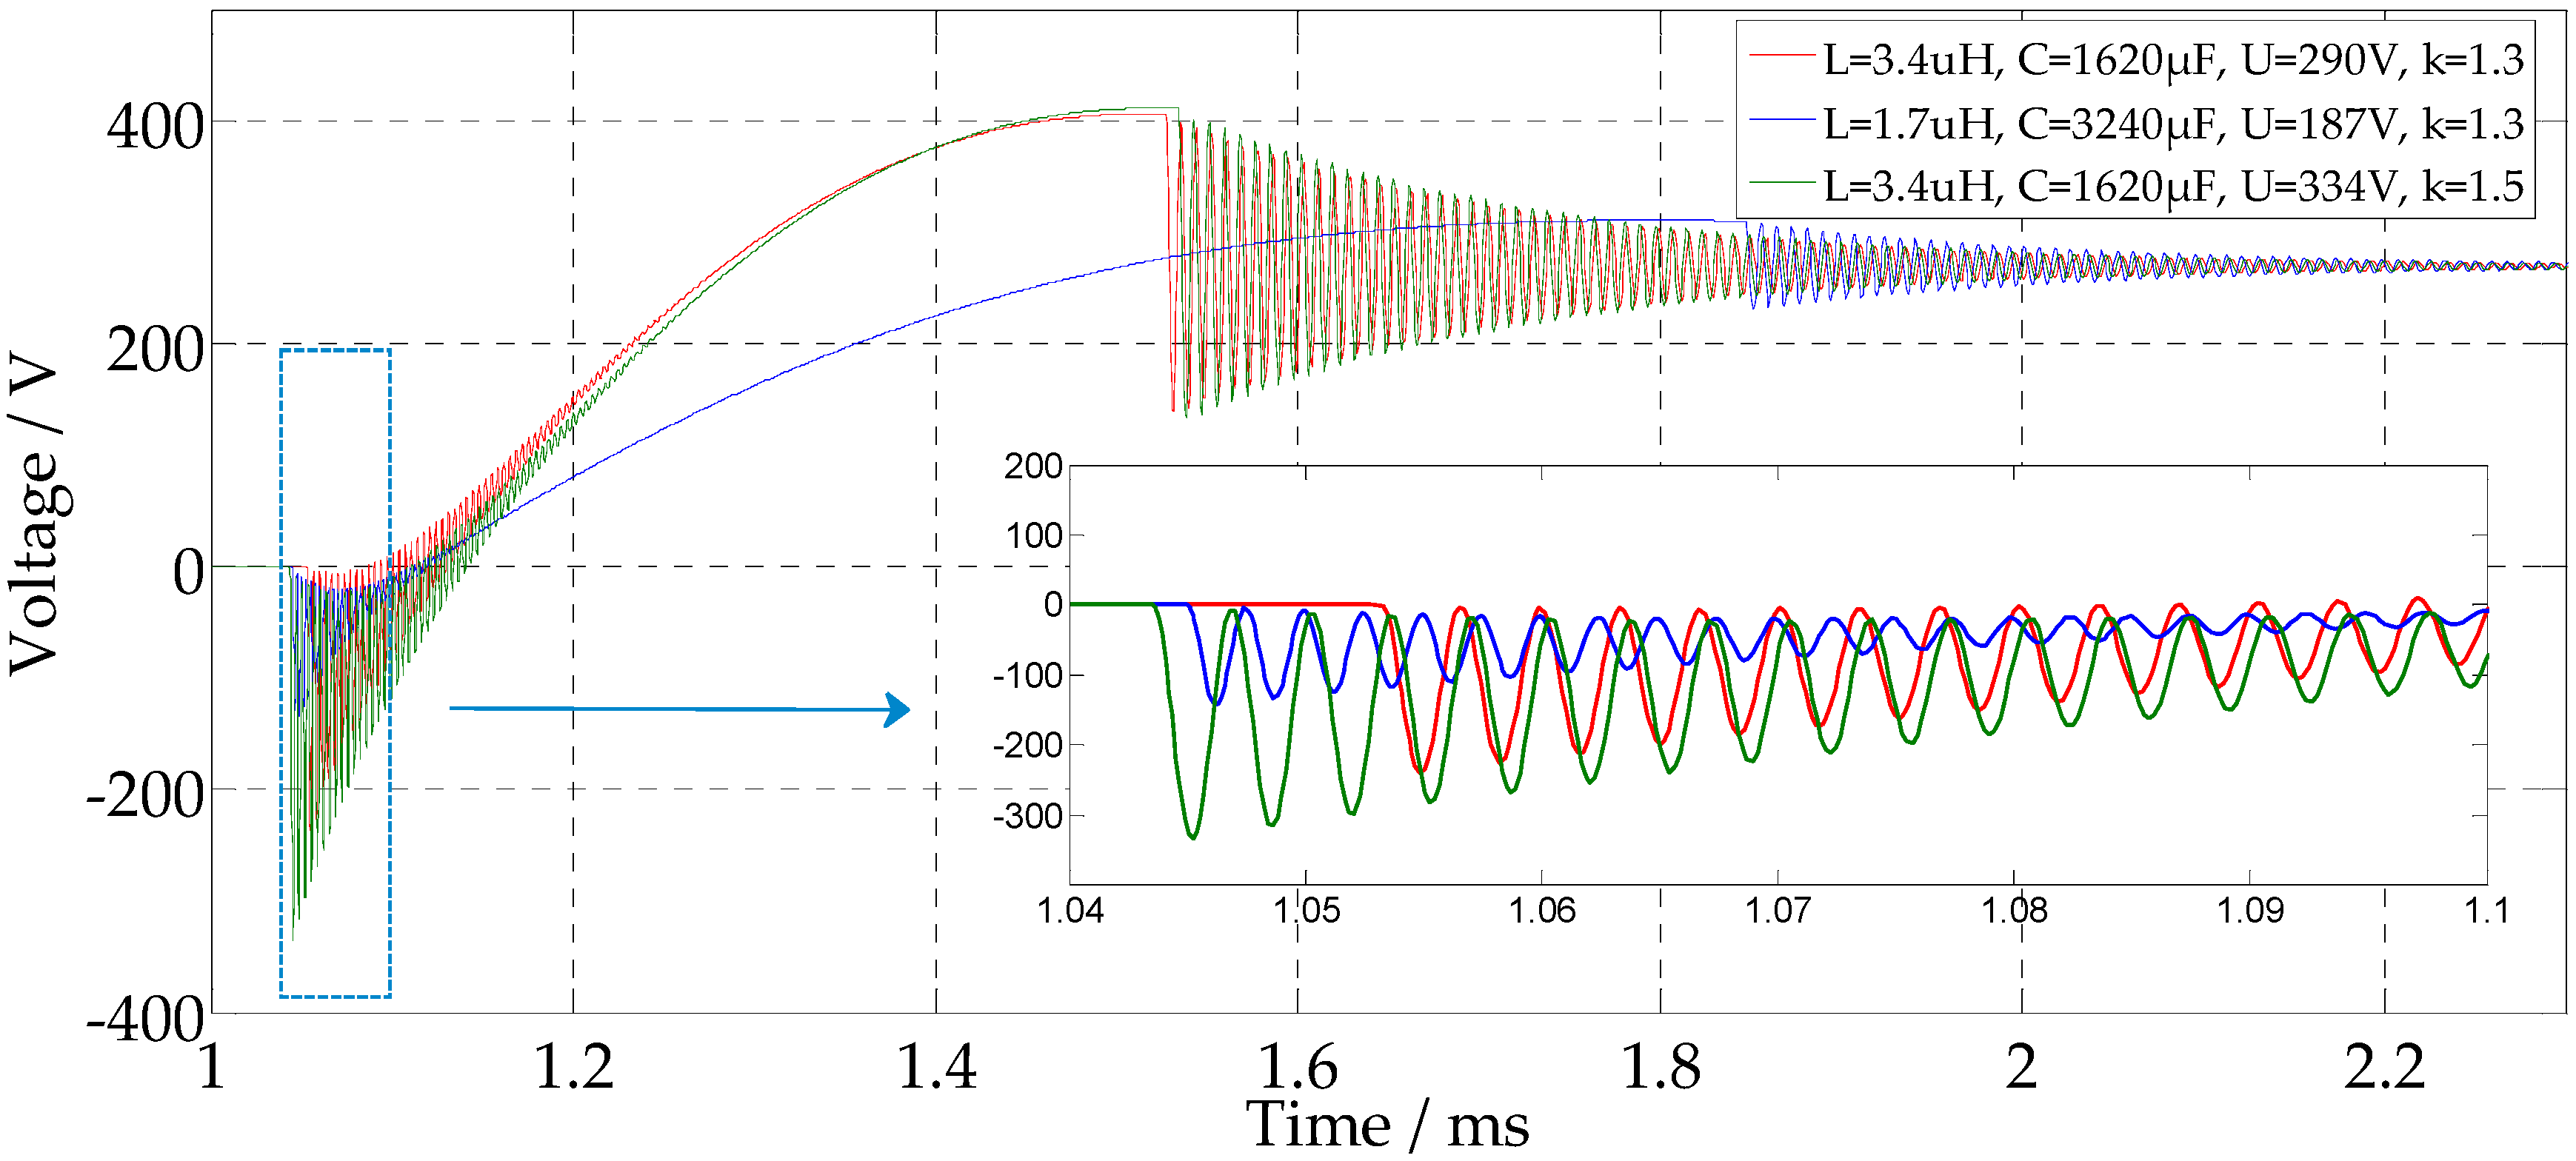
The frequency of the second high-frequency oscillation is influenced by the frequency-modulation circuit and the inductance L0 in the main circuit. The oscillation amplitude is determined by the breaking current I0, the residual voltage in C1, and the L1. By changing the parameters of the forced-commutation branch, the change in VI voltage can be obtained through simulations, as shown in Figure 4. By comparing the three simulation conditions and results, we can observe that, when the inductance of the commutation inductor is halved and the capacitance of the commutation capacitor is doubled, the commutation frequency remains unchanged, and the peak value of the VI voltage will be lower. With an increase in the commutation capacitance, the commencement of the voltage oscillations is delayed, but the three interruptions shown in Figure 4 end at the same time. This is due to the reduction in the precharged voltage of the commutation capacitor by the smaller inductance under the same k. The increased capacitance leads to a delay in the start of oscillation, but dampens the oscillation amplitude and period. Furthermore, with a smaller commutation inductance, the amplitude and period of the VI voltage can be effectively suppressed in the two oscillation processes. Besides, when k is set to be larger, the voltage increases with a higher precharged voltage of C1.
From the above analysis, it can be inferred that the selection of the reverse peak-current coefficient k affects not only the di/dt in the current-commutation process, but also the VI voltage transient characteristics in interruption. Properly reducing the value of k can reduce the slope of di/dt and lead to better voltage transient characteristics. When designing the parameters of the forced-commutation branch, the coupling relationships among the parameters should be comprehensively considered. The use of a power-supply voltage of 270 V limits the overvoltage during interruption to a much smaller value, by setting the absorption branch. Therefore, the precharged voltage of the commutation capacitor should be less than the peak of the overvoltage, to reduce the withstanding voltage of the forcing capacitor; thereby, the volume and cost can be reduced. With the decrease in L/C, the precharged voltage of the capacitor can also be reduced effectively, and the peak value of the VI voltage can be reduced under the same oscillation frequency.
3. Experimental System Setup
A direct circuit system was used to study the DC forced-commutation interruption, as shown in Figure 5. The instantaneous short-circuit current was supplied from the capacitor C0 with the capacitance value of 2 F, by triggering the bidirectional thyristor VT0 controlled by the measure-and-control system. The main current ratings were obtained by adjusting R0. In the breaking cycle, the experimental results showed that the total attenuation of the circuit current was less than 10%, which could provide a stable short-circuit current. As the contact separation time was uncertain, the time of arc ignition was also uncertain; thus, the arcing time was incorrect. An ignition circuit branch was designed to ignite the arc before the main current was injected. When contact separation occurred, an arc was formed between the anode and the cathode in the VI. At this time, the VI current was small, as long as the arc could be maintained, until the contacts were fully open. This current was provided by VT2, C2, and R2. The branch of R3 and C3 was composed as a frequency-modulation circuit. The frequency-modulation circuit was used to guarantee the same rate of rise of recovery voltage parameters after interruption. The forced-commutation branch included VT1, C1, and R1. The amplitude of the oscillation current was determined by the main circuit current I0 and the reverse peak-current coefficient k. The arc voltage and arc current were recorded by a multichannel isolated oscilloscope. The arc voltage was obtained from the voltage drop across the VI, and was corrected for the induced voltage drop caused by the resistance of the VI. The arc current was measured using a Roche Coil. A Phantom v7.3 high-speed video camera and a PC were used to record the arc appearances and the arc moving processes with a camera sample rate of 72,000 frames/s and exposure time of 1 μs. The parameters of the experimental system for DC forced interruption are listed in Table 2.
The detailed experimental operation is shown in Figure 6, and is described below. At the start of the experiment, the charging voltage of the capacitor C0 is 270 V, and the precharged voltage of the capacitor C2 is approximately 200 V. The precharged voltage of C1 varies according to the current rating of the arc current. The VI is in the closed position at this time. The trigger thyristor VT2 is triggered first to ignite the direct current, followed by the opening of the contacts, and a vacuum arc is maintained with a small current of approximately 80 A until the contacts are fully open. The opening of the contacts is actuated by the operation mechanism signal. Then, the camera signal and the thyristor VT0 are triggered sequentially. The direct current is injected and the DC-arcing stage begins. VT2 is switched off by the negative voltage. After the arcing time, the thyristor VT1 is triggered, and the forced-commutation process occurs.
Specially designed sealed VIs with spiral-type TMF contacts for forced-commutation interruption are utilized in the experimental system, as shown in Figure 7. The parameters of the electrodes are listed in Table 3. In order to observe the vacuum-arc appearance, the normally present metal shield of the VI is removed.
4. Experimental Results
4.1. Vacuum Arc Behavior with Spiral-Type TMF Contacts
Utilizing the experimental system described above, interruption experiments were carried out with currents of approximately 3.5 kA, using the type A and type B spiral-type TMF contacts. The typical vacuum arc appearance is shown in Figure 8 for a 2 ms arcing time.
As shown in Figure 8a, at T = 37.5 μs, a contracted arc developed, and the arc column diameter increased with the increase in the current. The arc in the contact anchored at the ignited point at the first arcing period of ~0.1 ms. During this period, the arc columns went through an initial expansion process with a relatively brighter central core and the arc voltages increased to 27 V. At this early expansion stage, there were few or no cathode spots outside the central column. With the further expansion of the arc, one or two cathode spot groups were formed, with the cathode spots splitting from the arc column. Then, the cathode spots began to move around the arc column. The arcs moved, increasing the cross-sectional area, and new cathode spots were constantly formed, which moved to the edges of the contacts, driven by the ampere force. By the time T = 1 ms, the cathode spots had occupied almost the entire cathode surface; their diameter was approximately 3/4 of the diameter of the contact, and they did not expand further. This process was investigated in [29]. It was indicated that the arc column established between the separating electrodes (with the range of current limited to below 5 kA) and the observed columnar arcs became diffused. Thereafter, the movement of the cathode spots was not obvious. During this process, the arc was burning relatively stably. However, from T = 1962.5 μs, the cathode spots moved to the edges of the slots of the spiral-type contacts, and began to burn intensively, developing into an intensive arc mode. With this locally intensive arc burning, large amounts of plasma and metal vapor were emitted into the contact gap, which is marked with an arrow in Figure 8a. When the arcing time was 2063.9 μs, forced commutation was triggered, and the arc current began to decrease, flowing into the forced-commutation branch. With the decrease of the arc current, the brightness of the arc and cathode spots became less. At T = 2108.2 μs, the arc current became zero. The bright cathode spots extinguished instantly, and the plasma began to diffuse between the contacts. At this time, the post-arc current reversed to IA, while the plasma in the contact was not fully diffused. It could be seen that the plasma moved irregularly in the contact gap, and that its density became larger at the position of intensive arc burning.
To better understand the formation of the intensive arc mode, tests were conducted with a type B contact for the same experimental parameters. A typical vacuum arc appearance was observed for the type B contacts under a 2 ms arcing time, and the results are shown in Figure 8b. The arc expanded gradually during the early stages and the arc voltage increased above 25 V. Then, with more cathode spots appearing outside the central core, a significant number of cathode spots began to appear outside the column, and they expanded to fill the cathode surface after a period of typically 0.17 to 1 ms. During this period, the arc transited to the column diffuse mode. After the diameter became the maximum, the arc started burning stably. Unlike the above-mentioned arc mode in the type A contact, no intensive arc was found in the whole arc period. The residual plasmas were obviously less after the current zero.
The diameters of the diffuse columns at different current ratings in the DC-arcing stage are shown in Figure 9. In the early stages of column diffusion, the arc expands rapidly. The higher the current level, the faster the expansion will be. The motion of the cathode spot is the result of the interactions between the TMF and the self-generated magnetic field. A higher interruption current will increase the magnetic force, and the cathode spot will move at a faster speed. With the increase in the diffusion diameter, the arc diffusion velocity will decrease gradually. After approximately 1.4 ms, the arc tends to expand slowly. The maximum column diameter is proportional to the current level. The symbol “•” denotes the beginning of occurrence of the intensive burning arc. From the obtained appearance, it can be inferred that almost all intensive arcs occur after 1.4 ms with interruption currents less than 2.6 kA. With the increase in the current rating, the time of intensive arc occurrence advances.
4.2. Influence of Arc Behavior on Breaking Performance
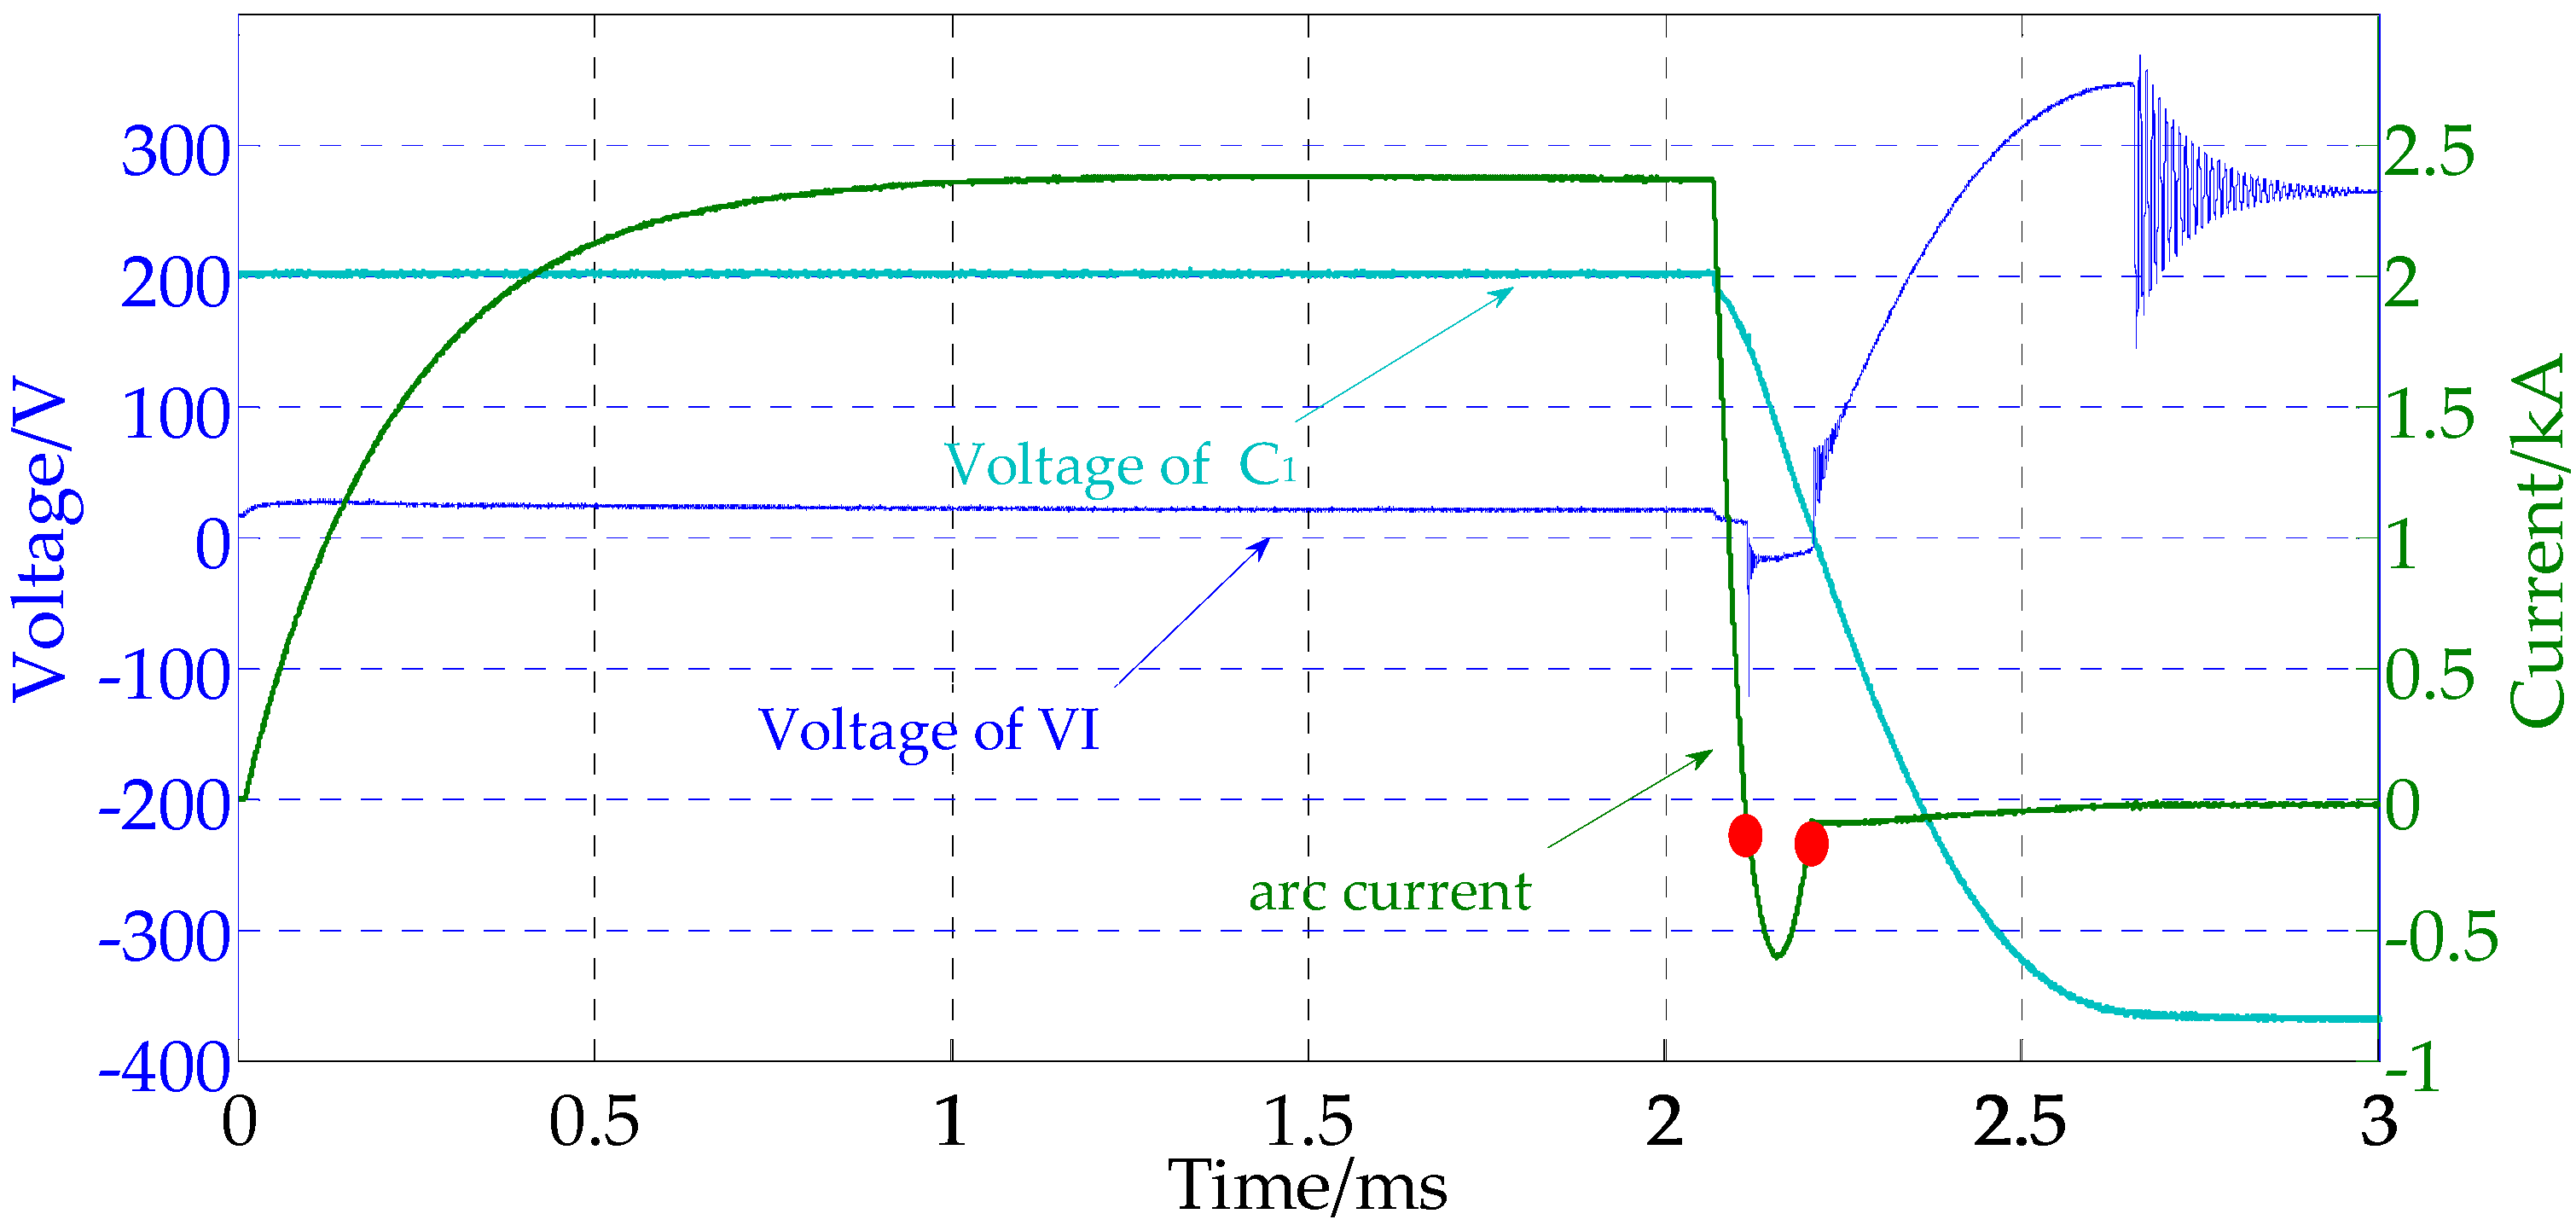
When the contact material is CuW80, an intensive arc mode occurs during the arc’s stable burning process. When the arc develops into an intensive arc, the current density increases, and more metal vapor is generated between the contacts. This can be observed directly in the arc images shown in Figure 8. The experimental waveforms and arc appearances of the interruption failure at the first current zero and success at the second current zero with a 2 ms arcing time for the type A contact are shown in Figure 10 and Figure 11, respectively. In the DC-arcing stage, the arc voltage is maintained at approximately 25 V. During the current-commutation stage, the capacitor is continuously discharged, and the voltage is continuously attenuated. When the arc current passes through the first current zero, re-ignition occurs. When the contact current passes through the second current zero, the voltage between the contacts increases until it reaches the source voltage. From Figure 11, it can be seen that the intensive arc mode develops at the center left position of the cathode contact. When the arc current is zero, more arc plasma occurs at the region of the intensive arc where arc re-ignition occurs. At the same time, a new cathode spot can be observed on the surface of the original anode during re-ignition. The position of re-ignition is the region of the intensive arc mode, as is the case in almost all re-ignition experiments. This phenomenon can be explained based on the high melt vapor density and temperature at the position of the intensive arc. Therefore, it is much easier for re-striking at the region of intensive arcing. Moreover, in this re-striking process, the arc is still bright, which is observed for all re-ignition conditions. Therefore, the brightness of plasma and metal vapor after current zero is another re-ignition feature. This region is the position of the intensive burning arc before the current zero.
4.3. Influence of Arcing Time on Breaking Capacity in Type A Contact
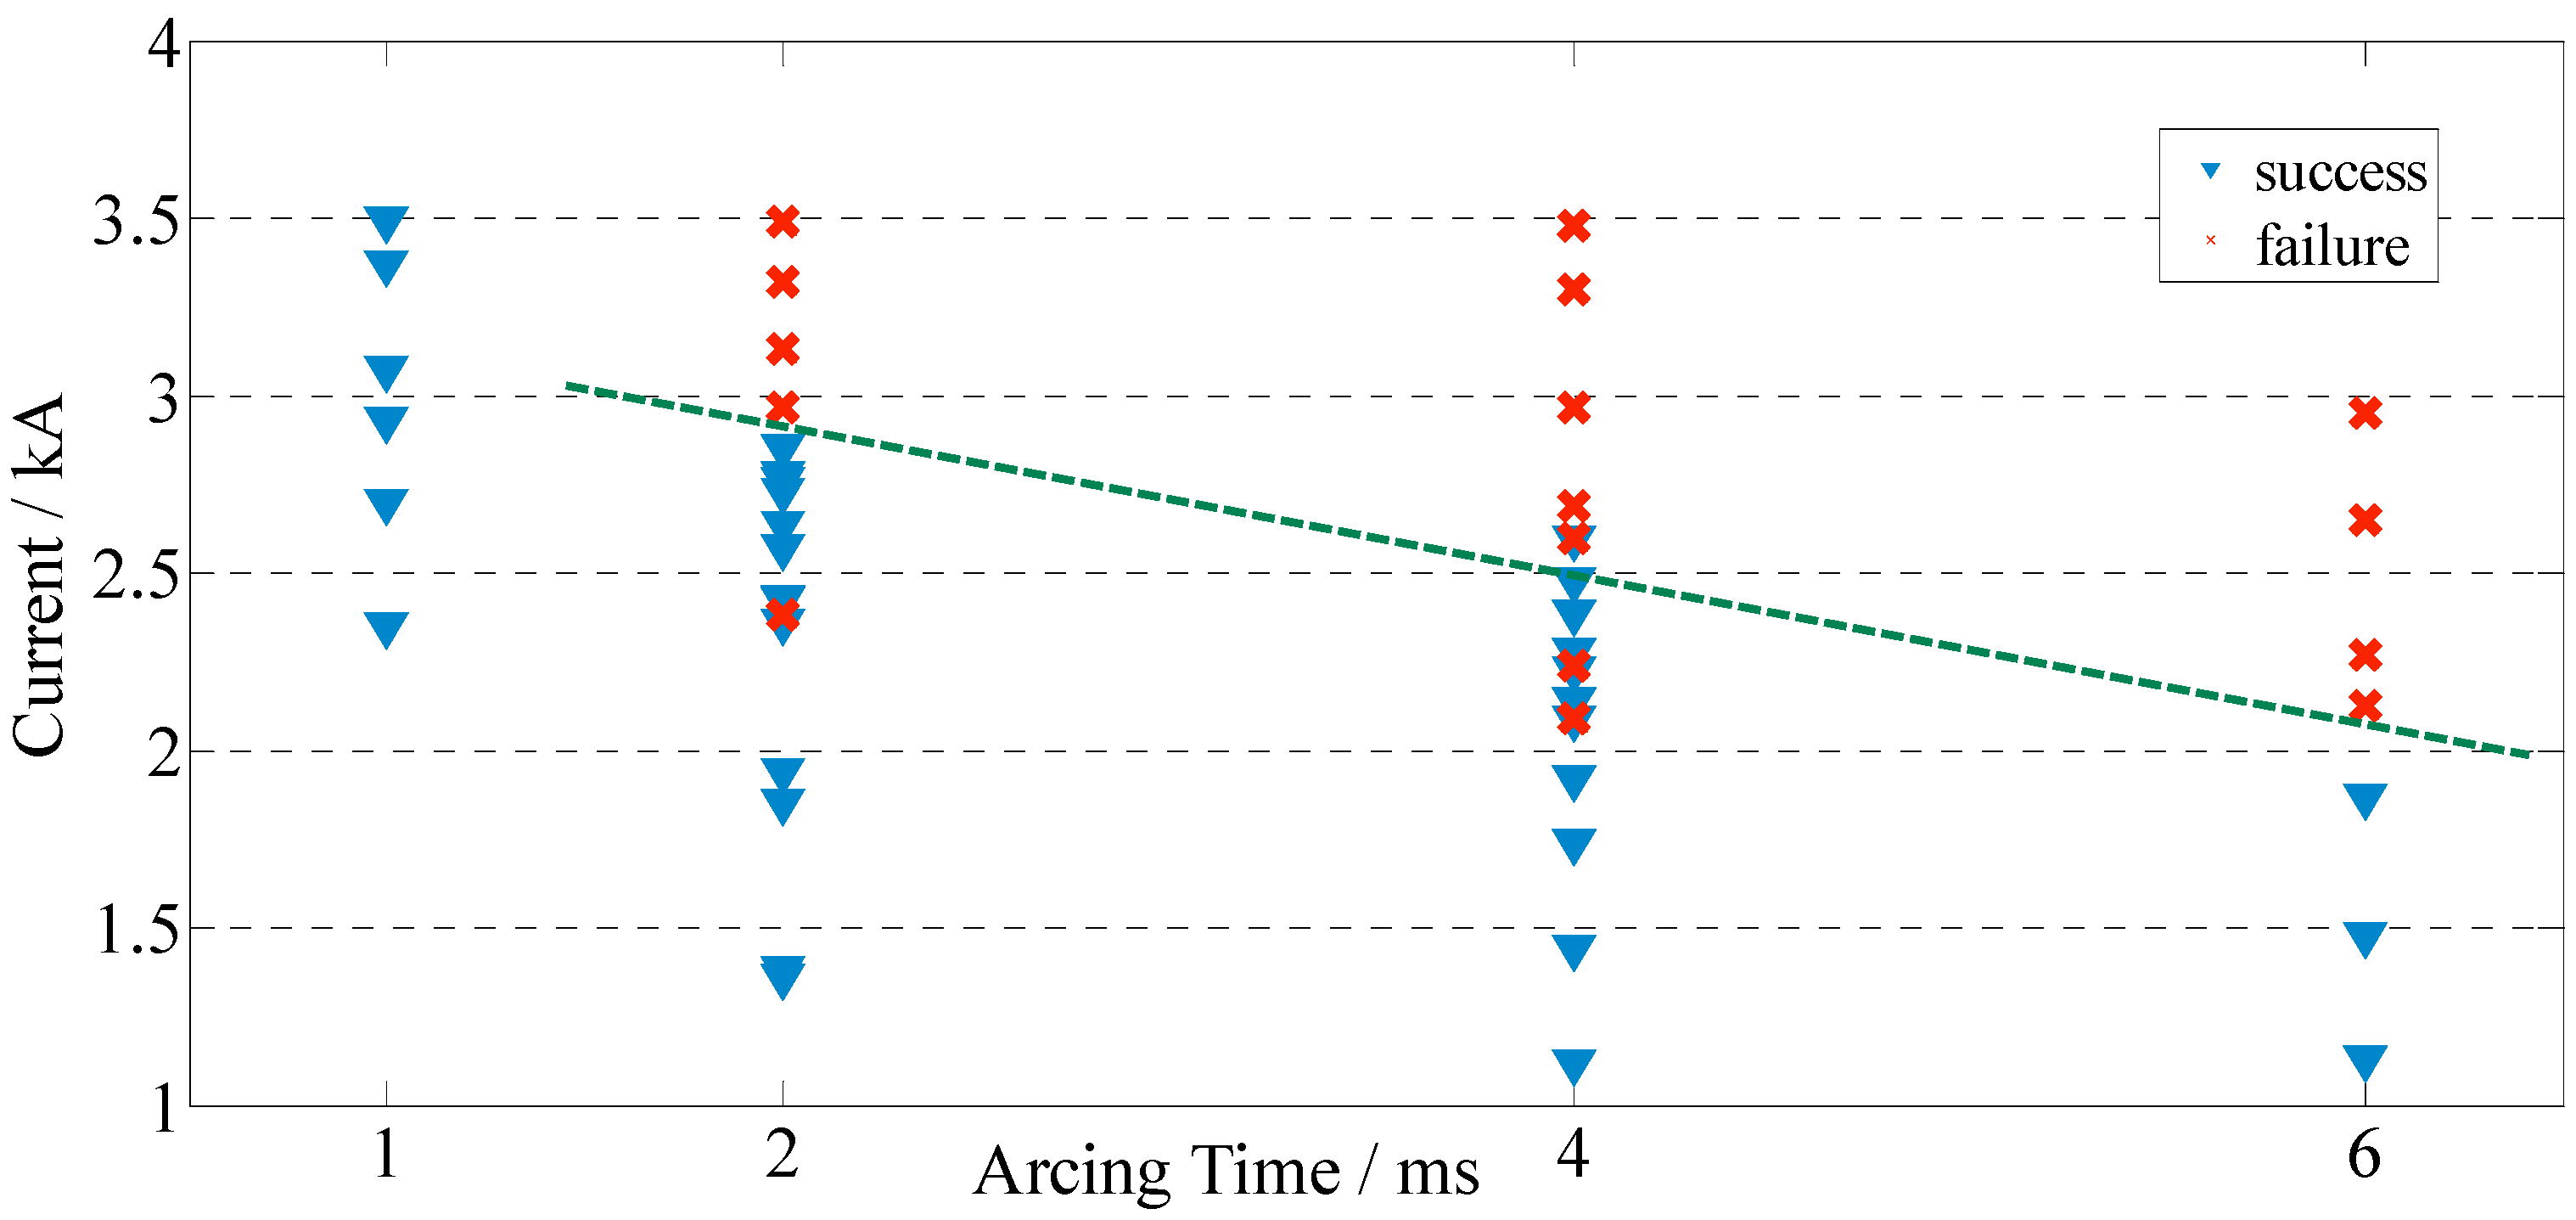
In order to analyze the influence of arcing time on the breaking capacity, experiments were conducted on the type A contact for arcing times of 1, 2, 4, and 6 ms. The experimental results of the breaking performance are shown in Figure 12. The symbols ‘▼’ and ‘x’ denote interruption success and failure, respectively, at the first current zero.
It can be concluded that, as the arcing time increases, the breaking capacity of the VI is greatly reduced. When the arcing time is 1 ms, the intensive arc mode is not developed and the breaking performance is much better. If the arcing time is longer than 1 ms, the breaking performance deteriorates, and the maximum breaking ability becomes proportional to the arcing time. When the arcing time is 2 ms, the maximum breaking ability is about 2.9 kA, but re-ignition happens at 2380 A. A similar phenomenon occurs for an arcing time of 4 ms at an interruption current of 2.2 kA. From the analysis above, this is directly related to the occurrence of the intensive arc mode. From the obtained arc images, it is found that the intensive arc mode is not observed for arcing times less than 1 ms. On the contrary, when the arcing time is 2 ms or longer, some cathode spots develop in the intensive arc. Therefore, it can be inferred that the intensive arc mode increases the probability of re-ignition and reduces the breaking capacity of the VIs.
5. Discussion
Low-current diffuse-type intensive arcs with highly evaporative cathode roots are mainly formed at the edges of the contacts and slots. At the position of a particularly intensive cathode spot, this can result from the continued heating of the localized hot area of the anode [30]. This also influences the density of the metal vapor at current zero. The thermal hysteresis will maintain a hot cathode surface for some time. Even though the current decline rate is very fast, the hot cathode continues to emit plasma for some time [31]. As a result, when the transient recovery voltage is increased, breakdown occurs and interruption fails. Meanwhile, local overheating would not only cause major contact erosion, but also reduce the breaking capacity because of the increased metal vapor generation and the pronounced afterglow effect [32]. Once the intensive arc has developed, the arc root moves slowly and more plasma is emitted to the gap. At the position of the intensive arc, the amount of residual metal vapor is much more when the arc current passes through zero. Hence, the probability of re-ignition increases and the breaking capacity reduces.
On comparing the arc appearances of the two types of contacts, no intensive arc mode is observed in the CuCr50 contact. As we know, the melting and boiling points of CuW80 are much higher than that of CuCr50, for which the arc and cathode surface temperatures are higher in the type A contact. Thus, the extinguishment and movement of cathode spots are impeded, which causes the arc to burn continuously at the local region. Therefore, it can be inferred that the occurrence of an intensive arc mode is related to the contact material, and that the possibility is greater for a high-melting-point contact material. Besides, in [33], it is noted that severe erosion occurs at both the anode and the cathode under the intensive arc mode, and that the intensive arc mode tends to occur at shorter gap lengths.
At the arc root, the charge carriers collide with the contact surface and transfer energy to the contact [21]. The total arcing energy can be calculated from the measured arc voltage, arc current, and arcing time, and can be expressed as follows:
where Parc is the mean power input (in Watts), Warc is the arc energy (in Joules), tarc is the arcing time, Rarc is the arc resistance, and Iarc is the arc direct current (in Amperes). In the DC-arcing stage, the arc current and arc voltage change by small amounts. According to Equation (9), the arcing energy is affected by the arcing duration tarc, proportionally. With a long arcing time, the DC-arcing stage is prolonged, and more energy is input to the contact. The energy transferred to the contact is mainly expended as heat conduction into the contact and evaporative cooling, which leads to higher temperatures on the contact surface. This may be a necessary condition for the occurrence of the intensive burning arc. The intensive arc mode only develops if the arcing time is long enough. Besides, the amount of residual metal vapor in the gap distance is more with a longer arcing time than with a shorter arcing time, leading to a high metal vapor density, weak dielectric strength, low breakdown voltage, and long recovery time. Therefore, a long arcing time is detrimental for the recovery of dielectric strength after current zero [9].
6. Conclusions
Based on the method of FCZ, the transient characteristics and breaking performances of spiral-type TMF contacts were researched, for aero applications. The experimental and analysis results obtained from the simulations of the interruption processes and experiments under different conditions are summarized below.
The selection of the reverse peak-current coefficient k affected not only the di/dt in the commutation process, but also the VI voltage characteristics in the recovery process. Properly reducing the value of k could reduce the slope of di/dt and lead to better voltage characteristics. By decreasing L/C, the pre-charging voltage of the capacitor could be reduced effectively, and the peak value of the VI voltage could be reduced.
Low-current diffuse-type intensive arcs with highly evaporative cathode roots were mainly formed at the edges of the contacts and slots. The intensive arc mode increased the probability of re-ignition and reduced the breaking capacity of the VI. The position of re-ignition was the region of intensive arcing. The occurrence of the intensive arc mode was related to the contact material, and the possibility was greater for high-melting-point contact materials.
The best breaking performance was observed for an arcing time of 1 ms in the CuW80 contact. If the arcing time was longer than 1 ms, the breaking performance deteriorated, and the breaking ability became proportional to the arcing time.
Acknowledgments
This study was co-supported by the National Natural Science Foundation of China (No. 51377007), the National Natural Science Foundation of China (No. 51407008), the Specialized Research Fund for the Doctoral Program of Higher Education (No. 20131102130006), and the Fundamental Research Funds for the Central Universities. We would like to thank Editage for English language editing.
Author Contributions
Wenlei Huo conceived the condition assessment model and wrote most parts of the manuscript. Jianwen Wu and Bowen Jia analyzed the data. Mingxuan Chen, Suliang Ma, and Liying Zhu checked the whole paper.
Conflicts of Interest
The authors declare no conflict of interest.
References
- Cutts, S.J. A collaborative approach to the more electric aircraft. Power Electron. Mach. Drives 2002, 223–228. [Google Scholar] [CrossRef]
- Naayagi, R.T. A review of more electric aircraft technology. In Proceedings of the 2013 International Conference on Energy Efficient Technologies for Sustainability (ICEETS), Nagercoil, India, 10–12 April 2013; pp. 750–753. [Google Scholar] [CrossRef]
- Alferov, D.F.; Belkin, G.S.; Yevsin, D.V. DC vacuum arc extinction in a transverse axisymmetric magnetic field. IEEE Trans. Plasma Sci. 2009, 37, 1433–1437. [Google Scholar] [CrossRef]
- Zheng, Z.-F. DC Interruption and DC Circuit Breaker. High Volt. Appar. 2006, 42, 445–449. [Google Scholar]
- Morishita, Y.; Ishikawa, T.; Yamaguchi, I.; Okabe, S.; Ueta, G.; Yanabu, S. Applications of dc breakers and concepts for superconducting fault-current limiter for a dc distribution network. IEEE Trans. Appl. Supercond. 2009, 19, 3658–3664. [Google Scholar] [CrossRef]
- Izquierdo, D.; Barrado, A.; Raga, C.; Sanz, M.; Lazaro, A. Protection Devices for Aircraft Electrical Power Distribution Systems: State of the Art. IEEE Trans. Aerosp. Electron. Syst. 2011, 47, 1538–1550. [Google Scholar] [CrossRef]
- Klajn, A.; Stosur, M.; Wroblewski, Z. Analysis of a forced extinction of a diffuse vacuum arc for digital modelling purposes. In Proceedings of the 20th International Symposium on Discharges and Electrical Insulation in Vacuum, Tours, France, 1–5 July 2002; pp. 411–414. [Google Scholar]
- Niwa, Y.; Sakaguchi, W.; Sasage, K.; Somei, H. Fundamental research of uniform vacuum arc control and its application to vacuum interrupter for high current interruption. In Proceedings of the 2013 2nd International Conference on Electric Power Equipment—Switching Technology (ICEPE-ST), Matsue, Japan, 20–23 October 2013; pp. 1–4. [Google Scholar]
- Qin, T.; Dong, E.; Liu, G.; Zou, J. Recovery of dielectric strength after DC interruption in vacuum. IEEE Trans. Dielectr. Electr. Insul. 2016, 23, 29–34. [Google Scholar] [CrossRef]
- Zhang, Y.; Shi, Z.; Wang, Q.; Gao, Z.; Jia, S.; Wang, L. Experimental investigation on HVDC vacuum circuit breaker based on artificial current zero. In Proceedings of the 2016 27th International Symposium on Discharges and Electrical Insulation in Vacuum (ISDEIV), Suzhou, China, 18–23 September 2016; pp. 1–4. [Google Scholar]
- Shi, Z.Q.; Zhang, Y.K.; Jia, S.L.; Song, X.C.; Wang, L.J.; Chen, M. Design and numerical investigation of A HVDC vacuum switch based on artificial current zero. IEEE Trans. Dielectr. Electr. Insul. 2015, 22, 135–141. [Google Scholar] [CrossRef]
- Song, X.; Shi, Z.; Jia, S.; Qian, Z.; Liu, C.; Wang, L. Experimental investigation on the initial expansion process in a drawn vacuum arc and the influence of axial magnetic field. IEEE Trans. Plasma Sci. 2012, 40, 528–534. [Google Scholar] [CrossRef]
- Liu, B.; Wu, J.; Zhu, L.; Sun, Y. Vacuum arc characters research on DC forcing interruption. In Proceedings of the 2011 1st International Conference on Electric Power Equipment—Switching Technology, Xi’an, China, 23–27 October 2011; pp. 82–85. [Google Scholar]
- Schneider, H.N. Contact Structure for an Electric Circuit Interrupter. U.S. Patent 2,949,520, 16 August 1960. [Google Scholar]
- Lake, A.A.; Reece, M.P. Improvements Relating to Vacuum Switch Contact Assemblies. U.K. Patent 997,384, 7 July 1965. [Google Scholar]
- Paulus, I. The short vacuum arc—Part I: Experimental investigations. IEEE Trans. Plasma Sci. 1988, 16, 342–347. [Google Scholar] [CrossRef]
- Schulman, M.B. Separation of spiral contacts and the motion of vacuum arcs at high AC currents. IEEE Trans. Plasma Sci. 1993, 21, 484–488. [Google Scholar] [CrossRef]
- Miller, H.C. Anode modes in vacuum arcs. IEEE Trans. Dielectr. Electr. Insul. 1997, 4, 382–388. [Google Scholar] [CrossRef]
- Gentsch, D.; Shang, W. High-speed observations of arc modes and material erosion on RMF- and AMF-contact electrodes. IEEE Trans. Plasma Sci. 2005, 33, 1605–1610. [Google Scholar] [CrossRef]
- Zalucki, Z.; Janiszewski, J. Transition from constricted to diffuse vacuum arc modes during high ac current interruption. IEEE Trans. Plasma Sci. 1999, 27, 991–1000. [Google Scholar] [CrossRef]
- Kimura, T.; Sawada, A.; Koyama, K.; Koga, H.; Yano, T. Influence of vacuum arc behavior on current interrupting limit of spiral contact. In Proceedings of the 19th International Symposium on Discharges and Electrical Insulation in Vacuum (ISDEIV), Xi’an, China, 18–22 September 2000; pp. 443–446. [Google Scholar]
- Dullni, E.; Schade, E.; Shang, W. Vacuum arcs driven by crossmagnetic fields (RMF). IEEE Trans. Plasma Sci. 2003, 31, 902–908. [Google Scholar] [CrossRef]
- Kim, B.-C.; Kim, S.-T. The influence of bridged slots on arc behavior in spiral type vacuum interrupter. In Proceedings of the 2011 1st International Conference on Electric Power Equipment—Switching Technology, Xi’an, China, 23–27 October 2011; pp. 98–101. [Google Scholar]
- Zhu, L.; Wu, J.; Zhang, X. Arc Movement of Intermediate-Frequency Vacuum Arc on TMF Contacts. IEEE Trans. Power Deliv. 2013, 28, 2014–2021. [Google Scholar]
- Wolf, C.; Kurrat, M.; Lindmayer, M.; Gentsch, D. Arcing Behavior on Different TMF Contacts at High-Current Interrupting Operations. IEEE Trans. Plasma Sci. 2011, 39, 1284–1290. [Google Scholar] [CrossRef]
- Odaka, H.; Yamada, M.; Sakuma, R.; Cuie, D.; Kaneko, E.; Yanabu, S. DC interruption characteristic of vacuum circuit breaker. Electr. Eng. Jpn. 2007, 161, 17–25, (English Translation of Denki Gakkai Ronbunshi). [Google Scholar] [CrossRef]
- Alferov, D.; Budovsky, A.; Evsin, D.; Ivanov, V.; Sidorov, V.; Yagnov, V. DC vacuum circuit-breaker. In Proceedings of the 2008 23rd International Symposium on Discharges and Electrical Insulation in Vacuum, Bucharest, Romania, 15–19 September 2008; pp. 173–176. [Google Scholar]
- Heinz, T.; Hock, P.; Hinrichsen, V. Comparison of artificial current zero impulses for a vacuum interrupter based direct current circuit breaker. In Proceedings of the 2016 27th International Symposium on Discharges and Electrical Insulation in Vacuum (ISDEIV), Suzhou, China, 18–23 September 2016; pp. 1–4. [Google Scholar]
- Slade, P.G.; Hoyaux, M.I. The effect of electrode material on the initial expansion of an arc in vacuum. IEEE Trans. Parts Hybrids Packag. 1972, 8, 35–47. [Google Scholar] [CrossRef]
- Schulman, M.B.; Slade, P.G. Sequential modes of drawn vacuum arcs between butt contacts for currents in the 1 kA to 16 kA range. IEEE Trans. Compon. Packag. Manuf. Technol. A 1995, 18, 417–422. [Google Scholar] [CrossRef]
- Bin, L.; Jianwen, W.; Chao, X. Study on Dynamic Characteristic in Force Interrupted DC Vacuum Arc. IEEE Trans. Plasma Sci. 2014, 42, 2382–2383. [Google Scholar] [CrossRef]
- Huhse, P.; Reinhardt, H.J. Arc Motion in Vacuum Circuit Breakers. IEEE Trans. Plasma Sci. 1986, 14, 460–463. [Google Scholar] [CrossRef]
- Miller, H.C. A Review of Anode Phenomena in Vacuum Arcs. IEEE Trans. Plasma Sci. 1985, 13, 242–252. [Google Scholar] [CrossRef]
Figure 1.
DC forced interruption schematic based on FCZ.
Figure 2.
Typical waveform of DC forced interruption obtained from the simulation with a main circuit current of 3.5 kA and arcing time of 1 ms (UA is the contact voltage and UC is the voltage of the capacitor in the forced-commutation branch).
Figure 2.
Typical waveform of DC forced interruption obtained from the simulation with a main circuit current of 3.5 kA and arcing time of 1 ms (UA is the contact voltage and UC is the voltage of the capacitor in the forced-commutation branch).
Figure 3.
Voltage of VI in the circuit-commutation stage under different frequency-modulation circuit parameters.
Figure 3.
Voltage of VI in the circuit-commutation stage under different frequency-modulation circuit parameters.

Figure 4.
Voltage transient characteristics of VI for various forced-commutation parameters and k (L is the inductance of the commutating inductor L1, C is the capacitance of the commutating capacitor C1, and U is the precharged voltage of the commutating capacitor).
Figure 4.
Voltage transient characteristics of VI for various forced-commutation parameters and k (L is the inductance of the commutating inductor L1, C is the capacitance of the commutating capacitor C1, and U is the precharged voltage of the commutating capacitor).

Figure 5.
Experimental system for DC forced interruption.

Figure 6.
Vacuum interrupter operation timing for the experimental system.
Figure 7.
Vacuum interrupter with spiral-type TMF contacts.
Figure 8.
Typical vacuum arc appearance with an interruption current of ~3.5 kA in (a) type A and (b) type B TMF contacts under a 2 ms arcing time. The lower contact is the cathode in all arc images in this paper. The times listed on the left of the frames are the arcing times, which are based on the onset of the trigger time of VT0.
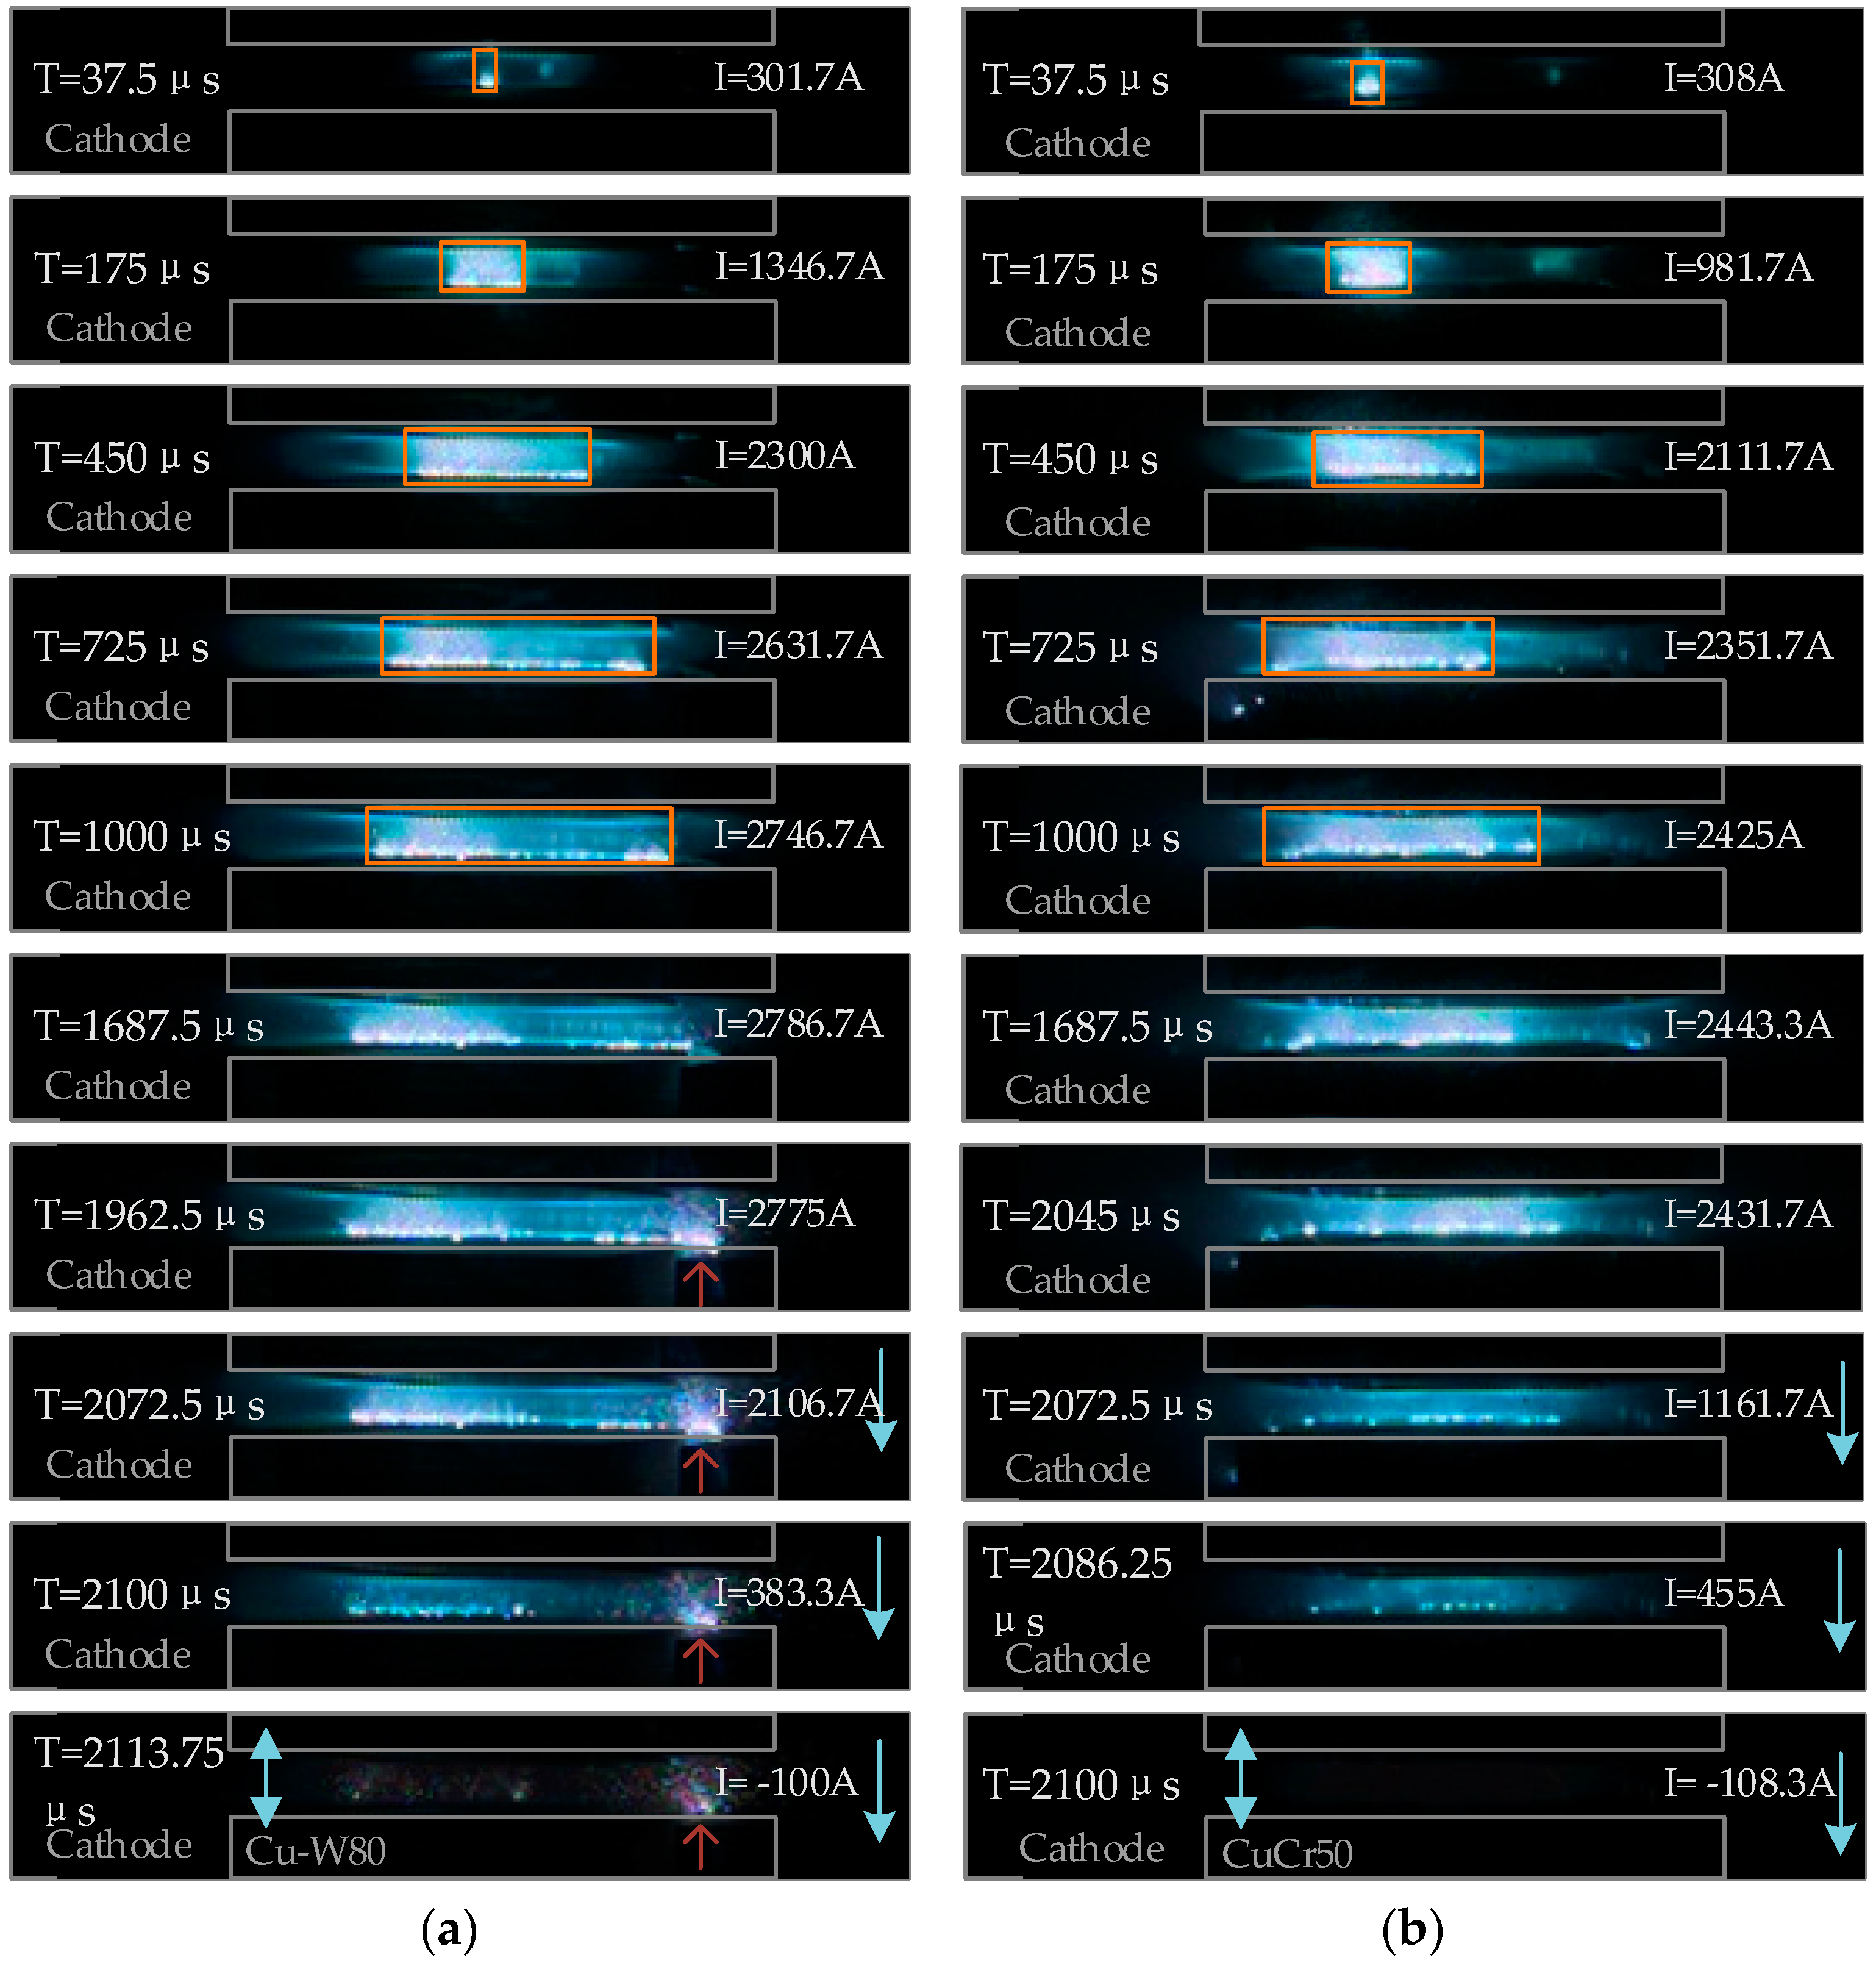
Figure 9.
Diameters of the diffuse columns at different current ratings and the start time of occurrence of the intensive burning arc.
Figure 9.
Diameters of the diffuse columns at different current ratings and the start time of occurrence of the intensive burning arc.
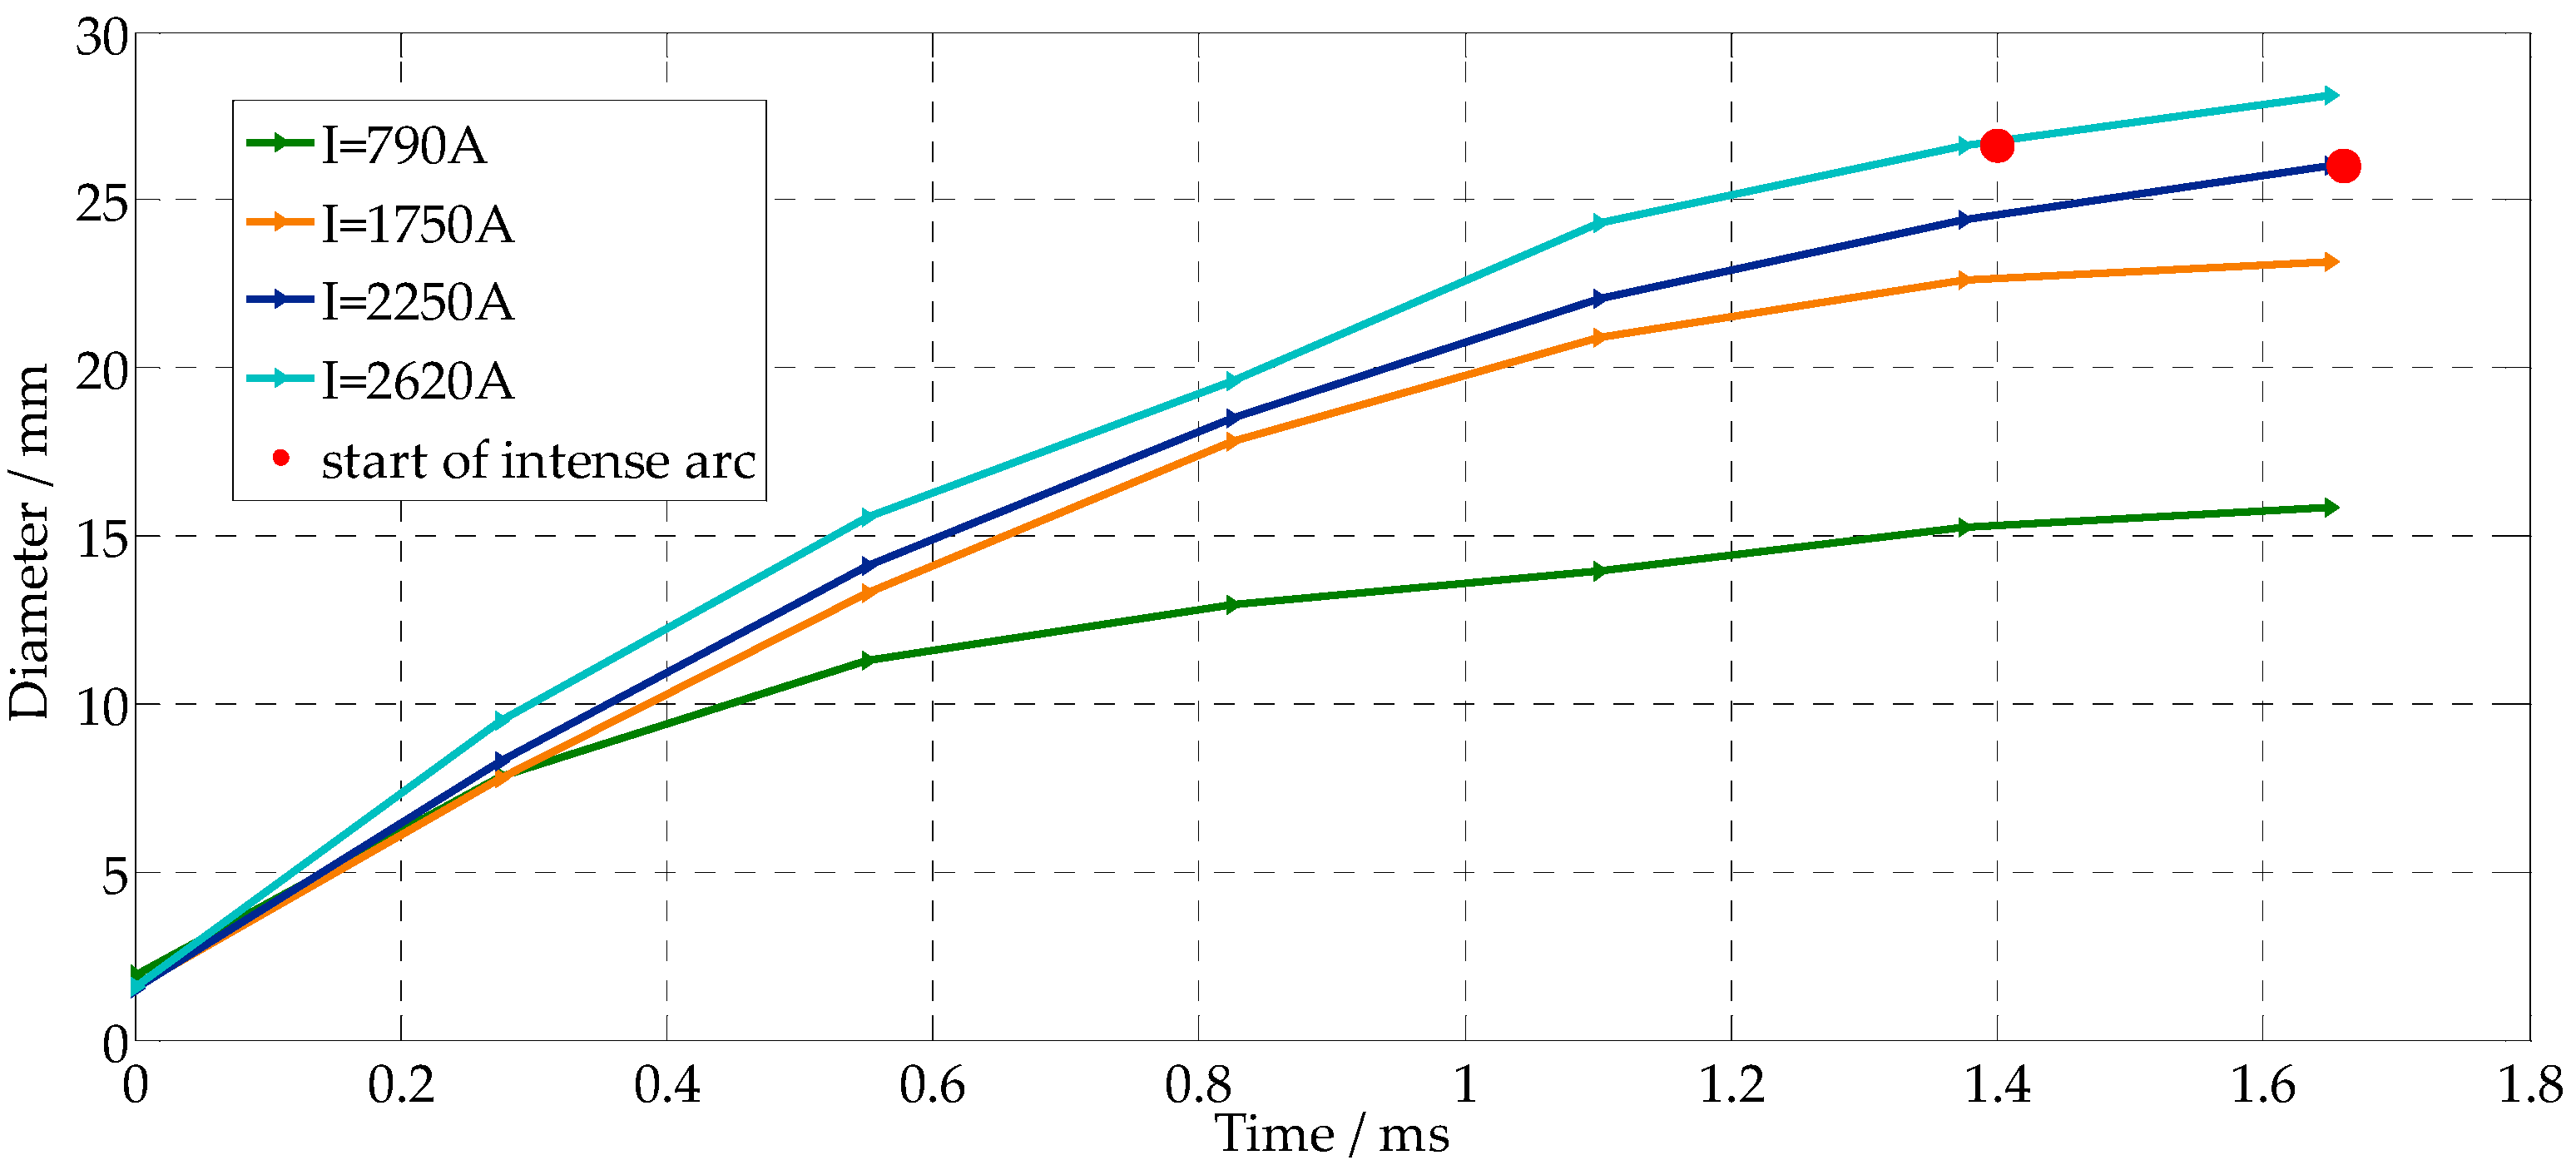
Figure 10.
Experimental waveforms of interruption failure at first current zero and success at second current zero with a 2 ms arcing time for type A.
Figure 10.
Experimental waveforms of interruption failure at first current zero and success at second current zero with a 2 ms arcing time for type A.

Figure 11.
Arc appearance of re-ignition under a 2 ms arcing time with the type A contact at a 2380 A main circuit current.
Figure 11.
Arc appearance of re-ignition under a 2 ms arcing time with the type A contact at a 2380 A main circuit current.
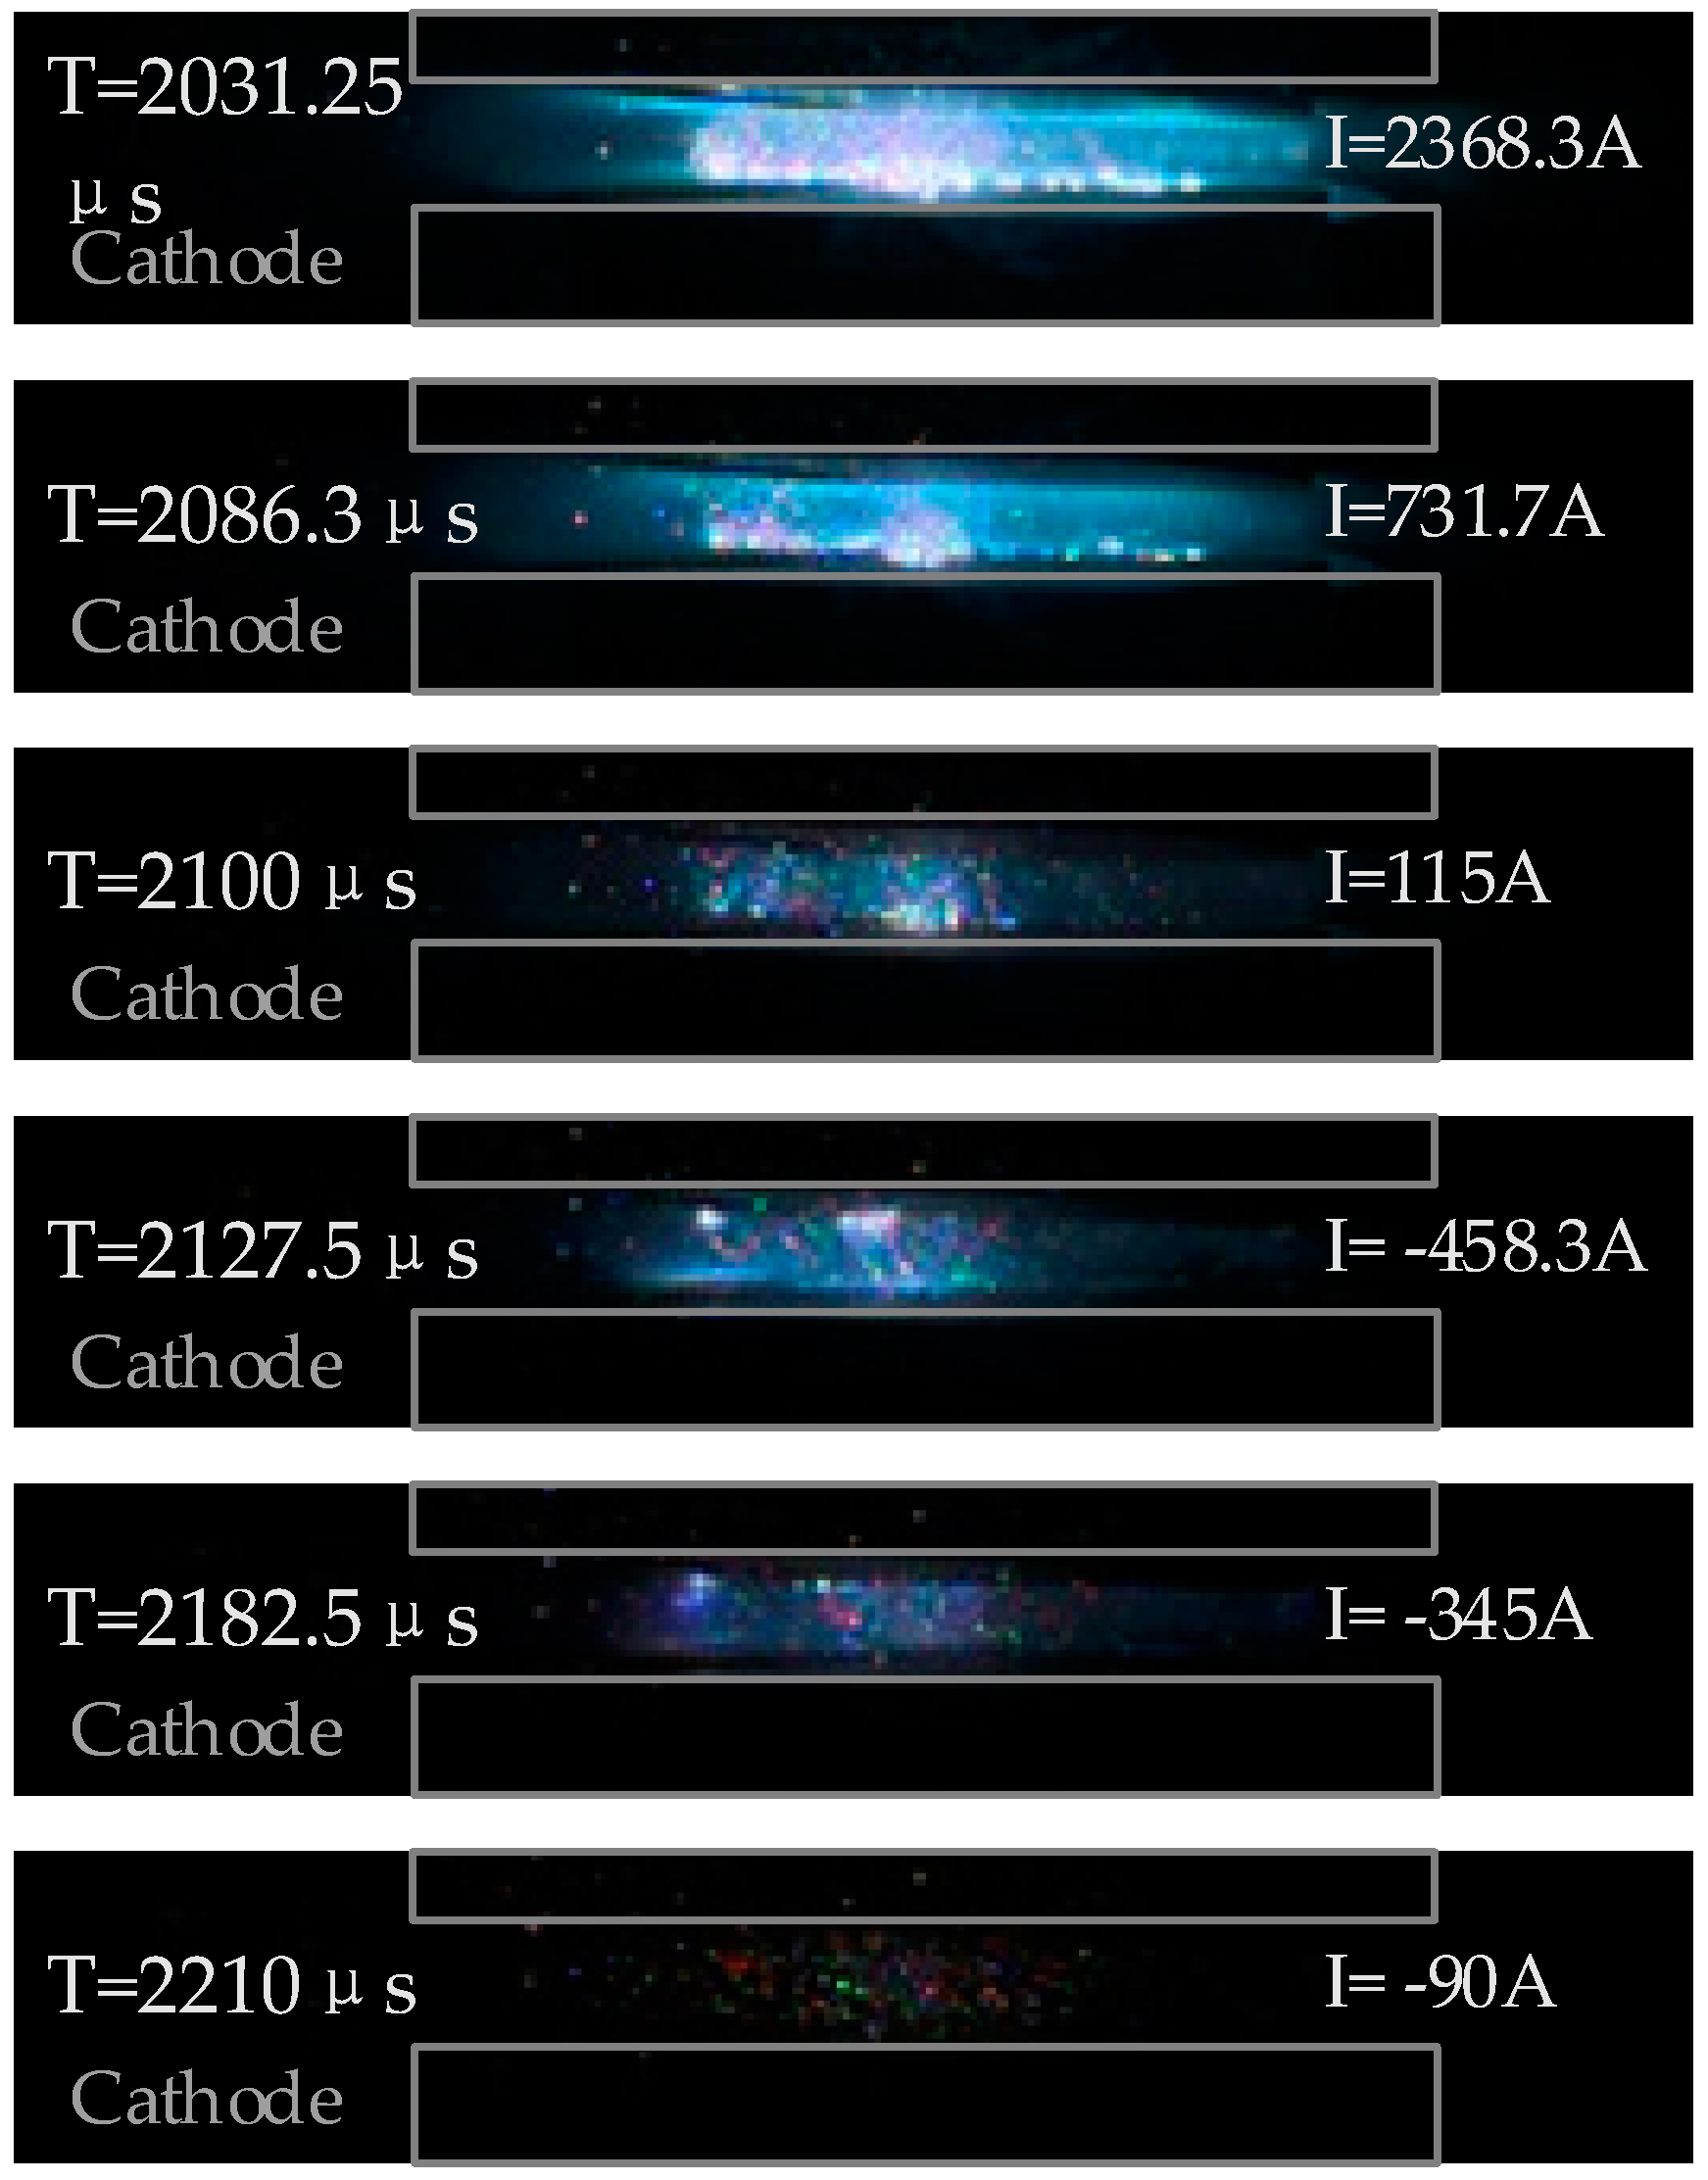
Figure 12.
Breaking experiment results of the type A vacuum interrupter with 1 to 6 ms arcing times.
Figure 12.
Breaking experiment results of the type A vacuum interrupter with 1 to 6 ms arcing times.

Table 1.
Comparisons of the di/dt obtained through Equation (7), simulation, and experiments.
| Main Circuit Current (A) | Precharged Voltage (V) | k | di/dt (A/μs) | |||
|---|---|---|---|---|---|---|
| Formulation (7) | Simulation | Experiments | ||||
| 1 | 1120 | 100 | 1.40 | 27.72 | 24.92 | 28.5 |
| 2 | 1120 | 120 | 1.68 | 33.26 | 31.56 | — |
| 3 | 1120 | 140 | 1.96 | 38.80 | 37.98 | — |
| 4 | 1740 | 120 | 1.08 | 27.71 | 25.68 | — |
| 5 | 1740 | 140 | 1.26 | 38.8 | 33.42 | 37.9 |
| 6 | 1740 | 160 | 1.45 | 44.35 | 40.36 | — |
| 7 | 1740 | 180 | 1.63 | 49.89 | 47.00 | — |
| 8 | 2240 | 180 | 1.26 | 49.89 | 42.84 | 47.6 |
Table 2.
Parameters of the experimental system for DC forced interruption.
| C0 | L0 | R0 | C1 | L1 | C2 | R2 | C3 | R3 |
|---|---|---|---|---|---|---|---|---|
| 2 F | 14 μH | 0.09–0.5 Ω | 1080 μF | 2.2 μH | 50 mF | 2.5 Ω | 0.1 μF | 0.1 Ω |
Table 3.
Structural parameters of the electrodes in the VI.
| Contact Type | Diameter | Gap Length | Contact Material | Arcing Material | Air Pressure | Contact Resistance | Number of Spirals |
|---|---|---|---|---|---|---|---|
| A | 40 mm | 2.5 mm | CuCr25 | CuW80 | 5 × 10⁻⁵ Pa | 12 μΩ | 4 |
| B | 40 mm | 2.5 mm | CuCr25 | CuCr50 | 5 × 10⁻⁵ Pa | 10 μΩ | 4 |
© 2017 by the authors. Licensee MDPI, Basel, Switzerland. This article is an open access article distributed under the terms and conditions of the Creative Commons Attribution (CC BY) license (http://creativecommons.org/licenses/by/4.0/).
Share and Cite
MDPI and ACS Style
Huo, W.; Wu, J.; Jia, B.; Chen, M.; Ma, S.; Zhu, L. Direct-Current Forced Interruption and Breaking Performance of Spiral-Type Contacts in Aero Applications. Appl. Sci. 2017, 7, 512. https://doi.org/10.3390/app7060512
AMA Style
Huo W, Wu J, Jia B, Chen M, Ma S, Zhu L. Direct-Current Forced Interruption and Breaking Performance of Spiral-Type Contacts in Aero Applications. Applied Sciences. 2017; 7(6):512. https://doi.org/10.3390/app7060512
Chicago/Turabian StyleHuo, Wenlei, Jianwen Wu, Bowen Jia, Mingxuan Chen, Suliang Ma, and Liying Zhu. 2017. "Direct-Current Forced Interruption and Breaking Performance of Spiral-Type Contacts in Aero Applications" Applied Sciences 7, no. 6: 512. https://doi.org/10.3390/app7060512
Note that from the first issue of 2016, this journal uses article numbers instead of page numbers. See further details here.