
Investigation on Eddy Current Sensor in Tension Measurement at a Resonant Frequency


1
Faculty of Infrastructure Engineering, State Key Laboratory of Coastal and Offshore Engineering, Dalian University of Technology, Dalian 116023, China
2
Department of Architectural Engineering, School of Civil Engineering, Shenyang Jianzhu University, Shenyang 110168, China
*
Authors to whom correspondence should be addressed.
Appl. Sci. 2017, 7(6), 538; https://doi.org/10.3390/app7060538
Submission received: 29 March 2017
/
Revised: 3 May 2017
/
Accepted: 9 May 2017
/
Published: 24 May 2017
Abstract
:For resolving deficiencies of conventional tension measurement methods, this paper proposes a novel eddy current sensor with a single-coil structure based on the inverse magnetostrictive effect. An inductor–resistor–capacitor (LRC) model of eddy current sensor, which considers more parameters than the traditional inductor–resistor (LR) model, was established. The eddy current sensor was operated by a swept frequency signal that ranged from 0.1 MHz to 1.6 MHz, encompassing the sensor resonant frequency. At the resonant frequency, the data of impedance magnitude and phase were extracted and linear relations between the impedance parameters and the external tension were ascertained. The experimental results show that the resonant frequency and impedance magnitude of eddy current sensor will decrease linearly with the increase of the external tension, which is consistent with the theoretical model. In addition, to improve sensor performance, the sleeve structure was designed to reduce the loss of magnetic field. Both finite element simulations and experimental results demonstrate that the sleeve structure provides a higher permeability path to the magnetic field lines than the non-sleeve structure and effectively improves sensor sensitivity and correlation coefficient.

1. Introduction
Steel cables are widely used in many civil engineering structures, such as long-span bridges, large gymnasiums, industrial factory buildings and rail stations. An increasing number of new large infrastructures are equipped with recently emerged structural health monitoring (SHM) systems to minimize unpredicted structural failure, which may cause economic and environmental damage as well as human casualties [1,2]. SHM is a fairly new concept to the field of civil engineering and SHM is intended to monitor structural behavior in real-time, evaluate structural performance under various loads and identify structural damage or deterioration [3]. Measuring cable tension in SHM is imperative during the service lives of steel structures. Damage in steel cables may induce collapse of whole bridges and result in the failure of entire infrastructures. The stress state of structures is used to determine when to replace them and how to prolong their useful lifetime or to retrofit them [4].
Traditional stress monitoring methods are the utilization of acceleration sensor, load cell and strain gauge. Based on the taut string theory, the vibration frequency measured by acceleration sensor is used to estimate cable tension [5]. However, due to the effects of sag and flexural rigidity of steel cables, the taut string theory will bring measurement inaccuracy. In addition, uncertainties of some parameters, such as mass, length and cross-sectional area, will produce significant errors in relation to the actual tension value [6]. During construction, the cable tension is closely monitored using load cells or pressure meters at one end of the cable. This method of measurement is not applicable after construction [7]. The strain gauge method is unable to directly measure the actual tension because steel cables contain tens or hundreds of wires coated with the high-density polyethylene.
Elasto-magnetic (EM) technology is a novel nondestructive method to monitor tension force of steel cables. EM sensor can overcome some of the problems associated with traditional methods and has many advantages of tension detection in long life-span, strong overloading capacity and measurement results not affected by the protective layer of steel cables with the high-density polyethylene. In addition, EM sensor can be moved to any location along steel cables, installed in structures during construction or after construction and is functional under many environmental conditions. Many researchers have explored the utilities of EM sensor in nondestructive examination. Based on Faraday’s law, Wang et al. developed EM sensor composed of primary and secondary coils, which cooperatively work to formalize magneto-elastic characterization of ferromagnetic materials. EM tension sensors function by utilizing the direct dependence of the magnetic properties of steel structures on the state of stress. A primary coil provides variable flux to the measured steel specimen, and a secondary coil obtains induced signal [8,9,10,11]. Changes in the magnetic flux of the primary coil allow magnetic properties of steel cables to be measured by the secondary coil. To easily fabricate EM sensor for tension measurement, Richen et al. and Roy et al. proposed the removable C-shaped and E-shaped sensors [12,13,14,15]. Steel cables act as a part of the magnetic circuit and the tension variation is measured by the sensing coil. Tang et al. designed a steel strand tension sensor with differential single bypass excitation structure for temperature compensation [16]. However, one difficulty associated with EM sensor is the need to wrap sensor around the cable, which can be laborious and costly. Hence, the utilization of a two-coil structure greatly restricts the application of EM sensor. Duan et al. devised a smart elasto-magneto-electric (EME) sensor for the stress monitoring of steel structures, in which the secondary coil is replaced by magneto-electric (ME) laminated composites as the sensing unit [17,18,19]. Although EME sensor improves measurement sensitivity, it is rarely applied in practice due to its high cost.
This paper presents a novel eddy current sensor with a single-coil structure to overcome the above problems. The eddy current sensor excited by a swept frequency signal involves a multi-turn wire coil. When the swept frequency signal is applied to the sensor coil, it produces a varying magnetic field around it and the eddy current is formed on the surface of the test specimen. The eddy current produces a secondary magnetic field in a direction opposite to that of the initial magnetic field. The amount of magnetic field is reduced, which is directly correlated to the change in the impedance parameters of the sensor. The theoretical model of the eddy current sensor with a single-coil structure has been established to obtain the explicit relation between the impedance parameters and the external tension. The paper is organized as follows: Section 2 proposes the equivalent model of eddy current sensor and establishes the theoretical derivation of sensor behavior. In Section 3, the magnetic field distributions of sensor with and without the sleeve structure are simulated using finite element software. Then, the experimental system is built; impedance analysis is carried out and the influence of sleeve structure is discussed in Section 4. Finally, some conclusions and future work are detailed in Section 5.
2. Theoretical Model
2.1. LR Model
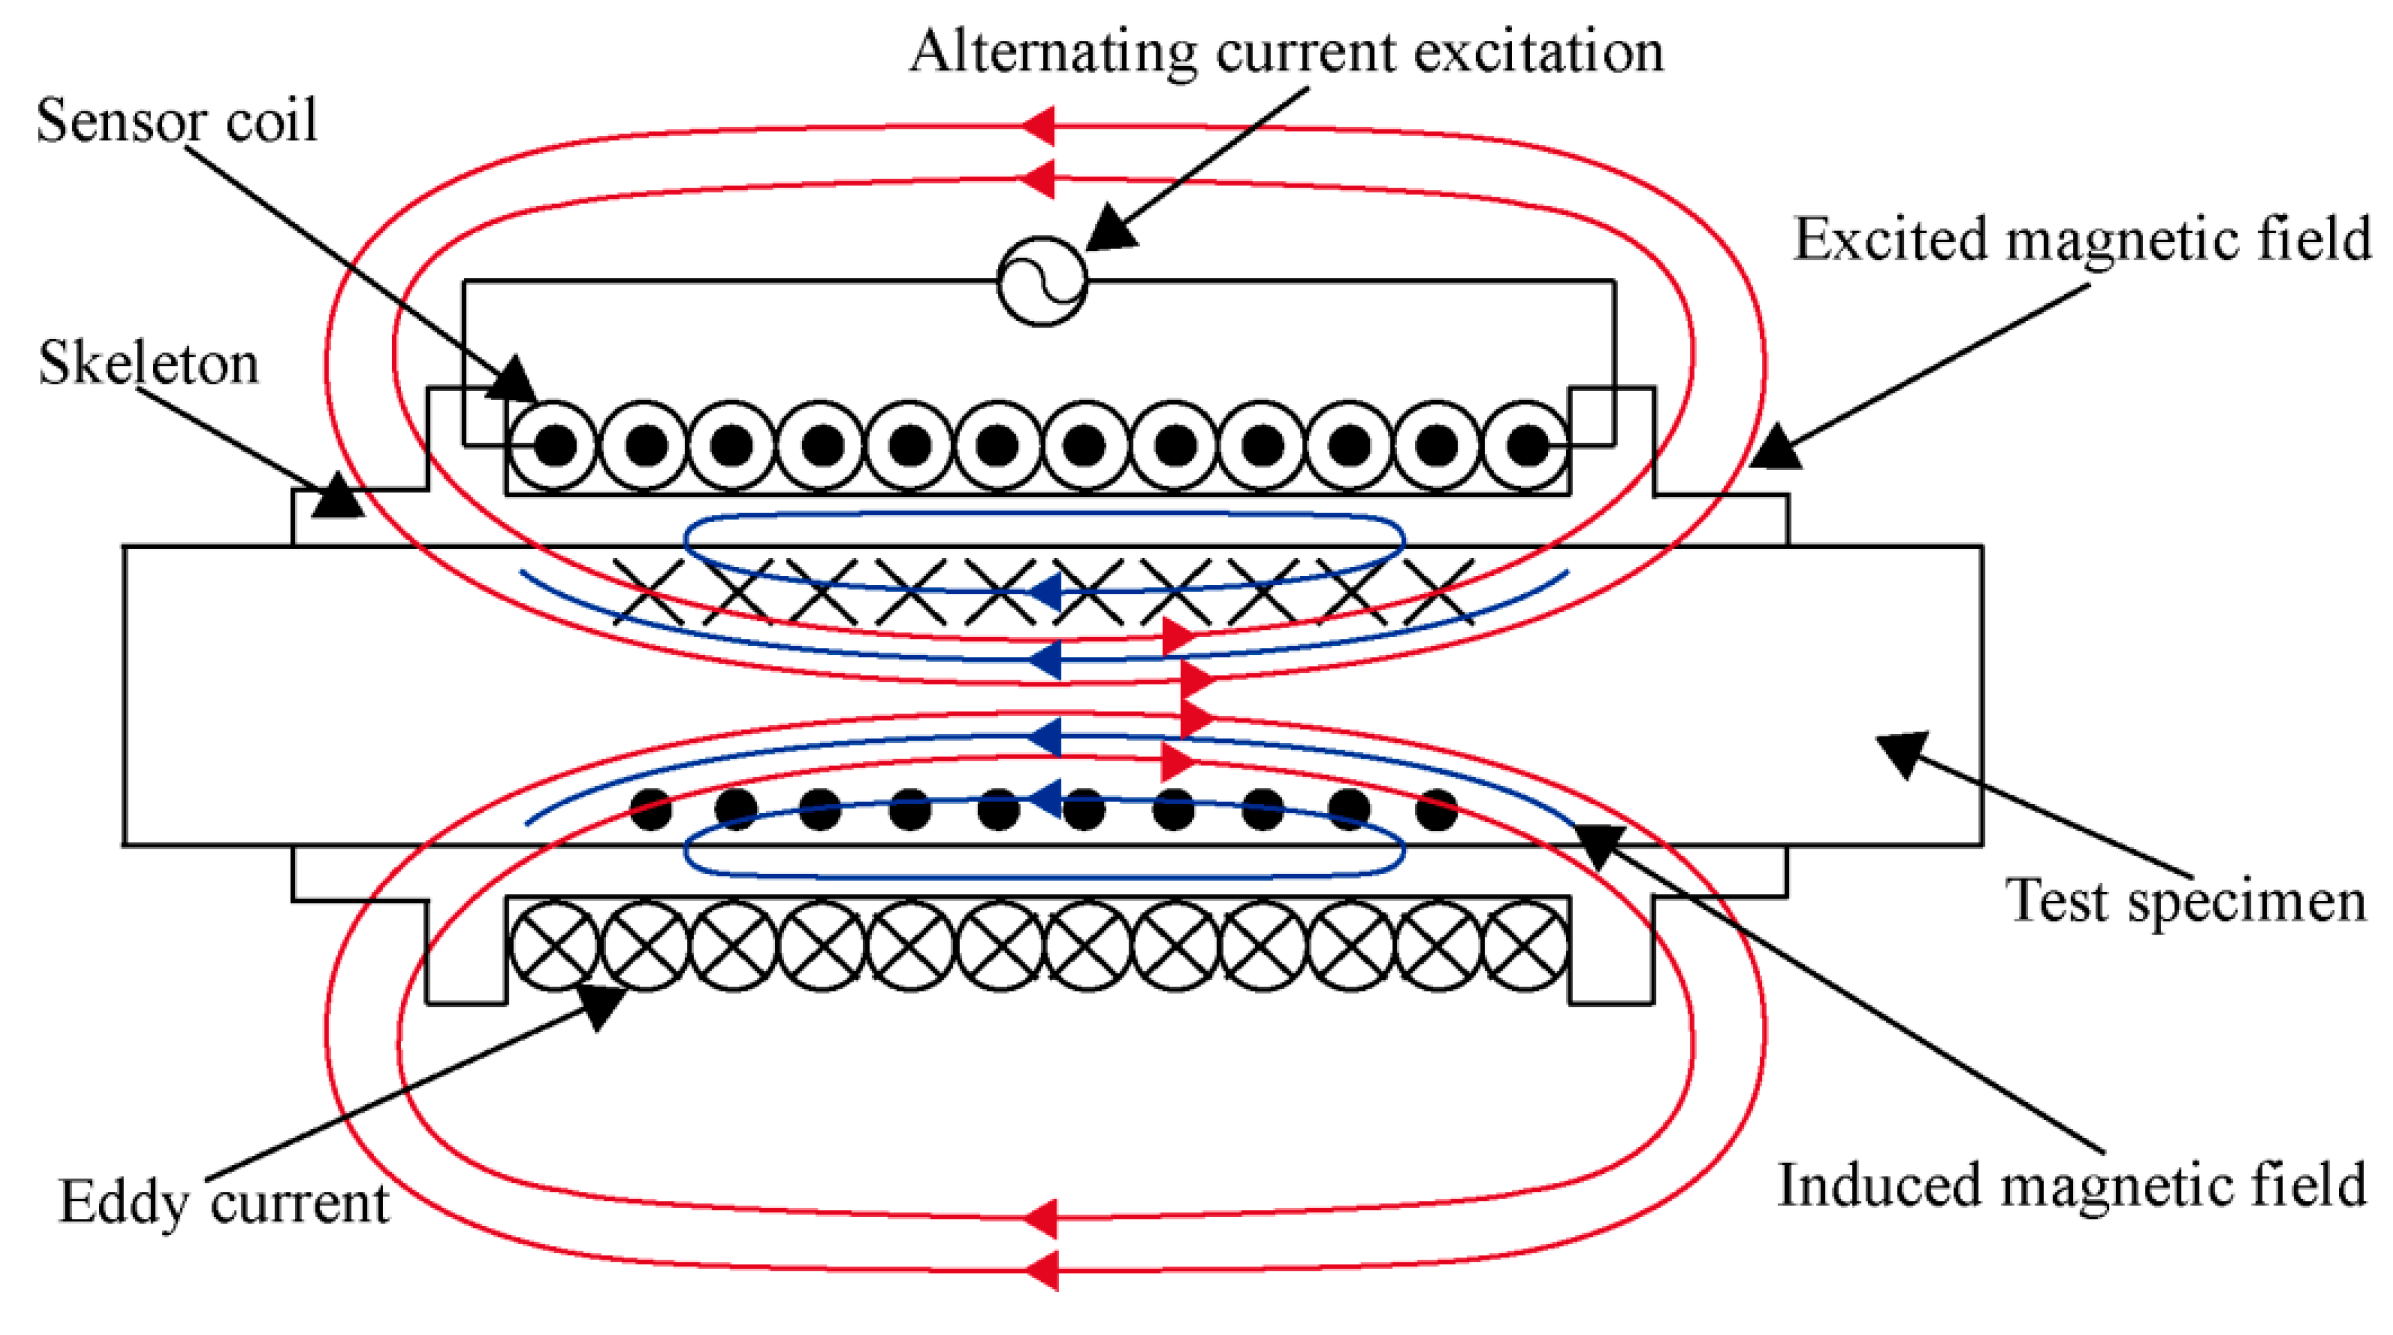
An alternating current (AC) applied to the solenoid coil produces an alternating magnetic field, which is referred to as the initial magnetic field and induces an eddy current around test specimen. The eddy current simultaneously creates a secondary magnetic field, which circulates in the opposing direction to the initial magnetic field, thus resisting the variation of the initial magnetic field and changing the coil impedance [20,21,22]. The schematic diagram of the working principle is shown in Figure 1. Under low excitation frequencies, the capacitances from the coaxial cable and adjacent coil turns are negligible. Thus, the sensor system can be modeled by the inductor–resistor (LR) circuit shown in Figure 2.
According to Kirchhoff’s Voltage Law, the equations can be expressed as follows:
where and are the resistance and inductance of solenoid coil without the test specimen, and are the excitation current and induced eddy current, and are the resistance and inductance of induced eddy current, is the coupling coefficient influenced by the skeleton thickness, is the angular frequency of alternating current excitation signal, and is the voltage of excitation signal, respectively.
The LR model can be remodeled as the equivalent model displayed in Figure 2b, which has a single-equivalent circuit as functions of , , and . The total impedance of the system is given by:
where is the effective impedance, and are the equivalent resistance and inductance of solenoid coil, respectively.
2.2. LRC Model
The eddy current sensor is connected to the current source via a coaxial cable. For the case of high frequencies, the capacitances from the coaxial cable and adjacent coil turns need to be considered. The eddy current sensor system can be approximately modeled as the combination of electronic components consisting of an inductor, a resistor and a parallel capacitor, known as an inductor–resistor–capacitor (LRC) circuit model. It is shown in Figure 3.
When a swept frequency signal passes through the sensor coil, there occurs a frequency known as electrical resonance, at which the impedance magnitude becomes a maximum and impedance phase is zero. The general expression for the resonant frequency of LRC model can be given by:
The impedance of coil is dependent on factors such as the gap between the sensor coil and the test specimen , the resistivity of the test specimen , the magnetic permeability of the test specimen and the frequency of the excitation signal [23,24,25,26].
The tension in the test specimen changes the induced eddy current resulting in the measurable impedance variation in the sensor coil, which is acquired by an impedance analyzer.
3. Finite Element Analysis
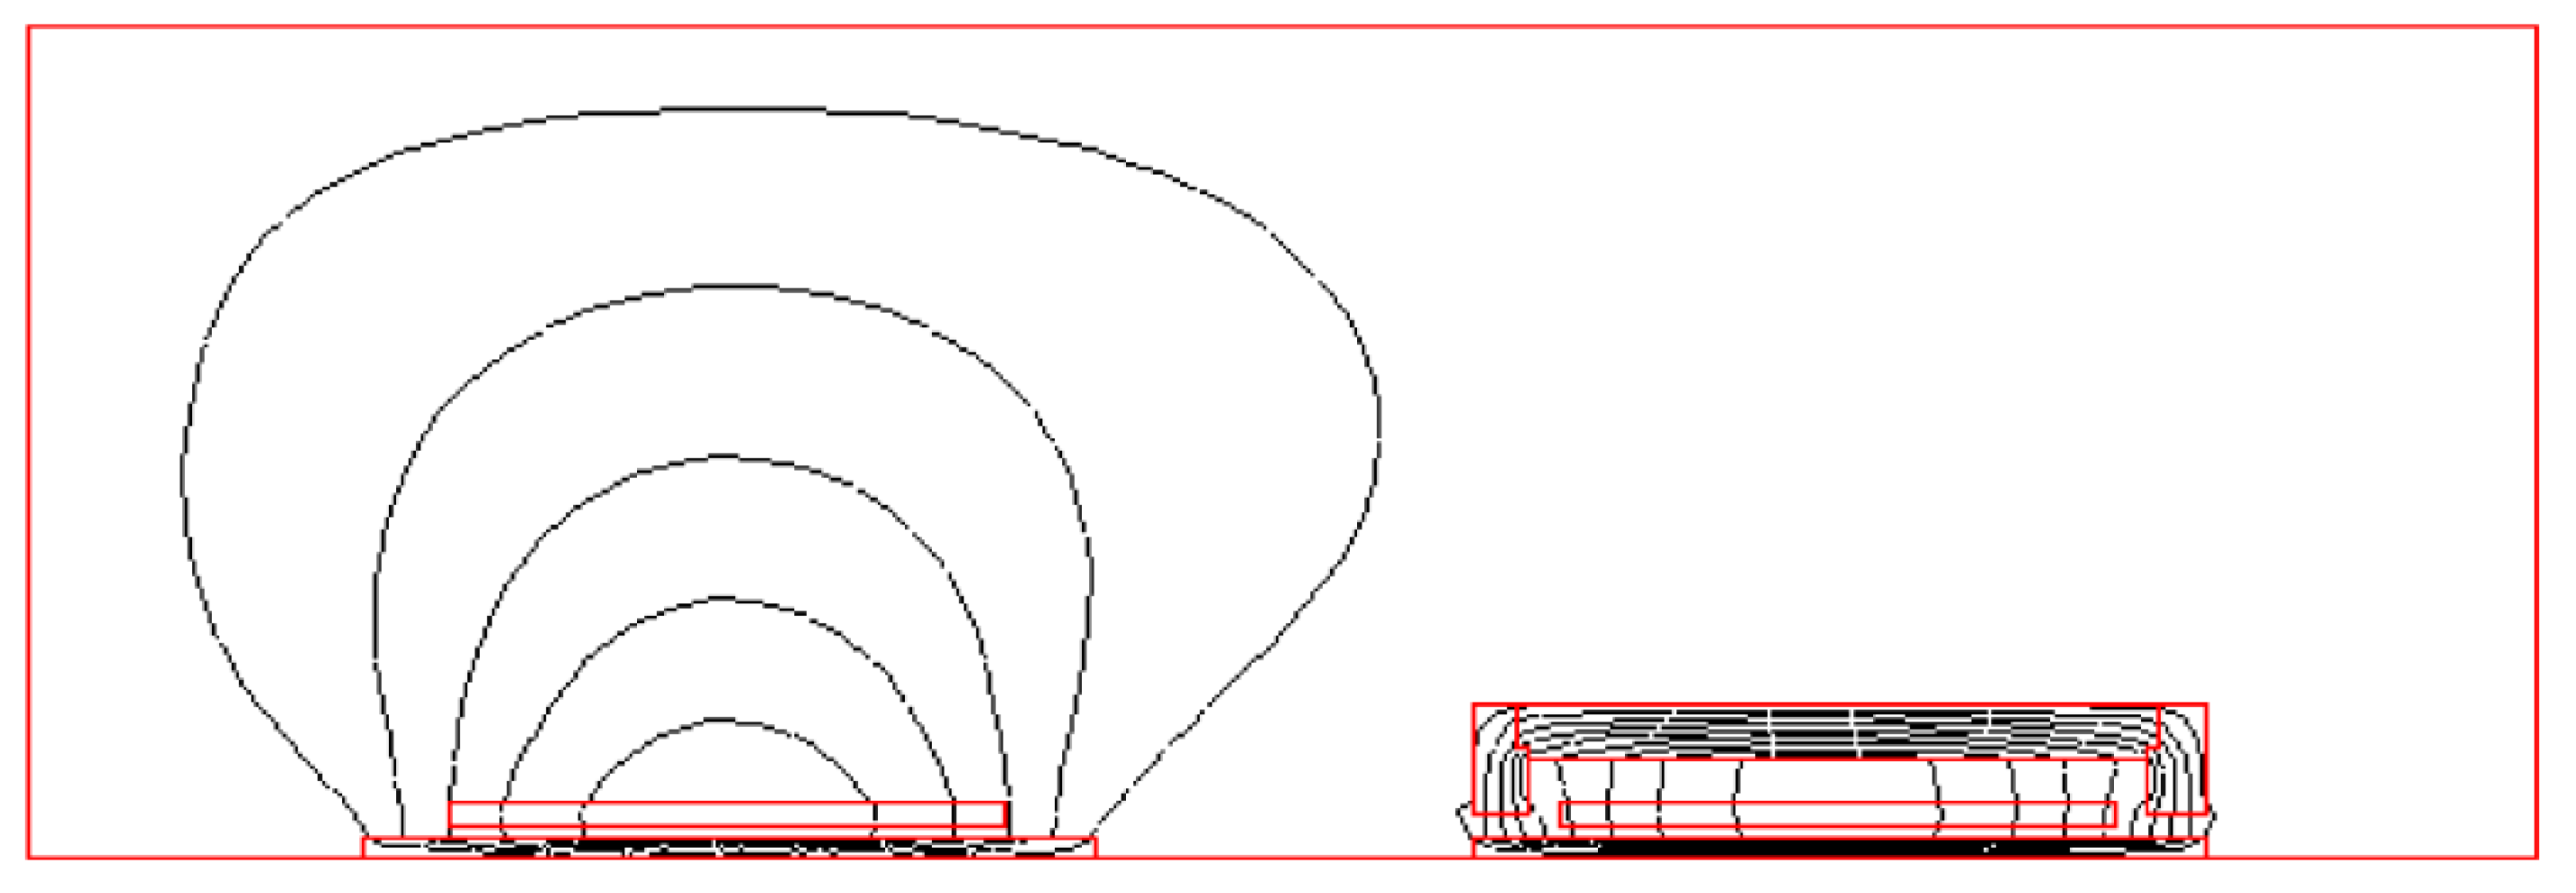
A 2D axis-symmetric model of eddy current sensor was established using finite element analysis software ANSYS 15.0 (ANSYS, Pittsburgh, PA, USA). The physical field was selected as the magnetic field under AC excitation and then solved using the harmonic solver [27]. The important parts were modeled with relatively fine mesh while the parts which do not need attention were modeled with relatively coarse mesh [28]. To investigate the influence of sleeve structure on the magnetic field strength distribution of the test specimen, two models with and without the sleeve structure were established. The simulation parameters were set as follows: the turns of coil were 204 and the diameter of enameled wire was 1 mm. The inner diameter and length of coil were 16 mm and 100 mm, respectively. The industrial pure iron DT4 was fabricated into the sleeve structure. The magnetic field lines and magnetic field strength distributions were acquired through the solution as shown in Figure 4 and Figure 5, respectively.
It can be observed in Figure 4 that the utilization of a sleeve structure with the high permeability material concentrates the magnetic field and makes the magnetic field lines pass through the test specimen. In Figure 5, it is possible to observe that the magnetic field strength of the test specimen with the sleeve structure was higher than that without the sleeve structure. The simulation results demonstrate that the sleeve structure reduces reluctance in the magnetic circuit and provides a higher permeability path to magnetic field lines than the non-sleeve structure, thus reducing the loss of magnetic field.
4. Experimental Results and Discussion
4.1. Experimental Setup
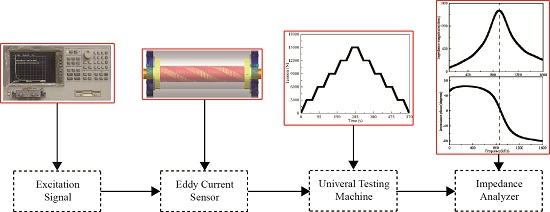
The HP4294A precision impedance analyzer was used to produce a driving current of 20 mA and the sensor coil was operated through a swept frequency signal from 0.1 to 1.6 MHz. The absolute coil was constructed with 68 turns of a 1 mm diameter wire wound over three layers on the skeleton with a radius slightly larger than that of the test specimen. A digital phosphor oscilloscope with multiple channels was used to acquire signals across the sensor at a sampling frequency of 1 GHz/s. The experimental system consisted of an eddy current sensor, a precision impedance analyzer (Dongguan Feiyu Electronics Co., Ltd., Dongguan, China), a digital phosphor oscilloscope (Tektronix, Beaverton, OR, USA), a digit multimeter (Shenzhen Wangbo Instrumentation Co., Ltd., Shenzhen, China), an acquisition circuit and a universal testing machine (Shanghai Xinrenda Instrumentation Co., Ltd., Shanghai, China) as shown in Figure 6.
Equations (6)–(8) suggest that the impedance of the coil tends towards a maximum at the resonant frequency [29]. Thus the system can be separated into two regions where the inductive and capacitive components are dominant, respectively. The impedance phase will change at the resonant frequency from a positive to a negative regime. Before this frequency, the impedance of the coil is dominated by the inductive component. Thus, the system appears to be almost inductive. However, after this frequency the capacitive component in the system is dominantly contributing to the impedance of the coil and the sensor will cease to measure variation in the inductive component. Figure 7 shows the impedance magnitude and phase curves when the test specimen is under no external tension.
According to the theoretical derivation, the resonant frequency can be influenced by the capacitance. The LRC parameters are listed in Table 1. When the external capacitance is 2.2 nF, 10 nF and 100 nF, the experimental results can be shown in Figure 8.
It is clear from Figure 8 that the resonant frequency declined with the increase of the external capacitance, which was consistent with the theoretical derivation. The sensor performance was carried out on a universal testing machine at room temperature. The experimental specimen was tested with the diameter of 12 mm and the length of 500 mm, the material of which was 45# carbon steel. During testing, the tension and displacement of the test specimen were recorded by an acquisition system, which was directly connected to the universal testing machine [30]. The loading tension was increased by increments of 3 kN up to 15 kN, which was in the elastic range of the test specimen.
4.2. Sensor Performance at the Resonant Frequency
4.2.1. Impedance Magnitude
As mentioned previously, the solenoid coil produces a circumferential current field into the test specimen, which creates an induced magnetic field that opposes the primary magnetic field. According to the variations of the impedance magnitude and phase, the eddy current sensor can detect the change of magnetic field caused by the external tension. Experimental analysis of the eddy current sensor was achieved by comparing the impedance magnitude signatures, as shown in Figure 9.
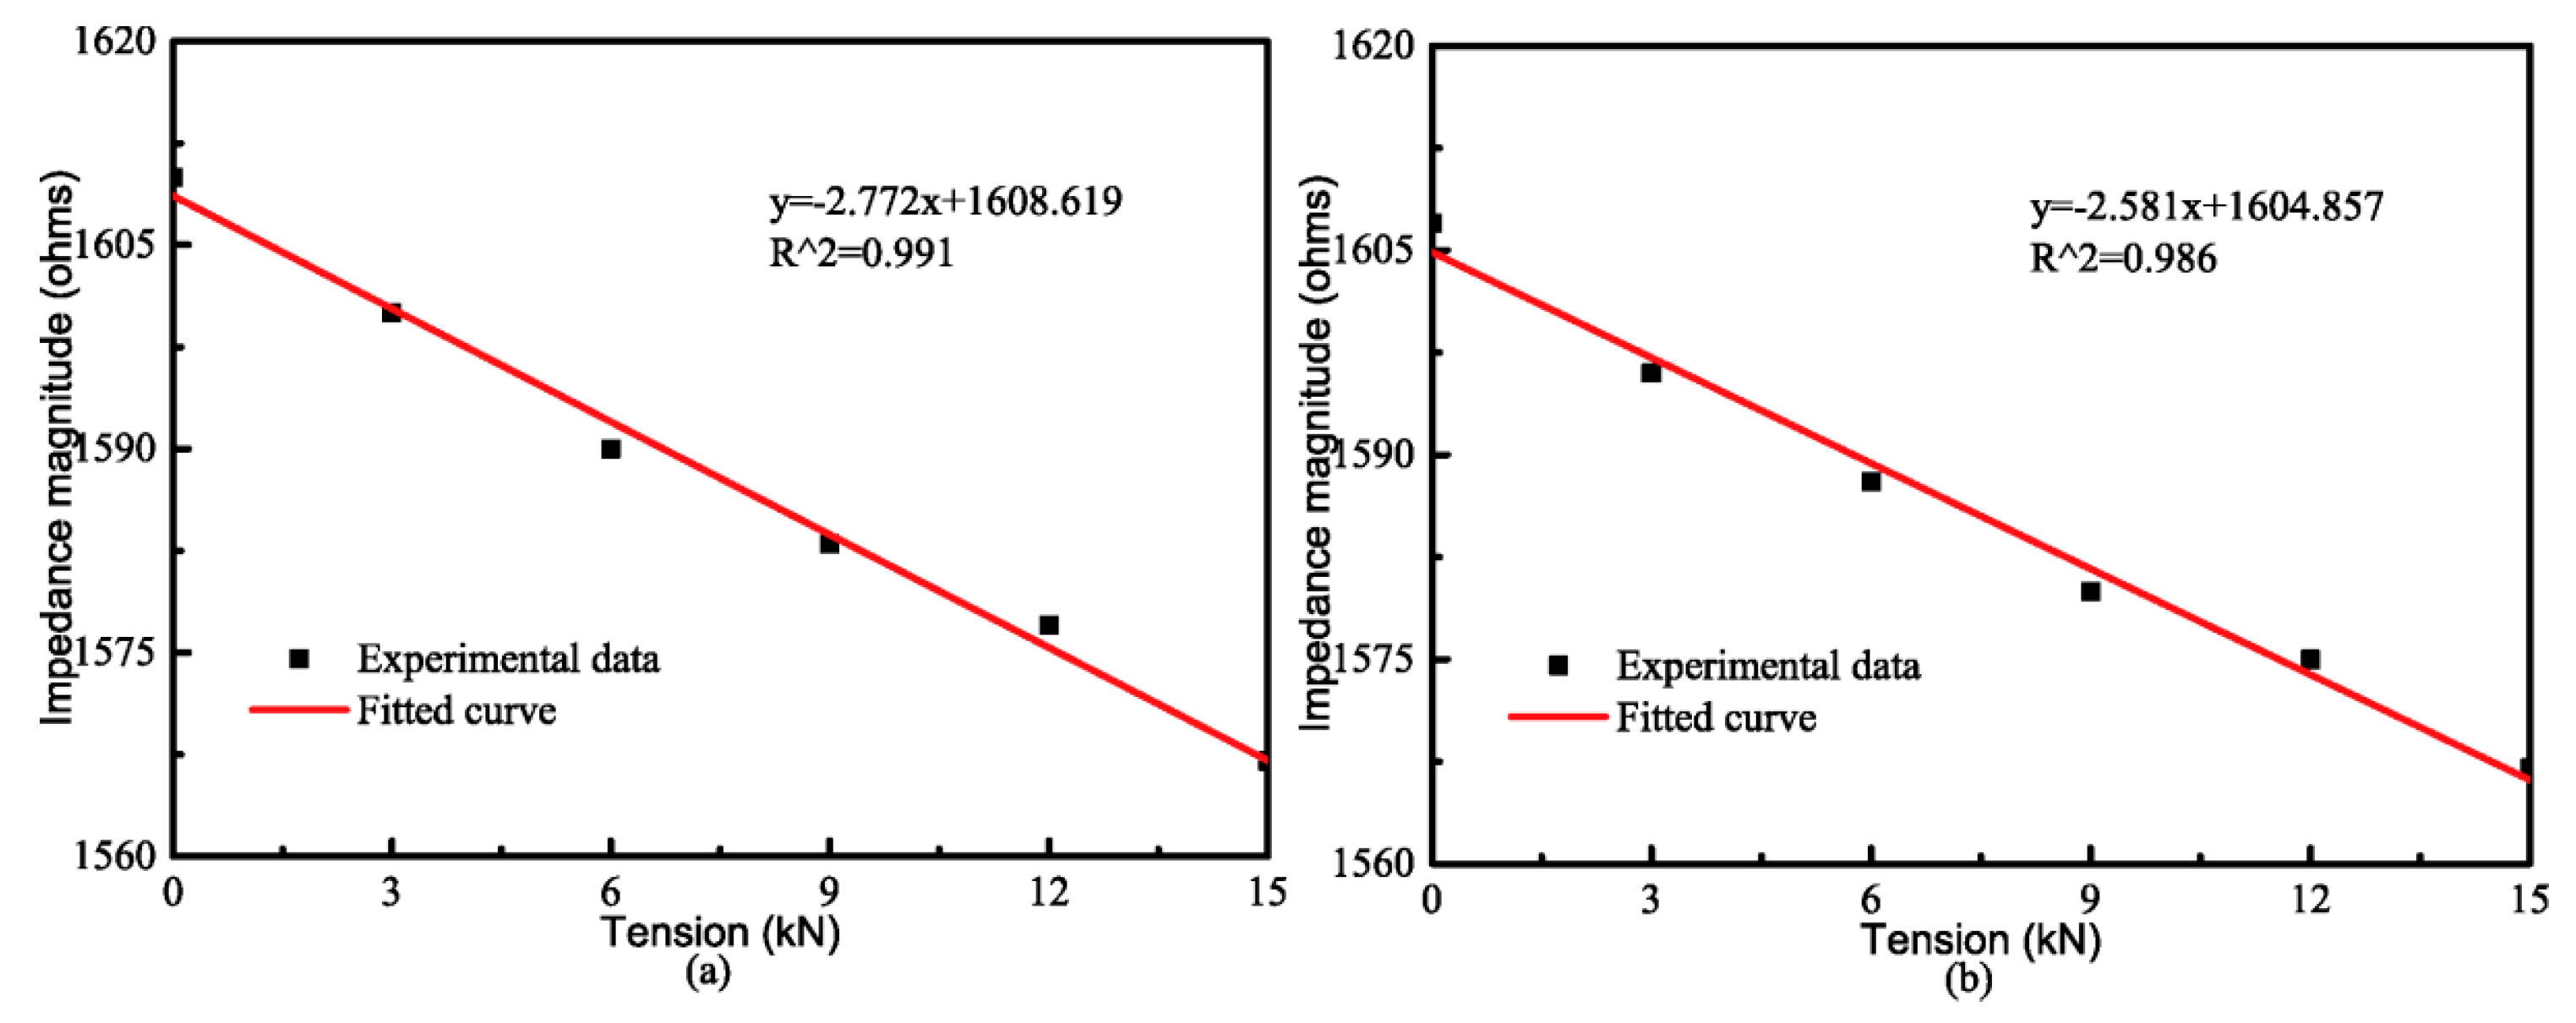
From Figure 9, it can be observed that the peak value of the impedance at the resonant frequency decreased with the increase of the external tension. Thus, the external tension of ferromagnetic materials specimen can be detected by measuring the peak value of sensor impedance. The experimental data were fitted and linear relationship between the peak value of impedance and the external tension was obtained. To reduce experimental error, the peak value of impedance was extracted in Figure 10 by averaging the six experimental results. The statistics of the repetitive experiments are listed in Table 2.
Table 2 demonstrates that the coefficient of variation is around 0.14% in the loading and unloading processes, which means that the variation among the different repetitive experiments is small and sensor performance is repeatable. Hence, these variations among repetitive experiments will not affect the usability of such a system where the mean values are used to draw conclusions. As seen from Figure 10, the peak value of impedance varies with the increasing tension in a good linearity with the linear regression equation y = −2.771x + 1608.619 and a correlation coefficient of R2 = 0.991 in Figure 9a, and the unloading process can be described with the linear regression equation y = −2.581x + 1604.857 and a correlation coefficient of R2 = 0.986 in Figure 9b. Therefore, the results indicate the existence of a good linear relationship between the peak value of sensor impedance and the external tension.
4.2.2. Impedance Phase
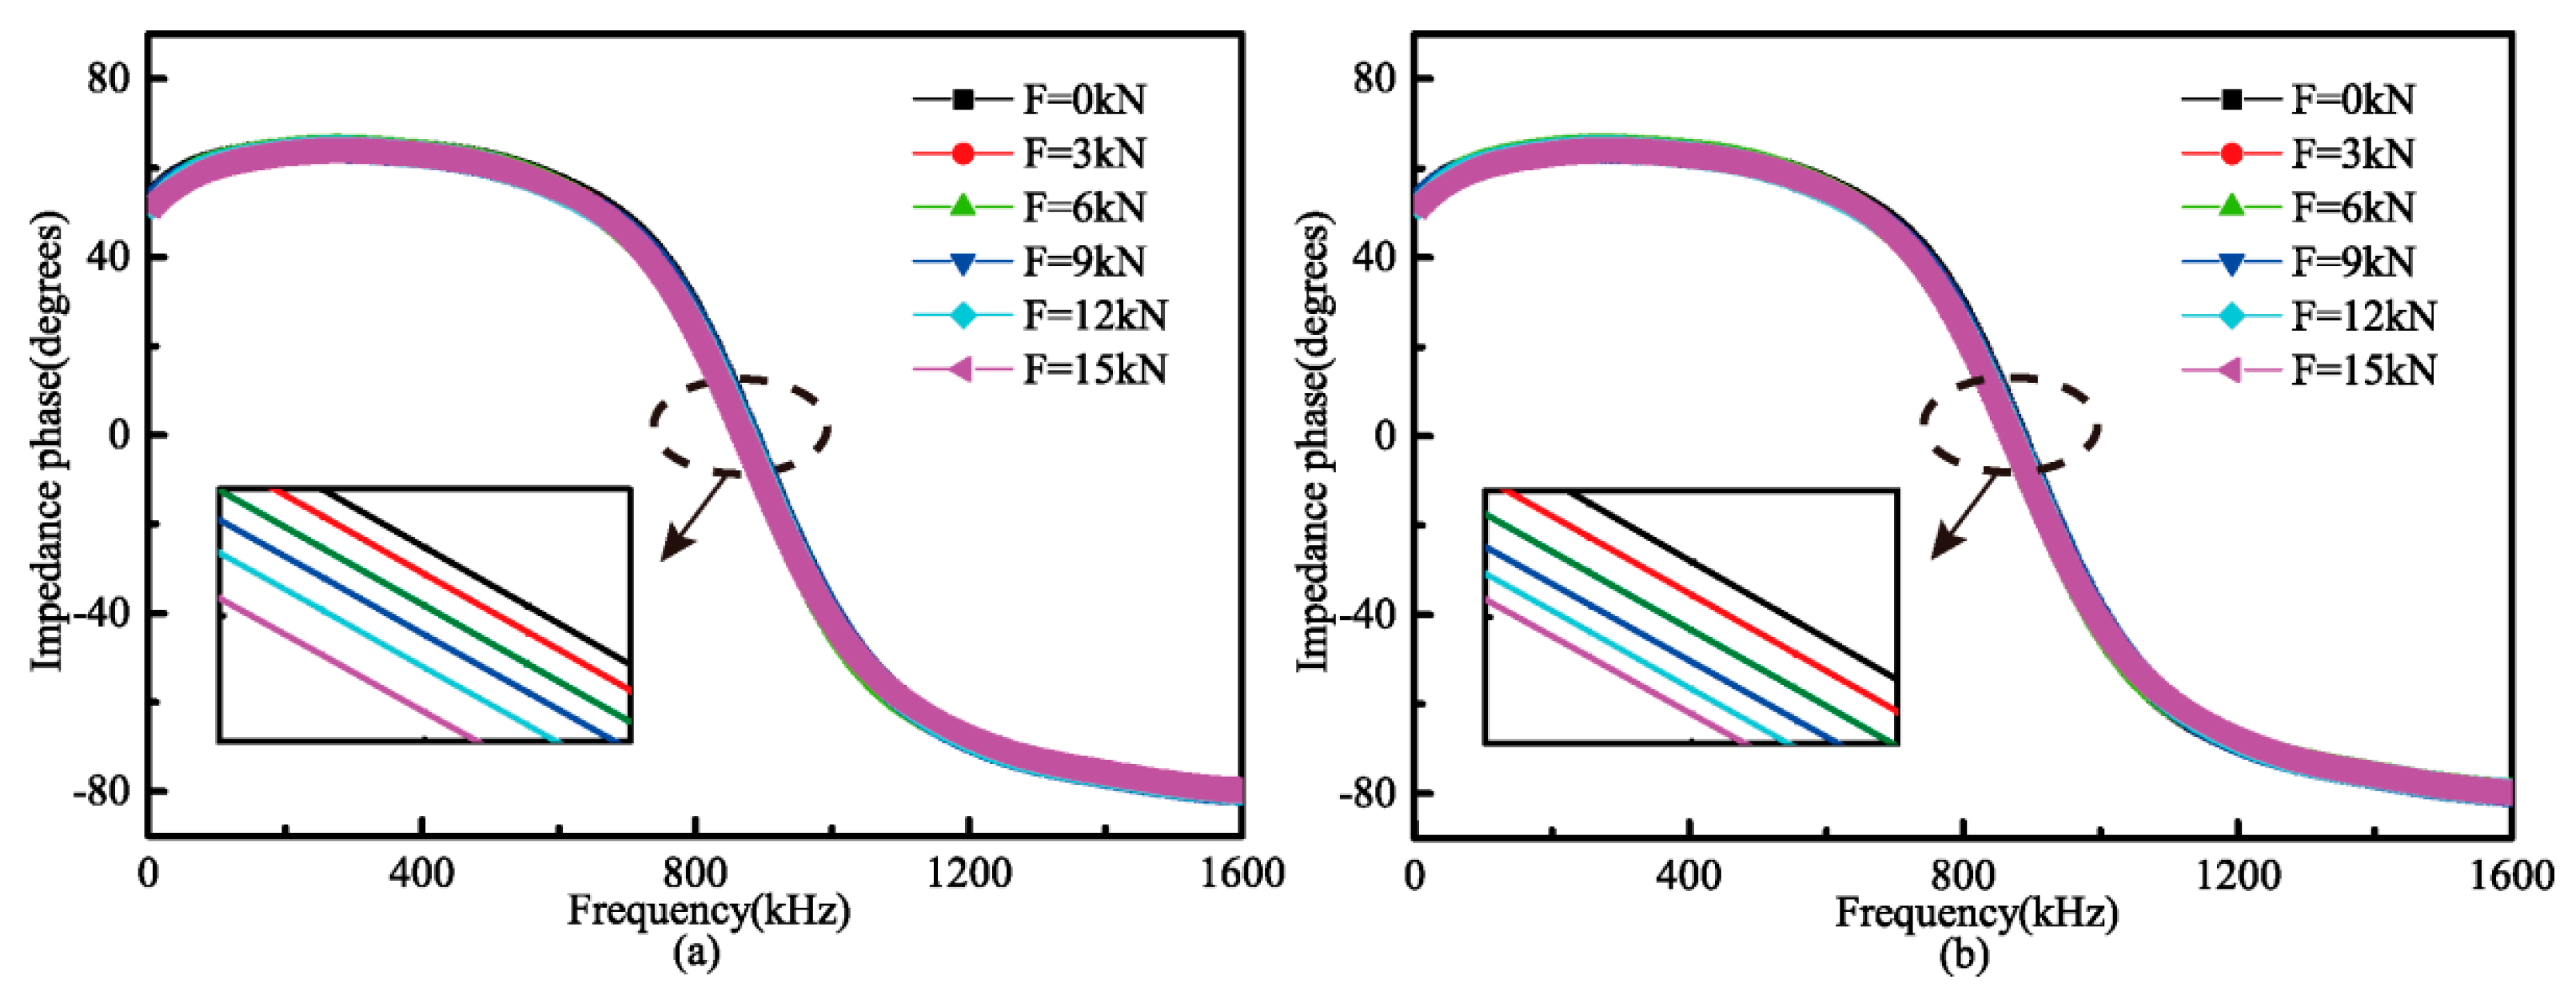
The impedance phase results are shown in Figure 11. As can see from Figure 11, each point of the curve is the average of six repetitive experiments and contains two coordinates; one is the phase value and another is the frequency. As the external tension increased, the relative permeability of the test specimen changed and the sensor resonant frequency decreased.
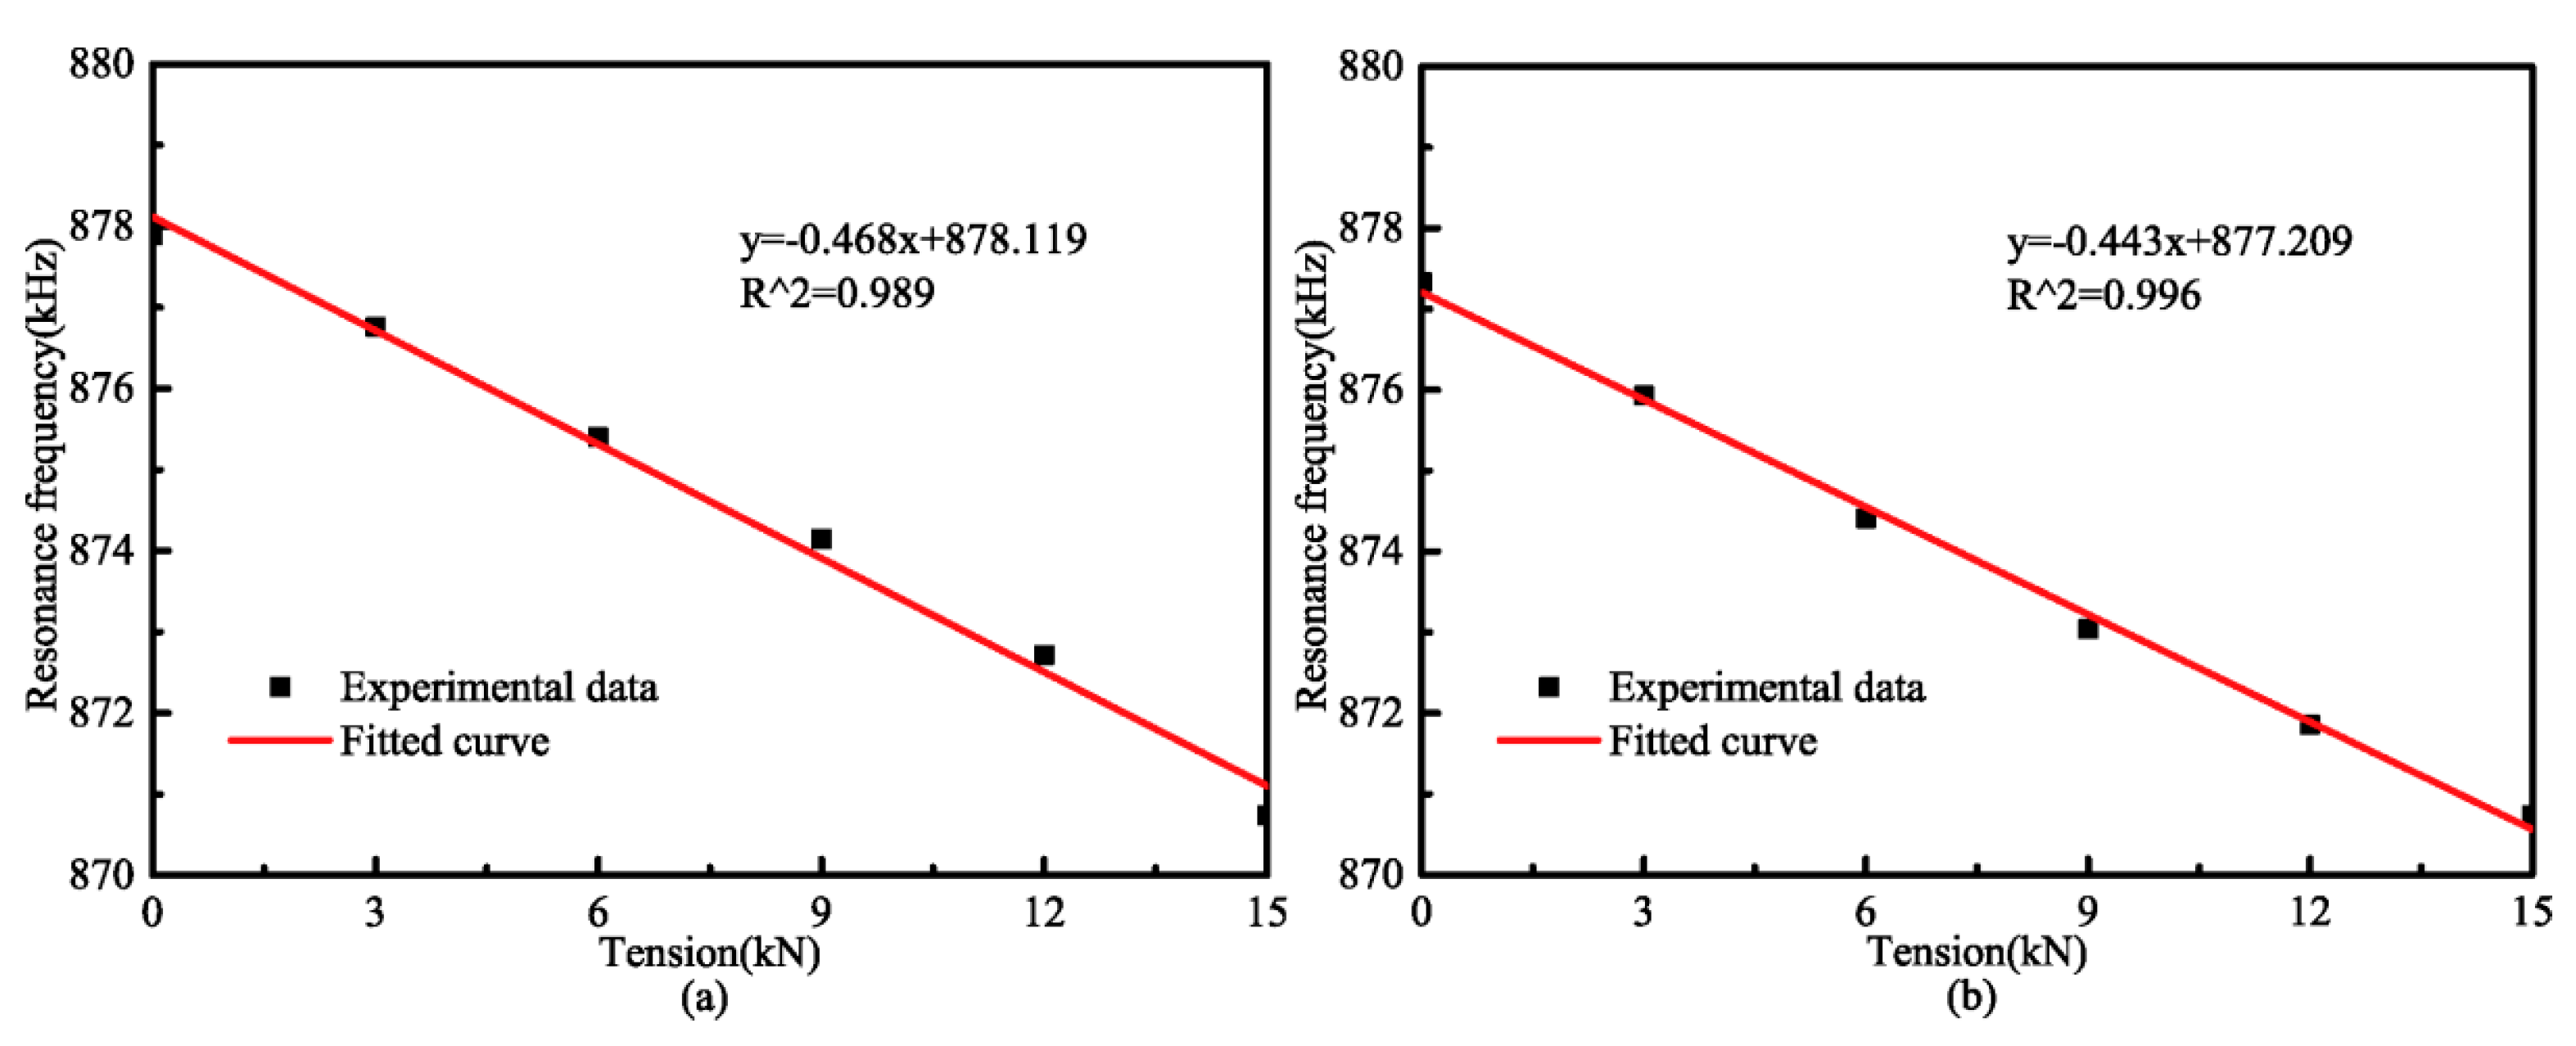
The resonant frequency at each tension is plotted and a good linear relationship is observed, as shown in Figure 12. The sensitivities are found to be around 0.468 kHz/kN in the loading process and 0.443 kHz/kN in the unloading process, which are slightly different due to the residual stress in the test specimen.
4.3. The Influence of Sleeve Structure on Sensor Performance
4.3.1. Correlation Coefficient
According to the repetitive experimental results, in order to obtain the relationship between the external tension and the impedance parameters, the data of impedance magnitude and phase at the resonant frequency were separately extracted and fitted into linear curves. To study the influence of sleeve structure on sensor performance, the correlation and relativity sensitivity coefficients of fitted curves with and without the sleeve structure were analyzed. Comparison results of correlation coefficient are shown in Table 3.
It should be noted that all correlation coefficients exceed 0.974, indicating the existence of a linear relationship between the external tension and the impedance parameters of the sensor. Moreover, the sensor correlation coefficient with the sleeve structure was obviously larger than that with the non-sleeve structure. The reason for the larger coefficient is that the sleeve structure provides a higher permeability path to magnetic field lines than the non-sleeve structure, thus optimizing magnetic field distribution and improving sensor performances.
4.3.2. Relative Sensitivity Coefficient
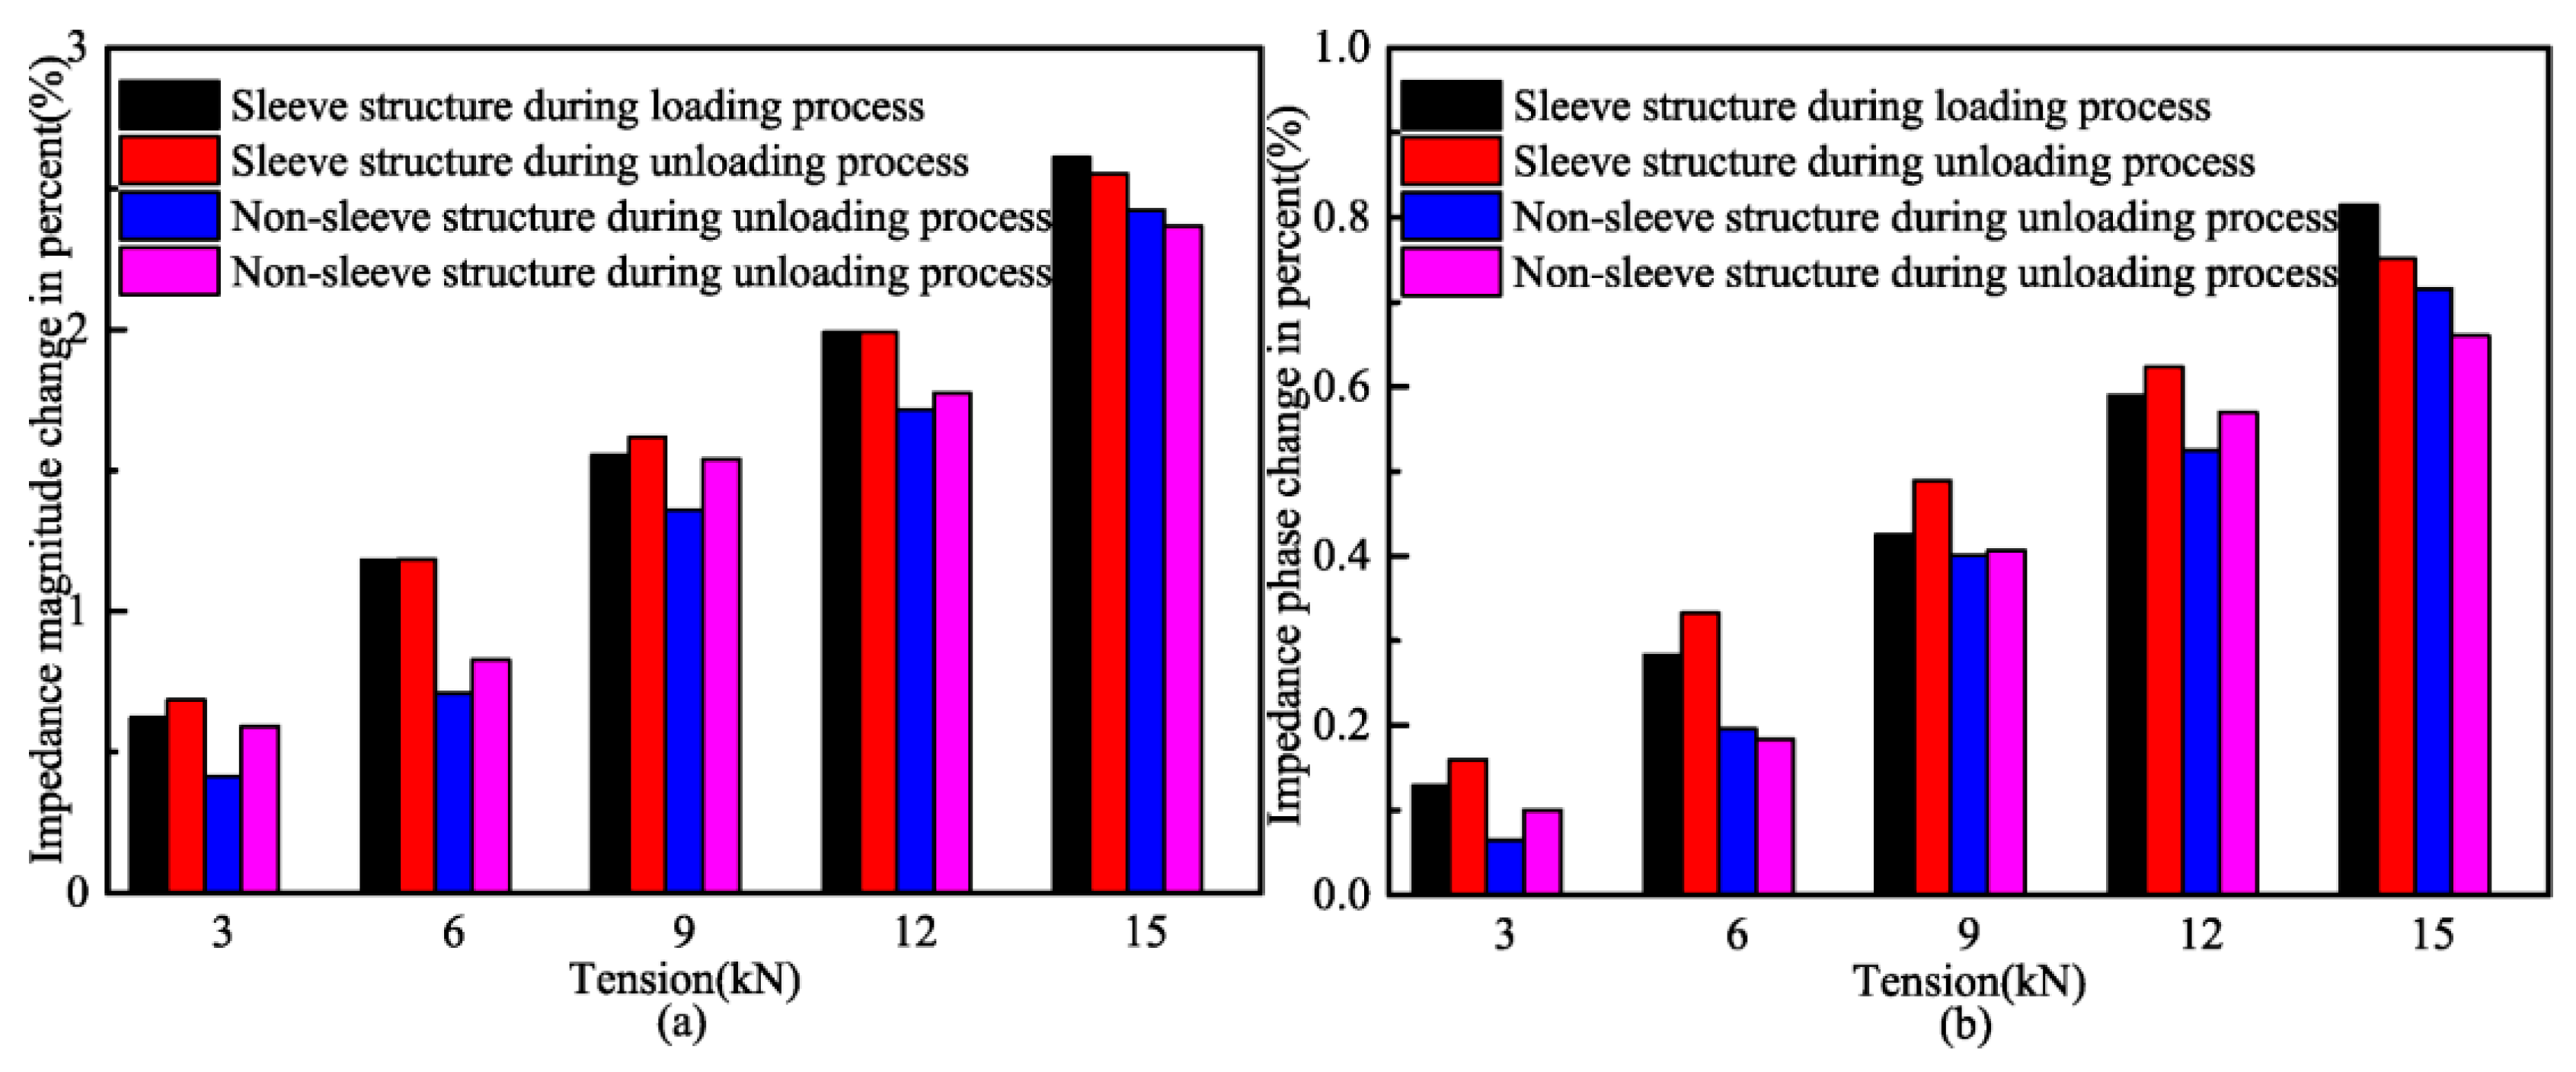
The change in the impedance parameters of the sensor is proportional to the external tension and its normalized value can be calculated by:
where S is the relative sensitivity, Z(T0) and Z(T) are measured at 0 kN and at each 3 kN.
Figure 13a,b shows the relative sensitivity change of the impedance magnitude and phase at the resonant frequency, respectively.
Figure 13 illustrates that the sensor’s relative sensitivity presents an increasing trend with the external tension changes from 0 kN to 15 kN with the loading step of 3 kN. Therefore, the data of impedance magnitude or impedance phase at the resonant frequency can be used to infer external tension. In addition, it is very clear that the presence of the sleeve structure improves the sensor’s relative sensitivity. This improvement may be attributed to the fact that the sleeve structure allows more magnetic field lines to flow through the test specimen as a result of its higher permeability than the non-sleeve structure. This conclusion is supported by the finite element analysis in Section 3.
5. Conclusions and Future Work
In this paper, the LRC theoretical model of an eddy current sensor for tension measurement was presented based on the inverse magnetostrictive effect and impedance parameters approaching the resonant frequency were analyzed. The finite element model of the sensor was simulated and experimental tension measurement system was designed. The main conclusions from this work are as follows:
- (1)
- A novel sensor was designed, analyzed, and experimentally verified on 45# carbon steel with diameter of 12 mm. Compared with the traditional tension measurement methods, the eddy current sensor with a single-coil structure has the advantages of smaller size, lower cost, easier installation and less mutual interference.
- (2)
- This paper proposes a novel approach to tension measurement in ferromagnetic materials based on the impedance change of an eddy current sensor at the resonant frequency. In six repetitive experiments, the results show that the impedance parameters are efficient for estimating the tension. In all cases, the correlation coefficient reaches to 0.974 and the sensitivity coefficients are 2.581 ohms/kN in impedance magnitude analysis and 0.443 kHz/kN in impedance phase analysis, respectively.
- (3)
- In order to improve sensor performance, a sleeve structure was presented. Both finite element simulations and experimental results match well with the theoretical analysis, which indicates that the utilization of a sleeve structure remarkably improves sensor sensitivity and correlation coefficient.
In the next step, the flexible eddy current sensor will be further researched for repeatable use and easy installation and disassembly. In addition, due to the limitation of experimental conditions, the maximum loading tension is 15 kN, which is within 42% of the elastic tension. In the future, the measuring range of the sensor will be experimentally ascertained and the sensor performance will be studied over the elastic range of the test specimen. Furthermore, this paper is the preliminary study and has not considered the effects of temperature and sensor robustness. Hence, it is necessary to solve the problem of temperature compensation and improve sensor robustness in order to apply the sensor to practical applications, such as measuring tension in post-tensioning (PT) tendon, steel bar and steel cables.
Acknowledgments
This work was supported by the Science Fund for Creative Research Groups of the National Natural Science Foundation of China (No. 51421064), the National Key Basic Research and Development Program (973 Program) (No. 2015CB060000), the Natural Science Foundation of China (No. 51327003) and the Fundamental Research Funds for the Central Universities (DUT15YQ107). These grants are greatly appreciated.
Author Contributions
Liang Ren and Hongnan Li proposed the LRC theoretical model; Chengzhu Xiu contributed to the experiments and data analysis.
Conflicts of Interest
The authors declare no conflict of interest.
References
- Li, H.N.; Li, D.S.; Ren, L.; Yi, T.H.; Jia, Z.G.; Li, K.P. Structural health monitoring of innovative civil engineering structures in Mainland China. Struct. Monit. Maint. 2016, 3, 1–32. [Google Scholar] [CrossRef]
- Aflatooni, M.; Chan, T.H.T.; Thambiratnam, D.P. Condition monitoring and rating of bridge components in a rail or road network by using SHM systems within SRP. Struct. Monit. Maint. 2015, 2, 199–211. [Google Scholar] [CrossRef]
- Chae, M.J.; Yoo, H.S.; Kim, J.Y.; Cho, M.Y. Development of a wireless sensor network system for suspension bridge health monitoring. Autom. Constr. 2012, 21, 237–252. [Google Scholar] [CrossRef]
- Duan, Y.F.; Zhang, R.; Zhao, Y.; Or, S.W.; Fan, K.Q.; Tang, Z.F. Smart elasto-magneto-electric (EME) sensors for stress monitoring of steel structures in railway infrastructures. J. Zhejiang Univ. Sci. A 2011, 12, 895–901. [Google Scholar] [CrossRef]
- Bao, Y.Q.; Shi, Z.; Beck, J.L.; Li, H.; Hou, T.Y. Identification of time-varying cable tension forces based on adaptive sparse time-frequency analysis of cable vibrations. Struct. Control Health Monit. 2016, 24, e1889. [Google Scholar] [CrossRef]
- Sumitro, S.; Jarosevic, A.; Wang, M.L. Elasto-magnetic sensor utilization on steel cable stress measurement. In Proceedings of the First FIB Congress, Concrete Structures in the 21th Century, Osaka, Japan, 13–19 October 2002. [Google Scholar]
- Wang, D.H.; Liu, J.; Zhou, D.; Huang, S.L. Using PVDF piezoelectric film sensors for in situ measurement of stayed-cable tension of cable-stayed bridges. Smart Mater. Struct. 1999, 8, 554–559. [Google Scholar] [CrossRef]
- Singh, V.; Lloyd, G.M.; Wang, M.L. Effects of temperature and corrosion thickness and composition on magnetic measurements of structural steel wires. NDT E Int. 2004, 37, 525–538. [Google Scholar] [CrossRef]
- Yim, J.; Wang, M.L.; Shin, S.W.; Yun, C.B.; Jung, H.J.; Kim, J.T.; Eem, S.H. Field application of elasto-magnetic stress sensors for monitoring of cable tension force in cable-stayed bridges. Smart Struct. Syst. 2013, 12, 465–482. [Google Scholar] [CrossRef]
- Singh, V.; Wang, M.L.; Lloyd, G.M. Measuring and modeling of corrosion in structural steels using magnetoelastic sensors. Smart Mater. Struct. 2005, 14, S24–S31. [Google Scholar] [CrossRef]
- Sumitro, S.; Wang, M.L. Sustainable structural health monitoring system. Struct. Control Health Monit. 2005, 12, 445–467. [Google Scholar] [CrossRef]
- Ricken, W.; Schoenekess, H.C.; Becker, W.J. Improved multi-sensor for force measurement of pre-stressed steel cables by means of the eddy current technique. Sens. Actuators A Phys. 2006, 129, 80–85. [Google Scholar] [CrossRef]
- Schoenekess, H.C.; Ricken, W.; Becker, W.J. Method to Determine Tensile Stress Alterations. IEEE Sens. J. 2007, 7, 1200–1205. [Google Scholar] [CrossRef]
- Ricken, W.; Liu, J.; Beck, W.J. GMR and eddy current sensor in use of stress measurement. Sens. Actuators A Phys. 2001, 91, 42–45. [Google Scholar] [CrossRef]
- Roy, D.; Kumar Kaushik, B.; Chakraborty, R. A novel E-shaped coil for eddy current testing. Sens. Rev. 2013, 33, 363–370. [Google Scholar] [CrossRef]
- Tang, D.D.; Huang, S.L.; Chen, W.M.; Jiang, J.S. Study of a steel strand tension sensor with difference single bypass excitation structure based on the magneto-elastic effect. Smart Mater. Struct. 2008, 17, 025019. [Google Scholar] [CrossRef]
- Duan, Y.F.; Zhang, R.; Zhao, Y.; Or, S.W.; Fan, K.Q.; Tang, Z.F. Steel stress monitoring sensor based on elasto-magnetic effect and using magneto-electric laminated composite. J. Appl. Phys. 2012, 111, 07E516. [Google Scholar] [CrossRef]
- Zhang, R.; Duan, Y.F.; Or, S.W.; Zhao, Y. Smart elasto-magneto-electric (EME) sensors for stress monitoring of steel cables: Design theory and experimental validation. Sensors 2014, 14, 13644–13660. [Google Scholar] [CrossRef] [PubMed]
- Duan, Y.F.; Zhang, R.; Dong, C.Z.; Luo, Y.Z.; Or, S.W.; Zhao, Y.; Fan, K.Q. Development of Elasto-Magneto-Electric (EME) Sensor for In-Service Cable Force Monitoring. Int. J. Struct. Stab. Dyn. 2016, 16, 1640016. [Google Scholar] [CrossRef]
- Yu, Y.T.; Yang, T.; Du, P.A. A new eddy current displacement measuring instrument independent of sample electromagnetic properties. NDT E Int. 2012, 48, 16–22. [Google Scholar]
- Javier, G.M.; Jaime, G.G.; Ernesto, V.S. Non-destructive techniques based on eddy current testing. Sensors 2011, 11, 2525–2565. [Google Scholar]
- Theodoulidis, T.; Wang, H.T.; Tian, G.Y. Extension of a model for eddy current inspection of cracks to pulsed excitations. NDT E Int. 2012, 47, 144–149. [Google Scholar] [CrossRef]
- Tian, G.Y.; Zhao, Z.X.; Baines, R.W. The research of inhomogeneity in eddy current sensors. Sens. Actuators A Phys. 1998, 69, 148–151. [Google Scholar] [CrossRef]
- Sophian, A.; Tian, G.Y.; Taylor, D.; Rudlin, J. Electromagnetic and eddy current NDT: A review. Insight 2001, 43, 302–306. [Google Scholar]
- Wilson, J.W.; Tian, G.Y.; Barrans, S. Residual magnetic field sensing for stress measurement. Sens. Actuators A Phys. 2007, 135, 381–387. [Google Scholar] [CrossRef]
- Wang, P.; Zhu, S.G.; Tian, G.Y.; Wang, H.T.; Wilson, J.; Wang, X. Stress measurement using magnetic Barkhausen noise and metal magnetic memory testing. Meas. Sci. Technol. 2010, 21, 055703. [Google Scholar] [CrossRef]
- Zhou, D.Q.; Wang, J.; He, Y.Z.; Chen, D.W.; Li, K. Influence of metallic shields on pulsed eddy current sensor for ferromagnetic materials defect detection. Sens. Actuators A Phys. 2016, 248, 162–172. [Google Scholar] [CrossRef]
- Fang, Z.; Li, A.Q.; Li, W.R.; Shen, S. Wind-Induced Fatigue Analysis of High-Rise Steel Structures Using Equivalent Structural Stress Method. Appl. Sci. 2017, 7, 71. [Google Scholar] [CrossRef]
- Na, W.S.; Baek, J. Impedance-Based Non-Destructive Testing Method Combined with Unmanned Aerial Vehicle for Structural Health Monitoring of Civil Infrastructures. Appl. Sci. 2016, 7, 15. [Google Scholar] [CrossRef]
- Zhang, Q.; Su, Y.; Zhang, L.; Bi, J.; Luo, J. Magnetoelastic Effect-Based Transmissive Stress Detection for Steel Strips: Theory and Experiment. Sensors 2016, 16, 1382. [Google Scholar] [CrossRef] [PubMed]
Figure 1.
Eddy current sensor configuration and working principle.

Figure 2.
(a) Inductor–resistor (LR) model and (b) equivalent model of eddy current sensor.
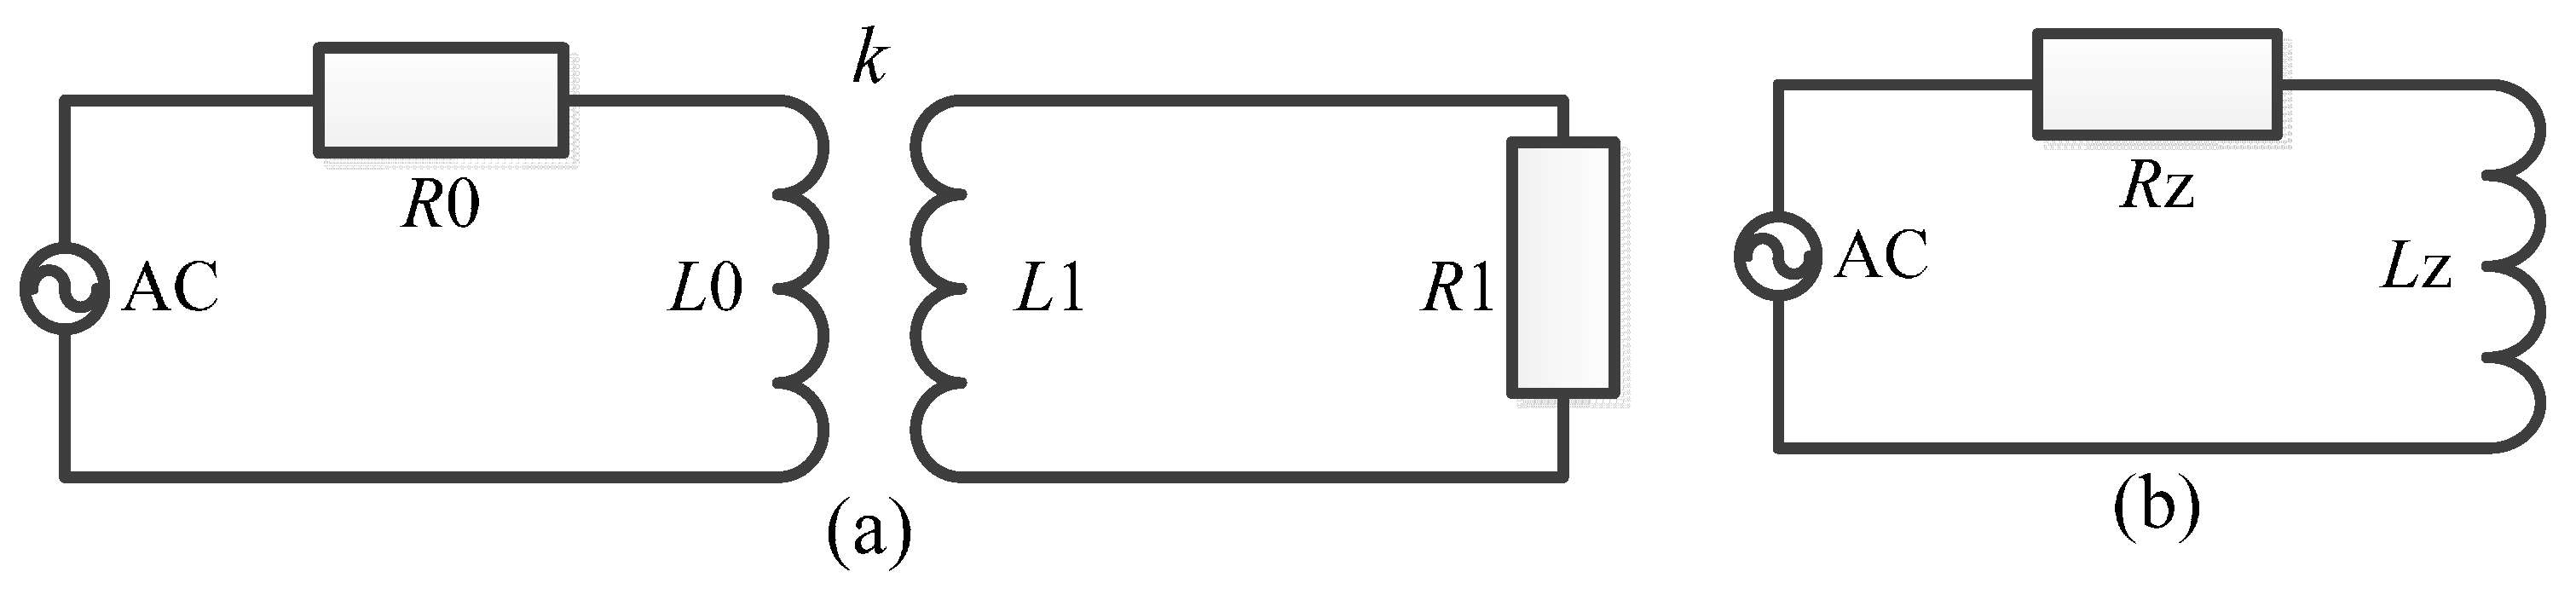
Figure 3.
Inductor–resistor–capacitor (LRC) model of eddy current sensor.
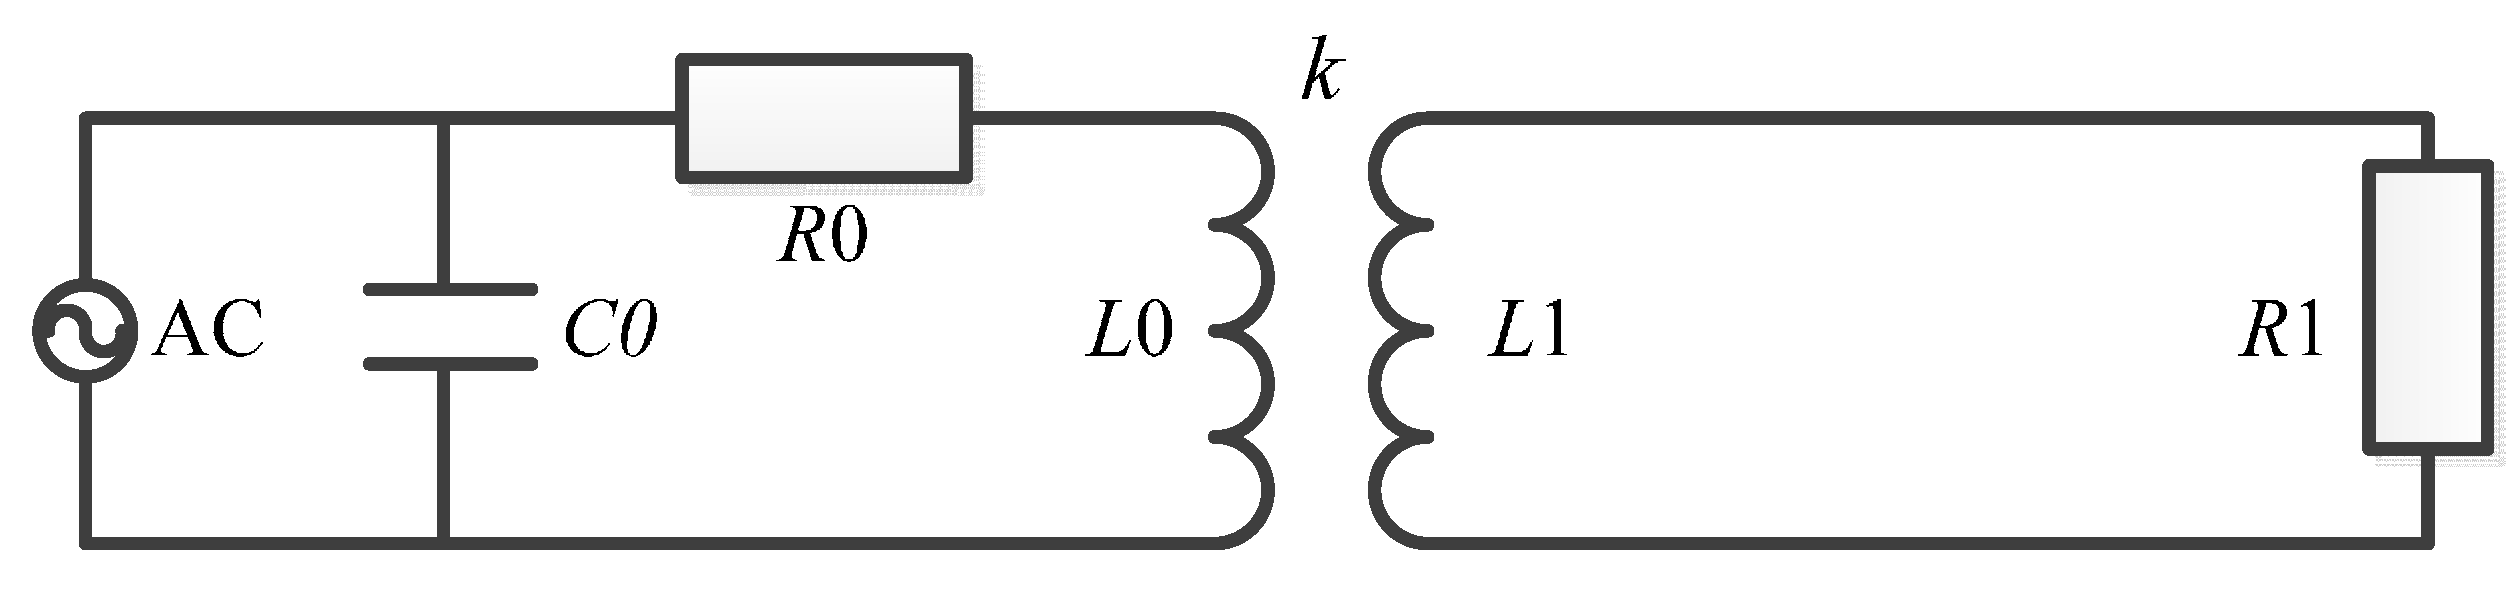
Figure 4.
Magnetic field lines distribution.

Figure 5.
Magnetic field strength distributions (a) with and (b) without the sleeve structure (H/m).
Figure 5.
Magnetic field strength distributions (a) with and (b) without the sleeve structure (H/m).
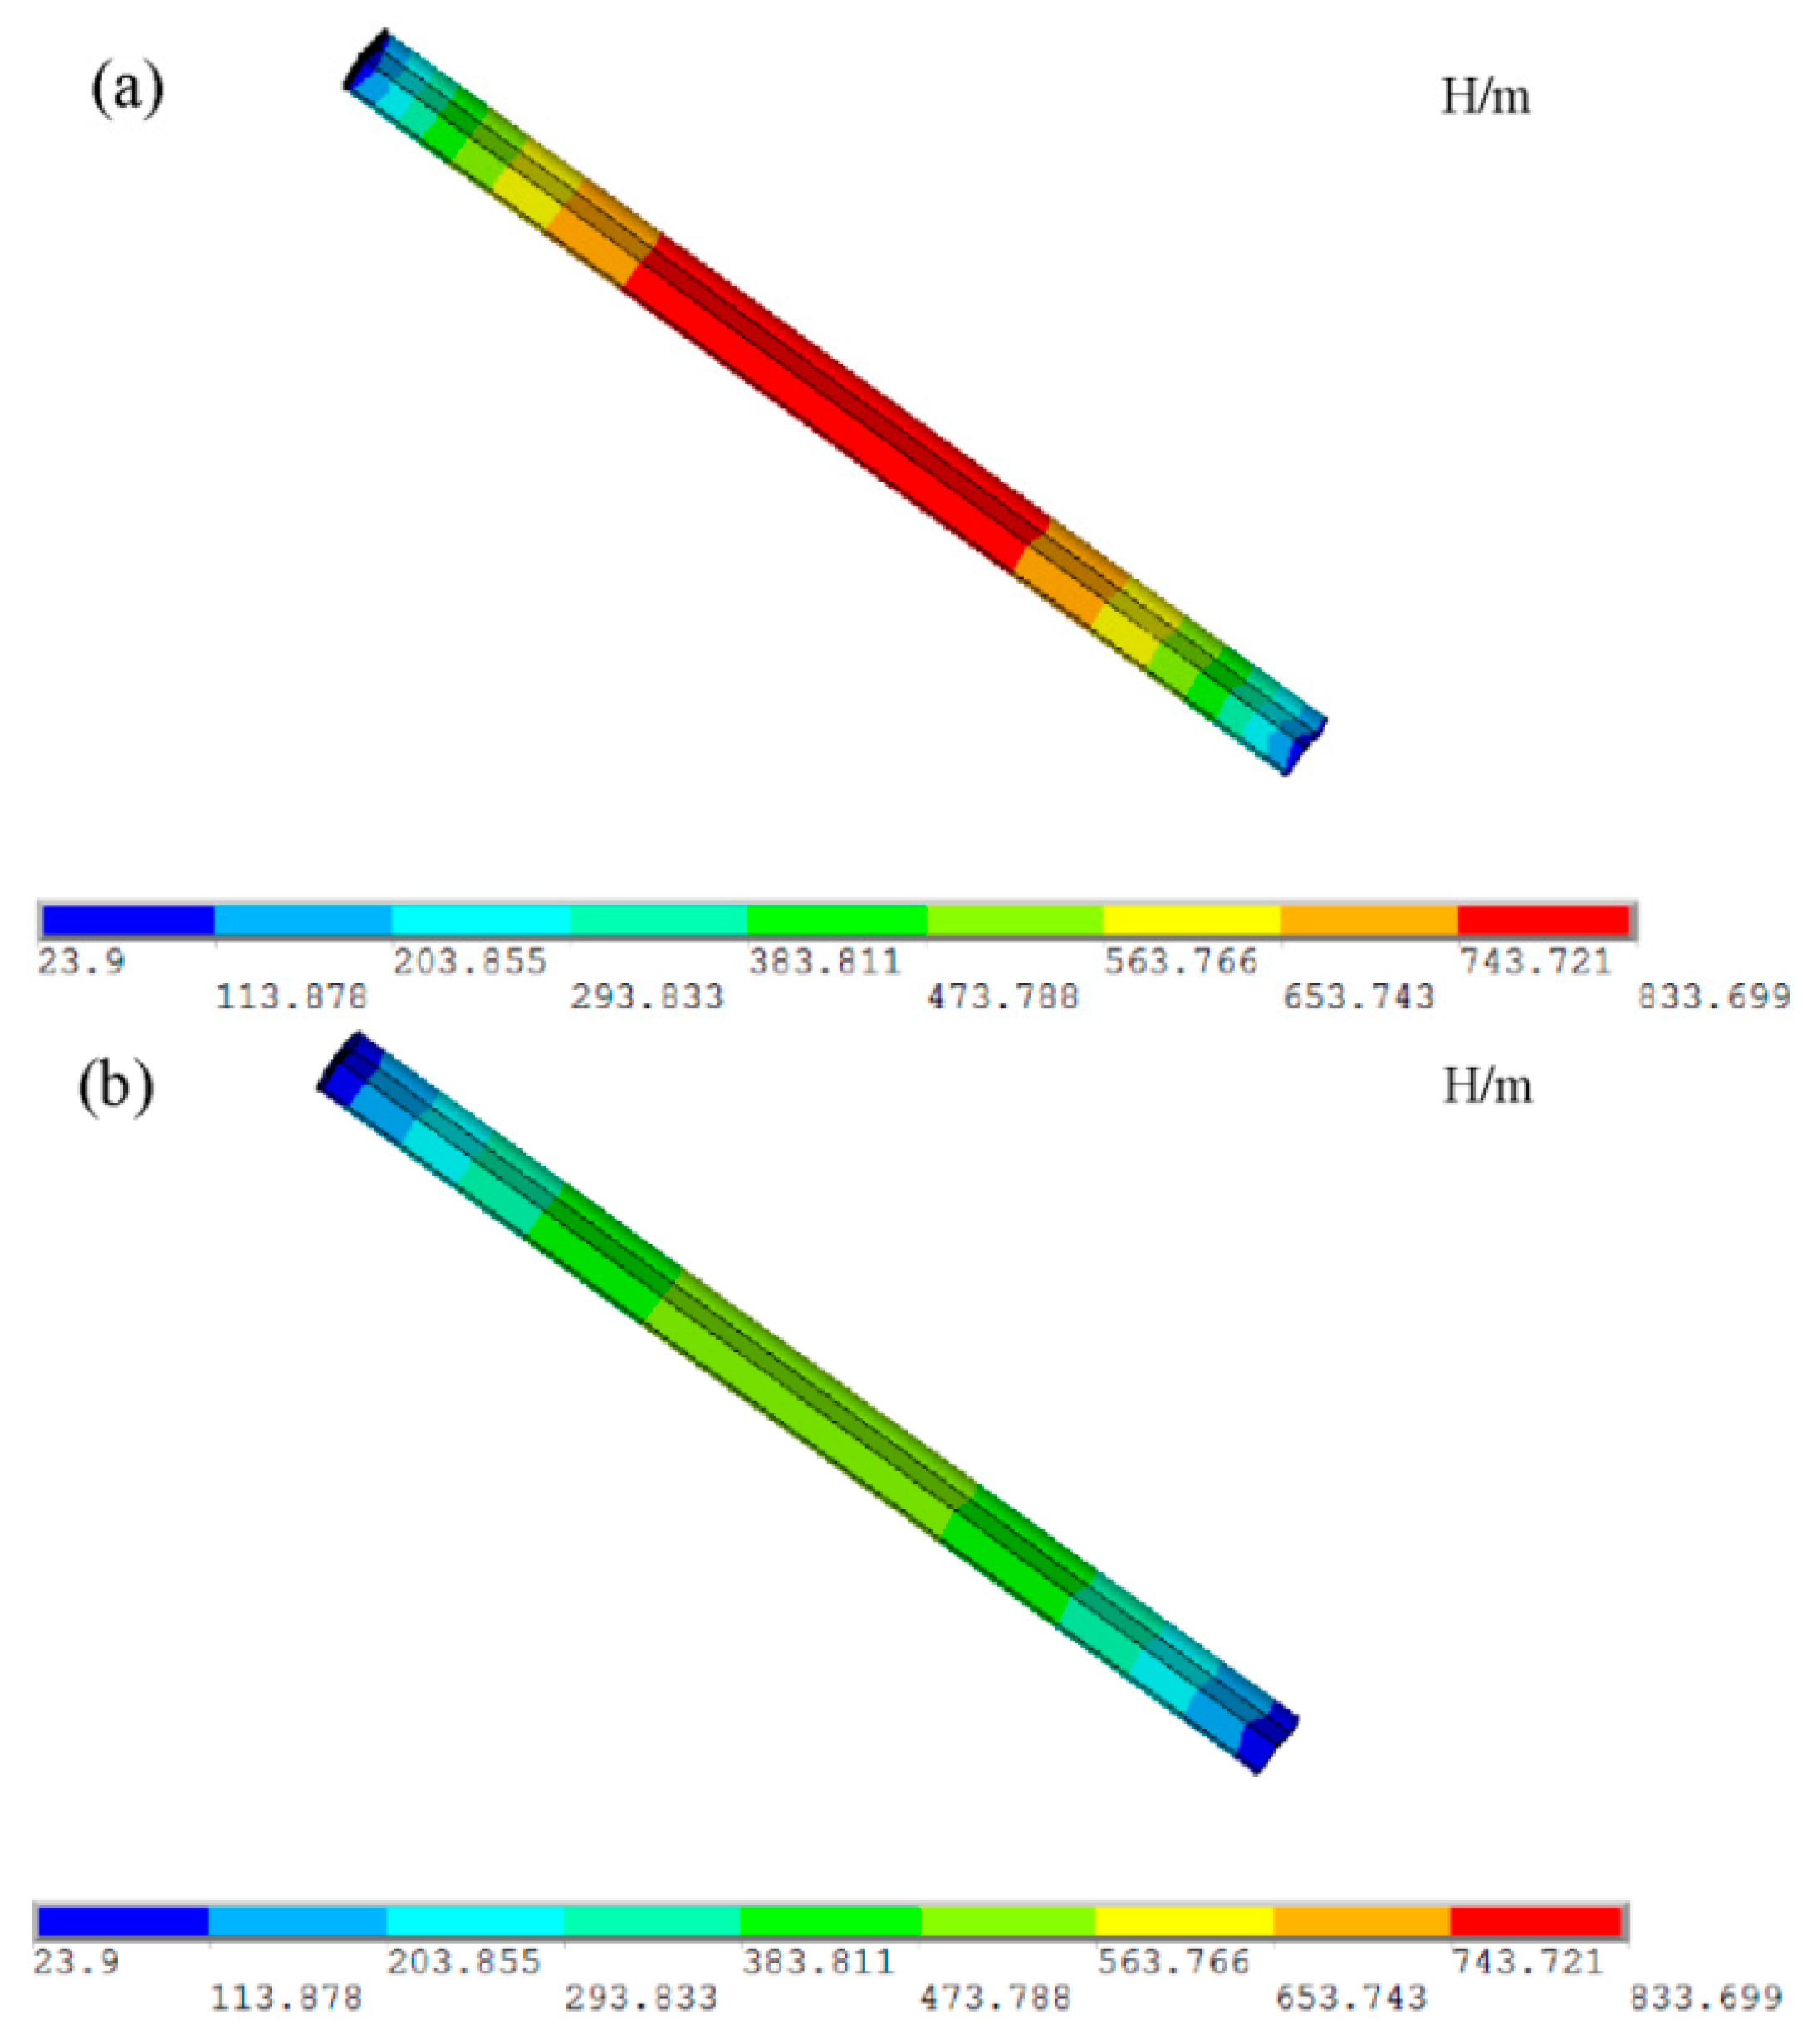
Figure 6.
Photo of the experimental system.
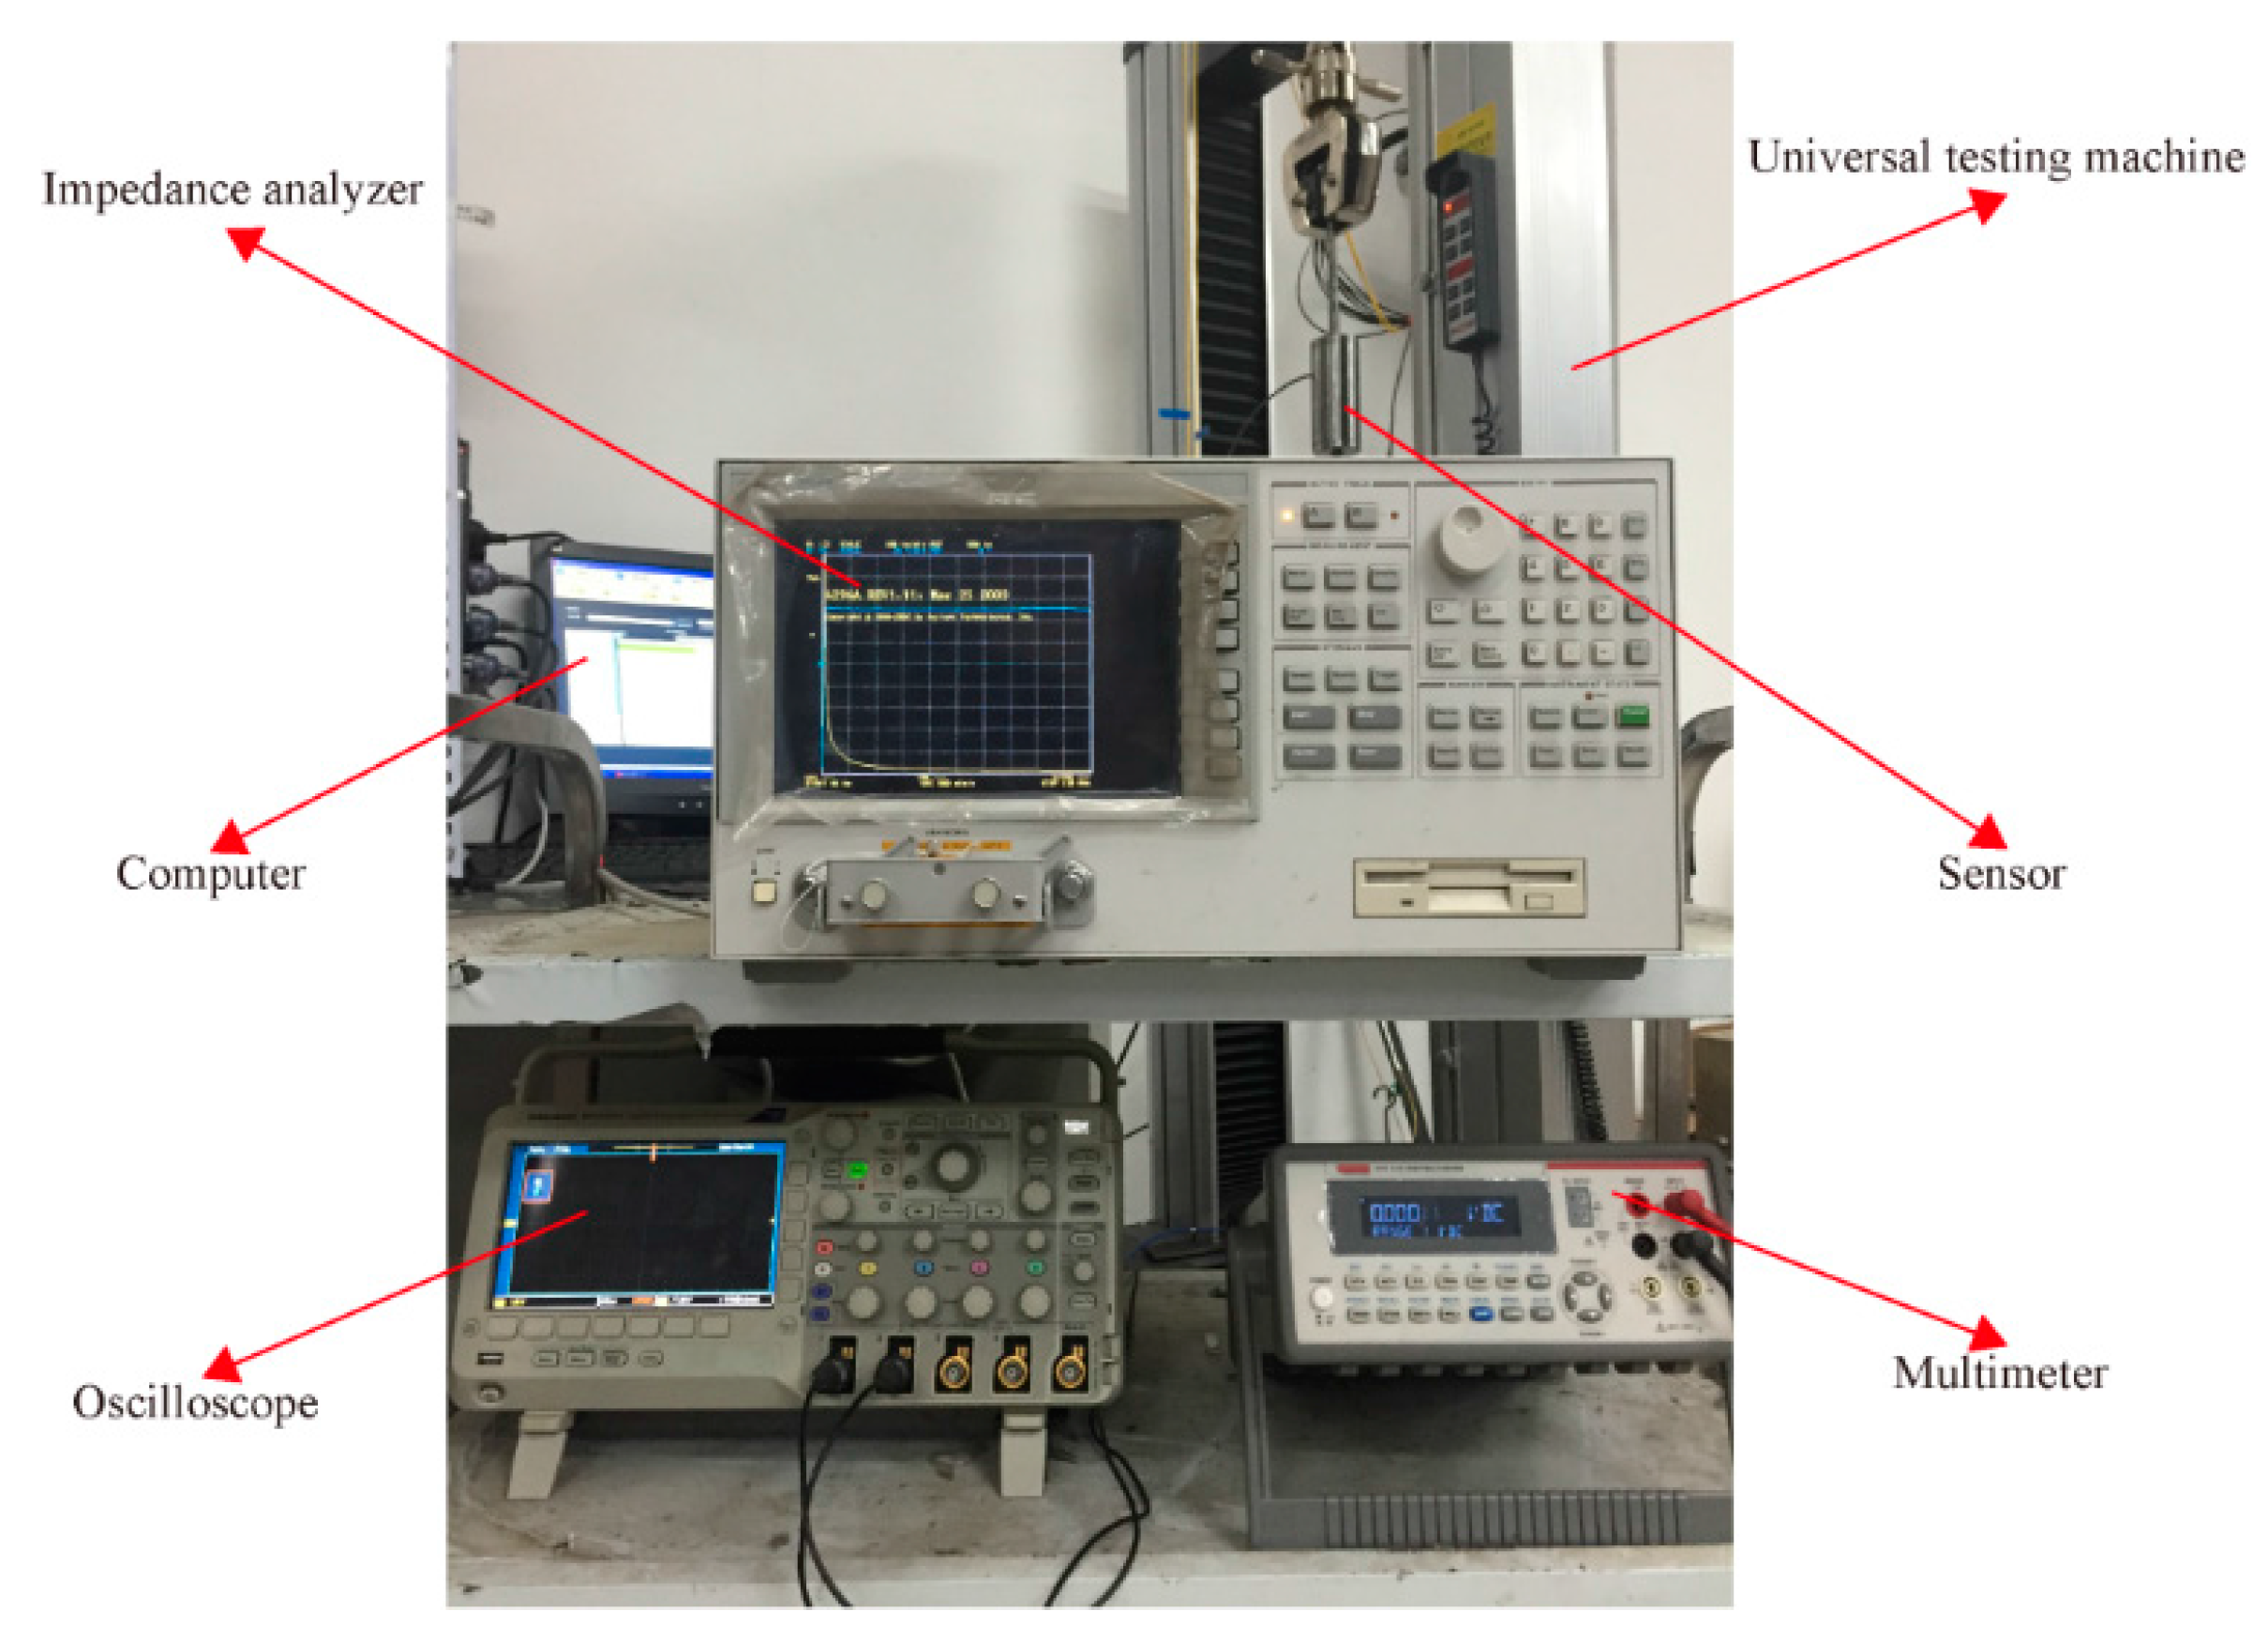
Figure 7.
Impedance magnitude and phase curves.
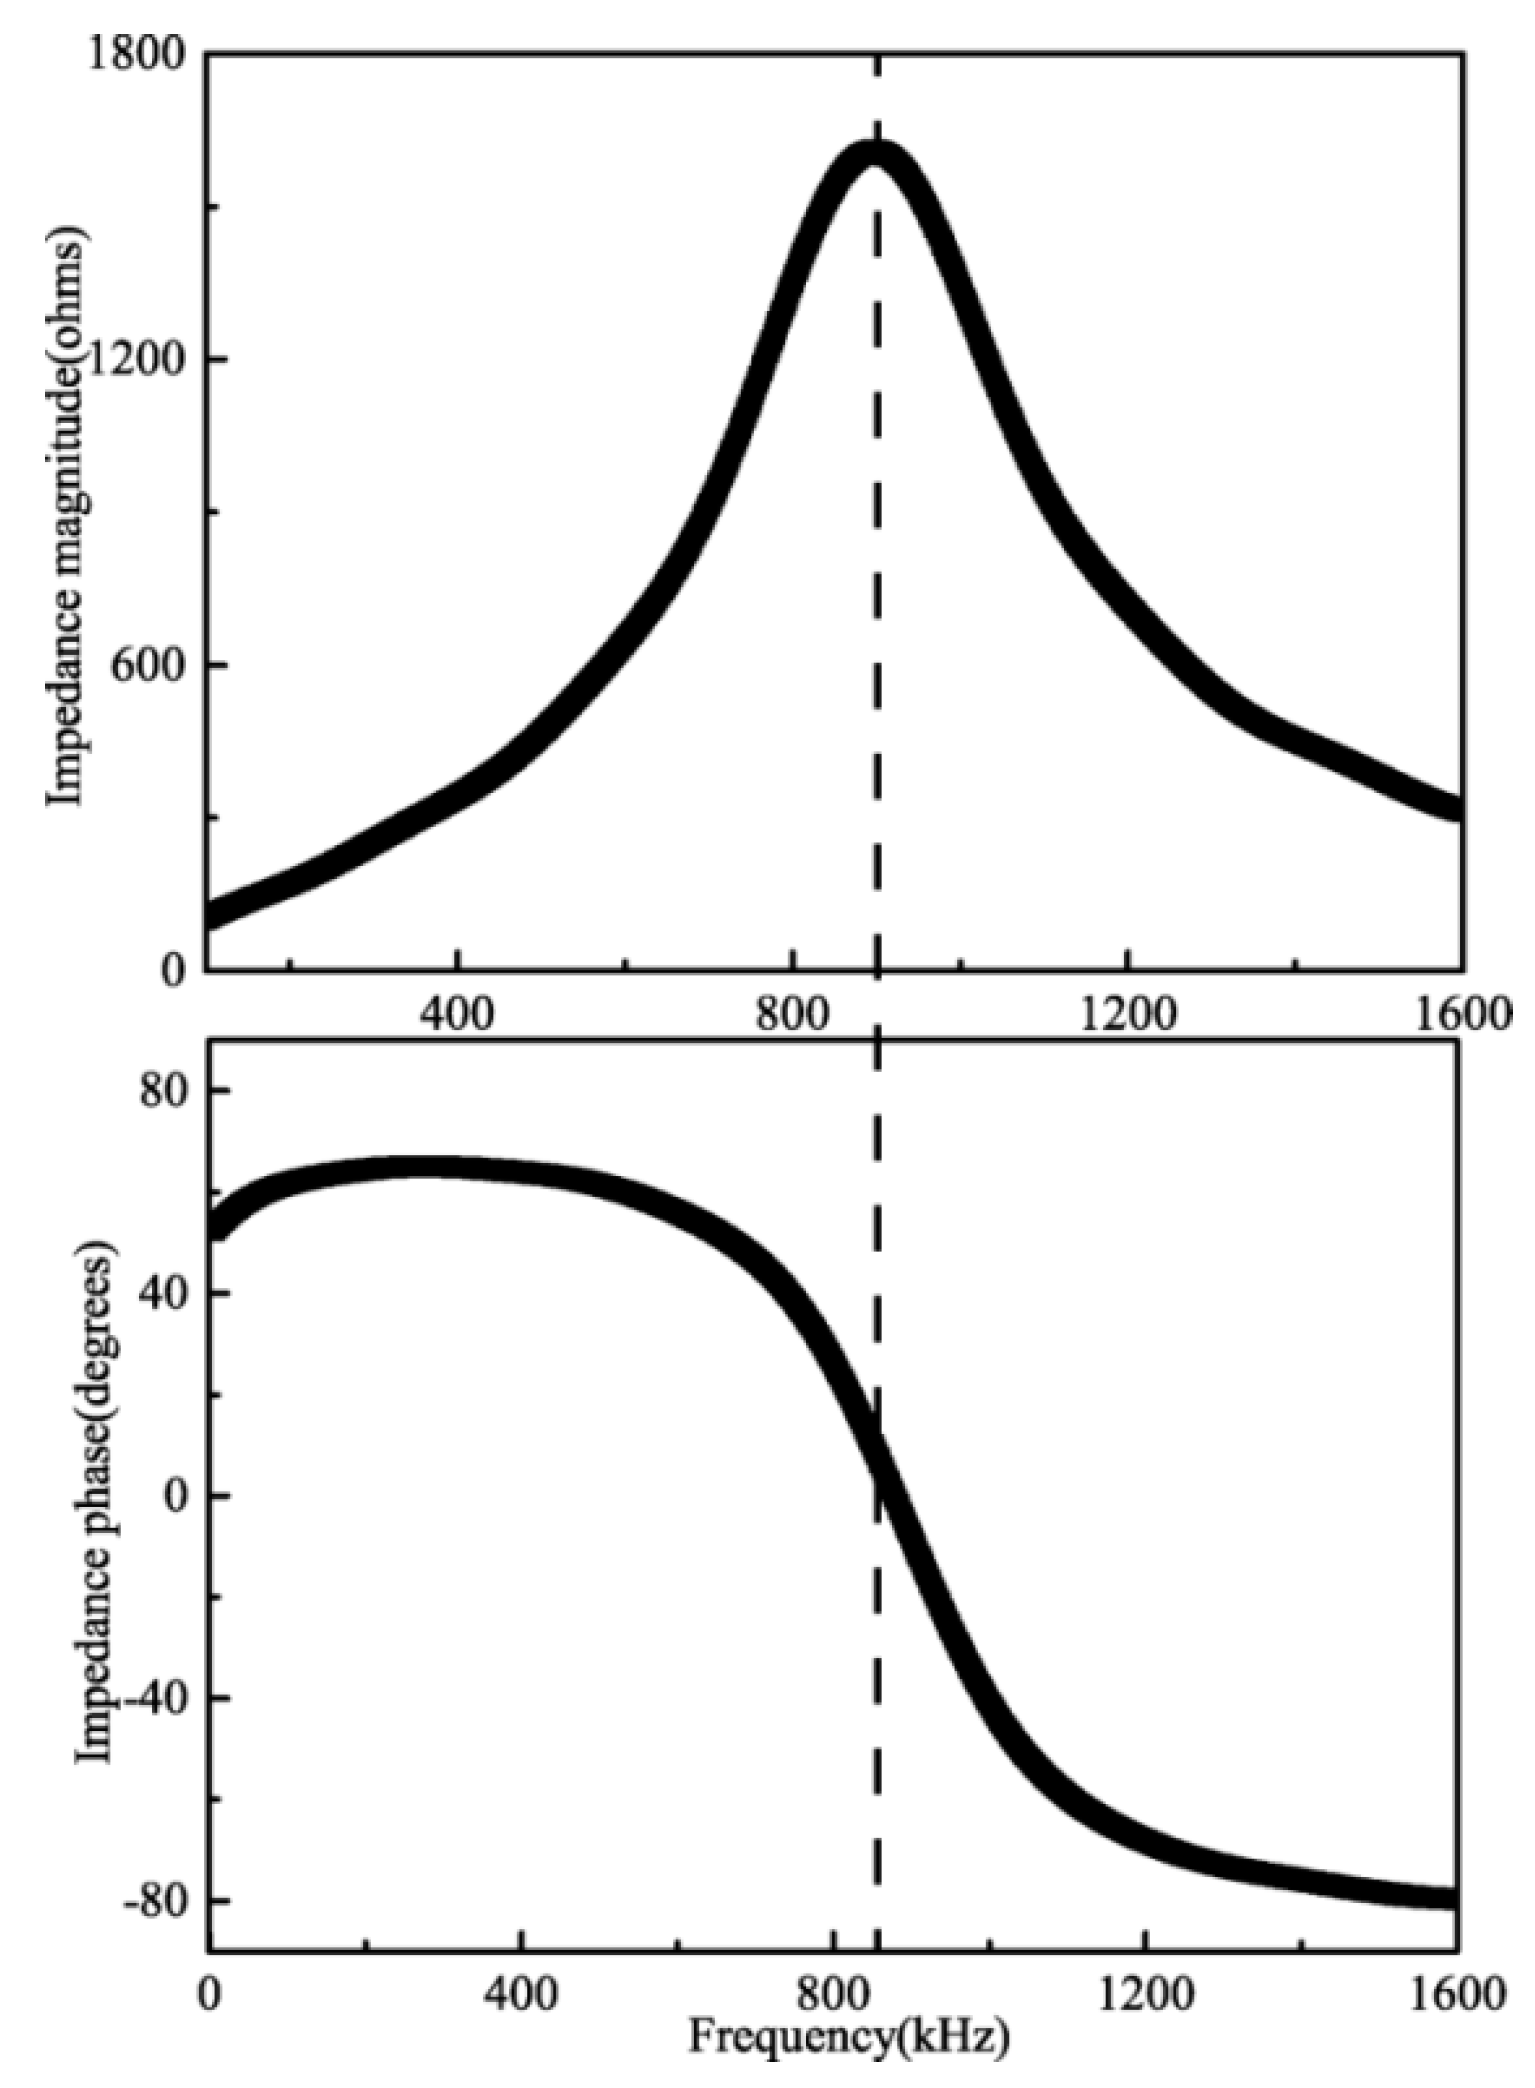
Figure 8.
Resonant frequency shift with different external capacitances.
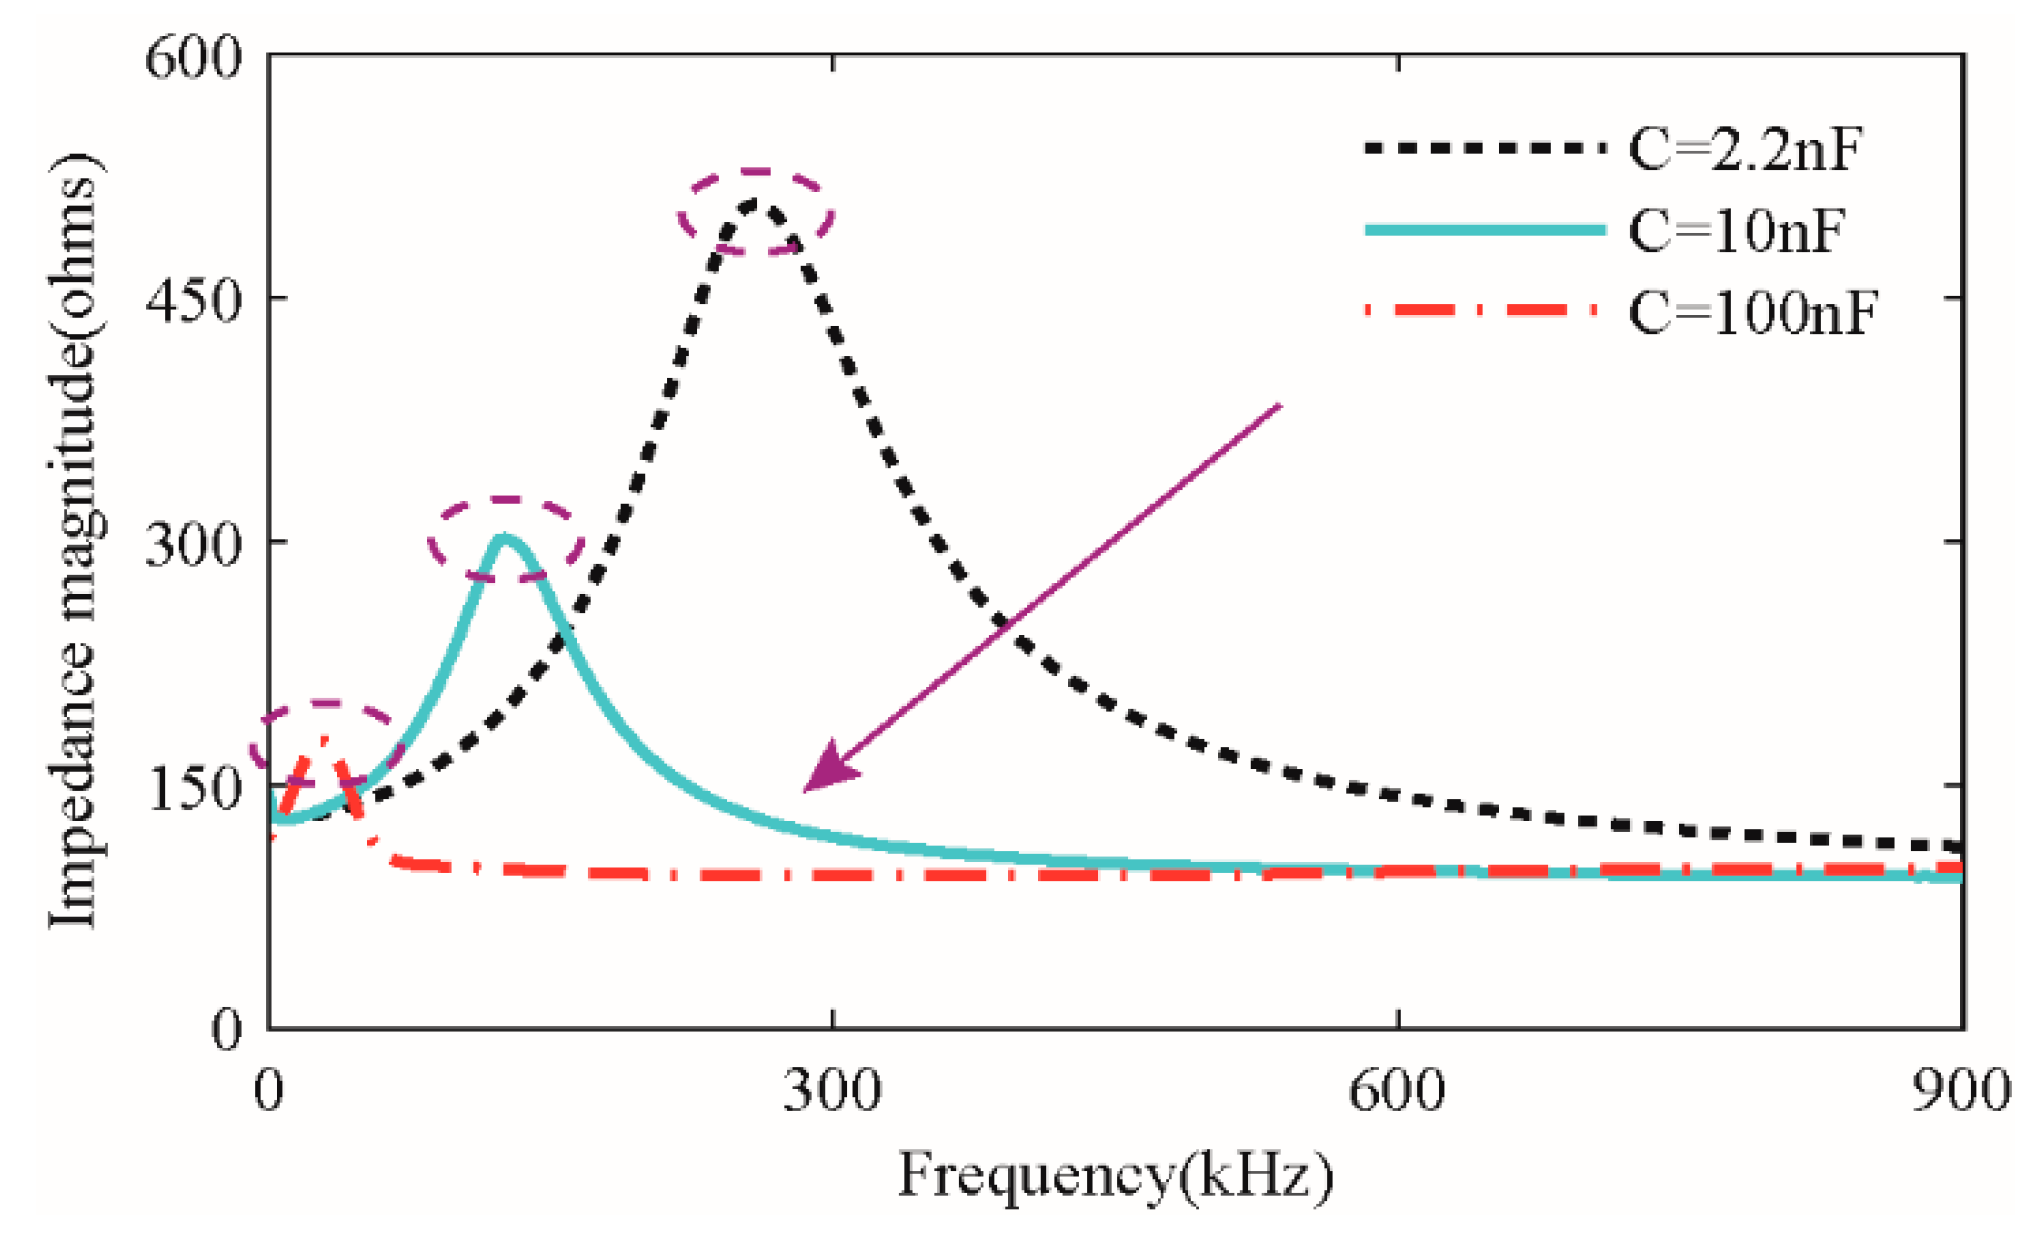
Figure 9.
Impedance magnitude analysis of eddy current sensor in the (a) loading and (b) unloading processes.
Figure 9.
Impedance magnitude analysis of eddy current sensor in the (a) loading and (b) unloading processes.
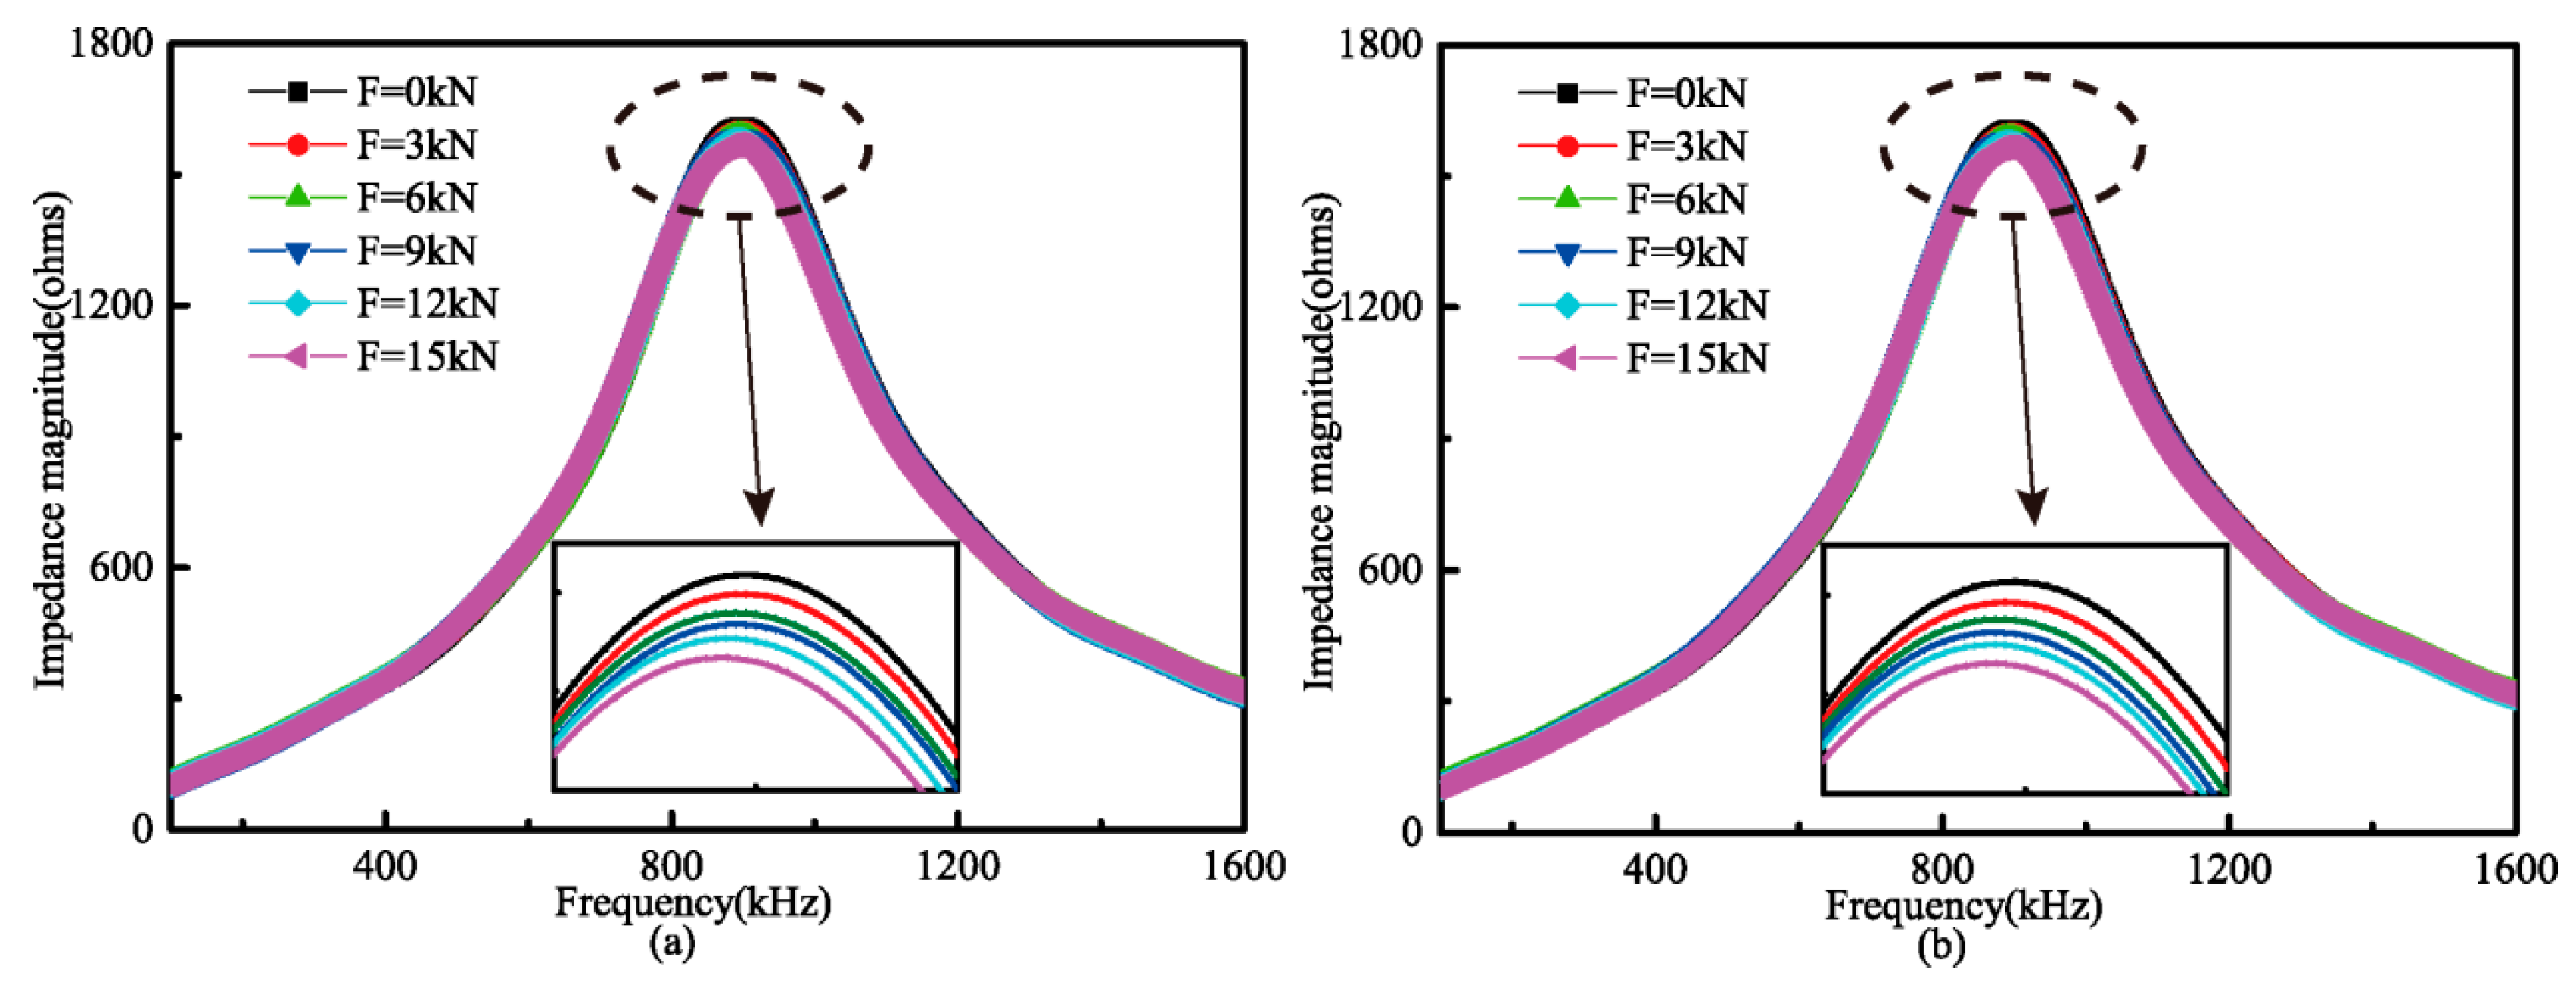
Figure 10.
Fitted results between the impedance magnitude and the external tension in the (a) loading and (b) unloading processes.
Figure 10.
Fitted results between the impedance magnitude and the external tension in the (a) loading and (b) unloading processes.

Figure 11.
Impedance phase analysis of eddy current sensor in the (a) loading and (b) unloading processes.
Figure 11.
Impedance phase analysis of eddy current sensor in the (a) loading and (b) unloading processes.

Figure 12.
Fitted results between the impedance phase and the external tension in the (a) loading and (b) unloading processes.
Figure 12.
Fitted results between the impedance phase and the external tension in the (a) loading and (b) unloading processes.

Figure 13.
Relative sensitivity change of impedance (a) magnitude and (b) phase.

Table 1.
Inductor–resistor–capacitor (LRC) parameters.
| Parameters | Inductance | Resistance | Capacitance |
|---|---|---|---|
| Values | 176.5 μH | 1.8 ohms | 182.9 pF |
Table 2.
Statistics of the repetitive experiments.
| Statistics | Mean Value | Variance | Coefficient of Variation (%) | |
|---|---|---|---|---|
| 0 kN | loading | 1610 | 2.27 | 0.14 |
| unloading | 1607 | 1.53 | 0.10 | |
| 3 kN | loading | 1600 | 1.49 | 0.09 |
| unloading | 1596 | 1.07 | 0.07 | |
| 6 kN | loading | 1590 | 0.94 | 0.06 |
| unloading | 1588 | 1.11 | 0.07 | |
| 9 kN | loading | 1583 | 1.07 | 0.07 |
| unloading | 1580 | 0.90 | 0.06 | |
| 12 kN | loading | 1577 | 1.57 | 0.10 |
| unloading | 1575 | 0.94 | 0.06 | |
| 15 kN | loading | 1567 | 1.70 | 0.11 |
| unloading | 1567 | 1.70 | 0.11 | |
Table 3.
Comparison results of correlation coefficient.
| Correlation Coefficient | Sleeve Structure | Non-Sleeve Structure | ||
|---|---|---|---|---|
| Loading | Unloading | Loading | Unloading | |
| Impedance magnitude | 0.991 | 0.986 | 0.981 | 0.982 |
| Impedance phase | 0.989 | 0.996 | 0.977 | 0.974 |
© 2017 by the authors. Licensee MDPI, Basel, Switzerland. This article is an open access article distributed under the terms and conditions of the Creative Commons Attribution (CC BY) license (http://creativecommons.org/licenses/by/4.0/).
Share and Cite
MDPI and ACS Style
Xiu, C.; Ren, L.; Li, H. Investigation on Eddy Current Sensor in Tension Measurement at a Resonant Frequency. Appl. Sci. 2017, 7, 538. https://doi.org/10.3390/app7060538
AMA Style
Xiu C, Ren L, Li H. Investigation on Eddy Current Sensor in Tension Measurement at a Resonant Frequency. Applied Sciences. 2017; 7(6):538. https://doi.org/10.3390/app7060538
Chicago/Turabian StyleXiu, Chengzhu, Liang Ren, and Hongnan Li. 2017. "Investigation on Eddy Current Sensor in Tension Measurement at a Resonant Frequency" Applied Sciences 7, no. 6: 538. https://doi.org/10.3390/app7060538
Note that from the first issue of 2016, this journal uses article numbers instead of page numbers. See further details here.