Article

Application of FBG Based Sensor in Pipeline Safety Monitoring

1
School of Civil and Hydraulic Engineering, Dalian University of Technology, Dalian 116024, China
2
School of Ocean Science and Technology, Dalian University of Technology, Panjin 124221, China
3
School of Civil Engineering, Shenyang Jianzhu University, Shenyang 110168, China
*
Author to whom correspondence should be addressed.
Appl. Sci. 2017, 7(6), 540; https://doi.org/10.3390/app7060540
Submission received: 29 March 2017 / Revised: 24 April 2017 / Accepted: 12 May 2017 / Published: 24 May 2017

Abstract

:
Pipeline leakage and corrosion are two serious threats to pipeline safety operation. Therefore, to ensure the safety operation of long-distance pipeline, it is of great significance to conduct pipeline monitoring. Since hoop strain is an effective indicator to reflect the inner pressure fluctuation and the wall thickness reduction of the pipeline, a method of monitoring leakage and corrosion simultaneously was proposed based on hoop strain measurement. In order to test the hoop strain variation, this paper introduces a fiber Bragg grating (FBG) strain hoop sensor. To verify the monitoring method and the performance of this FBG strain sensor, a pipeline leakage simulation experiment and corrosion simulation experiment were conducted on an actual pipeline and a polyvinyl chloride (PVC) pipe model, respectively. The experimental results demonstrate that the pipeline leakage and corrosion can be detected by the FBG hoop strain sensor. The FBG strain hoop sensor is a promising device in pipeline safety monitoring.

Graphical Abstract

1. Introduction

Pipeline is an important means to transport oil and gas through long distance [1,2]. However, due to the effect of the inner fluids and the harsh environmental conditions, these pipelines are particularly prone to be corroded [3]. Once the pipes are subjected to corrosion, it may probably cause leakage or breakages [4]. Thus, a number of pipeline detection technologies have been developed to ensure pipeline safety. Pole climbing robots that perform periodical inspections with non-destructive testing probes are widely used for assessing the progression of material degradation and detecting welding defects [5]. In order to inspect 80–100 mm pipelines in an indoor pipeline environment, Kwon et al. design a motion planning algorithm of a caterpillar-based pipeline robot [6]. An ultrasonic inspection robot equipped with an electromagnetic acoustic transducer was developed for inspection of a steel pipeline in service [7]. However, inspection techniques cannot provide real-time monitoring of the pipelines. Therefore, leakage or pipeline defects may not be detected in time and may cause much larger economic loss and environmental pollution [8]. Consequently, it is more significant to perform permanent and real-time integrity monitoring.
Generally, oil and gas pipelines are buried underground and extend hundreds of kilometers. These working conditions mean that many traditional structural monitoring technologies are not applicable for pipeline structure. A fiber optic sensor, with its superior immunity to electromagnetic interference, long distance transmission, good embeddability and reliability [9], is an ideal approach for pipeline safety monitoring. Optical fiber based innovative distributed temperature monitoring techniques have proven to be an efficient way to detect and localize leakages along pipelines [10]. Since leakages from the pipeline lead to regional temperature anomalies in the vicinity of the pipeline, Brillouin-based distributed temperature monitoring systems have been developed and equipped with a 55 km pipeline for the leakage localization [11]. Zou et al. developed a Brillouin-scattering-based fiber optic distributed strain sensor and applied it to measure the longitudinal and hoop strain in a steel pipe model with wall thinning defects. According to the strain distribution, the locations of structural defects were found [12]. To detect the internal corrosion of pipeline, a novel distributed sensor, employing metal coated polymer-clad fiber optic cables, was studied and developed theoretically by Alhandawi et al. [13]. However, the widely applied distributed optic fiber sensor has its own advantages and limitations. For example, optical time-domain reflectometer (OTDR) based technique has distributed measurement over a long distance due to its larger dynamic range, while its spatial resolution is usually on the order of meters to tens of meters [14], and its measurement accuracy is not high. Generally, the distributed sensors are more suitable for localizing damage or leakage instead of measuring the degree of damage or corrosion. An FBG sensor, with the special advantages of high measurement accuracy [15], is also suitable for pipeline monitoring [16]. To monitor pipeline leakage, Jia et al. applied FBG sensors to measure hoop strain at regular points along the pipeline [17]. Felli et al. presented FBG accelerometers for detecting fuel theft from pipelines [18]. Zhou et al. applied the FBG sensors in the monitoring of the dynamic response of a submarine pipeline model under a variety of dynamic loading conditions [19]. Lee et al. proposed a method to monitor the damage of pipeline using FBG sensors to measure guided wave responses [20]. In order to detect and localize pipeline leakage, Hou et al. utilized an FBG strain sensor in the natural gas pipeline model to detect a negative pressure wave (NPW) caused by leakage [21]. It can be concluded that the current study based on FBG sensors mainly focus on the pipeline damage detection and leakage monitoring. However, few studies about corrosion monitoring have been conducted, despite having the advantage of high measurement accuracy. Moreover, the existing optic fiber based monitoring technique cannot conduct corrosion monitoring and leakage monitoring simultaneously. In this paper, an FBG hoop strain sensor is proposed to monitor pipeline corrosion and leakage simultaneously. Two model experiments were conducted to test the performance of an FBG strain hoop sensor. To verify the correctness of the monitoring theory, a numerical analysis was also carried out using SAP2000 software (V15, Computers and Structures, Inc., New York, NY, USA).

2. Pipeline Safety Monitoring Theory

To implement pipeline leakage and corrosion simultaneous monitoring, a key parameter is required to reflect their respective characteristics. Thus, a hoop strain theory is proposed.

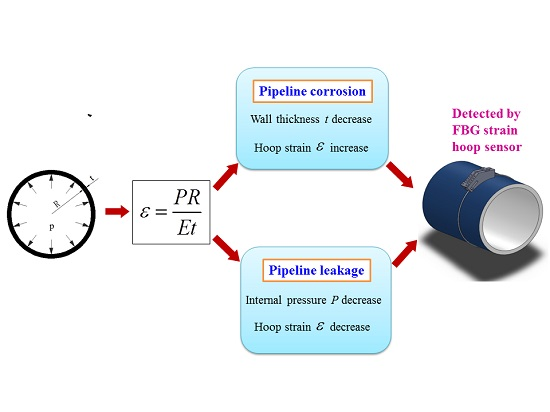
2.1. Hoop Strain Theory

Inner pressure causes the pipeline expansion in the radial direction. Based on the theory of Material Mechanics, the relationship between the hoop strain, the inner pressure and the wall thickness of the pipeline, is given directly:
ε = P × R / E × t
where ε is the hoop strain of the pipeline; P is the applied pressure; E is the Young’s modulus and t is the wall thickness of the pipeline.

2.2. Leakage Monitoring

When pipeline leakage occurs, the fluid suddenly escapes from the leakage point, causing the instantaneous pressure drop. Simultaneously, an NPW is generated and propagate toward both ends of the pipeline at a certain velocity [17]. Traditionally, several pressure sensors are mounted along the pipeline to detect the NPW. According to Equation (1), the hoop strain is proportional to the inner pressure variation, since t and R can be considered as the constants during the pipeline leakage. Thus, pipeline leakage can be detected via the hoop strain measurement.

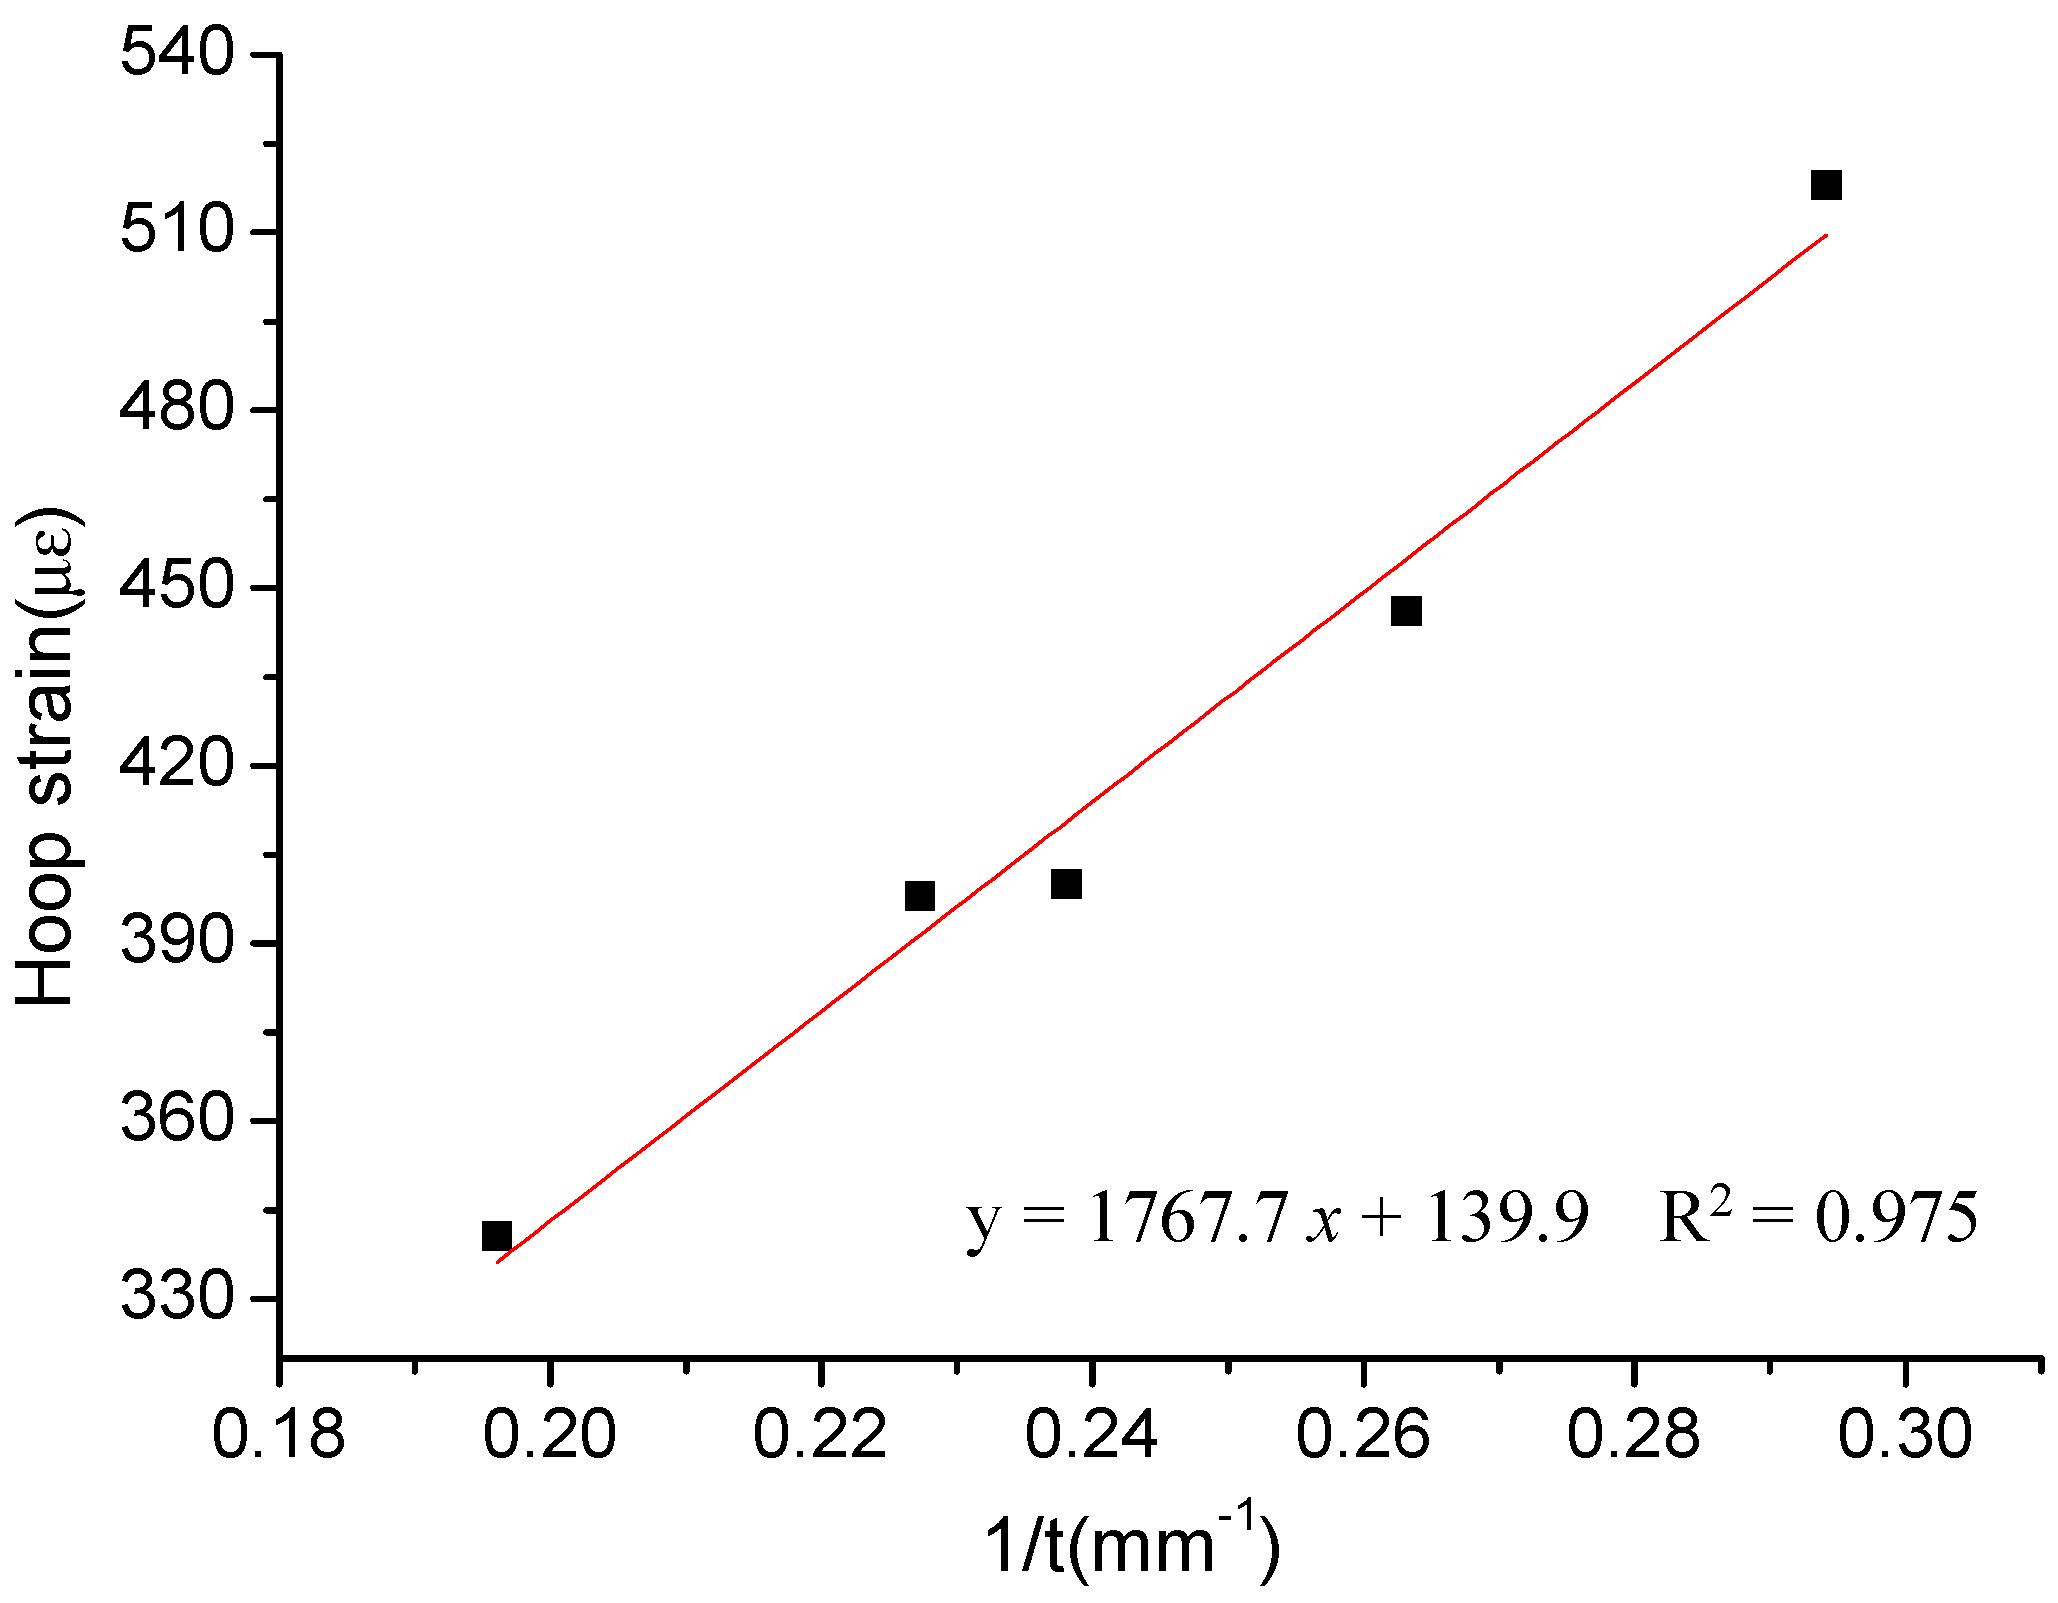
2.3. Corrosion Monitoring

For pipeline corrosion monitoring, it is assumed that P and R are the constants since pipelines usually work in the condition of steady pressure and the radius of the pipeline is a constant. Therefore, the hoop strain is inversely proportional to the wall thickness of pipeline based on Equation (1). According to this theory, the wall thickness reduction, which is the most direct phenomenon caused by corrosion, can be reflected by the hoop strain directly.

2.4. Leakage and Corrosion Distinction

Both leakage and corrosion will cause the hoop strain variation. Generally, pipeline leakage occurs within a few seconds, and the instantaneous pressure drop causes the hoop strain to decrease. However, for pipeline corrosion, which directly leads to the pipeline wall thickness reduction, will induce the hoop strain increase in a few months or years. Thus, leakage and corrosion can be distinguished by the hoop strain decrease or increase.
Based on the theory of hoop strain monitoring, pipeline leakage and the corrosion level can be measured. Therefore, whether the hoop strain can be measured accurately is very crucial. An FBG strain hoop sensor, which can be attached on the external surface of the pipeline and measure the overall circumferential deformation on the same cross-section, is designed and applied in the model tests.

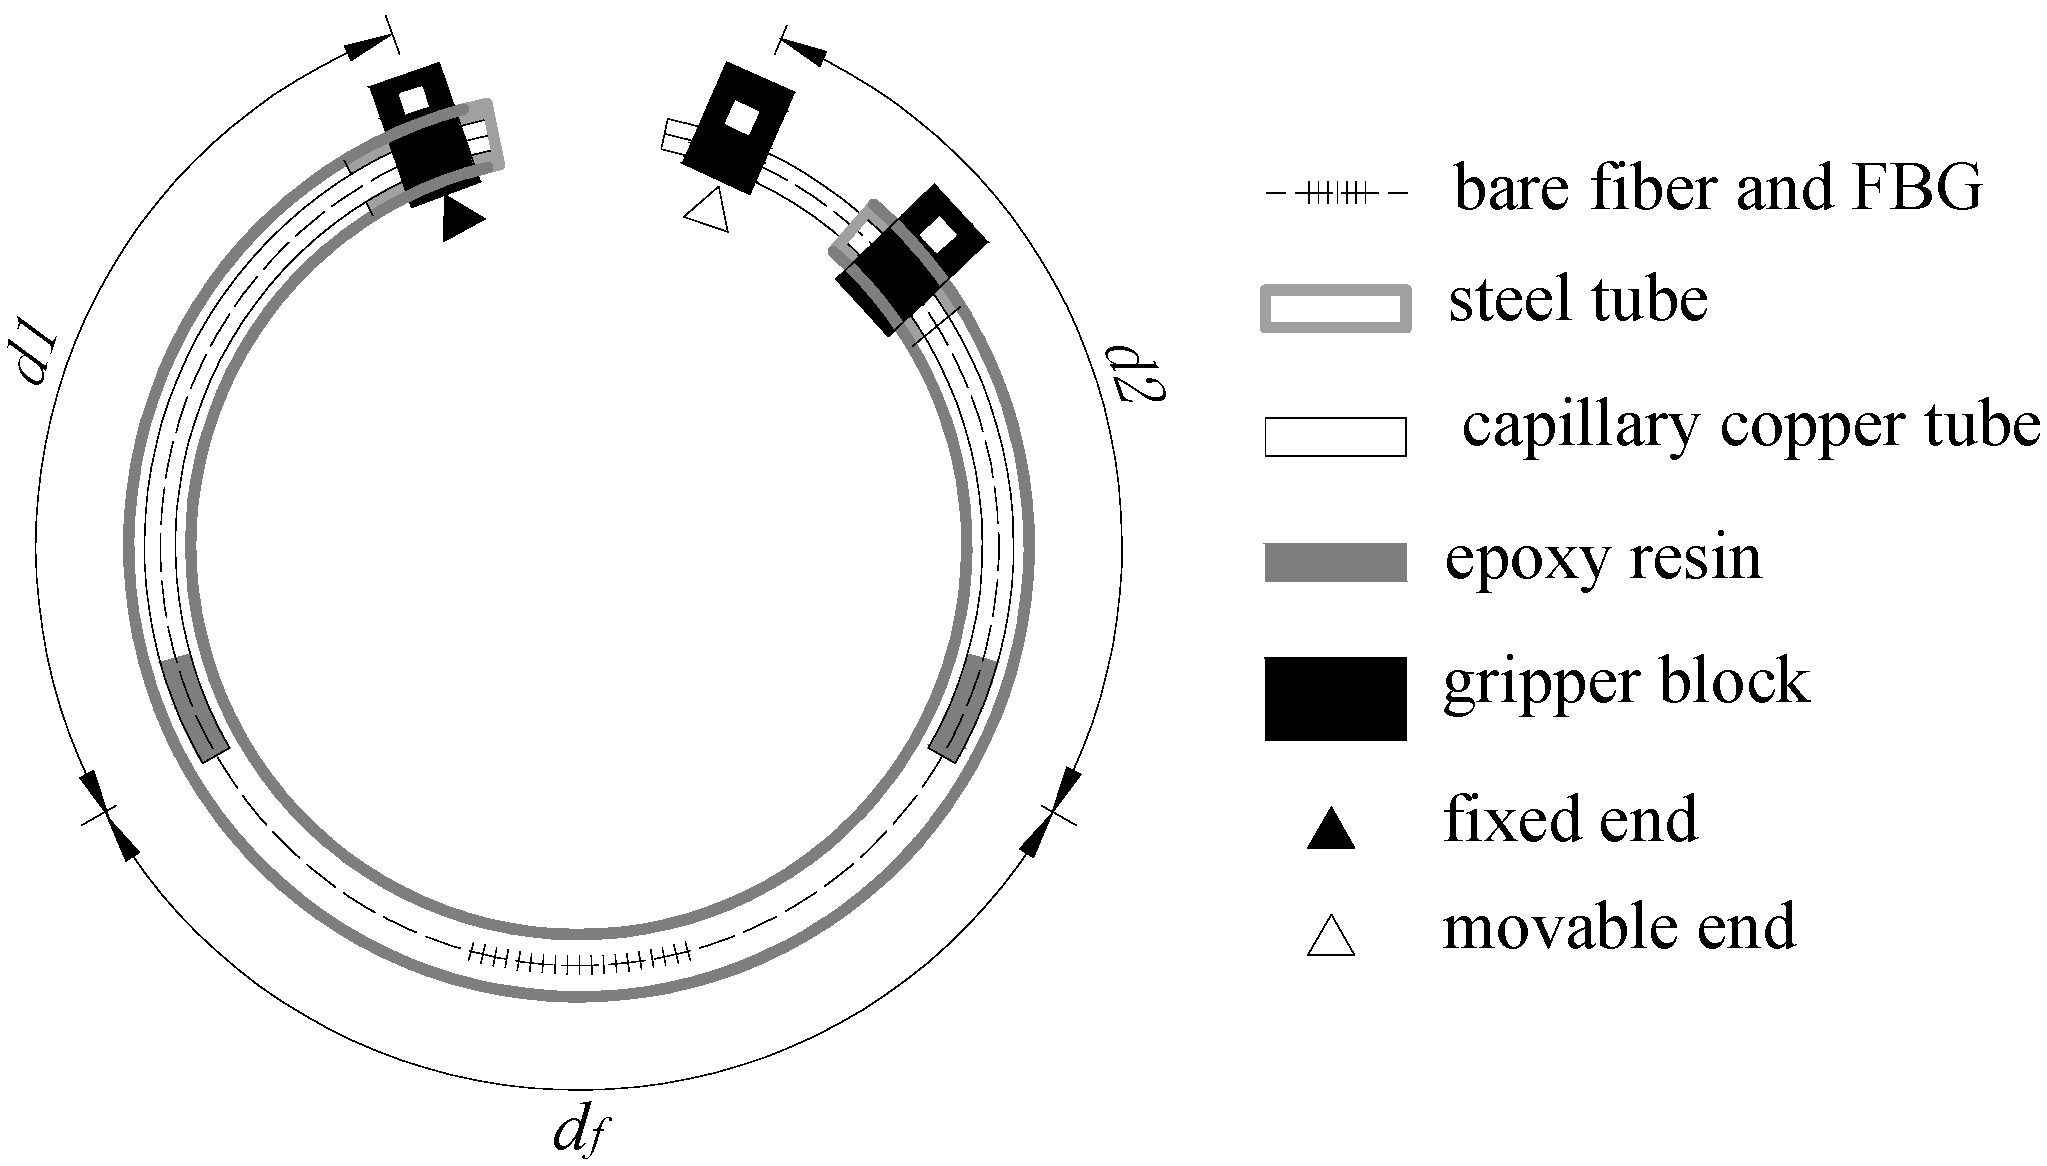
3. Sensor Introduction
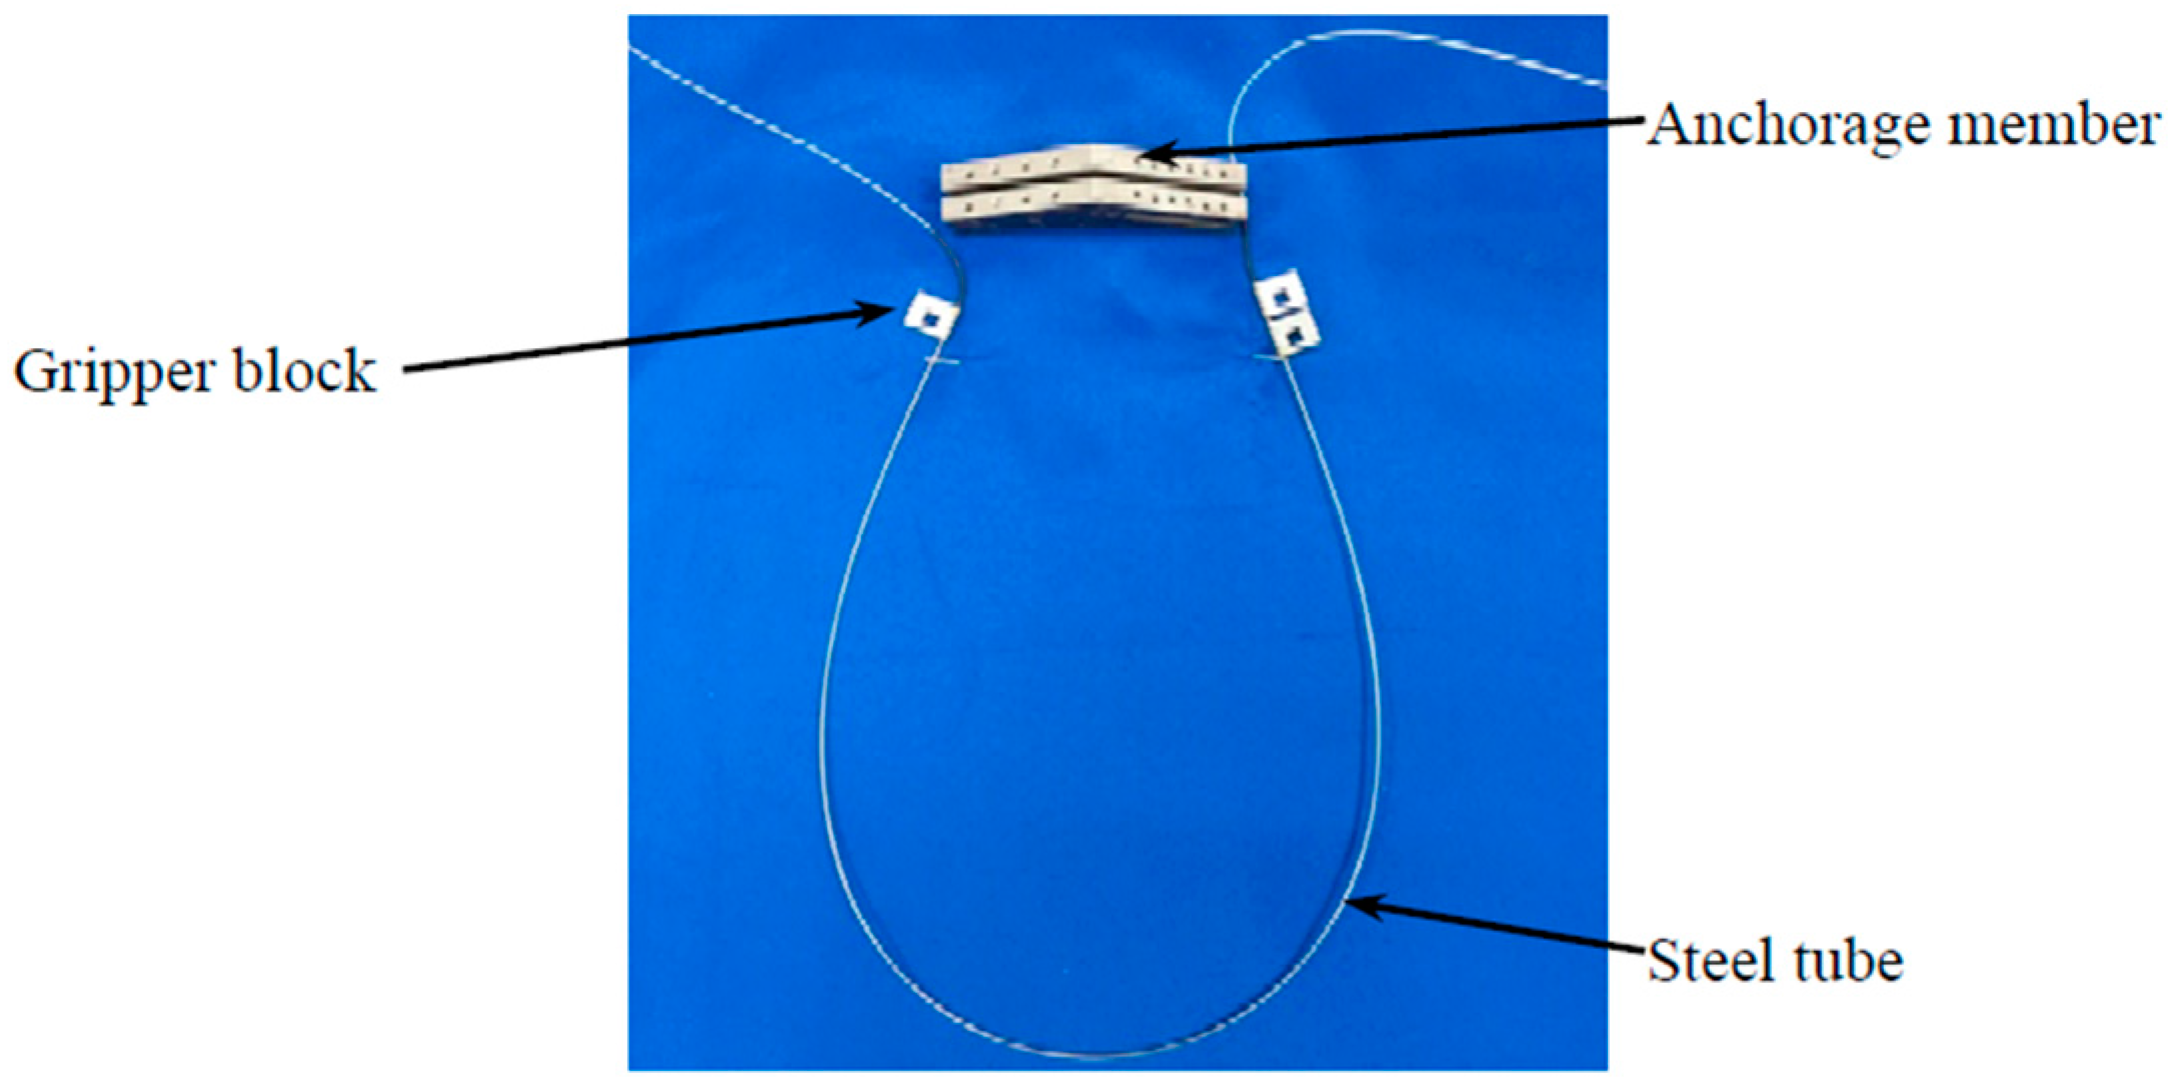
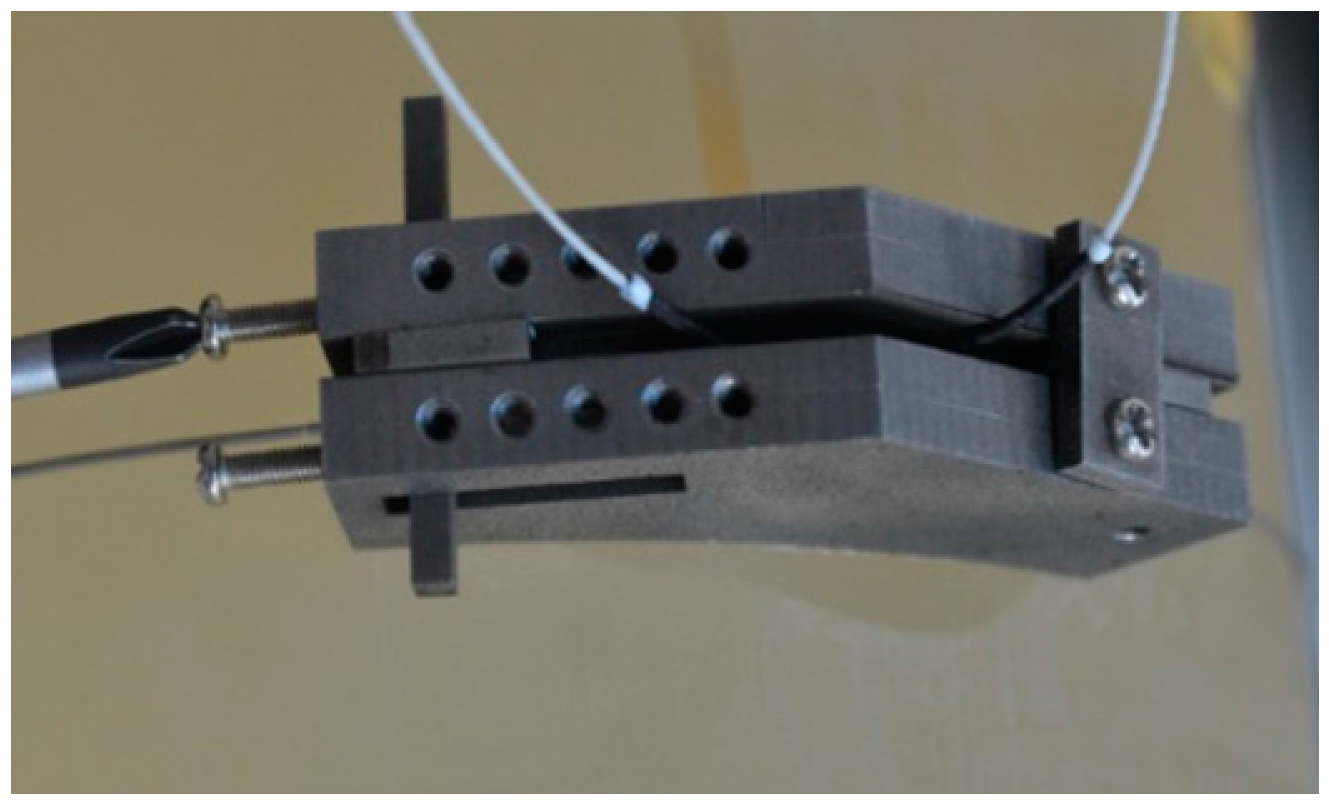
3.1. Sensor Design

Figure 1 and Figure 2 present the schematic diagram and the photo of FBG strain hoop sensor, respectively. This sensor is comprised of an FBG sensor, two capillary copper tubes, three gripper blocks and a steel tube. The fiber in both sides of an FBG is packaged with the epoxy resin in the two capillary copper tubes. The steel tube is used to protect the fragile bare fiber from damage. Meanwhile, the steel tube is mounted on the outer surface of the pipeline, providing a track for the capillary copper tubes slide in it. The two gripper blocks fixed on the steel tube are temporarily jammed in an anchorage member when bonding the steel tube to the outer surface of the pipeline, ensuring that the steel tube can be closely mounted onto the pipeline surface. After bonding the steel tube to the pipeline, the two gripper blocks at the movable end and the fixed end are jammed in an anchorage member (as shown in Figure 2). The movable end shifts position when a circumferential deformation happens, which, in turn, drags the gripper block, causing deformation in the grating area and the gripper tubes.
If the fiber packaged in the FBG strain hoop sensor is not tightened under working conditions, there may be no wavelength variation when pipeline leakage happens during its service. Therefore, a pre-tension mechanism (presented in Figure 3) was developed to load pre-stressing to the fiber and fix the FBG strain hoop sensor simultaneously. In practical application, the wavelength variation caused by the pre-tension system is recommended to be restricted under 1 nm so that the FBG will not be easily destroyed during testing.

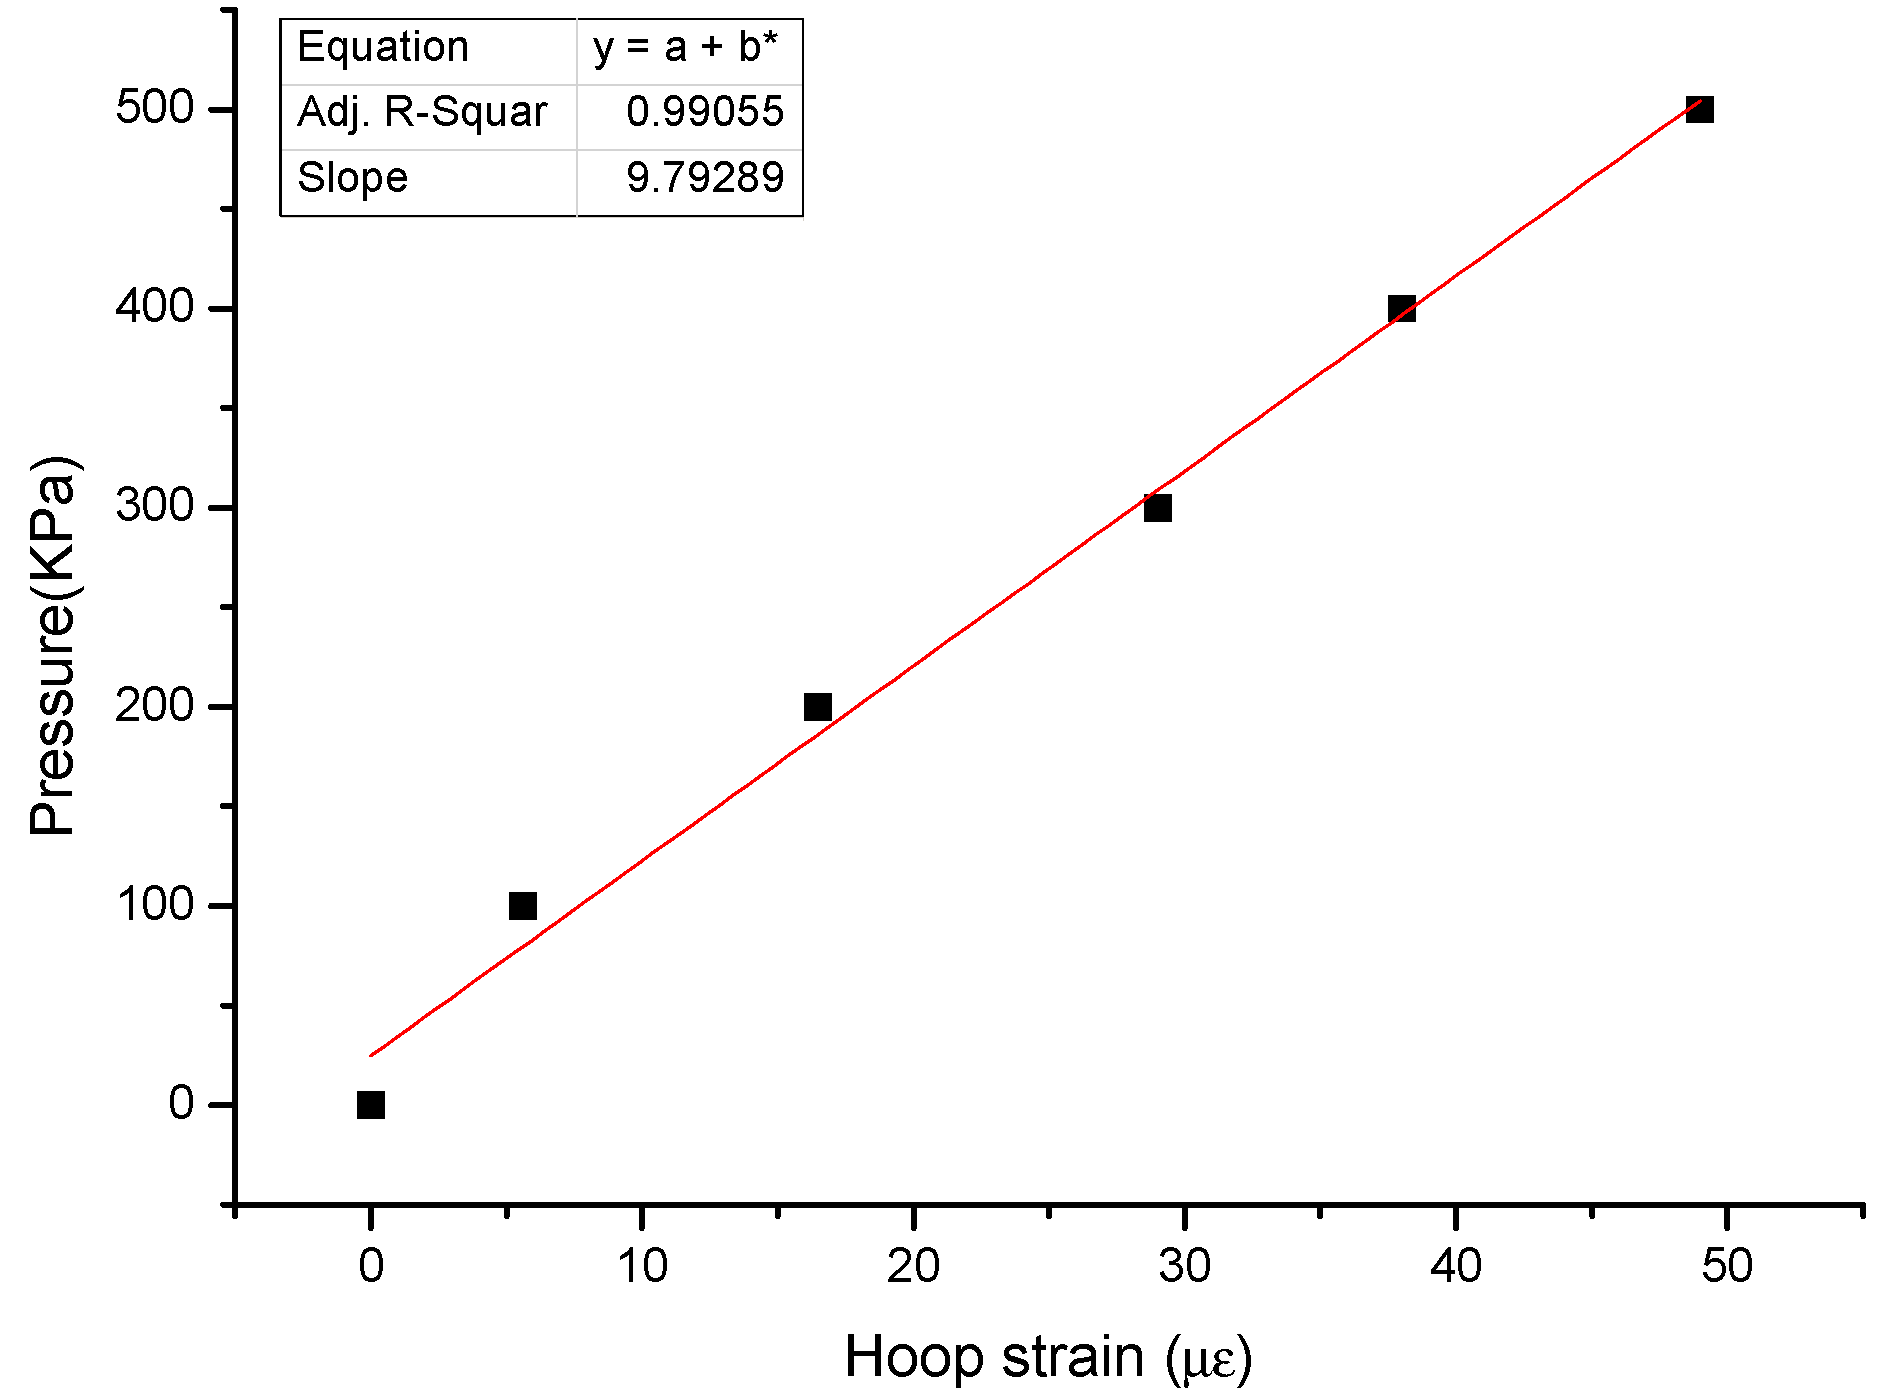
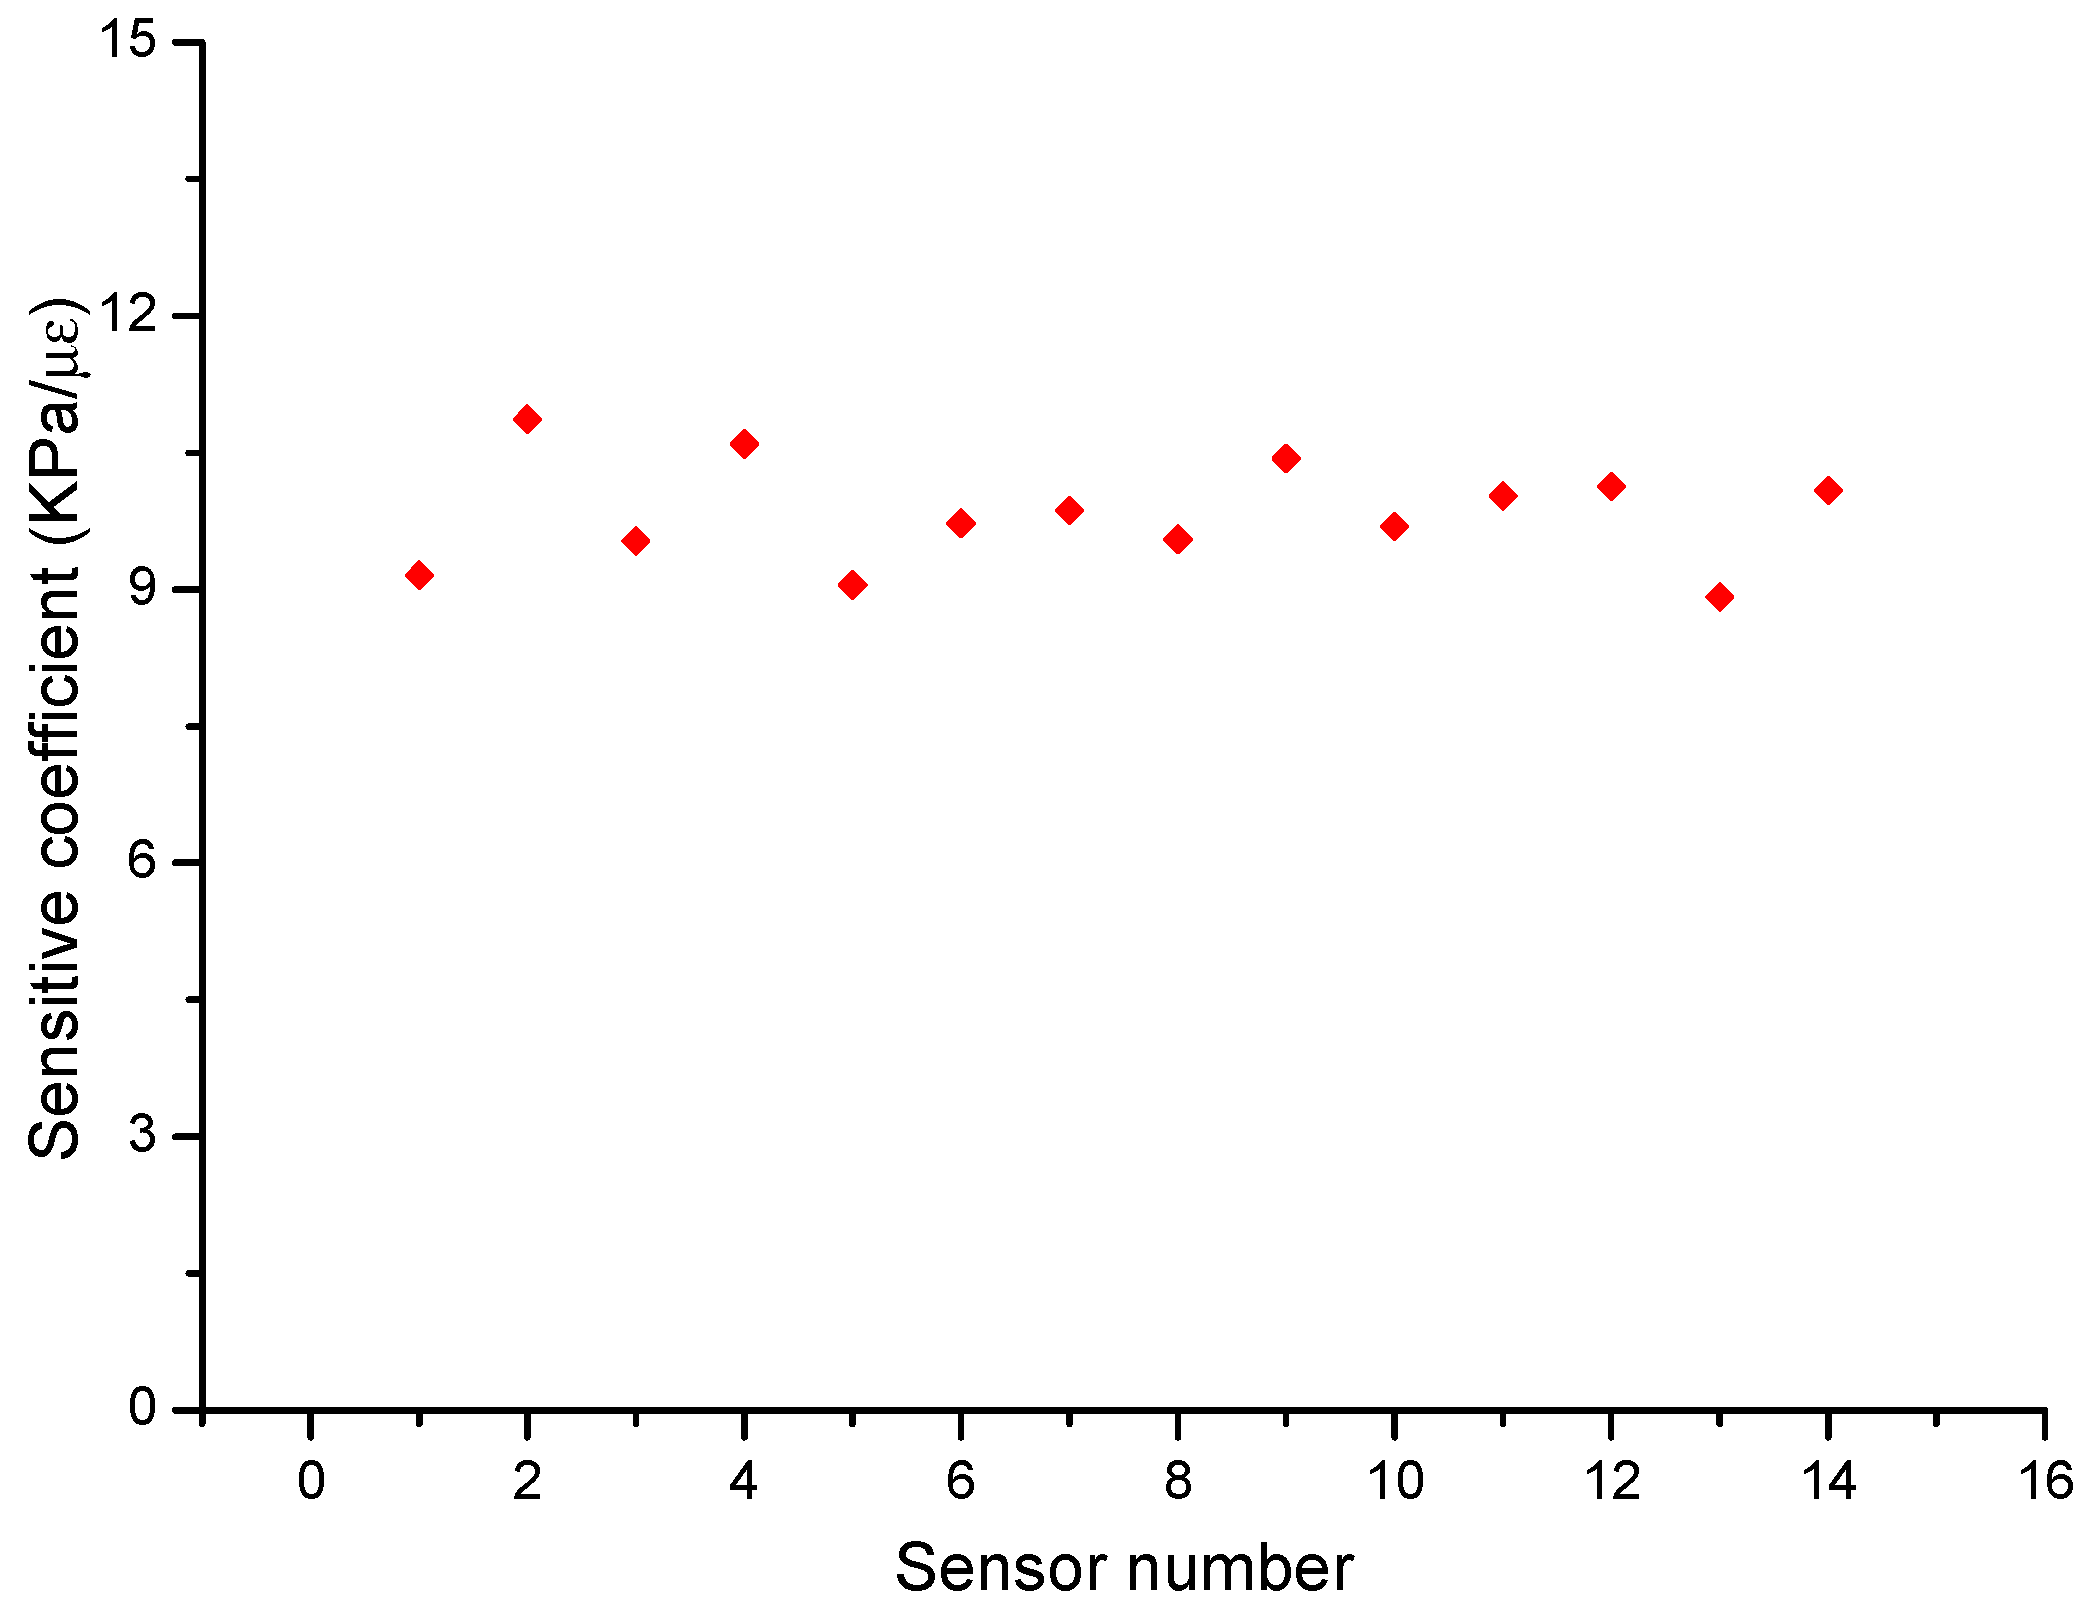
3.2. Sensor Calibration Test

To characterize the working performance of the FBG strain hoop sensor, the calibration tests were conducted on a steel pipe model with the outer diameter 219 mm and wall thickness 6 mm, which is the same as the actual pipeline used for experiment. The test model is presented in Figure 4. The internal pressure was loaded by a water pump with a maximum pressure of 1.5 MPa. During the test, the pipe model was loaded step by step continuously from 0 KPa to 500 KPa at an interval of 100 KPa.
The sensitive coefficient, reflecting the relationship between the pressure and hoop strain, is a key parameter for the FBG strain hoop sensor. As shown in Figure 5, the sensitivity coefficient of the FBG strain hoop sensors is 9.79 KPa/με and the hoop strain measured by the FBG strain hoop sensor is linear to the inner pressure from the first to the fifth load step, demonstrating that the FBG strain hoop sensor is sensitive to the pressure variation. Therefore, leakage monitoring is viable based on an FBG strain hoop sensor. Fourteen FBG strain hoop sensors’ sensitive coefficients were extracted and shown in Figure 6. Obviously, the sensitive coefficients fluctuate around the value of 10 KPa/με, indicating that the FBG strain hoop sensor has stable performance since the packaging mechanism of the sensor has no adverse effect on the hoop strain measurement.

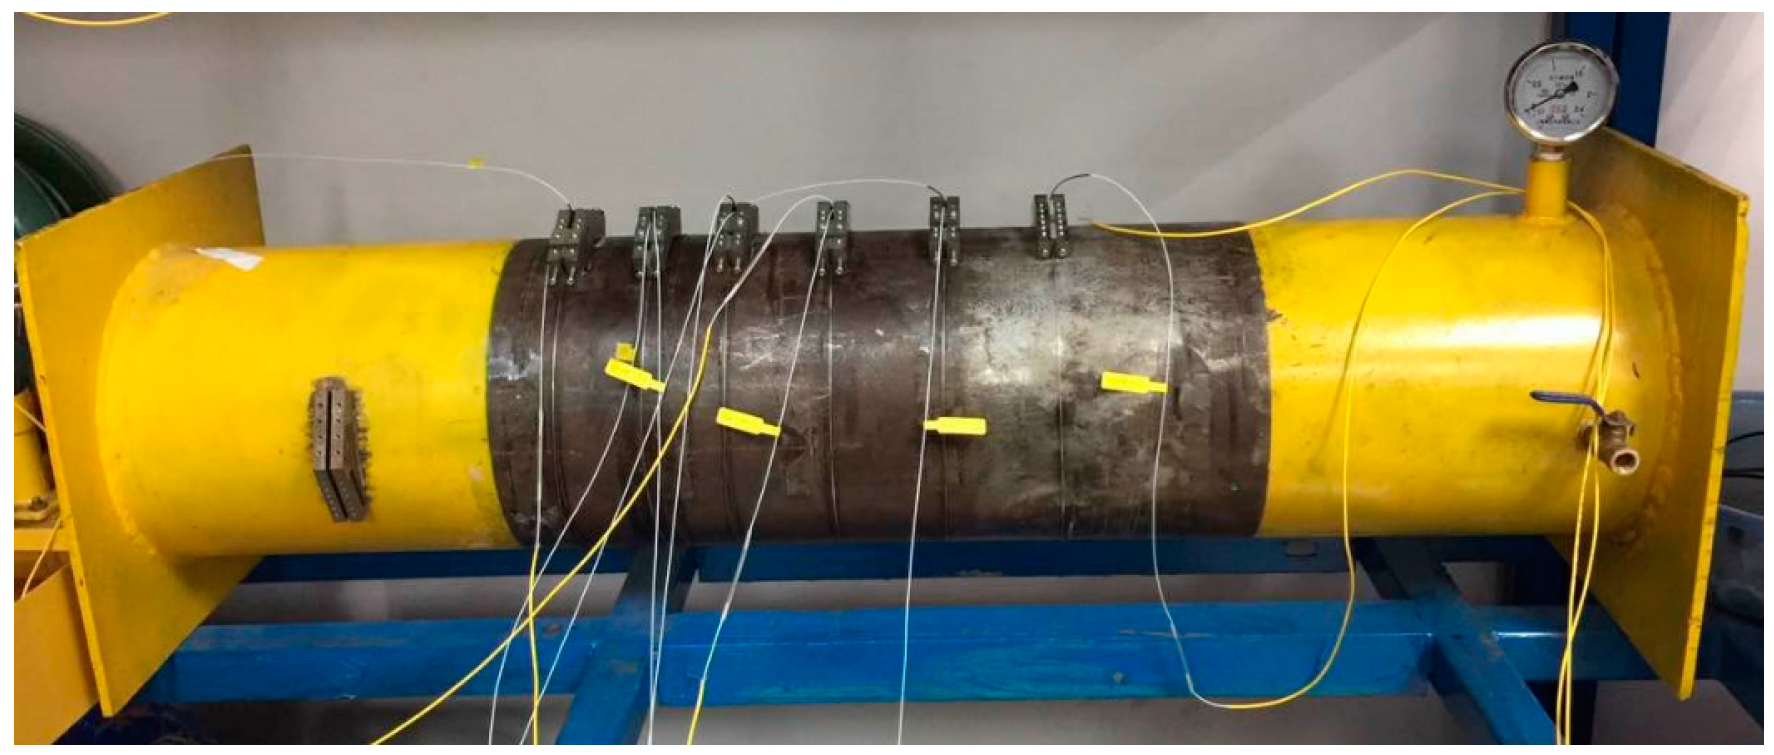
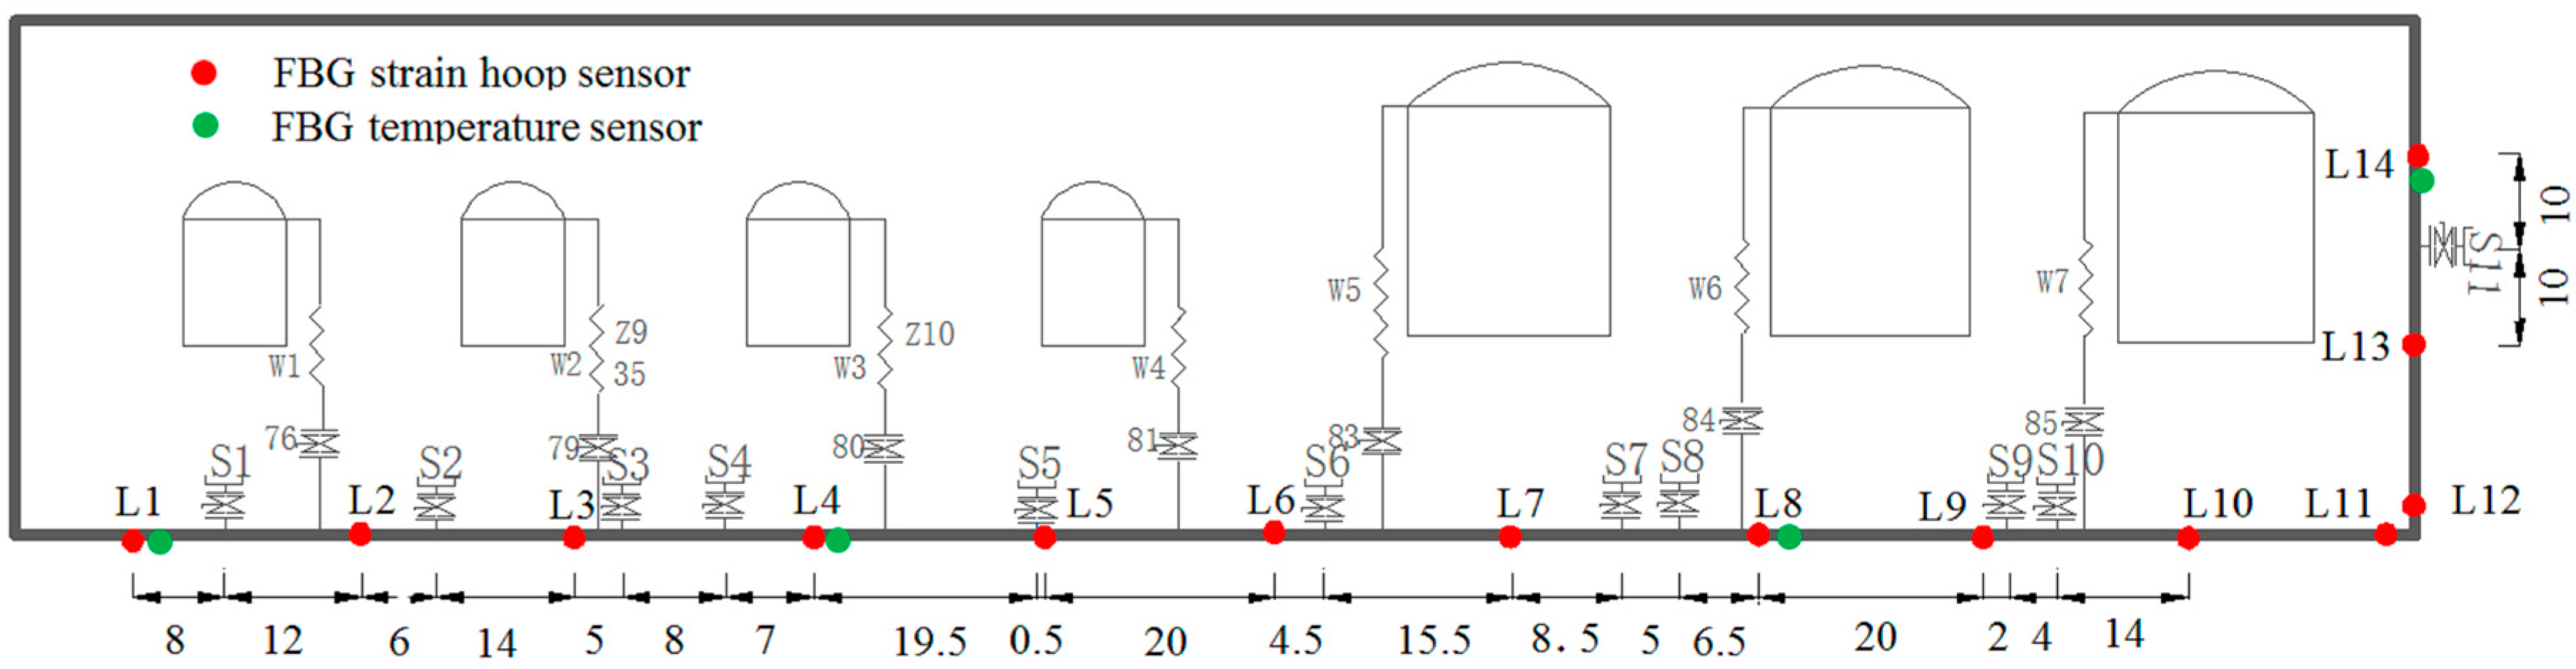
4. Experimental Pipeline and Sensor Installation

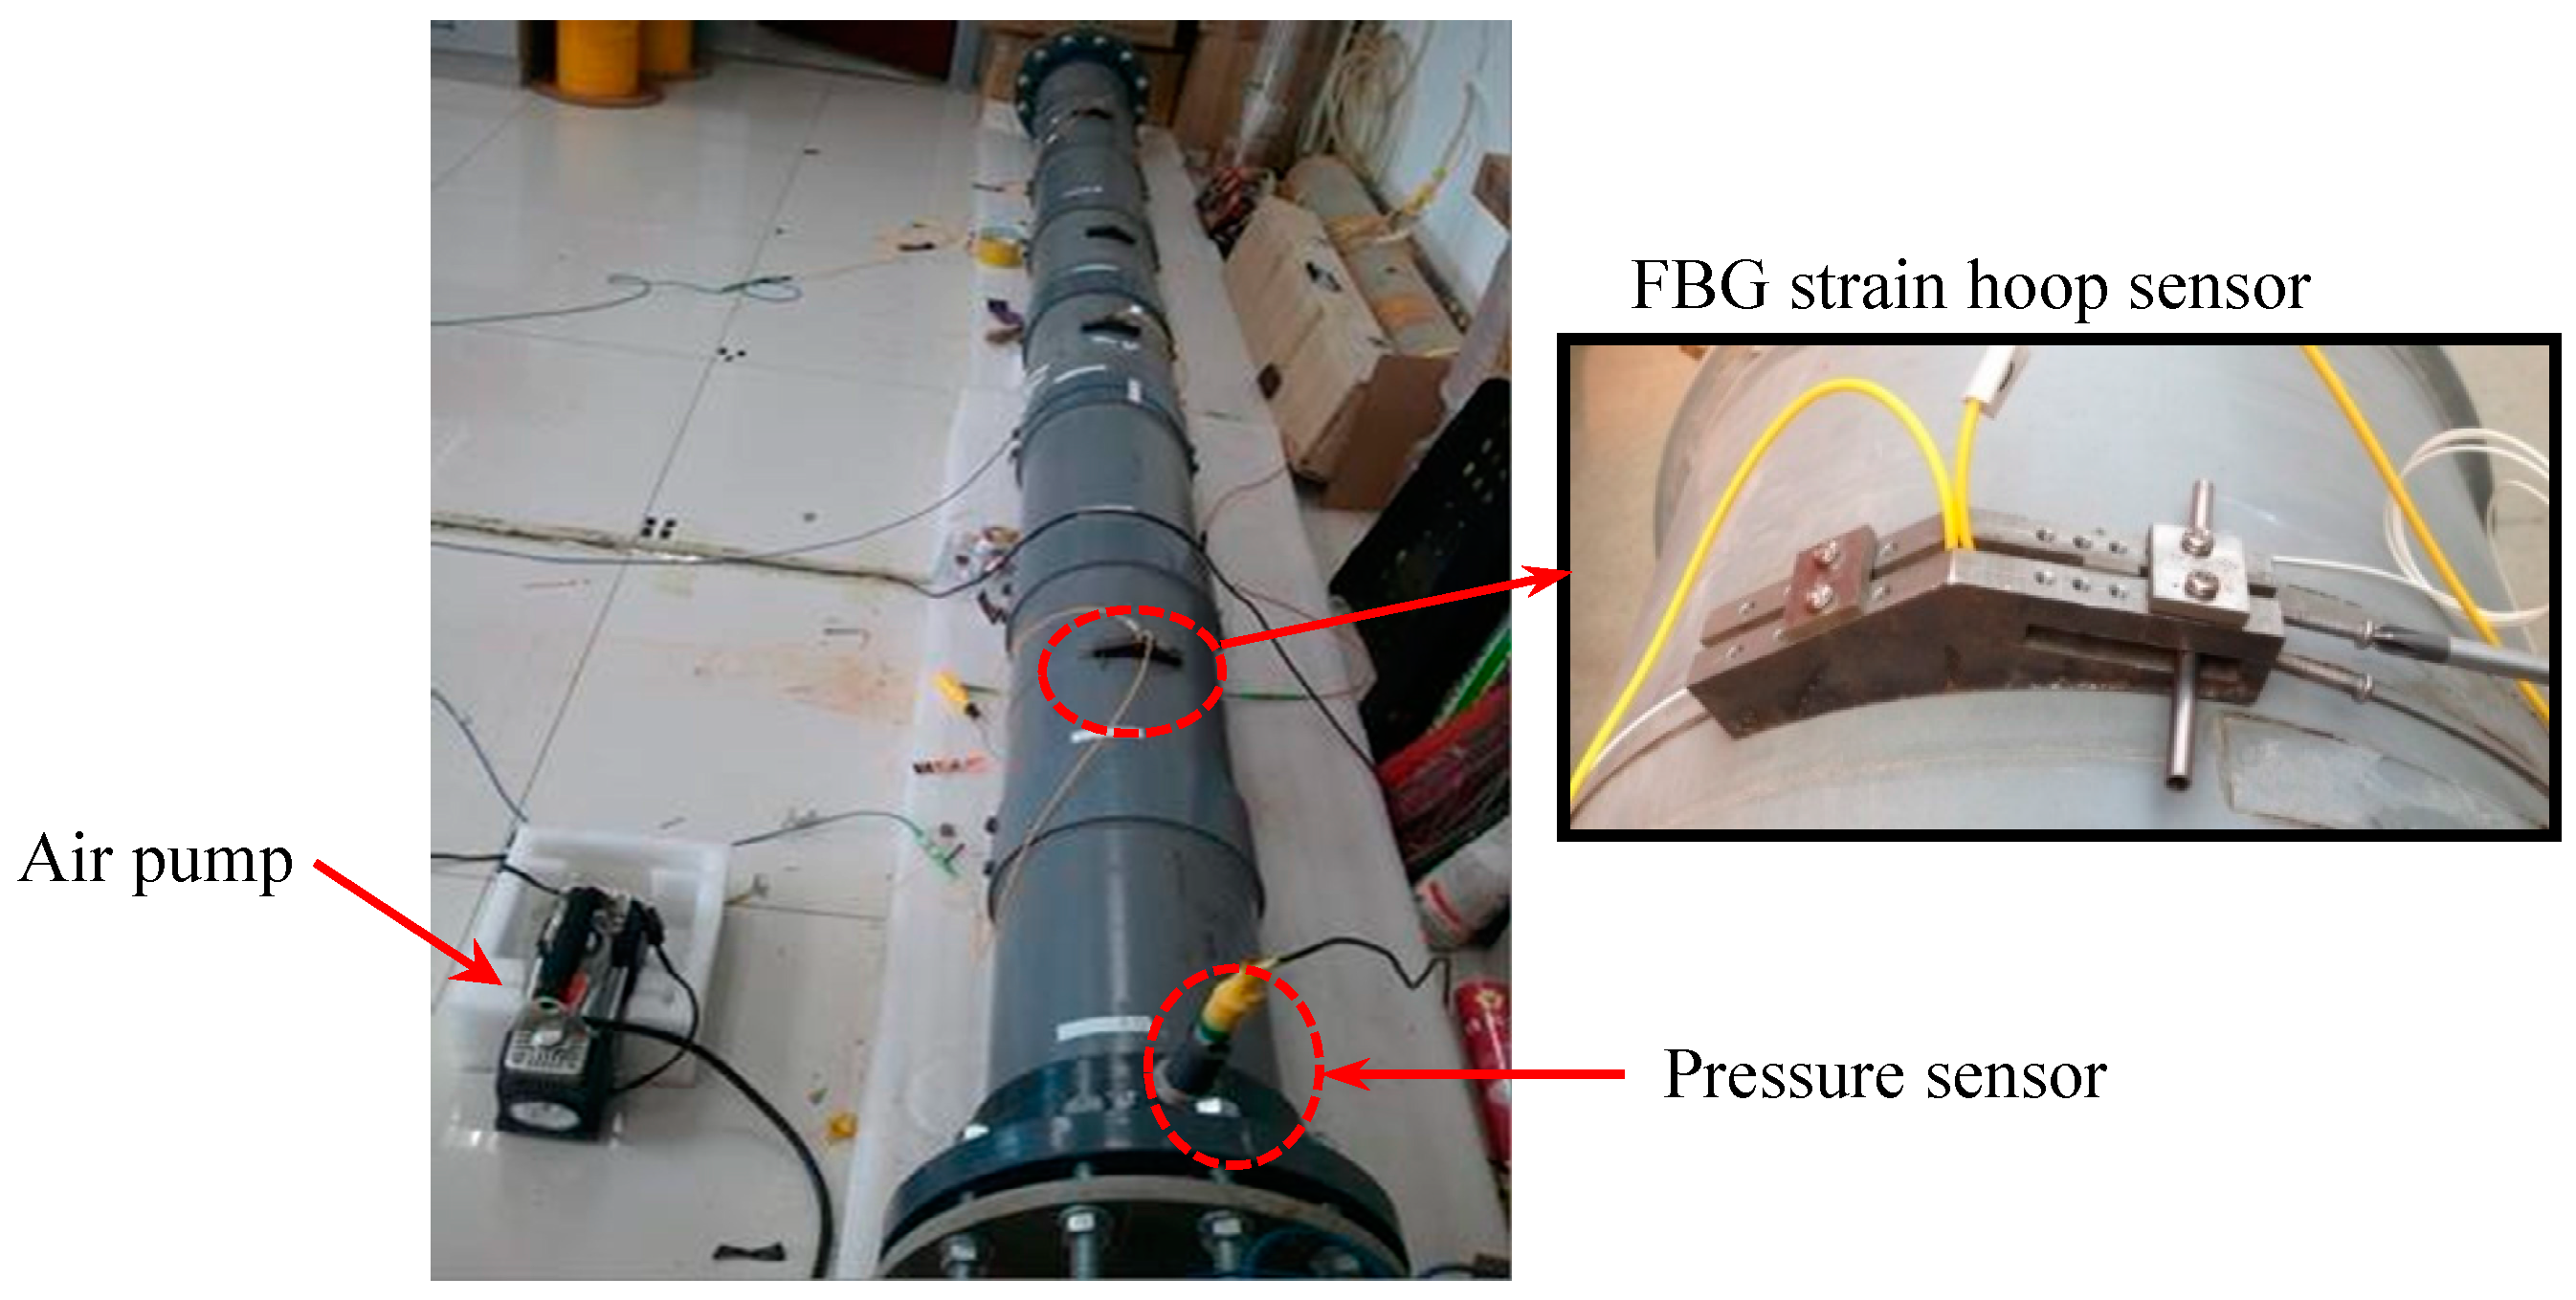
4.1. Experimental Pipeline Introduction

The pipeline leakage experiment was conducted on part of the fire-fighting pipeline with a total length of 600 m (shown in Figure 7 and Figure 8). The outer diameter and the wall thickness of the pipeline are 219 mm and 6 mm, respectively. The pipeline leakage was simulated by opening the existing valves S1–S11, whose positions are displayed in Figure 7. The actual valve is presented in Figure 8b. A fire service pump was used to load pressure into the pipeline. Fourteen FBG hoop strain sensors were mounted on the pipeline model with the same interval of 20 m, forming a sensor array (illustrated in Figure 7). It should be noted that the pipeline between sensors L1 and L14 is the experiment section with the length of 240 m. The effect of temperature on the FBG strain hoop sensor is negligible since pipeline leakage occurs within a few seconds. The four FBG temperature sensors, mounted close to the sensors L1, L4, L8 and L14, were utilized to achieve temperature compensation of the four FBG strain hoop sensors in long-term monitoring.

4.2. Sensor Installation

Before installing the FBG strain hoop sensor, a sander and abrasive paper were used to burnish the area for sensor installation, providing a smooth and uniform surface. After burnishing, the surface was cleaned by cotton immersed in alcohol. After cleaning the pipeline surface, the anchorage member was bonded on the pipeline surface. Then, the gripper block connected with the steel tube was stretched along the circumferential direction in order to make the steel tube seamlessly contact the pipe surface. After bonding the steel tube to the pipeline surface, the pre-tension system switched to stretch the gripper block connected with the optic fiber, applying pre-stress to the optic fiber. Finally, the gripper blocks at both movable end and fixed end were clamped in the anchorage member. The FBG strain hoop sensor and the anchorage member are presented in Figure 9a. To prevent the FBG strain hoop sensor from corrosion, a specially designed steel box is used to protect the pre-tension system and the FBG strain hoop sensor, as shown in Figure 9b.

5. Experimental Results

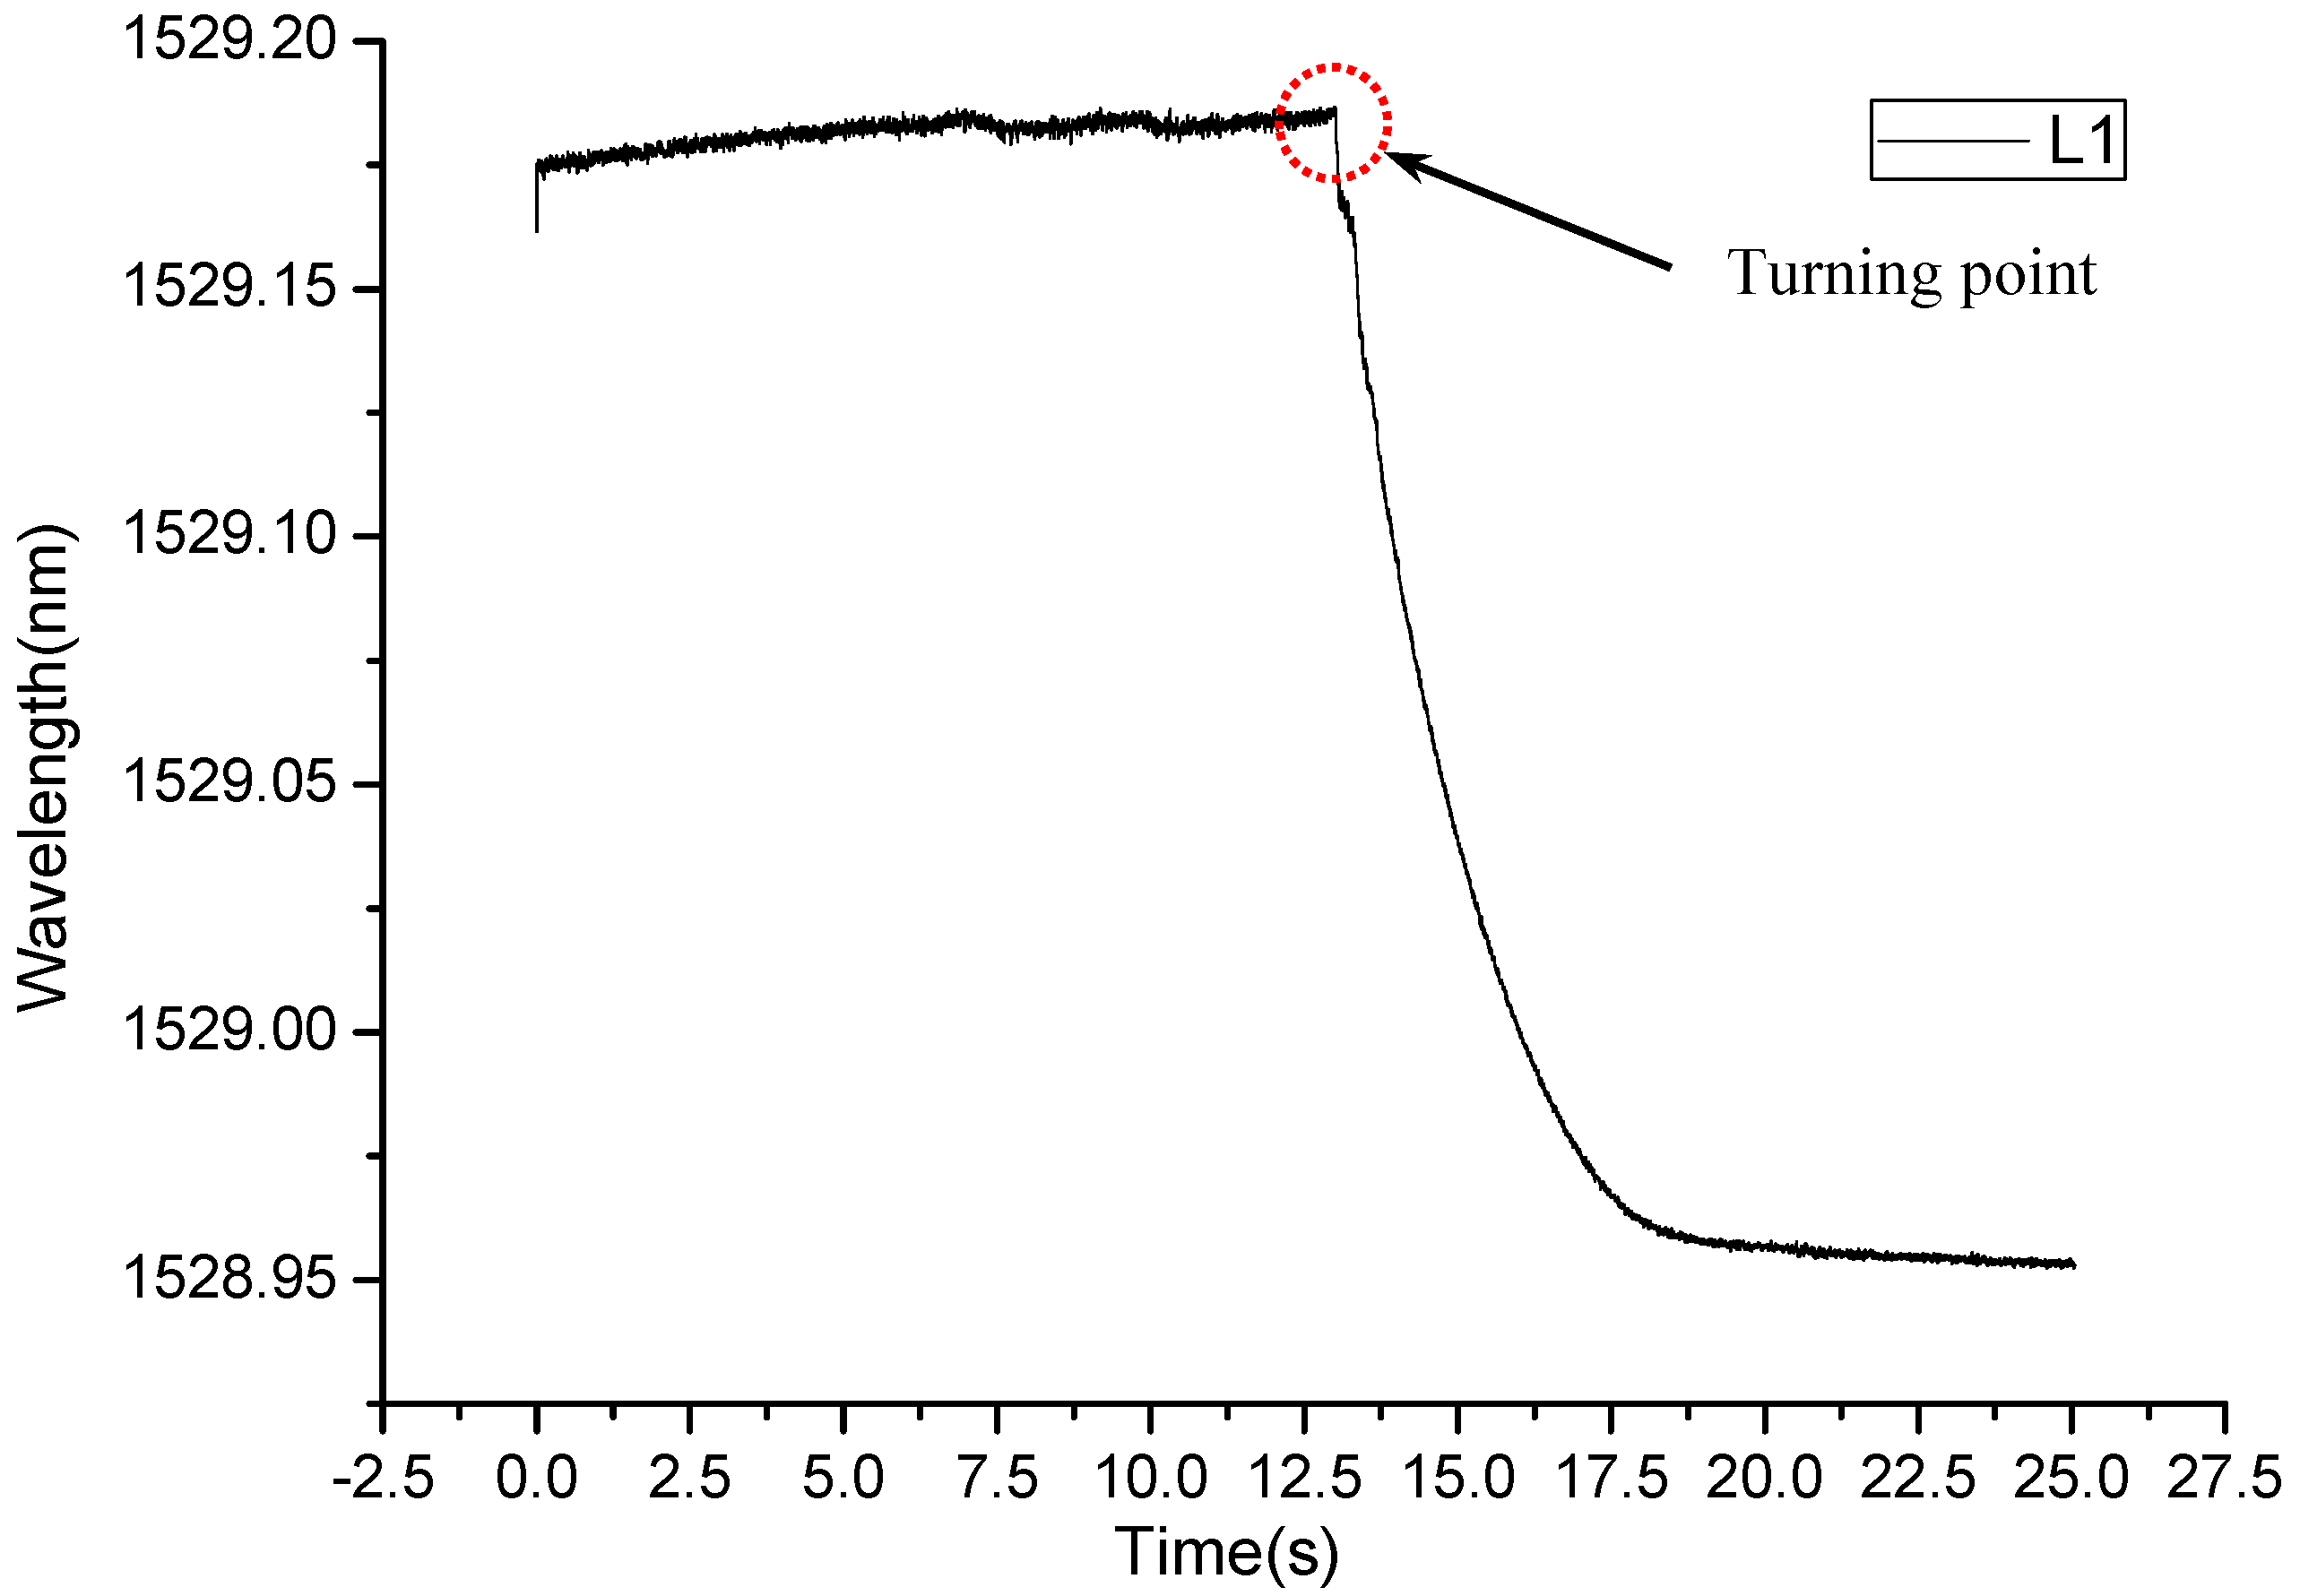
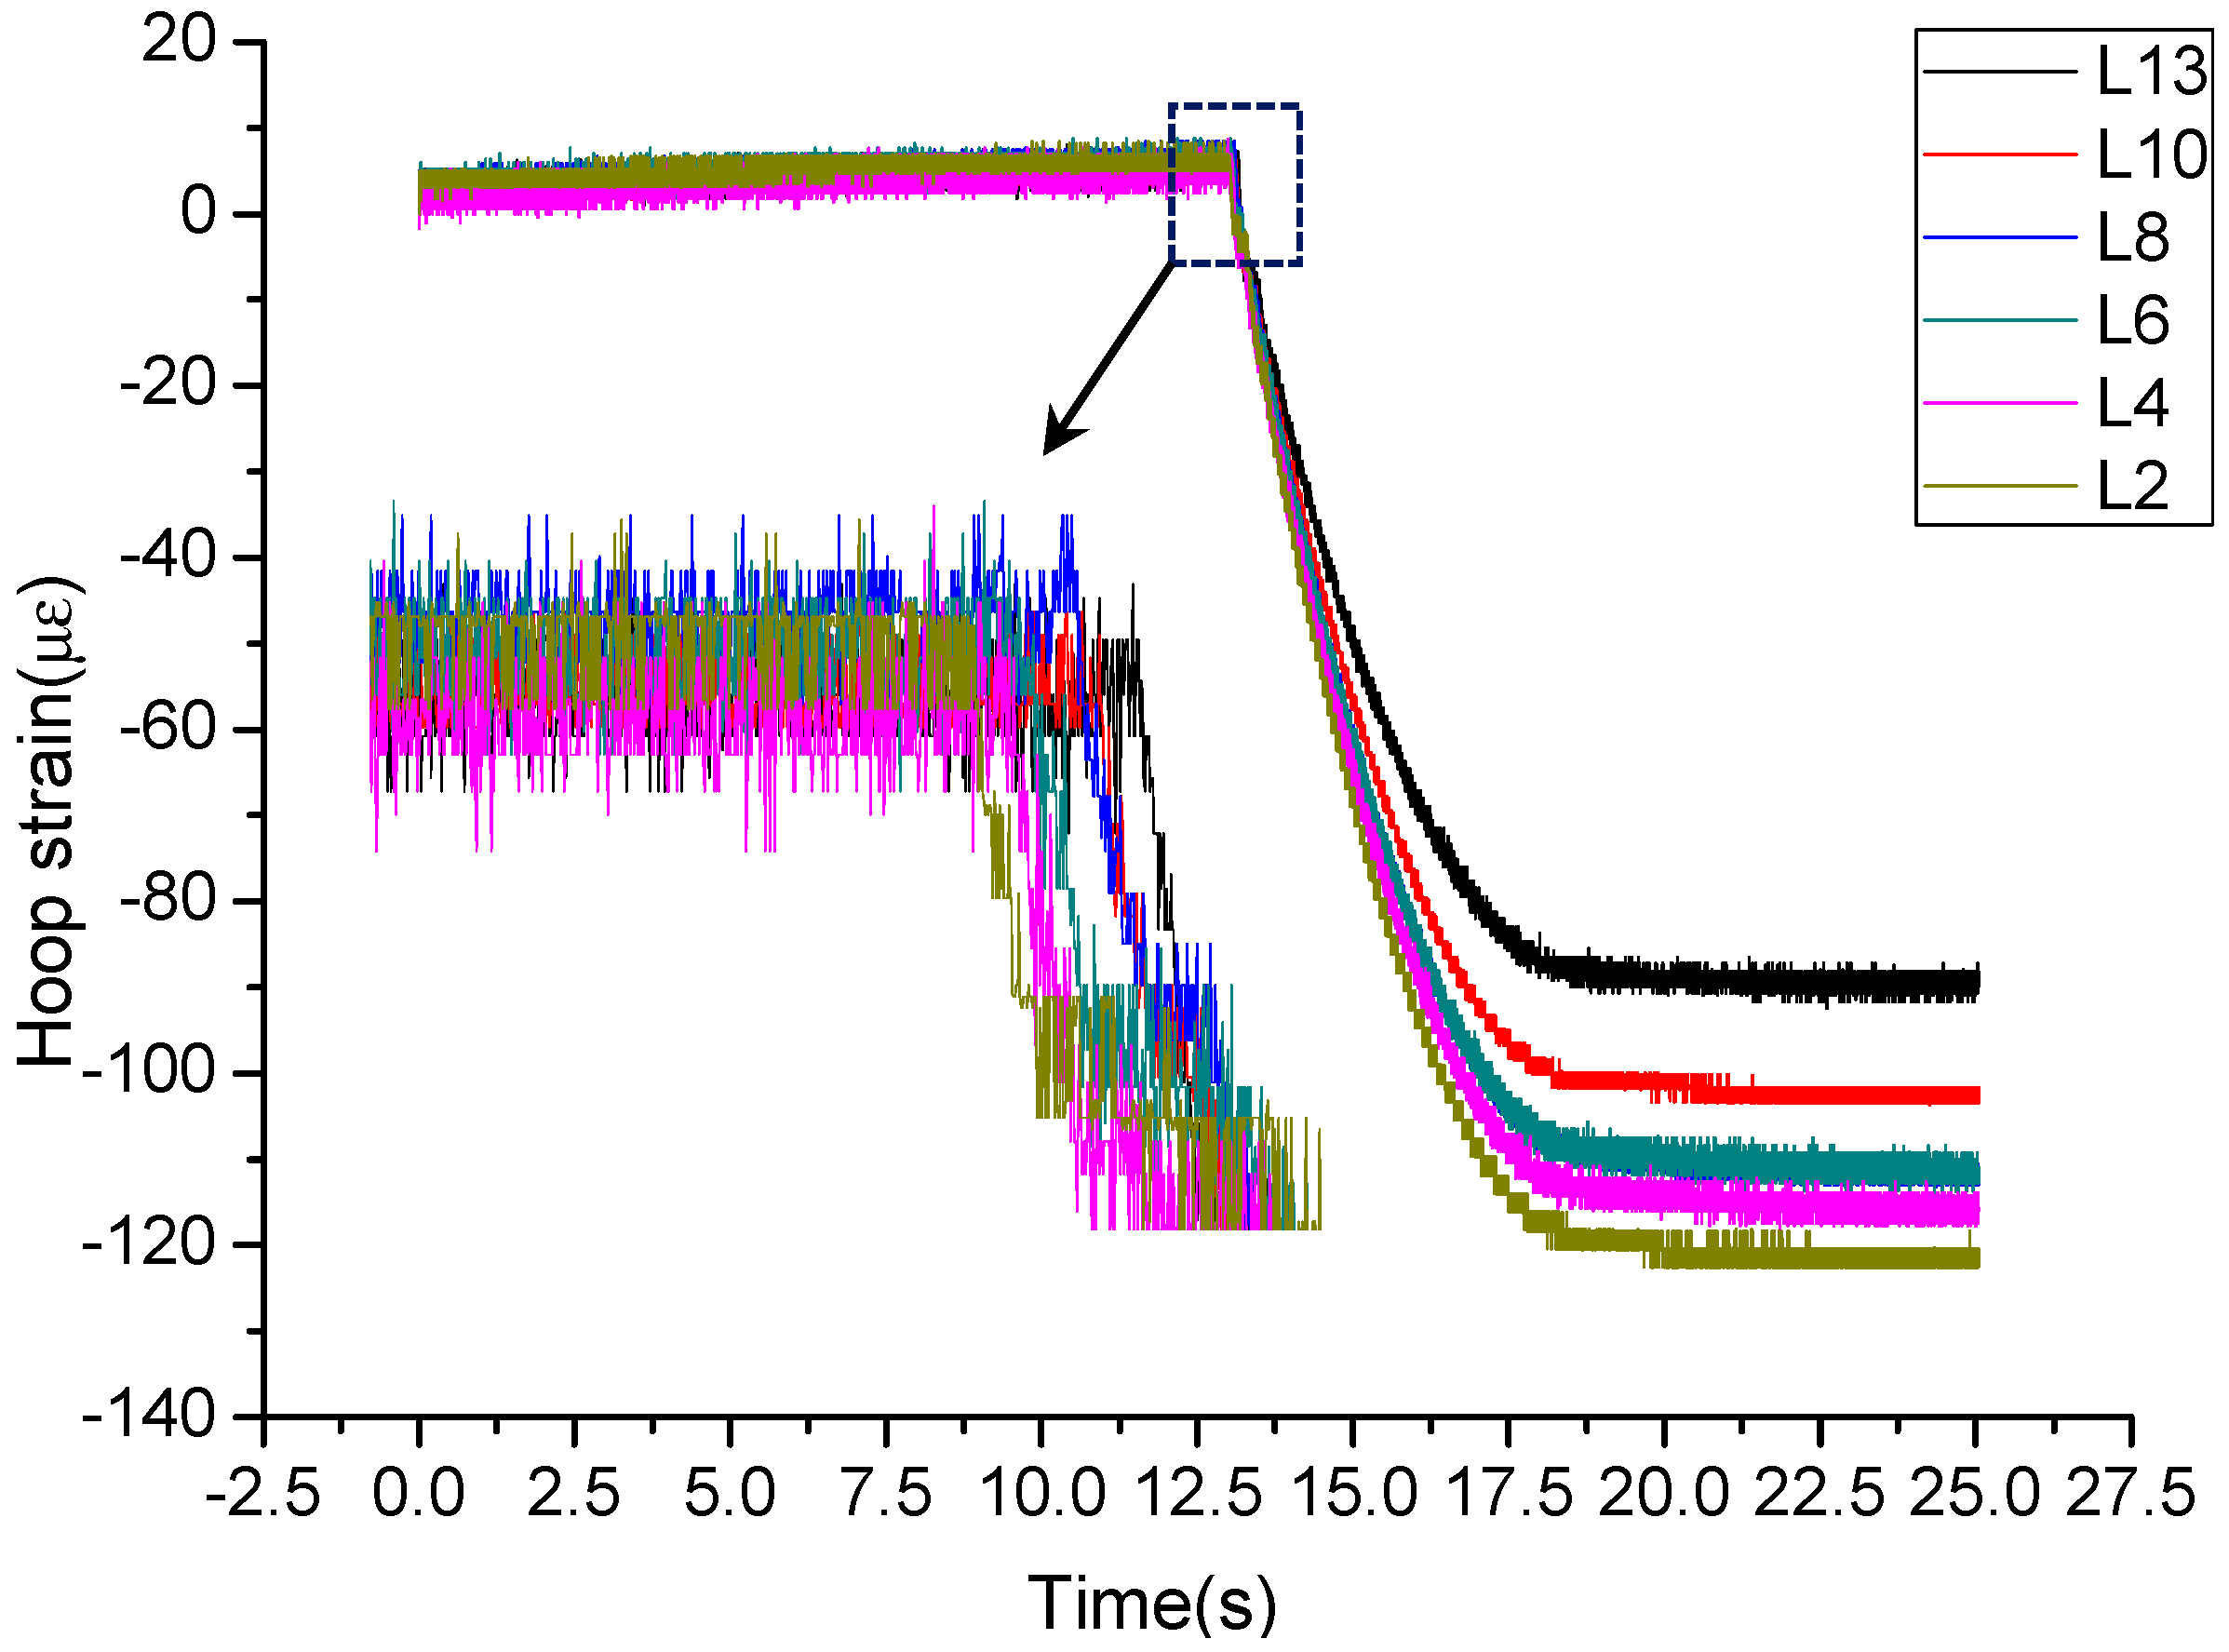
5.1. Leakage Monitoring

Due to limitations of the water pump, the actual pipeline model cannot simulate the leakage under the flow state. Prior to starting the leakage experiment, the pipeline was filled with water and pressurized to 1.2 MPa. During the leakage experiment, the inner pressure dropped from 1.2 MPa to 0 MPa by opening the valve suddenly. The Micron Optics SM130 (Micron Optics, Inc., Atlanta, GA, USA) was used to demodulate the wavelength of an FBG strain hoop sensor. The sampling rate in this leakage experiment is 1000 Hz. Figure 10 presents the wavelength variation of sensor L1 when the leakage was simulated by opening valve S1. It can be seen that the wavelength remains constant before the leakage occurrence. However, when the leakage happened, the wavelength detected by the FBG strain hoop sensor suddenly declined. This is due to the NPW propagating along the pipeline model, causing the inner pressure to suddenly drop, simultaneously leading to the hoop strain decrease. The time when the turning point (displayed in Figure 10) occurs can be considered as the arrival time of NPW. The experiment results demonstrate that the wavelength detected by the FBG strain hoop sensor can be taken as an effective indicator of leakage occurrence and the FBG strain hoop sensor is suitable for the pipeline leakage monitoring.
When leakage occurred at S1, the hoop strain variation of six sensors (L2, L4, L6, L8, L10 and L13) with the same interval of 40 m is displayed in Figure 11. Obviously, the last sensor to detect the turning point was L13, which is located the farthest from the leakage point among the six sensors. However, for sensor L2, which is located closest to the leakage point S1 among the six sensors, is the first sensor to detect the turning point. In conclusion, the closer the distance between the leakage point and the sensor, the earlier the turning point occurs. The experiment results demonstrate that NPW propagates along the pipeline model at a certain speed. The time when a turning point occurs can be considered as the arrival time of NPW. Based on the difference in time it takes for the NPW to reach the FBG strain hoop sensors, the leakage location can be calculated. Additionally, it can be seen from Figure 11 that hoop strain variation of different sensors under the same leakage is different, the amplitude of hoop strain variation decreases with the increase of the distance between the leakage point and the FBG strain hoop sensor. This phenomenon illustrates that the NPW energy attenuates gradually when NPW propagates along the pipeline, and perhaps there is a certain relationship between the NPW energy attenuation and its propagation distance. The experimental results suggest that a leakage localization method according to the NPW energy attenuation is worthy of being studied. It can also be concluded from Figure 11 that the method of leakage localization based on the NPW is limited by distance. Therefore, the principle of NPW energy attenuation will be studied comprehensively in the next stage.

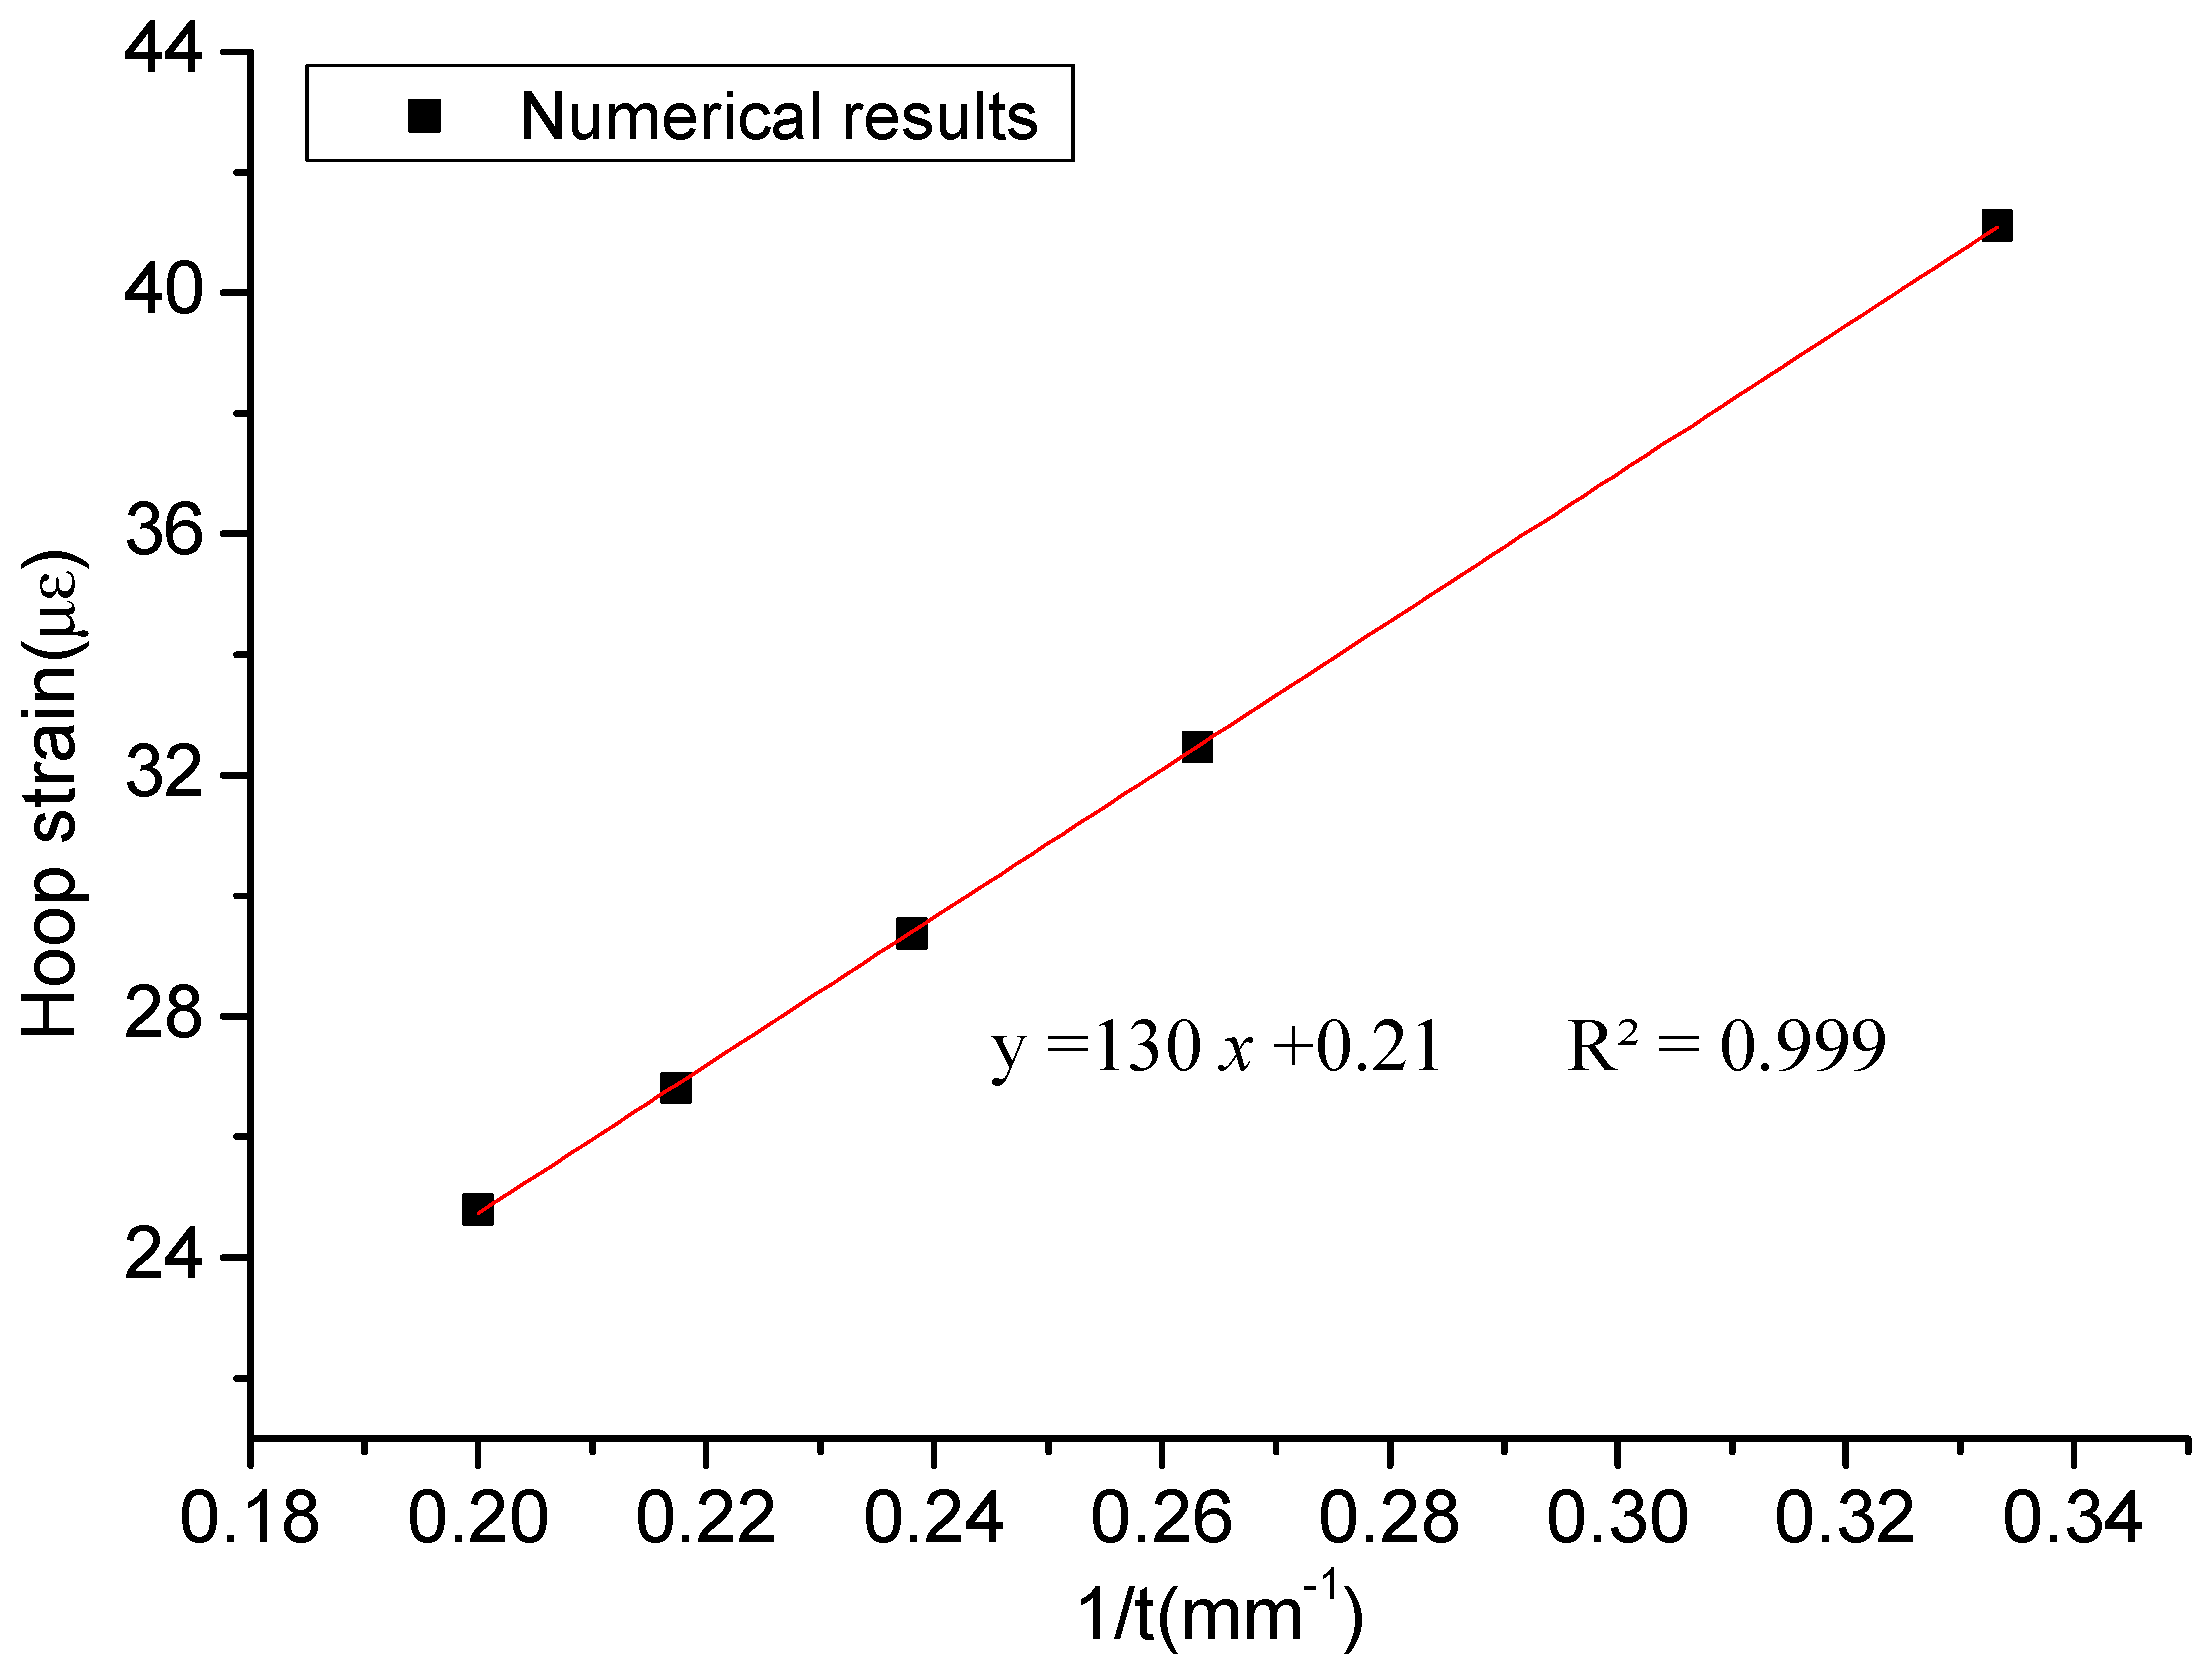
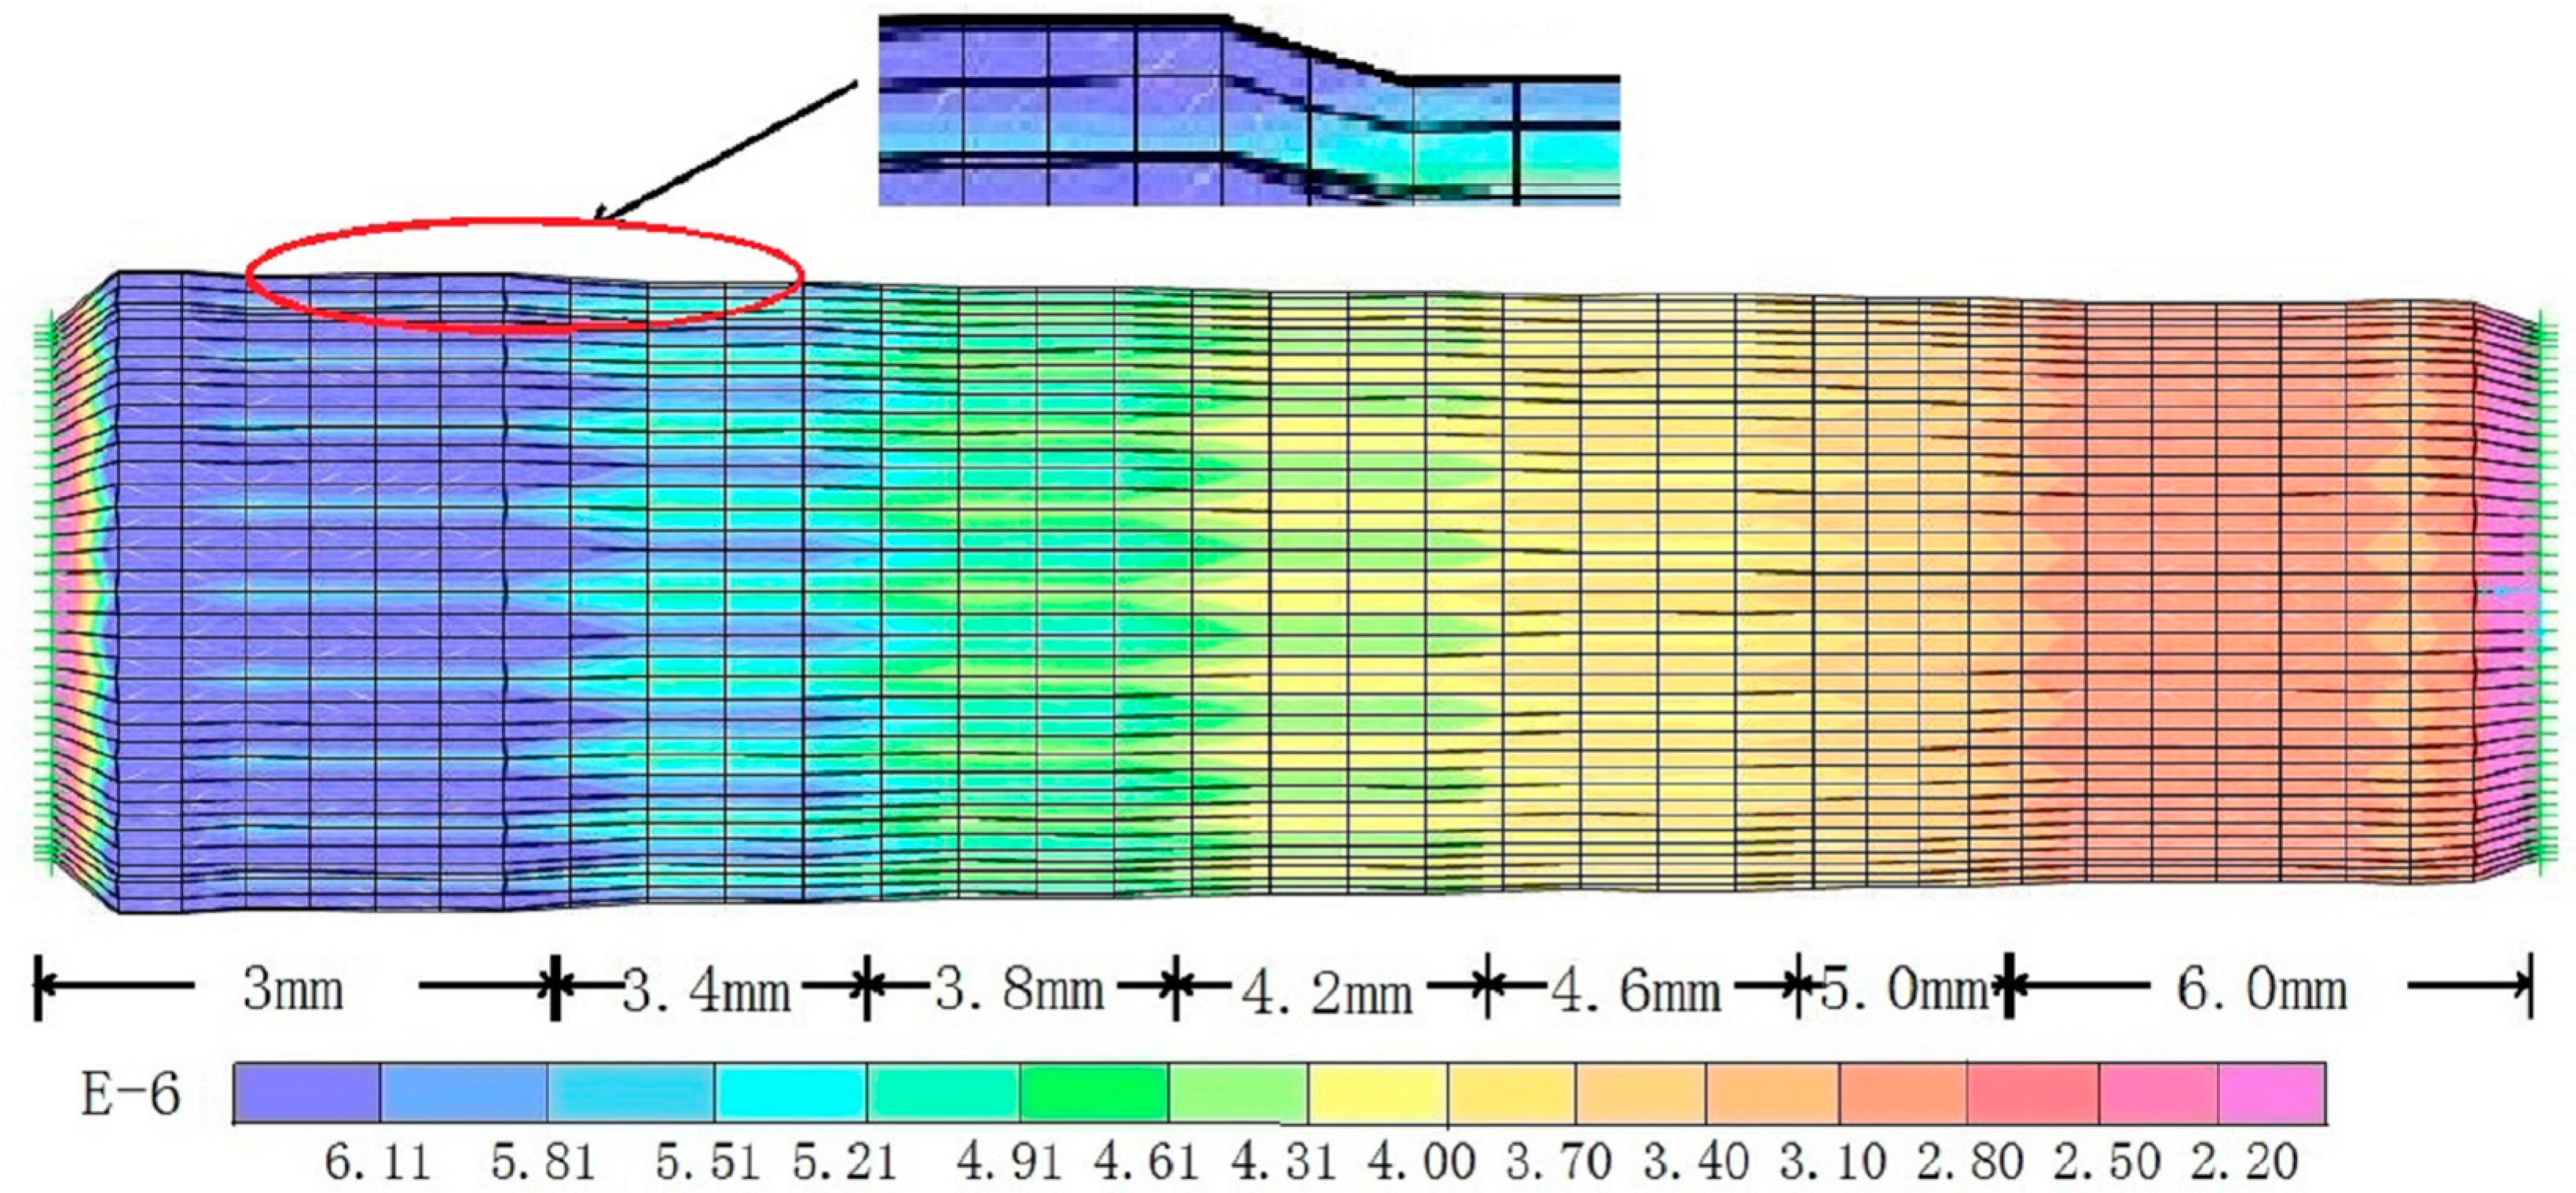
5.2. Corrosion Detection Results

Prior to a pipeline corrosion experiment, a numerical simulation using SAP2000 software was conducted to verify the pipeline corrosion monitoring theory based on hoop strain measurement. There are some basic assumptions in this numerical model: (1) the pipeline model was modeled by a shell element; (2) the material is isotropic; (3) each part with different thickness is connected to another by a rigid connection; (4) the end restraint is selected as a hinge; and (5) the elasticity modulus is 210 × 109 Pa.
The deformation nephogram generated by the SAP2000 software is shown in Figure 12 and the wall thicknesses are marked by dimensions. To be more explicit, the scaling of nephogram is taken as 2000, and the place circled in red is magnified five times. The numerical results are extracted and displayed in Figure 13. Additionally, the linear equation between the hoop strain and the wall thickness of the numerical model is established. The numerical analytical results show a linear variation of the hoop strain with a regression coefficient over 0.999, which demonstrates that the hoop strain is in inverse proportion to the wall thickness of pipeline strictly. It also can be seen that the pipeline wall extends uniformly and the circumferential deformations of the pipeline decrease according to the rise of the wall thicknesses. The numerical results proved that the corrosion monitoring theory based on hoop strain measurement is valid.
It is difficult to achieve corrosion dates from the actual pipeline model within a short time since corrosion is a long-term process. Therefore, in order to investigate the performance of a FBG strain hoop sensor in the pipeline corrosion detection, an experiment was conducted on a PVC pipeline model since the PVC material is easy to be machined. This model (shown in Figure 14) consists of seven segments with the same outer diameter of 250 mm but different wall thicknesses (e.g., 7.8 mm, 6.0 mm, 5.1 mm, 4.4 mm, 4.2 mm, 3.8 mm and 3.4 mm). The different wall thicknesses represent different uniform corrosion levels. FBG strain hoop sensors were mounted on the segments with wall thicknesses 5.1 mm, 4.4 mm, 4.2 mm, 3.8 mm and 3.4 mm, respectively. These sensors were connected to an interrogator (Micron Optics SM130) that sent data via the Ethernet to a computer. An air pump was used to provide a pressurized condition to simulate the working environment of a practical pipeline. The demodulation instrument collected data from the FBG strain hoop sensors on the PVC pipeline model with the internal pressure being loaded from 0 KPa to 50 KPa.
The hoop strain variation measured by five FBG strain hoop sensors is shown in Figure 15. Because PVC is not an absolute linear elastic material, leading to the hoop strain variation under the internal pressure is not extremely linearized. Therefore, the regression coefficient of the linear variations of the FBG strain hoop sensor is 0.975, less than 0.999. Nevertheless, hoop strain variation and wall thickness of the pipeline still present as being an inverse proportion relationship. The hoop strains measured by the FBG strain hoop sensors give the sensitivity 1767 με/mm for the PVC pipeline model, proving that the FBG strain hoop sensors are sensitive to the hoop strain variations caused by corrosion. Therefore, considering the good performance of the FBG strain hoop sensor in the experimental results, the hoop strain measured by the FBG strain hoop sensor can reflect the corrosion degree accurately.

6. Conclusions

A method, based on hoop strain measurement, was proposed to detect pipeline corrosion and leakage simultaneously. With the advantages of high sensitivity, good electrical-magnetic immunity and chemical stability, an FBG strain hoop sensor was developed for the pipeline monitoring. Two model experiments including corrosion and leakage were conducted to verify the method and test the performance of this sensor. The leakage simulation experiment proved that a turning point arose due to the NPW propagate along the pipeline. Meanwhile, pipeline leakage can be detected by the FBG strain hoop sensor. According to the corrosion experiment, FBG strain hoop sensors were demonstrated to be sensitive to the hoop strain variations caused by corrosion. It can be concluded from the two experiments that the pipeline leakage and corrosion monitoring method based on hoop strain measurement are practicable. Further investigation will be conducted to study the leakage monitoring of the gas pipeline and improve the sensitivity of the FBG strain hoop sensor.

Acknowledgments

This work has been supported by the National Key Research and Development Program of China (Grant No. 2016YFC0701107), the Fund of the National Natural Science Foundation of China (Grant Nos. 51421064, 51327003, 51678109 and 51608094). These grants are greatly appreciated.

Author Contributions

Tao Jiang performed the experiments and wrote the paper; Liang Ren and Tao Jiang conceived and designed the experiments; Ziguang Jia analyzed the data; Dongsheng Li and Hongnan Li made constructive comments on the experiments and paper writing.

Conflicts of Interest

The authors declare no conflict of interest.

References

  1. Laurentys, C.; Bomfim, C.; Menezes, B.; Caminhas, W. Design of a pipeline leakage detection using expert system: A novel approach. Appl. Soft Comput. 2011, 11, 1057–1066. [Google Scholar] [CrossRef]
  2. Frings, J.; Walk, T. Distributed fiber optic sensing enhances pipeline safety and security. Oil Gas Eur. Mag. 2011, 3, 132–136. [Google Scholar]
  3. Bartolini, C.; Cioccolanti, L.; Comodi, G.; Caresana, F. Distributed stirling engines for pipeline corrosion protection. In Proceedings of the 15th International Stirling Engine Conference, Dubrovnik, Croatia, 27–29 September 2012. [Google Scholar]
  4. Skjelvareid, M.; Birkelund, Y.; Larsen, Y. Internal pipeline inspection using virtual source synthetic aperture ultrasound imaging. NDT E Int. 2013, 54, 151–158. [Google Scholar] [CrossRef]
  5. Tavakoli, M.; Marques, L.; de Almeida, A. Development of an industrial pipeline inspection robot. Ind. Robot Int. J. 2010, 37, 309–322. [Google Scholar] [CrossRef]
  6. Kwon, Y.; Yi, B. Design and motion planning of a two-module collaborative indoor pipeline inspection robot. IEEE Trans. Robot. 2012, 28, 681–696. [Google Scholar] [CrossRef]
  7. Murayama, R.; Makiyama, S.; Kodama, M.; Taniguchi, Y. Development of an ultrasonic inspection robot using an electromagnetic acoustic transducer for a Lamb wave and an SH-plate wave. Ultrasonics 2004, 42, 825–829. [Google Scholar] [CrossRef] [PubMed]
  8. Sun, Z.; Wang, P.; Vuran, M.; Al-Rodhaan, M.; Al-Dhelaan, A.; Akyildiz, I. MISE-PIPE: Magnetic induction-based wireless sensor networks for underground pipeline monitoring. Ad Hoc Netw. 2011, 9, 218–227. [Google Scholar] [CrossRef]
  9. Li, H.N.; Li, D.S.; Song, G.B. Recent applications of fiber optic sensors to health monitoring in civil engineering. Eng. Struct. 2004, 26, 1647–1657. [Google Scholar] [CrossRef]
  10. Grosswig, S.; Graupner, A.; Hurtig, E.; Kühn, K.; Trostel, A. Distributed fibre optical temperature sensing technique—A variable tool for monitoring tasks. In Proceedings of the 8th International Symposium on Temperature and Thermal Measurements in Industry and Science, Berlin, Germany, 19–21 June 2001. [Google Scholar]
  11. Niklès, M.; Vogel, B.; Briffod, F.; Grosswig, S.; Sauser, F.; Luebbecke, S.; Pfeiffer, T. Leakage detection using fiber optics distributed temperature monitoring. Smart Struct. Mater. 2004, 18–25. [Google Scholar] [CrossRef]
  12. Zou, L.; Sezerman, O.; Revie, W. Pipeline corrosion monitoring by fiber optic distributed strain and temperature sensors. In Proceedings of the NACE International Corrosion Conference and Expo, New Orleans, LA, USA, 16–20 March 2008. [Google Scholar]
  13. Alhandawi, K.; Vahdati, N.; Shiryayev, O.; Lawand, L. Corrosion monitoring along infrastructures using distributed fiber optic sensing. In Proceedings of the SPIE Smart Structures and Materials + Nondestructive Evaluation and Health Monitoring, Las Vegas, NV, USA, 20–24 March 2016. [Google Scholar]
  14. Li, W.; Bao, X. High Spatial Resolution Distributed Fiber Optic Technique for Strain and Temperature Measurements in Concrete Structures. In Proceedings of the International Workshop on Smart Materials, Structures NDT in Canada 2013 Conference & NDT for the Energy Industry, Calgary, AB, Canada, 7–10 October 2013. [Google Scholar]
  15. Li, H.; Yi, T.; Ren, L.; Li, D.; Huo, L. Reviews on innovations and applications in structural health monitoring for infrastructures. Struct. Monit. Maint. 2014, 1, 1–45. [Google Scholar] [CrossRef]
  16. Ren, L.; Jia, Z.; Li, H.; Song, G. Design and experimental study on FBG hoop-strain sensor in pipeline monitoring. Opt. Fiber Technol. 2014, 20, 15–23. [Google Scholar] [CrossRef]
  17. Jia, Z.; Ren, L.; Li, H.; Ho, S.; Song, G. Experimental study of pipeline leak detection based on hoop strain measurement. Struct. Control Health Monit. 2015, 22, 799–812. [Google Scholar] [CrossRef]
  18. Felli, F.; Paolozzi, A.; Vendittozzi, C.; Paris, C.; Asanuma, H. Use of FBG sensors for health monitoring of pipelines. In Proceedings of the SPIE Smart Structures and Materials + Nondestructive Evaluation and Health Monitoring, Las Vegas, NV, USA, 20–24 March 2016. [Google Scholar]
  19. Zhou, J.; Sun, L.; Li, H. Study on dynamic response measurement of the submarine pipeline by full-term FBG sensors. Sci. World J. 2014, 2014. [Google Scholar] [CrossRef] [PubMed]
  20. Lee, H.; Sohn, H. Damage detection for pipeline structures using optic-based active sensing. Smart Struct. Syst. 2012, 9, 461–472. [Google Scholar] [CrossRef]
  21. Hou, Q.; Jiao, W.; Zhan, S.; Ren, L.; Jia, Z. Natural gas pipeline leakage detection based on FBG strain sensor. In Proceedings of the Fifth International Conference on Measurements and Mechatronics Automation, Hong Kong, China, 16–17 January 2013. [Google Scholar]
Figure 1. Schematic diagram of a fiber Bragg grating (FBG) strain hoop sensor.
Applsci 07 00540 g001
Figure 2. Photo of FBG strain hoop sensor.
Applsci 07 00540 g002
Figure 3. Photo of pre-tension system.
Applsci 07 00540 g003
Figure 4. A pipeline model used for a calibration test.
Applsci 07 00540 g004
Figure 5. Relationship between the pressure and hoop strain.
Applsci 07 00540 g005
Figure 6. Calibration test results.
Applsci 07 00540 g006
Figure 7. Schematic diagram of pipeline model and sensor position.
Applsci 07 00540 g007
Figure 8. Picture of actual pipeline; (a) pipeline; (b) valve.
Applsci 07 00540 g008
Figure 9. FBG strain sensor monuted on pipeline surface: (a) FBG strain hoop sensor and anchorage member; (b) steel box.
Applsci 07 00540 g009
Figure 10. Wavelength responses induced by leakage point S1.
Applsci 07 00540 g010
Figure 11. Hoop strain responses induced by leakage point S1.
Applsci 07 00540 g011
Figure 12. The deformation Nephogram generated by SAP2000 software.
Applsci 07 00540 g012
Figure 13. Hoop strain extracted from numerical results.
Applsci 07 00540 g013
Figure 14. Photo of the PVC pipeline model.
Applsci 07 00540 g014
Figure 15. Results of the corrosion simulation experiment.
Applsci 07 00540 g015

