Article

Split-And-Delay Unit for FEL Interferometry in the XUV Spectral Range

by
Sergey Usenko
1,2,
Andreas Przystawik
1,
Leslie Lamberto Lazzarino
3,
Markus Alexander Jakob
2,3,
Florian Jacobs
3,
Christoph Becker
3,
Christian Haunhorst
4,
Detlef Kip
4 and
Tim Laarmann
1,2,*
1
Photon Science Division, Deutsches Elektronen-Synchrotron DESY, 22607 Hamburg, Germany
2
The Hamburg Centre for Ultrafast Imaging CUI, 22761 Hamburg, Germany
3
Department of Physics, University of Hamburg, 22761 Hamburg, Germany
4
Faculty of Electrical Engineering, Helmut Schmidt University, 22043 Hamburg, Germany
*
Author to whom correspondence should be addressed.
Appl. Sci. 2017, 7(6), 544; https://doi.org/10.3390/app7060544
Submission received: 29 March 2017 / Revised: 5 May 2017 / Accepted: 22 May 2017 / Published: 25 May 2017
(This article belongs to the Special Issue X-Ray Free-Electron Laser)

Abstract

:
In this work we present a reflective split-and-delay unit (SDU) developed for interferometric time-resolved experiments utilizing an (extreme ultraviolet) XUV pump–XUV probe scheme with focused free-electron laser beams. The developed SDU overcomes limitations for phase-resolved measurements inherent to conventional two-element split mirrors by a special design using two reflective lamellar gratings. The gratings produce a high-contrast interference signal controlled by the grating displacement in every diffraction order. The orders are separated in the focal plane of the focusing optics, which enables one to avoid phase averaging by spatially selective detection of a single interference state of the two light fields. Interferometry requires a precise relative phase control of the light fields, which presents a challenge at short wavelengths. In our setup the phase delay is determined by an in-vacuum white light interferometer (WLI) that monitors the surface profile of the SDU in real time and thus measures the delay for each laser shot. The precision of the WLI is 1 nm as determined by optical laser interferometry. In the presented experimental geometry it corresponds to a time delay accuracy of 3 as, which enables phase-resolved XUV pump–XUV probe experiments at free-electron laser (FEL) repetition rates up to 60 Hz.

1. Introduction

The recent fast development of table-top high harmonic generation (HHG) [1,2] and free-electron laser (FEL) light sources [3,4,5] made short and intense light pulses available in the extreme ultraviolet (XUV) and soft X-ray wavelength ranges. This opens new opportunities for ultrafast science, in particular new time-resolved studies. Currently, FELs have two major advantages over HHG sources: the wavelength tunability and the high intensity. Multidimensional spectroscopy [6], coherent control [7] and coherent nonlinear optics [8] require multiple intense pulses in the XUV or soft X-ray spectral range with a precisely defined relative phase.
The simplest interferometric experiment requires two phase-locked light fields. A sequence of two phase-locked pulses can either be directly generated or produced from a single pulse by physical manipulation of the beam using a beam splitter and a delay stage. Direct generation and attosecond control of phase-locked pulse sequences were recently demonstrated at a seeded FEL [9,10]. Nevertheless, mechanical split-and-delay units (SDUs) offer a number of advantages over the direct methods. The first advantage of SDUs lies in their versatility as they are not tied to a particular light source, making the experimental setup more flexible and mobile. The second advantage is a wide continuous range of the pulse replica delays SDUs can provide. Today, the direct methods are limited to either very short (<1 fs) [9] or relatively long (>300 fs) pulse delays [10]. This leaves uncovered a large 0.3–300 fs gap interesting for investigation of ultrafast dynamics of light–matter interaction. By contrast, the delay window of an SDU is limited solely by the travel magnitude of its driving mechanism and can continuously cover a larger range. For a long time the working horse for XUV pump–XUV probe experiments was a double-mirror split-and-delay unit [11,12,13] which impedes phase-resolved measurements due to the nature of its wavefront splitting (see [14,15,16] and Section 2). However, recent successful adaptations of ideas originally invented for far-infrared interferometry [17,18,19,20] to UV [21] and XUV [22] frequencies open new opportunities for phase-resolved (interferometric) experiments at short wavelength FELs with a typical spectral bandwidth of 1%.
One of the major challenges presented by interferometry at short wavelengths is the need for a precise control of the light phase. Any interferometric experiment requires the delay between the light fields to be controlled within a fraction of their optical cycle. For XUV frequencies, these times lie in the attosecond domain. When applied to an SDU, this requires the geometry of the device to be manipulated with nanometer precision, which imposes very high demands on the precision of mechanics and electronics. Yet sometimes the complexity of the task can be reduced. Precise control over some variable involves two steps: (1) measuring this variable and (2) steering the variable to the desired value, i.e., controlling it. Usually the second step—the actual control—requires much more effort than the measurement. However, in many parameter dependence studies the genuine control can be omitted if one can measure the independent variable and then appropriately sort the dependent observables. All interferometric studies investigate dependence of some observable (photon flux, ion or electron yield) on the phase delay between the light fields. With respect to an SDU, it is sufficient to measure the delay in real time and later sort the data accordingly, provided that some sort of “coarse” delay control is available for the desired time scale. In this way, the question how precisely one can control the delay is transformed into how precisely one can measure it. Typically, high-precision piezo actuators employed in SDUs possess measurement and control systems based on strain-gauge and capacitive sensors. However, often the control electronics fail to measure and maintain the actuator position in environments where vibrations are present and one has to rely on different methods. Interferometric profilometry is an attractive choice as it provides a non-contact, quick and precise measurement of surface profiles with nanometer resolution. White light interferometry is one of the most powerful techniques in this family because it overcomes the phase ambiguity from which monochromatic sources suffer [23,24,25,26,27,28] by using broadband light sources with short coherence lengths.
In this paper we present a reflective split-and-delay unit that allows for interferometric pump–probe experiments with short XUV laser pulses provided, for instance, by FEL facilities. The SDU is paired with a diagnostics system based on a white light interferometer that measures the generated pump–probe delay with attosecond precision. The performance of the WLI system is characterized using monochromatic interferometry in the optical spectral range.

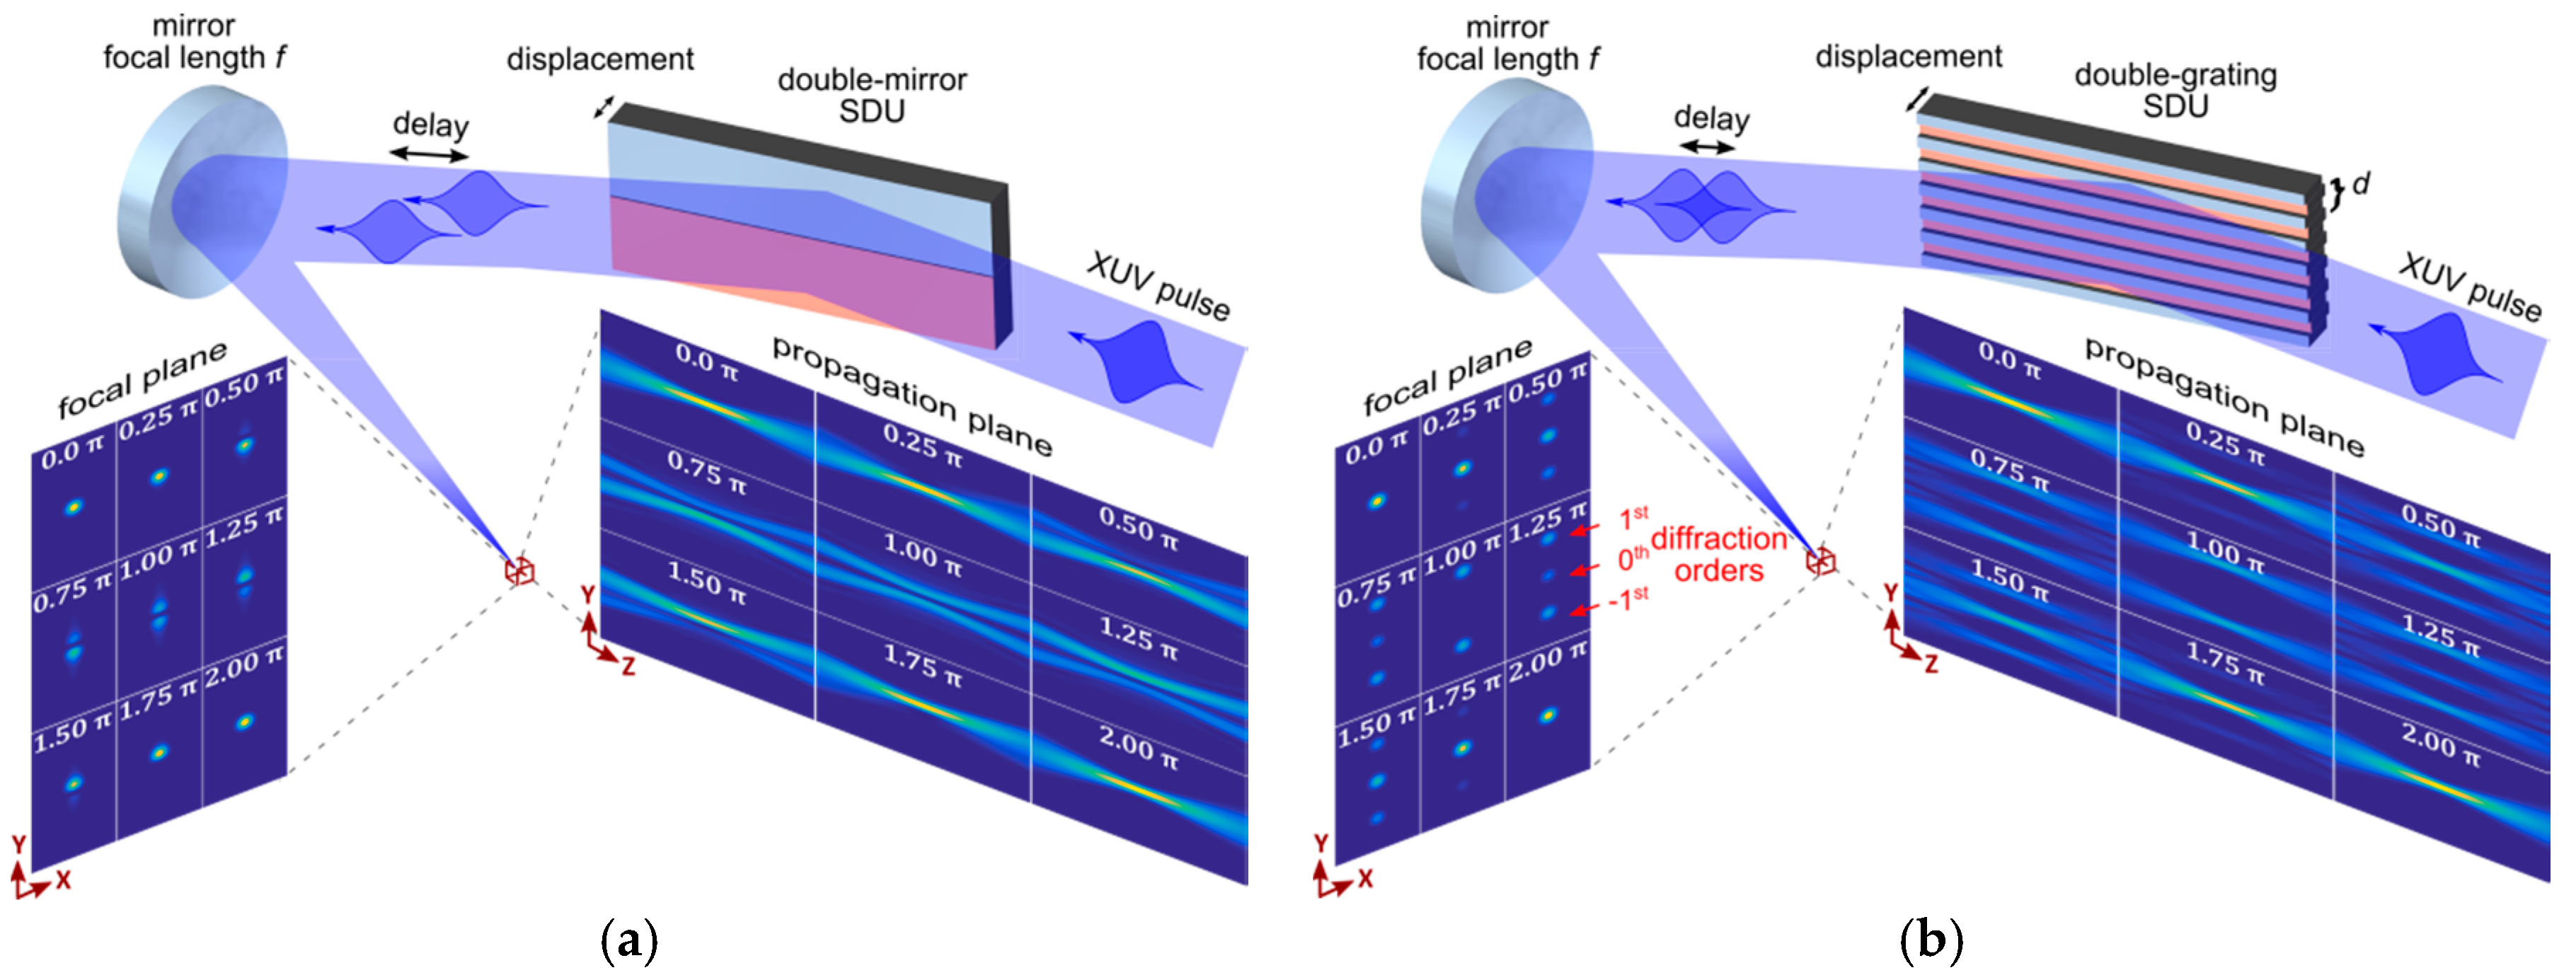
2. Split-And-Delay Unit for XUV Interferometry

To produce a double pulse sequence from a single pulse, one requires two key components: a beam splitter to divide the initial pulse in two and a translation stage to introduce a phase shift to one of them. Common tools used to split beams in the visible wavelength range are semi-transparent mirrors (amplitude beam splitters). These devices divide the incident wavefront in two replicas—one transmitted and one reflected—each carrying half the energy (for a 50:50 split) and preserving the shape of the original beam. One of the replicas is delayed in time and then both of them are recombined in another (or the same) beam splitter. The advantage of amplitude beamsplitters is that they inherently allow for collinear beam mixing. Collinear propagation puts the pulse replicas in a single interference state as their phase difference is solely defined by the introduced delay. Phase-resolved signal detection thus becomes easy, provided that the delay stage is capable of sub-wavelength movement control. However, amplitude beam splitters are not available below 140 nm [29] and for shorter wavelengths, one has to rely on reflective optics.
A common design of a reflective split-and-delay unit for XUV wavelengths is a double split mirror shown in Figure 1a. Its reflective surface is divided into two halves, one of which can be displaced along the normal and thus delay part of the incident wavefront. The two partial beams are later overlapped by tilting the parts of the split mirror or by focusing optics as shown in the figure. Since the two half-beams are spatially separated, they are superimposed at a small skew angle with their wavefronts tilted in opposite directions. This means that the relative phase between the beams varies continuously along the intersection plane. The simulated light distribution created by the split mirror in the focus is shown in Figure 1a as a function of phase delay between the two partial beams. As the delay changes, the interference pattern continuously “scrolls” inside the intensity envelope defined by the transverse focus size. One can see from the fringe spacing that the phase difference between the beams changes across the focal spot on the scale of 2 π . In experiments demanding high photon fluxes, the XUV beams are focused into spots that do not exceed several microns in size. Therefore, to select a region with a fixed phase relation between the two light fields required for interferometry, one would need a detector with a submicron spatial resolution. This is a very challenging task. Instead, the signal is generally integrated over the whole focal volume and the phase information is lost due to phase averaging. This is a major obstacle for phase-resolved measurements with split mirror SDUs.
Limitations of the double split mirror can be overcome using diffractive optics. The idea to use a diffraction grating as a beam splitter is not new [30,31]. For example, a Michelson interferometer based on a transmission grating was successfully employed to characterize femtosecond UV pulses and was proposed for applications in XUV wavelength range [32,33]. However, the setup utilizing a transmission grating is difficult to align, requires additional mirrors and has a low efficiency of the order of several percent [32]. An alternative approach using reflective optics was suggested by Strong and Vanasse in their lamellar-grating interferometer developed for Fourier spectrometry in the far-infrared [17]. The authors overcame the problem of the two-element split mirror—generation of two spatially separated beams—by using two interleaved multi-mirror arrays (lamellar gratings) shown in Figure 1b. Each grating represents a sequence of narrow rectangular facets separated by gaps wide enough to house the facets of another grating. When interleaved, the gratings form a sequence of alternating lamellae with neighboring elements belonging to different gratings. Optical performance of the lamellar-grating beam splitter was thoroughly investigated [17,21,34,35]. In short, each grating diffracts the incident beam in a number of diffraction orders. The partial beams from both gratings propagate collinearly in every order which ensures that their interference depends only on the longitudinal offset between the gratings. This property makes the lamellar-grating SDU a reflective analog of a Michelson interferometer. As an example, for a π phase delay, diffraction from each lamellar grating results in constructive interference in odd orders and destructive interference in even orders. Upon focusing, the angular distribution of the diffracted light translates into a sequence of spots in the focal plane separated by:
Δ r = λ f d ,
where d is the grating period, f is the focal length of the focusing optics and λ is the mean wavelength of the incident light. The intensity of the zeroth order recorded as a function of grating displacement yields the interferogram of the light source. Provided that Δ r is larger than the focus size and can be resolved by the detection system, a single order can be selected for the signal accumulation. Compared to a transmission grating setup, the lamellar-grating SDU has fewer optical elements and offers higher efficiency.

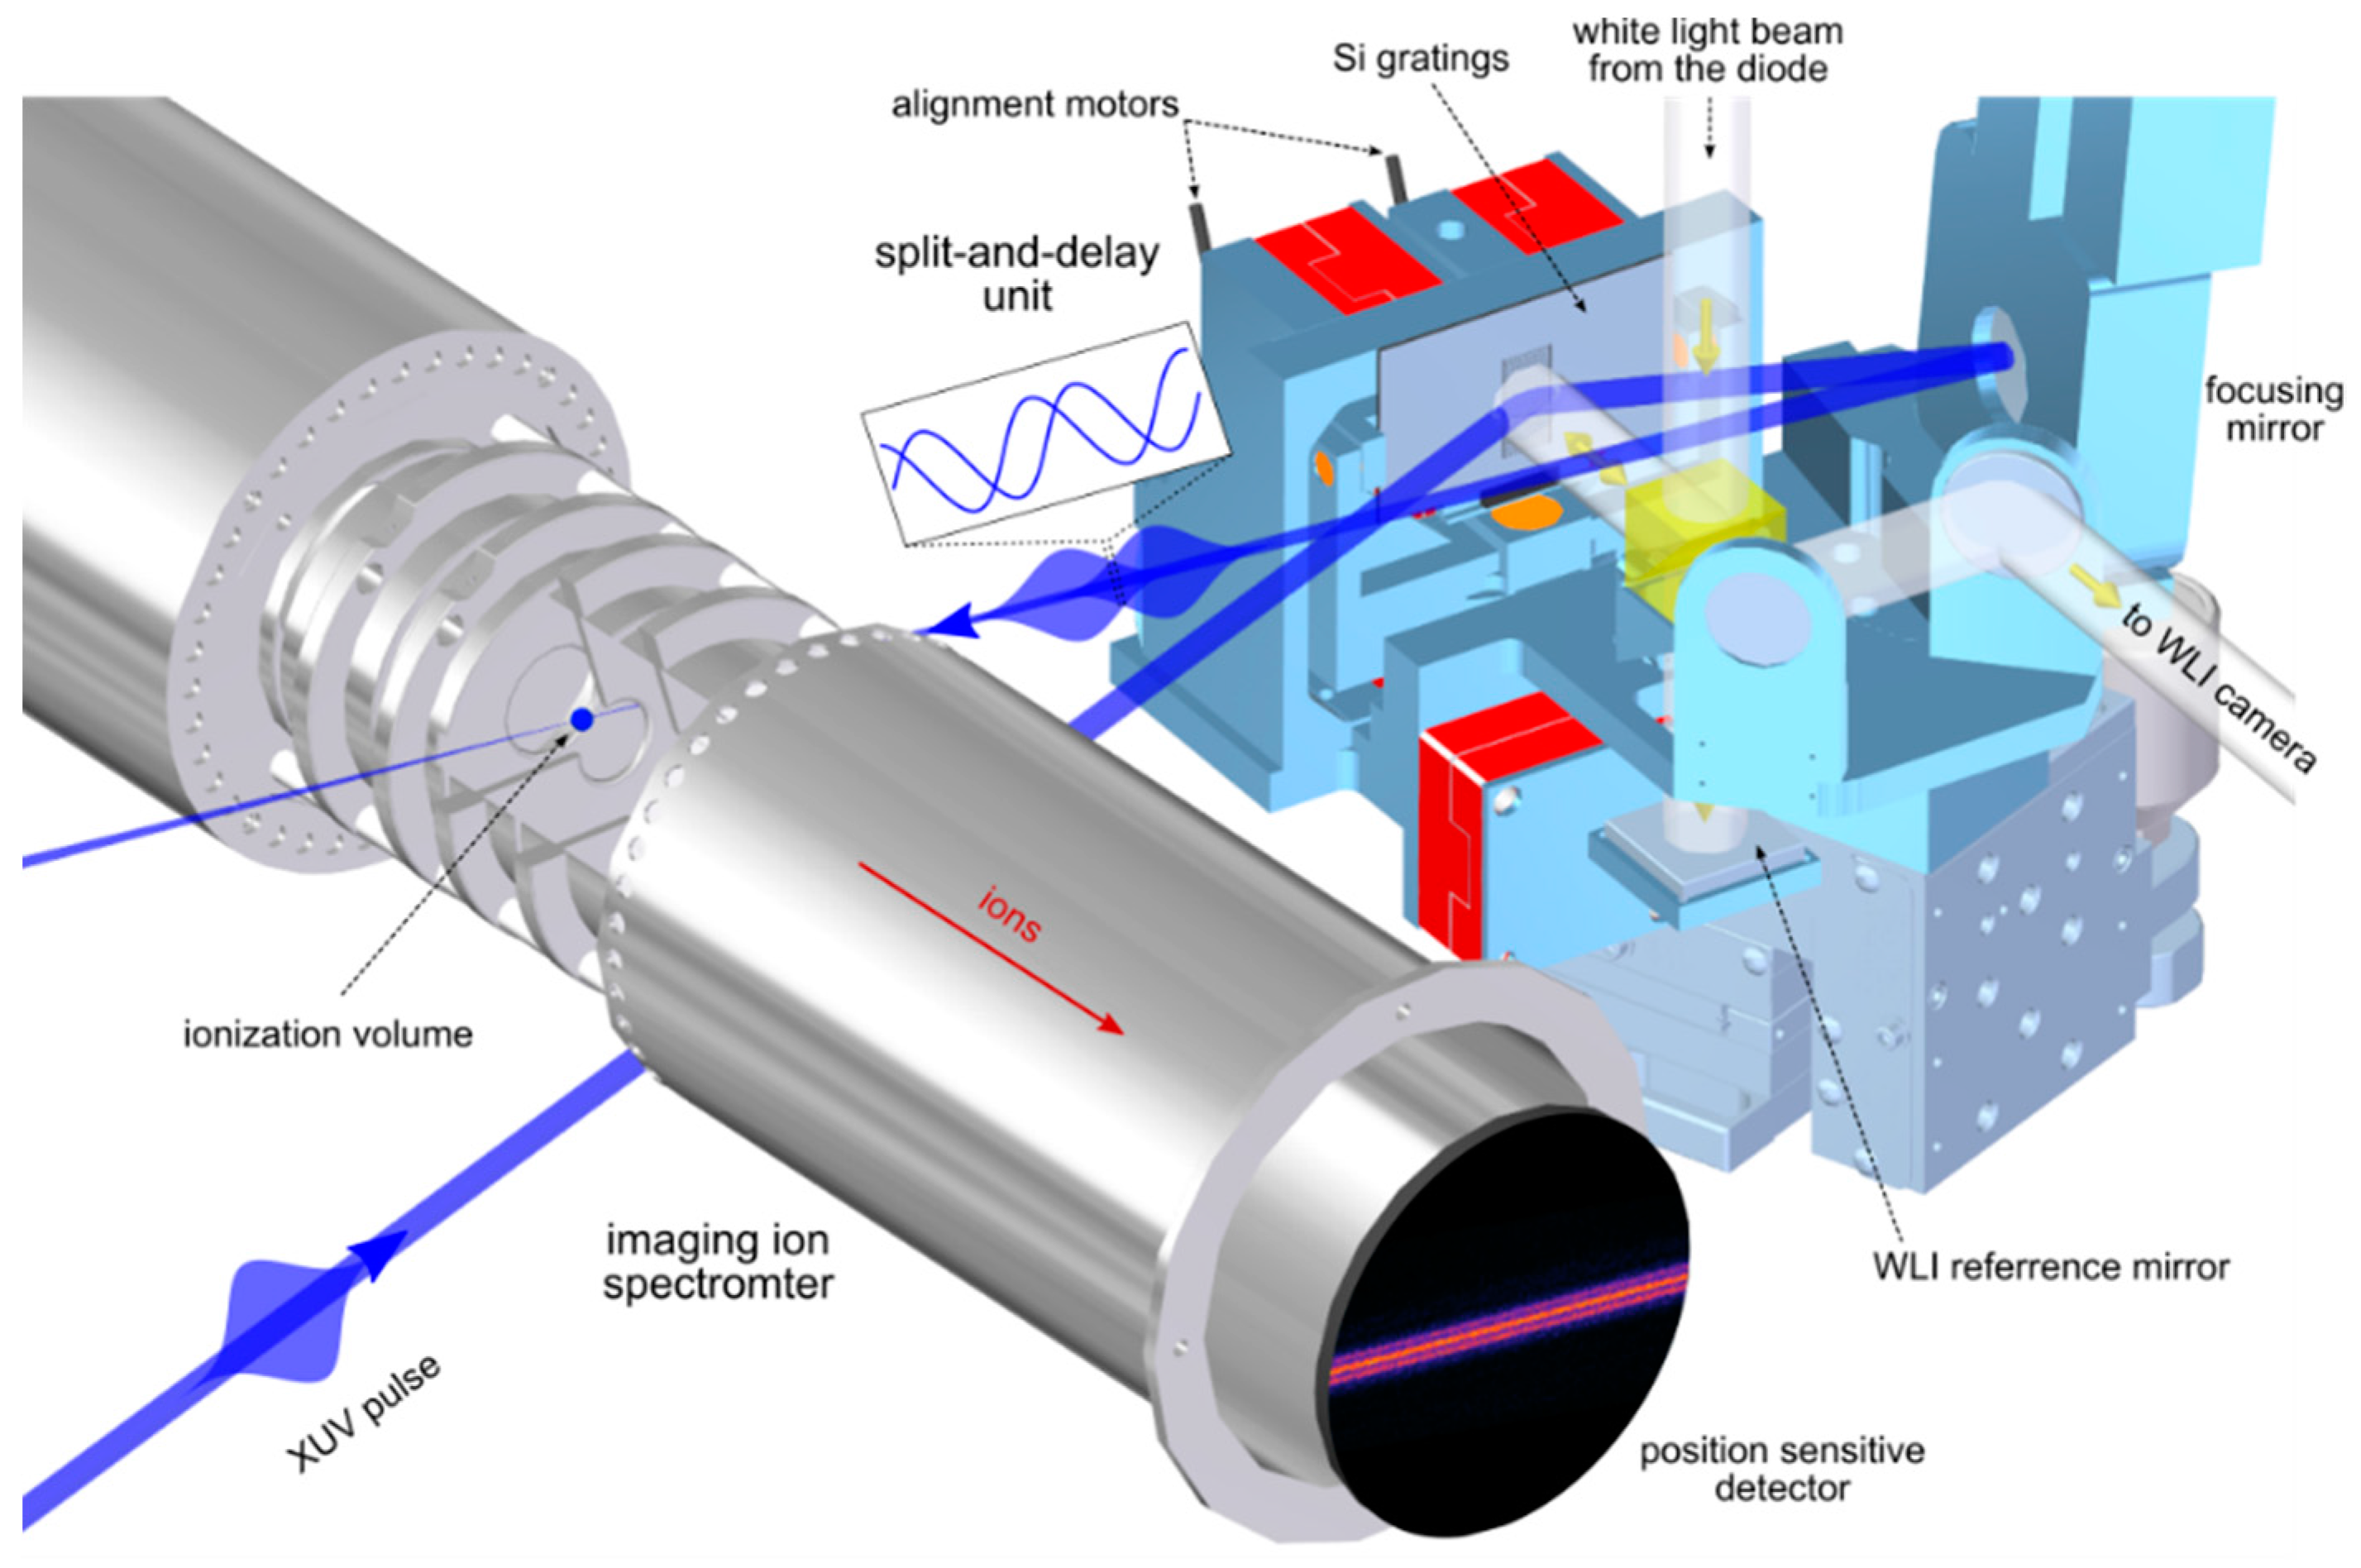
Experimental Design of the SDU

The SDU designed for XUV experiments utilizes two lamellar gratings of different but complementary design. The first grating is a 60 × 35 × 1 mm3 Si wafer with the central 10 × 20 mm2 area processed as a slotted grid with a circular diamond saw. The structure of 250 µm period comprises 150 µm wide slits separated by 100 µm wide reflective facets. The second grating comprises 100 µm wide, rectangular ridges projecting (protruding) from the substrate for 1.25 mm. The ridges are spaced 150 µm apart and fit into the slits of the first grating. When interleaved, the gratings form an alternating pattern of 100 µm facets separated by 25 µm gaps giving a fill factor of 0.8 for the assembled device.
The interleaved gratings are installed on a specially designed mount equipped with motors necessary for grating alignment and translation as shown in Figure 2. The slotted grating is rigidly fixed to the mount while the ridged grating has three degrees of freedom driven by piezo actuators. One of them is used to translate the grating and thus delay the reflected beam. The two others control the grating rotation in two planes and keep both gratings parallel. The delay piezo stage has a travel range of 250 µm in the closed loop control mode, which translates in the delay ranging from −50 to +574 fs at the incidence angle of 22° with respect to the surface. We note in passing that the resulting peak fluence of unfocused FEL beams on the optics surface in this geometry is well below the melting and ablation thresholds of bulk Si.
The described SDU is designed for time-resolved ionization experiments of low-density gas targets by XUV photons with detection of ionization products, i.e., electrons and ions. It follows from Equation (1) that diffraction orders from an XUV beam generated by a grating with a 250 µm period in the focal plane will be separated only by some tens of microns. For example, Δ r = 46 µm for λ = 38 nm and f = 300 mm [22]. Therefore the detection system must have high spatial resolution in order to distinguish signals from individual orders. The ionization volume can be readily imaged with a resolution of few microns by an elongated velocity map imaging (VMI) spectrometer operated in the spatial imaging mode, which proved to be sufficient for 38 nm wavelength [22]. Higher resolution required for shorter wavelengths can be achieved by extending the focal length of the mirror and using a spectrometer purposely designed for magnified spatial imaging of charged particles, i.e., an ion microscope [36].

3. White Light Interferometer for Time Delay Diagnostics

In our experimental setup we determine the time delay introduced by the SDU using a white light interferometer that monitors the topography of the split-and-delay unit. The typical task of a WLI system is to characterize the height profile h ( x , y ) of a sample surface placed in one of the interferometer arms by finding zero optical path difference (OPD) for each point of the surface. Usually an experiment is performed by mechanically scanning the length z of one arm and recording the light intensity I ( x , y ) for different z positions by a camera. The recorded intensity I ( x , y ; z ) is a collection of z -dependent interferograms for all camera pixels. The optical path difference s between the two arms can be expressed as a sum of the surface heightmap h ( x , y ) relative to some reference plane and a translation z of this plane along the interferometer arm: s ( x , y ) = 2 ( z + h ( x , y ) ) . By scanning z , the positions where s = 0 (interferogram maximum) are found for every pixel yielding thus the surface profile h ( x , y ) .
A mechanical z -scan requires the setup to be static on the timescale of at least few seconds. This condition is often difficult to fulfill. Equipment present in a typical laboratory environment (e.g., vacuum pumps or ventilation system) operates at frequencies from several tens to several hundred Hz and generates vibrations which may be transmitted to the experimental setup. For interferometric experiments in the XUV, even small vibration-induced displacements on a scale of tens of nm become crucial. With respect to an SDU, the important aspect to take into account is not the vibration of the system as the whole but the relative jitter of the two components of the device. These oscillations transform into the jitter of the time delay between the generated pulse replicas and thus have a direct impact on the outcome of an interferometric measurement. For example, a displacement of just 50 nm between the SDU reflectors translates into a delay which may comprise several optical cycles for XUV wavelengths. This makes interferometric, i.e., sub-cycle resolved, experiments impossible if the signal is accumulated over time without considering the exact topography of the SDU for each laser shot. Under such a scenario, a mechanical z -scan of the WLI is not applicable and one has to rely on a single-frame technique. Therefore, we used the interferometer in the so-called “electronically scanned” configuration [37,38] with non-collinear beams. If one of the reflective surfaces is tilted to some small angle β , the two beams intersect at the skew angle 2 β . As a result, the OPD between the beams varies continuously along the intersection plane and a single camera image actually presents an OPD scan. In this way, the interferogram I ( z ) is mapped onto the axis perpendicular to the beam propagation: I ( z ) I ( x ) as shown in Figure 3. A shift of the interference pattern Δ x along the horizontal axis of the image will correspond to some longitudinal displacement Δ z of the reflective surface along the interferometer arm. The calibration factor d z / d x for a fixed tilt angle can be calculated from the spacing of interference fringes knowing the average wavelength of the white light. Using this factor, Δ z can be derived for every single frame.

Experimental Design of the WLI

The diagnostics setup for a precise determination of the delay introduced by the SDU is based on a Michelson white light interferometer. All of its components except the white light source and the imaging system are placed in a vacuum chamber in close proximity to the SDU (see Figure 2). The interferometer employs a white light diode with a mean wavelength λ D = 593 nm as the illumination source. The diode is mounted on top of the vacuum chamber and illuminates the interferometer through a viewport. The beam from the diode is split equally into two arms by a 20 mm broad-band beam splitting cube. The SDU is placed at the end of the horizontal arm. The vertical arm terminates with a super-polished reference Si mirror mounted on a translational piezo stage. After reflection, the two beams recombine in the same beam splitter and pass through a vacuum window to a camera placed outside the chamber. The camera can image a 10 × 10 mm2 area of the SDU surface with a lateral resolution of 8 µm at a full frame rate up to 60 Hz.

4. Results and Discussion

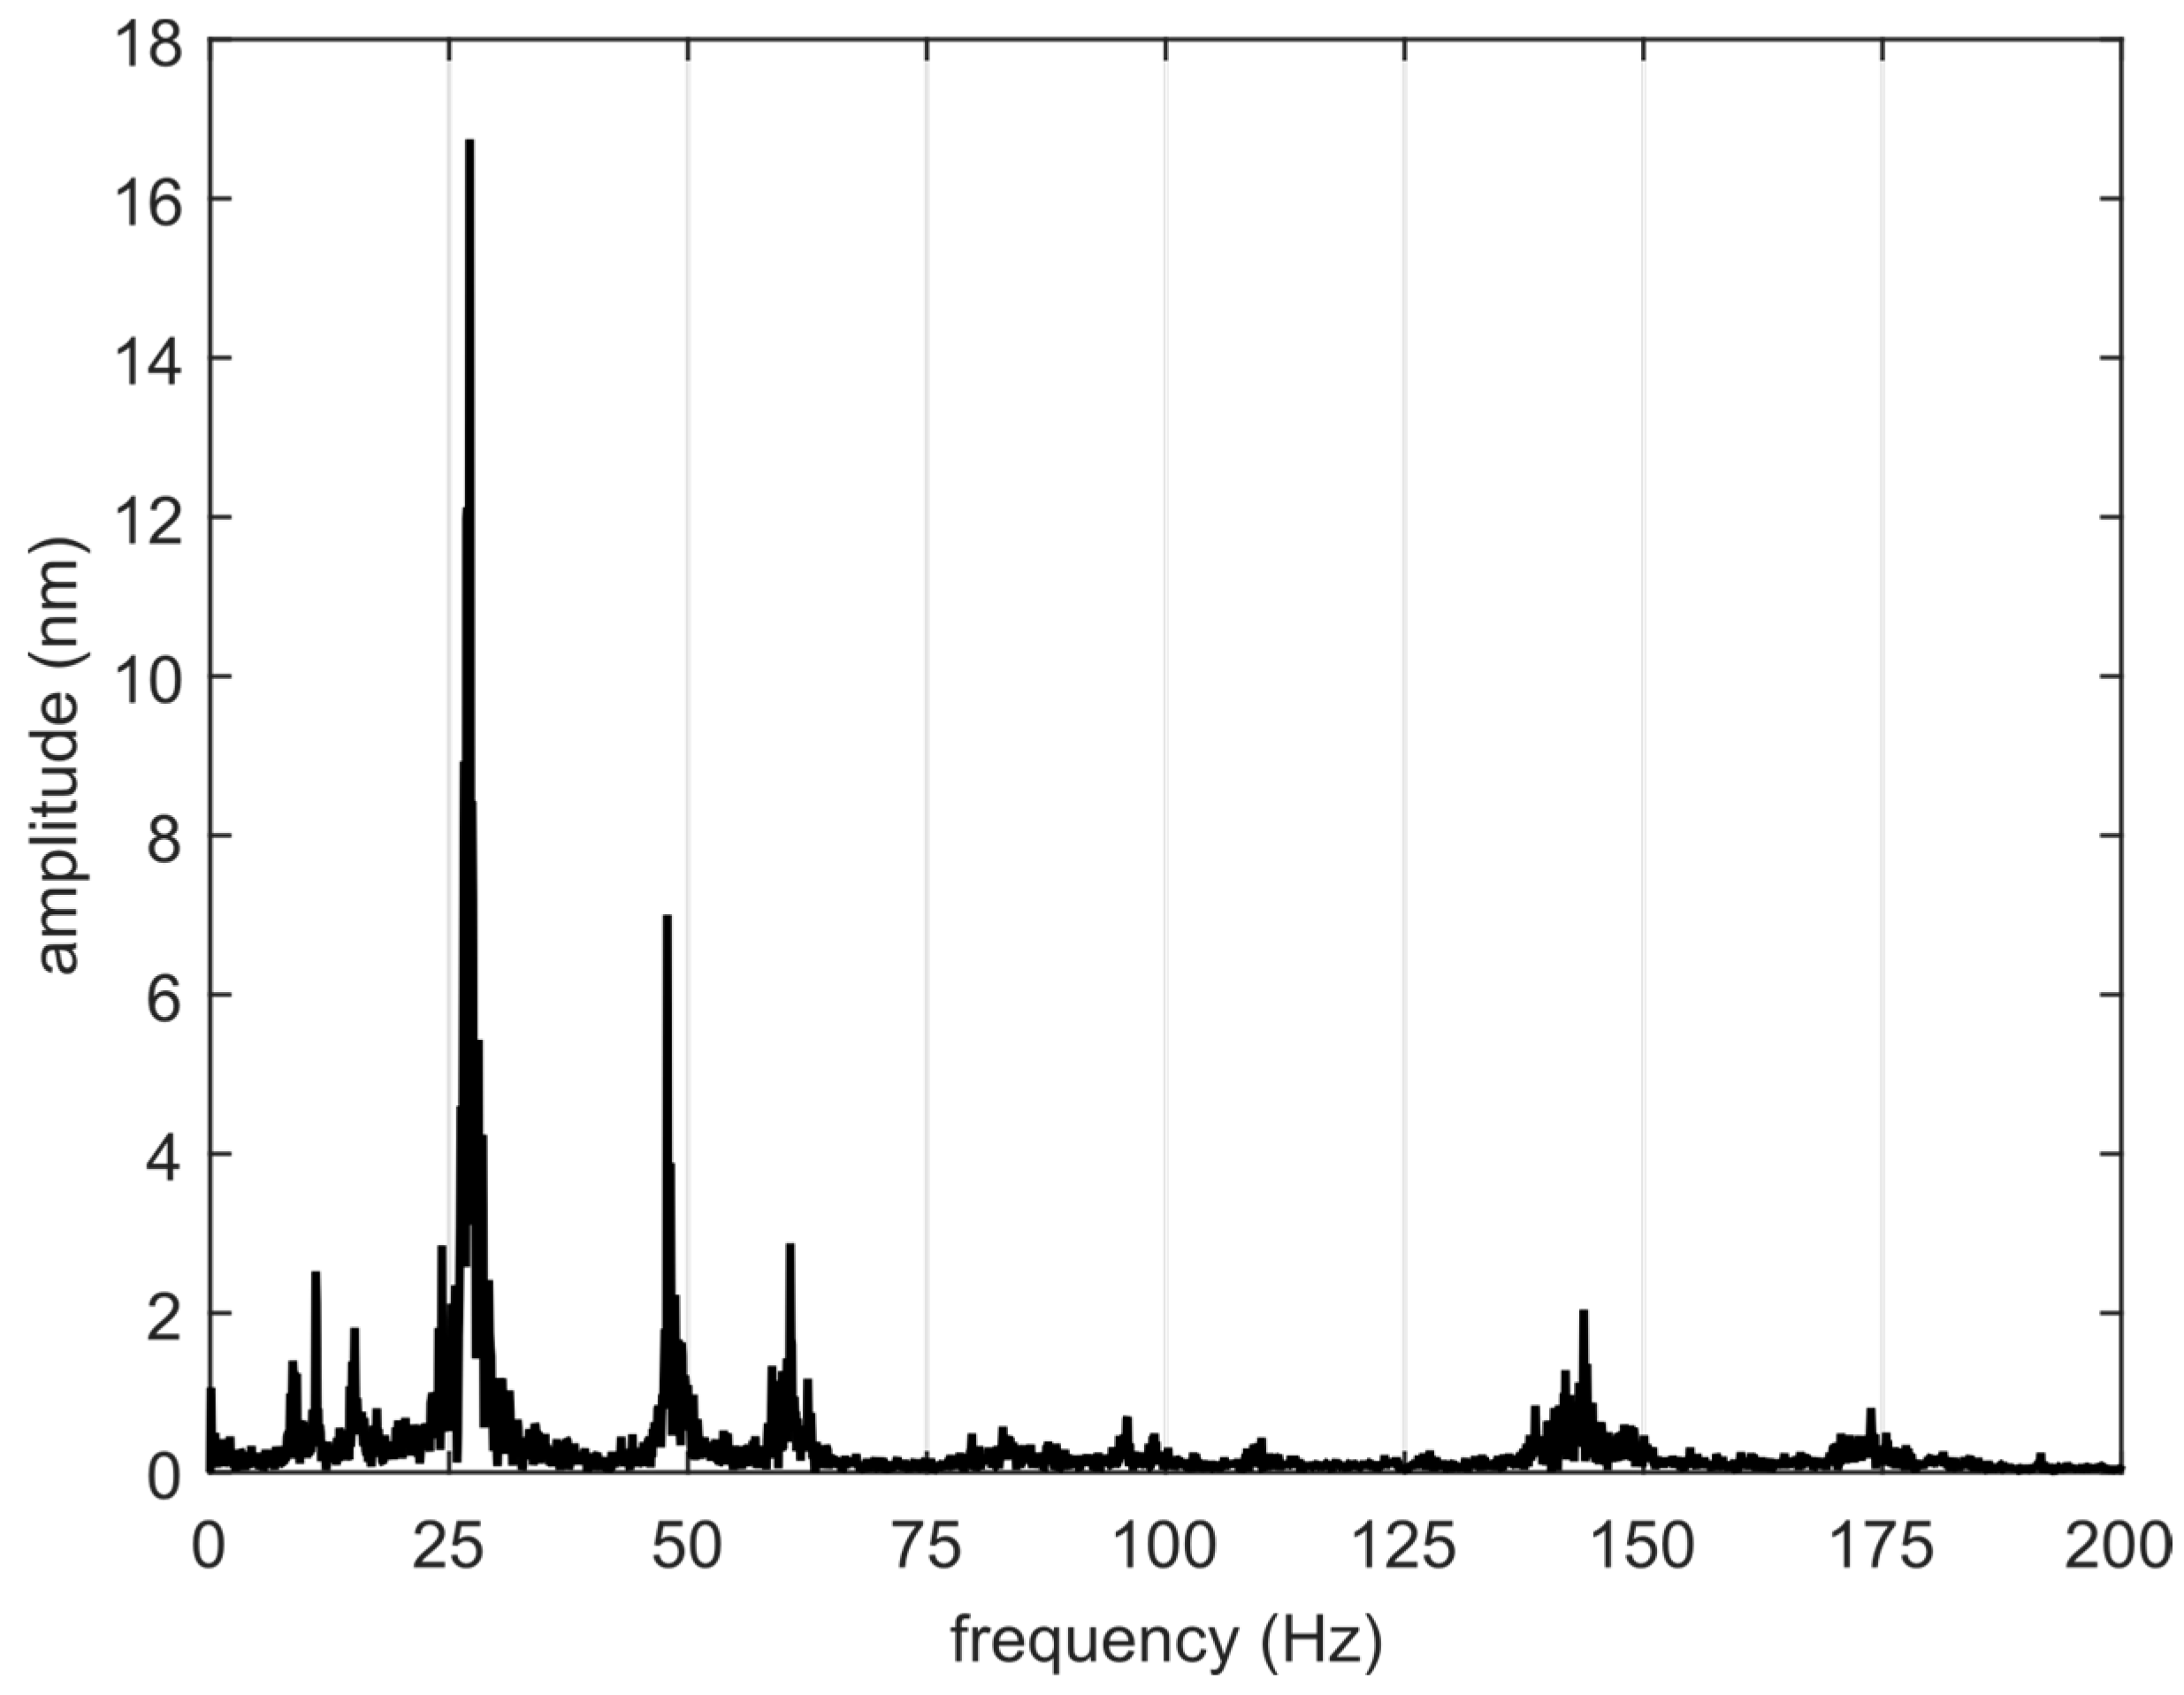
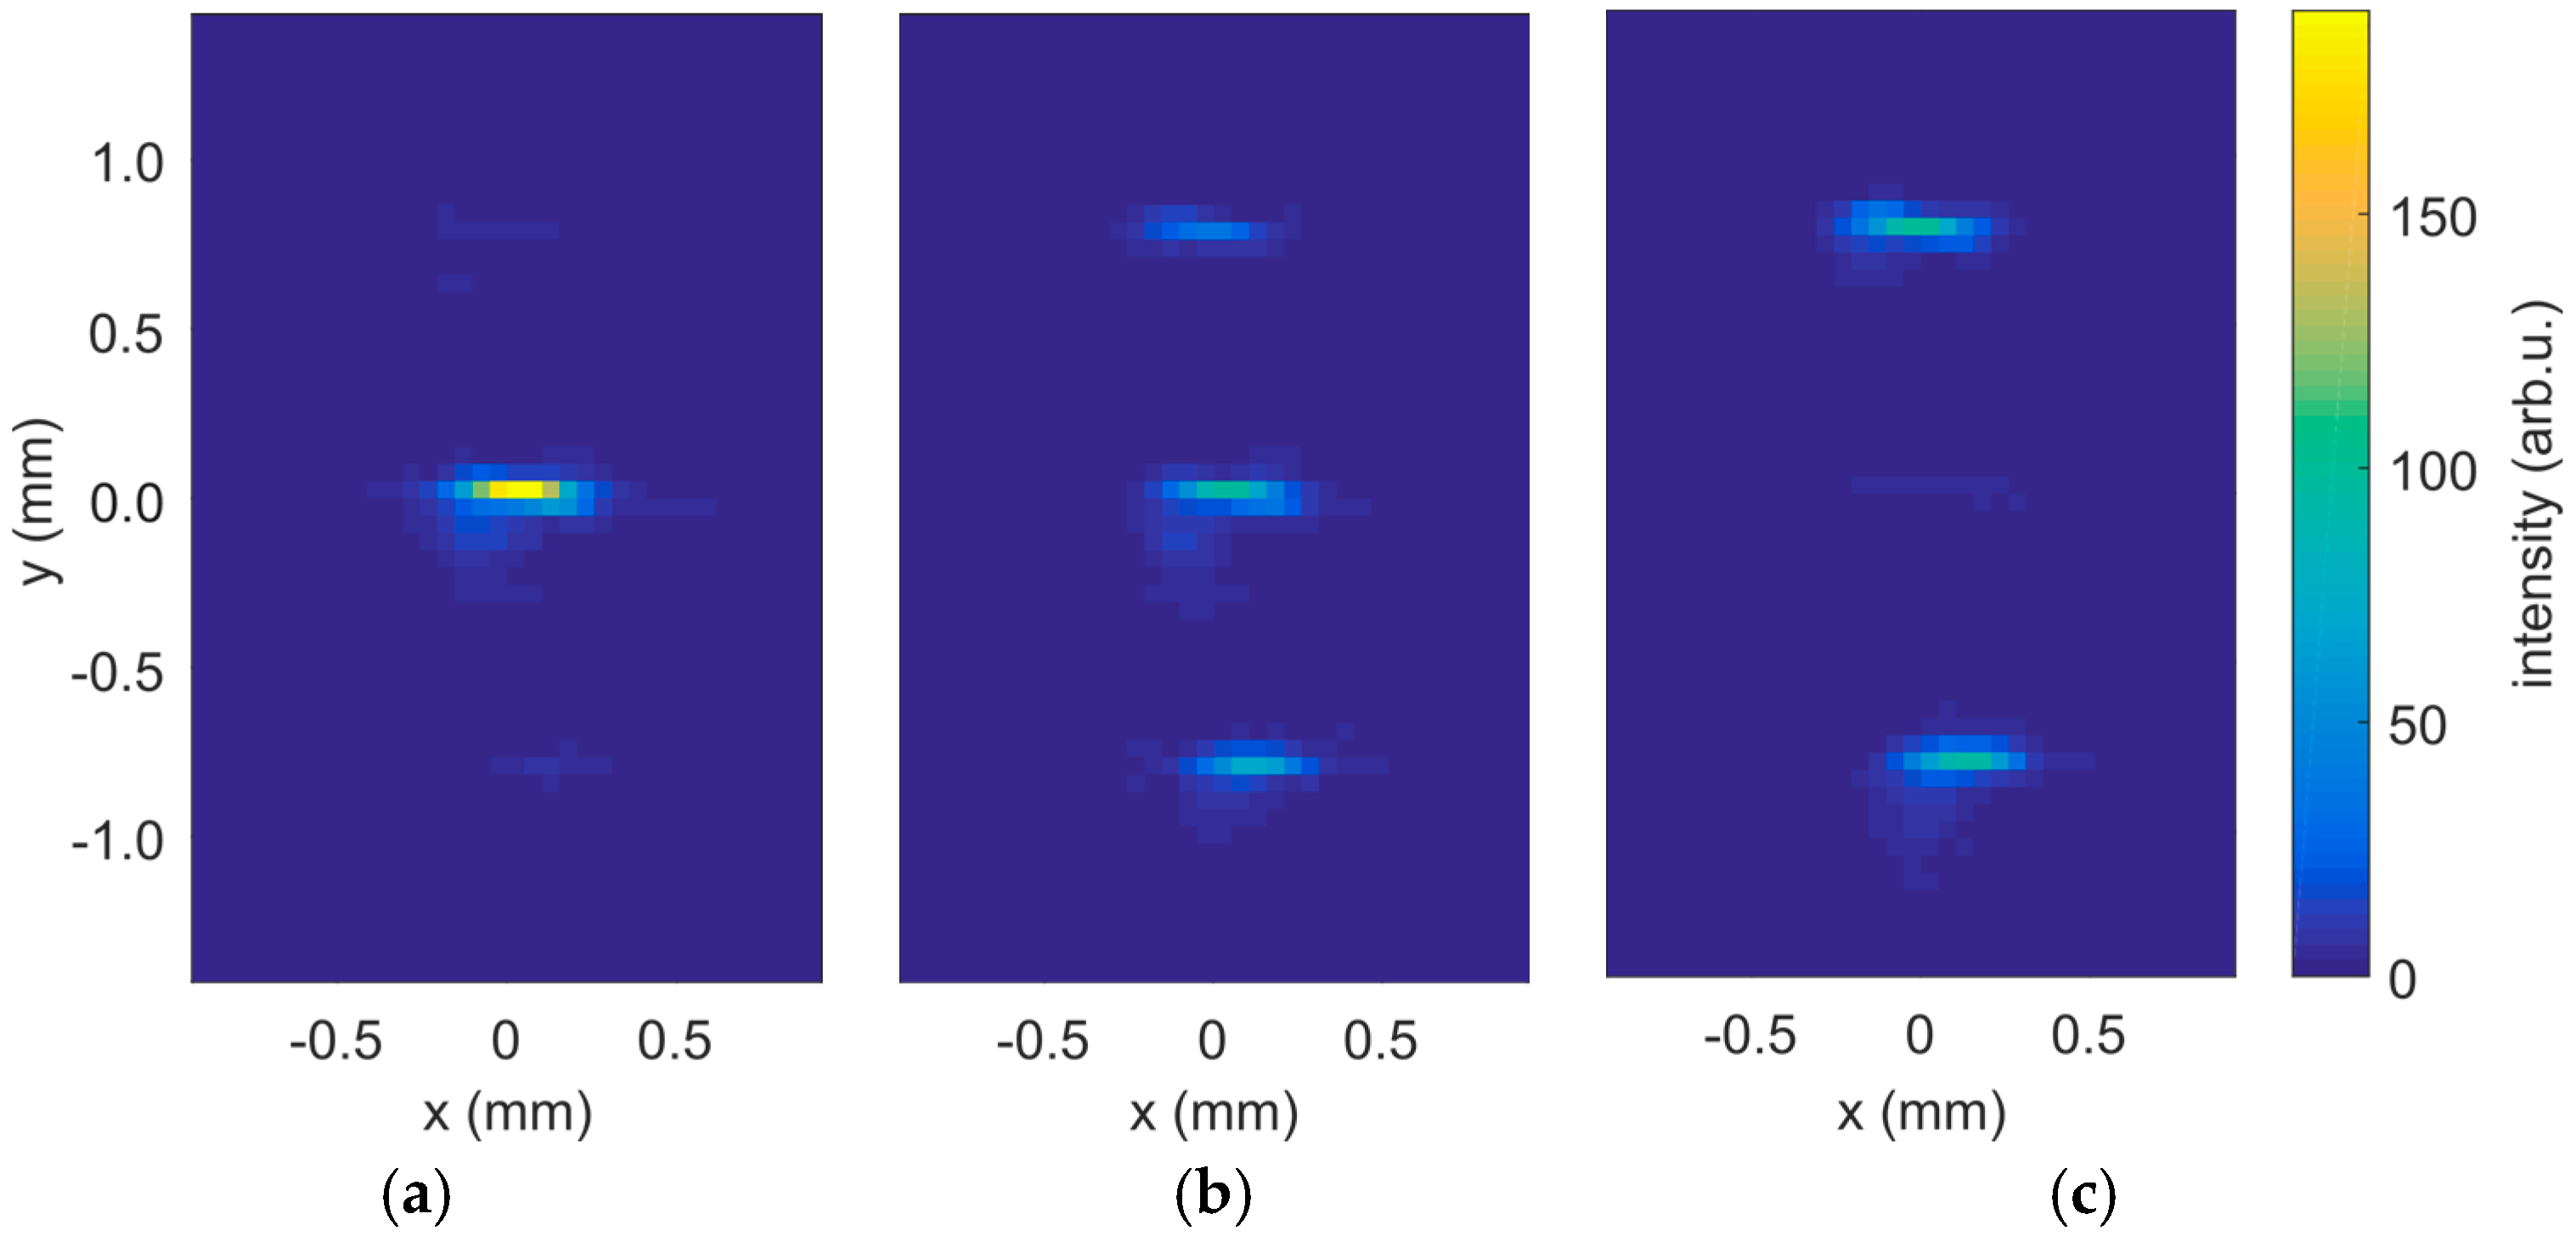
4.1. Analysis of the SDU Displacement Jitter

Using the WLI, we found that the movable grating is affected by environmental vibrations transmitted to the experimental chamber. The vibrations cause the grating to oscillate around the set position with amplitudes up to 100 nm. The frequency spectrum of this displacement jitter was analyzed as follows. A movie of the jittering interference pattern was recorded by the WLI camera at a high frame rate of 1380 Hz. In order to increase the frame rate from the maximum 60 Hz available for the full frame data acquisition, the frame was sized down to a small area of interest comprising only two 100 µm wide lamellae (one from each grating). The positions of interferogram maxima x 0 corresponding to s = 0 were found for each grating in every movie frame. The relative displacements Δ z between the gratings were derived from these data as described in Section 2. The Fourier transform of Δ z ( t ) directly gives the vibrational spectrum shown in Figure 4. As seen from the figure, the major frequency components lay below 100 Hz. The spectrum demonstrates that typical jitter periods (>10 ms) are much longer than the typical exposure time of the camera (~1 ms). In an experiment with femtosecond laser pulses, this allows the SDU displacement to be determined on a single-shot basis at a repetition rate limited solely by the camera characteristics (up to 60 Hz for the full frame acquisition in our case).

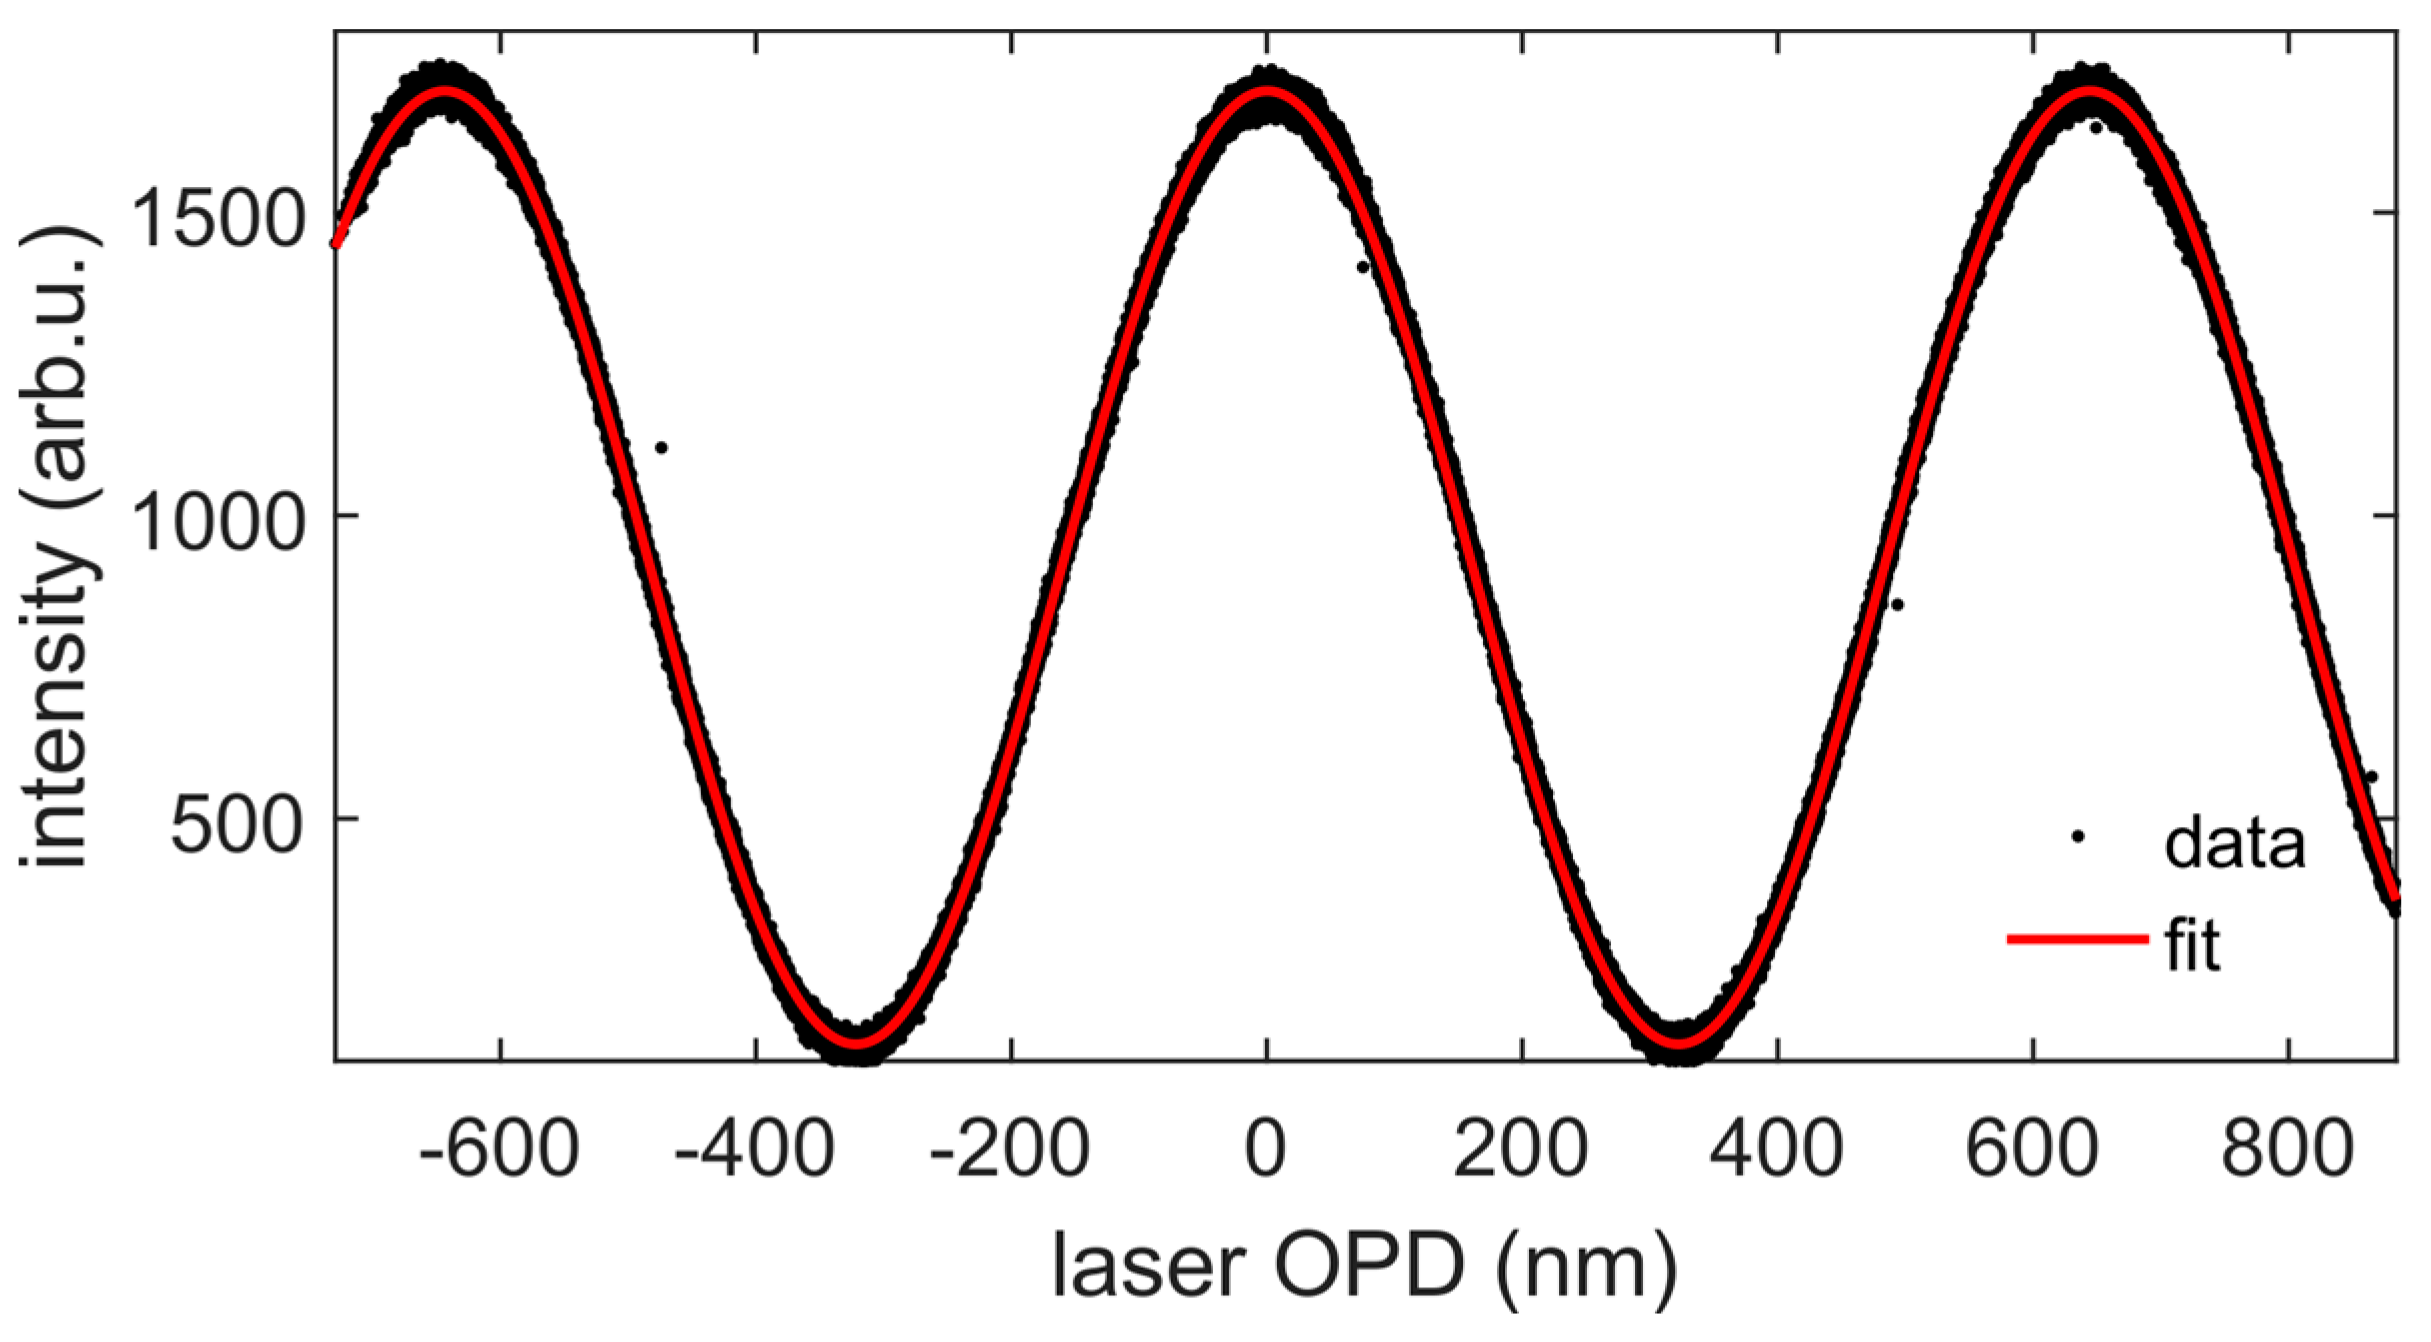
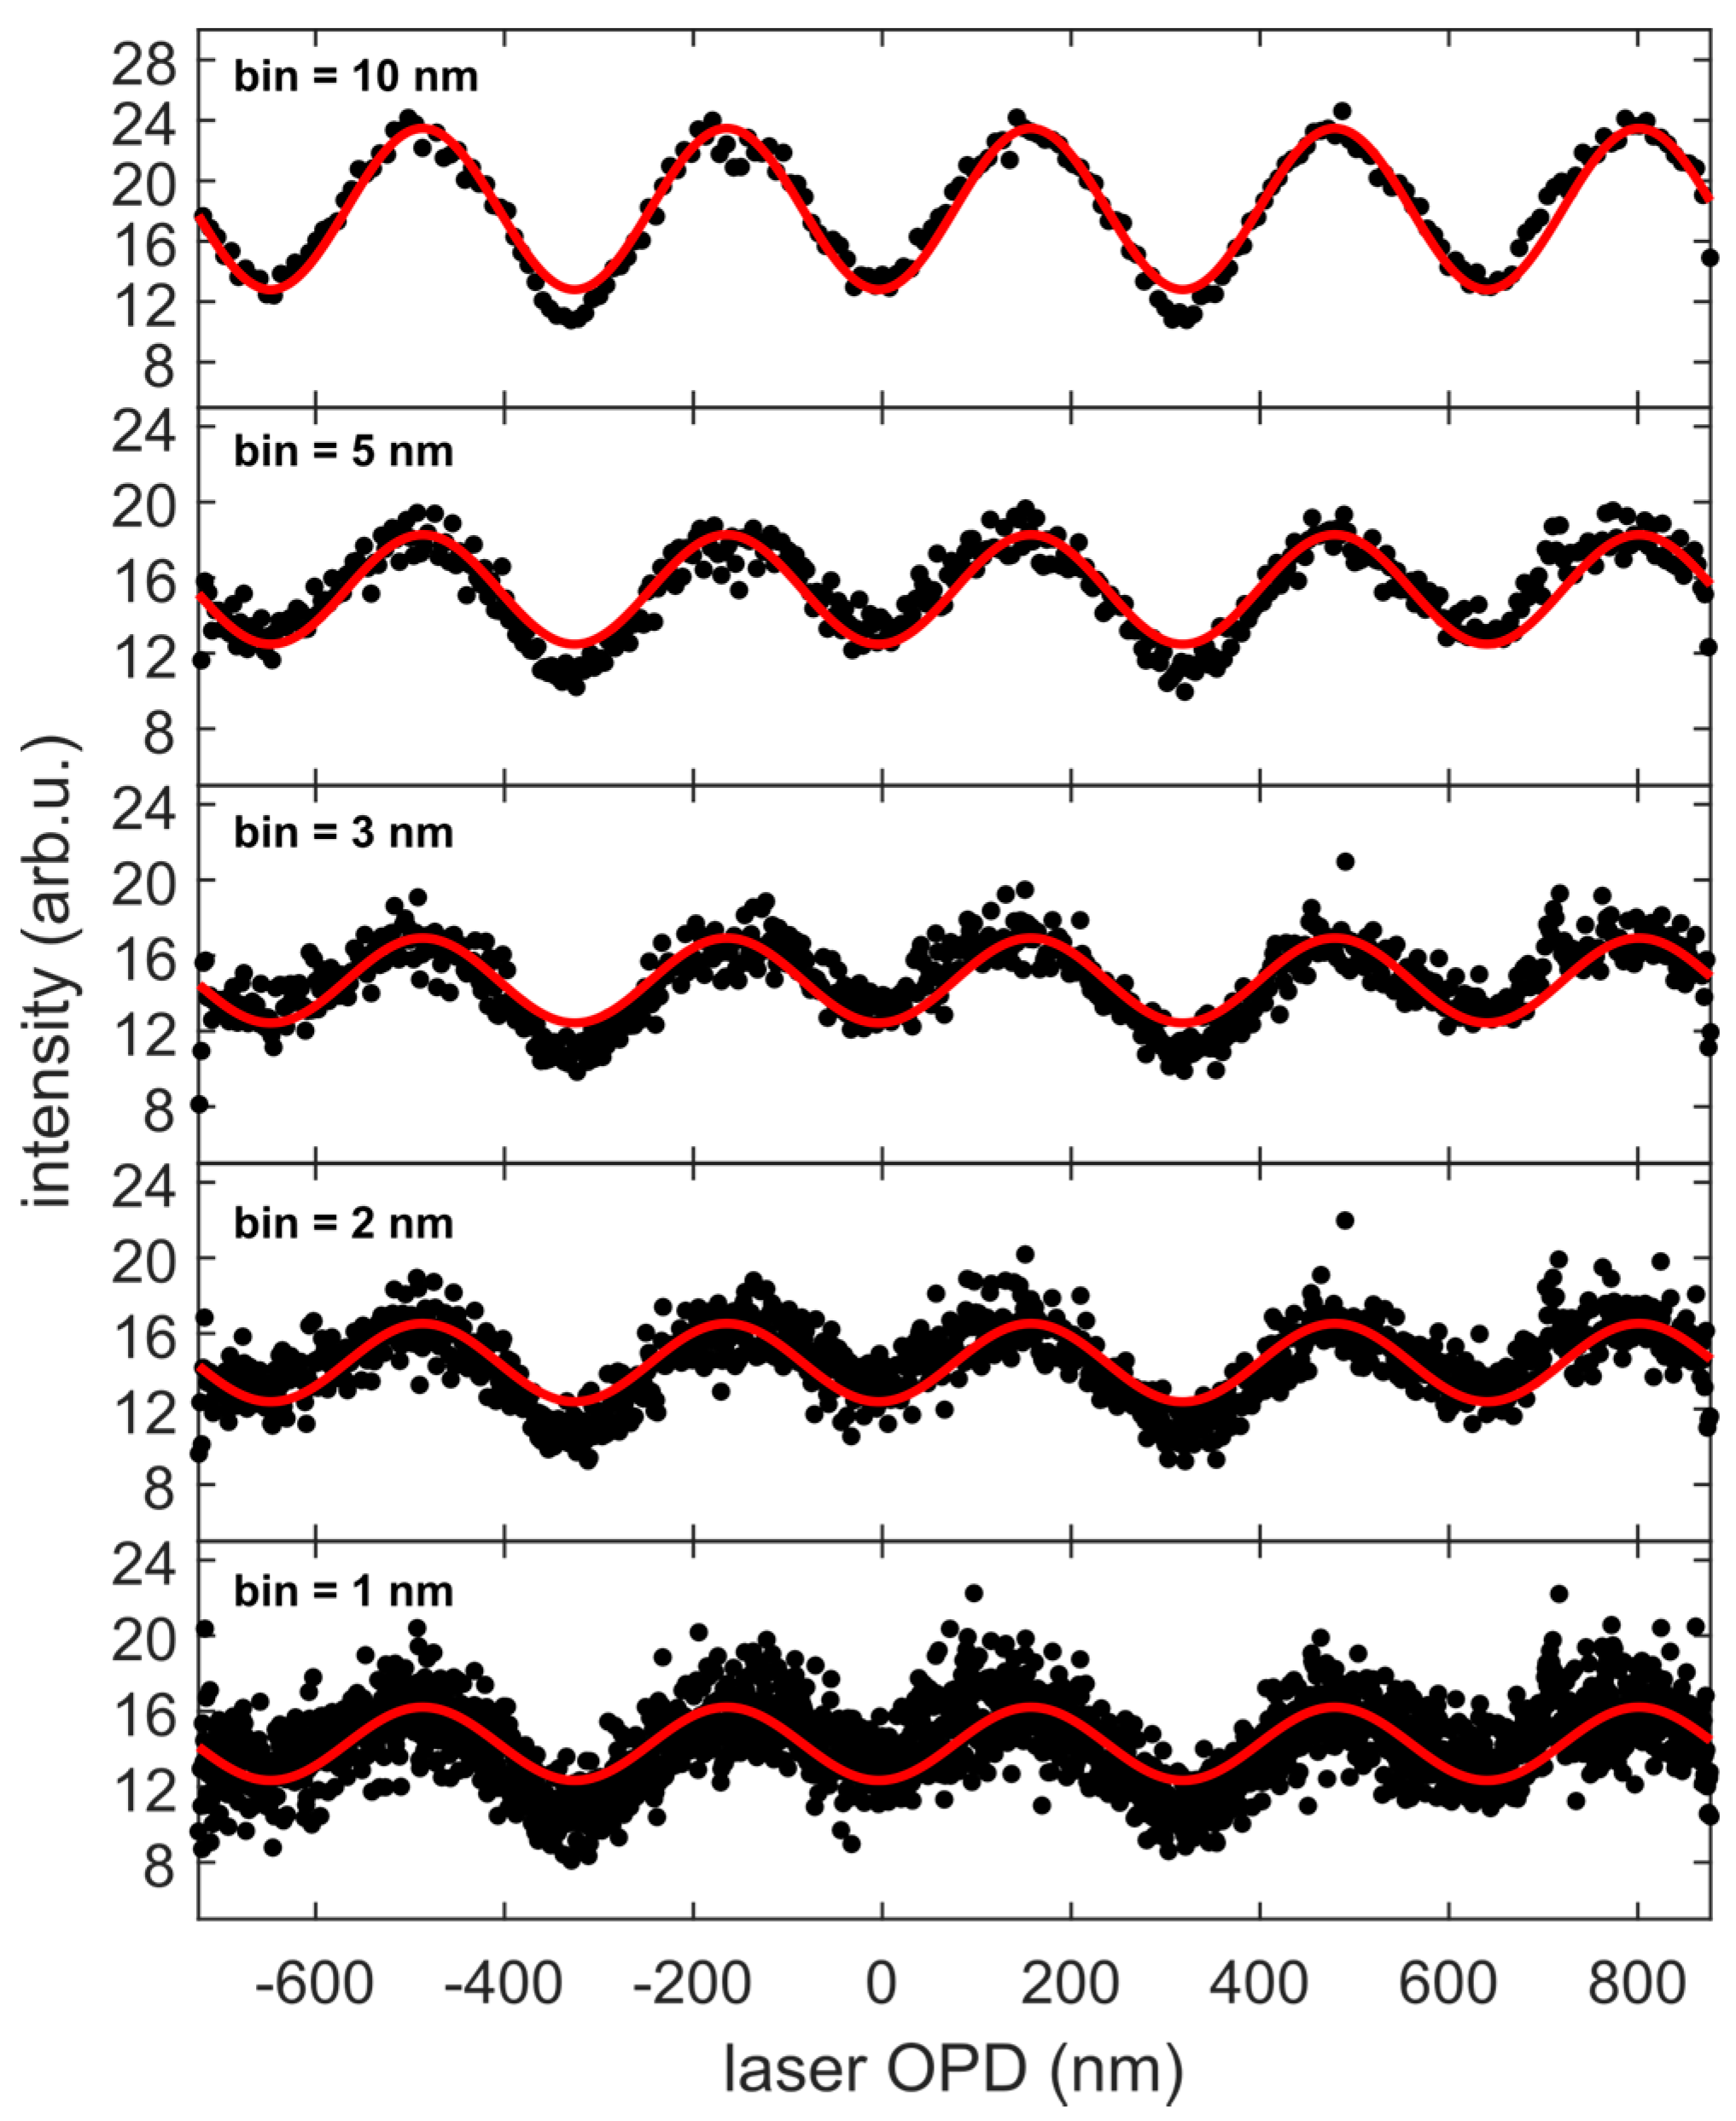
4.2. WLI Single-Shot Precision Determination

To characterize the performance of the WLI system, we used the split-and-delay unit as a second independent interferometer. The SDU conveniently combines a beam splitter and two interferometer arms in a single device and requires only a light source and a detector to complete the setup. Hence, the second interferometric experiment can be performed simultaneously with the WLI measurement and used to gauge the precision of the latter. In the experiment, we used a small continuous wave (CW) diode laser to illuminate the SDU and imaged the reflected intensity in the focal plane with the second camera in synchronization with the WLI measurement. The interferogram of the laser recorded as a function of SDU displacement was then used to characterize the performance of the WLI system.
The laser used in the experiment has a narrow spectrum with the central wavelength λ L = 638.4 nm determined by a grating spectrometer. The laser beam was collimated and shaped with a 1.5 × 7 mm2 rectangular aperture in order to restrict the illuminated area of the SDU to the structured region. After reflection from the SDU, the laser beam was focused by a toroidal mirror with an effective focal length f = 317 mm. The irradiance distribution in the focal plane was imaged by a camera placed behind the focus. The spatial distribution of the laser intensity for different OPDs between the gratings is shown in Figure 5. According to Equation (1), the separation between diffraction orders in the focal plane for our experimental geometry is Δ r = 801 µm and could be easily resolved by the camera.
We scanned the OPD by translating the movable grating. The WLI and the laser cameras took images synchronously with equal exposure time of 1 ms at a rate of 8 Hz. The OPD s between the partial laser beams is connected to the displacement Δ z between the gratings by the relation:
s = 2 Δ z sin α ,
where is the angle of incidence on the SDU counted from its surface. We performed a 2130 nm long z -scan which corresponds to an OPD window of 1600 nm considering α = 22 ° in our experiment. The actual displacement between the gratings for each exposure cycle was determined by the WLI according to the procedure described in Section 3. The laser intensity in the zeroth diffraction order as a function of derived OPD s is shown in Figure 6. The obtained interferogram is sinusoidal without any noticeable envelope as is expected for a highly monochromatic light source. The oscillation period of 640 nm agrees well with λ L = 638.4 nm measured previously by the grating spectrometer.
The deviation of the experimental data from the fit in the interferogram plot has two main contributions: (1) the noise of the camera imaging the focal plane and (2) the error in the OPD derived by the WLI. The latter error defines the precision of the WLI system and we will quantify it using its dependence on the interferogram shape in the following. The contribution of the WLI error to the standard deviation (SD) of the data is proportional to d I / d s , where I is the interferogram intensity. Consequently, the contribution is the smallest for data points located on crests of the sinusoid and the largest for points of the highest gradient. Therefore, the SD plotted as a function of s oscillates at twice the frequency of the interferogram and is shifted by π / 2 . To compare the contribution of the WLI error with the camera noise we bin the interferogram data in OPD bins of different size (see Figure 7). The figure clearly demonstrates that the ratio of the oscillation amplitude to the noise level decreases as the bin size gets smaller. At the bin size δ s = 1 nm, the oscillation amplitude becomes comparable to the noise level and we consider this value to be the effective precision of our WLI system. In our experimental geometry, s = 1 nm corresponds to the SDU displacement Δ z = 0.75 nm and translates into 3 attoseconds of time delay. This value is sufficient to perform interferometric experiments with laser pulses in the XUV wavelength range as was already demonstrated [22].

5. Conclusions

In summary, we have described a split-and-delay unit suitable for interferometric XUV pump–XUV probe experiments at coherent FELs. The SDU consists of two interleaved lamellar gratings. The intensity of the zeroth diffraction order monitored as a function of delay is analogous to that in a Michelson interferometer. The signal from individual orders can be selected using spatially-resolved imaging of the ionization volume with a VMI spectrometer or an ion microscope. The time delay produced by the SDU is precisely determined by an in-vacuum white light interferometer. The WLI in “electronically scanned” configuration records the topography of the SDU on a single-shot basis. These data are used to determine the pump–probe delay generated by the SDU for each laser shot. The WLI was characterized with an interferometric measurement using a CW laser to have a precision of 1 nm. This allows for interferometric experiments in the XUV spectral range with a delay resolution down to 3 attoseconds at repetition rates up to 60 Hz.
Towards short-wavelength FEL applications, the key aspect defining the usability of the described SDU for phase-resolved studies is whether the individual diffraction orders can be resolved under the particular experimental conditions. For a given light wavelength, this depends on the grating surface quality and period, focusing geometry and the charged particle detector, all of which can be improved. High surface quality of the optics becomes an especially important aspect when dealing with short wavelengths. The major challenge here is to structure the gratings with small period maintaining the flatness of the original substrate. Distortions of the substrate induced by the sawing process lead to phase errors in the reflected wavefront, which reduce the interference contrast in the ionization region. This effect becomes more pronounced the shorter the wavelength is. To some extent, the phase errors produced by the surface inhomogeneity can be scaled down by reducing the angle of incidence of the XUV beam on the SDU, which is required anyway for shorter wavelengths to maintain high reflectivity. Another aspect to take into account is the order separation equal to λ f / d in the focal area. For a fixed wavelength, the free parameters are the mirror focal length and the grating period. Manufacturing lamellar gratings with shorter periods and high surface quality is challenging; therefore, extending the focal length is a feasible option. The imaging detector is yet another key element that defines the resolution of the setup. In the experiment with 38 nm wavelength and a focal length of 300 mm, the resolution of the VMI spectrometer operated in the spatial-imaging mode with a moderate magnification of 20 was sufficient to distinguish individual diffraction orders. A spectrometer purposely designed for magnified spatial imaging of charged particles, i.e., an ion microscope, can reach magnification factors up to 100 [36] and significantly improve the resolution of the setup. In conclusion, we are confident that the lamellar-grating concept can be extended to the few nm-wavelength range for advanced applications with soft X-ray FEL pulses.

Acknowledgments

This work was supported by the Deutsche Forschungsgemeinschaft through the excellence cluster “The Hamburg Centre for Ultrafast Imaging (CUI)—Structure, Dynamics and Control of Matter at the Atomic Scale” (DFG-EXC1074), the collaborative research center “Light-induced Dynamics and Control of Correlated Quantum Systems” (SFB925), the GrK 1355 and by the Federal Ministry of Education and Research of Germany under contract No. 05K16GU4.

Author Contributions

Sergey Usenko, Andreas Przystawik, Leslie Lamberto Lazzarino, Markus Alexander Jakob, Florian Jacobs, Christoph Becker, Christian Haunhorst, Detlef Kip and Tim Laarmann contributed to the design of the experimental setup. Andreas Przystawik performed the experiment with the diode laser. Florian Jacobs performed the vibration measurement. Sergey Usenko analyzed the data. Sergey Usenko wrote the paper with contributions from Andreas Przystawik and Tim Laarmann and input from all the other authors.

Conflicts of Interest

The authors declare no competing financial interests.

References

  1. Krausz, F.; Ivanov, M. Attosecond physics. Rev. Mod. Phys. 2009, 81, 163–234. [Google Scholar] [CrossRef]
  2. Kohler, M.C.; Pfeifer, T.; Hatsagortsyan, K.Z.; Keitel, C.H. Frontiers of Atomic High-Harmonic Generation. In Advances in Atomic, Molecular, and Optical Physics; Elsevier: Amsterdam, The Netherlands, 2012; Volume 61, pp. 159–208. [Google Scholar]
  3. Ackermann, W.; Asova, G.; Ayvazyan, V.; Azima, A.; Baboi, N.; Bähr, J.; Balandin, V.; Beutner, B.; Brandt, A.; Bolzmann, A.; et al. Operation of a free-electron laser from the extreme ultraviolet to the water window. Nat. Photonics 2007, 1, 336–342. [Google Scholar] [CrossRef]
  4. Emma, P.; Akre, R.; Arthur, J.; Bionta, R.; Bostedt, C.; Bozek, J.; Brachmann, A.; Bucksbaum, P.; Coffee, R.; Decker, F.-J.; et al. First lasing and operation of an ångstrom-wavelength free-electron laser. Nat. Photonics 2010, 4, 641–647. [Google Scholar] [CrossRef]
  5. Allaria, E.; Appio, R.; Badano, L.; Barletta, W.A.; Bassanese, S.; Biedron, S.G.; Borga, A.; Busetto, E.; Castronovo, D.; Cinquegrana, P.; et al. Highly coherent and stable pulses from the FERMI seeded free-electron laser in the extreme ultraviolet. Nat. Photonics 2012, 6, 699–704. [Google Scholar] [CrossRef]
  6. Cundiff, S.T.; Mukamel, S. Optical multidimensional coherent spectroscopy. Phys. Today 2013, 66, 44–49. [Google Scholar] [CrossRef]
  7. Adams, B.W.; Buth, C.; Cavaletto, S.M.; Evers, J.; Harman, Z.; Keitel, C.H.; Pálffy, A.; Picón, A.; Röhlsberger, R.; Rostovtsev, Y.; et al. X-ray quantum optics. J. Mod. Opt. 2013, 60, 2–21. [Google Scholar] [CrossRef]
  8. Bencivenga, F.; Cucini, R.; Capotondi, F.; Battistoni, A.; Mincigrucci, R.; Giangrisostomi, E.; Gessini, A.; Manfredda, M.; Nikolov, I.P.; Pedersoli, E.; et al. Four-wave mixing experiments with extreme ultraviolet transient gratings. Nature 2015, 520, 205–208. [Google Scholar] [CrossRef] [PubMed]
  9. Prince, K.C.; Allaria, E.; Callegari, C.; Cucini, R.; Ninno, G.D.; Mitri, S.D.; Diviacco, B.; Ferrari, E.; Finetti, P.; Gauthier, D.; et al. Coherent control with a short-wavelength free-electron laser. Nat. Photonics 2006, 10, 985–990. [Google Scholar] [CrossRef]
  10. Gauthier, D.; Ribič, P.R.; Ninno, G.D.; Allaria, E.; Cinquegrana, P.; Danailov, M.B.; Demidovich, A.; Ferrari, E.; Giannessi, L. Generation of phase-locked pulses from a seeded free-electron laser. Phys. Rev. Lett. 2016, 116, 024801. [Google Scholar] [CrossRef] [PubMed]
  11. Sorgenfrei, F.; Schlotter, W.F.; Beeck, T.; Nagasono, M.; Gieschen, S.; Meyer, H.; Foehlisch, A.; Beye, M.; Wurth, W. The extreme ultraviolet split and femtosecond delay unit at the plane grating monochromator beamline PG2 at FLASH. Rev. Sci. Instrum. 2010, 81, 043107. [Google Scholar] [CrossRef] [PubMed]
  12. Wöstmann, M.; Mitzner, R.; Noll, T.; Roling, S.; Siemer, B.; Siewert, F.; Eppenhoff, S.; Wahlert, F.; Zacharias, H. The XUV split-and-delay unit at beamline BL2 at FLASH. J. Phys. B 2013, 46, 164005. [Google Scholar] [CrossRef]
  13. Campi, F.; Coudert-Alteirac, H.; Miranda, M.; Rading, L.; Manschwetus, B.; Rudawski, P.; L’Huillier, A.; Johnsson, P. Design and test of a broadband split-and-delay unit for attosecond XUV-XUV pump-probe experiments. Rev. Sci. Instrum. 2016, 87, 023106. [Google Scholar] [CrossRef]
  14. Mashiko, H.; Suda, A.; Midorikawa, K. All-reflective interferometric autocorrelator for the measurement of ultra-short optical pulses. Appl. Phys. B 2003, 76, 525–530. [Google Scholar] [CrossRef]
  15. Faucher, O.; Tzallas, P.; Benis, E.P.; Kruse, J.; Conde, A.P.; Kalpouzos, C.; Charalambidis, D. Four-dimensional investigation of the 2nd order volume autocorrelation technique. Appl. Phys. B 2009, 97, 505–510. [Google Scholar] [CrossRef]
  16. Tzallas, P.; Charalambidis, D.; Papadogiannis, N.A.; Witte, K.; Tsakiris, G.D. Direct observation of attosecond light bunching. Nature 2003, 426, 267. [Google Scholar] [CrossRef] [PubMed]
  17. Strong, J.; Vanasse, G.A. Lamellar grating far-infrared interferometer. J. Opt. Soc. Am. 1960, 50, 113. [Google Scholar] [CrossRef]
  18. Hall, R.T.; Vrabec, D.; Dowling, J.M. A high-resolution, far infrared double-beam lamellar grating interferometer. Appl. Opt. 1966, 5, 1147. [Google Scholar] [CrossRef] [PubMed]
  19. Milward, R.C. A small lamellar grating interferometer for the very far-infrared. Infrared Phys. 1969, 9, 59–74. [Google Scholar] [CrossRef]
  20. Henry, R.L.; Tanner, D.B. A lamellar grating interferometer for the far-infrared. Infrared Phys. 1979, 19, 163–174. [Google Scholar] [CrossRef]
  21. Gebert, T.; Rompotis, D.; Wieland, M.; Karimi, F.; Azima, A.; Drescher, M. Michelson-type all-reflective interferometric autocorrelation in the VUV regime. New J. Phys. 2014, 16, 239–310. [Google Scholar] [CrossRef]
  22. Usenko, S.; Przystawik, A.; Jakob, M.; Lazzarino, L.L.; Brenner, G.; Toleikis, S.; Haunhorst, C.; Kip, D.; Laarmann, T. Attosecond interferometry with self-amplified spontaneous emission of a free-electron laser. Nat. Commun. 2017, 8, 15626. [Google Scholar]
  23. Flournoy, P.A.; McClure, R.W.; Wyntjes, G. White-light interferometric thickness gauge. Appl. Opt. 1972, 11, 1907. [Google Scholar] [CrossRef] [PubMed]
  24. Lee, B.S.; Strand, T.C. Profilometry with a coherence scanning microscope. Appl. Opt. 1990, 29, 3784–3788. [Google Scholar] [CrossRef] [PubMed]
  25. Chim, S.S.C.; Kino, G.S. Correlation microscope. Opt. Lett. 1990, 15, 579. [Google Scholar] [CrossRef] [PubMed]
  26. Kino, G.S.; Chim, S.S.C. Mirau correlation microscope. Appl. Opt. 1990, 29, 3775–3783. [Google Scholar] [CrossRef] [PubMed]
  27. Danielson, B.L.; Boisrobert, C.Y. Absolute optical ranging using low coherence interferometry. Appl. Opt. 1991, 30, 2975. [Google Scholar] [CrossRef] [PubMed]
  28. Dresel, T.; Häusler, G.; Venzke, H. Three-dimensional sensing of rough surfaces by coherence radar. Appl. Opt. 1992, 31, 919–925. [Google Scholar] [CrossRef] [PubMed]
  29. Thorne, A. Fourier transform spectrometry in the vacuum ultraviolet: Applications and progress. Phys. Scr. 1996, T65, 31–35. [Google Scholar] [CrossRef]
  30. Ronchi, V. Forty years of history of a grating interferometer. Appl. Opt. 1964, 3, 437. [Google Scholar] [CrossRef]
  31. Munnerlyn, C.R. A Simple Laser Interferometer. Appl. Opt. 1969, 8, 827. [Google Scholar] [CrossRef] [PubMed]
  32. Goulielmakis, E.; Nersisyan, G.; Papadogiannis, N.A.; Charalambidis, D.; Tsakiris, G.D.; Witte, K. A dispersionless Michelson interferometer for the characterization of attosecond pulses. Appl. Phys. B 2002, 74, 197–206. [Google Scholar] [CrossRef]
  33. Papadogiannis, N.A.; Nersisyan, G.; Goulielmakis, E.; Rakitzis, T.P.; Hertz, E.; Charalambidis, D.; Tsakiris, G.D.; Witte, K. Temporal characterization of short-pulse third-harmonic generation in an atomic gas by a transmission-grating Michelson interferometer. Opt. Lett. 2002, 27, 1561. [Google Scholar] [CrossRef] [PubMed]
  34. Möller, K.D. Wavefront dividing interferometers. Infrared Phys. 1991, 32, 321–331. [Google Scholar] [CrossRef]
  35. Yin, H.; Wang, M.; Ström, M.; Nordgren, J. Study of a wave-front-dividing interferometer for Fourier transform spectroscopy. Nucl. Instrum. Methods Phys. Res. Sect. A 2000, 451, 529–539. [Google Scholar] [CrossRef]
  36. Schultze, M.; Bergüs, B.; Schroeder, H.; Krausz, F.; Kompa, K.L. Spatially resolved measurement of ionization yields in the focus of an intense laser pulse. New J. Phys. 2011, 13, 033001. [Google Scholar] [CrossRef]
  37. Bosselmann, T.; Ulrich, R. High-accuracy position-sensing with fiber-coupled white-light interferometers. In Proceedings SPIE 0514; Kersten, R.T., Kist, R., Eds.; SPIE: Bellingham, WA, USA, 1984; pp. 361–364. [Google Scholar]
  38. Chen, S.; Meggitt, B.T.; Rogers, A.J. Electronically scanned optical-fiber Young’s white-light interferometer. Opt. Lett. 1991, 16, 761. [Google Scholar] [CrossRef] [PubMed]
Figure 1. Comparison of a conventional double-mirror SDU (a) and a lamellar-grating SDU (b). The insets with blue background show simulated light intensity distributions in the focal (XY) and the propagation (YZ) planes for nine different phase delays ranging from 0 to 2 π . (a) The double-mirror SDU generates two spatially separated beams which are superimposed by the focusing optics at a small angle with their wavefronts tilted in opposite directions. As a result, their relative phase varies continuously along the Y-axis. Hence, a detector with infinitely high resolution would be required to discriminate single interference states. (b) Each grating of the SDU diffracts the incident beam. Partial beams from the two gratings propagate collinearly in every diffraction order, which is justified by the complete destructive interference in the zeroth order for Δ ϕ = π . Spatial selection of a single order for detection allows for high-contrast interferometric measurement.
Applsci 07 00544 g001
Figure 2. Layout of the experimental setup inside the vacuum chamber. As an illustration, the image on the position-sensitive detector (PSD) displays the spatial distribution of Xe+ ions produced by 38 nm photons [22]. The image shows a characteristic triple foci structure generated by the SDU. The image is an accumulation of ~5000 shots including many different pulse-replica delays.
Applsci 07 00544 g002
Figure 3. Surface fragment of the SDU seen through the WLI camera. The image clearly shows horizontal facets of the gratings with white light interference fringes on their surface. Neighboring facets belong to different gratings. One of the gratings is displaced along the surface normal ( z -direction) as is indicated by the shift of the interference pattern.
Applsci 07 00544 g003
Figure 4. Vibrational spectrum of the SDU displacement. The spectrum was obtained by recording a movie with the WLI camera at a frame rate of 1380 Hz and then making the Fourier transform of the central fringe position.
Applsci 07 00544 g004
Figure 5. Irradiance distribution of the laser diode in the focal plane after reflection from the SDU for three different phase delays: (a) 0 , (b) π / 2 , (c) π . The foci have line shapes because the laser had a 1.5 × 7 mm2 rectangular aperture to match the beam size with the structured area of the SDU.
Applsci 07 00544 g005
Figure 6. Intensity of the diode laser in the zeroth diffraction order as a function of optical path difference between the gratings of the SDU derived from the WLI images. The red curve is a sine fit to the data.
Applsci 07 00544 g006
Figure 7. Standard deviation of the laser intensity data from the fit plotted as a function of optical path difference s . The black scatter represents the data, and the red curves are fits of a form sin 2 2 π λ L s , where λ L is the laser wavelength. Each data point is the center of a bin, the size of which is indicated in the left top corner of each plot.
Applsci 07 00544 g007

