
Effect of Load Transfer Section to Toughness for Steel Fiber-Reinforced Concrete


School of Architecture, Seoul National University of Science & Technology, 232 Gongneung-ro, Nowon-gu, Seoul 01811, Korea
*
Author to whom correspondence should be addressed.
Appl. Sci. 2017, 7(6), 549; https://doi.org/10.3390/app7060549
Submission received: 12 April 2017
/
Revised: 16 May 2017
/
Accepted: 16 May 2017
/
Published: 26 May 2017
(This article belongs to the Section Materials Science and Engineering)
Abstract
:This study analyzed the correlation between the load transfer properties and the overall toughness in the flexural behavior of steel fiber-reinforced concrete after concrete matrix cracking. Beam specimens with identical aspect ratios were made with three different types of steel fiber, each of which had different properties, and were used for the flexural test. The load displacement graph from the test was divided into sections by behavioral properties, and the regression model by mix was analyzed to extract the correlation between the load transfer section (concrete-fiber) and the overall toughness. The analysis results showed three types of load displacement curve based on the fiber type and fiber content, and confirmed that the load reduction section towards fiber after concrete cracking and the slope and area of the load reascension section had a huge impact on the overall toughness. The regression model of the whole toughness (Tb) was then acquired by proposing the resulting correlation as the load transfer factor (LTF).
1. Introduction
The quality of concrete is gradually deteriorated in the long-term degradation process involving minute cracks due to the dry shrinkage generated in the manufacturing process, the infiltration of damaging materials, and various loading conditions, and the concrete is eventually destroyed. The addition of fiber to concrete complements the brittleness of the concrete, thus enhancing the impact strength, delaying fracture, and greatly improving the ductility performance. Fiber-reinforced concrete can offer structural safety by transferring the load to the fiber after concrete matrix failure, and converts the concrete matrix failure to ductile fracture through the crack control process [1,2]. Glass fiber, steel fiber, nylon fiber, Polypropylene (PP) fiber, or jute fiber can be mixed with the concrete, and steel fiber-reinforced concrete, with which thin and short steel fiber is mixed, exhibits a similar performance as the generic concrete in terms of the elastic modulus, but offers greatly improved flexural ductility after the concrete cracks thanks to the ductile behavior of steel fiber [3,4,5].
When continuous flexural load is applied to concrete, tensile load is generated from the lower part, in which the deflection of concrete starts, and after the progress of fine cracks, if an amount of stress exceeding what concrete can withstand is applied, fracture is instantaneously generated [6]. When the transferred cracks come in contact with the fiber, the fiber is detached or extended from the surface due to the binding force between the fiber and the matrix, at which some energy is dissipated thanks to the different material properties of concrete and steel fiber.
The existing toughness evaluation methods of steel reinforced concrete often use the area up to a certain displacement of the load displacement graph. Among these methods, the flexural test using beam specimens is highly useful for toughness evaluation as it offers simpler specimen production and testing methods than any other test. The toughness evaluation method based on absolute values considers the area below the load displacement graph up to a displacement specified in the test method to be the energy absorbed by the steel reinforced concrete, and uses it as the toughness, whereas the other method based on relative values uses the ratio between the area below the load displacement graph up to the point at which the brittle failure of the material occurs, and the area of the nonlinear section. To date, Japan Society of Civil Engineers standard (JSCE SF-4), Japan Concrete Institute standard (JCI SF-4), European Federation of National Associations Representing for Concrete standard (EFNARC), Korean Standards (KS F 2566) and American Society for Testing and Materials standard (ASTM C 1609) are the typical toughness evaluation methods based on absolute values, and French Standard P 18-409 and American Concrete Institute (ACI) 544 Guidelines are those based on relative values as shown in Table 1 [3,4,5,6,7,8,9,10,11,12,13,14,15].
Most of the latter methods, however, determine the dimensionless index by selecting the initial crack point and using the ratio between the area under the load deflection curve up to the deflection at the initial crack point and the area up to a certain deflection, and considerable differences may result based on the initial crack point selected by the tester in evaluating the toughness of fiber-reinforced concrete. Additionally, such difference in the selected initial crack point greatly influences the index value, resulting in inaccurate evaluation results.
The evaluation methods based on absolute values do not have the same issue concerning the accurate selection of the initial crack point, but the end point corresponding to 1/150 of the span, which is usually selected in the test, is larger than the deflection limit that considers the usability of the regulations on fiber-reinforced concrete, and the difference in behavior before and after the initial crack occurrence can be distinguished; as such, the mixes with different load deflection curves cannot show the same toughness [8,16]. Such a symptom results in a small amount of load reduction after the first peak load in the flexural load displacement graph of steel fiber-reinforced concrete [17]. The small-reduction section in the graph generated by the differences in the physical properties of the two materials determines the starting location of the nonlinear graph that continues, and therefore, the energy transfer capacity in the load transfer section is believed to greatly influence the nonlinear section, which occupies most of the graph.
To improve the issues of the various toughness evaluation methods existing today, improvement measures should be applied equally to each specimen. Therefore, with the aim of evaluating the correlation in the overall toughness, this study conducted an assessment based on absolute values, and extracted a regression analysis model by analyzing the different load transfer properties based on the fiber type and the variation of the fiber contents (by volume) in the load transfer process to fiber after the concrete matrix cracking, and by extracting the key factors contributing to fracture delay in the fiber section. The comparison with the reinforcing rebar is not meaningful in this study due to totally different stress distribution and facture mechanism compared to the fiber-reinforced concrete.
2. Materials and Methods
2.1. Fibers
Hooked steel fiber (H-SF) by Kumkang Company, Hwaseong, Korea and crimped steel fiber (C-SF) and crimped stainless steel fiber (C-SLF) by SeAH Company, Busan, Korea were used as the steel fiber in this study. The length of the steel fiber (lf) was 35 mm, its diameter (df) was 0.5 mm, and its aspect ratio (lf/df) was 70. The fiber type was determined by considering that, to prevent the uneven distribution of fiber due to the wall effect, the value should be smaller than the section of the specimen used in the toughness assessment method divided by 2.5 [18]. The study used the hook-type steel fiber glued in parallel using a water-soluble adhesive that does not affect the workability, and crimped steel fiber (general and stainless) that does not use adhesives. Table 2 shows the key properties and detailed images of the different fiber types that were used in this study.
2.2. Mix Design
Grade 1 regular Portland cement was used to examine the flexural behavior characteristics of steel fiber-reinforced concrete, and the aggregate by Kunwoo Company, Ulsan, Korea was used for the fine and coarse aggregates. In the case of the coarse aggregate, the density of the saturated surface dry condition was 5711.1 g/cm3, the dry density was 5677.7 g/cm3, the absorption rate was 0.59%, and the maximum measurement was 19 mm, and in the case of the fine aggregate, the density of the saturated surface dry condition was 500.7 g/cm3, the dry density was 485.3 g/cm3, and the absorption rate was 3.03%.
Polycarboxylate superplasticizer by Dongnam Company, Pyeongtaek, Korea was used to prevent the reduction of the workability when mixing fiber to concrete, and to improve the formability and durability by stably entraining the fine air pockets inside the concrete. The physical properties of the aggregates are shown in Table 3, and the mix design is shown in Table 4.
2.3. Equipment and Test Procedure
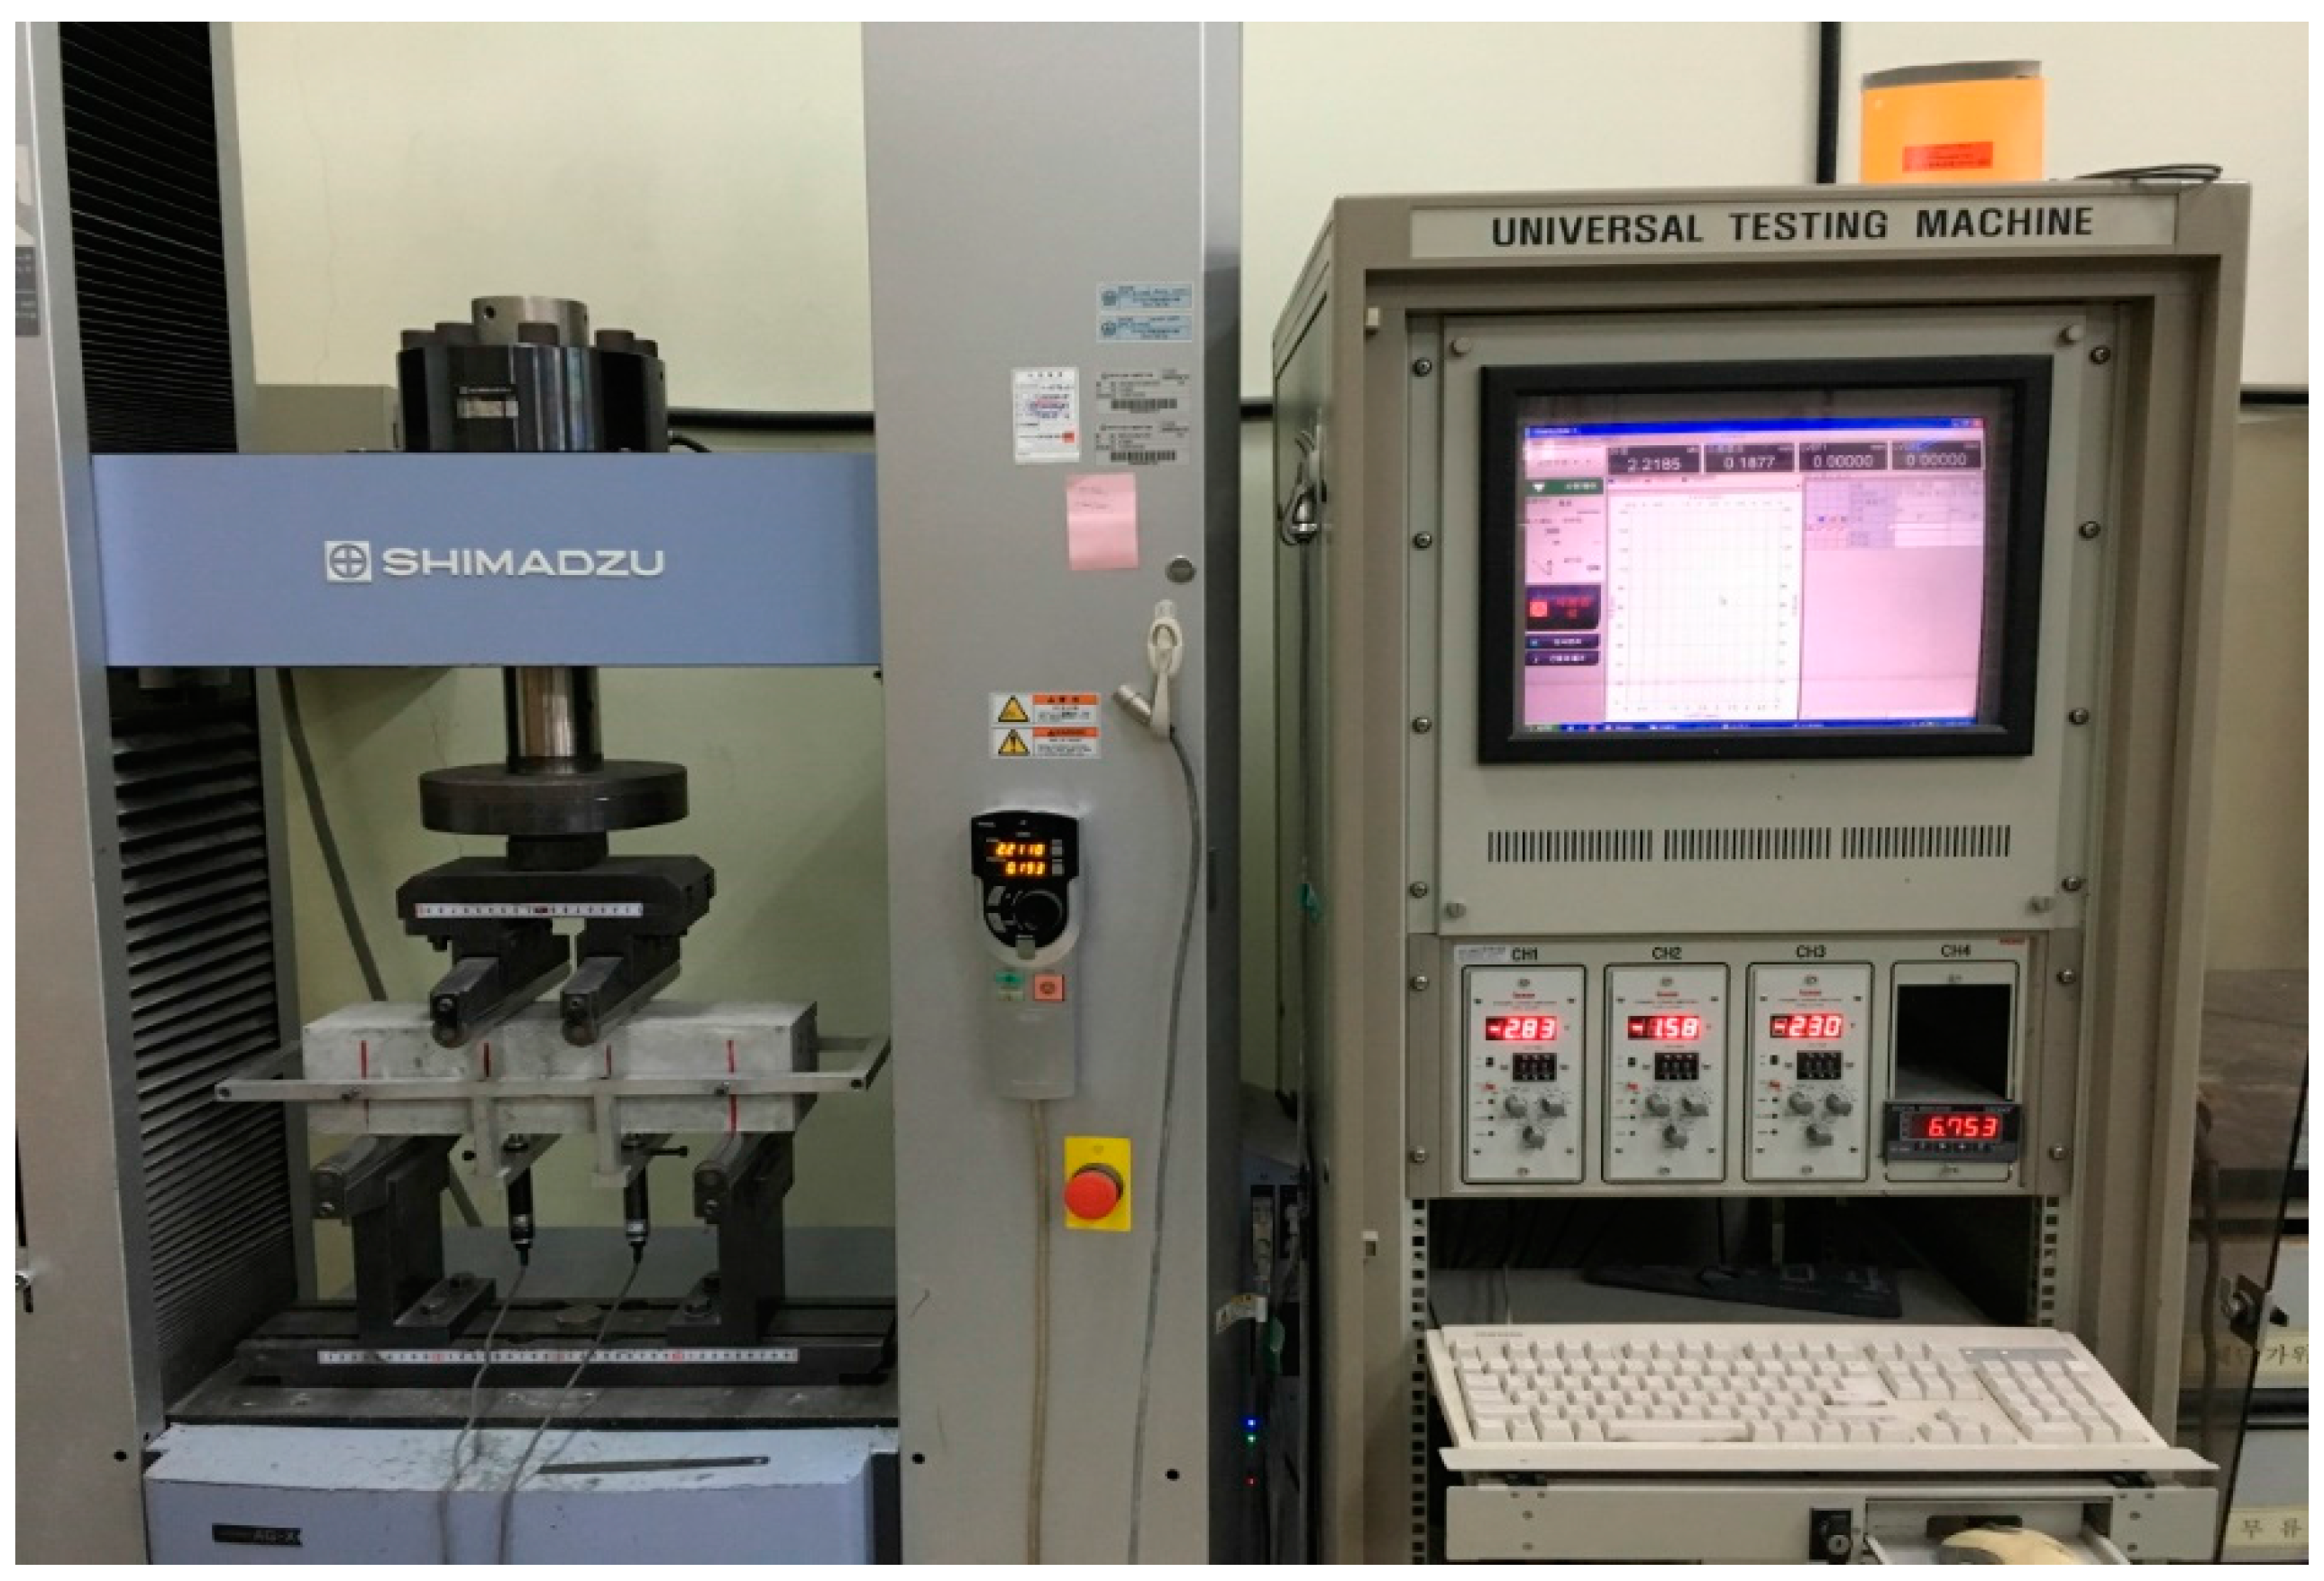
The production of the specimen for the flexural behavior characteristics test and toughness assessment was based on “Flexural Performance Testing Method for Fiber-reinforced Concrete” in Korean standard (KS F 2566:2014) [10] The specimen section was square-shaped, and the length of each side was set to 10 mm as the length of fiber did not exceed 35 mm. As a result, three 100 × 100 × 400 mm specimens for all types were created. For the accurate deflection measurement, the test used a loading device with rotational hinges at the point for the flexural testing, as shown in Figure 1, and to measure the pure deflection at the center of the specimen, linear variable differential transducers (LVDT) were attached to both sides of the mid-span, and a data logger was used to measure and record the deflection. The increase rate of the tensile stress was set to 0.06 ± 0.04 MPa (N/mm) per second. Using the load deflection data from the flexural test, the toughness of the specimen was derived by calculating the area below the load displacement graph up to 2.0 mm, which corresponds to 1/150 of the span. Furthermore, by calculating the area below the load displacement graph corresponding to the first peak loading point, the load reduction point, and the second peak loading point, the relation between the load transfer section and the subsequent flexural behavior was analyzed [10,19].
3. Experimental Results
3.1. Flexural Strength
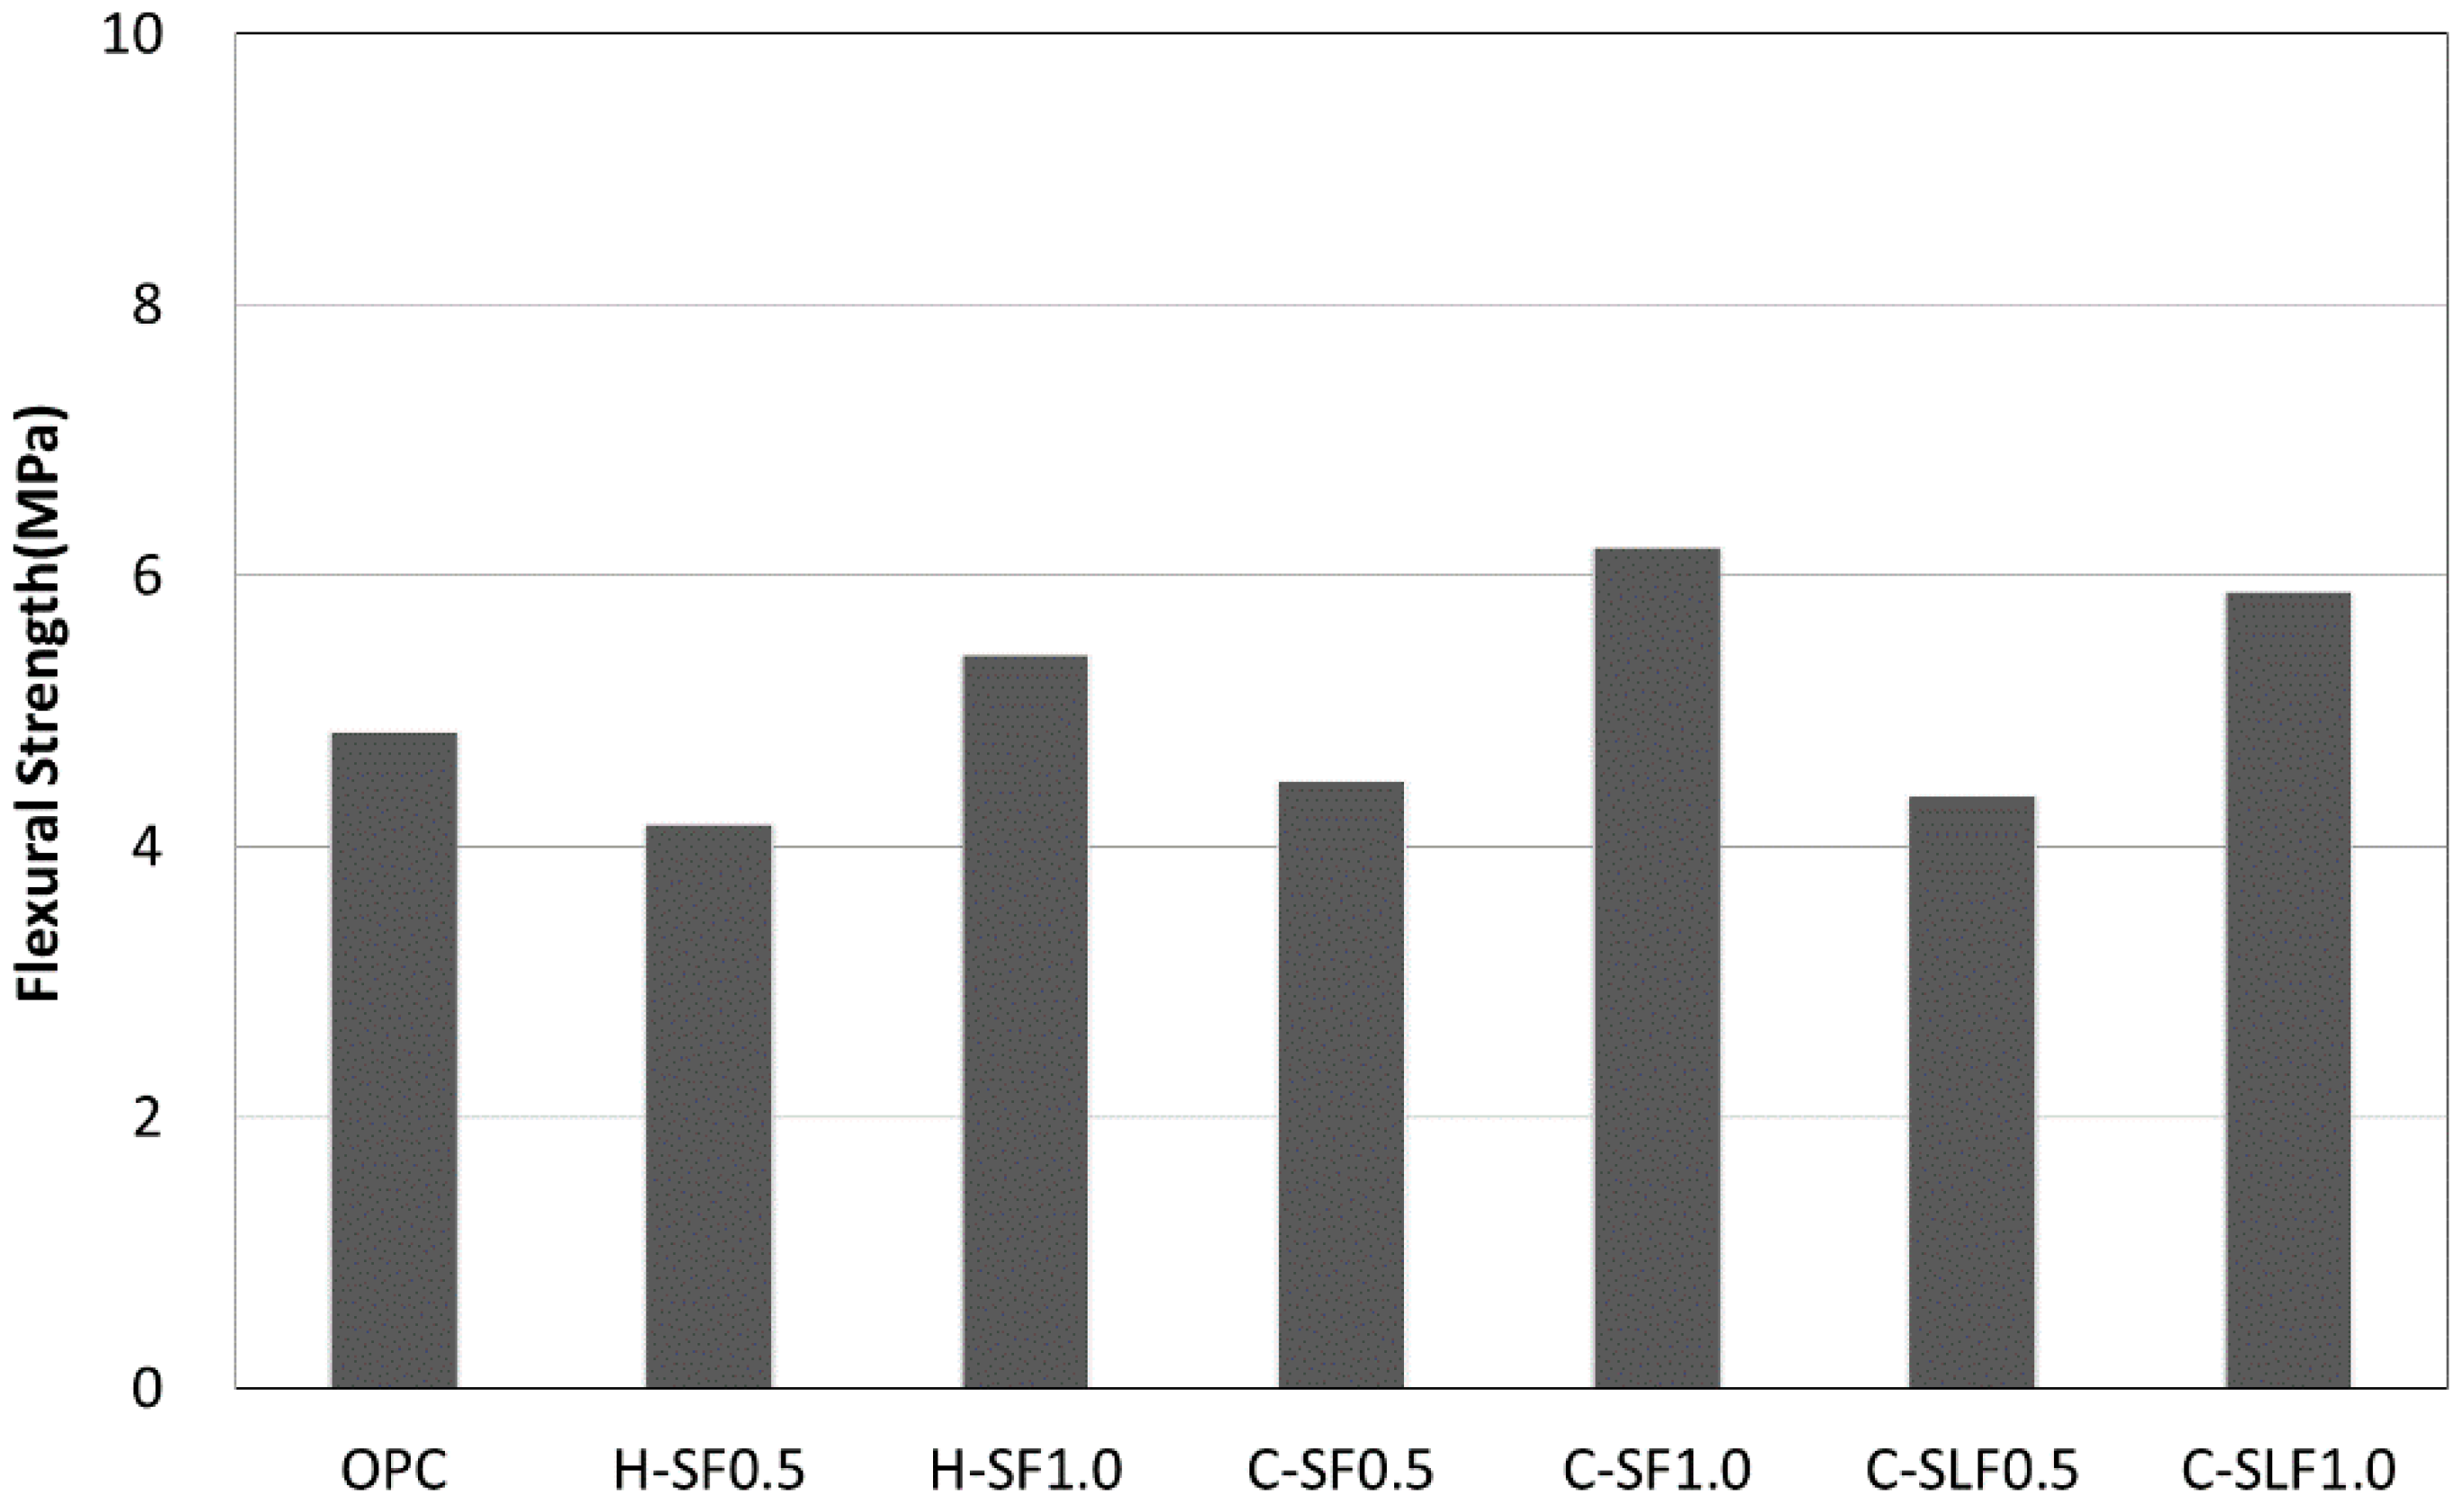
Shown in Figure 2 are the flexural strength results of all the specimens. The specimen mixed with 0.5% steel fiber showed 8–14% strength reduction compared to the ordinary Portland cement (OPC) specimen, and the specimen with 1.0% steel fiber showed 11–28% improved strength compared to the OPC specimen. The specimen with 0.5% steel fiber, however, showed a strength reduction rate within the error range of the strength of the OPC specimen, and the other specimen with 1.0% steel fiber showed some degree of improvement by mix.
3.2. Flexural Behavior Characteristics
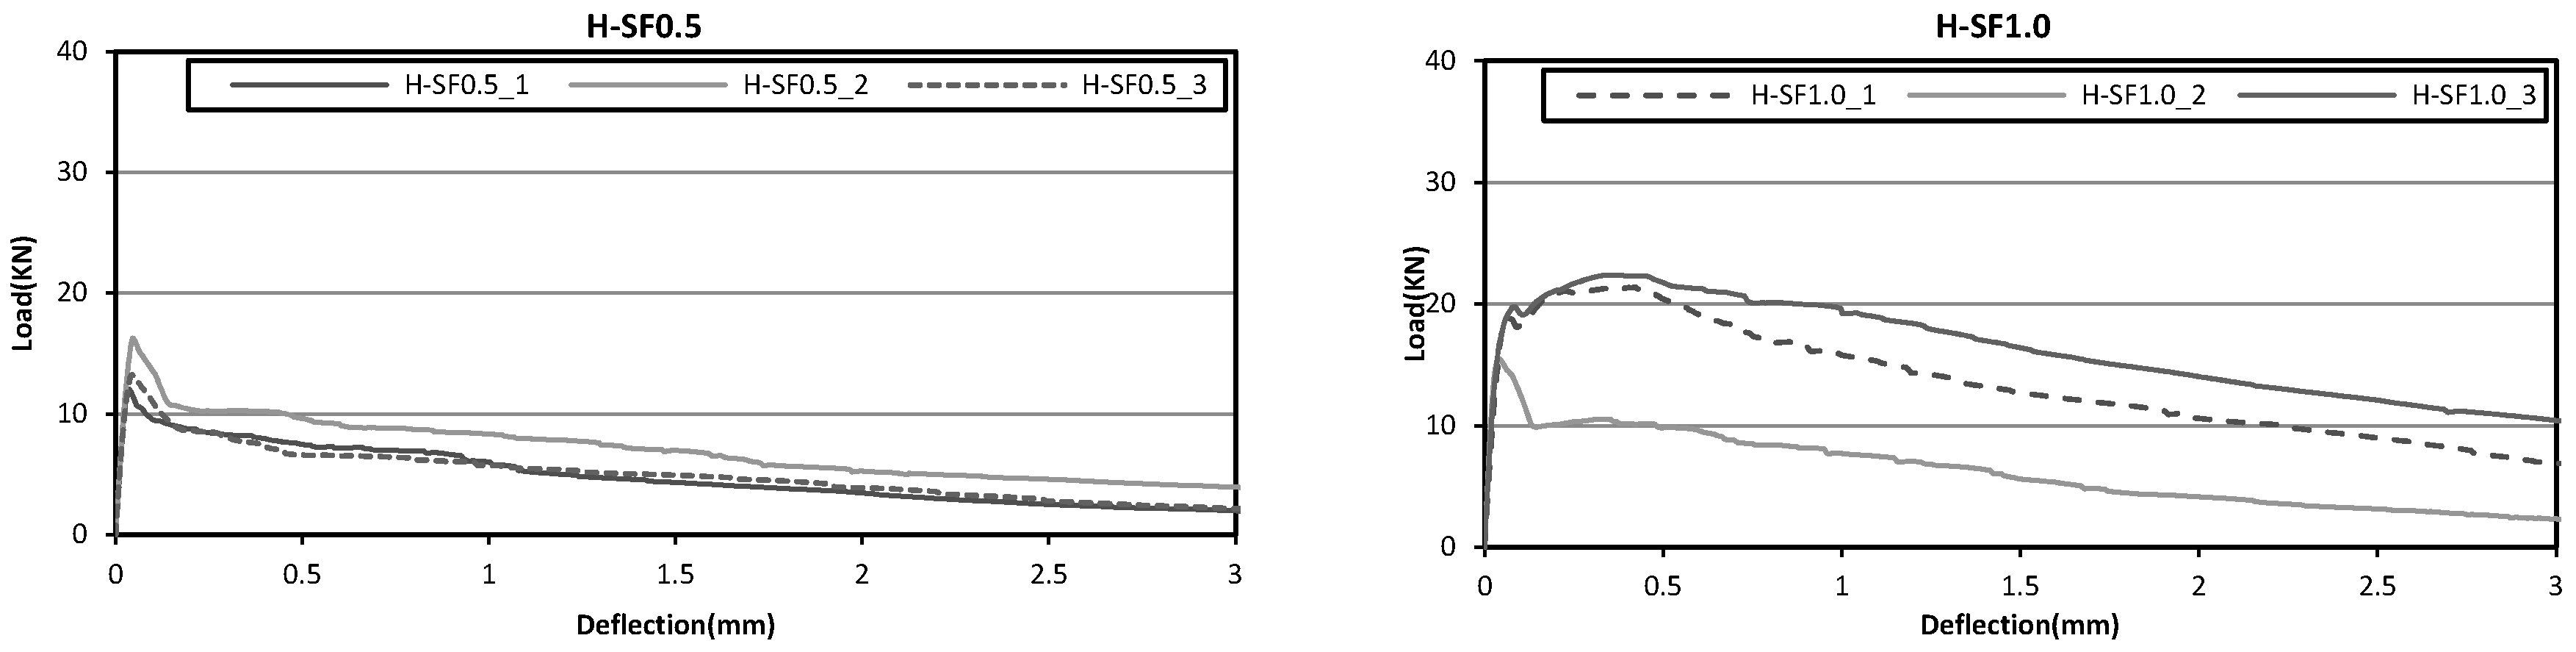
The flexural characteristics test of the OPC specimen showed that its strength declined drastically after brittle failure, but the flexural load displacement curve of the specimen mixed with steel fiber, as can be seen in Figure 3, showed the load declining after brittle failure, and as the load was being transferred to steel fiber, the remaining strength was maintained. The test confirmed the existence of different flexural behavior characteristics after the failure of the concrete matrix, such as gradual or drastic deflection softening and deflection hardening, depending on the steel fiber type and the mix amount. Specifically, the concrete mixed with 0.5% hook-type steel fiber (H-SF 0.5%) exhibited a relatively faster load decline at the maximum load, but when the mix amount was increased to 1.0% (H-SF 1.0%), the load transfer to the fiber after the crack occurrence progressed rapidly, and the load based on fiber bridging was shown to have gradually decreased after the maximum load was reached. The crimped general steel fiber (C-SF 0.5%) exhibited similar characteristics as the hook-type steel fiber (H-SF 0.5%), but in the process of load reduction, it showed a slight load increase. Similar to the hook-type steel fiber (H-SF), the crimped general steel fiber (C-SF 1.0%) showed a gradual load decline after the maximum load was reached. In conclusion, depending on the steel fiber type or fiber content, different pullout resistance effects in the process of the load transfer to the fiber, such as a gradual pullout after a sharp load fall, a rebound after a slight decline, and a nonlinear increase without load reduction, resulted after the failure of the concrete matrix.
3.3. Flexural Toughness Assessment Results
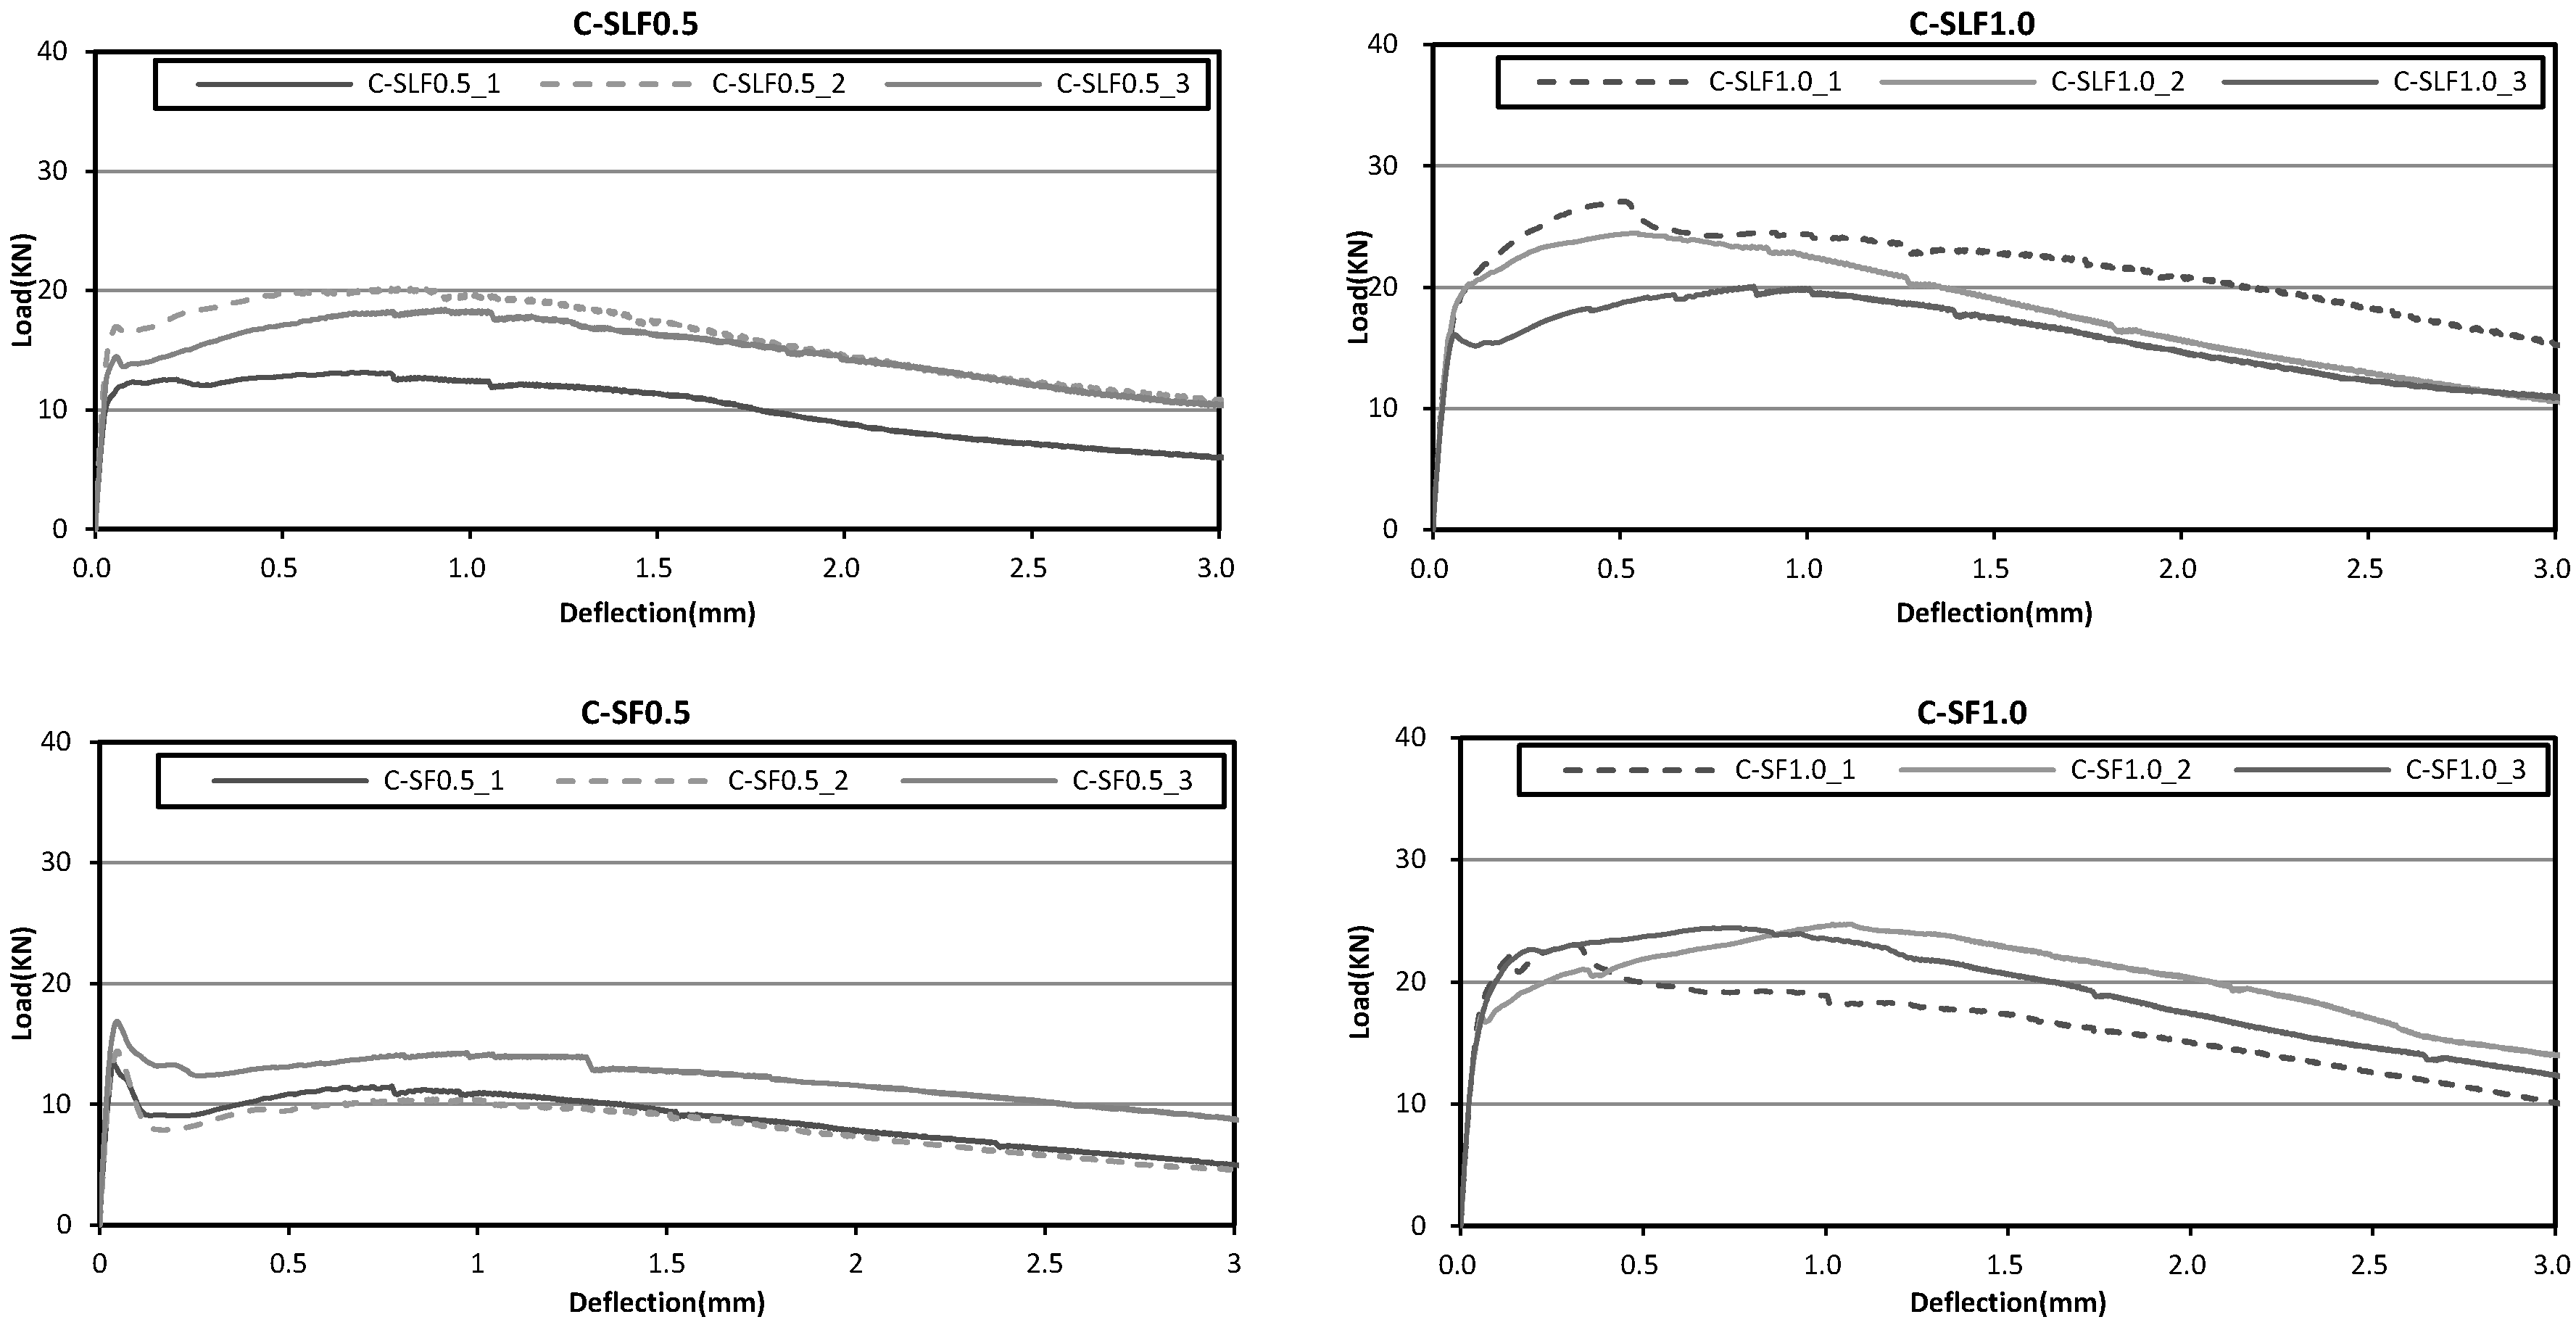
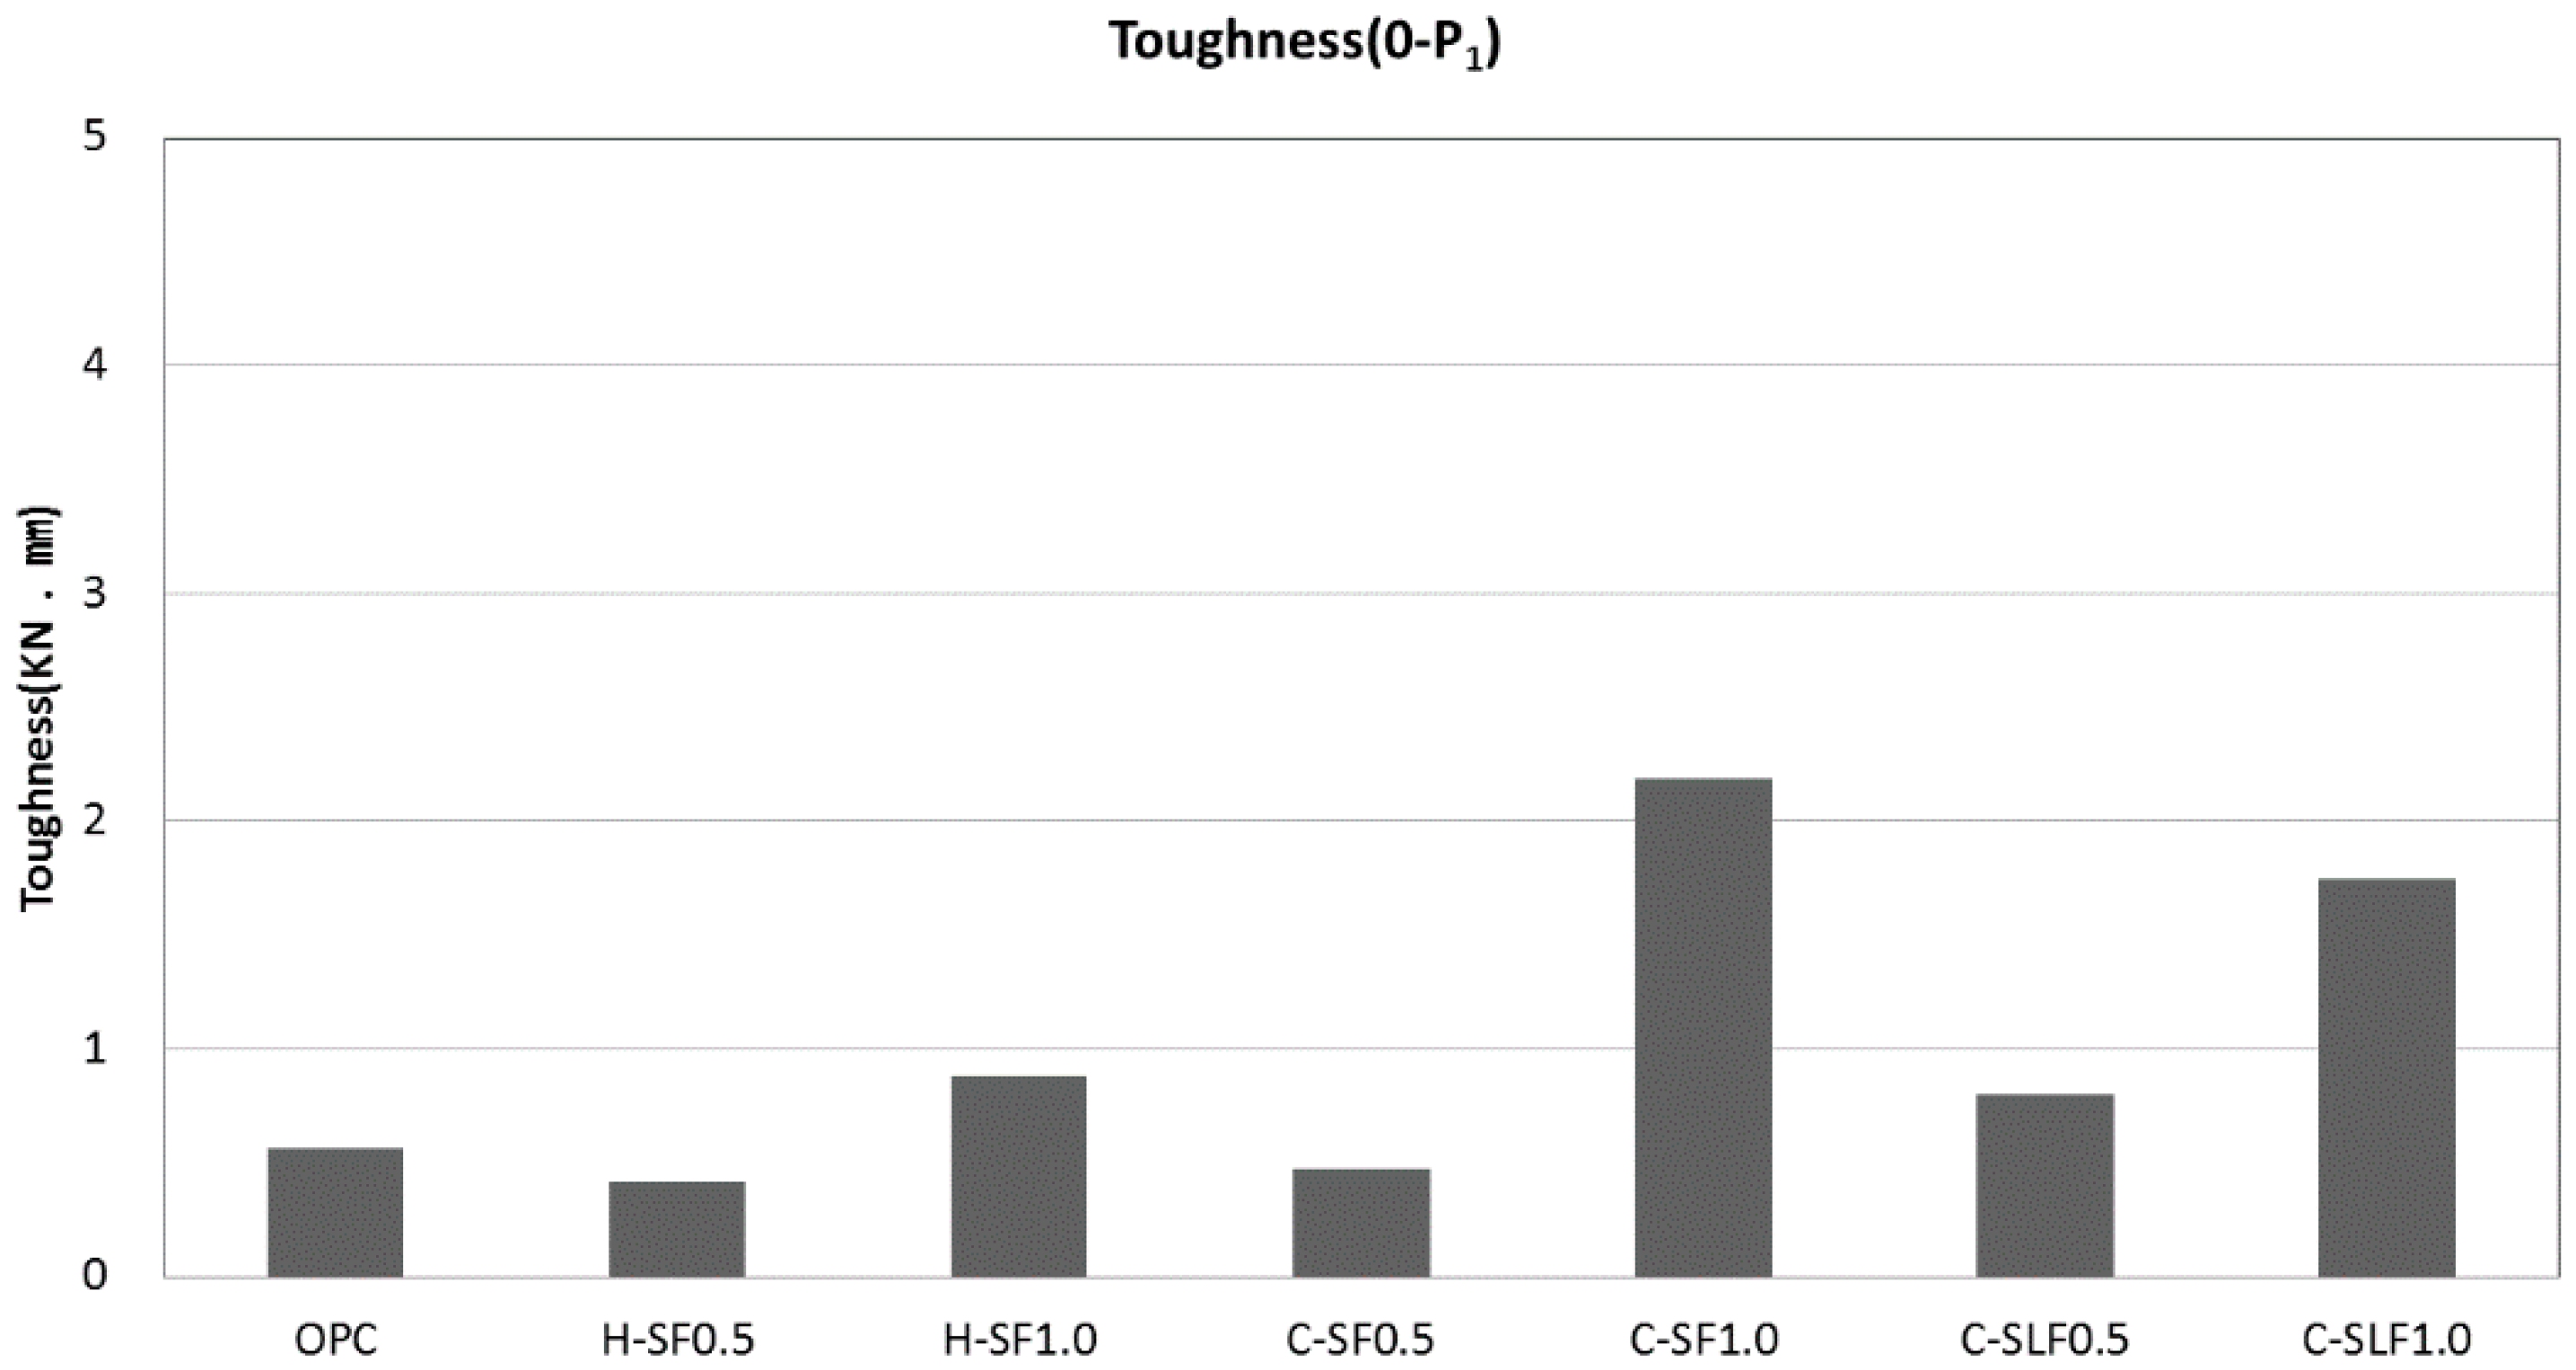
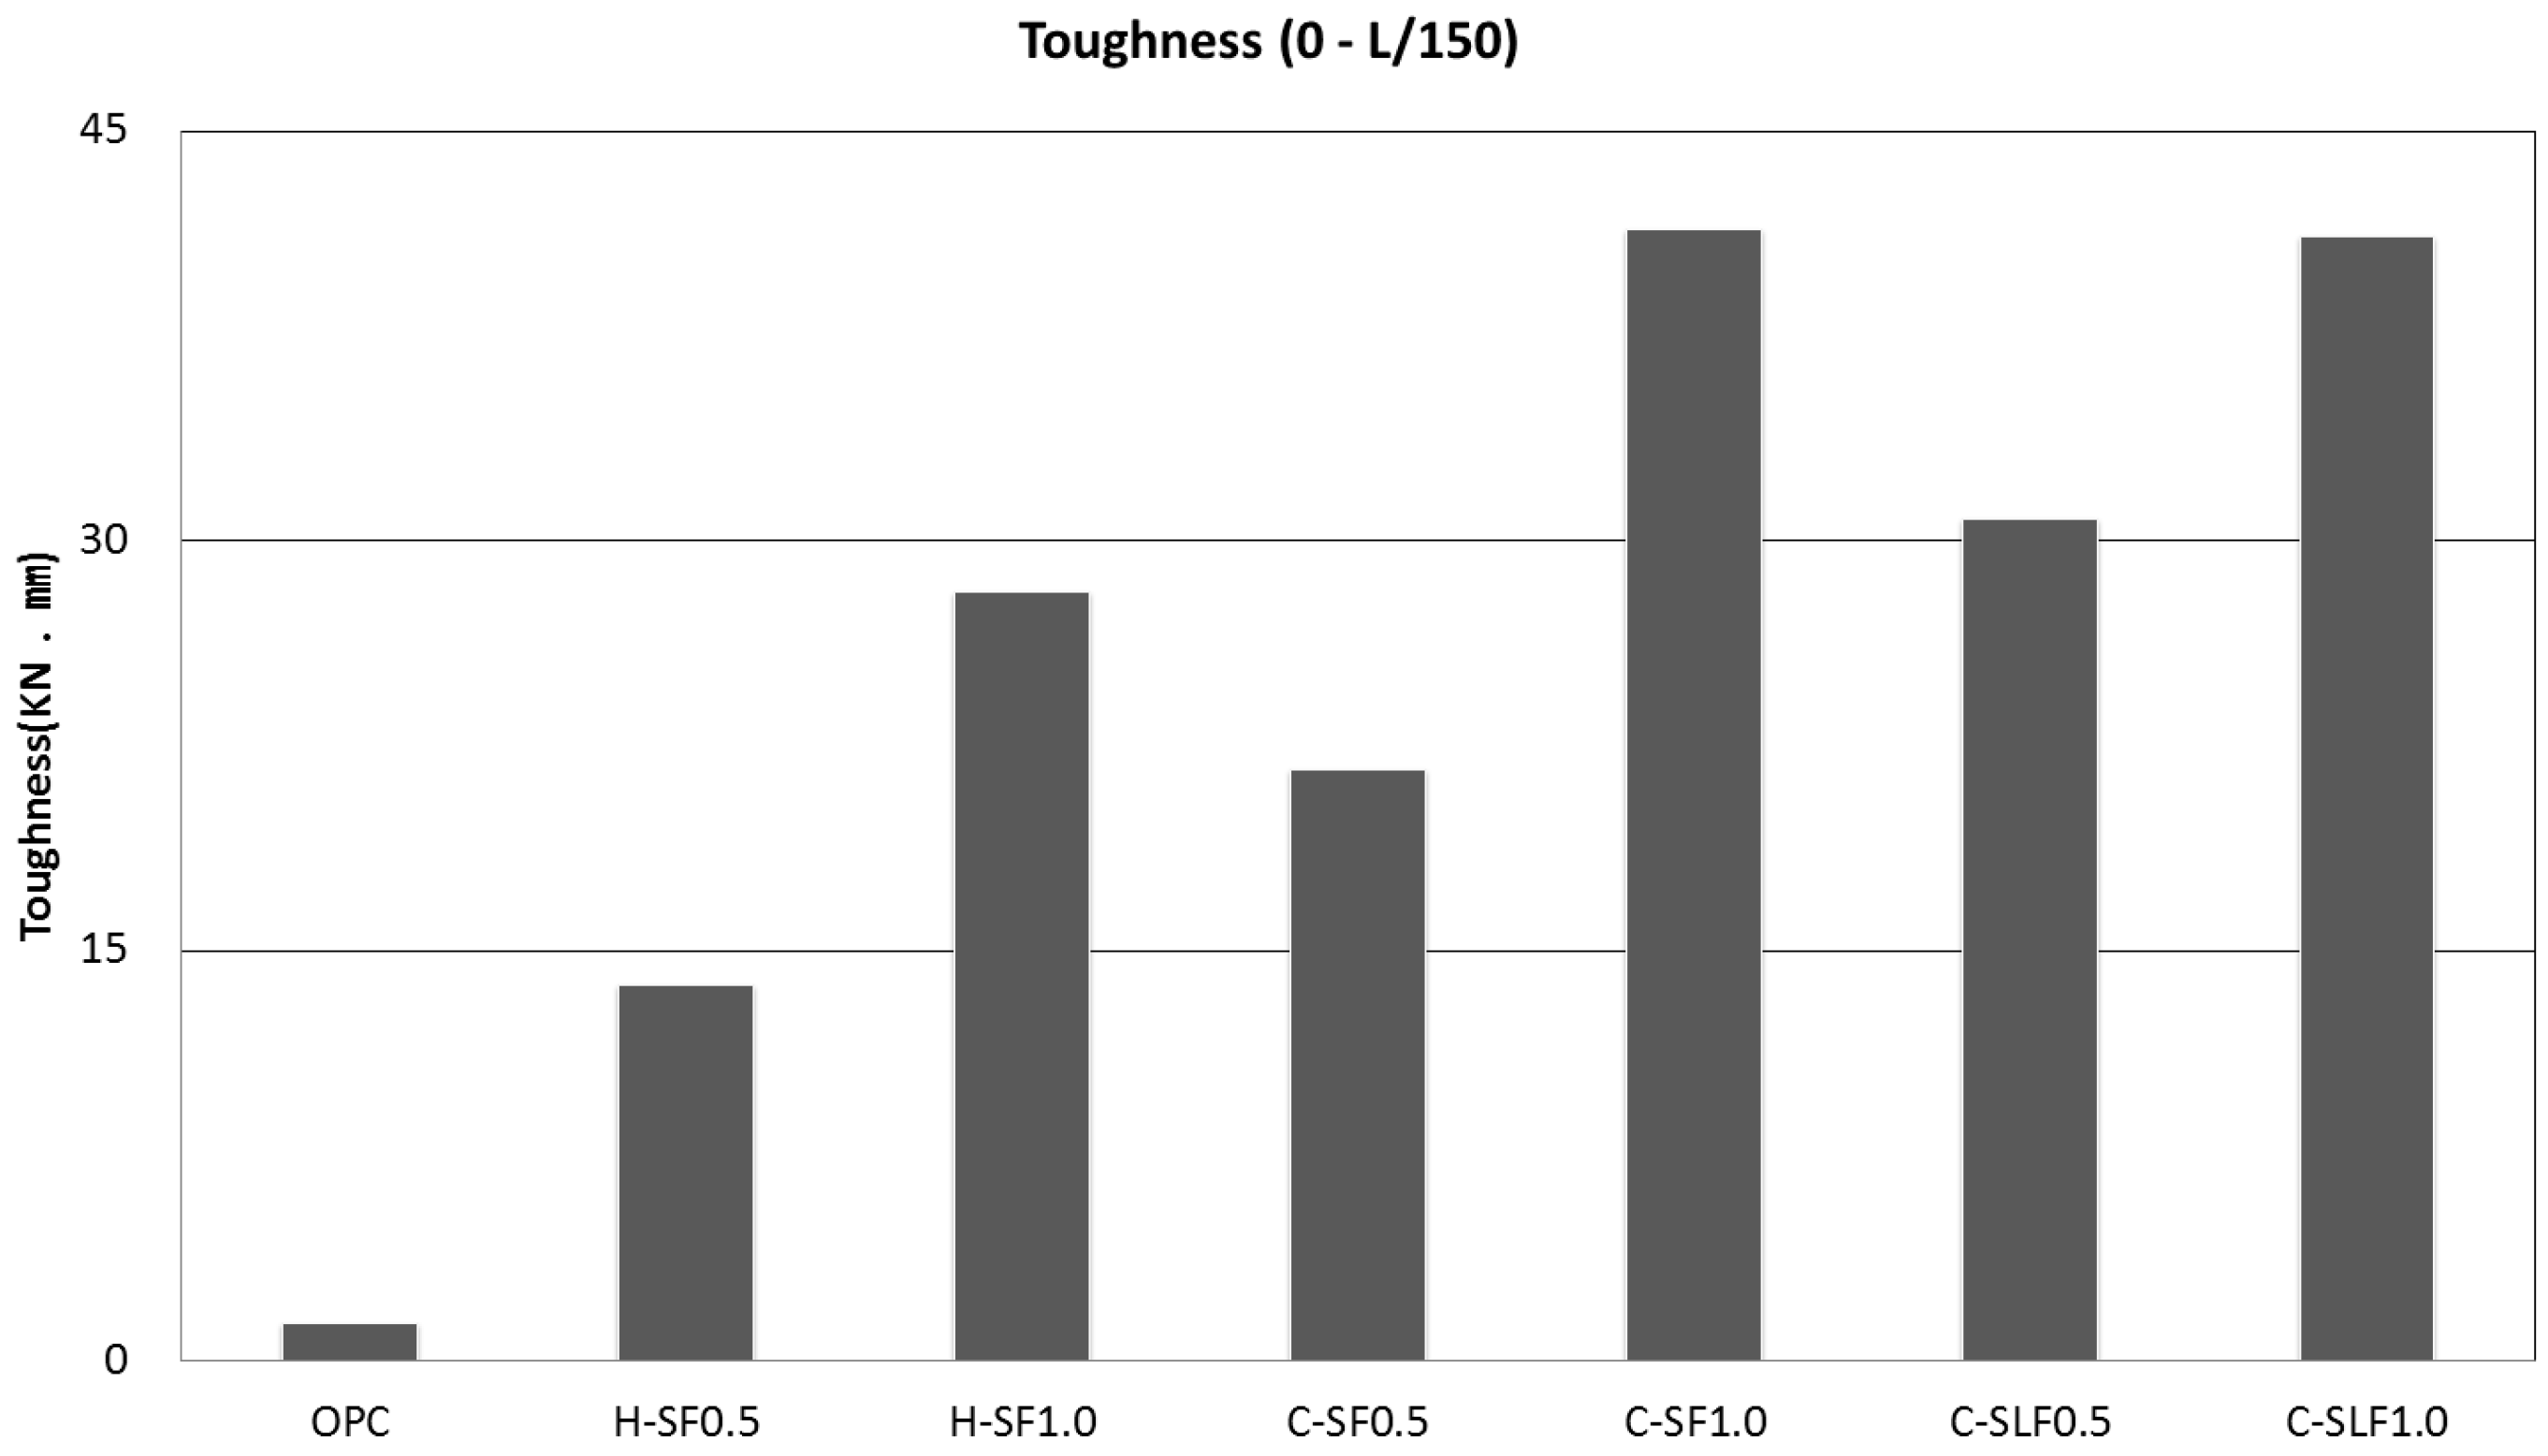
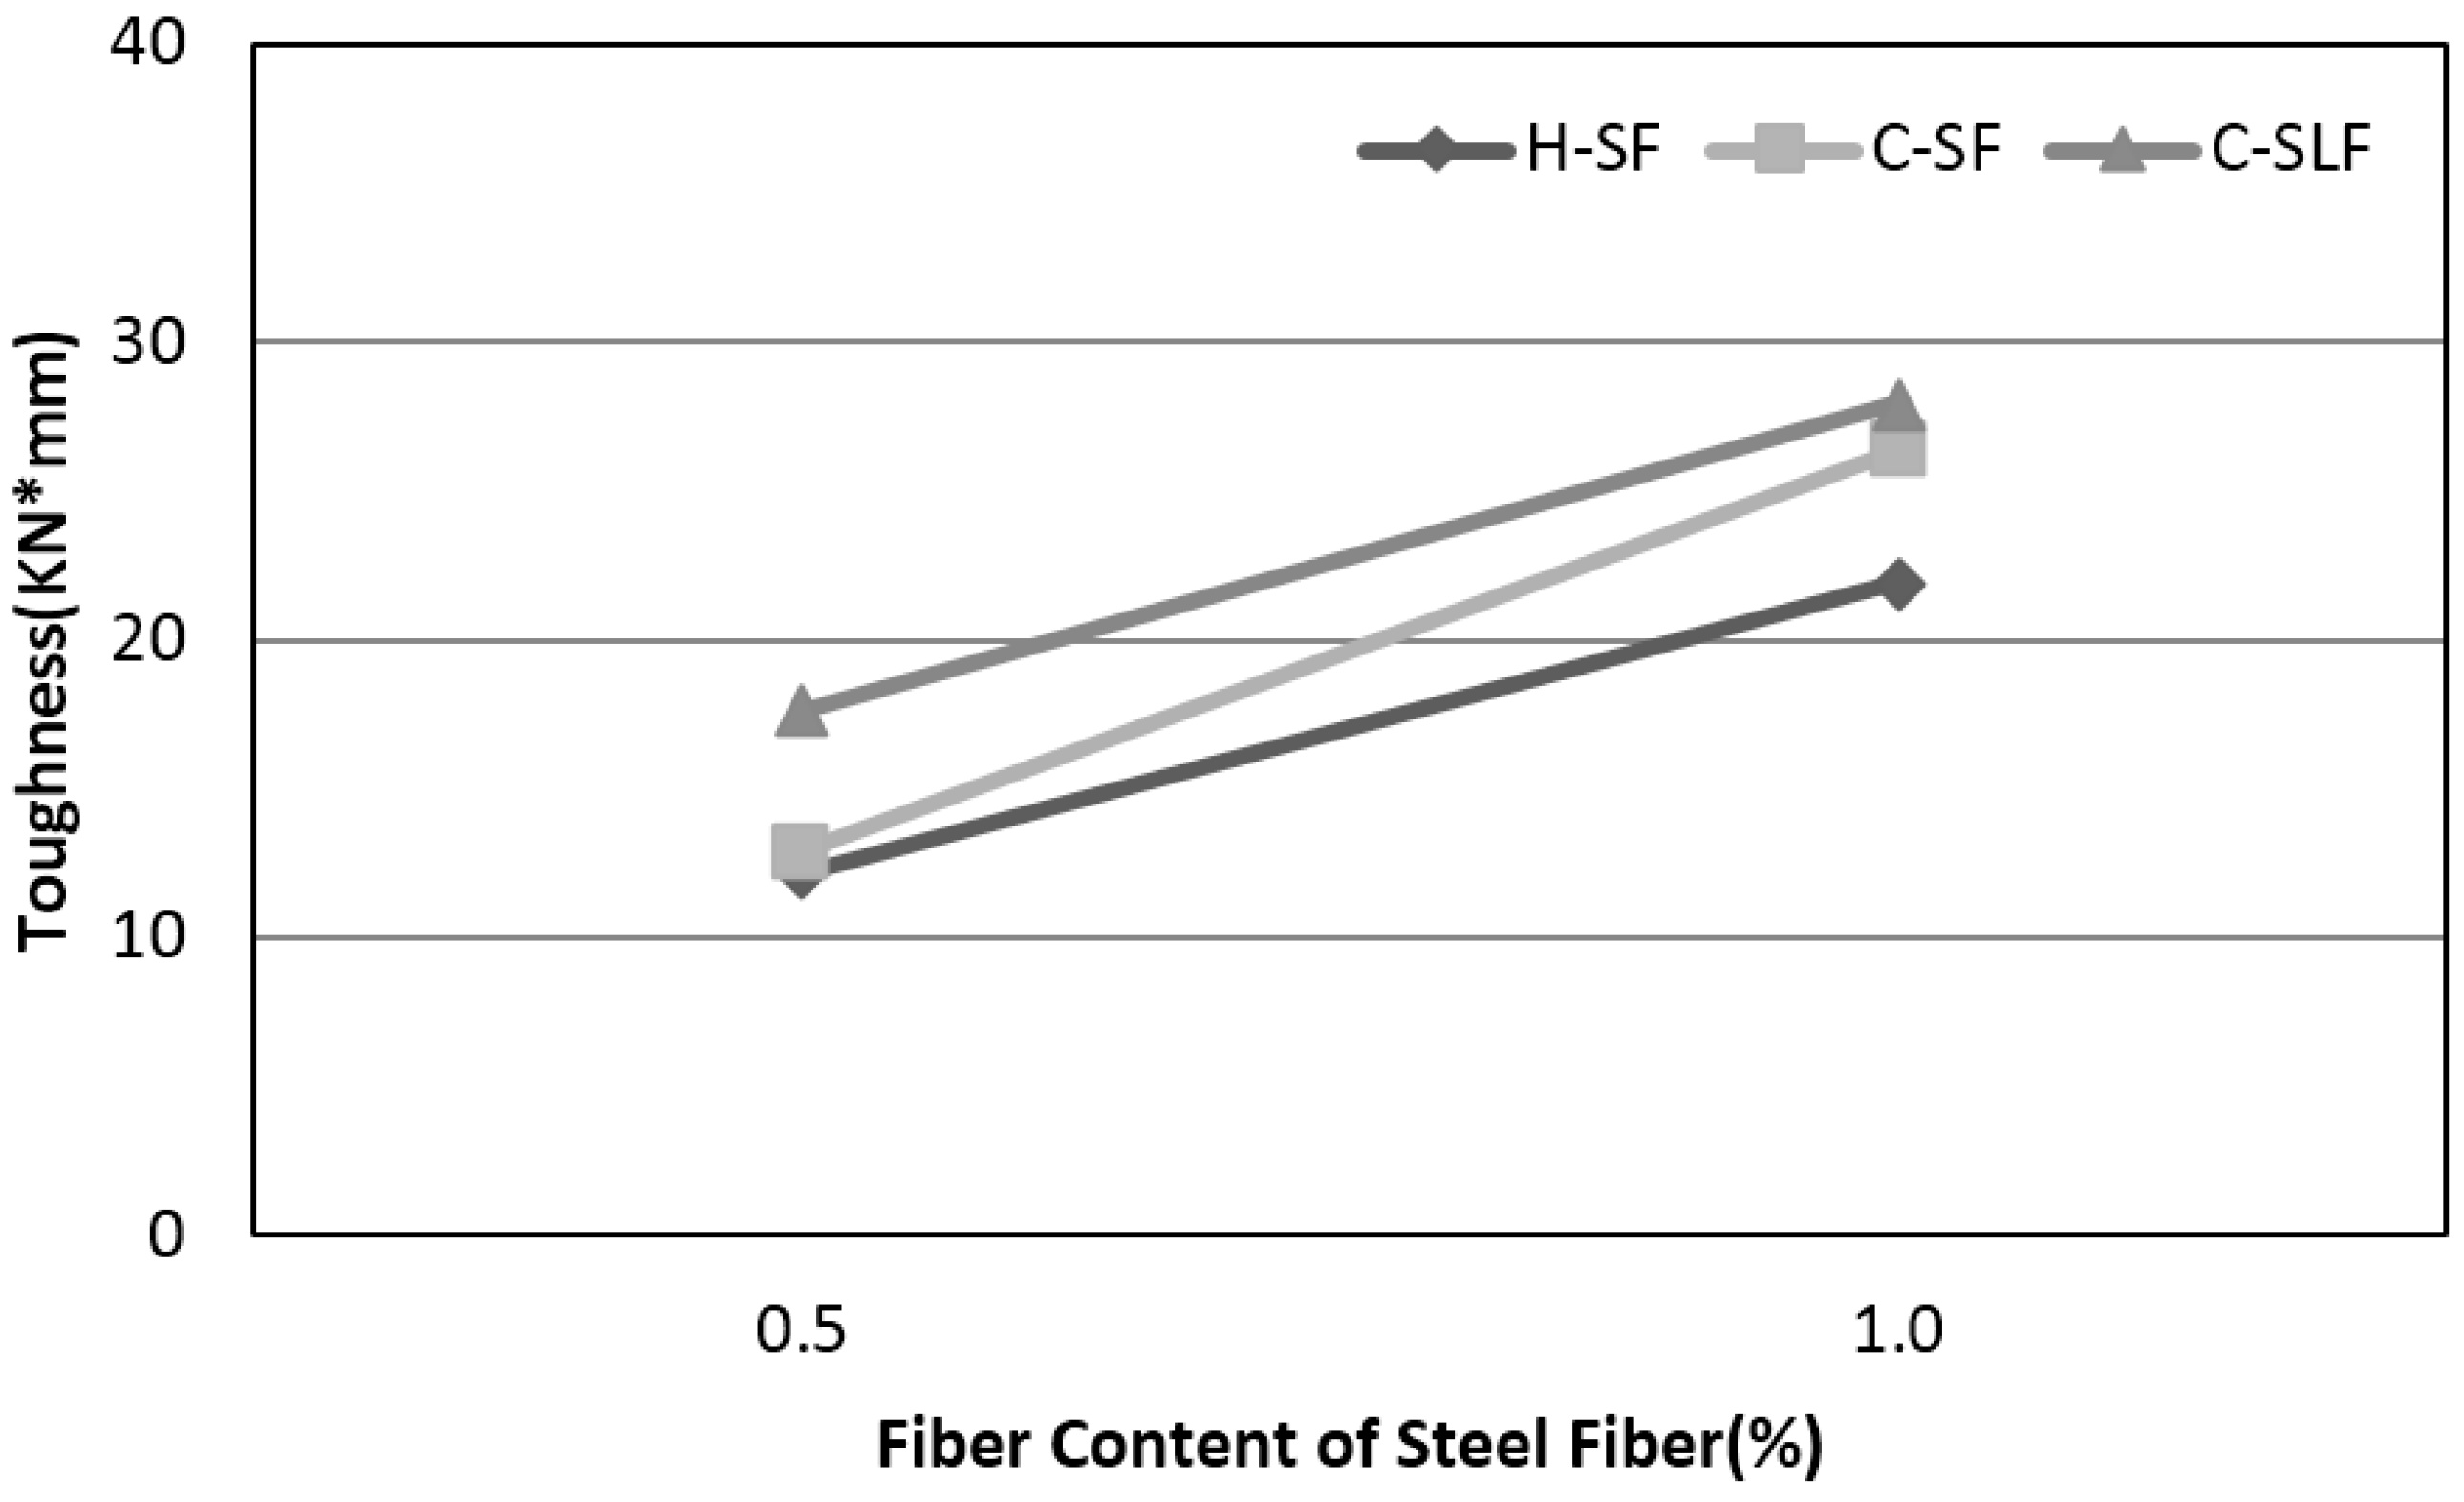
Figure 4 shows the area up to the first peak load of the specimen, and Figure 5 shows the overall toughness. Although there was a small difference in toughness among the specimens up to the point of concrete matrix failure, as shown by the failure mechanism of steel fiber-reinforced concrete, a drastic increase in toughness was identified when the fiber behavior section was included. The overall toughness of the steel fiber-reinforced concrete (H-SF, C-SF and C-SLF) drastically increased compared to that of the ordinary Portland concrete (OPC), but the toughness of the specimens with 1.0% steel fiber was shown to have improved by 30–100% compared to that of the specimens with 0.5% steel fiber. In the case of the H-SF and C-SF specimens, the toughness of those with a 0.5% steel fiber content was 13.76 and 21.63 KN-mm, respectively, and that of those with a 1.0% steel fiber content was 28.11 and 41.36 KN-mm, respectively, demonstrating that the C-SF specimens with crimped steel fiber exhibited superior toughness compared to the H-SF specimens. C-SLF showed a higher energy absorption property than the H-SF and C-SF specimens in all the fiber contents.
4. Analysis and Discussion
4.1. Analysis of the Flexural Behavior Characteristics
The load displacement curve of the steel fiber-reinforced concrete illustrated that with fiber mix, the concrete after failure would show a rapid load decline, a gentle load decline, or a smooth load increase depending on the fiber bridging capacity. Different remaining loads and toughness variation resulted from the pullout resistance effect of steel fiber, and generally, the increase in the fiber content tended to show a marked increase in the remaining load and toughness. It is believed that this was because, in the load transfer process to the steel fiber after the initial concrete matrix cracked, the steel fiber under load delayed the cracks as it went through the process of load bridging, pullout and fracture [19,20,21,22,23]. It is also believed that this was because after the brittle failure of the concrete, it was the steel fiber that affected the behavior of the specimens, and therefore, the behavior of the load displacement graph after the first peak load changed depending on the shape and type of the steel fiber. The test verified that C-SF and C-SLF showed superior remaining load and toughness in all the fiber contents with H-SF, which is manufactured through the thin-plate cutting method.
4.2. Load Transfer Types by Fiber Content and Material Properties
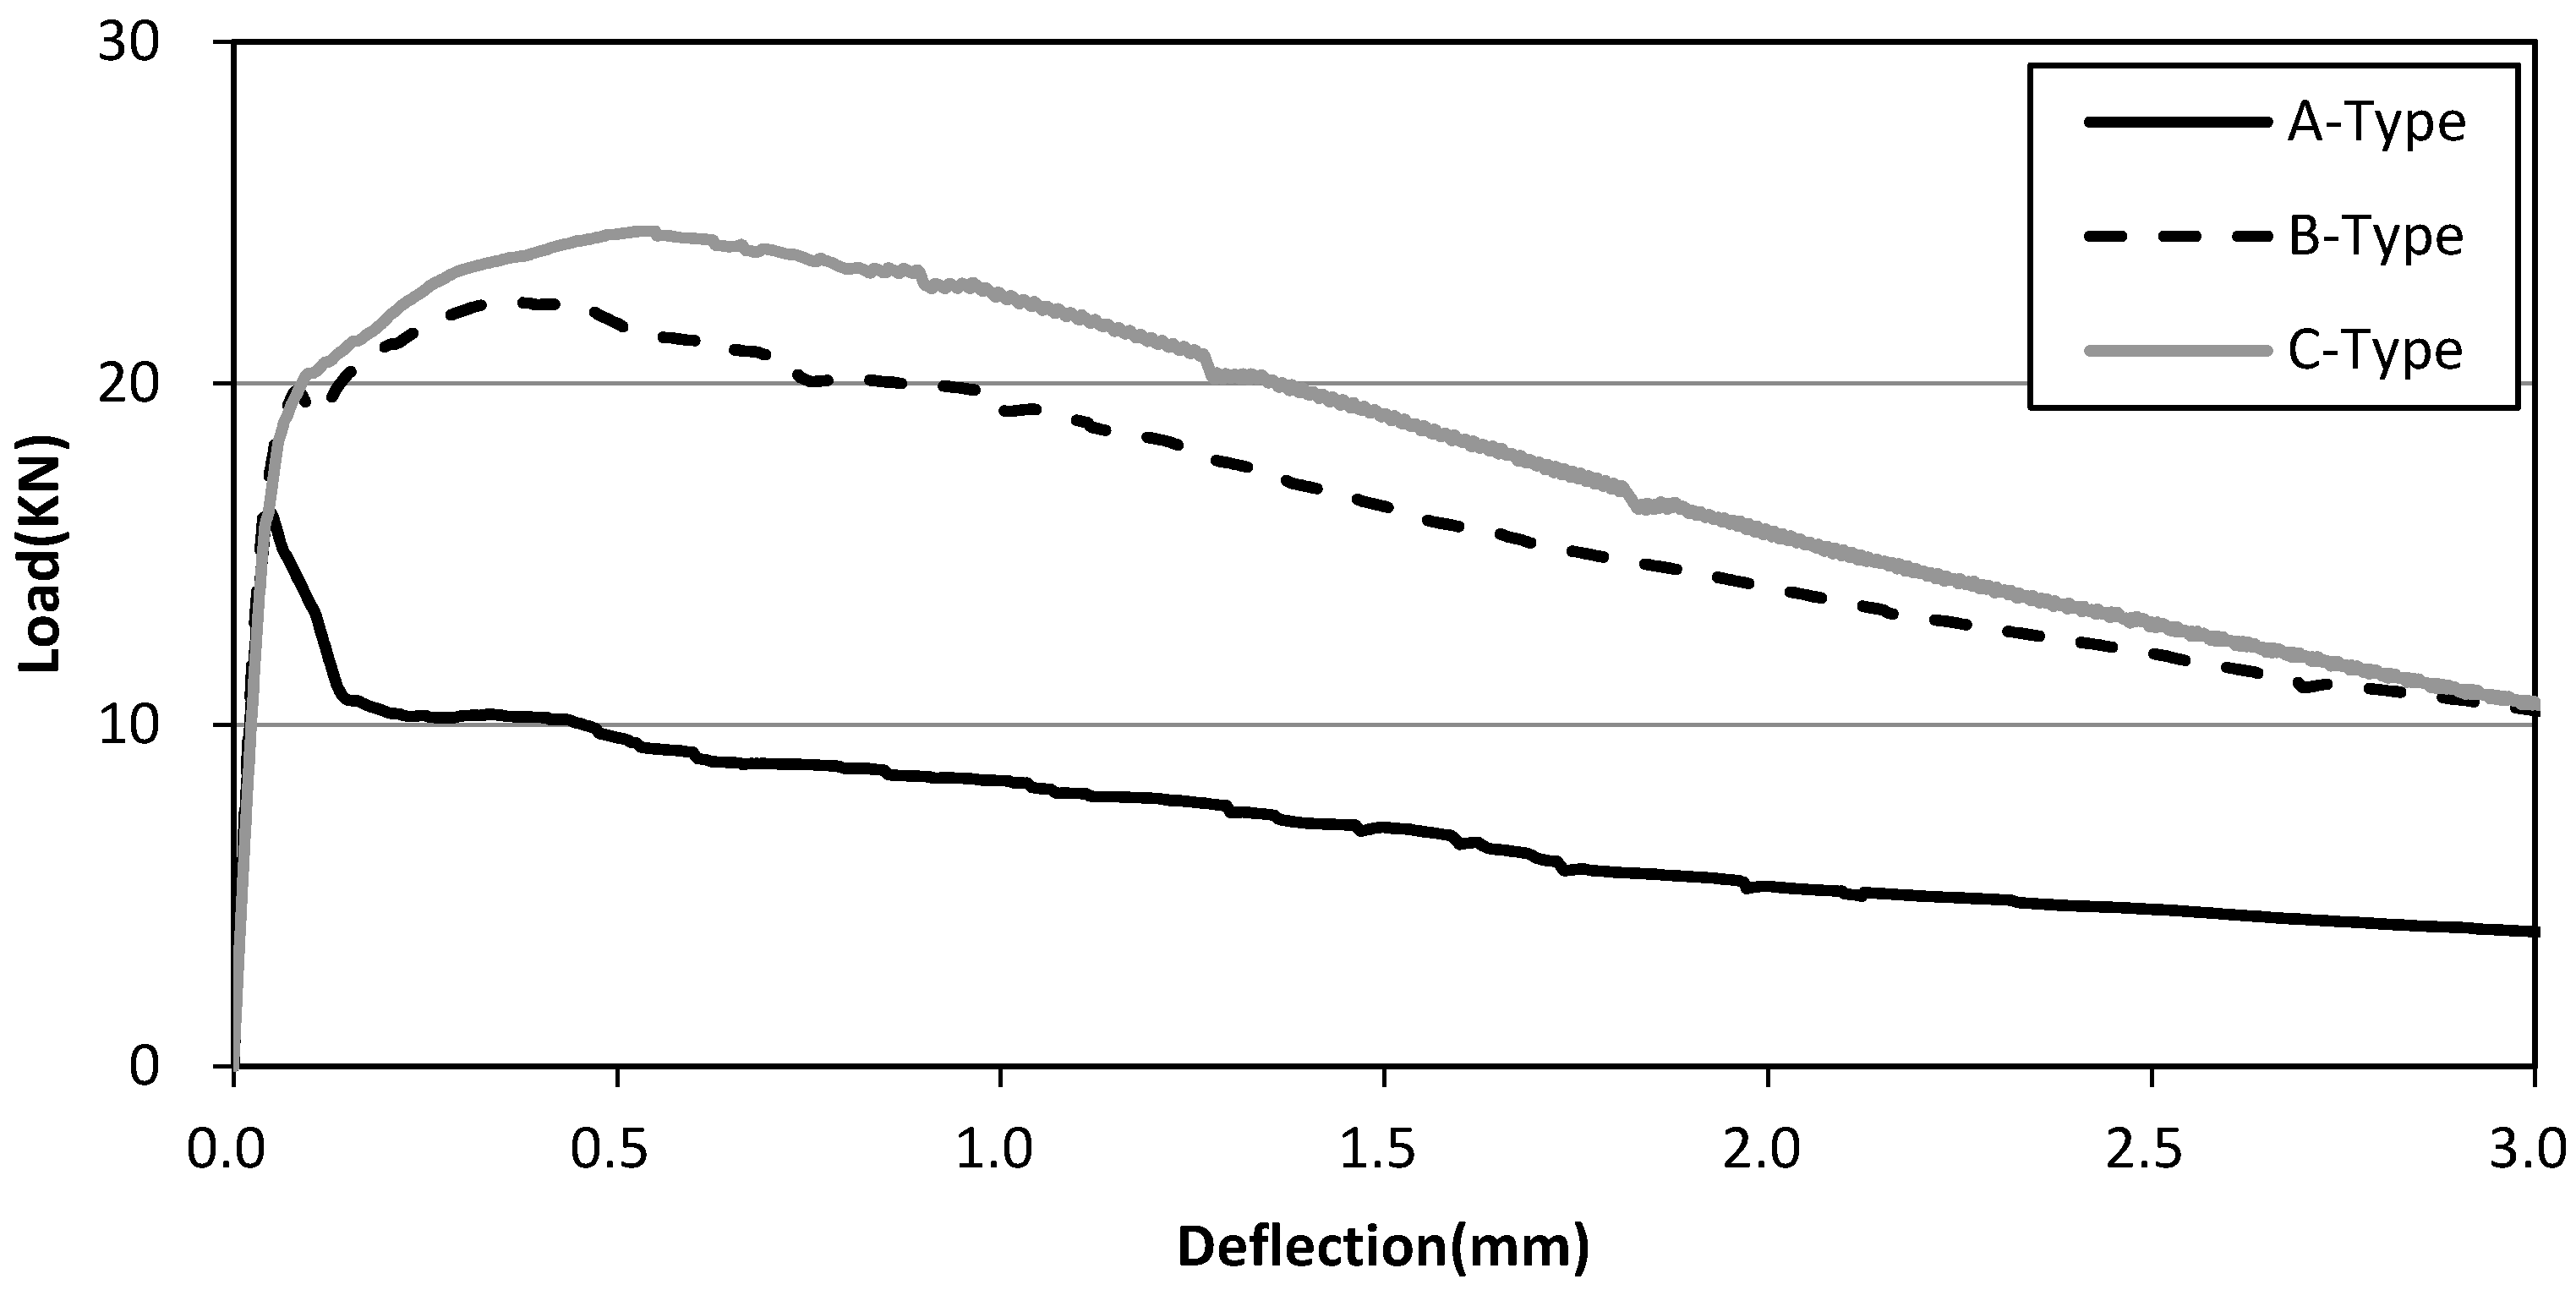
As shown in Figure 6, three different behavioral types of the load displacement curve of the steel fiber-reinforced concrete were identified from the analysis of the flexural behavior characteristics, from which some principles among the fiber contents, material properties, and the load displacement curve were derived. First, the smaller the fiber content and the lower the tensile strength of the fiber, the wider and more drastic the load reduction that was detected in the section where the load was reduced after the first peak load was reached (type A). Second, the greater the increase in the fiber content and the higher the tensile strength of the fiber , the longer the load displacement curve increased over the first peak load after a slight load decline (type B). Finally, after the cracking of the concrete matrix, the load transfer to the fiber increased nonlinearly, without any load reduction (type C).
4.3. Load Displacement Curve Analysis by Material
For a detailed analysis of the flexural behavior characteristics, the curve was divided into zones based on the load transfer type. First, as with the other toughness assessment methods, the point at which brittle fracture occurred on the load deflection curve was considered the first peak load point, and the section was set to the first section (sections 1a and 1b). Section 1a was the zone where the concrete matrix exhibited elastic behavior, and Section 1b was the zone where fine cracks occurred with curved behavior up to the first peak point. These two sections were separated from each other based on the fact that the elastic behavior of the material showed a straight line. When a linear regression curve of a linear equation (y = ax) was applied to the load displacement graph, the maximum displacement in which the coefficient of determinant to the actual load displacement graph was 0.99 or higher was set as the end of section 1a, and the curved-behavior zone from the end of section 1a to the first peak load point was set as section 1b. The second section was the load reduction zone caused by the different material properties in the load transfer process to the steel fiber after the first peak load. The third section was the load reascending zone due to the interaction between the steel fiber and the surface to which the concrete was attached, which was from the end of the second section to the second peak load point. The fourth section was the zone where load reduction occurred as the remaining load was gradually dissipated, which was from the end of the second section if the third section did not exist, or from the end of the third section to 2.0, the end point of the overall toughness. Shown in Table 5 is a summary of the range of each section, and Figure 7 shows the diagram of the slope and area (toughness) by section.
The regression analysis targeted a total of six types of steel fiber-reinforced concrete, and due to the characteristics of the regression curve in which the nonlinear and linear zones coexisted, the standard equation was a quadratic equation (Equation (1)).
4.4. Regression Curve Analysis
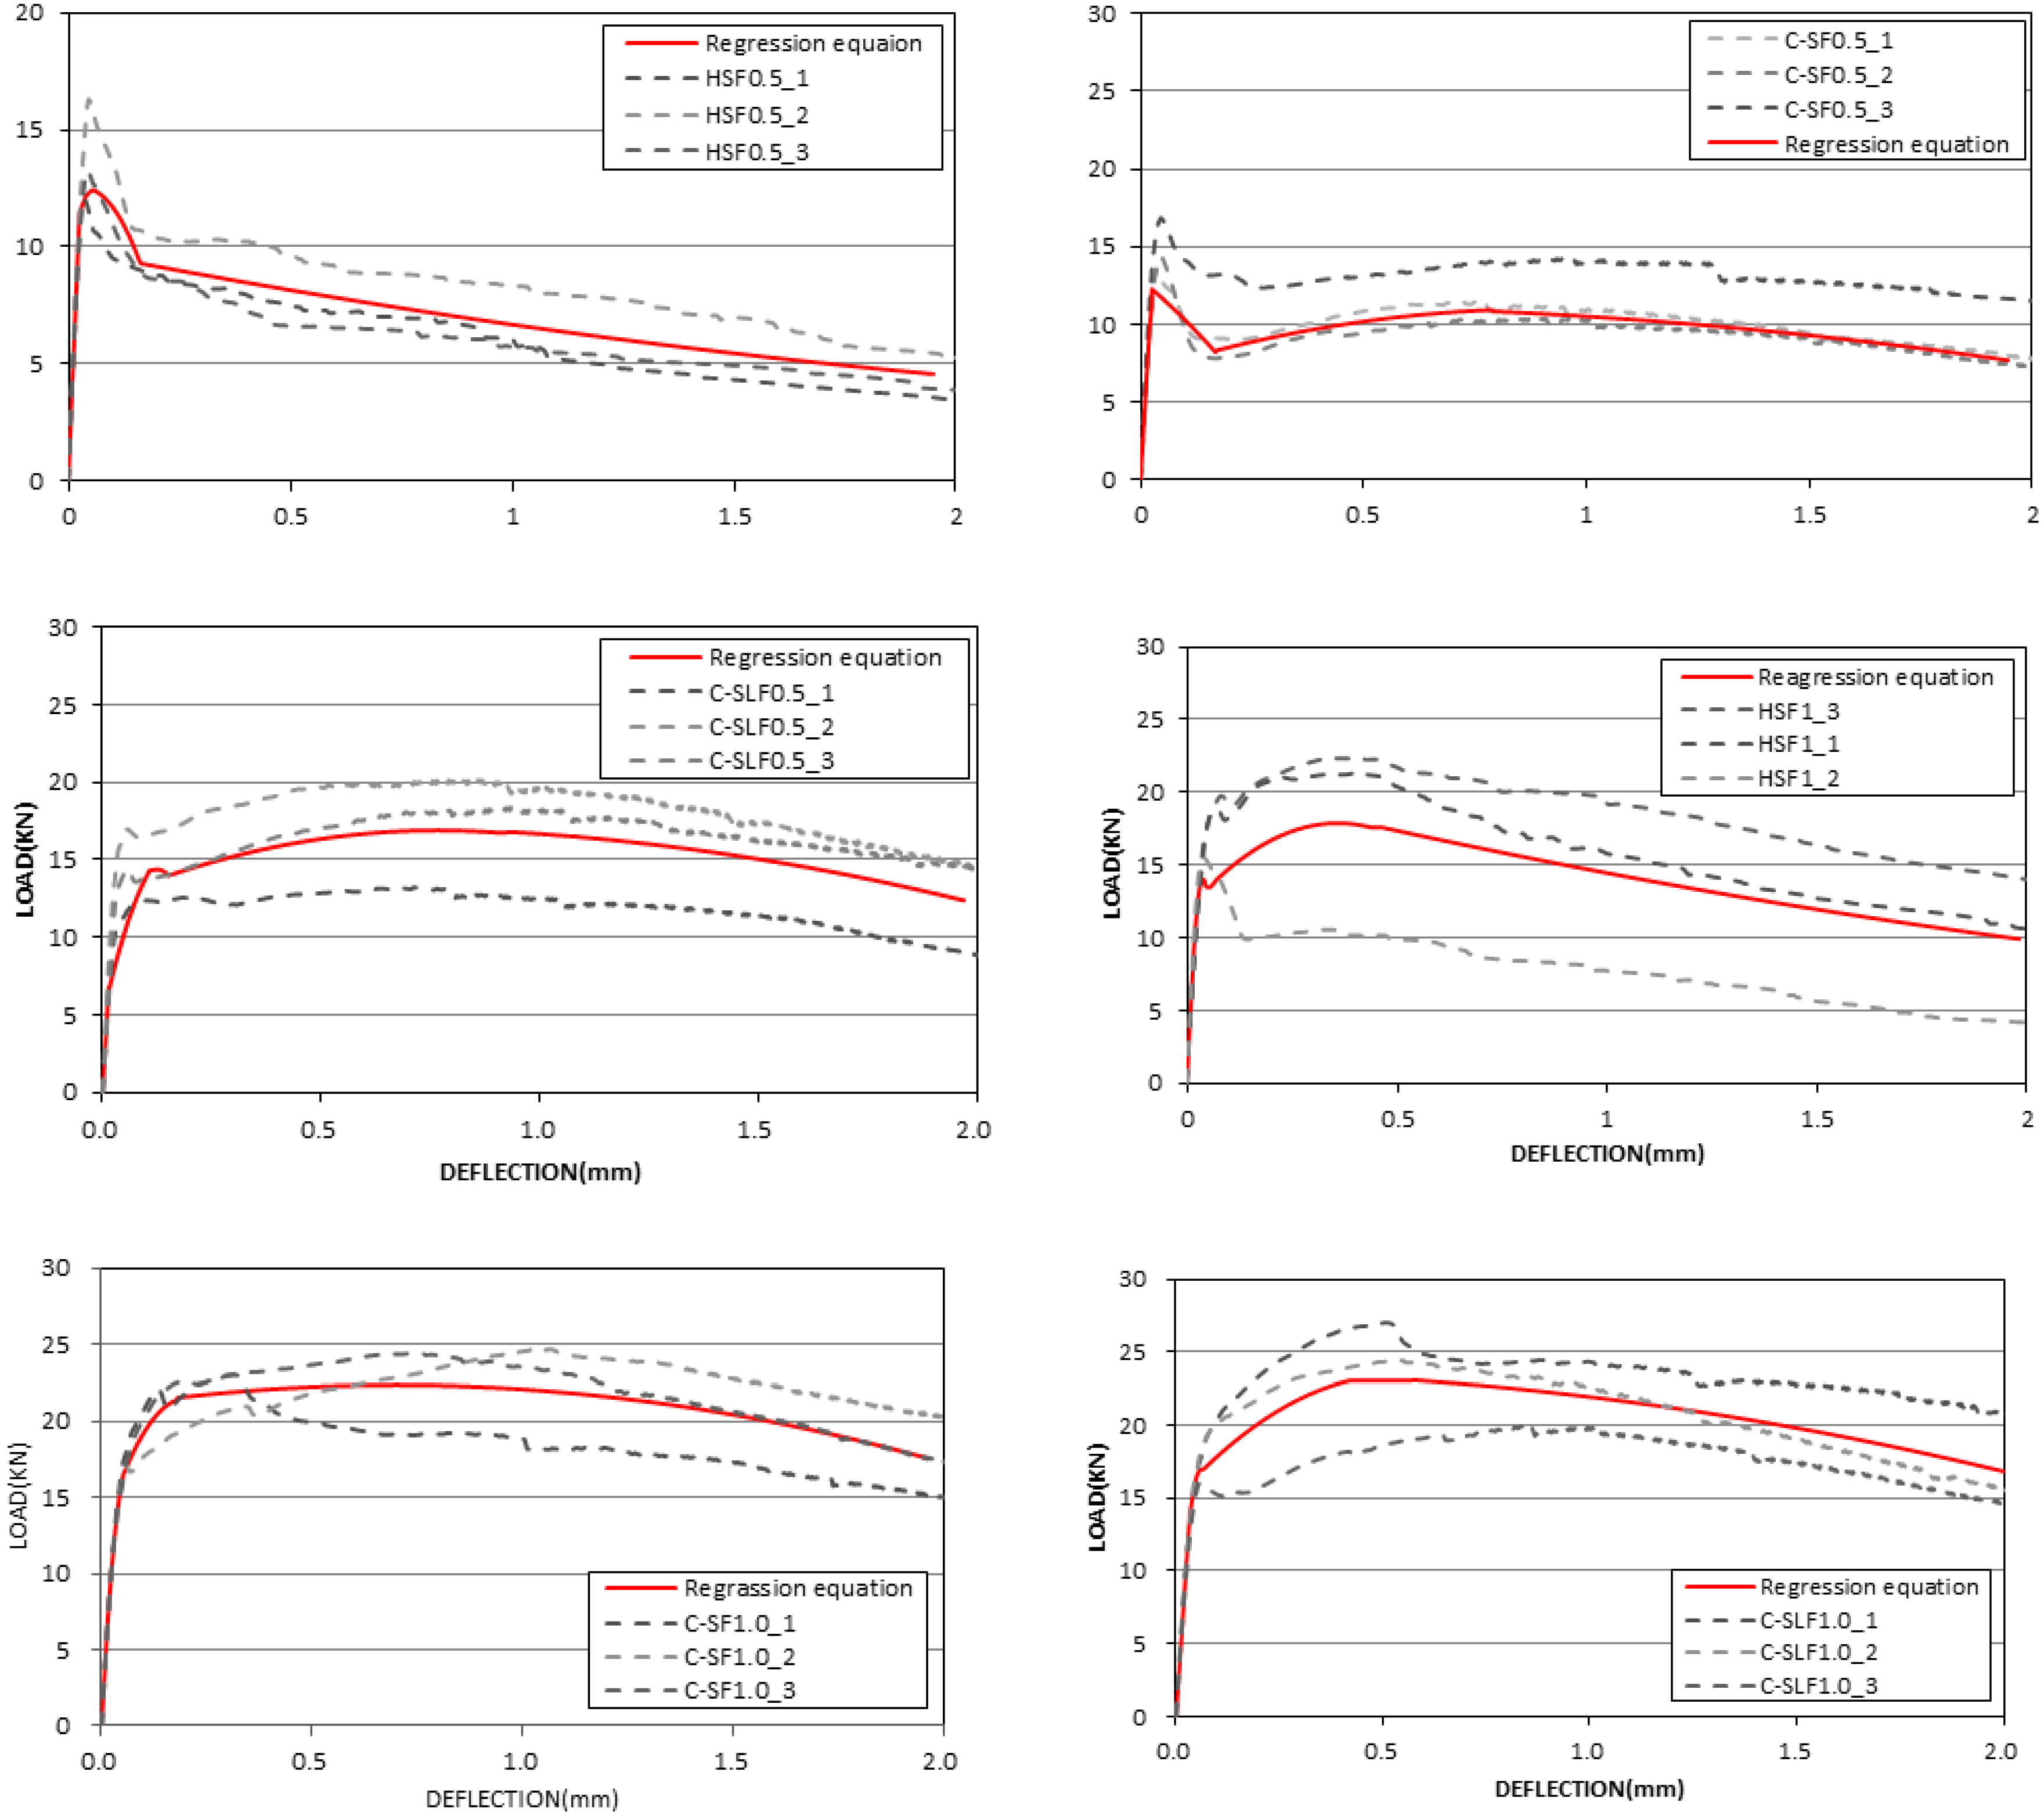
Table 6 shows a summary of the coefficients of the derived regression curve by section, and Figure 8 shows the regression curves by specimen. The regression curve was derived by first dividing the load displacement curve of the specimen into sections, and by conducting a nonlinear regression analysis (the secondary curve) to produce a regression equation suitable for each section. The analysis of the regression curve by section showed that most of the correlation coefficients of the derived regression curve exceeded 99%, and considering that all three types of load transfer properties were shown, the section used for deriving the regression curve is believed to have had some reliability.
4.4.1. Slope Analysis by Section
Except for section 1a, nonlinear behavior was shown in all the sections, and the amount of increase from the beginning to the end of the concerned section was defined as (Equation (2)) in the analysis of the increase rate of the regression curve by load transfer type.
Also, the load displacement curve of the steel fiber-reinforced concrete had both increasing and decreasing parts, and to focus on the increase or decrease rate, the absolute value of the graph was used in this study. The analysis results (Table 7) showed that in the second section, the slope of the specimen with a 0.5% fiber content was larger than that of the specimen with a 1.0% fiber content. A drastic load reduction was thus demonstrated in the load transfer section, and in the case of the specimen with a 0.5% fiber content, the fiber distribution was sparse, and the steel fiber’s lack of load transfer capacity (the mix amount and the tensile strength) as the energy discharged from the concrete matrix was transferred to the steel fiber resulted in the pullout or fracture of the fiber, which led to the drastic progress of load reduction and displacement increase. In the third section, the specimen with a 0.5% fiber content did not exhibit any load increase, or its slope was more gradual than that of the specimen with a 1.0% fiber content. In the case of the fourth section, the increase of the steel fiber content resulted in the increase of the slope, and it is believed that this was because the increase in the amount of mixed steel fiber led to the relatively fast dissipation of energy after the increase in the amount of energy absorption.
4.4.2. Analysis of the Amount of Energy Absorption by Section
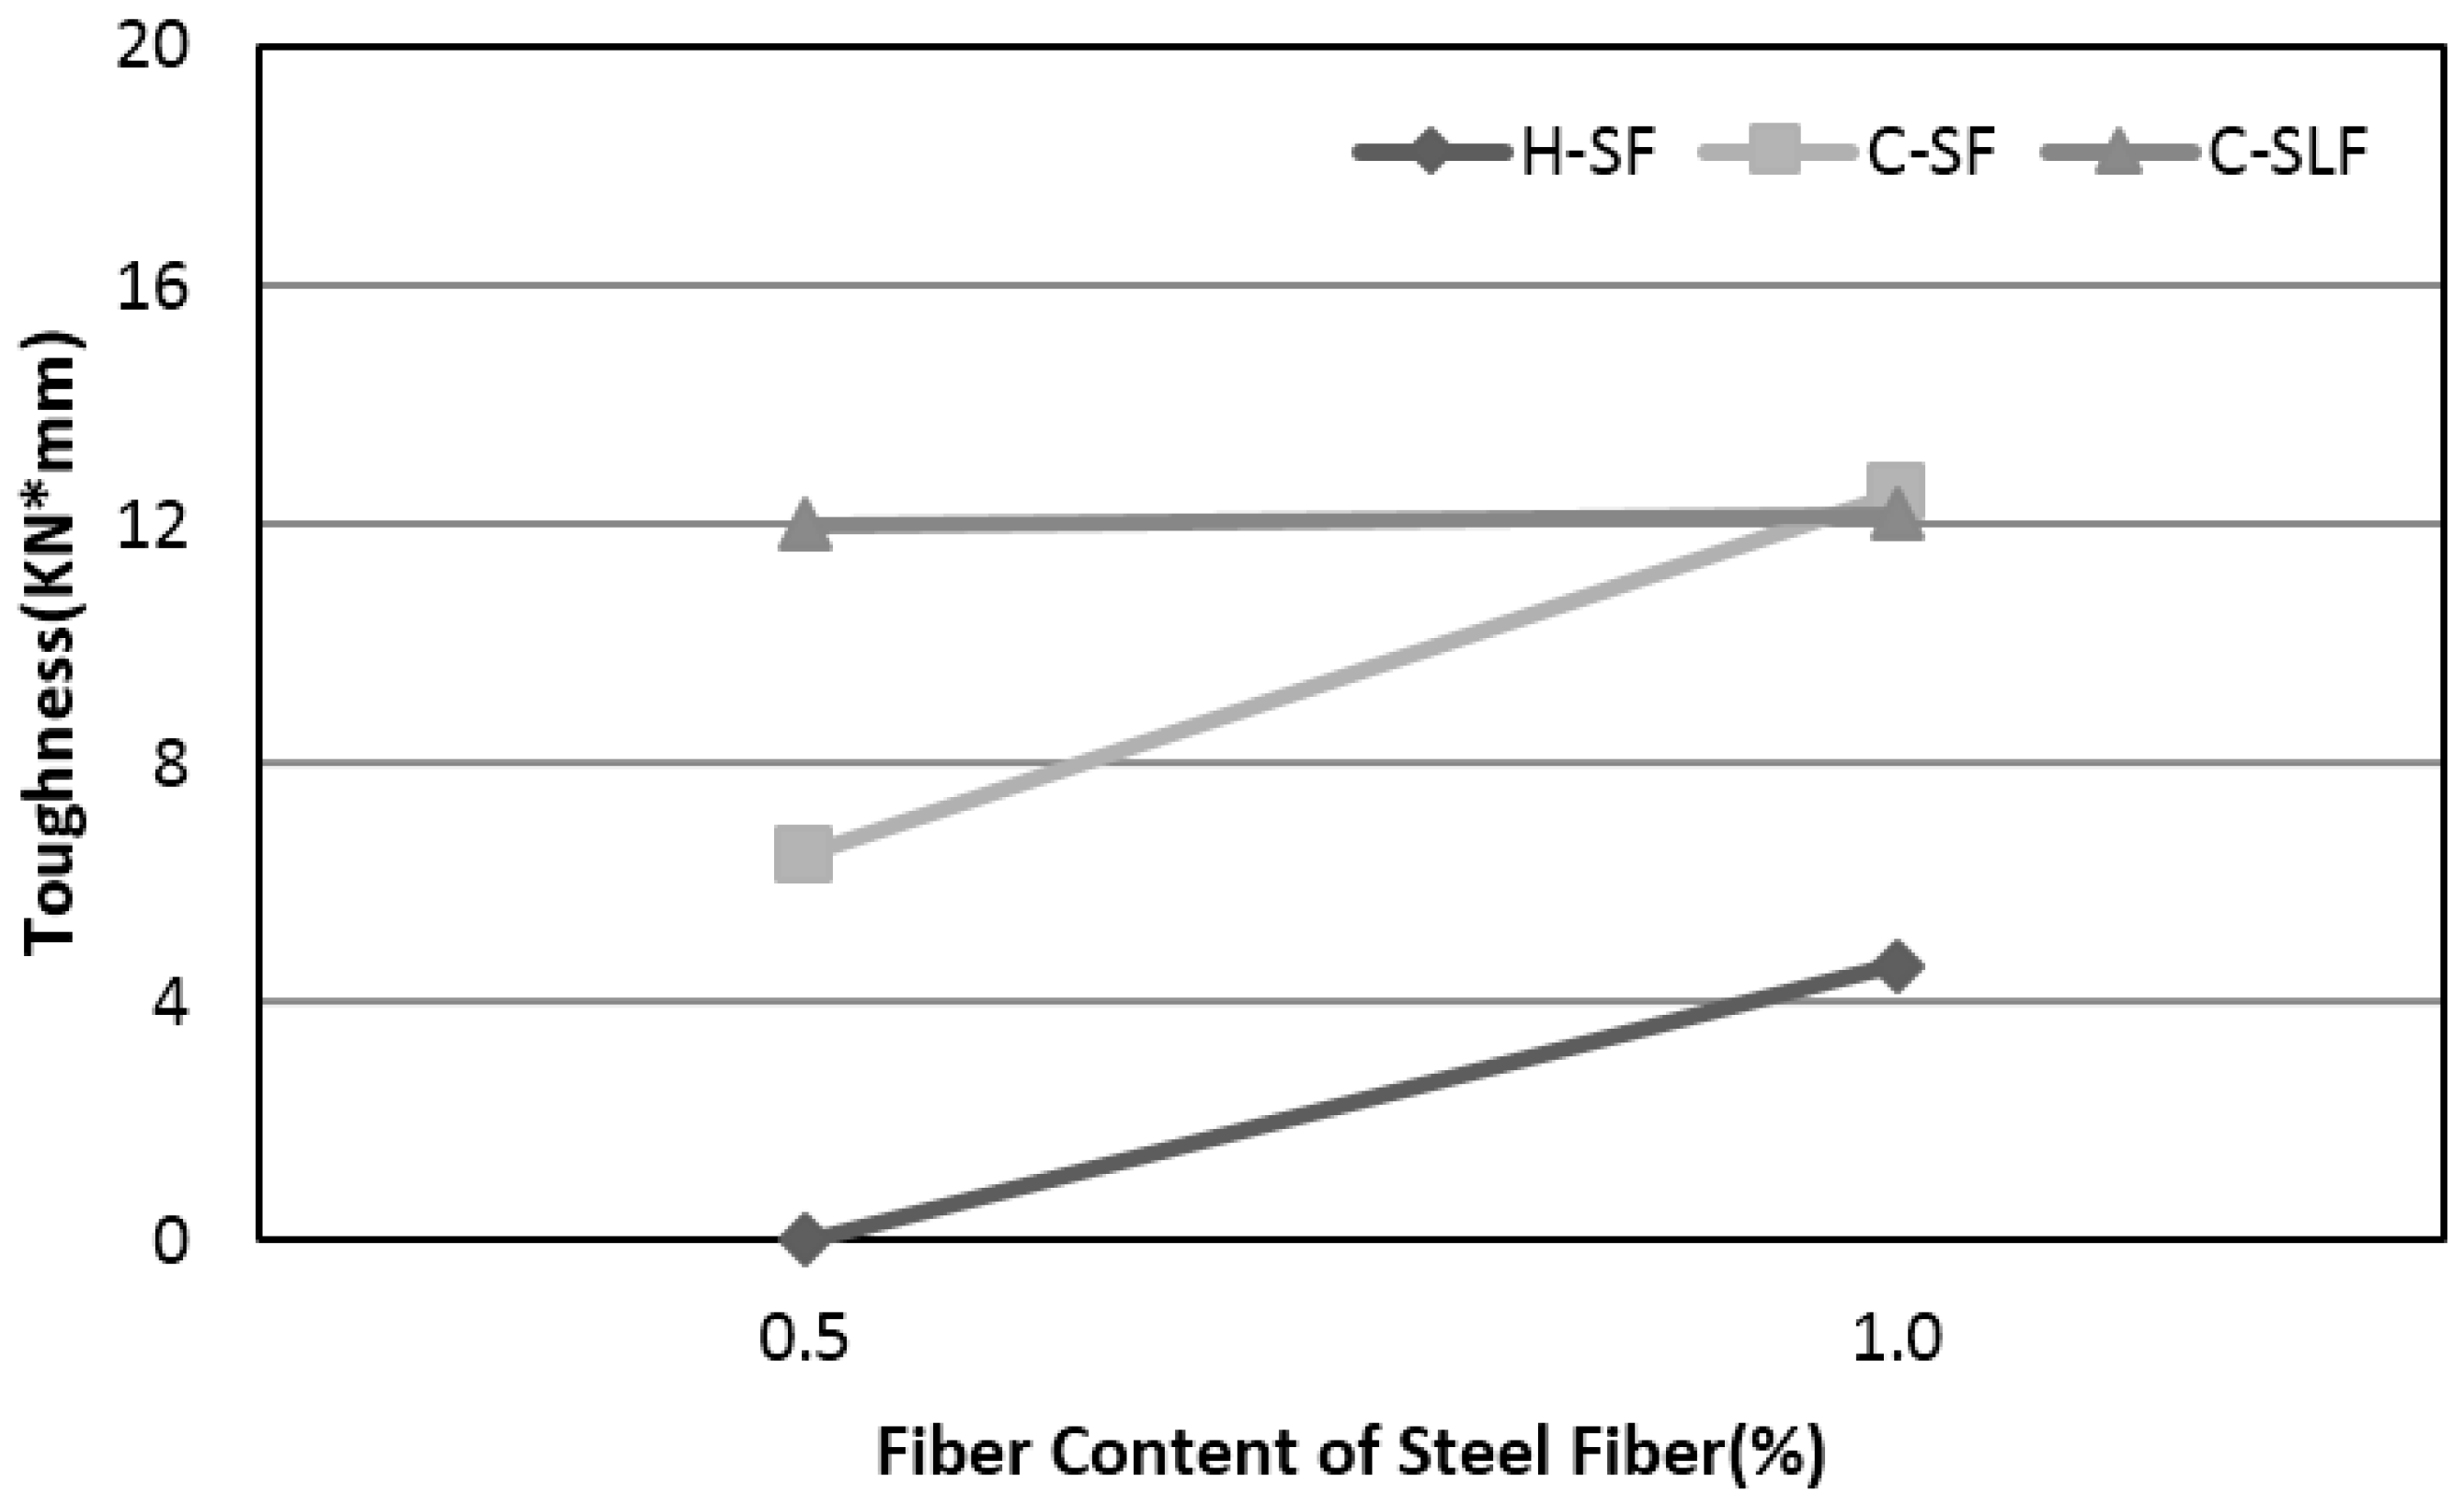
Shown in Figure 9, Figure 10 and Figure 11 is the comparison of the energy absorption by section based on the fiber content of the steel fiber-reinforced concrete. The second section was the zone where, as the concrete matrix absorbing energy was fractured, the absorbed energy was transferred from the concrete matrix to the steel fiber, and some energy was lost due to the different behavior characteristics of the heterogeneous materials. In other words, the smaller the discharged energy loss, the more superior the load transfer capacity of the specimen. As in Figure 9, the area (toughness) of the concerned section based on the fiber content decreased as the fiber content increased. Also, the fiber bridging performance based on the increase in the fiber content was shown to be most effective with C-SF, and C-SLF had the smallest load dissipation regardless of the fiber content.
The third section was the zone where the load displacement curve increased after the load reduction due to the interaction between the steel fiber and the concrete, and the increase in the amount of fiber mixed with the concrete resulted in increases in the amount of energy absorbed. The load reascension effect was not shown, however, in the H-SF with 0.5% steel fiber (Figure 10).
The fourth section was the second load zone, where the pullout resistance effect of the steel fiber against the concrete matrix reached the maximum point, and the remaining strength decreased as the internal stress gradually dissipated. The analysis showed that the increase in the amount of fiber increased the amount of absorbed energy. If there was a slight load reduction in the second section and a load increase in the third section due to the increase in the amount of mixed steel fiber and the superior bonding force with the concrete, the higher starting point of the fourth section is believed to have led to the increase of the overall toughness (Figure 11).
4.5. Analysis of the Correlation between the Load Transfer Sections and the Toughness
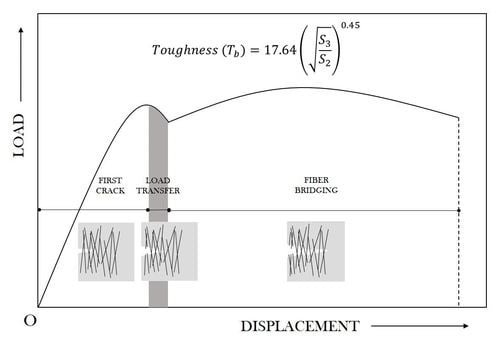
The analysis of the regression curves showed that the smooth load transfer in the load transfer section would increase the location of the starting point of the subsequent nonlinear section, which would raise the overall height of the load displacement graph and increase the toughness. In this section, the toughness index was proposed to derive a quantitative correlation between the energy transfer capacity of the steel fiber in the load transfer section and the overall toughness. Considering that the overall toughness increased as the discharged energy was small while it was being transferred from the concrete matrix to the steel fiber, and as the area (toughness) of the section where the load reascended after the transfer of energy to the steel fiber was large, the load transfer factor (LTF) in Equation (3) was proposed based on the area of the second section (S2) and that of the third section (S3).
where
- L.T.F.: Load transfer factor (LTF)
- S2: Area of the third section (kN·mm)
- S3: Area of the third section (kN·mm)
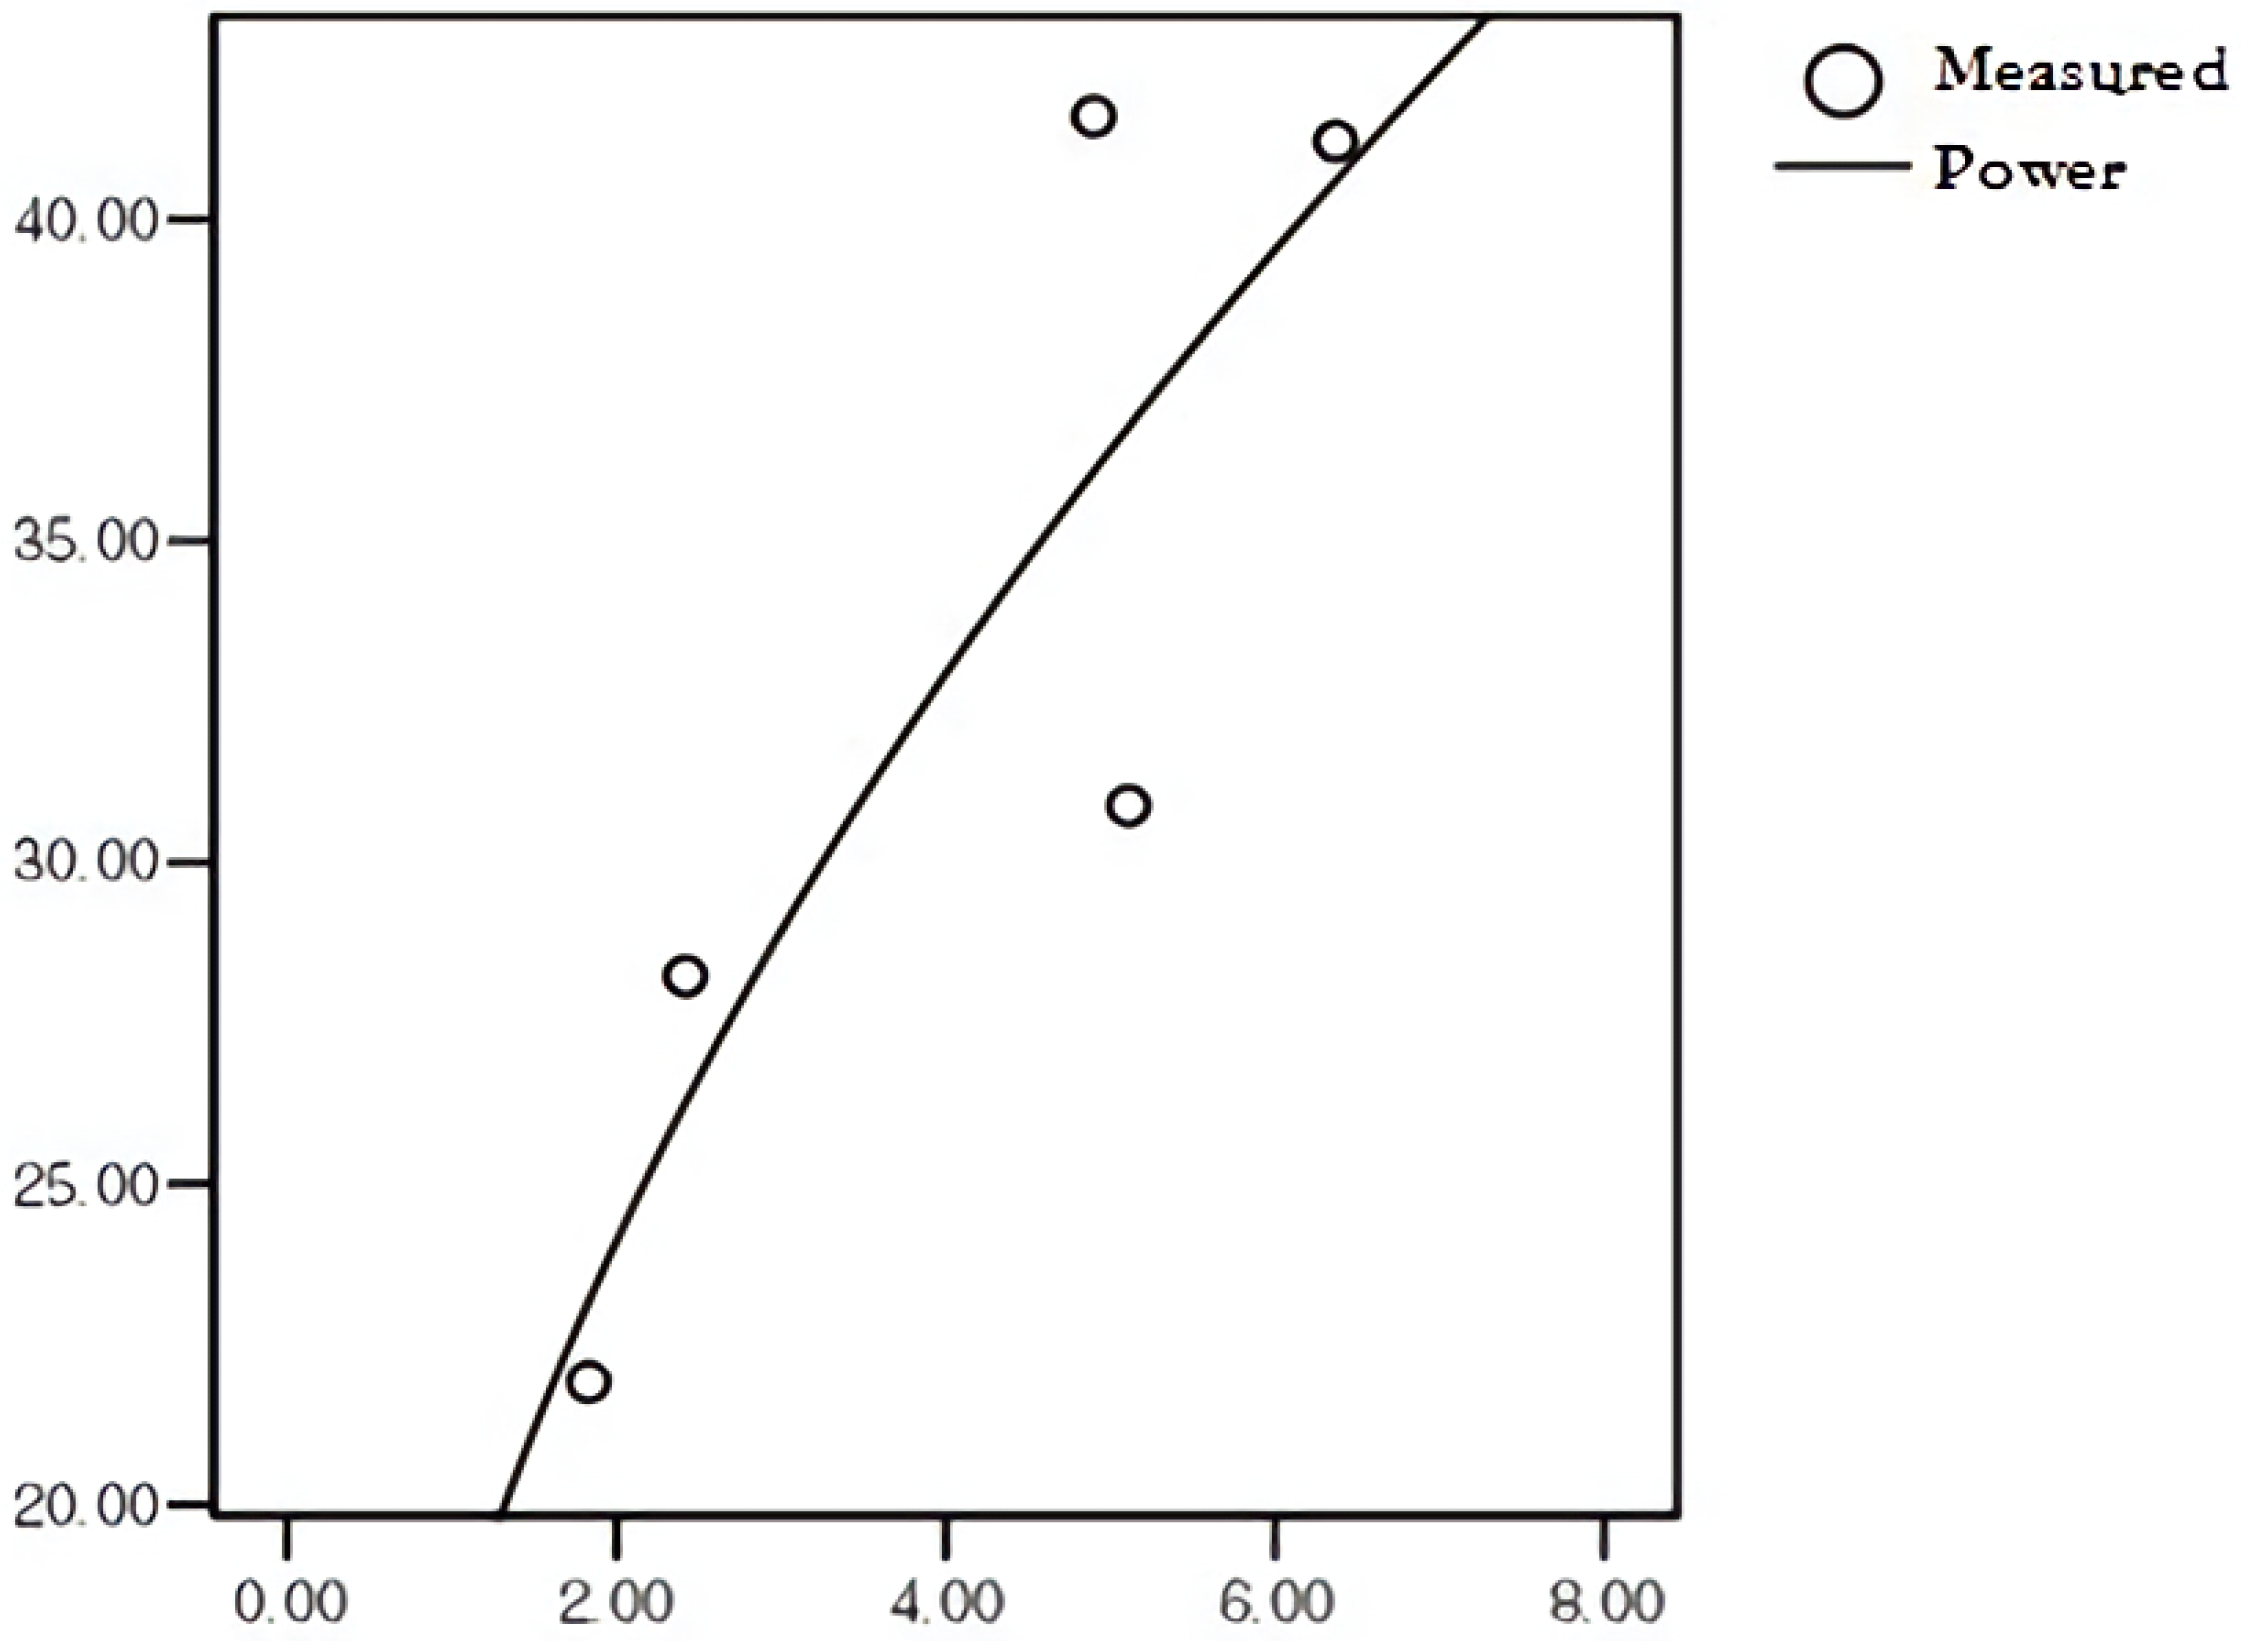
Shown in Table 8 are the LTF and toughness derived by steel fiber type and fiber content, and shown in Table 9 are the results of the regression analysis on the correlation, which resulted in the correlation equation shown in Figure 12, which can predict the overall toughness using the LTF. Reliability analysis of this regression equation was performed with the degrees of freedom, F-statistic, significance probability, and coefficient of determinant (R2).
The regression equation of the overall toughness based on the distribution of the LTF was verified by Equation (4), and from the analysis results on the degrees of freedom, F-statistic, significance probability, and coefficient of determinant (R2), and based on the fact that the coefficient of determinant (R2) was 0.798, it is believed that the proposed correlation model offers good accuracy and reliability.
where
- Tb: Toughness (KN·mm)
- S2: Area of the second section
- S3: Area of the third section
5. Conclusions
This study aimed to determine the effect of the degree of energy discharge and the variation of the slopes on the overall toughness properties of the flexural behavior as the load is transferred to the fiber after concrete crack occurrence in the load transfer section of steel fiber-reinforced concrete. A flexural behavior test was performed on six specimens with different steel fiber types and fiber contents, and by analyzing the load displacement graph by section, the conclusions shown below were arrived at.
- (1)
- The study verified the increase in the remaining load and toughness based on the increase in the amount of steel fiber mixed with the concrete, and the degree of increase variation differed by fiber type, fiber content, and shape.
- (2)
- C-SF was shown to offer superior remaining load and toughness at all the fiber contents, and compared to C-SF, C-SLF offered even more superior remaining load and toughness.
- (3)
- From the analysis of the load displacement curve of the steel fiber-reinforced concrete by section, it was verified that the slope of the second section became smooth as with the increase of the fiber content, and that the slope of the third section increased as the section’s load increased.
- (4)
- The load displacement curve of the steel fiber-reinforced concrete showed a correlation between the fiber content, specifically the area of the second section (the load transfer section) and that of the third section. With the increase of the fiber content, the second section area decreased while the third section ratio increased. Based on these results, the study proposed the LTF of steel fiber.
- (5)
- To determine the correlation between the energy transfer capacity of steel fiber and the overall toughness of the load transfer section, the study derived the regression model (Tb) using the LTF.
Acknowledgment
This research was supported by a grant (NRF-2016RIC IB2009489) from the National Research Foundation of Korea.
Author Contributions
Yoon-Jung Han and Byoungil Kim conceived and designed the experiments; Yoon-Jung Han performed the experiments; Yoon-Jung Han, Byoungil Kim and Sang-Keun Oh analyzed the data; Yoon-Jung Han, Byoungil Kim and Sang-Keun Oh wrote the paper.
Conflicts of Interest
The authors declare no conflict of interest.
Abbreviations
The following abbreviations are used in this manuscript:
| H-SF | Hooked Steel Fiber |
| C-SF | Crimped Steel Fiber |
| C-SLF | Crimped Stainless Steel Fiber |
| OPC | Ordinary Portland Cement |
| LVDT | Linear Variable Differential Transducers |
| LTF | Load Transfer Factor |
References
- Construction Technology Laboratory. Workability and Dynamic Properties of Steel Fiber Reinforced Concrete; Seoul National University of Science and Technology: Seoul, Korea, 2016; pp. 4–42. [Google Scholar]
- Nataraja, M.C.; Dhang, N.; Gupta, A.P. Toughness Characterization of Steel Fiber-Reinforced Concrete by JSCE Approach. Cem. Concr. Res. 2000, 30, 593–597. [Google Scholar] [CrossRef]
- Han, Y.J. Evaluation of Flexural Behavior Effect in the Load Transfer Zone for Steel Fiber Reinforced Concrete; Seoul National University of Science and Technology: Seoul, Korea, 2017; pp. 1–76. [Google Scholar]
- Mindess, S.; Young, J.F.; Darwin, D. Concrete; Donghwa Technologies: Seoul, Korea, 2003; pp. 649–668. [Google Scholar]
- Leung, C.K.Y.; Li, V.C. New Strength-based Model for the Debonding of Discontinuous Fibres in an Elastic Matrix. J. Mater. Sci. 1991, 26, 5996–6010. [Google Scholar] [CrossRef]
- Gopalaratnam, V.S.; Gettu, R. On the Characterization of Flexural Toughness in Fiber Reinforced Concretes. Cem. Concr. Compos. 1995, 17, 239–254. [Google Scholar] [CrossRef]
- Japan Society of Civil Engineers. JSCE Standards for Test. Method of Test for Flexural Strength and Flexural Toughness of Steel Fiber Reinforced Concrete (Standard SF4); Japan Society of Civil Engineers: Tokyo, Japan, 1984; pp. 58–61. [Google Scholar]
- Japan Concrete Institute. JCI Standards for Test. Methods of Fiber Reinforced Concrete, Method of Test for Flexural Strength and Flexural Toughness of Fiber Reinforced Concrete (Standard SF4); Japan Concrete Institute: Tokyo, Japan, 1983; pp. 45–51. [Google Scholar]
- European Federation of National Associations Representing for Concrete (EFNARC). European Specification for Sprayed Concrete; Specification for Sprayed Concrete; European Federation of National Associations Representing for Concrete (EFNARC): Surrey, UK, 1996; pp. 11–16. [Google Scholar]
- Korean Standards Associations. Korean Standards (F 2566). In Test Method for Flexural Toughness of Steel Fiber Reinforced Concrete; Korean Standards Associations: Gwacheon, Korea, 2014; pp. 1–9. [Google Scholar]
- American Society for Testing and Materials (ASTM). American Standards (C 1609). In Standard Test Method for Flexural Performance of Fiber-Reinforced Concrete (Using Beam with Third-Point Loading); American Society for Testing and Materials: West Conshohocken, PA, USA, 2012; pp. 1–9. [Google Scholar]
- American Concrete Institute. ACI Guidelines (544). In Measurement of Properties of Fiber Reinforced Concrete; American Concrete Institute: Farmington Hills, MI, USA, 1996; pp. 7–23. [Google Scholar]
- Sivakumar, A.; Sounthararajan, V.M. Toughness characterization of steel fibre reinforced concrete—A review on various international standards. J. Civ. Eng. Constr. Tech. 2013, 4, 65–69. [Google Scholar]
- Banthia, N.; Trottier, J.F. Test Methods for Flexural Toughness Characterization of Fiber Reinforced Concrete: Some Concerns and a Proposition. ACI Mater. J. 1995, 92, 48–57. [Google Scholar]
- Swamy, R.N.; Mangat, P.S. A Theory for the Flexural Strength of Steel Fiber Reinforced Concrete. Cem. Concr. Res. 1974, 4, 313–325. [Google Scholar] [CrossRef]
- Jung, B.S. Flexural Toughness of Steel Fiber Reinforced Very Early Strength Latex Modified Concrete; Kangwon National University: Chuncheon, Korea, 2010; pp. 27–31. [Google Scholar]
- Beaudoin, J. Handbook of Fiber-Reinforced Concrete; Noyes Publications: Norwich, NY, USA, 1990; pp. 85–89. [Google Scholar]
- ACI Committee. State-of-the Art Report in Fibre Reinforced Concrete; ACI (American Concrete Institute): Farmington Hills, MI, USA, 1982. [Google Scholar]
- Kanda, T.; Li, V.C. Interface property and apparent strength of high-strength hydrophilic fiber in cement matrix. J. Mater. Civ. Eng. 1998, 10, 5–13. [Google Scholar] [CrossRef]
- Ni, Y. Natural Fibre Reinforced Cement Composites. Ph.D. Thesis, Victoria University of Technology, Melbourne, Australia, 1995; pp. 22–25. [Google Scholar]
- Kim, J.M. Microstructure Changes of Continuous Cooling and Isothermal Transformation Heat-Treated STS 430 Ferritic Stainless Steel after High Temperature Gas Nitriding; Dong-a University: Busan, Korea, 2012; pp. 28–45. [Google Scholar]
- Han, Y.J.; Oh, G.H.; Choi, S.Y.; Oh, S.K.; Kim, B. Fiber Bridge. Analysis of Steel Fiber Reinforced Concrete According to Different Fiber Manufacture & Fiber Addition. In Proceedings of the Annual Conference of the Architectural Institute of Korea, Seoul, Korea, 23–26 October 2016; Volume 36, pp. 917–918. [Google Scholar]
- Han, Y.J.; Ma, S.J.; Oh, G.H.; Oh, S.K.; Kim, B. Comparison of Load Transferring Property for Steel Fiber Production and Type. In Proceedings of the 2016 Spring Conference of the Korea Concrete Institute, Gyeongsan, Korea, 17 April 2016; Volume 28, pp. 383–384. [Google Scholar]
Figure 1.
Flexural behavior test.

Figure 2.
Flexural strength test results.

Figure 3.
Flexural load displacement curve of the specimen mixed with steel fiber.


Figure 4.
Toughness up to the brittle failure by specimen (0–P1).

Figure 5.
Overall toughness by specimen (0–2 mm).

Figure 6.
Load transfer characteristics by steel fiber type and fiber content.

Figure 7.
Area (toughness) and slope of the load displacement curve by section.
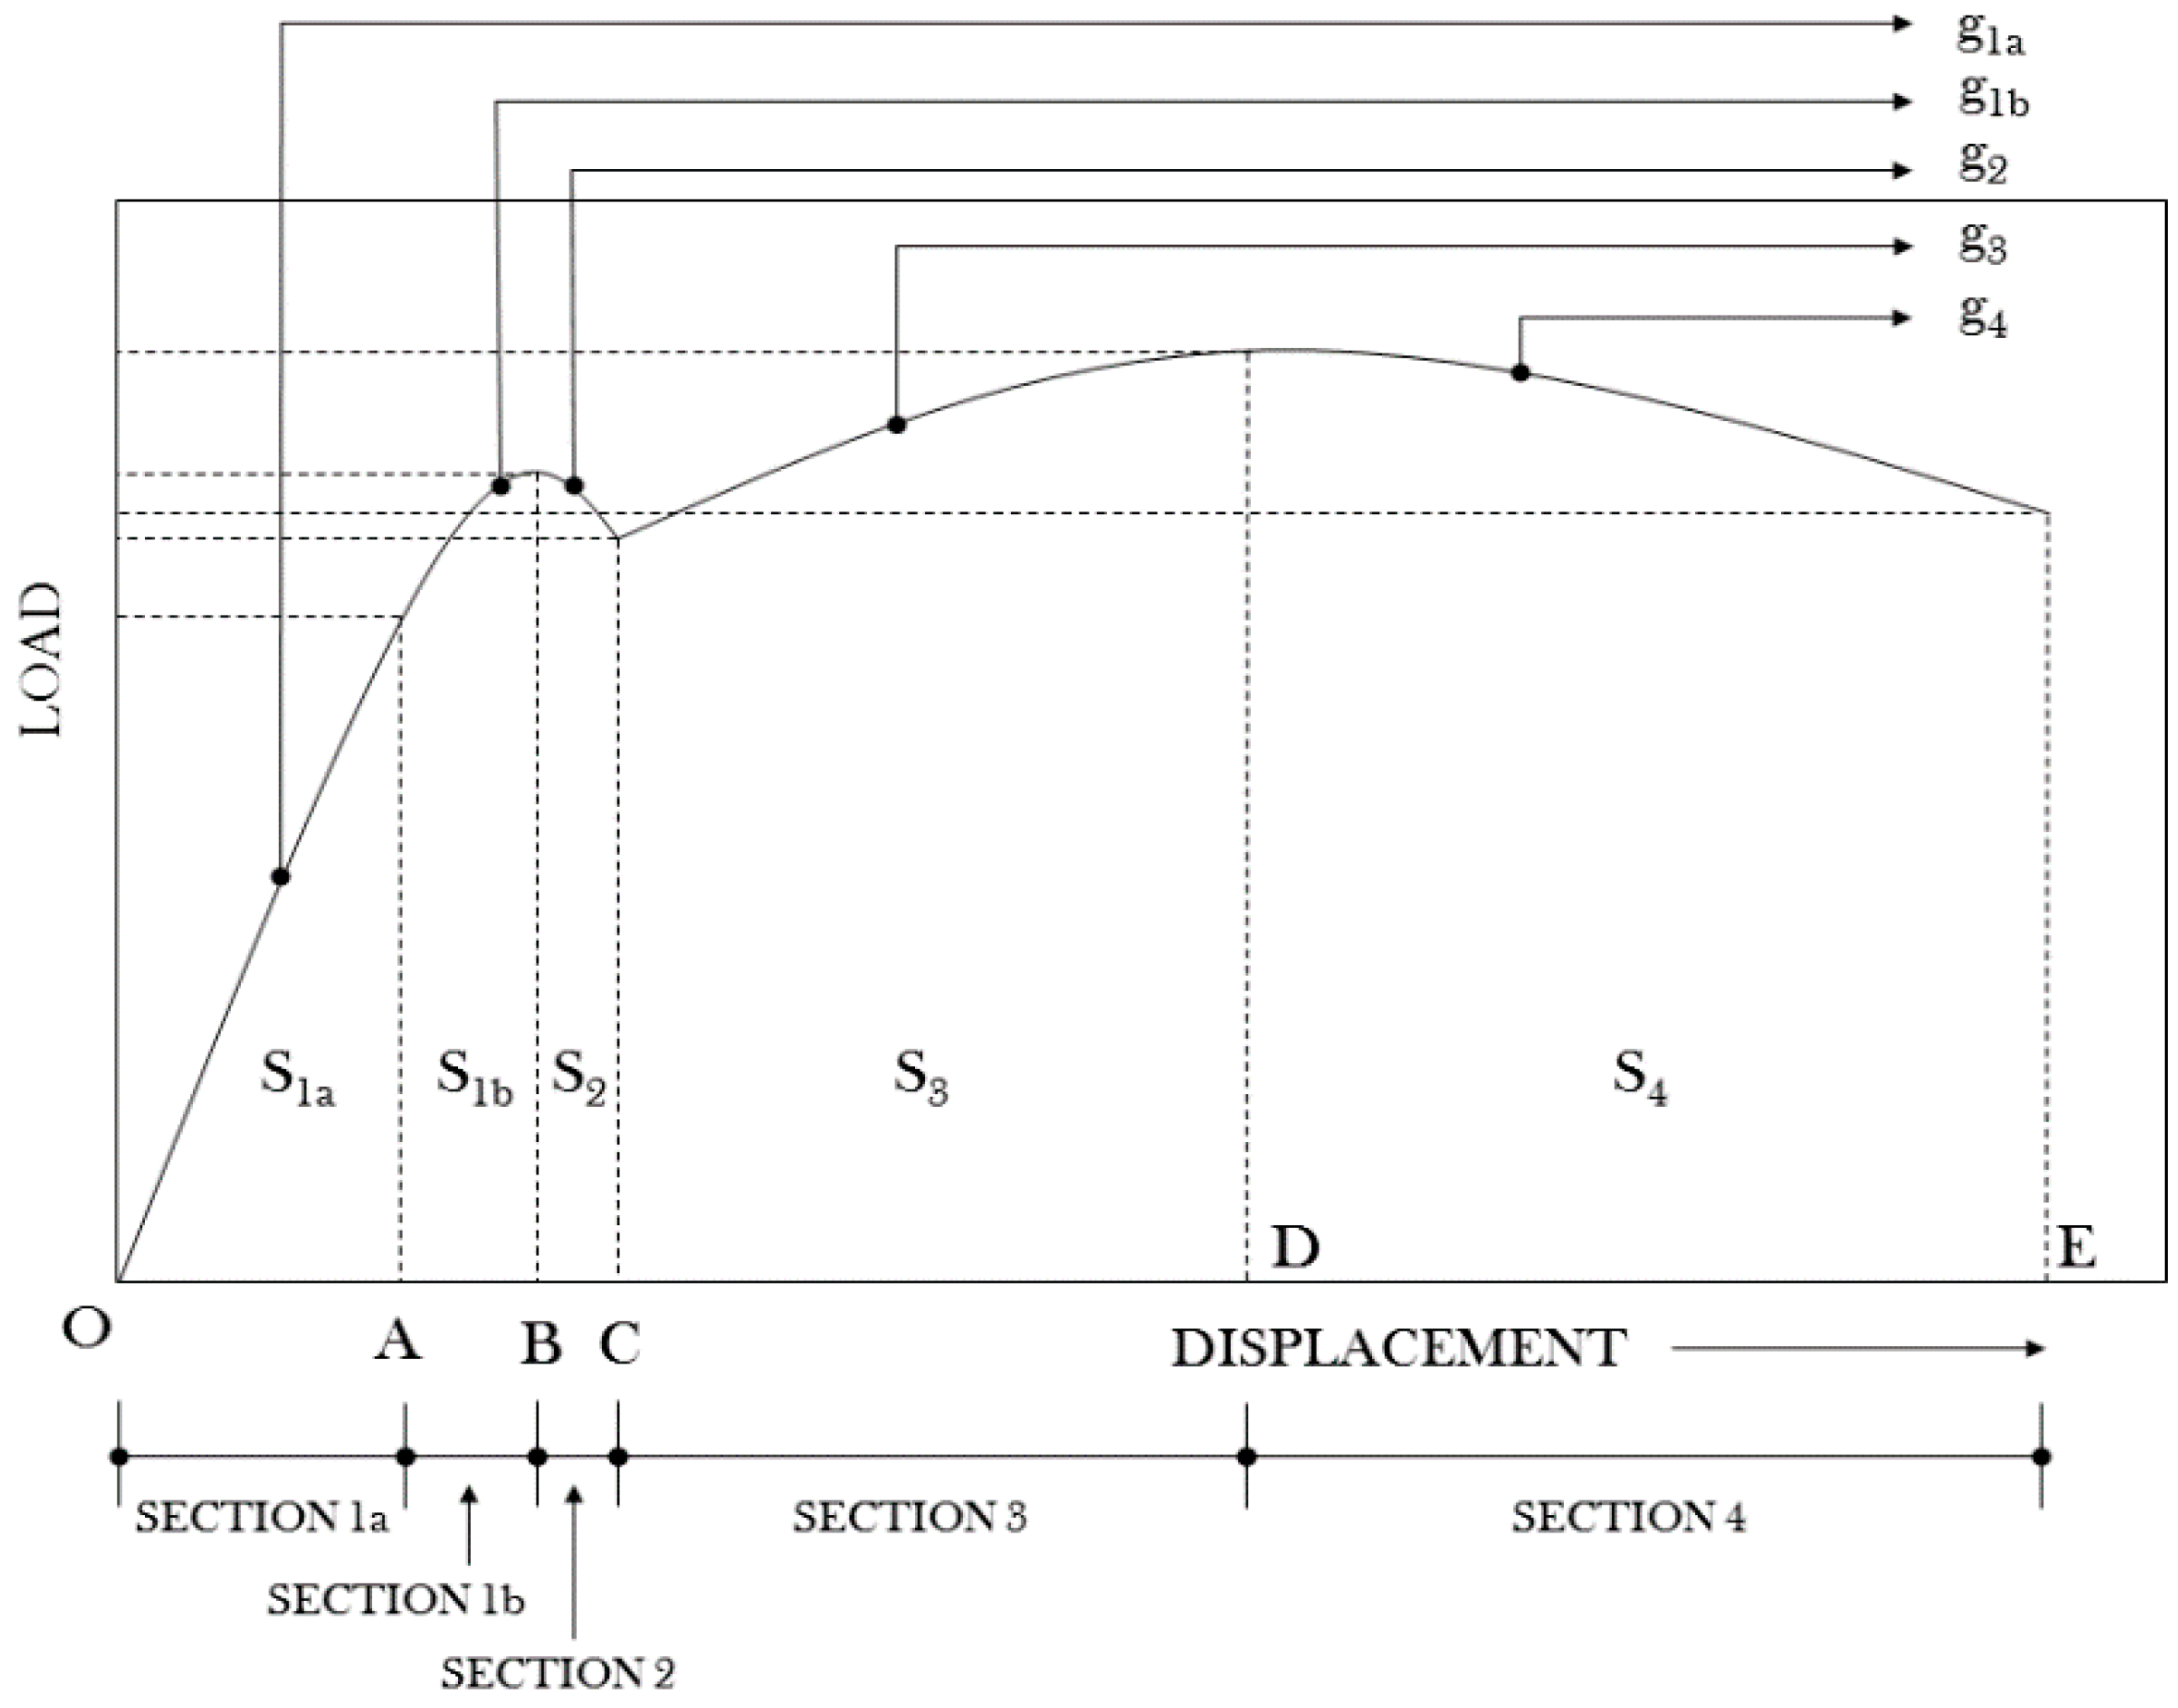
Figure 8.
Regression curve of the flexural load displacement curve by specimen.

Figure 9.
Comparison of the energy absorption (S2) in the second section.
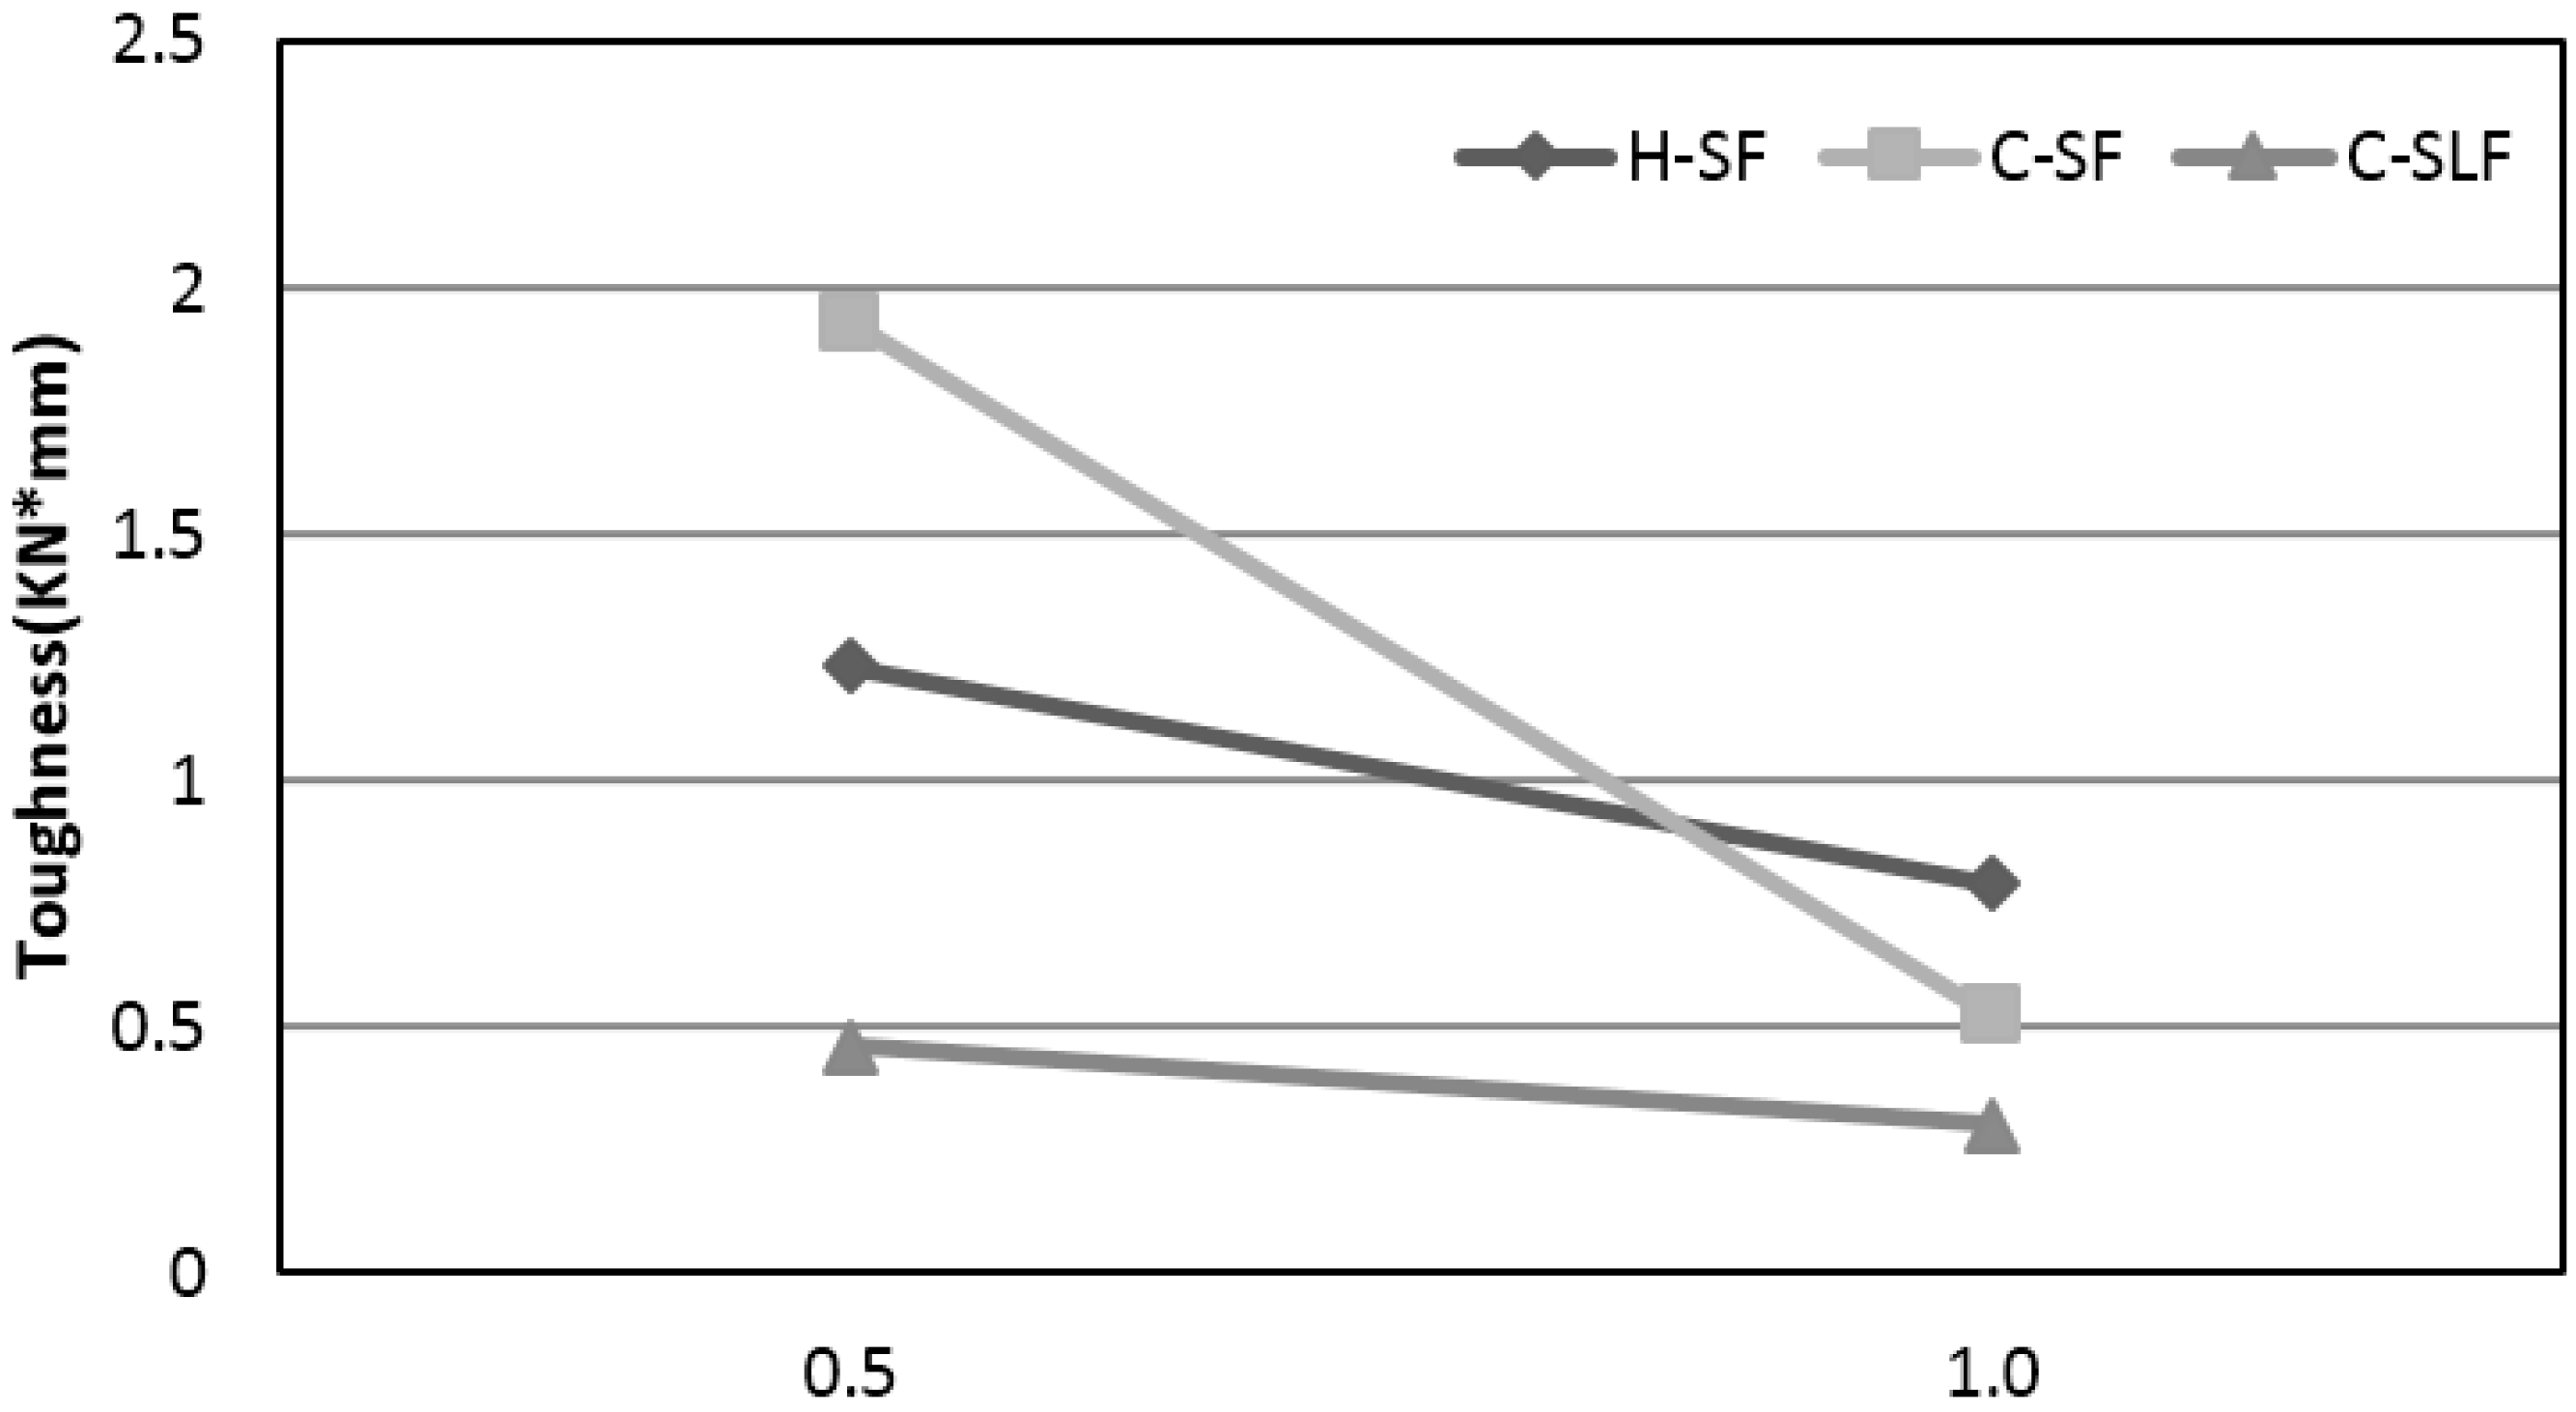
Figure 10.
Comparison of the energy absorption (S3) in the third section.

Figure 11.
Comparison of the energy absorption (S4) in the fourth section.

Figure 12.
Regression model based on the load transfer factor (LTF) and the overall toughness.


Table 1.
Experimental test methods and toughness characterization by various standards.
| Name of Standard | Dimensions of the Specimen | Rate of Loading (mm/min) | Type of Loading Arrangement | Maximum Deflection Measured | Toughness Measurement |
|---|---|---|---|---|---|
| JSCE SF-4, JCI SF-4 | 100 × 100 × 300 | L/1500 to L/1300 | 4-point bending test | L/150 | Energy absorbed up to a deflection of L/150 mm |
| EFNARC | 75 × 125 × 450 | 0.25 ± 0.05 | 4-point bending test | 25 | Residual strength factors up to deflection of 1 and 3 mm |
| KS F 2566 | 100 × 100 × 400 150 × 150 × 500 | 0.1–0.2 | 4-point bending test | L/150 | Energy absorbed up to a deflection of L/150 mm |
| ASTM C 1609 | 100 × 100 × 400 150 × 150 × 500 | 0.05–0.10 0.05–0.12 | 4-point bending test/3-point bending test | L/150 | Energy absorbed up to a deflection of L/150 mm |
| French Standard P18-409 | 140 × 140 × 560 | 0.05–0.10 | 4-point bending test | 2.8 | Ratio of load at deflection (0.7 mm, 1.4 mm, 2.8 mm) to load P |
| ACI 544 | 100 × 100 × 350 | 0.05–0.10 | 4-point bending test/3-point bending test | 1.9 | Ratio of energy absorbed up to deflection of 1.9 mm |
Table 2.
Properties of steel fiber.
| Category | Hook Type | Crimped | Crimped |
|---|---|---|---|
| Code | H-SF (hooked-end steel fiber) | C-SF (crimped steel fiber) | C-SLF (crimped stainless steel fiber) |
| Section | Circular | Circular | Circular |
| Tensile strength (N/mm2) | 1300 | 2896 | 1941 |
| Length (mm) | 35 | 35 | 35 |
| Diameter (mm) | 0.5 | 0.5 | 0.5 |
| Aspect ratio (L/D) | 70 | 70 | 70 |
| Aspect |  |  |  |
| Image | 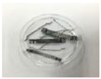 |  |  |
Table 3.
Physical properties of the aggregate.
| Category | Density of Saturated Surface Dry Condition (g/cm3) | Dry Density (g/cm3) | Absorption Ratio (%) | Max. Dimensions (mm) |
|---|---|---|---|---|
| Coarse aggregate | 5711.1 | 5677.7 | 0.59 | 19 |
| Fine aggregate | 500.7 | 485.3 | 3.03 | - |
Table 4.
Mix design.
| Type | Water Cement Ratio (%) | Fine Aggregate Modulus (%) | Unit Weight (kg/m3) | Superplasticizer (C × %) | Air Entraining (C × %) | Fiber Content (%) | |||
|---|---|---|---|---|---|---|---|---|---|
| W | C | S | G | ||||||
| OPC | 45 | 51 | 200 | 440 | 778 | 748 | 1.0 | 0.02 | - |
| H-SF_0.5 | 45 | 51 | 200 | 440 | 766 | 748 | 1.0 | 0.02 | 0.5 |
| H-SF_1.0 | 45 | 51 | 200 | 440 | 753 | 748 | 1.0 | 0.02 | 1.0 |
| C-SF_0.5 | 45 | 51 | 200 | 440 | 766 | 748 | 1.0 | 0.02 | 0.5 |
| C-SF_1.0 | 45 | 51 | 200 | 440 | 753 | 748 | 1.0 | 0.02 | 1.0 |
| C-SLF_0.5 | 45 | 51 | 200 | 440 | 766 | 748 | 1.0 | 0.02 | 0.5 |
| C-SLF_1.0 | 45 | 51 | 200 | 440 | 753 | 748 | 1.0 | 0.02 | 1.0 |
Table 5.
Range by section.
| Category | Range (d: displacement, mm) | Energy Absorption Mechanism | Energy-Absorptive Material | ||
|---|---|---|---|---|---|
| Section | Toughness by Section | Slope by Section | |||
| 1 | S1a | g1a | 0 < d ≤ initial crack point | Linear elastic behavior | Concrete |
| S1b | g1b | Initial crack point < d ≤ first peak load | Progress of fine cracks inside the matrix | Concrete | |
| 2 | S2 | g2 | First peak load < d ≤ lowest load point | Concrete-fiber load transfer section | Concrete, fiber |
| 3 | S3 | g3 | Lowest load point < d ≤ second peak load | Fiber bridging and pullout action | Fiber |
| 4 | S4 | g4 | Second peak load < d ≤ 2.0 | Fiber bridging and pullout action | Fiber |
Table 6.
Specimen coefficients by section.
| Specimen | Displacement | Section 1a | Section 1b | Second Section | Third Section | Fourth Section | |
|---|---|---|---|---|---|---|---|
| H-SF 0.5 | Displacement | 0 ≤ χ ≤ 0.03 | 0.03 ≤ χ ≤ 0.05 | 0.05 ≤ χ ≤ 0.16 | - | 0.16 ≤ χ ≤ 2.00 | |
| Co-efficient | a | 0 | −682.7 | −207.5 | - | 0.5 | |
| b | 455.5 | 94.4 | 15.8 | - | −3.7 | ||
| c | 0 | 9.5 | 12.2 | - | 9.9 | ||
| Correlation coefficient | 99.1 | 99.8 | 99.2 | - | 98.2 | ||
| H-SF 1.0 | Displacement | 0 ≤ χ ≤ 0.02 | 0.02 ≤ χ ≤ 0.04 | 0.04 ≤ χ ≤ 0.07 | 0.07 ≤ χ ≤ 0.46 | 0.46 ≤ χ ≤ 2.00 | |
| Co-efficient | a | 0 | −11,120 | −3295.7 | −46.4 | 0.8 | |
| b | 541.0 | 846 | 338.7 | 33.4 | −7 | ||
| c | 0 | −2.1 | 4.8 | 11.8 | 20.6 | ||
| Correlation coefficient | 99.0 | 99.6 | 98.1 | 97.7 | 99.5 | ||
| C-SF 0.5 | Displacement | 0 ≤ χ ≤ 0.02 | 0.02 ≤ χ ≤ 0.03 | 0.03 ≤ χ ≤ 0.10 | 0.10 ≤ χ ≤ 0.31 | 0.31 ≤ χ ≤ 2.00 | |
| Co-efficient | a | 0 | −10,540 | −80.2 | 30 | −2.1 | |
| b | 486.8 | 643.8 | −12.3 | 15.6 | 3.3 | ||
| c | 0 | 0 | 9.2 | 4.8 | 10.2 | ||
| Correlation coefficient | 99.1 | 99.8 | 96.1 | 97.6 | 94.2 | ||
| C-SF 1.0 | Displacement | 0 ≤ χ ≤ 0.01 | 0.01 ≤ χ ≤ 0.05 | - | 0.05 ≤ χ ≤ 0.18 | 0.18 ≤ χ ≤ 2.00 | |
| Co-efficient | a | 0 | −3924.5 | 0 | −232 | −3 | |
| b | 492.3 | 516.7 | 0 | 91.8 | 4.2 | ||
| c | 0 | 0.3 | 0 | 12.4 | 20.9 | ||
| Correlation coefficient | 99.2 | 99.0 | 98.9 | 97.7 | 97.9 | ||
| C-SLF 0.5 | Displacement | 0 ≤ χ ≤ 0.01 | 0.01 ≤ χ ≤ 0.12 | 0.12 ≤ χ ≤ 0.15 | 0.15 ≤ χ ≤ 0.90 | 0.90 ≤ χ ≤ 2.00 | |
| Co-efficient | a | 0 | −361.6 | −561.1 | −7.7 | −2.5 | |
| b | 486.6 | 126.6 | 139.7 | 11.8 | 3 | ||
| c | 0 | 4.9 | 5.7 | 12.4 | 16.2 | ||
| Correlation coefficient | 99.1 | 99.3 | 96.1 | 93.0 | 98.6 | ||
| C-SLF 1.0 | Displacement | 0 ≤ χ ≤ 0.04 | 0.04 ≤ χ ≤ 0.06 | - | 0.06 ≤ χ ≤ 0.58 | 0.58 ≤ χ ≤ 2.00 | |
| Co-efficient | a | 0 | −4628.5 | 0 | −29.1 | −1.7 | |
| b | 422.3 | 549.1 | 0 | 31.3 | 0 | ||
| c | 0 | 0.6 | 0 | 15 | 23.6 | ||
| Correlation coefficient | 99.0 | 98.8 | 99.6 | 99.1 | 97.1 | ||
Table 7.
Comparison of absolute slopes by section (()).
| Section | Second Section | Third Section | Fourth Section | ||||
|---|---|---|---|---|---|---|---|
| Mix Name | 0.5% | 1.0% | 0.5% | 1.0% | 0.5% | 1.0% | |
| H-SF | 0.04 | 0.02 | 0 | 2.51 | 4.74 | 7.66 | |
| C-SF | 1.6 | 0 | 3.96 | 4.63 | 2.05 | 3.99 | |
| C-SLF | 0.3 | 0 | 2.77 | 6.02 | 3.83 | 6.23 | |
Table 8.
LTF and overall toughness.
| Specimen | Load Transfer Factor (LTF) | Overall Toughness (Toughness) |
|---|---|---|
| H-SF 0.5% | 0 | 13.86 |
| H-SF 1.0% | 5.84 | 28.23 |
| SF 0.5% | 3.34 | 21.91 |
| C-SF 1.0% | 24.06 | 41.61 |
| C-SLF 0.5% | 26.09 | 30.88 |
| C-SLF 1.0% | 40.57 | 41.22 |
Table 9.
Regression model of LTF and overall toughness.
| Degree of Freedom (df) | F-Statistic | Significance Probability (Sigf) | Coefficient of Determinant (R2) | Regression Model |
|---|---|---|---|---|
| 3 | 11.84 | 0.041 | 0.798 | y = 17.64x0.45 |
© 2017 by the authors. Licensee MDPI, Basel, Switzerland. This article is an open access article distributed under the terms and conditions of the Creative Commons Attribution (CC BY) license (http://creativecommons.org/licenses/by/4.0/).
Share and Cite
MDPI and ACS Style
Han, Y.-J.; Oh, S.-K.; Kim, B. Effect of Load Transfer Section to Toughness for Steel Fiber-Reinforced Concrete. Appl. Sci. 2017, 7, 549. https://doi.org/10.3390/app7060549
AMA Style
Han Y-J, Oh S-K, Kim B. Effect of Load Transfer Section to Toughness for Steel Fiber-Reinforced Concrete. Applied Sciences. 2017; 7(6):549. https://doi.org/10.3390/app7060549
Chicago/Turabian StyleHan, Yoon-Jung, Sang-Keun Oh, and Byoungil Kim. 2017. "Effect of Load Transfer Section to Toughness for Steel Fiber-Reinforced Concrete" Applied Sciences 7, no. 6: 549. https://doi.org/10.3390/app7060549
Note that from the first issue of 2016, this journal uses article numbers instead of page numbers. See further details here.