
Modeling of Heat Transfer and Oscillating Flow in the Regenerator of a Pulse Tube Cryocooler Operating at 50 Hz

1
State Key Laboratory of Multiphase Flow in Power Engineering, Xi’an Jiaotong University, Xi’an 710049, China
2
Xi’an Jiaotong University Su Zhou Academy, Suzhou 215123, China
*
Author to whom correspondence should be addressed.
Appl. Sci. 2017, 7(6), 553; https://doi.org/10.3390/app7060553
Submission received: 4 April 2017
/
Revised: 19 May 2017
/
Accepted: 22 May 2017
/
Published: 5 June 2017
(This article belongs to the Special Issue Heat Transfer Processes in Oscillatory Flow Conditions)
Abstract
:The regenerator of the pulse tube refrigerator (PTR) operates with oscillating pressure and mass flow, so a proper description of the heat transfer characteristics of the oscillating flow in the regenerator is crucial. In this paper, a one-dimensional model based on Lagrangian representation is developed to simulate the oscillating flow in the regenerator of the PTR. The continuity equation, momentum equation and energy equation are solved iteratively using the SIMPLER algorithm. The Darcy-Brinkman-Forchheimer model is used in the momentum equation, and a thermal non-equilibrium model is implemented in the energy equation. Lagrangian representation is employed to describe the thermodynamics of fluid parcels while the Eulerian representation (control volume method) is adopted for the energy equation of the solid matrix. The boundary conditions are set as the periodic flow of the sine function. The thermodynamic parameters of the gas parcels are obtained, which reveal the critical processes of the heat transfer in the regenerator under oscillating flow. The performance of the regenerator with different geometries is evaluated based on the numerical results. The present study provides insight for better understanding the physical process in the regenerator of the PTR, and the proposed model serves as a useful tool for the design and optimization of the cryogenic regenerator.
1. Introduction
The use of very low temperatures in advanced technology for applications in medical science, electronic technics, computer technology, aerospace exploration and other fields requires high performance cryogenic systems of low cost, simple design, small vibrations, low noise production, long life and high efficiency [1]. The pulse tube refrigerator (PTR) has been widely used because of the absence of moving parts at cryogenic temperature [2]. As the most important component in a PTR system, the regenerator has the advantages of a large heat transfer area and enhanced fluid mixing [3]. Its oscillating flow characteristics play a critical role in the performance of a PTR, which has attracted extensive attention in both theoretical and experimental studies. Radebaugh et al. reported a series of numerical studies on the performance and optimization of regenerators of a 4 K cryogenic system [4,5,6,7]. They used the commercial software Regen 3.2 in the simulation and design. They obtained the temperature curves along the regenerator which were later demonstrated to be consistent with the experimental results [7]. The comparative study of He-3 and He-4 systems showed that He-3 was more like an ideal gas at low temperature, which indicated that the substitution of He-3 for He-4 helped to improve the performance of regenerator [5]. Using Regen 3.3, the influence of porosity on the losses of the regenerator was analyzed, showing that the regenerator loss decreased with the decrease of porosity [4]. They also investigated the influence of the operating parameters, e.g., average pressure, pressure ratio and warm-end temperature; the regenerator parameters, e.g., material, shape and hydraulic diameter of the solid matrix; and the geometric parameters. Based on the optimization, the ineffectiveness was reduced to 0.36 and the second-law efficiency was enhanced to 25% [6]. Nield et al. [8] investigated the effects of a local thermal non-equilibrium on thermally-developing forced convection in a porous medium in parallel plate channels with the classic Graetz method, and the momentum equation of porous medium was established using the Brinkman model. Their study revealed that the local Nusselt number was closely related to the Peclet number and the thermal conductivity of both solids and gas. Pathak et al. [9] used the commercial computational fluid dynamics code (CFD) Fluent to simulate convective heat transfer and thermal dispersion during laminar pulsating flow in porous media, wherein the gas pulsation was realized through the inlet boundary condition of sine waves. Their simulations covered the porosities range from 0.64 to 0.84, the frequency range from 0 to 100 Hz, and the Reynolds number range from 70 to 980, which showed that the heat transfer in the porous medium had a strong dependence on the porosity, Reynolds number and operating frequency. Based on the simulation results, empirical correlations of both the thermal diffusion term and the Nusselt number were proposed, respectively. Teamah et al. [10] carried out numerical simulations of laminar forced convection in horizontal pipes partially or completely filled with porous material, and obtained the effects of the geometry (cylindrical and annular) of the porous media and the placement in the pipe on the flow distribution. The influence of the external diameter of porous media and the Darcy number was also investigated. The results showed, that the average Nusselt number of the flow in the pipes with the placement of porous media increased, while the entrance length decreased; there existed a critical value for the external diameter of porous media, and the thermal performance degraded when the external diameter exceeded this value. Li et al. [11] performed both theoretical and experimental studies to reveal the influence of regenerator void volume on the performance of a precooled 4 K high frequency Stirling type PTR. They found the following results: that the refrigeration temperature could be lowered as porosity increased, but that the power input of the precooling stage increased significantly; that lower average pressure yielded a lower refrigeration temperature, as well as a lower power input of the second precooling stage; that the performance of the final stage regenerator had a strong dependence on the operating frequency, especially at a low average pressure; and that the regenerator void volume in a multi-stage Stirling type PTR had a significant impact on the distribution of cooling capacity over different stages of regenerator. Saat and Jaworski [12] proposed a friction factor correlation applicable to a larger mesh range for a regenerator in a travelling-wave thermoacoustic system, based on experimental and CFD studies. They also studied the effects of temperature field, gravity and device orientation on the oscillatory flow [13]. Hsu and Biwa [14] carried out an experimental study on the heat flow in different mesh screen regenerators and compared the experimental result with four empirical equations, and concluded that all four empirical equations reproduce the measured heat flow rates to a similar degree.
In the previous studies, Eulerian representation has been widely employed to describe the oscillating flow and heat transfer in the regenerators. Recently, Dai and Yang [15,16] applied the lattice Boltzmann method (LBM) to the study of porous media flow and heat transfer. They verified the LBM model by simulating the flow across a cylinder, and then used the model to investigate the oscillating flow and heat transfer in porous media. The results showed that LBM was an effective method for the optimization of the PTR. In previous studies, the Lagrange description-based model has been adopted. In 1994, Organ [17] employed the Lagrangian representation for the governing equations of energy conservation. They solved the regenerator problem using the ε-NTU (number of transfer units) method, and analyzed the effect of NTU and solid-gas heat capacity ratio on the performance of the regenerator. However, the momentum equations were ignored in their study, and details of the oscillating flow in regenerators are still not well understood. Liang et al. [18] used the Lagrange description to explain the working mechanism of PTR and proposed the thermodynamic asymmetry effect. However, they focused on the pulse tube, and the regenerator was assumed to be perfect. Ataer [19] concluded that the Lagrangian method was more suitable for analyzing the heat transfer in the regenerative duct of free-piston type Stirling engines than other theories. In 2014, Tang et al. [20] developed a one-dimensional model of a regenerator based on the Lagrange description, and investigated the enthalpy flow, entropy flow on the Euler description and the gas parcels motion and loss on the Lagrange description, respectively. This work is helpful in understanding the regenerative process, but the flow resistance and real gas properties are neglected, and the heat transfer coefficient is also set constant.
In this study, Lagrangian representation is used to describe the thermodynamic cycle process of gas parcels inside the regenerator, and track the flow and heat transfer of a single parcel, leading to a better understanding of the operation principles and characteristics of the regenerator. A one-dimensional transient model of the regenerator in the PTR operating at 50 Hz is developed based on Lagrangian representation. The SIMPLER algorithm is used to solve the governing equations. The porous Darcy-Brinkman-Forchheimer model is applied in the momentum equation, and the thermal non-equilibrium model is implemented in the energy equation. The simulation results of mass flow at the cold end agree well with the experimental data, which verifies the reliability of this model. The variations of thermal parameters and the distribution of gas parcels under oscillating flow are obtained and analyzed in detail, and the effects of structural parameters on the regenerator ineffectiveness are discussed. This study is useful in aiding the understanding of the flow and heat transfer of internal fluid inside the regenerator, and can also provide the guidelines for the regenerator design.
2. Numerical Model and Simulations
2.1. Mesh Generation
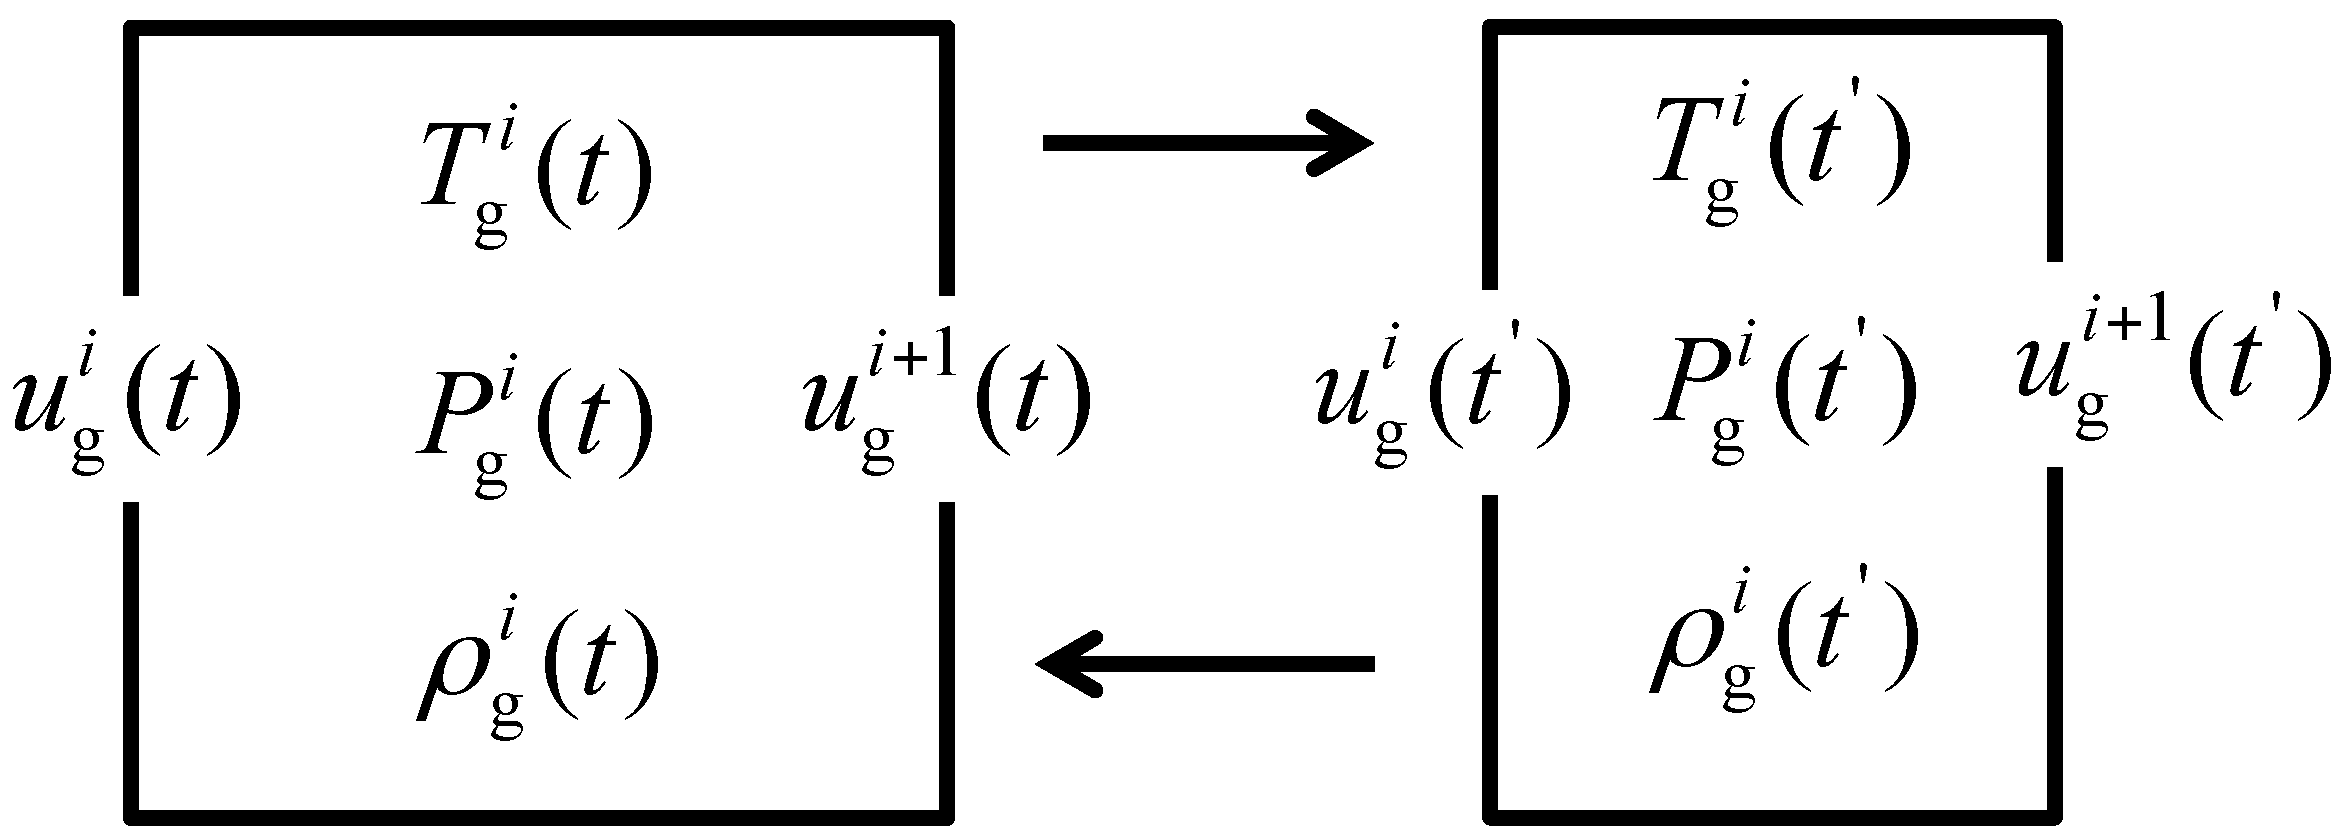
A one-dimensional transient model of the regenerator under oscillating flow is developed. Considering the use of Lagrangian representation, it is necessary to describe the mesh generation before discussing the governing equations. Using Lagrangian representation, the fluid in the regenerator is divided into parcels, and the governing equations of gas are set up to track the motion, deformation and heat transfer processes of gas parcels in the regenerator. A “staggered grid” scheme is implemented for the pressure and velocity, as shown in Figure 1 for gas parcel . It should be noted that the staggered grid of the parcels is different from that of control volumes. In the Lagrangian representation, the velocity and the deformation are defined at the parcel boundary, while the pressure, temperature and other properties are defined at the center of the parcels. The parcel boundaries move forward and backward in the simulation. However, the staggered grid is fixed in the control volume scheme. The flow direction from the warm end to the cold end in the regenerator is defined as positive, and the orders of parcels along the positive direction at the boundary are defined as their indices. The Eulerian representation is used for the mesh generation of the solid matrix in the regenerator, and the energy equations for control volumes are solved using the finite volume method.
2.2. Governing Equations
2.2.1. Assumptions
- Heat transfer and fluid flow is simplified to one dimension along the axial direction of the regenerator;
- The wall of the regenerator is adiabatic;
- Axial conduction in the solid matrix is neglected;
- Heat conduction between the wall and solid matrix in the regenerator is negligible;
- Density of the solid matrix is assumed to be constant and thermal expansion of the solid is neglected.
2.2.2. Mass, Momentum and Energy Conservation
The governing equations of the conservations of mass, momentum and energy are presented in Lagrangian form as follows:
The continuity equation of gas parcels is:
The momentum equation is based on the Darcy-Brinkman-Forchheimer model:
where S is the source term representing the force between fluid and wire meshes. It includes the osmotic force term and inertial force term by:
where Cf is the osmotic resistance coefficient and Cj is the inertia coefficient. The two coefficients can be estimated according to the friction factor relations of the regenerator, which will be discussed in the following section.
Energy equations of the gas parcels and solid matrix are respectively written based on the thermal non-equilibrium model. For the control volume, the heat transferred to gas by heat convection is equal to the sum of the enthalpy increment of flow and the internal energy increment. For the gas parcels in Lagrangian representation, the heat transferred to gas by heat convection equates to the increment of internal energy of the gas parcel itself. So the expression of energy conservation is given by:
For the solid matrix, the heat from the gas equates to the internal energy increment of the solid matrix, and the expression of energy conservation equation is as follows:
2.3. Boundary Conditions
In order to simulate the oscillating flow in the regenerator, a sinusoidal pressure wave is provided at the cold end with an average pressure of 3 MPa, and the mass flow of sinusoidal variations is provided at the warm end with the magnitude of 2.5 g/s. The thermal boundary conditions are as follows: the inlet temperature at the cold end is 80 K; the inlet temperature at the warm end is 285 K. Thus, the boundary conditions are specified as:
where subscript h indicates the warm end and c is the cold end.
2.4. Correlations of Heat Transfer Coefficient and Friction Factor
In 2014, Coasta et al. [21] reported the correlation of heat transfer coefficient for the stacked woven wire matrix regenerator, which had a diameter of 100 μm and a porosity of 63%. The validity and reliability of this correlation has been demonstrated for the application of porous media simulations, and the expression is given by:
The friction factor correlation has been widely studied for porous media. Miyabe et al. [22] investigated the pressure drop under steady flow in a screen-based regenerator and obtained the Darcy friction factor correlation, which is now widely used under steady flow in the regenerator:
where l denotes the pore gap.
Nam et al. [23] investigated the oscillatory flow in the regenerator at ambient temperature and set up a one-dimensional model. Based on the experimental results, they proposed correlations for the Fanning friction factor, which depended on the mesh numbers:
In this study, the steady friction factor correlation by Miyabe et al and the oscillating flow friction factor correlation by Nam et al. are applied in the simulations, respectively. The results indicate that under the boundary condition of sinusoidal pressure, the steady friction factor correlation by Miyabe is no longer valid, showing significant differences between steady flow and oscillatory flow. So, the friction factor correlation introduced by Nam et al. is selected.
2.5. Numerical Algorithm
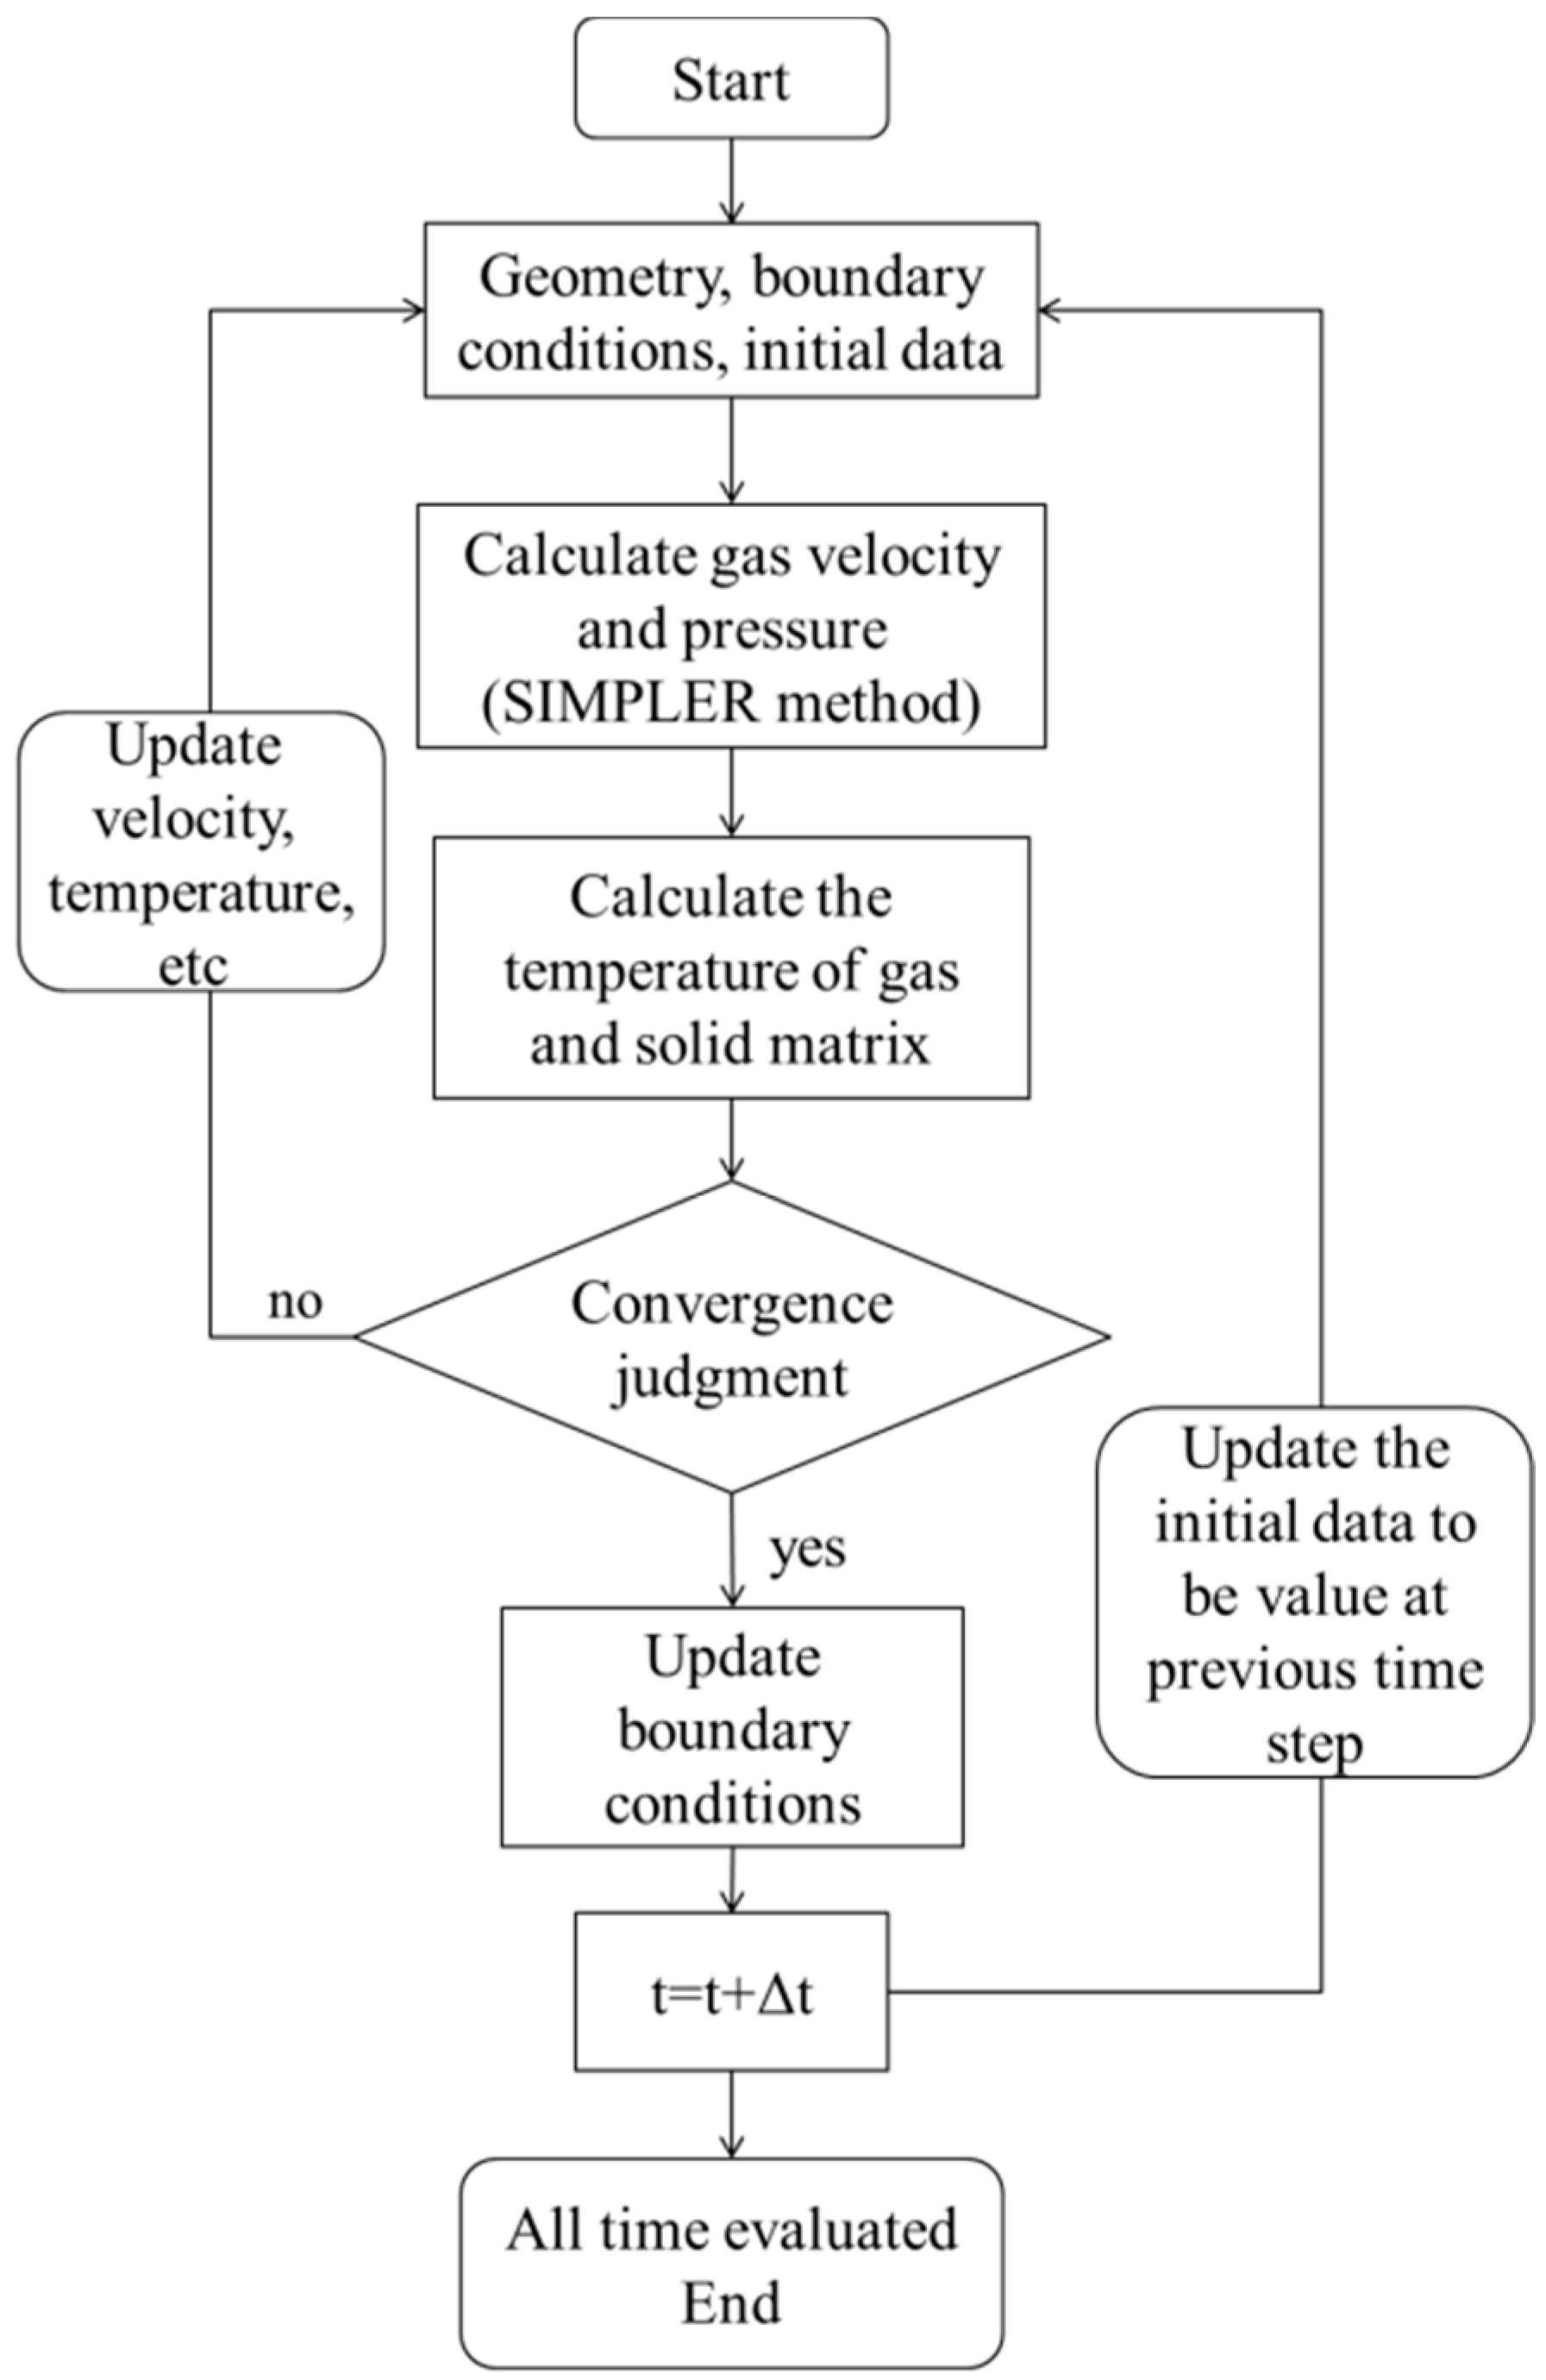
The numerical algorithm to solve the governing equations is shown in Figure 2. The geometry parameters are given at the beginning. The boundary conditions and initial data are set to start the calculation. An iteration at a given time step involves calculating the velocity, pressure and temperature of all gas parcels as well as the temperature of all solid elements. After each iteration, the gas velocity of each parcel is compared with the value in the previous iteration, thus obtaining the maximum absolute difference in all gas parcels. This value is then compared with the convergence criteria. If the convergence condition is not satisfied, iterations in the same time step are continued with the updated velocity, pressure and temperature. When the convergence criteria are achieved, the iteration in this time step is completed and the boundary conditions are updated. The calculation in the next time step starts with the updated values of gas velocities, pressures, temperatures, and the new temperature field of solid matrix.
3. Results and Discussion
3.1. Mesh Independence Verification
The mesh independence is verified for the selection of time step and grid size, and the regenerator parameters used in the simulations are listed in Table 1. Firstly, the selection of the time step is verified. Simulations with different time steps are performed under the condition of the fixed parcel grids, and the effects of the time step on the results are compared. The proper time step is the one beyond which further refinement has little effect on the results. Then the selection of the size of gas parcels is verified through simulations with a fixed time step, but different initial sizes of gas parcels. The proper grid is obtained when further mesh refinement does not improve the simulation results.
3.1.1. Verification of Time Step Independence
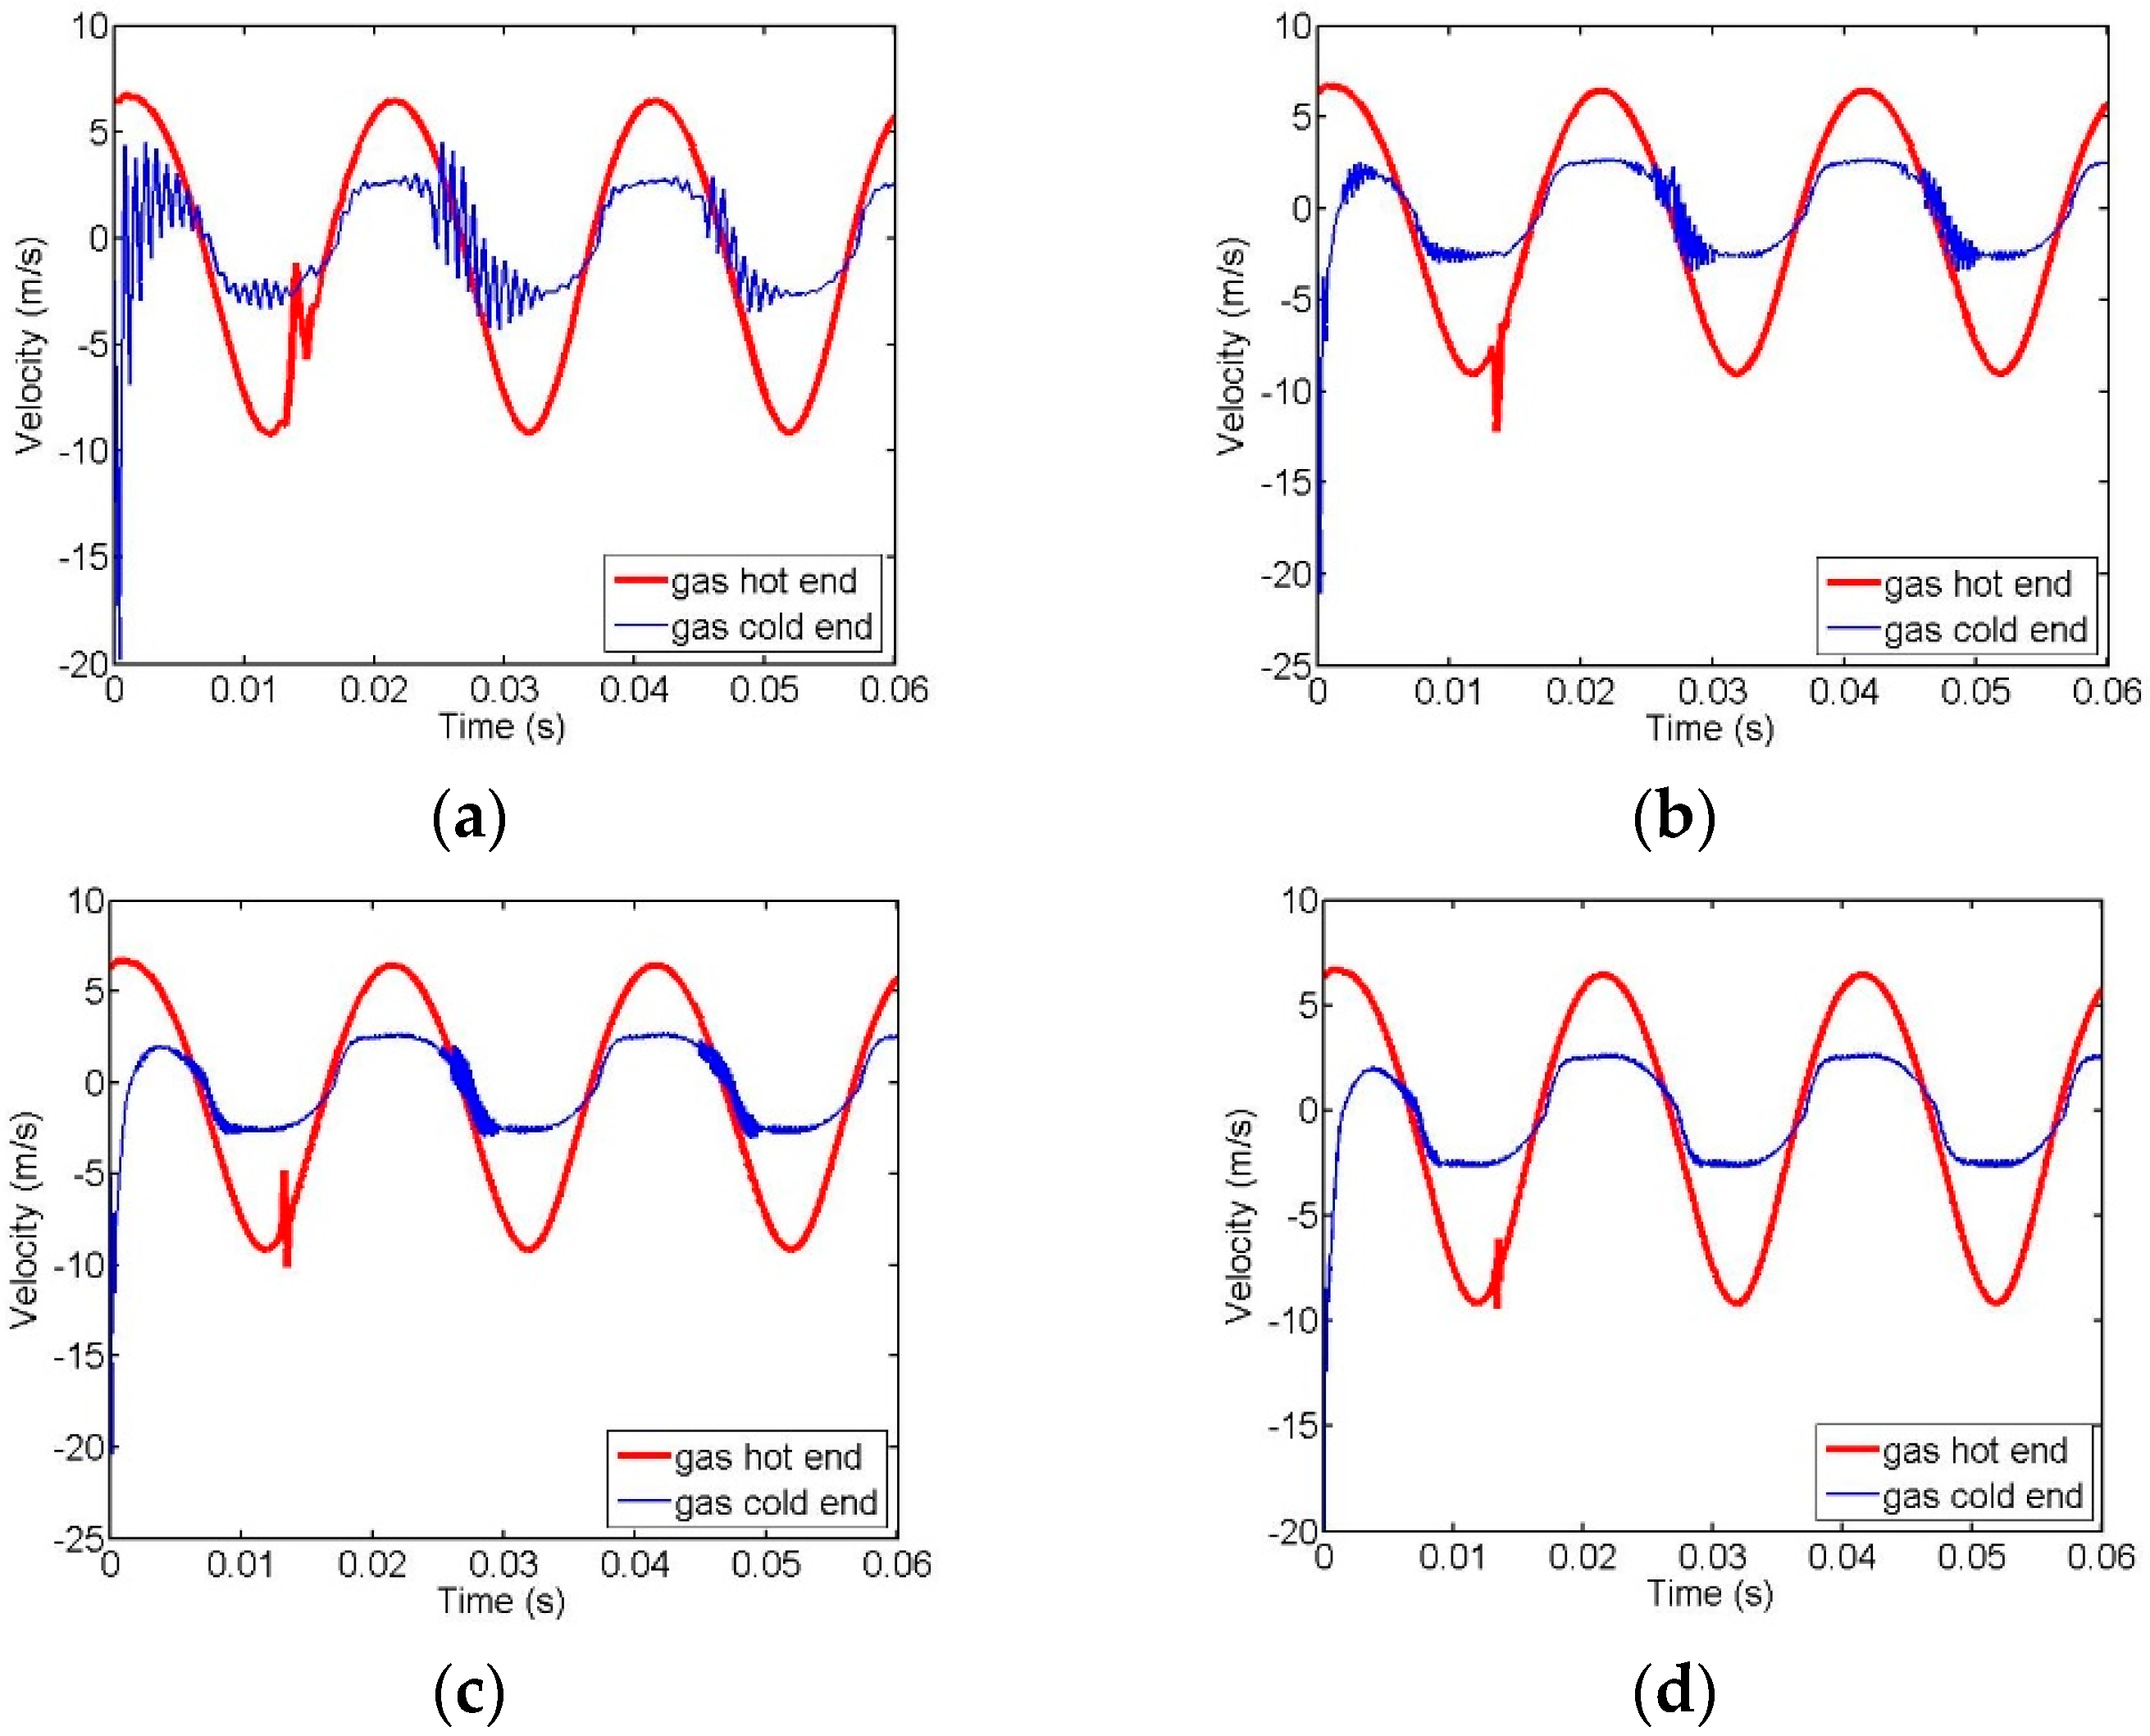
Four different time steps under the fixed initial size of gas parcels are chosen as follows: 50, 100, 200 and 300 time steps per cycle. The variations of inlet velocities at the cold end are obtained and shown in Figure 3, serving as the selection criteria of time steps.
As shown in Figure 3, the red solid lines represent the specified velocity at the warm end, and the blue lines are the predictions of velocities at the cold end. From these 4 figures, it can be seen that the calculated value of cold end velocity is unstable, with large fluctuations when a cycle is divided into 50 time steps; the fluctuation of the calculated cold end velocity becomes smaller under the condition of 100 time steps per cycle; a division of 200 time steps per cycle shows even better stability and lower fluctuations; the choice of 300 time steps per cycle enhances the stability of the calculated velocity at the cold end and minimizes the fluctuation to a great extent. As shown in Figure 4, the cold end velocity after several cycles converges with little fluctuations under the condition of 200 time steps per cycle, which is almost the same as under 300 time steps per cycle. At the early stage, the initial velocity, which is inconsistent with actual condition, produces a large fluctuation. Therefore, a division of 200 time steps per cycle is adopted in the consideration of both the calculation accuracy and computational cost.
3.1.2. Size of Parcels Independent Verification
Under the condition of fixed time steps, the initial gas in the regenerator is divided into 65, 130, 195 parcels, and the corresponding parcel sizes are 1, 0.5 and 0.333 mm, respectively. Then, simulations for a few cycles are performed, and the predictions of cold end velocities are compared, which enables us to make a proper choice of parcel meshing.
Figure 5 illustrates that, when the initial gas parcels inside the regenerator increase from 65 to 130, the predictions of the cold end velocity are converged when the initial parcel number is 130; the predictions show little change with further increase of the initial parcel number beyond 130. Therefore, the parcel meshing of 130 is chosen in the following simulations.
3.2. Model Validation
Nam et al. [24] conducted an experimental study on regenerators within a given size and operating parameters. The comparison between the results calculated by our model and that of the experiment is carried out with the structural and operating parameters of the regenerator in the experiment. The proposed model is also compared with Regen, a program specialized in regenerator simulation [25]. The pressure variations of the warm end and the cold end in one cycle are compared as shown in Figure 6. In general, the simulation results are compatible with the experimental results, more so than Regen. The deviation of Regen may be caused by the limitations in the setting of boundary conditions, namely that both pressure and mass flow rate must be specified at the cold end, but that the input value of the phase angle between the two may be deviated from the actual value. Another reason might be because of the friction term determined from the experimental data of steady flow, which may not be accurate for oscillating flow in the regenerator. It can also be seen from the figure that the deviations in amplitudes and phase angles between the pressure curves predicted by our model, and the experimental results of both the warm end and the cold end, are relatively small. This deviation may be caused by the assumptions in the model, as well as the difference in boundary conditions at the cold end as denoted by the blue curves in Figure 6.
3.3. Simulation Results
A high frequency regenerator at low temperature, operating at 50 Hz with a cold end temperature of 80 K, and a warm end temperature of 285 K, is simulated. The flow field and heat transfer in the oscillating processes are discussed in detail. With the aid of Lagrangian representation applied in the model, the trajectories of selected gas parcels inside the regenerator can easily be obtained, as well as such time-dependent changes of gas parcel parameters as temperature, pressure, density and velocity.
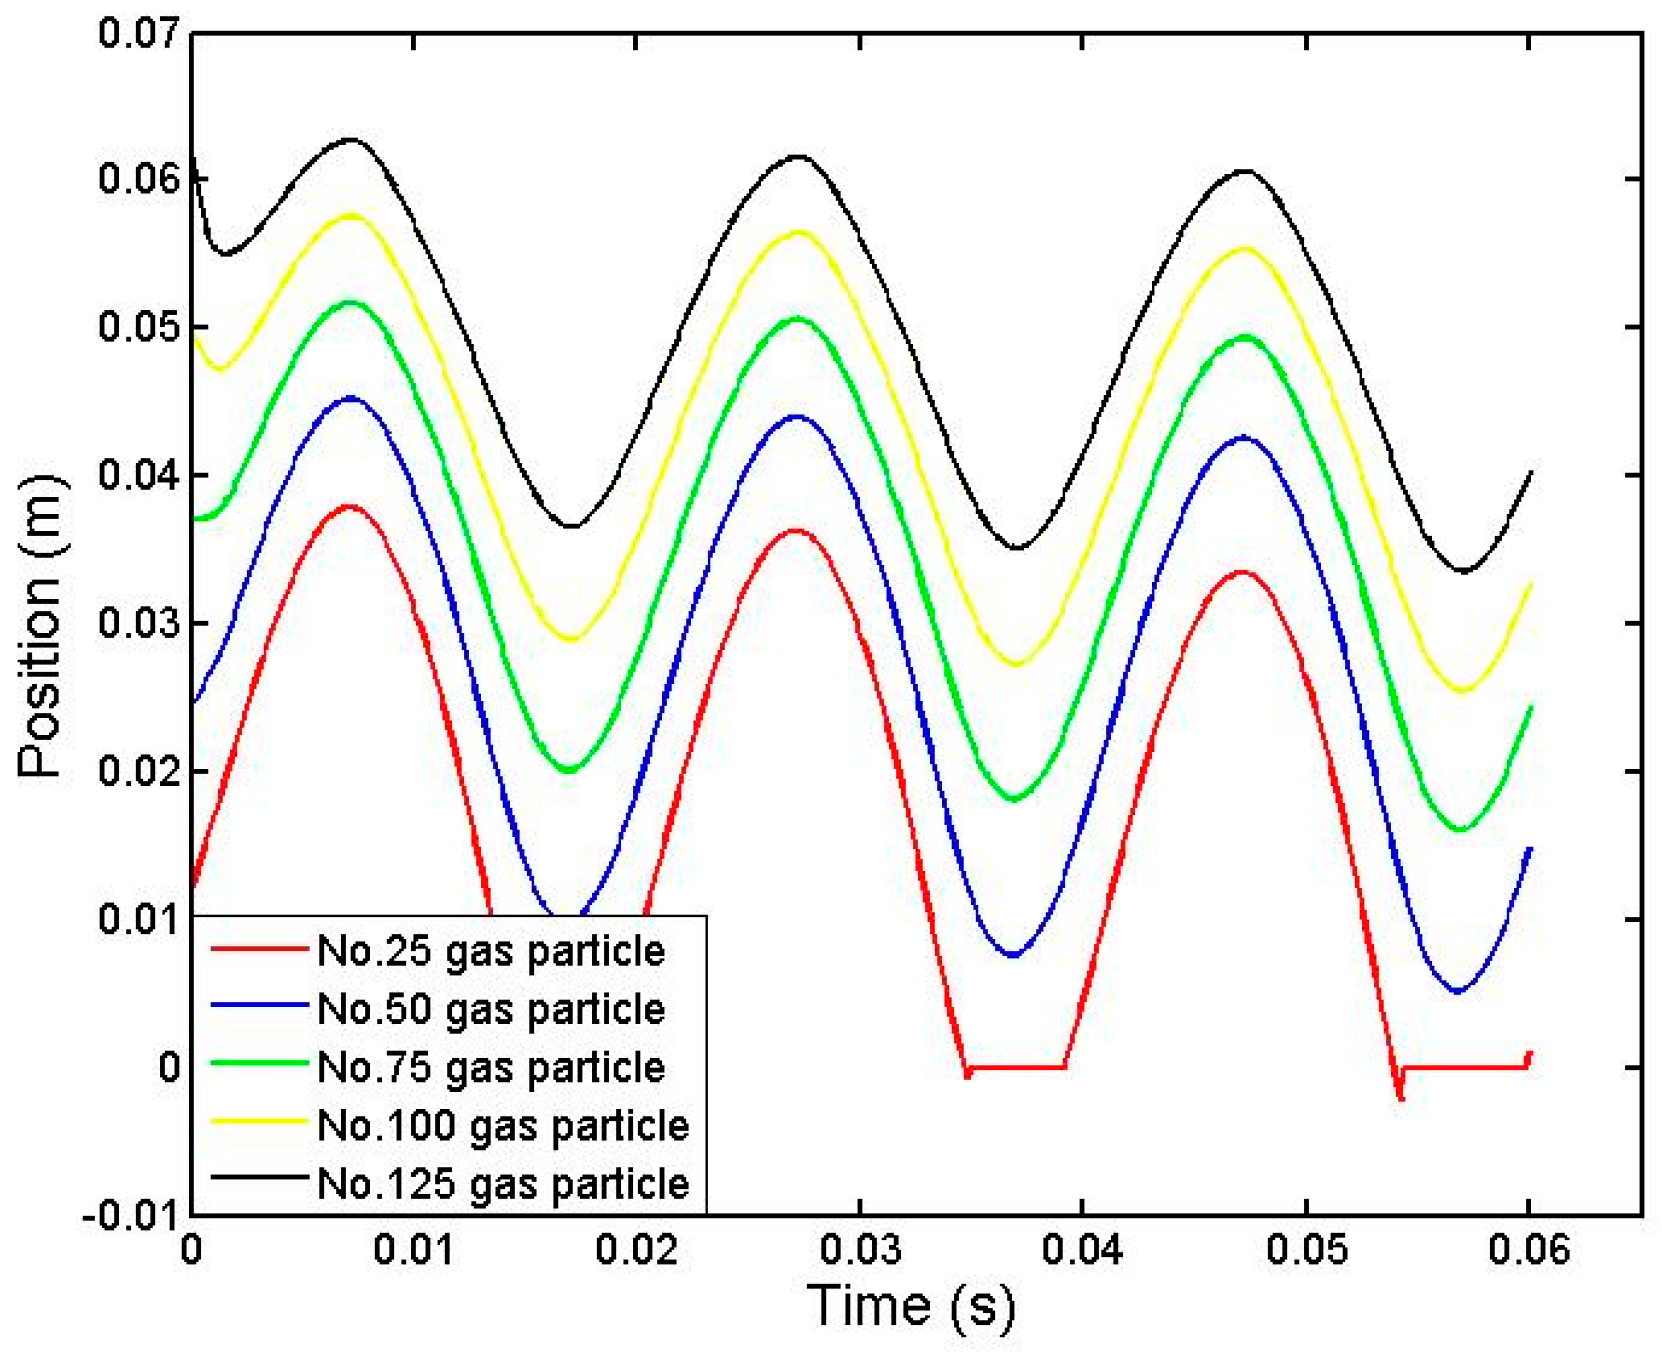
The trajectories of gas parcels inside the regenerator are illustrated in Figure 7. The gas parcels are numbered on the basis of their positions at the initial time, with indices increasing sequentially along the direction from warm- to cold-ends. The five parcels numbered 25, 50, 75, 100 and 125 are selected for tracking purposes. It can be seen from the trajectories of gas parcels that the parcels’ backward and forward motion over time shows an oscillatory pattern of movement, and that the parcels close to the warm end would be expelled from the regenerator at the second half cycle. From the figure, it can be observed that the highest and lowest points during the time period of the gas parcels’ trajectories decrease gradually, which indicates the gas parcels approaching the warm end in the first few cycles of the simulation.
The variations of temperature, pressure, density and velocity with the positions of the five gas parcels tracked in the regenerator are shown in Figure 8. It can be established from the figures that each gas parcel’s trajectory consists of three parts of curves, which is consistent with the three cycles of the simulation, indicating that gas parcels move in a reciprocating pattern. The temperature variations shown in Figure 8a indicate that the temperature decreases when gas parcels move from the warm end to the cold end and the temperature rises when moving from the cold end to the warm end. The average temperature of the first half of the cycle is higher than that of the second half, which clearly illustrates the regenerator’s cooling mechanism; the parcel’s average temperature decreases with the increase of its index that is ordered from the warm end to the cold end. These gas parcels form a series of heat exchange units at different temperatures from 285 to 80 K. These results help to improve our understanding of how regenerators work from the perspective of gas parcels.
Figure 8b shows the pressure variations of selected gas parcels as a function of position. The parcels’ pressure firstly increases and then decreases at a rather slow speed when moving from the warm end to the cold end, while the opposite is true when the process is in reverse, moving from the cold end to the warm end. The average pressure in the first half cycle is higher than that in the second half. Under the influence of temperature and pressure, the parcels’ density shown in Figure 8c rises constantly during the motion from the warm end to the cold end and decreases when moving in the opposite direction. The average density of the cooling process is higher than the heating process. The variations of parcel velocity, as shown in Figure 8d, follow a trend similar to the pressure. When combining the results from the four figures, it is obvious that the variations of the parcels’ temperature, pressure, density and velocity in different cycles decrease with the increase of parcel index: in other words, gas parcels near the warm end change most dramatically in the first three cycles. This may result from the fact that the parcel’s velocity is larger when mass flow is constant with a rather smaller gas density under the higher temperature at the warm end. The larger velocity can result in a larger range of motion within the same time cycle, thus causing larger resistance and pressure differences, and which therefore leads to dramatic velocity variations. Meanwhile, gas volume is considerably large when the gas density is small, since the mass of each gas parcel at the initial time is the same, thus increasing the heat exchange area between parcels and solid matrix and enlarging the temperature differences. The large variations of parcels’ temperature and pressure yield a large variation of parcel density.
According to the Reynolds transport theorem, Lagrangian representation can be converted to Eulerian representation. Figure 9 shows the distribution of parameters inside the regenerator from the perspective of a Eulerian representation. It can be seen from the distribution of gas temperature that the temperature declines from the warm end to the cold end. With the initial value of 285 K, the heat exchange increases, and the gas temperature decreases gradually in the process of calculation. It is noticeable from Figure 9a that the temperature drops dramatically near the cold end during the simulation of the cooling-down processes. This is because the temperature of the gas entering the regenerator at the cold end is set to 80 K during the second half cycle of the oscillating flow. In the early stages, the large temperature difference between gas parcels and solid matrix results in dramatic temperature change. As the oscillating flow continues, the distribution of temperature develops into a linear pattern. As shown in Figure 9b, the distribution of pressure in the regenerator changes periodically over the cycle. During the first half cycle of the oscillating gas flow, pressure declines from the warm end to the cold end, while during the second half cycle, the pressure distribution is reversed. The distribution of density shown in Figure 9c is similar to the temperature distribution on the existence of dramatic changes, which can result from the temperature variations. As shown in Figure 9d, the velocity seems nearly linear, with apparent fluctuations near the cold end. This phenomenon can be explained by the reversals of gas parcels. There are gas parcels with different speeds and directions flowing into both ends of the regenerator during the entire cycle of the oscillating flow, which generates an unstable pressure in the process of parcel velocity reversal, and therefore leads to the presentence of velocity fluctuations. Since the parcels from the warm end have higher average velocity, the velocity reversal occurs near the cold end, which can be observed in Figure 9d.
The thermal performance of the regenerator is usually measured by the ineffectiveness, which is as follows [26]:
where 0 − τw is the time period when fluid flows into the warm end, and τw − τ is the time period when fluid flows into the cold end. H represents the enthalpy loss at the cold end during an entire cycle, and Hw − Hc represents the maximum heat transfer that can be achieved in the regenerator.
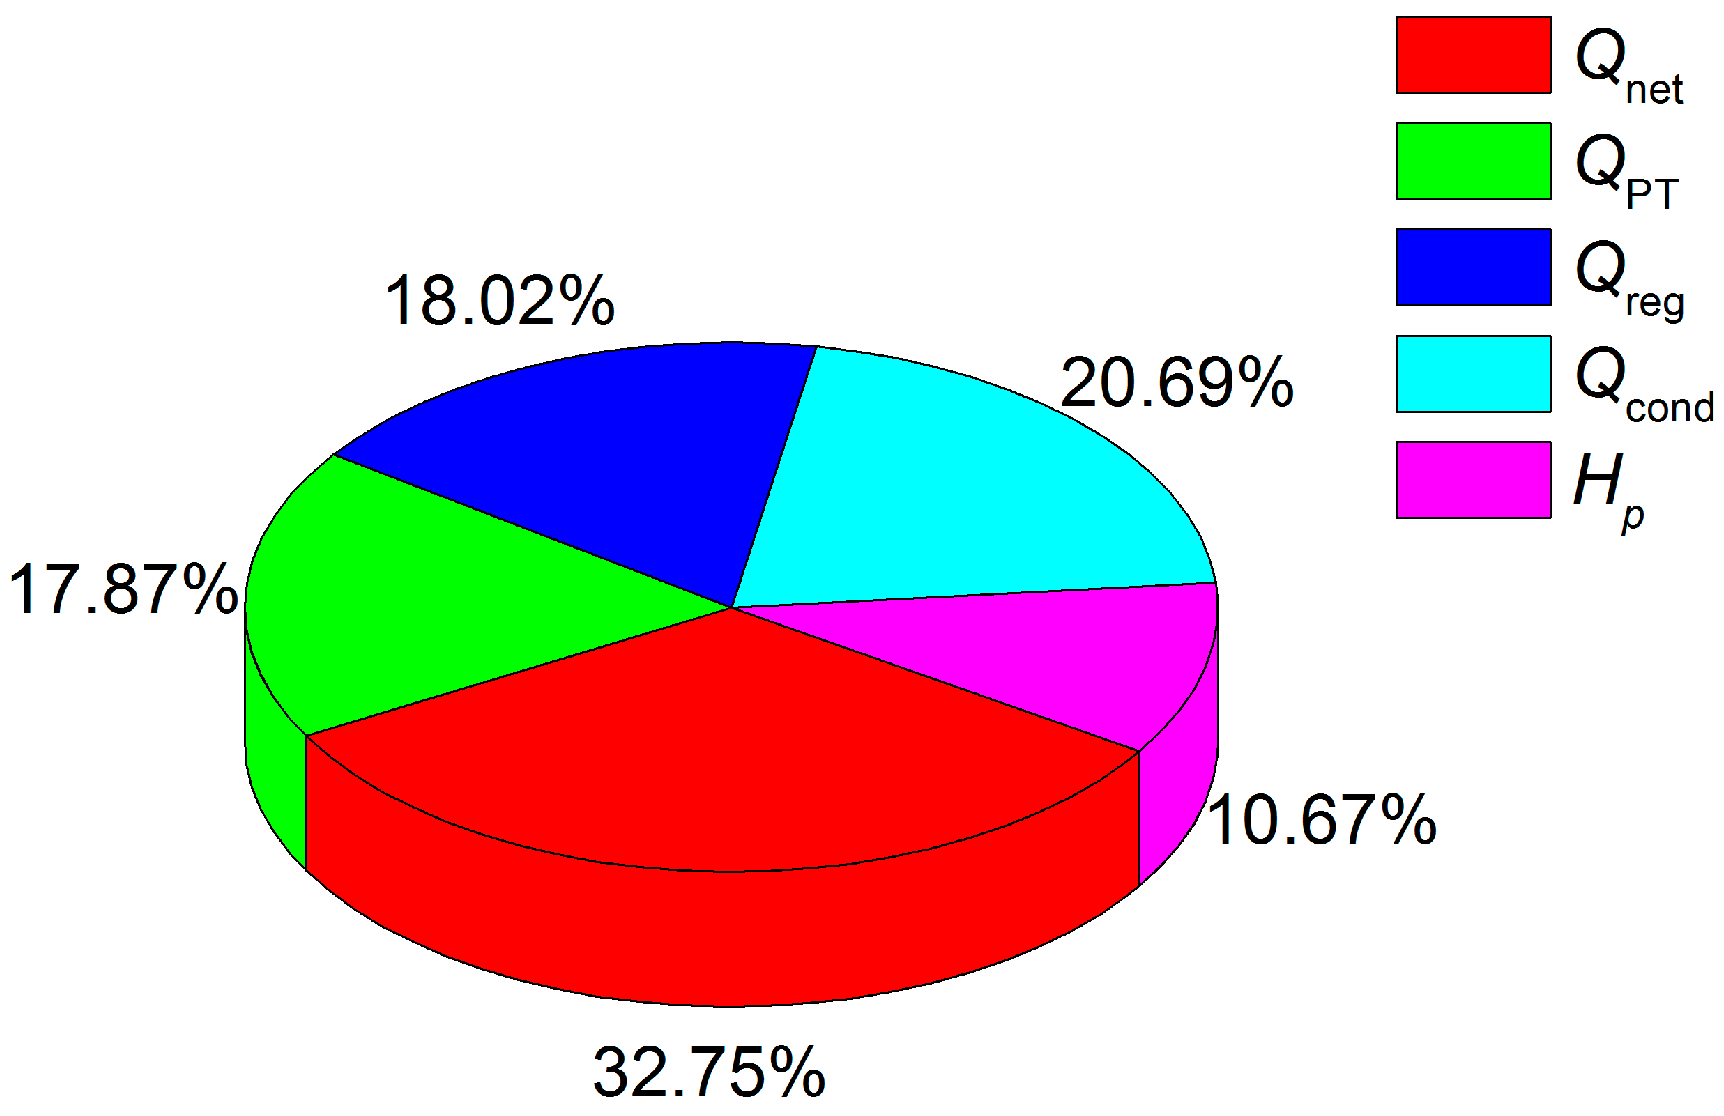
The purpose of the regenerator is to deliver as much of this acoustic power to the cold end as possible with minimum loss. Therefore, a net refrigeration power is given by:
where is the acoustic power at the cold end; is the enthalpy flow associated with the enthalpy pressure dependence (real gas effect); is the thermal loss associated with enthalpy flow caused by imperfect heat transfer and limited heat capacity in the regenerator (regenerator ineffectiveness); is the conduction heat leak; is the loss associated with an imperfect pulse tube or any irreversible expansion process at the cold end; and is the radiation heat leak to the cold end, which is ignored in this work.
Considering the lack of accurate theoretical calculation for pulse tube losses, an estimated value of pulse tube losses is adopted, as the pulse tube expansion efficiency is assumed to be 80%. The loss characteristics under our operating conditions are calculated and the proportions of various losses in are compared. Figure 10 gives the distribution of losses in a PTR, which indicates that regenerator ineffectiveness is one of the main reasons contributing towards refrigeration losses.
By using the above correlation, the ineffectiveness of regenerators with different diameters and lengths are estimated to analyze their effects on the regenerator performance. With respect to the effect of diameter on the regenerator performance, five regenerators are studied, with diameters of 12, 14, 16, 17.5 and 20 mm, respectively, and the results are shown in Figure 11. With the increase of diameter, the ineffectiveness of the regenerator shows a tendency towards increase at a smaller diameter, reaching the maximum near the diameter of 14 mm, and then decreases quickly before being stabilized at the diameter of 20 mm. The occurrence of the ineffectiveness peak can be explained as follows: the heat exchange between fluid and solid matrix is associated with heat transfer coefficient and heat transfer area. On the basis of this principle, under the condition of constant mass flow, a large fluid velocity accompanied by a small diameter, leads to a large heat transfer coefficient and thus minimal ineffectiveness; a large heat transfer area accompanied by a large diameter can also reduce the ineffectiveness; when the diameter of regenerator is intermediate, the combination of fluid velocity and heat transfer area would lead to the worst heat exchange, and as a result, the ineffectiveness reaches the maximum value.
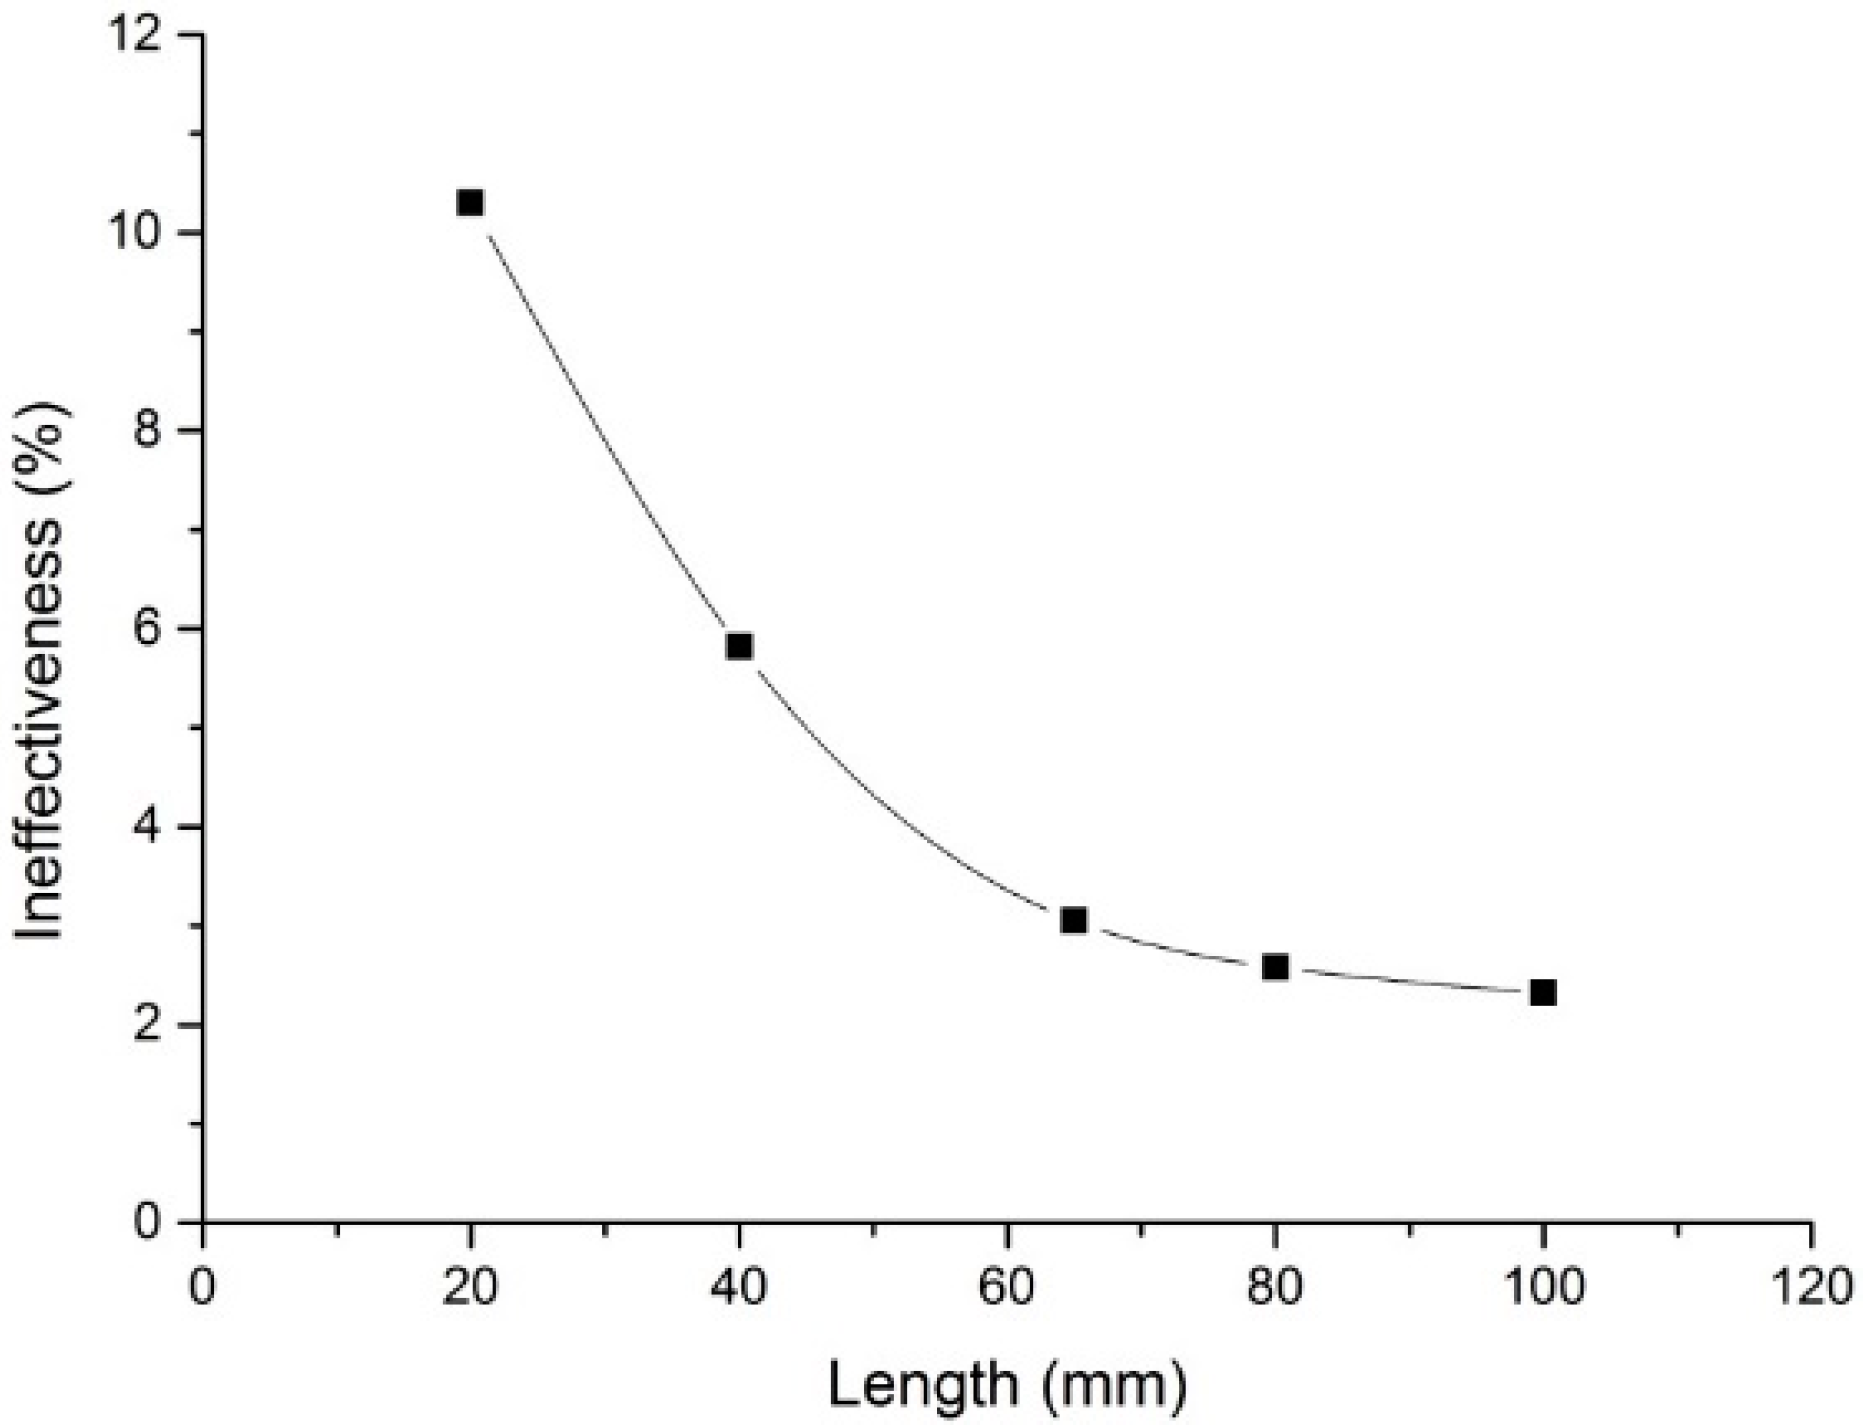
In order to obtain the effect of the length on the regenerator performance, simulations are performed on five regenerators with different lengths: 20, 40, 65, 80 and 100 mm, and the results are shown in Figure 12. It can be observed that the ineffectiveness decreases monotonically with increasing length of the regenerator. The variations become smaller with further increase of length beyond 65 mm, and finally tend to stabilize at the length of 100 mm. It can be explained as follows: the larger heat transfer area of the longer-length regenerator enhances the heat transfer, and thus, reduces the ineffectiveness. When the regenerator length is large enough, the heat transfer between fluid and solid matrix has reached the limit, and any further increase of length contributes little to the heat transfer enhancement, as well as the ineffectiveness reduction.
4. Conclusions
Simulations of oscillating flow in a pulse tube cryocooler regenerator operating at 50 Hz were performed, using a numerical model in Lagrangian representation, and solved with SIMPLER algorithm. The study reveals that the flow resistance under oscillating flow differs significantly from that which occurs under steady flow, indicating that the friction factor correlation for steady flow was not valid under the condition of oscillating flow. The trajectory obtained by tracking a single gas parcel implies that the oscillating movement in the regenerator can provide insight into understanding the complex flow. The analysis on the temperature variations of gas parcels reveals the heat exchange processes in the regenerator. Additionally, similar characteristics exist in the variations of gas parcels’ temperature, pressure, density and velocity, that is, the variation range of parameters near the warm end is larger, due to the higher temperature and smaller density. According to the Reynolds transport theorem, the distributions of various parameters along the axial direction of the regenerator are obtained from the perspective of the Euler representation. Further study of flow and heat transfer processes shows that the trends of temperature, pressure and density under the initial conditions are compatible with the general characteristics of the regenerator. However, the distribution of velocity shows some fluctuations near the cold end, which is caused by the inlet velocity difference at the warm- and cold-ends. The performance of the regenerator with different diameters and lengths is evaluated, showing that the ineffectiveness reaches its peak when the diameter is near 14 mm and then decreases with the increase of diameter; the ineffectiveness decreases monotonically with increasing length of the regenerator, and tends to stabilize at the length of 100 mm.
Acknowledgments
This project was supported by the National key basic research program (613322), and the Natural Science Foundation of Jiangsu Province (BK20160388).
Author Contributions
Liang Chen and Chen Chen conceived and developed the model; Xiufang Liu and Chen Chen performed the simulations; Chen Chen and Yu Hou analyzed the data; Shubei Wang contributed analysis tools; Xiufang Liu and Qian Huang wrote the paper.
Conflicts of Interest
The authors declare no conflict of interest. The founding sponsors had no role in the design of the study; in the collection, analyses, or interpretation of data; in the writing of the manuscript, and in the decision to publish the results.
References
- Popescu, G.; Radcenco, V.; Gargalian, E.; Bala, P.R. A critical review of pulse tube cryogenerator research. Int. J. Refrig. 2001, 24, 230–237. [Google Scholar] [CrossRef]
- Richardson, R.N.; Evans, B.E. A review of pulse tube refrigeration. Int. J. Refrig. 1997, 20, 367–373. [Google Scholar] [CrossRef]
- Mahdi, R.A.; Mohammed, H.A.; Munisamy, K.M.; Saeid, N.H. Review of convection heat transfer and fluid flow in porous media with nanofluid. Renew. Sustain. Energy Rev. 2015, 41, 715–734. [Google Scholar] [CrossRef]
- Radebaugh, R.; Huang, Y.; O’Gallagher, A. Calculated Performance of Low-Porosity Regenerators at 4 K with He4 and He3. Cryocooler 2009, 15, 325–334. [Google Scholar]
- Radebaugh, R.; Huang, Y.; O’Gallagher, A.; Gary, J. Calculated regenerator performance at 4 k with helium-4 and helium-3. In Proceedings of the AIP Conference, Chattanooga, TN, USA, 16–20 July 2007. [Google Scholar]
- Radebaugh, R.; Huang, Y.; O’Gallagher, A.; Gary, J. Optimization Calculations for a 30 HZ, 4 K Regenerator with HELIUM-3 Working Fluid. In Proceedings of the AIP Conference, Tucson, AZ, USA, 28 June–2 July 2009. [Google Scholar]
- Radebaugh, R.; O’Gallagher, A.; Gary, J. Regenerator behavior at 4 K: Effect of volume and porosity. In Proceedings of the AIP Conference, Madison, WI, USA, 16–20 July 2001. [Google Scholar]
- Nield, D.A.; Kuznetsov, A.V.; Xiong, M. Effect of local thermal non-equilibrium on thermally developing forced convection in a porous medium. Int. J. Heat Mass Transf. 2002, 45, 4949–4955. [Google Scholar] [CrossRef]
- Pathak, M.G.; Ghiaasiaan, S.M. Convective heat transfer and thermal dispersion during laminar pulsating flow in porous media. Int. J. Therm. Sci. 2011, 50, 440–448. [Google Scholar] [CrossRef]
- Teamah, M.A.; El-Maghlany, W.M.; Dawood, M.M.K. Numerical simulation of laminar forced convection in horizontal pipe partially or completely filled with porous material. Int. J. Therm. Sci. 2011, 50, 1512–1522. [Google Scholar] [CrossRef]
- Li, Z.; Jiang, Y.; Gan, Z.; Qiu, L.; Chen, J. Influence of regenerator void volume on performance of a precooled 4 K stirling type pulse tube cryocooler. Cryogenics 2015, 70, 34–40. [Google Scholar] [CrossRef]
- Saat, F.M.; Jaworski, A.J. Friction Factor Correlation for Regenerator Working in a Travelling-Wave Thermoacoustic System. Appl. Sci. 2017, 7, 253. [Google Scholar] [CrossRef]
- Saat, F.M.; Jaworski, A.J. The Effect of Temperature Field on Low Amplitude Oscillatory Flow within a Parallel-Plate Heat Exchanger in a Standing Wave Thermoacoustic System. Appl. Sci. 2017, 7, 417. [Google Scholar] [CrossRef]
- Hsu, S.; Biwa, T. Measurement of Heat Flow Transmitted through a Stacked-Screen Regenerator of Thermoacoustic Engine. Appl. Sci. 2017, 7, 303. [Google Scholar] [CrossRef]
- Dai, Q.; Yang, L. LBM numerical study on oscillating flow and heat transfer in porous media. Appl. Therm. Eng. 2013, 54, 16–25. [Google Scholar] [CrossRef]
- Dai, Q.; Chen, H.; Yang, L. Numerical simulations of oscillating flow and heat transfer in porous media by lattice boltzmann method. J. Eng. Thermophys. 2012, 32, 1891–1898. [Google Scholar]
- Organ, A.J. Solution of the Classic Thermal Regenerator Problem. ARCHIVE Proc. Inst. Mech. Eng. Part C J. Mech. Eng. Sci. 1994, 208, 187–197. [Google Scholar] [CrossRef]
- Liang, J.; Ravex, A.; Rolland, P. Study on pulse tube refrigeration Part 1: Thermodynamic nonsymmetry effect. Cryogenics 1996, 36, 87–93. [Google Scholar] [CrossRef]
- Ataer, Ö.E. Numerical analysis of regenerators of free-piston type Stirling engines using Lagrangian formulation. Int. J. Refrig. 2002, 25, 640–652. [Google Scholar]
- Tang, Q.; Cai, J.; Liu, Y.; Chen, H. A Numerical Model of Regenerator Based on Lagrange Description. In Proceedings of the Interational Cryocooler Conference, Syracuse, NY, USA, 9–12 June 2014. [Google Scholar]
- Costa, S.C.; Barreno, I.; Tutar, M.; Esnaola, J.A.; Barrutia, H. The thermal non-equilibrium porous media modelling for CFD study of woven wire matrix of a Stirling regenerator. Energy Convers. Manag. 2015, 89, 473–483. [Google Scholar] [CrossRef]
- Miyabe, H.; Hamaguchi, K.; Takahashi, K. An approach to the design of Stirling engine regenerator matrix using packs of wire gauzes. In Proceedings of the 17th Intersociety Energy Conversion Engineering conference, Los Angeles, CA, USA, 8 August 1982. [Google Scholar]
- Nam, K.; Jeong, S. Novel flow analysis of regenerator under oscillating flow with pulsating pressure. Cryogenics 2005, 45, 368–379. [Google Scholar] [CrossRef]
- Nam, K.; Jeong, S. Measurement of cryogenic regenerator characteristics under oscillating flow and pulsating pressure. Cryogenics 2003, 43, 575–581. [Google Scholar] [CrossRef]
- Gary, J.; Radebaugh, R. An improved numerical model for calculation of regenerator performance (regen3.1). In Proceedings of the Fourth Interagency Meeting on Cryocoolers, Plymouth, MA, USA, 24 October 1990. [Google Scholar]
- Radebaugh, R.; Linenberger, D.; Voth, R.O. Methods for the measurement of regenerator ineffectiveness. NBS Spec. Publ. 1981, 607, 70–81. [Google Scholar]
Figure 1.
Velocity and thermodynamic parameters of gas parcels in the regenerator model: Tg—emperature of gas parcel; Pg—pressure of gas parcel; ρg—density of gas parcel; ug—velocity of gas parcel; t—instant time; i—number of gas parcel.
Figure 1.
Velocity and thermodynamic parameters of gas parcels in the regenerator model: Tg—emperature of gas parcel; Pg—pressure of gas parcel; ρg—density of gas parcel; ug—velocity of gas parcel; t—instant time; i—number of gas parcel.

Figure 2.
Schematic of the numerical algorithm.

Figure 3.
Velocity variations at the cold end of the regenerator predicted using different time steps per cycle: (a) 50; (b) 100; (c) 200; (d) 300. The velocity at the warm end is also shown in each figure as reference.
Figure 3.
Velocity variations at the cold end of the regenerator predicted using different time steps per cycle: (a) 50; (b) 100; (c) 200; (d) 300. The velocity at the warm end is also shown in each figure as reference.

Figure 4.
Predictions of cold end velocity after several cycles when time steps = 200 per cycle.
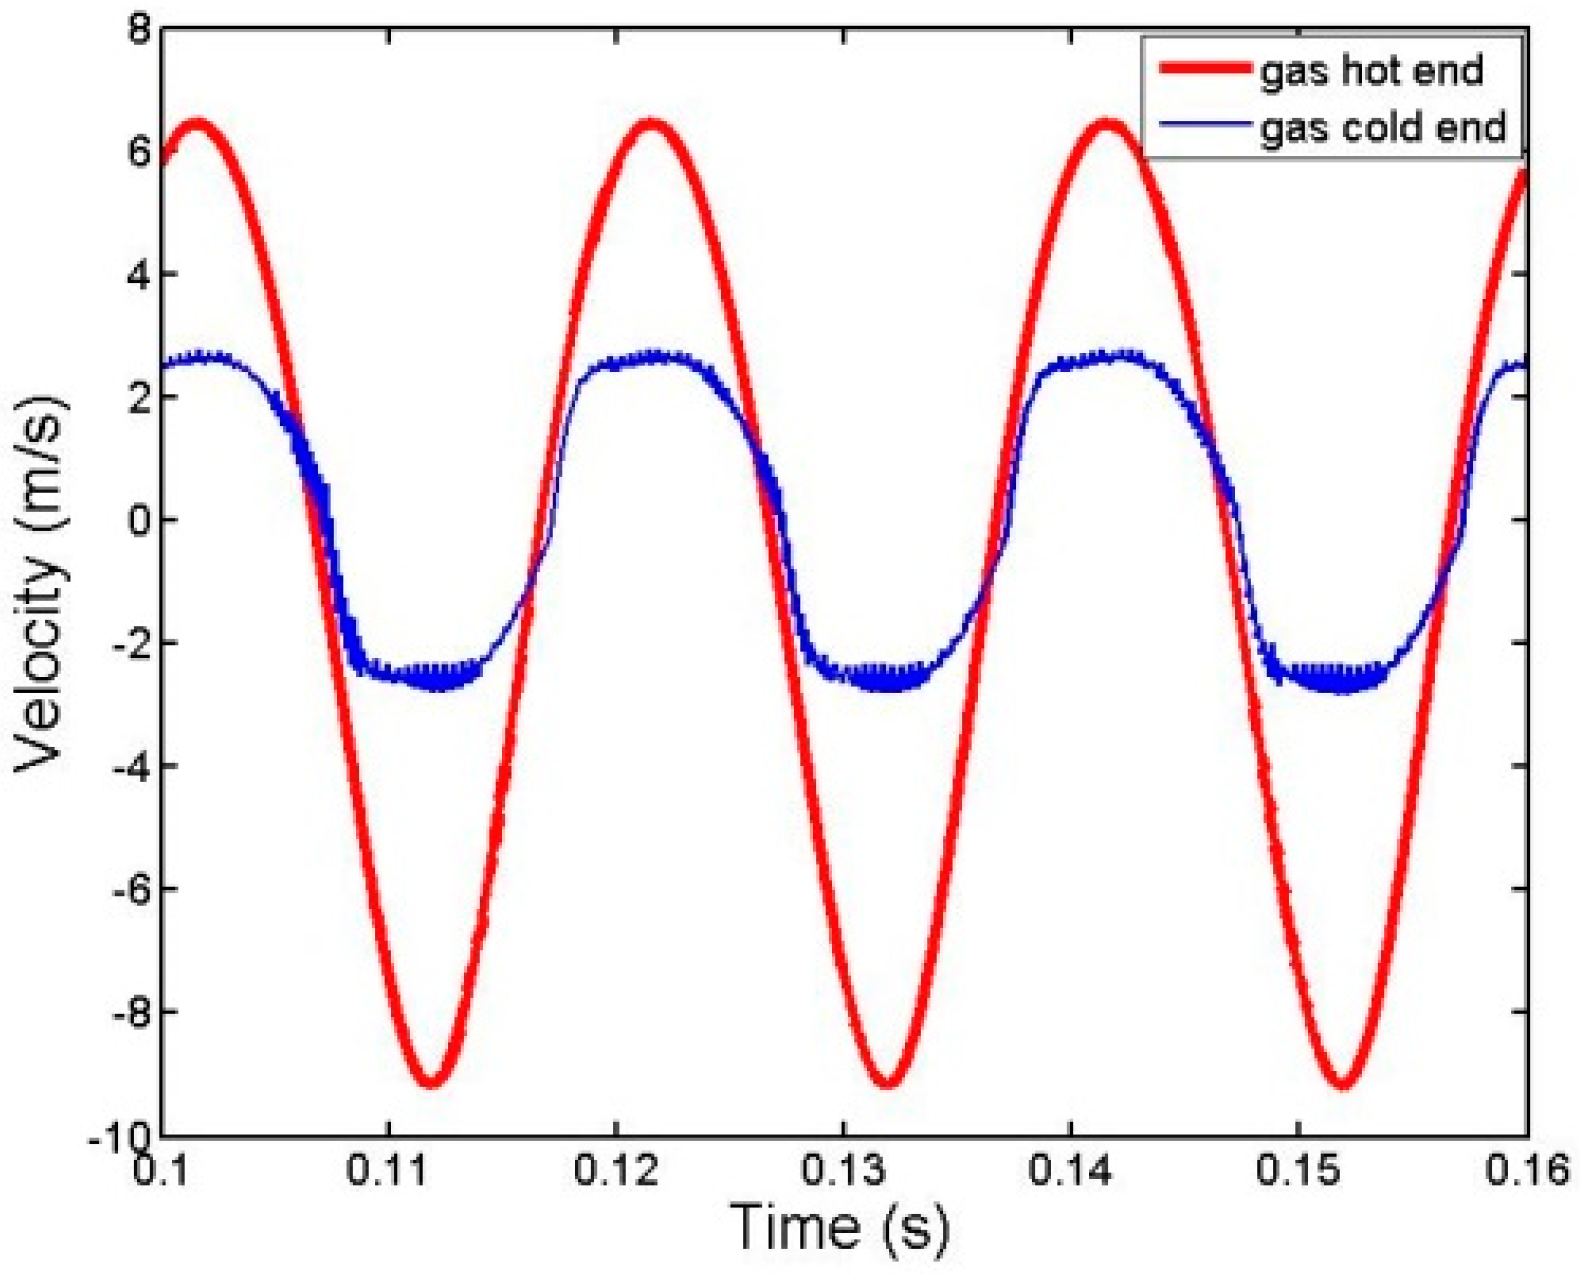
Figure 5.
Predictions of cold end velocity for different initial parcel sizes: (a) 1 mm; (b) 0.5 mm; (c) 0.333 mm. A cycle is divided into 200 time steps for all the simulations.
Figure 5.
Predictions of cold end velocity for different initial parcel sizes: (a) 1 mm; (b) 0.5 mm; (c) 0.333 mm. A cycle is divided into 200 time steps for all the simulations.
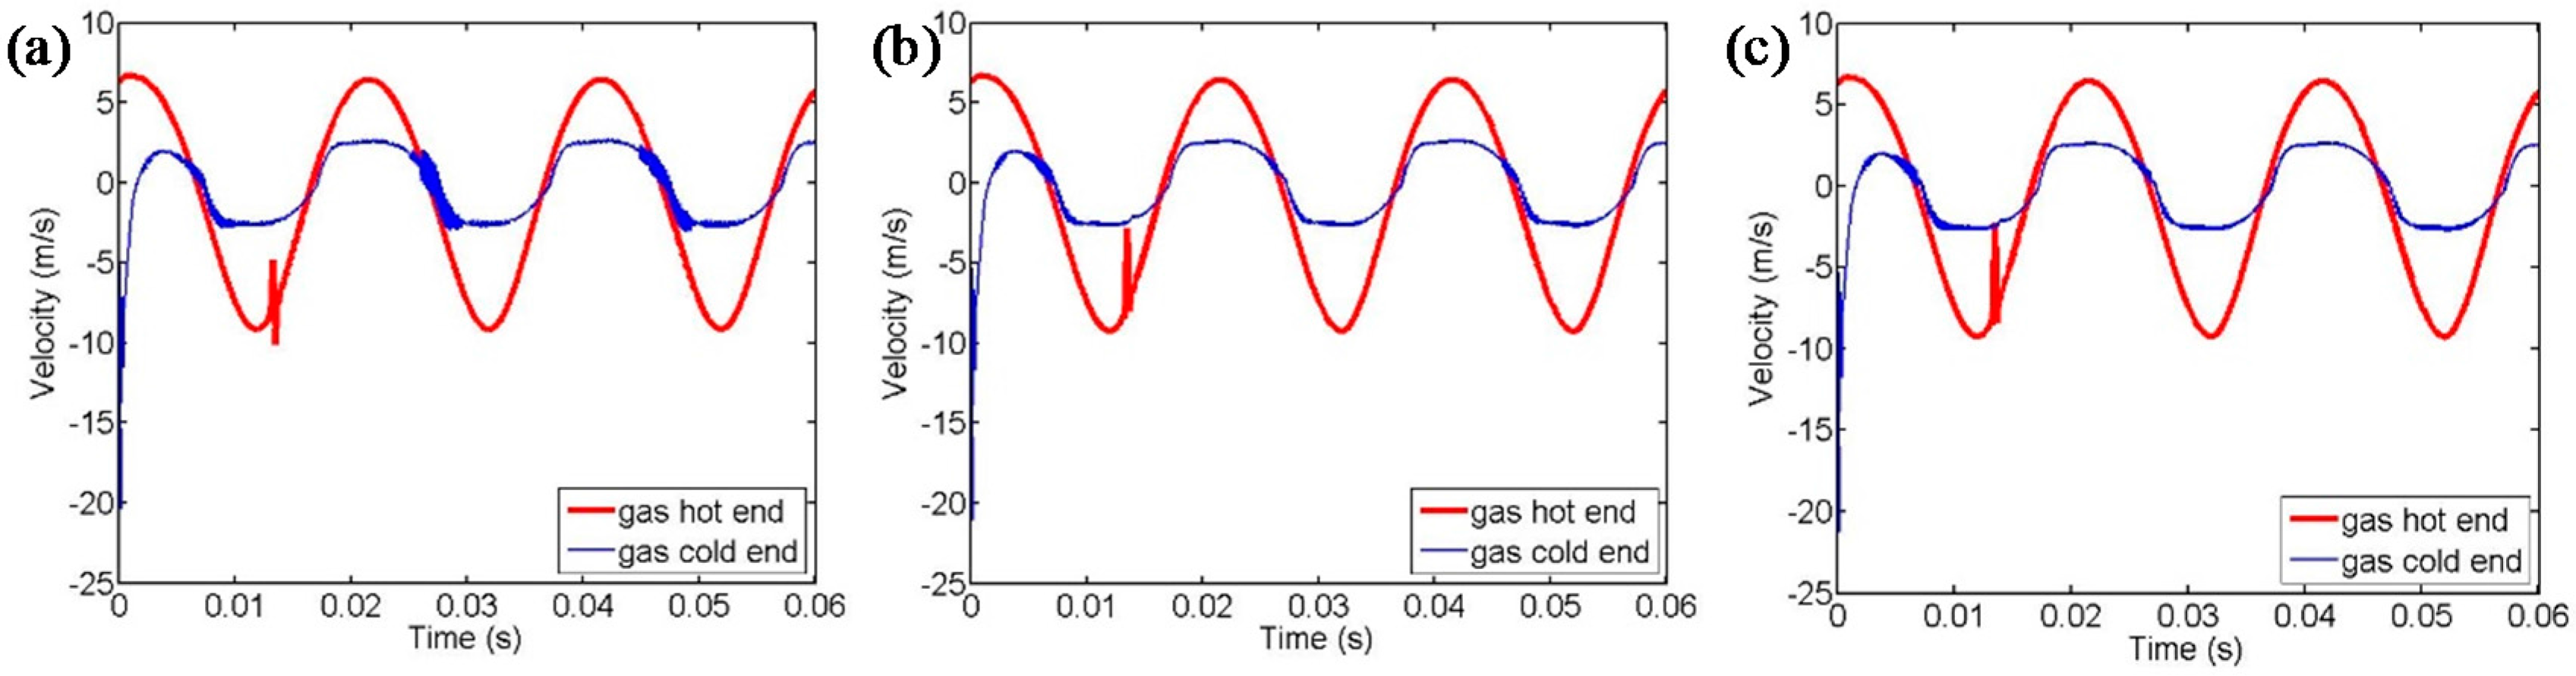
Figure 6.
Comparison of the predicted pressure variations with the experimental results [24] and the calculated results by Regen [25].
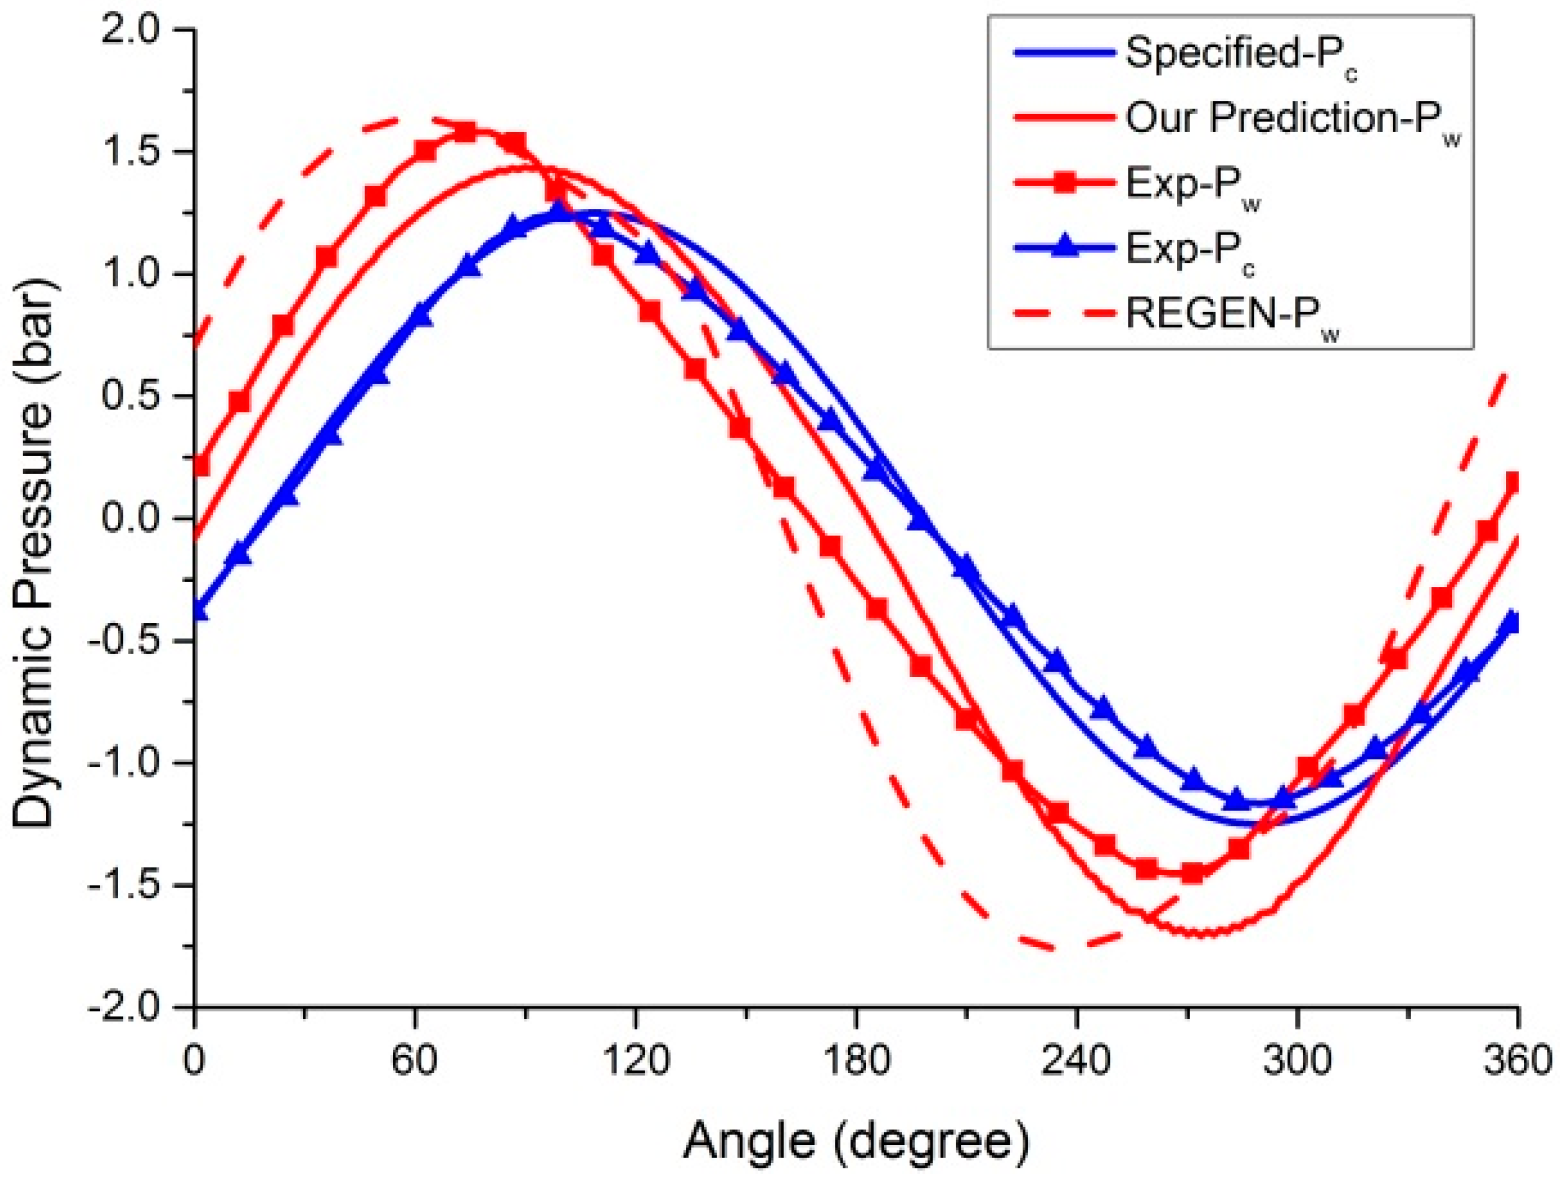
Figure 7.
The trajectories of selected gas parcels in the regenerator.

Figure 8.
Parameter variations of selected gas parcels as a function of position: (a) Temperature; (b) Pressure; (c) Density; (d) Velocity.
Figure 8.
Parameter variations of selected gas parcels as a function of position: (a) Temperature; (b) Pressure; (c) Density; (d) Velocity.
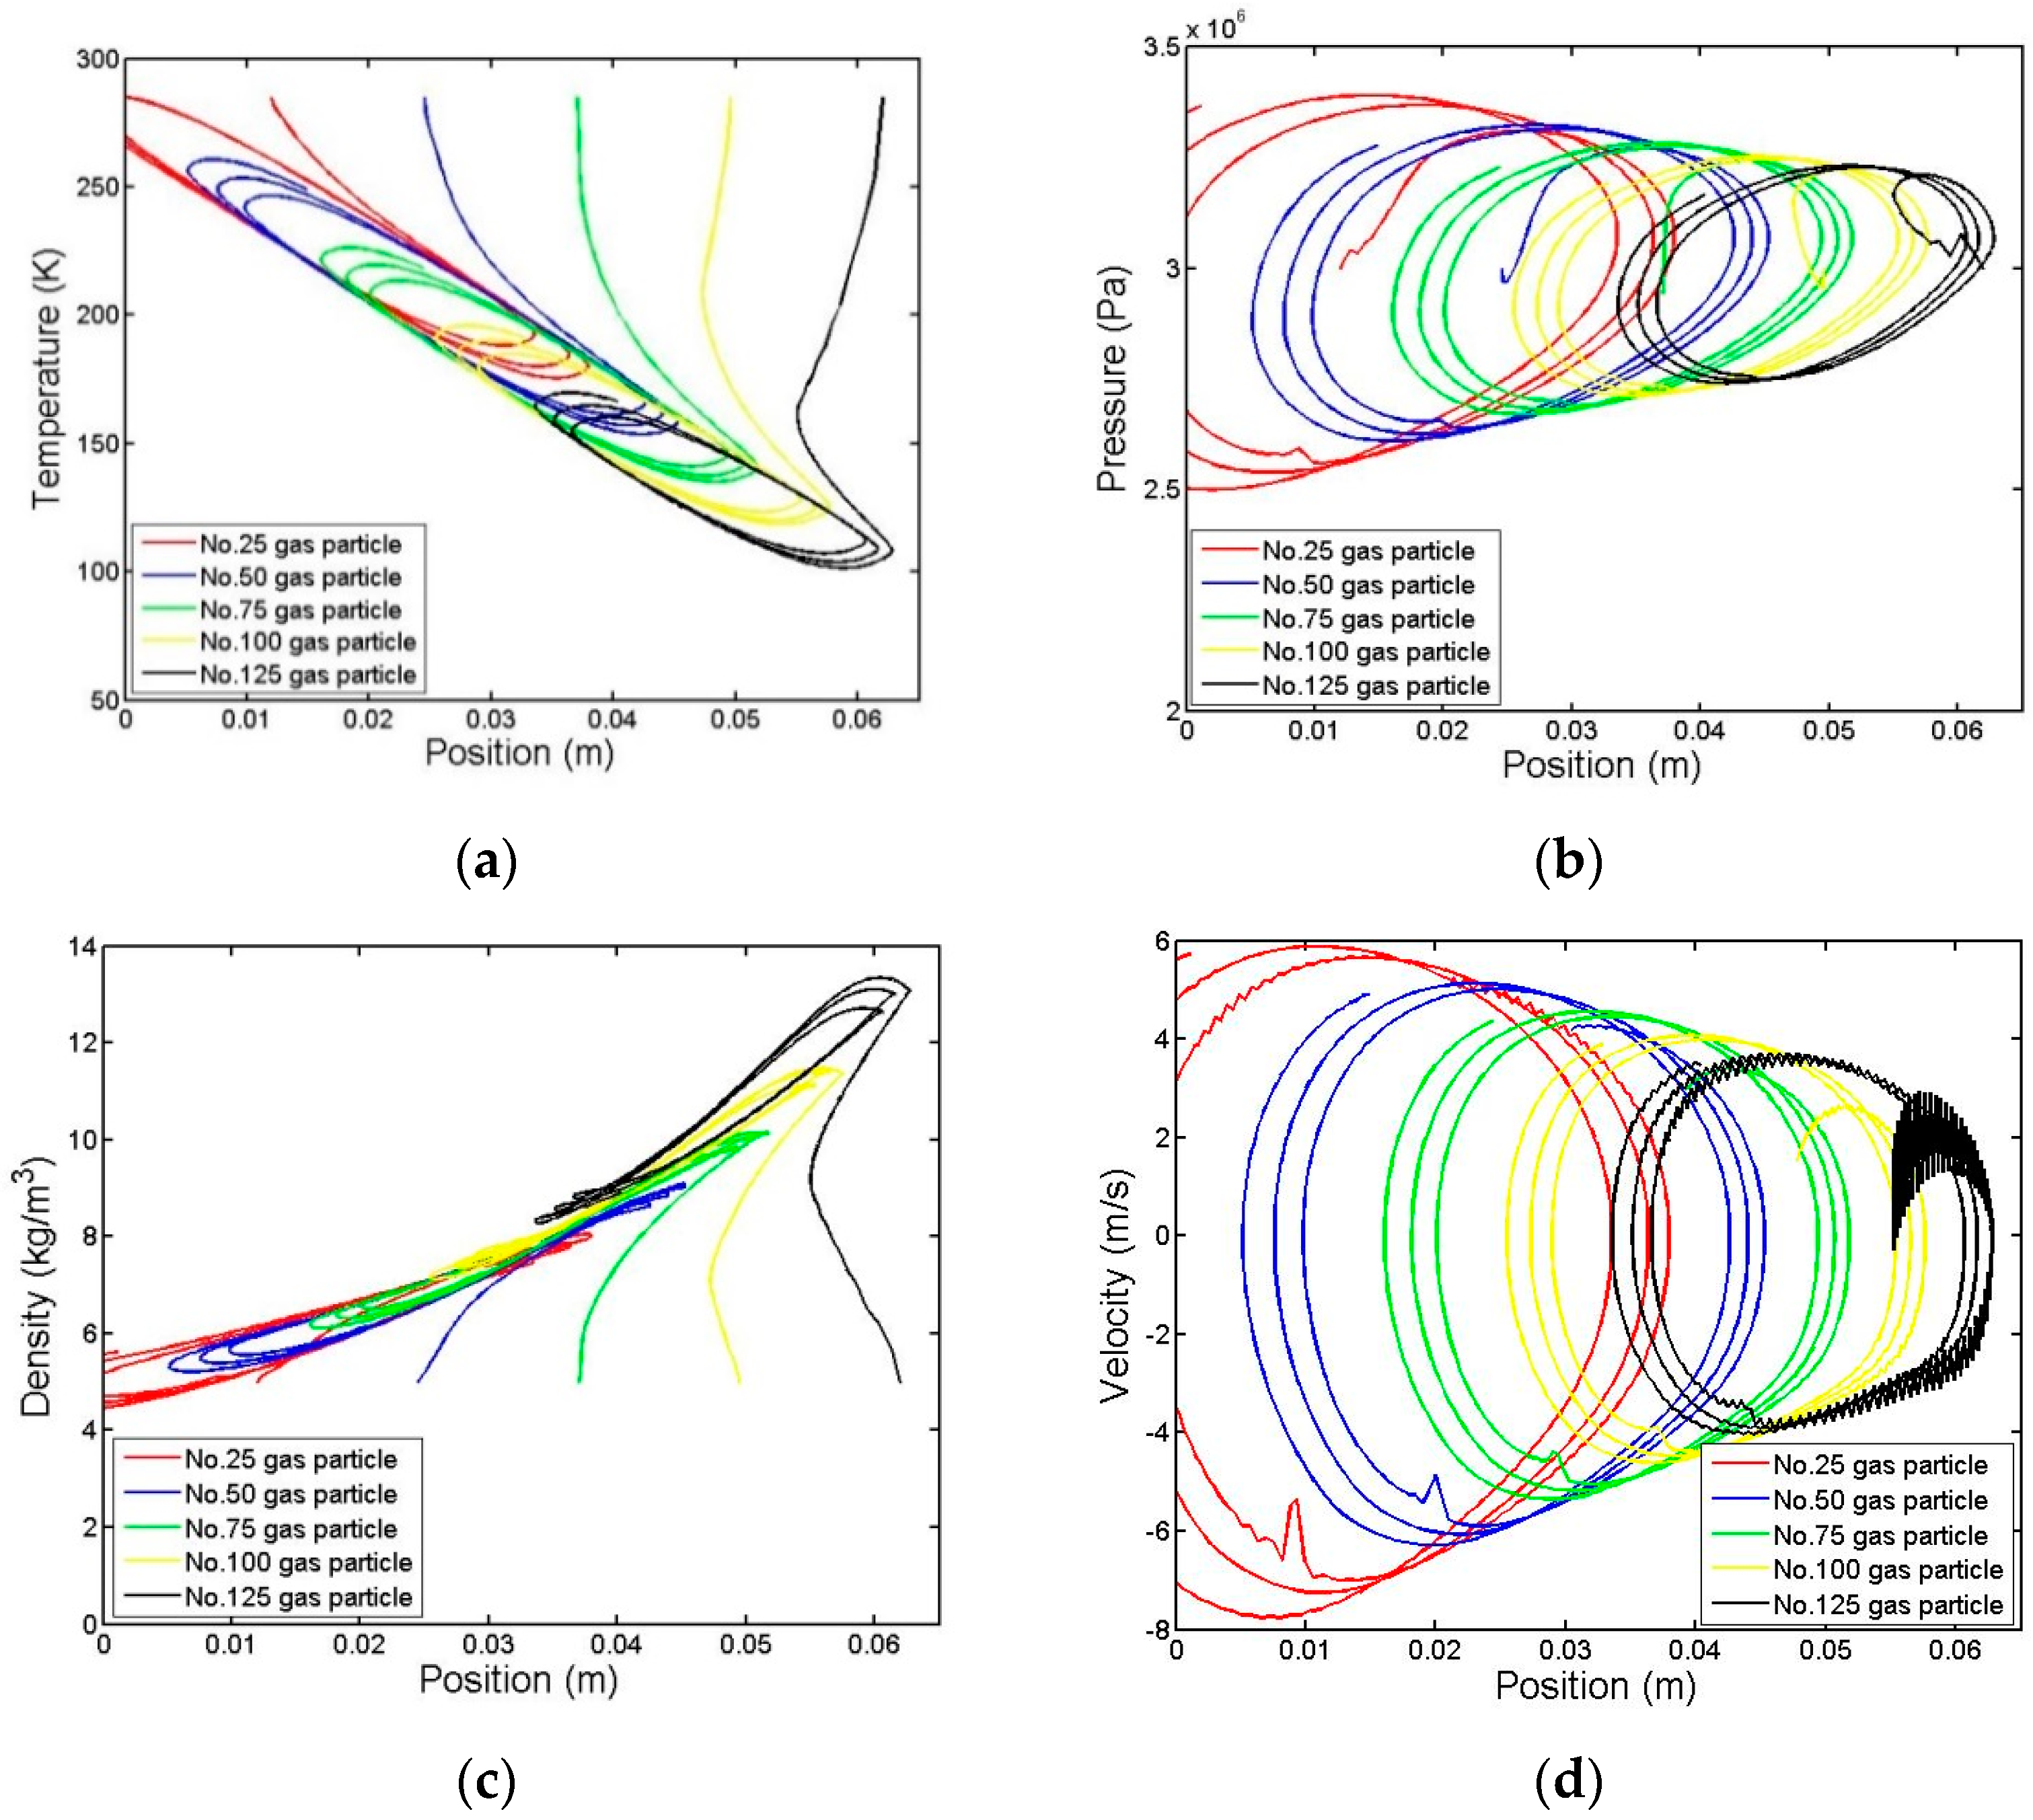
Figure 9.
Distribution of gas parameters in the regenerator: (a) Temperature; (b) Pressure; (c) Density; (d) Velocity.
Figure 9.
Distribution of gas parameters in the regenerator: (a) Temperature; (b) Pressure; (c) Density; (d) Velocity.
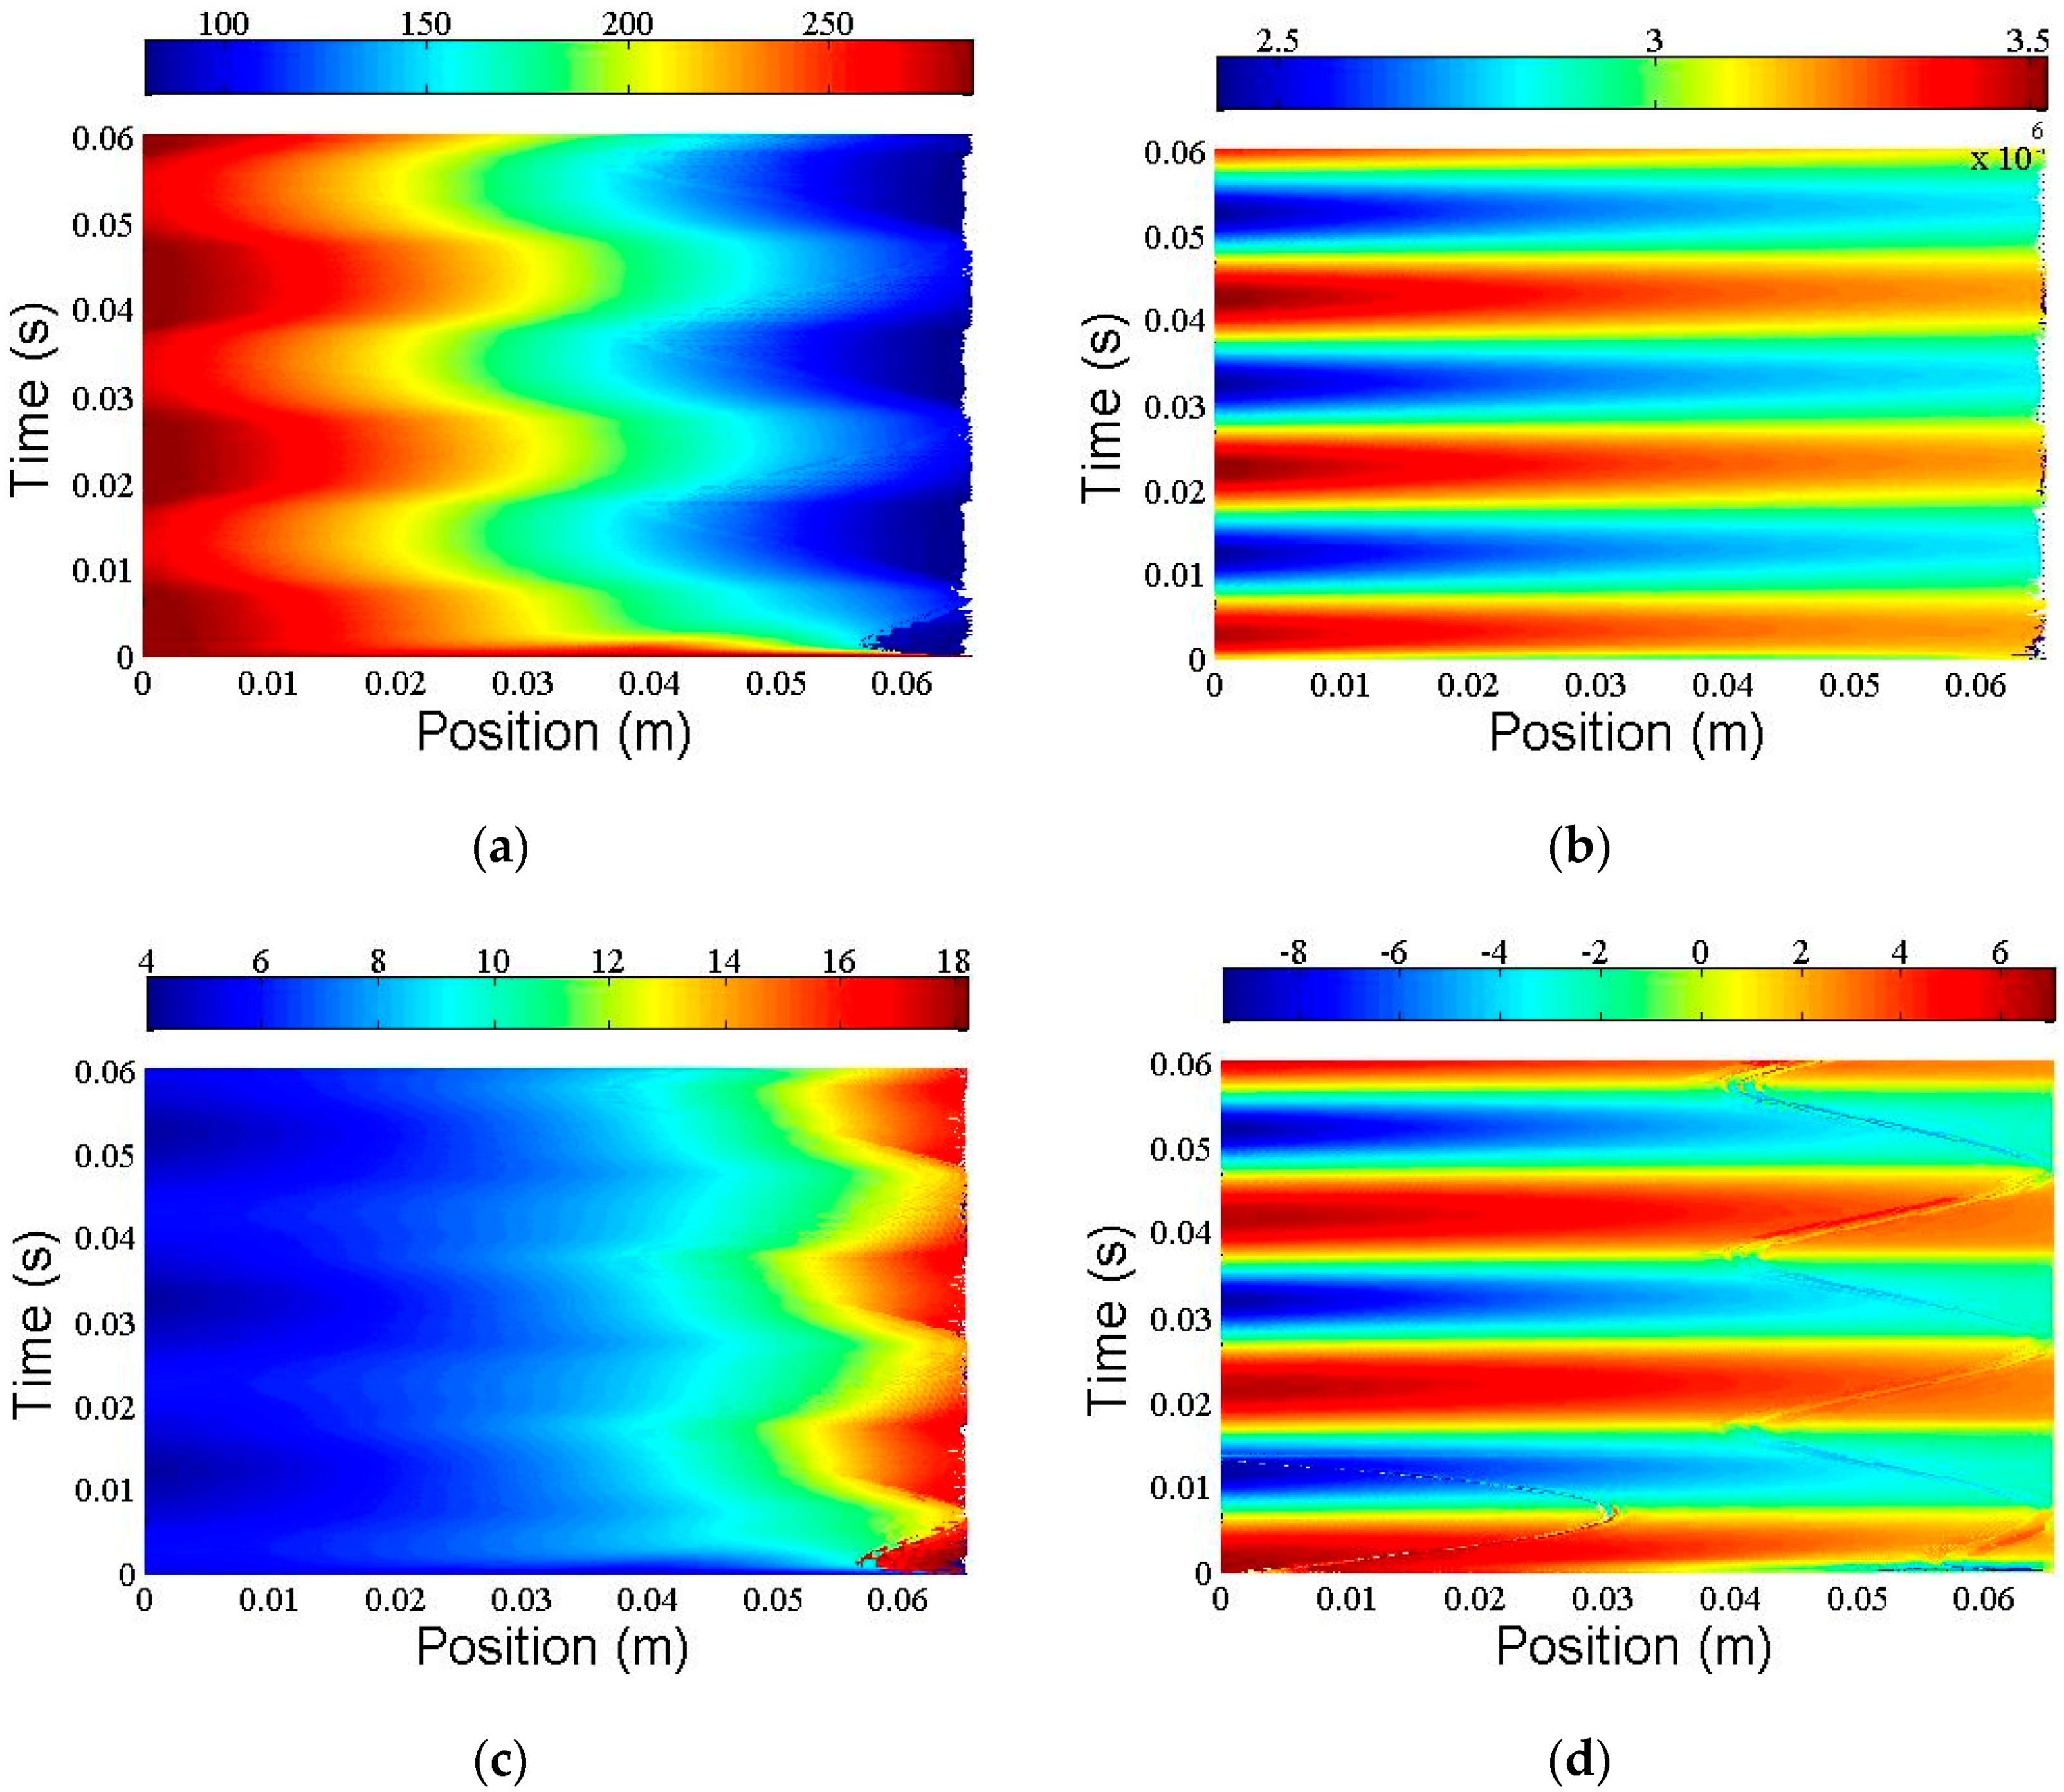
Figure 10.
Contribution to the system losses from real gas effect, regenerator ineffectiveness, conduction heat leak and irreversible expansion.
Figure 10.
Contribution to the system losses from real gas effect, regenerator ineffectiveness, conduction heat leak and irreversible expansion.

Figure 11.
Ineffectiveness variations as a function of regenerator diameter.
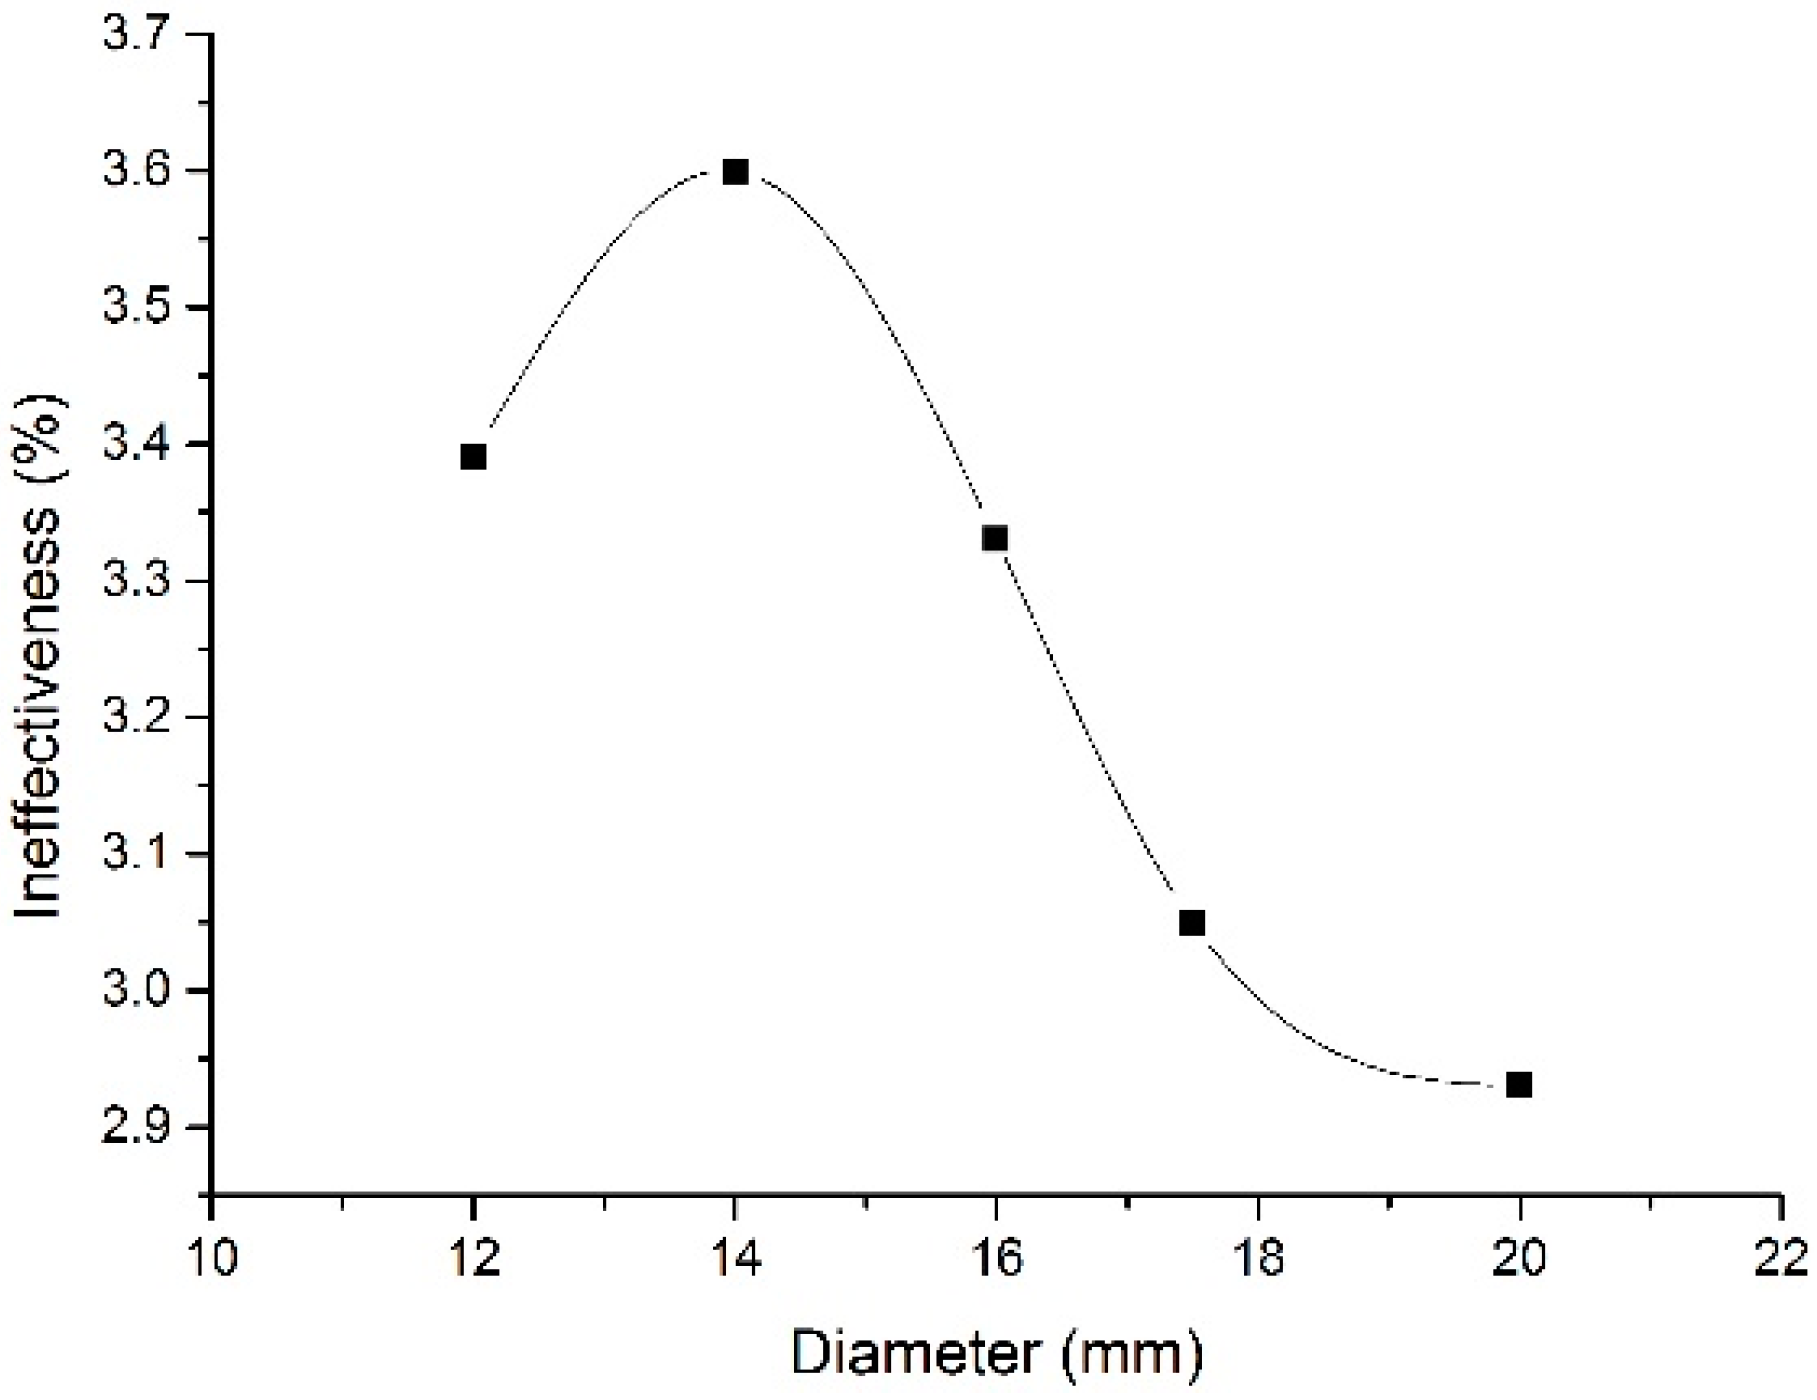
Figure 12.
Ineffectiveness variations as a function of regenerator length.


Table 1.
Typical geometry parameters of the regenerator in the mesh independent verification.
| Geometry | Parameters |
|---|---|
| length | 65 mm |
| inner diameter | 17.5 mm |
| porosity | 0.7 |
| mesh number | 400 |
| hydraulic diameter of mesh wire | 43 μm |
© 2017 by the authors. Licensee MDPI, Basel, Switzerland. This article is an open access article distributed under the terms and conditions of the Creative Commons Attribution (CC BY) license (http://creativecommons.org/licenses/by/4.0/).
Share and Cite
MDPI and ACS Style
Liu, X.; Chen, C.; Huang, Q.; Wang, S.; Hou, Y.; Chen, L. Modeling of Heat Transfer and Oscillating Flow in the Regenerator of a Pulse Tube Cryocooler Operating at 50 Hz. Appl. Sci. 2017, 7, 553. https://doi.org/10.3390/app7060553
AMA Style
Liu X, Chen C, Huang Q, Wang S, Hou Y, Chen L. Modeling of Heat Transfer and Oscillating Flow in the Regenerator of a Pulse Tube Cryocooler Operating at 50 Hz. Applied Sciences. 2017; 7(6):553. https://doi.org/10.3390/app7060553
Chicago/Turabian StyleLiu, Xiufang, Chen Chen, Qian Huang, Shubei Wang, Yu Hou, and Liang Chen. 2017. "Modeling of Heat Transfer and Oscillating Flow in the Regenerator of a Pulse Tube Cryocooler Operating at 50 Hz" Applied Sciences 7, no. 6: 553. https://doi.org/10.3390/app7060553
Note that from the first issue of 2016, this journal uses article numbers instead of page numbers. See further details here.