
Analyzing the Characteristics of Soil Moisture Using GLDAS Data: A Case Study in Eastern China

1
School of Marine Sciences, Nanjing University of Information Science and Technology, Nanjing 210044, China
2
Center for Housing Innovations, Chinese University of Hong Kong, Shatin, N. T., Hong Kong, China
3
Faculty of Information Science, Beijing University of Technology, Beijing 100124, China
4
Department of Surveying, Huaihai Institute of Technology, Lianyungang 222005, China
*
Authors to whom correspondence should be addressed.
Appl. Sci. 2017, 7(6), 566; https://doi.org/10.3390/app7060566
Submission received: 7 April 2017
/
Revised: 13 May 2017
/
Accepted: 25 May 2017
/
Published: 31 May 2017
Abstract
:In this paper, we use GLDAS (Global Land Data Assimilation System) to analyze the effects of air temperature and precipitation on the characteristics of soil moisture in the eastern region of China from 1961 to 2011. We find that the temperature and precipitation in different seasons have different degrees of influence on the characteristics of soil moisture in each layer. The results show that over the last 50 years, the soil moisture in eastern China has a tendency to dry out, especially between the late 1970s to the early 1980s. The change of soil moisture with the depth of soil layer has similar inter-annual and seasonal patterns. Soil moisture in different depths (0–200 cm) positively correlates with the air temperatures of spring, summer and autumn, but negatively correlates with the air temperature in winter at 0–10 cm, 40–100 cm and 100–200 cm. Similarly, soil moisture is positively related to the precipitation in spring, summer and autumn, and the opposite is true in winter. The results also show that precipitation has a significant effect on the shallow soil moisture (0–10 cm), while air temperature most affects the deep soil moisture (100–200 cm).
1. Introduction
Soil moisture plays a very key role in the process of climate evolution. It not only carries the responsibilities of energy and water exchange between land and atmosphere, it also takes part in the land–atmosphere interaction. As to be explained, soil moisture and climate changes are connected. Soil albedo, soil heat capacity, and the transfer of heat into the atmosphere are affected by changes in levels of soil moisture, which indirectly affects climate change. Climate change will also have an impact on the soil by altering its moisture content. For example, although the heat capacity of soil is small, surface albedo is large; yet the transfer of heat into the atmosphere is not obvious for small soil moisture. In different soil moisture areas, the form of interaction is not the same [1,2]. Because of deep soil’s vertical direction, precipitation’s effects on its soil moisture lags by about 1 to 2 months. Consequently, climate change is also influenced by future soil moisture [3]. Similarly, the evolution of soil moisture is mainly affected by the properties of soil, the strength of the light, the moisture of the air, and wind speed. The evolution of soil moisture is particularly affected by temperature and precipitation. As soil moisture plays a critical role in the evolution of climate, soil moisture is the first factor considered [4,5,6,7].
The research into the climate evolution of soil moisture is still limited by the varying length of observation data and influence of the area. Remote sensing [8,9] observes the large-scale coverage, but it is very dependent on the inversion algorithm and deep soil moisture cannot be inverted. The research into soil moisture using remote sensing observation is therefore limited. With the development of the numerical model [10], it became possible to analyze soil moisture evolution characteristics on a regional scale and an inter-annual scale. Yet the initial value set affects whether the final results are determined correctly. The emergence of a global land data assimilation system overcomes the remote sensing observation’s dependence on the inversion algorithm and numerical models for the accuracy of results. Comparing the land data assimilation system with other simulation models, the advantage of GLDAS’s data is that it is closer to the actual situation [11] and the results also more in line with the actual standard.
At present, although GLDAS outputs can be highly uncertain [12,13] and data validation with in situ observations is generally necessary, their unique characteristics also fit many different models [14,15,16]. Previous studies reported that the change of soil moisture in eastern China is active [17], while the mutual influence of each circle in eastern Asia is very positive. The weather evolution, especially the generation and evolution process of a monsoon, is greatly affected by soil moisture. An analysis of the strong coupling areas of soil moisture and precipitation [17] through the global land–atmosphere coupling experiments established that soil moisture is very sensitive to precipitation. By adding the soil moisture assimilation data to the simulation values of temperature and precipitation in eastern China [18], temperature and precipitation simulation values become closer to observed values, which means that soil moisture has a certain impact on temperature and precipitation. The soil moisture data from regions within China can be used to analyze the radial evolution characteristics of soil moisture [19], revealing the inter-annual variability of soil moisture vertical distribution regularity and its relationship with precipitation. Furthermore, when combined with the observed data on soil moisture in eastern China [20], the evolution law of soil moisture and the relationship between soil moisture and climate change rates clearly show a positive correlation between precipitation and soil moisture, whereas the correlation between temperature and soil moisture is negative.
In this paper, we analyzed the characteristics of soil moisture using GLDAS data, focusing on the effects and differences between temperature and precipitation in different seasons from 1961 to 2011 in eastern China. As soil moisture is an important reference for climate change, the evaluation of dry and wet climate conditions is not only significant with regard to meteorology, but also to natural environment and farming cultivation.
2. Materials and Methods
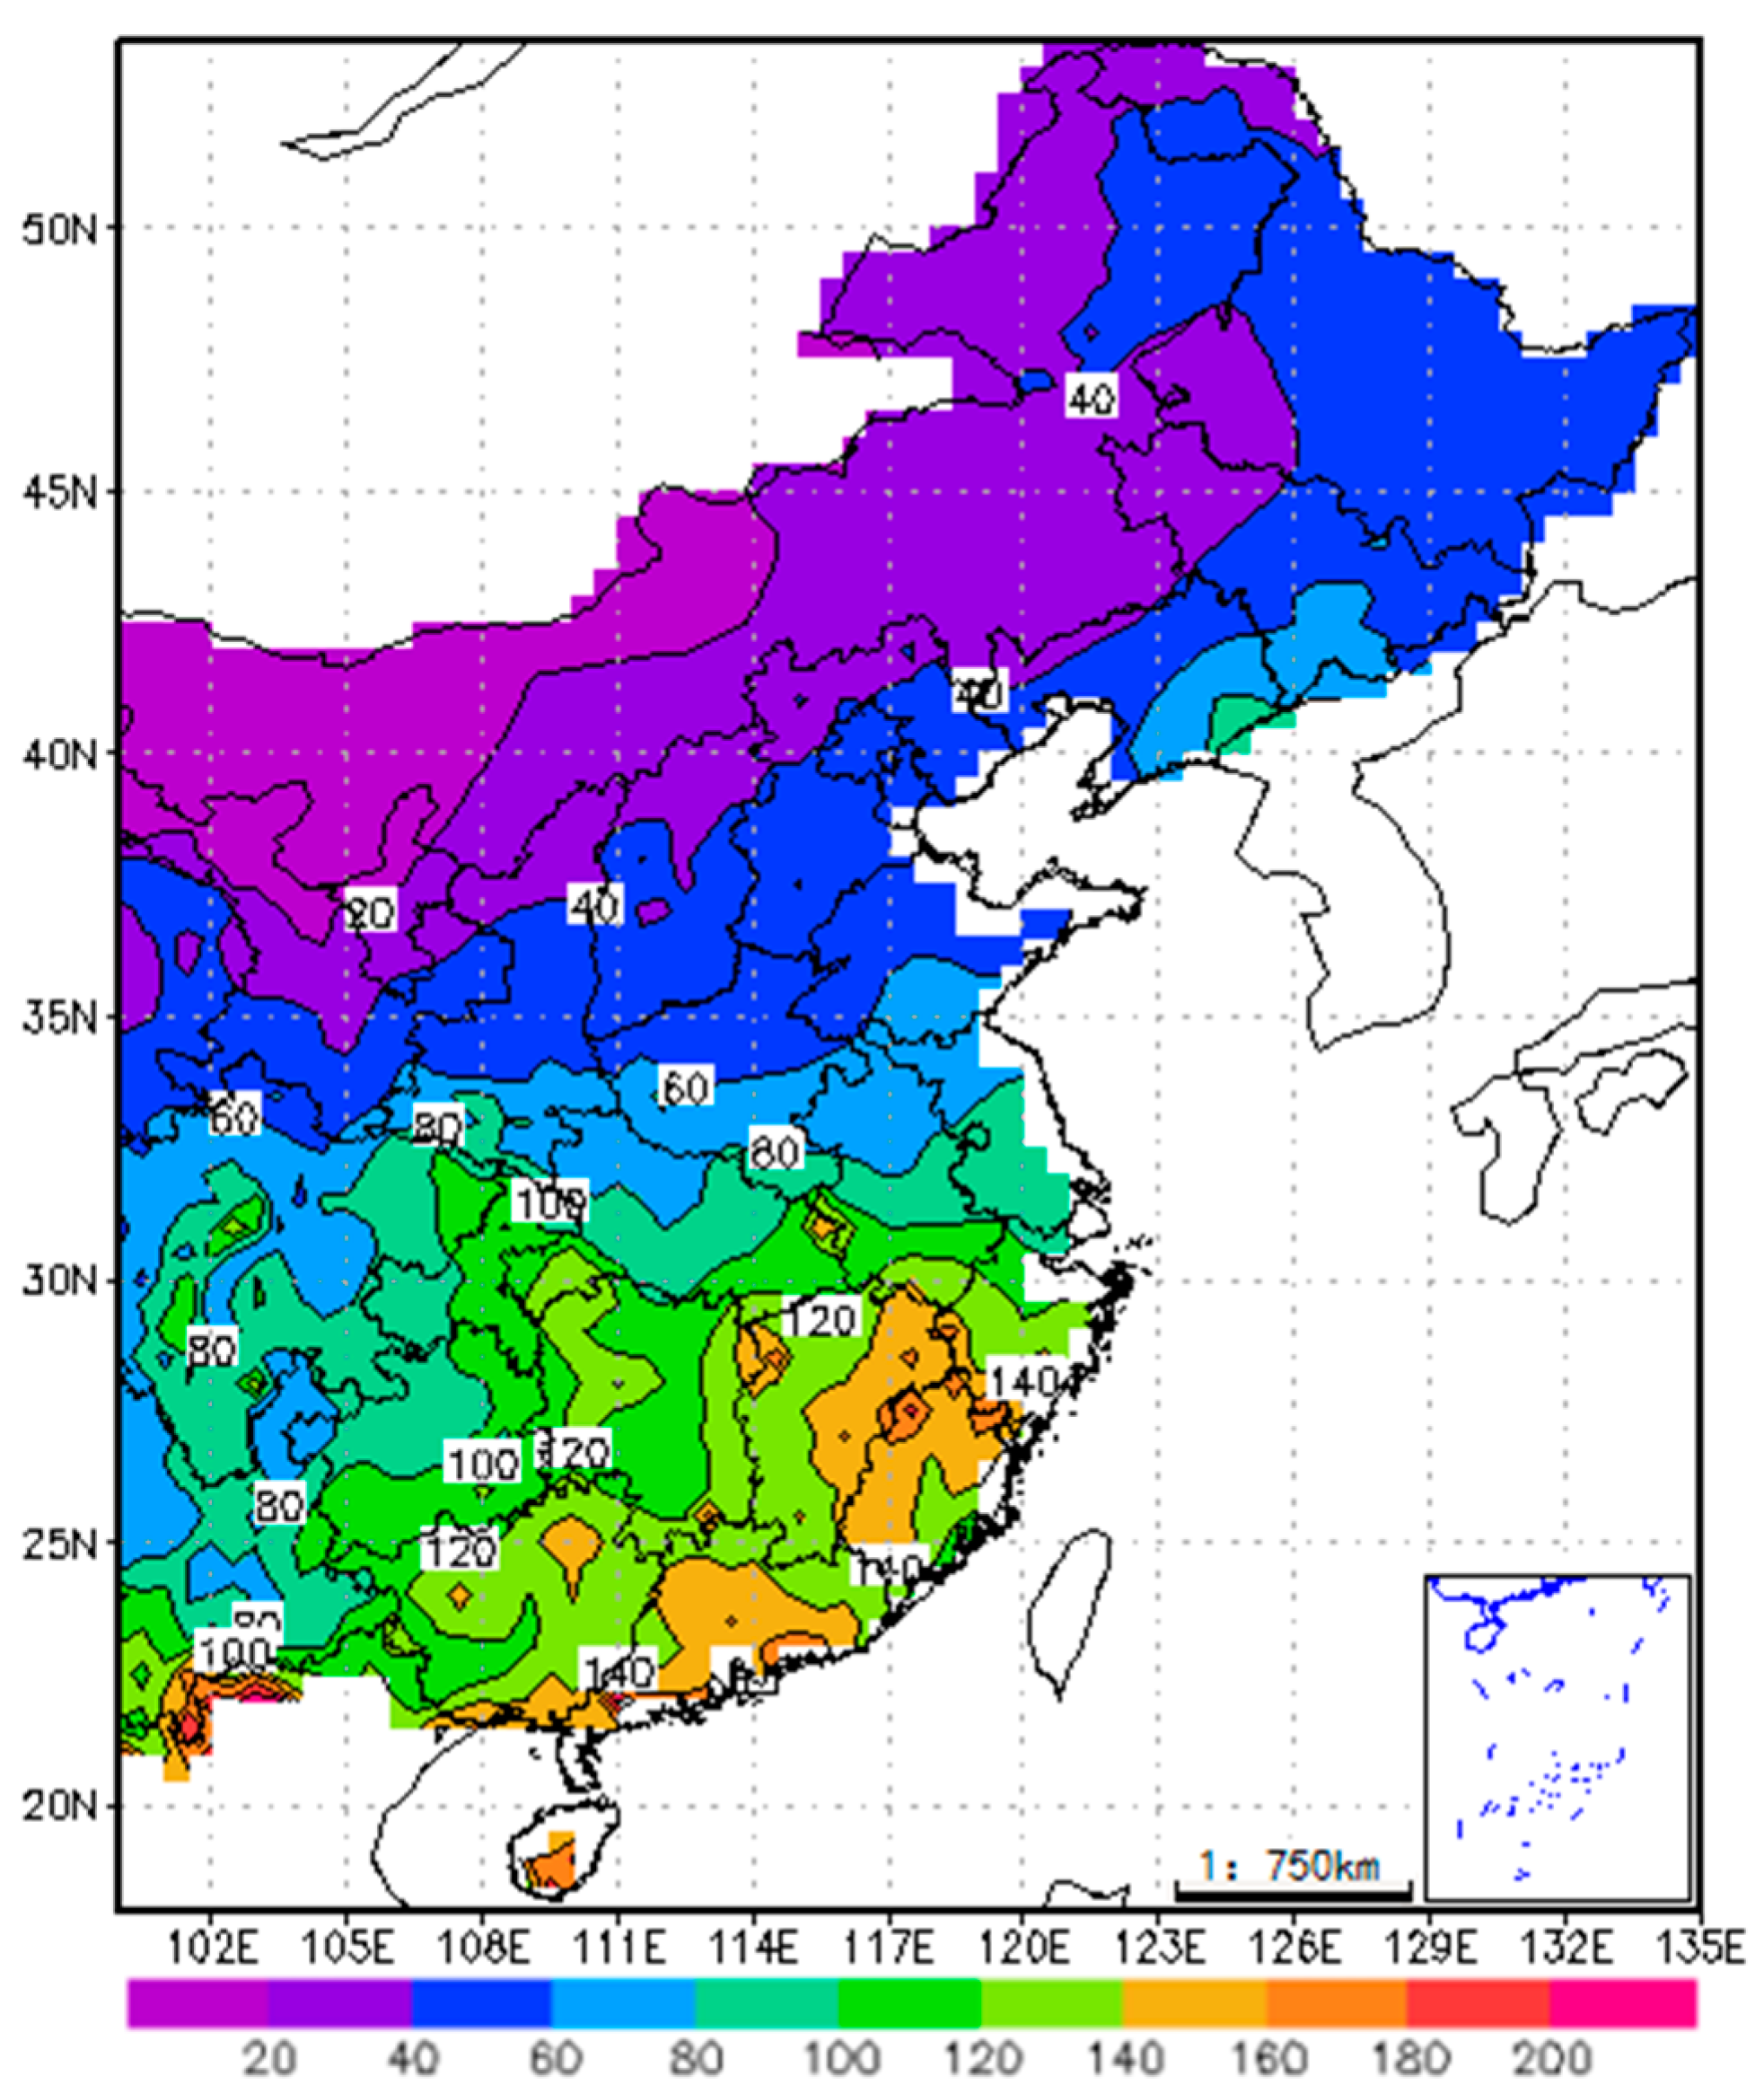
The study area is located in eastern China (4°~53° N and 100°~135° E). It is close to the Pacific Ocean, while the mainland area covers northeast China, east China, and southeast China. Most of these areas are in the eastern monsoon region of China. The average annual rainfall is from 20 mm to 140 m in the east China, while precipitation gradually reduces from southeast to northwest, as shown in Figure 1. The average temperature was between 5 and 20 °C in east China, decreasing from the south to the north along with the increase of latitude, as indicated in Figure 2. The monsoon climate in east China is significant; it is characterized by hot rain, year-round high-temperatures, and obvious precipitation changes in the rainy and dry seasons, which are advantageous to the tropical economic crops. The region to the south of the Huaihe River and Qinling has a subtropical monsoon climate, with the average temperature over 0 °C in January. The ample annual precipitation means that crops can be harvested two or three times per year—the paddy plays an essential role in agriculture. To the north of the Huaihe River and Qinling there is a temperate monsoon climate, and the average temperature falls below 0 °C in January. As annual precipitation is lower than the south of Huaihe River and Qinling, crops can be harvested only once a year, or three times every two years.
With the development of national advanced satellites, satellite data provide more valuable information to constrain the land surface state initialization of climate forecasting. At present, there are two ways to constrain the land surface state initialization: Firstly, the observed data (such as precipitation and radiation data) are used to prevent a land surface model from making serious errors related to the land surface driving data of atmospheric numerical prediction. Secondly, the land surface state observation variables, supported by land surface data assimilation techniques, are used to constrain inaccurate simulated state variables [21]. The Global Land Data Assimilation System was invented by the National Oceanic and Atmospheric Administration (NOAA), the National Center for Environmental Prediction (NCEP), the Goddard Space Flight Center (GSFC) and the National Aeronautics and Space Administration (NASA). It was built based on the aforementioned two criteria. It is an offline global high-resolution land surface simulation system, which combines the ground observation data and satellite observation data to produce better surface state variables [22]. The mode of the version 2.0 GLDAS used in this study is NOAH, the resolution of data is 1° × 1°, and the time series of monthly data from 1961 to 2011 is longer than for other modes. The data set includes 28 variables such as temperature, precipitation, and soil moisture. Among them, precipitation is calculated by the rate of snow and rainfall. Soil moisture is divided into four levels—0–10 cm, 10–40 cm, 40–100 cm, 100–200 cm—in a unit area of soil water content (kg/m2).
In the study, the main method includes anomaly analysis and correlation calculation. The correlation coefficient formula is expressed as [23]:
where n is the data number, are arithmetic average, σx σy are the standard deviation, and is covariance.
The Mann–Kendall test is a statistical test widely used for the analysis of trends in climatologic and hydrologic time series [24,25]. According to this test, the null hypothesis H0 assumes that there is no trend (the data is independent and randomly ordered) and this is tested against the alternative hypothesis H1, which assumes that there is a trend.
The formula is expressed as:
The test statistic Zc is used as a measure of the significance of a trend.
where, Xk and Xi are the annual values in years k and i, and k > i, respectively.
In which ti denotes the number of ties to extent i. The summation term in the numerator is used only if the data series contains tied values.
1 <j < i < n, beta is represented by the slope; the positive value rises and negative value declines, thereby the value represents whether the trend is obvious.
3. Results and Discussion
3.1. Characteristics of Climate Change in East China
3.1.1. The Changes of Temperature and Precipitation
The eastern China area roughly tends to grow hotter between 1961 and 2011, as Table 1 and Figure 3 display.
The Mann–Kendall test results show the average temperatures rise (slope 0.0267) in 51 years, and Zc value passes the test of significance of 99%, which means the increasing trend is obvious. The average annual climate tendency rate in eastern China is 0.266 °C/10a, which is higher than centurial average global climate tendency rate (0.104 °C/10a) [26]. The 50-year temperature data can be divided into two characteristic phases: from 1961 to 1986, when the temperature in eastern China was colder than normal (negative temperature departure) and the climate tendency rate was −0.0283 °C/10a; and from 1987 to 2011, when the temperature increased (positive temperature departure). The temperature shows a rising trend, with a climate trend rate of 0.268 °C/10a. In particular, the average temperature rose to hit 9.91 °C in 1998, later reaching 9.94 °C in 2007, which is a high point over the previous 50 years, as shown in Figure 4.
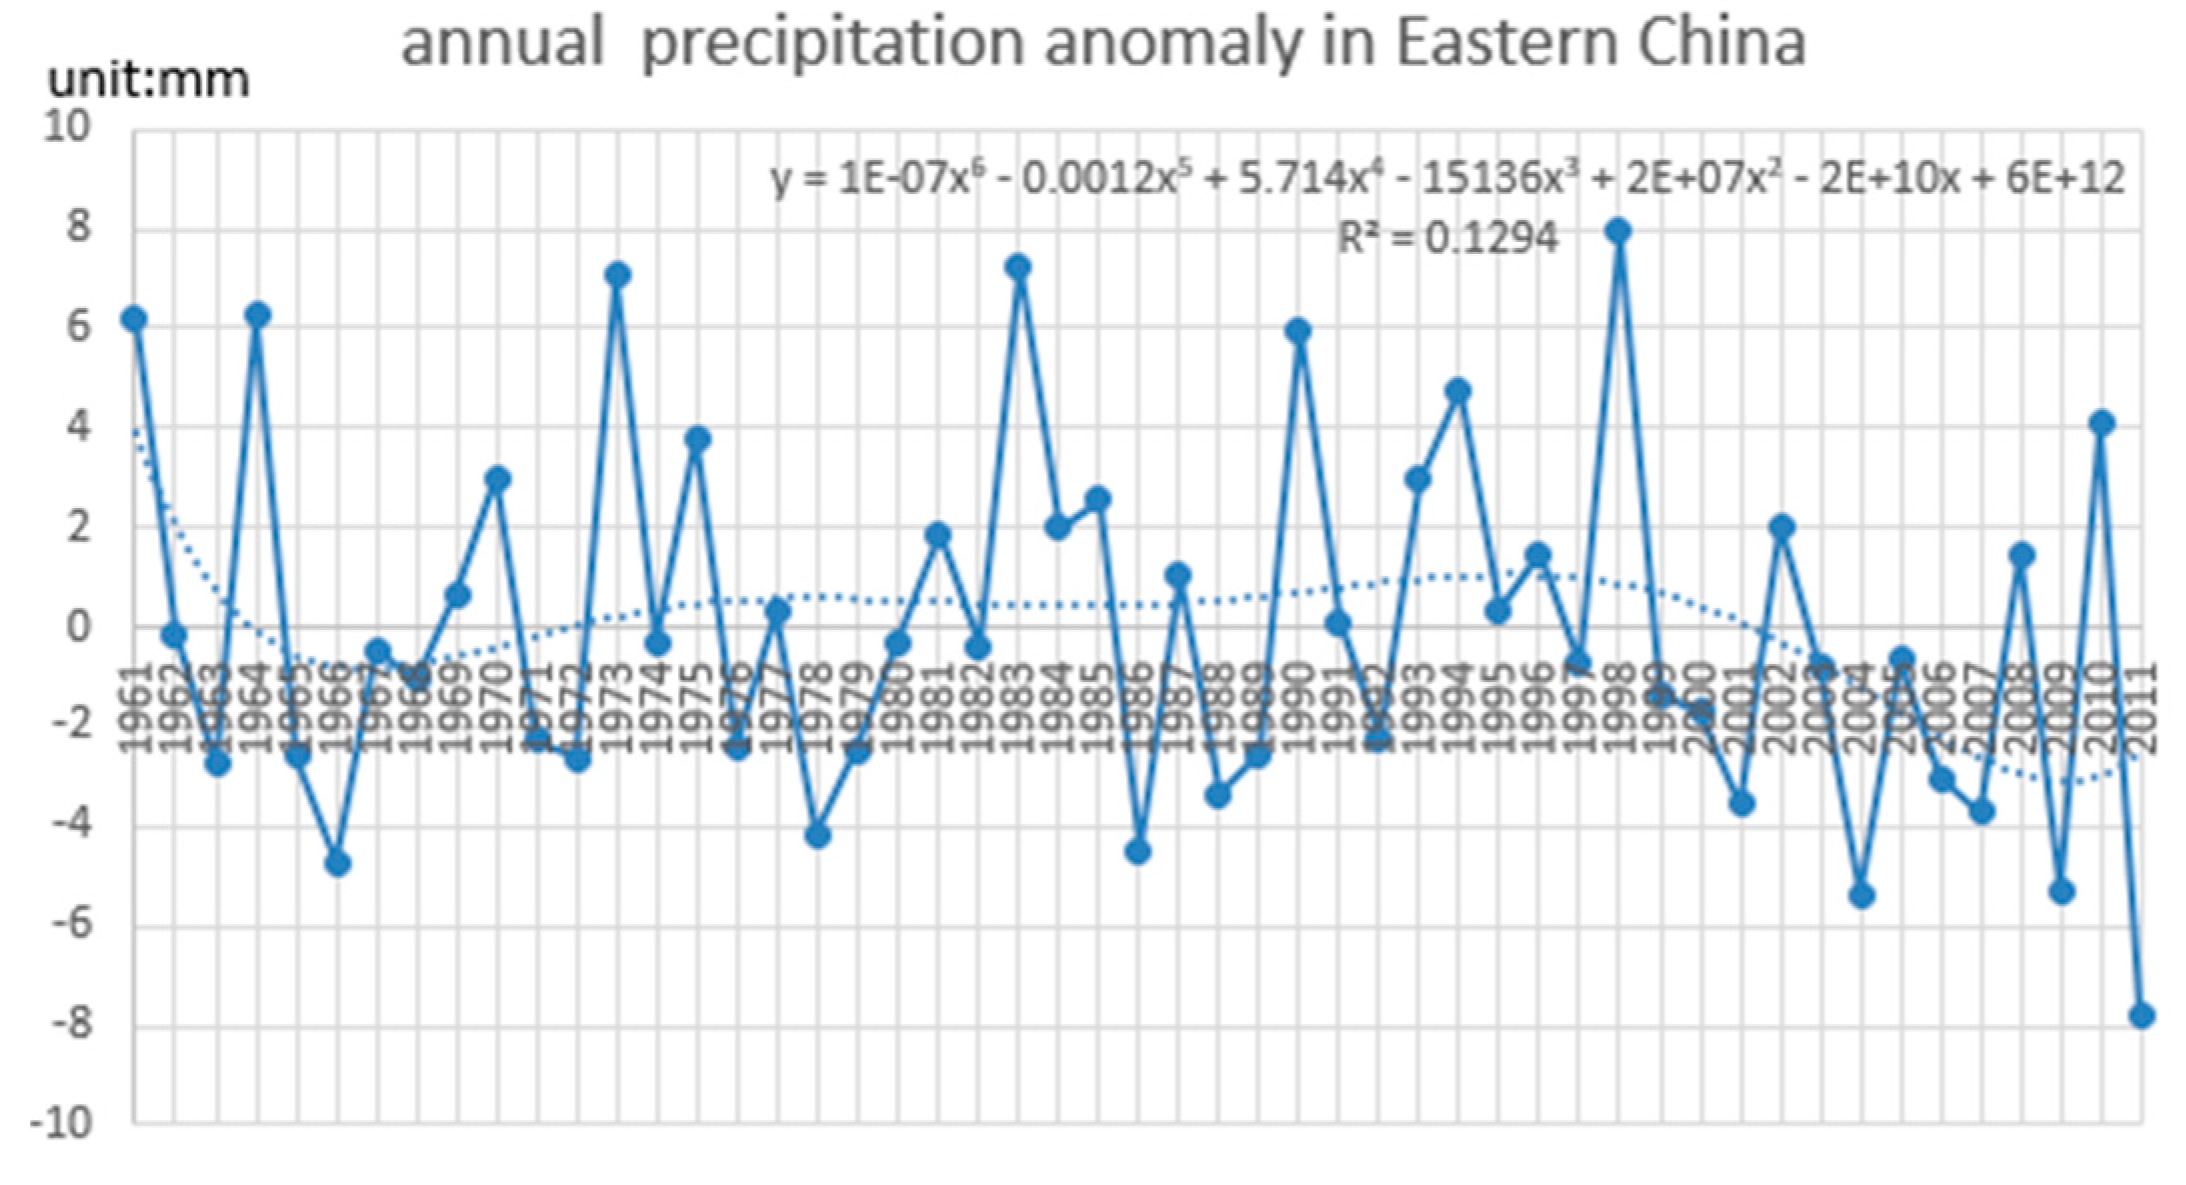
Compared with temperature, precipitation in eastern China shows different trends. From Mann–Kendall test precipitation results we know that in the last 50 years, precipitation in eastern China declined overall (i.e., here slope is −0.03), but is not in an obvious manner because the Zc value doesn’t pass the significance test. Inter-annual change is also very different. The largest annual average precipitation value reached 73.8 mm in 1998. This large precipitation corresponds to the heavy flood in 1998 which caused many rivers’ water levels to rise sharply in the middle and low reaches of the Yangtze River, and seriously exceeded the safety level. The smallest average annual precipitation value appeared in 2011 at only 58.03 mm. Average annual precipitation of course varied in different years, as Figure 5 and Figure 6 show.
From the comparison of temperature and precipitation, the temperature in eastern China has evidently increased, while precipitation has slightly declined. In order to further analyze the climate change in eastern China, it is necessary to consider the characteristics of soil moisture in this region. Although there are many factors that influence changes in soil moisture, its characteristics are complicated due to the effect of non-unitary. Temperature, evaporation, light intensity, precipitation and other climate factors can lead to some changes in soil moisture. Long-term climate evolution can also cause changes in soil moisture at different times.
3.1.2. The Seasonal Changes of Soil Moisture
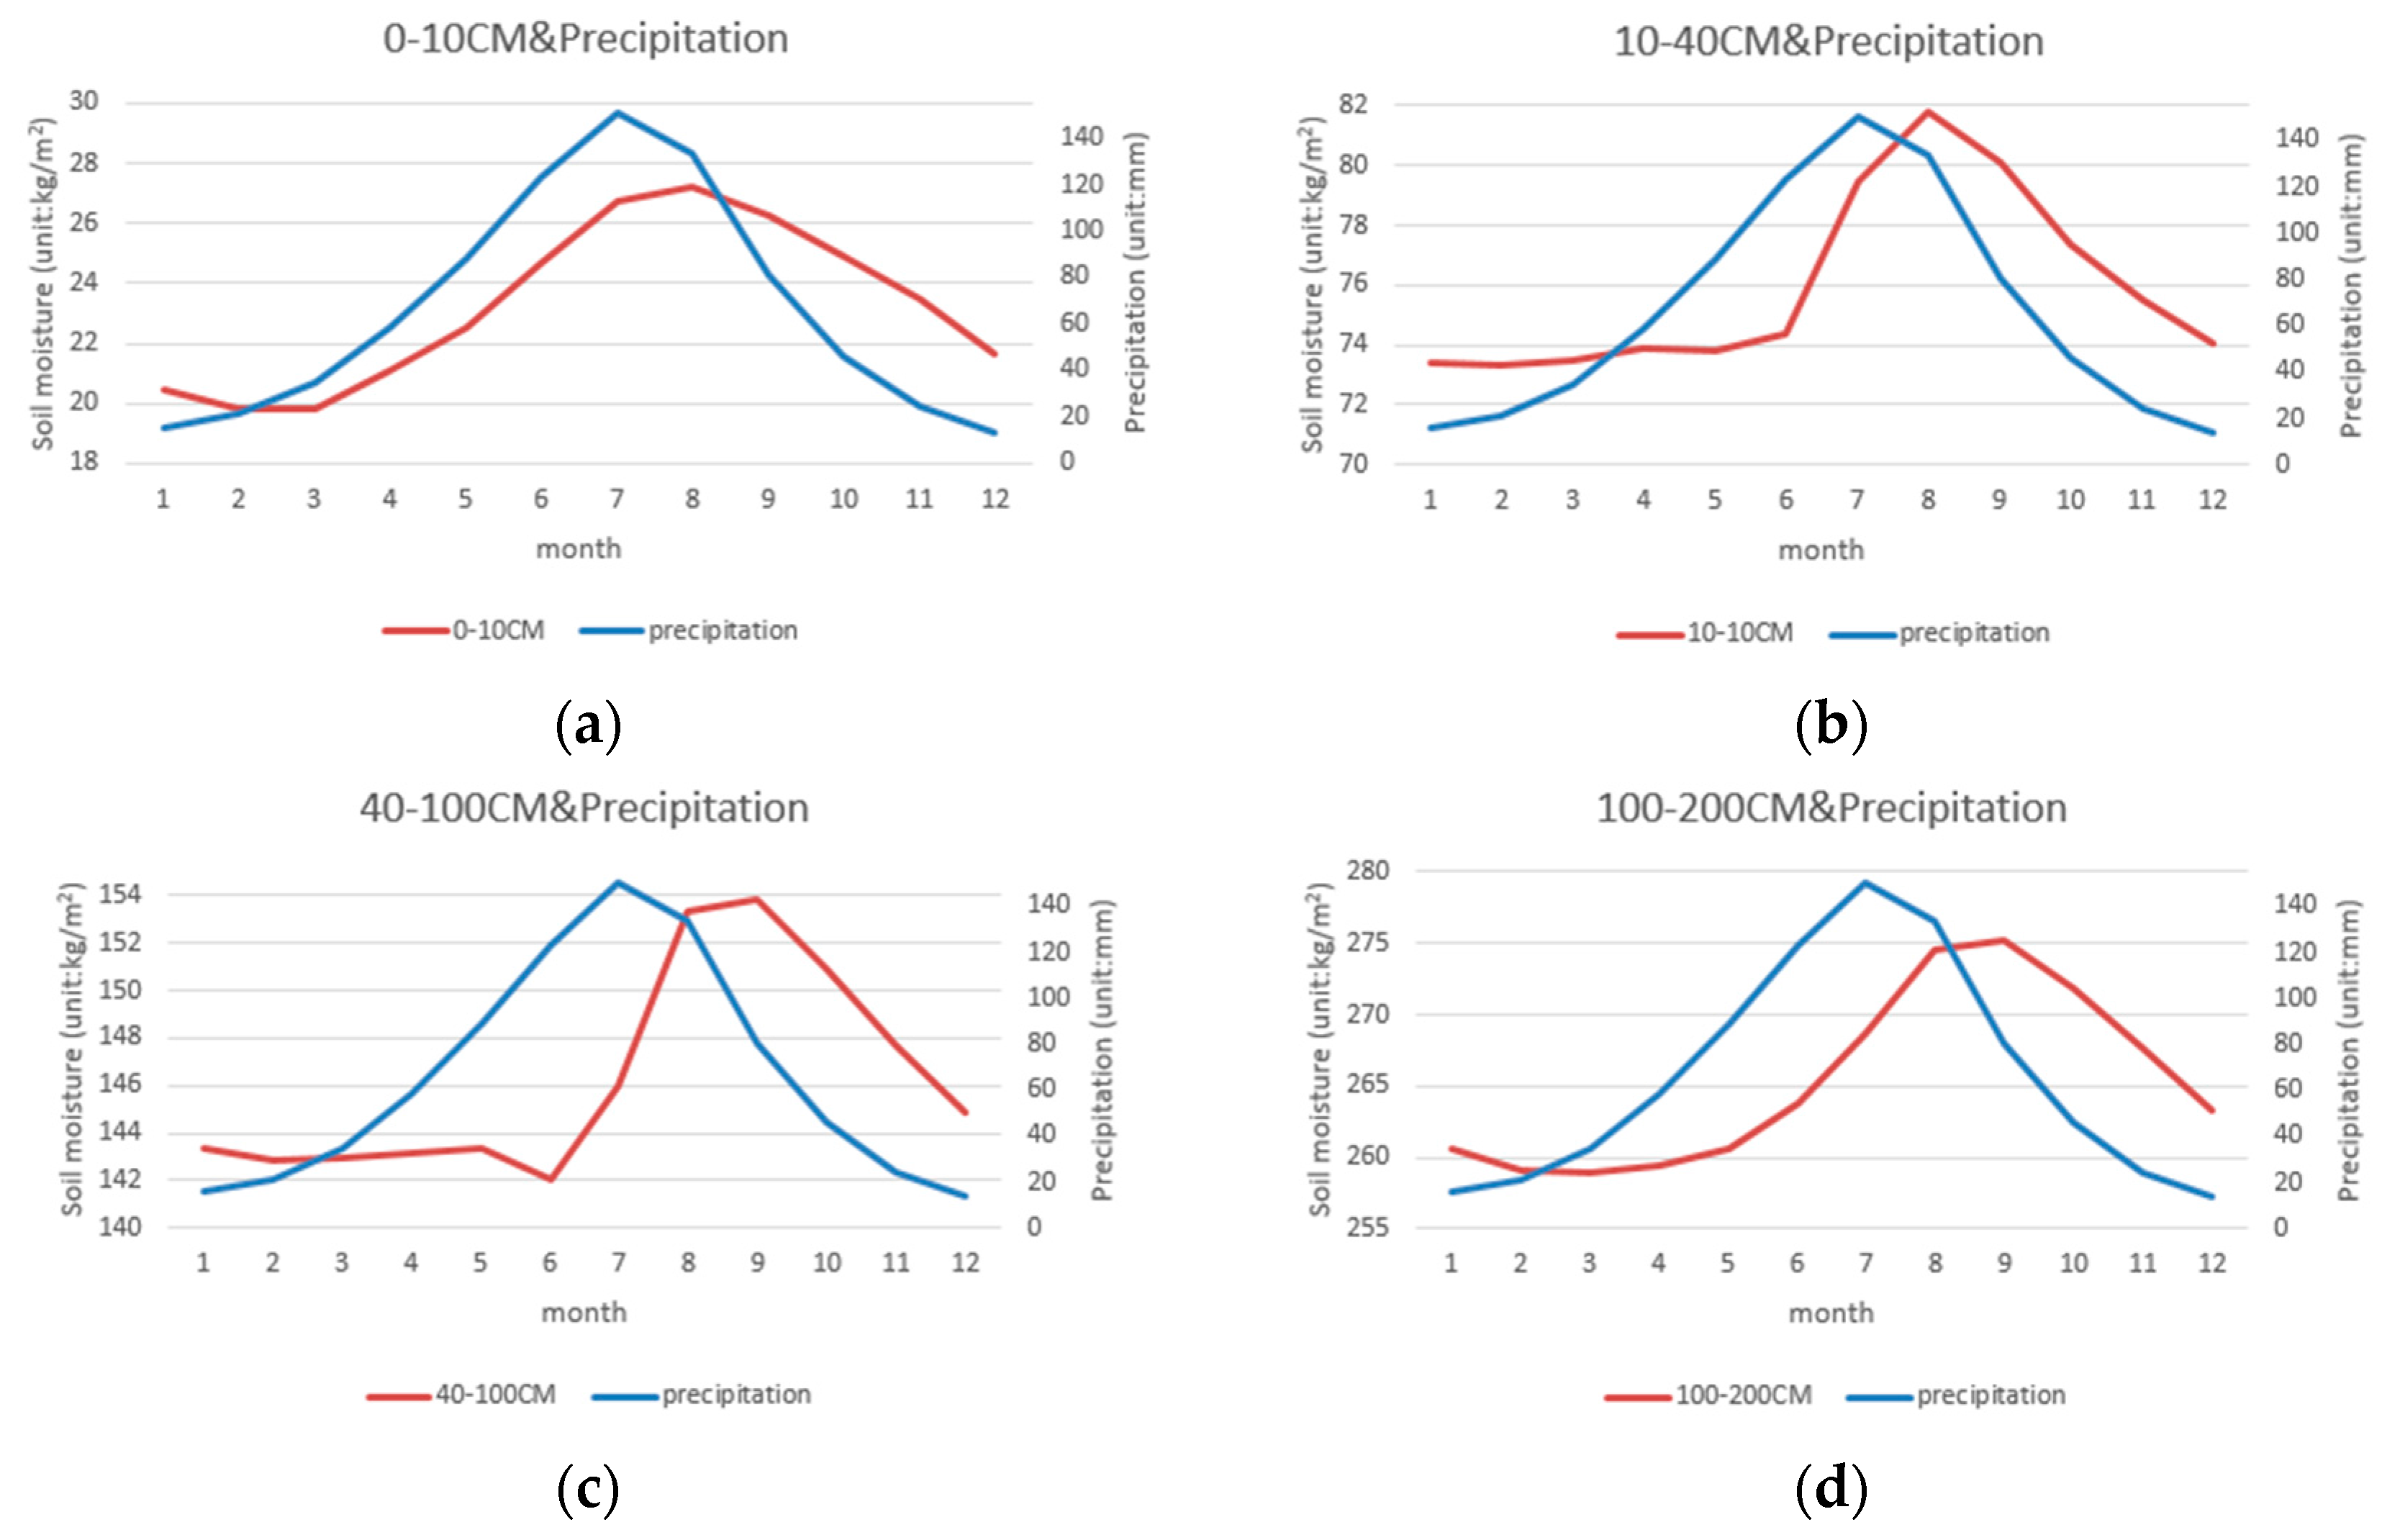
Each layer of soil moisture is significantly different in eastern China (Figure 7). The layer of soil moisture and precipitation in different months undergo similar changes. Before June, the 0–10 cm layer of soil moisture is low. As rainfall increases in summer, soil moisture gradually rises and reaches its peak value from July to September. In the next month, a decrease in precipitation leads to a gradual decrease in soil moisture and a slightly smaller humidity value. Among them, the 40–100 cm soil moisture layer’s seasonal evolution is different from the 0–10 cm, 10–40 cm, and 100–200 cm layers of soil moisture. The 40–100 cm layer of soil moisture is in a drought period from January to June; when the rainy season comes in June, the soil moisture increases with the greater precipitation and reaches a high in the middle of August. The maximum value of surface soil moisture (0–10 cm) coincides with the maximum value of precipitation. In the remaining three layers, maximum soil moisture lags behind the maximum value of precipitation; there are about one to two months of hysteresis. This delay indicates that soil moisture doesn’t immediately reflect the real-time dynamic of precipitation.
Comprehensive analysis of the above shows that the 0–10 cm of soil moisture is largely controlled by precipitation in different seasons. In the time series, the change in precipitation is similar to soil moisture. The deep soil moisture (10–40 cm, 40–100 cm, and 100–200 cm) and the changes in precipitation have a lag of one month in the time series. This shows that, in contrast to surface soil moisture and precipitation consistency, deep soil moisture is less susceptible to real-time precipitation constraints. Deep soil has a certain link to early climate change, can accumulate information on surface hydrological processes information, and is able to respond to the relationship between its ecological environment and climate change.
3.1.3. The Long-term Changes in Soil Moisture
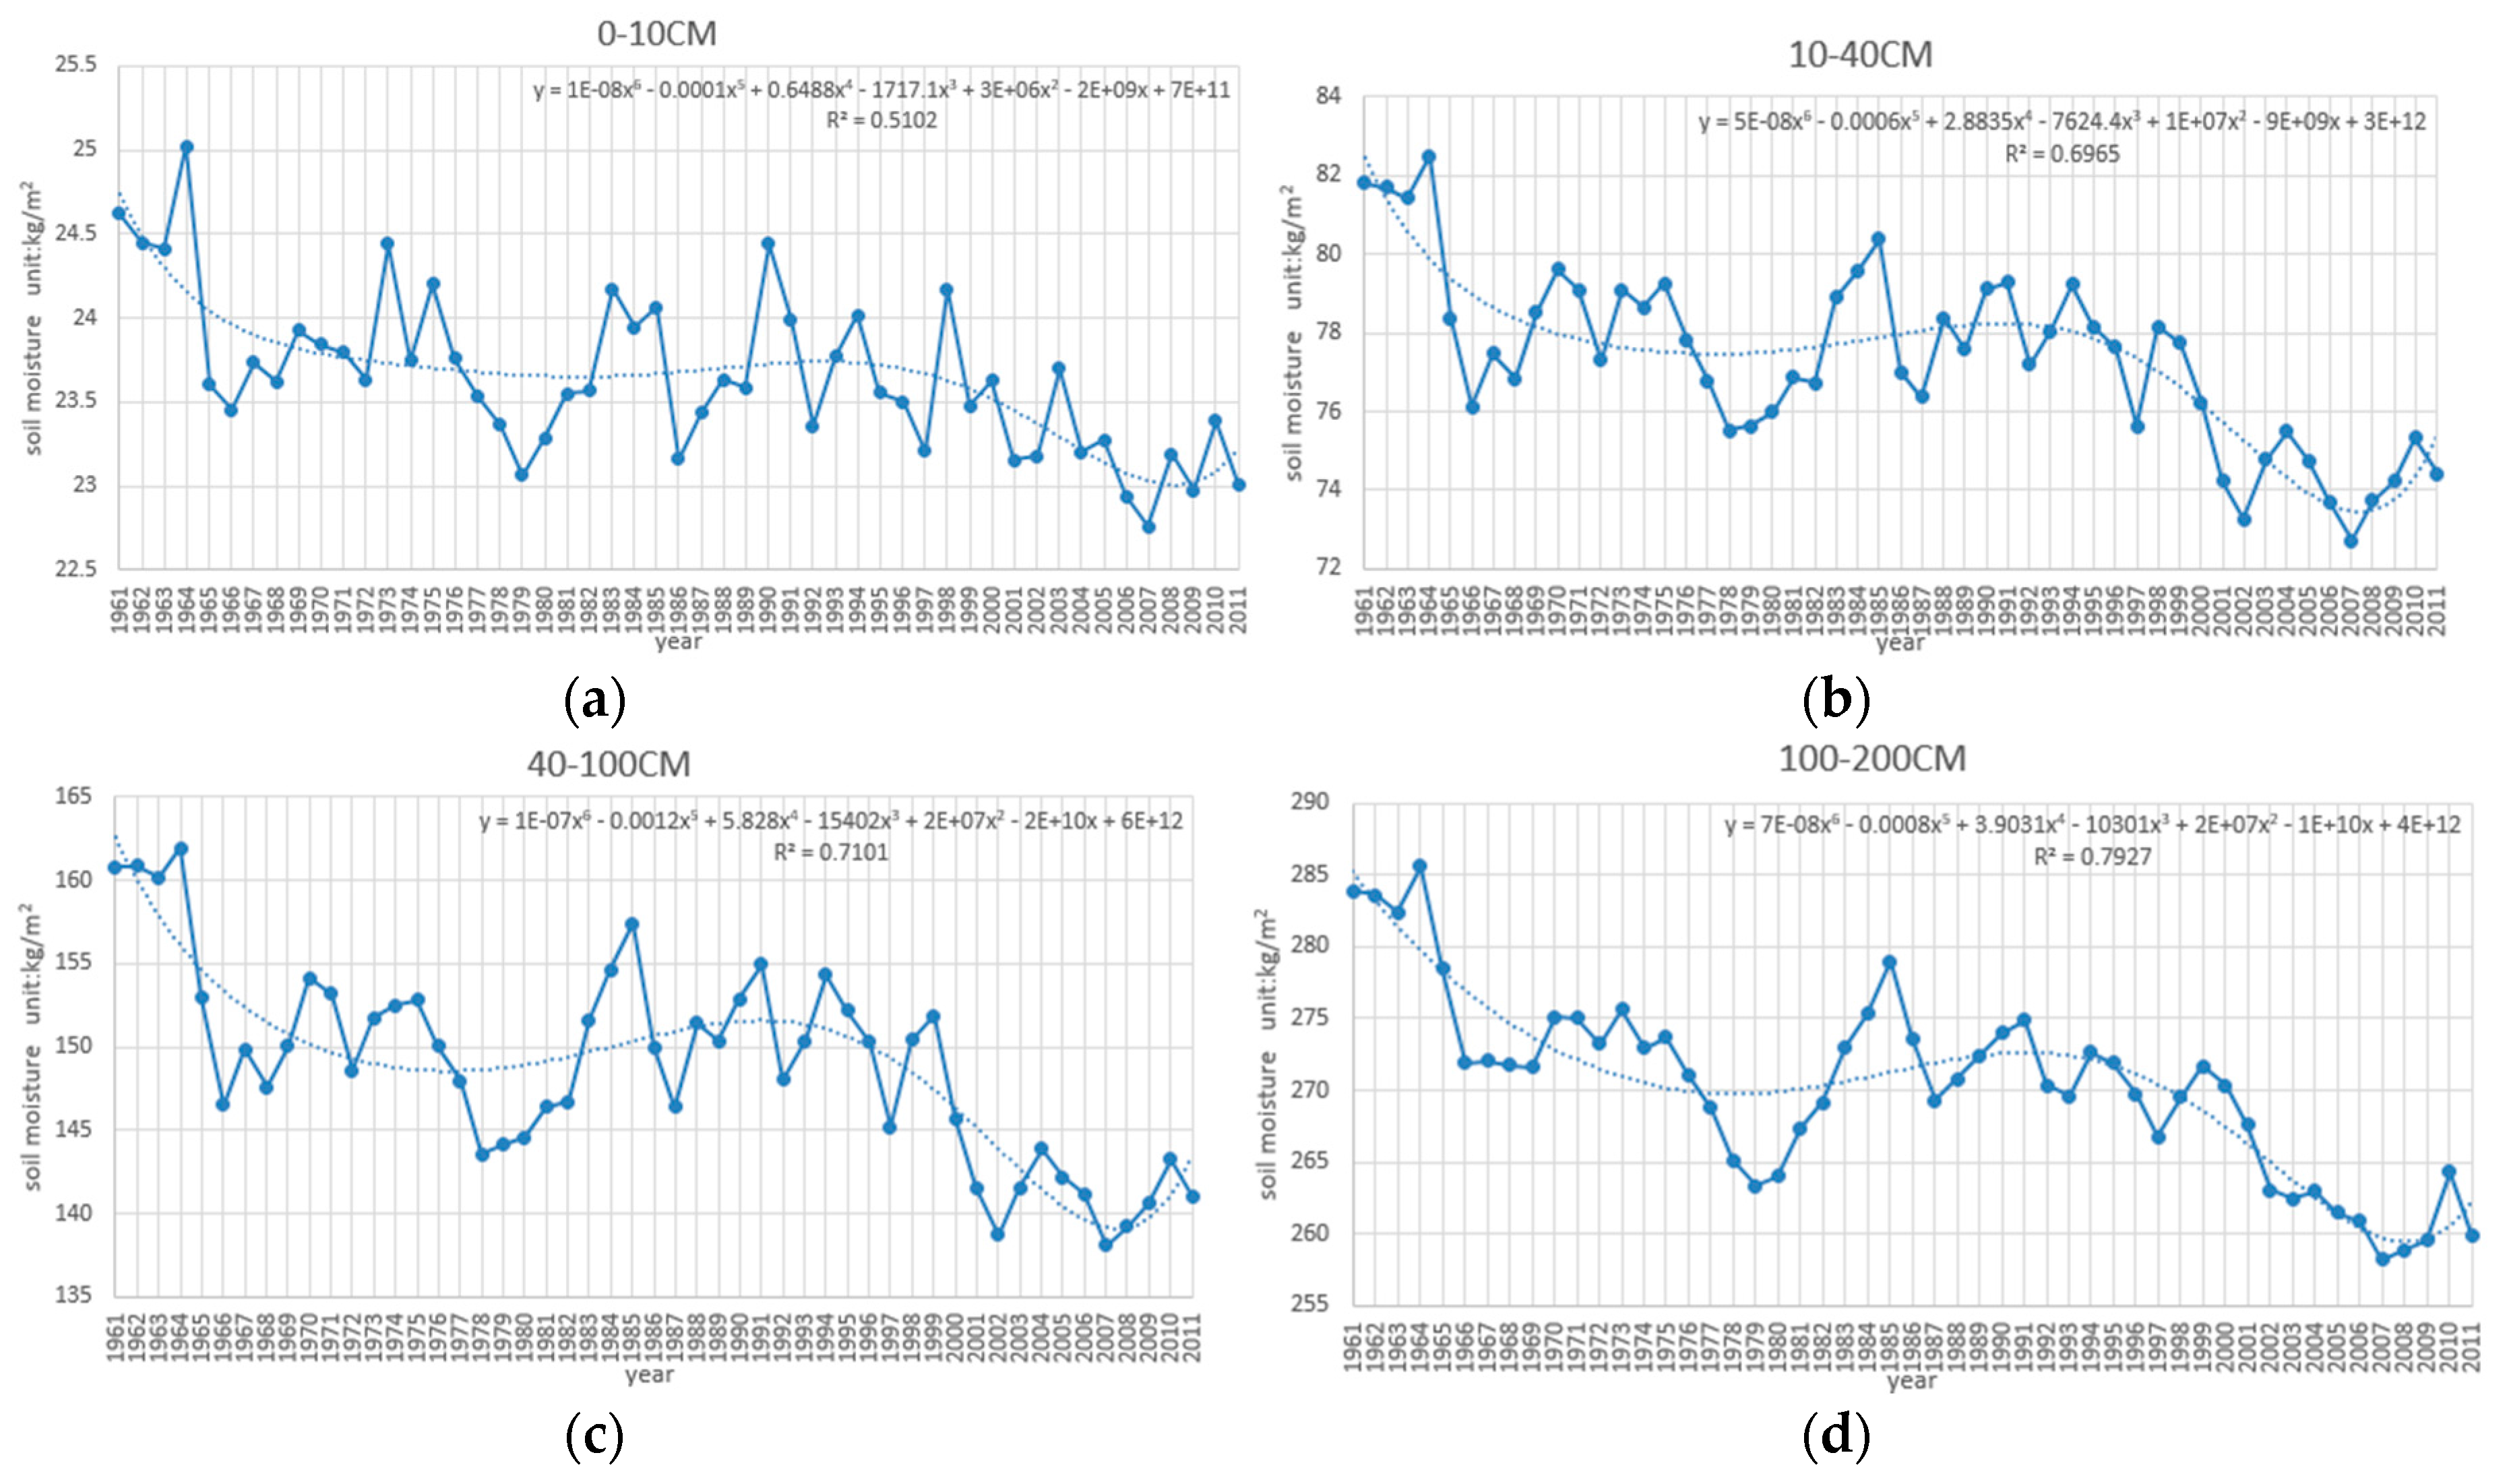
Figure 8 shows a time curve of soil moisture in four different layers (0–10 cm, 10–40 cm, 40–100 cm, and 100–200 cm). All layer soil moisture variation characteristics have similar declining trends; the changes in soil moisture are also very significant in different years in eastern China from 1961 to 2011. Before 1964, soil moisture in eastern China appeared to be increasing. In 1964, the soil moisture value reached a peak. After 1964, soil moisture declined sharply, but gradually shifted from wet towards drought conditions.
In addition to the curve of change over time, we calculated different seasons’ climate tendency rate of soil moisture in different layers (Table 2). Table 2 shows that the climate tendency rate is positive in the different layers of soil moisture in the spring and summer, but is negative in autumn and winter. The 0–10 cm layer has a small difference between spring and summer, and the characteristics of the other layers significantly differ each season. The climate tendency rates of the four layers are negative for every year considered, which indicates that the soil became dryer. It was also confirmed that in most cases the soil tends to become dryer the deeper down you go from the surface. These findings reached 99% on the significance test, which is the same as the result given by [18] using observation data from 1981 to 1991. Although there were some differences between GLDAS data and observation data, GLDAS data reflected the inter-annual variability of the observation data and peak events leading to the catch of the soil moisture.
3.2. The Relationship between Precipitation, Temperature and Soil Moisture
Soil moisture is an important meteorological element for keeping the balance of global water and energy. Due to the delayed changes to the characteristics of the soil, it became the hydrologic cycle storage buffer area, which thus mastered the surface heat flux between the latent and sensible heat flux. More analysis shows that the deviation of soil moisture adversely affects climate change. The lower than normal value of soil moisture can lead to a drop in precipitation, thus reducing the ground air humidity and causing a rise in temperature. This means that reducing the water content of soil makes temperature rise [27]. In eastern China, precipitation and temperature both have a large impact on the regional soil water content. Looking at the data on soil moisture, precipitation and temperature, it is noted that the inter-annual variability of precipitation and different layers of soil moisture is very significant. Both present declining trends, and the annual average temperature increases, yet minimum temperatures in 1969, 1976, and 1984 correspond to the El Nino year in Chinese history. The maximum temperatures fell in 1998, 2003, and 2007. Again, it is significant that 1998 follows the strongest El Nino year in the 20th century, 2003 was a rare high temperature year and 2007 was the warmest year since 1951. Each layer of soil moisture also displays such extremes. This shows that there is a connection between soil moisture, precipitation and temperature. Therefore, the above data reveals that warming and drying phenomena are related to decreasing soil moisture. In order to examine the previous assumptions, we examine links between the 51 years of soil moisture anomalies in each layer and the annual average precipitation anomaly, and also assess the relevance of the soil moisture, temperature and precipitation.
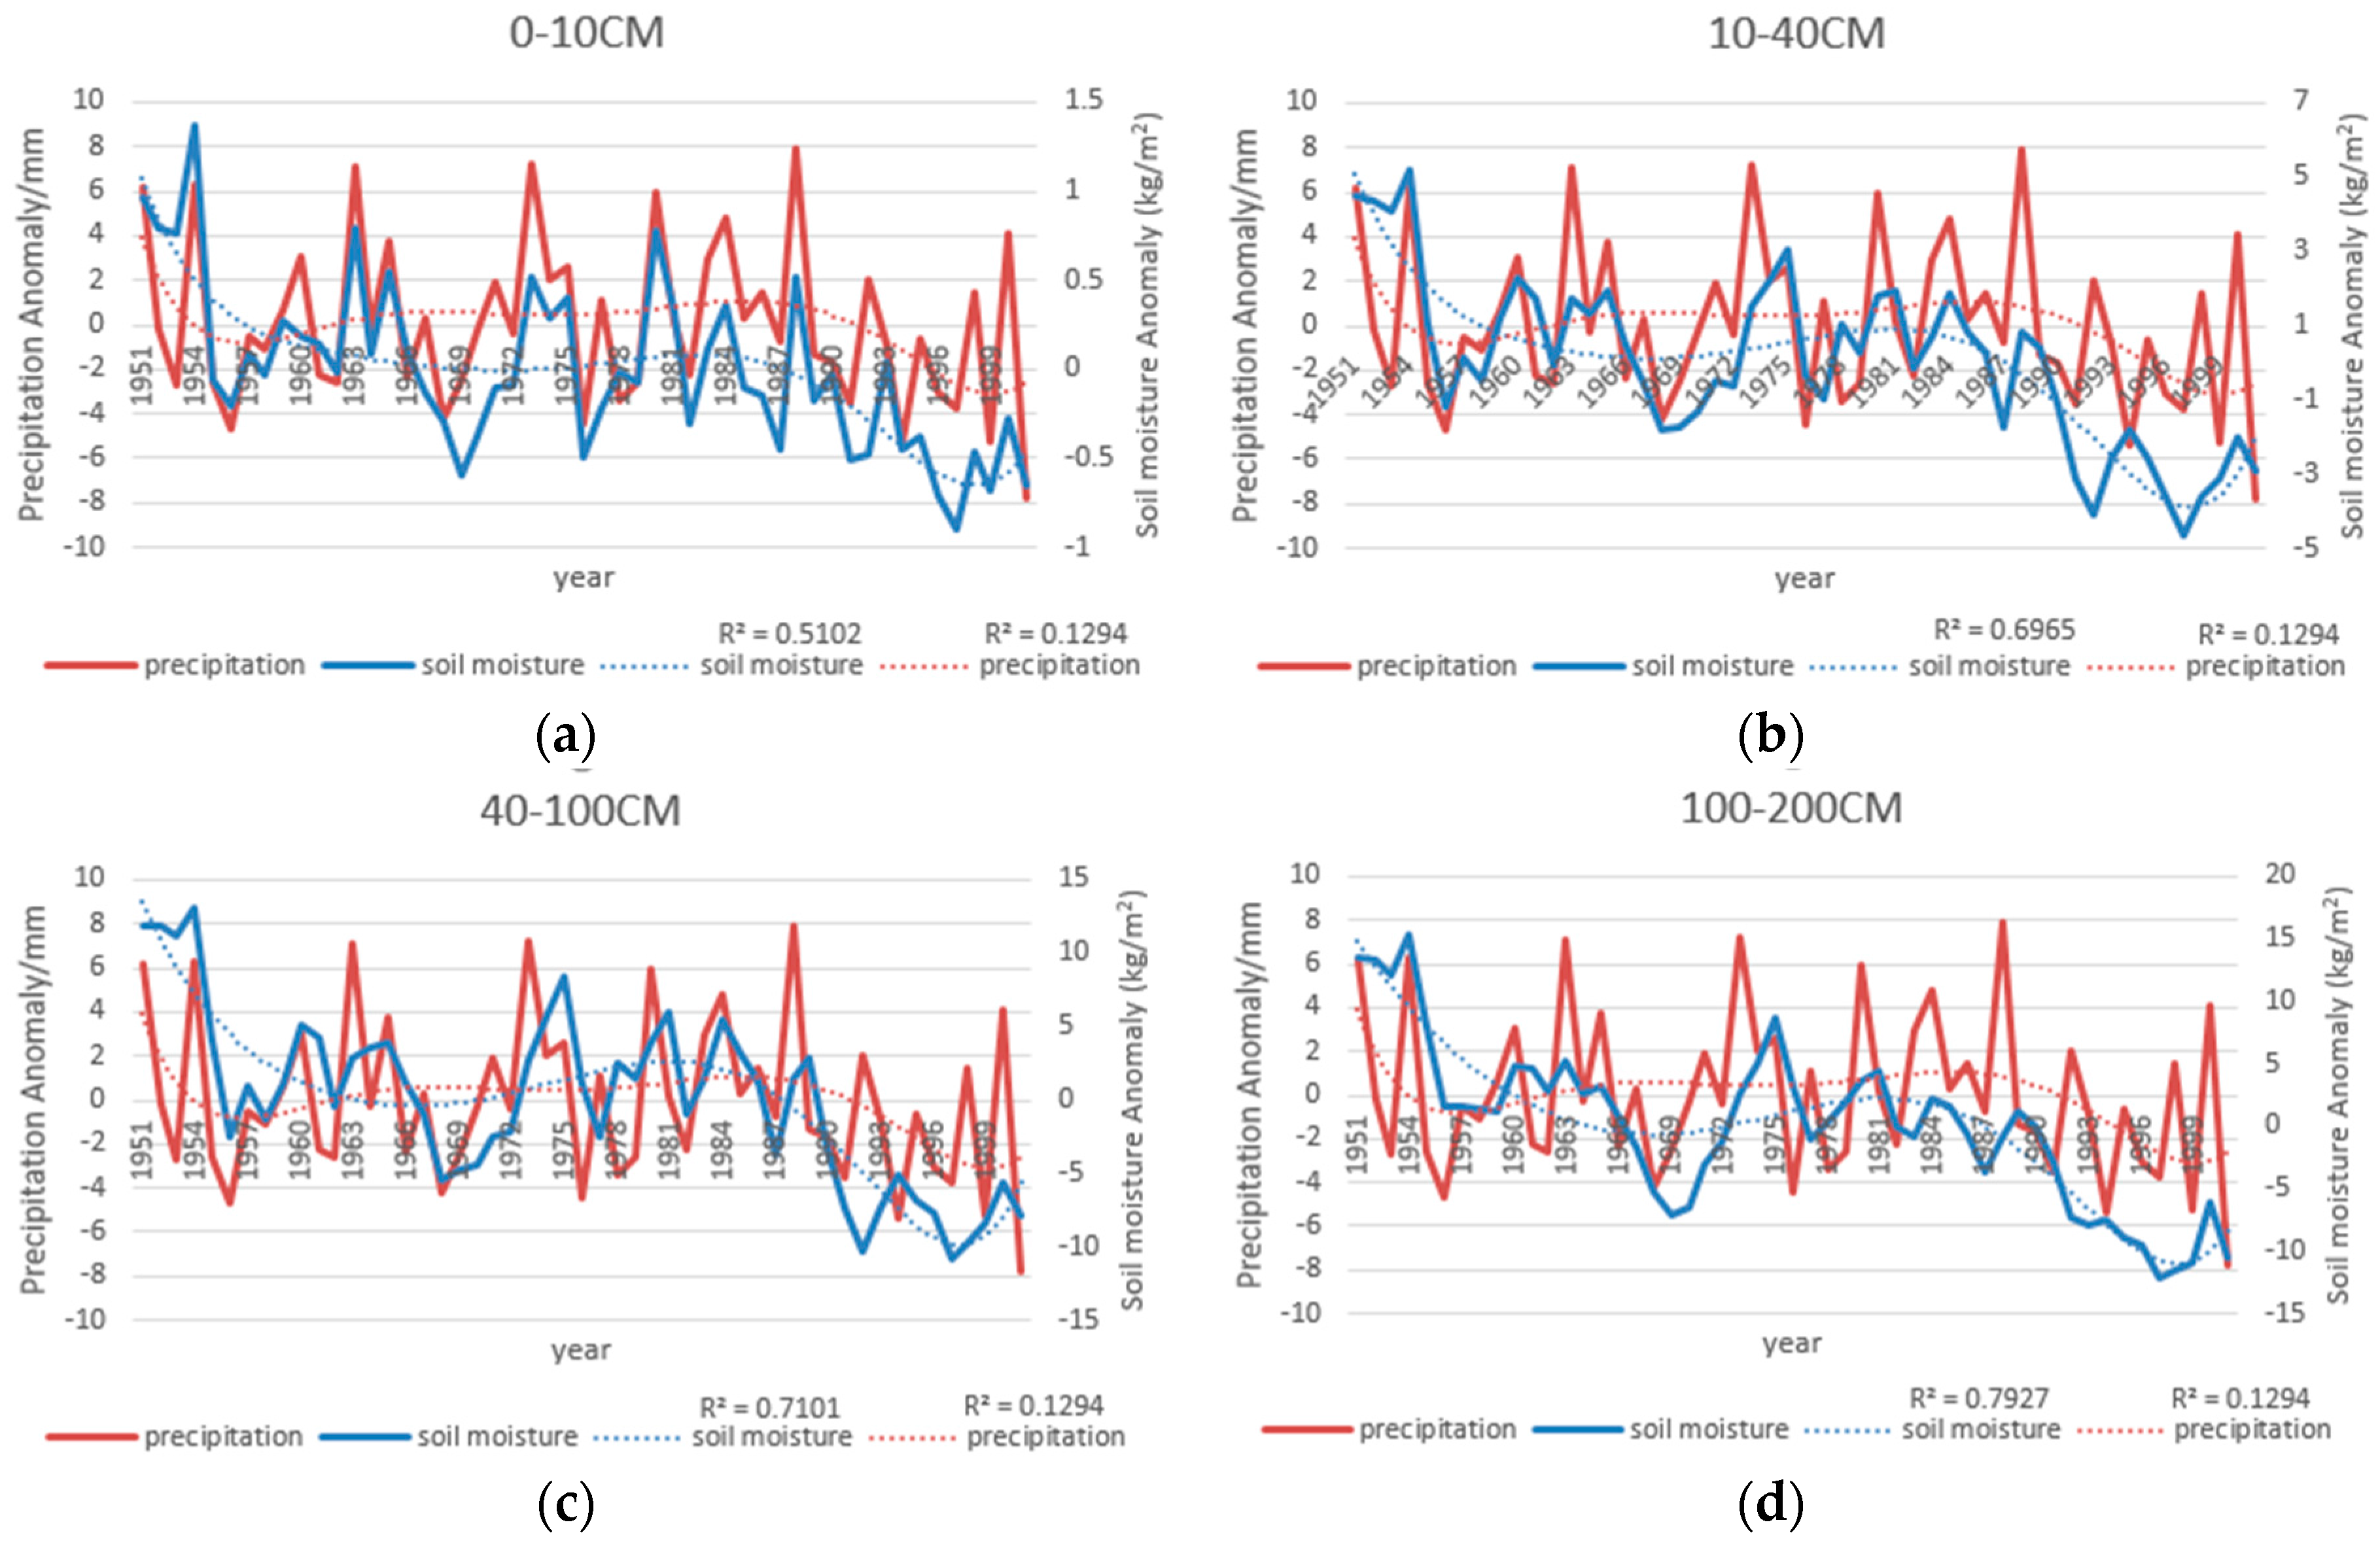
Comparing the average annual precipitation anomaly in eastern China with the soil moisture anomalies (Figure 9), it is evident that although all layers of soil moisture are not the same, each layer of soil moisture and precipitation have a positive correlation.
Its correlation coefficient shows a decline with the increase of soil depth from 0.78 in the 0–10 cm layer to 0.46 in the 100–200 cm layer. Thus, precipitation strongly influences soil moisture in the 0–10 cm layer, though it is not clear whether this can be said for the other layers. The main cause of this phenomenon is that water in the 0–10 cm layer mainly comes from natural precipitation, whereas the water in 10–40 cm, 40–100 cm, and 100–200 cm layers is from penetration. Figure 10 compares annual average temperature anomalies with the layers of soil moisture from 1961 to 2011 in eastern China, and it proves that temperature and different layers of soil moisture have a negative correlation. From shallow to deep soil (0–10 cm, 10–40 cm, 40–100 cm, and 100–200 cm), the correlation coefficient of soil moisture and temperature is 0.32, 0.51, 0.47 and 0.52, respectively. This shows that, in addition to the second layer, the other three layers’ temperature has a greater impact the deeper the soil layer.
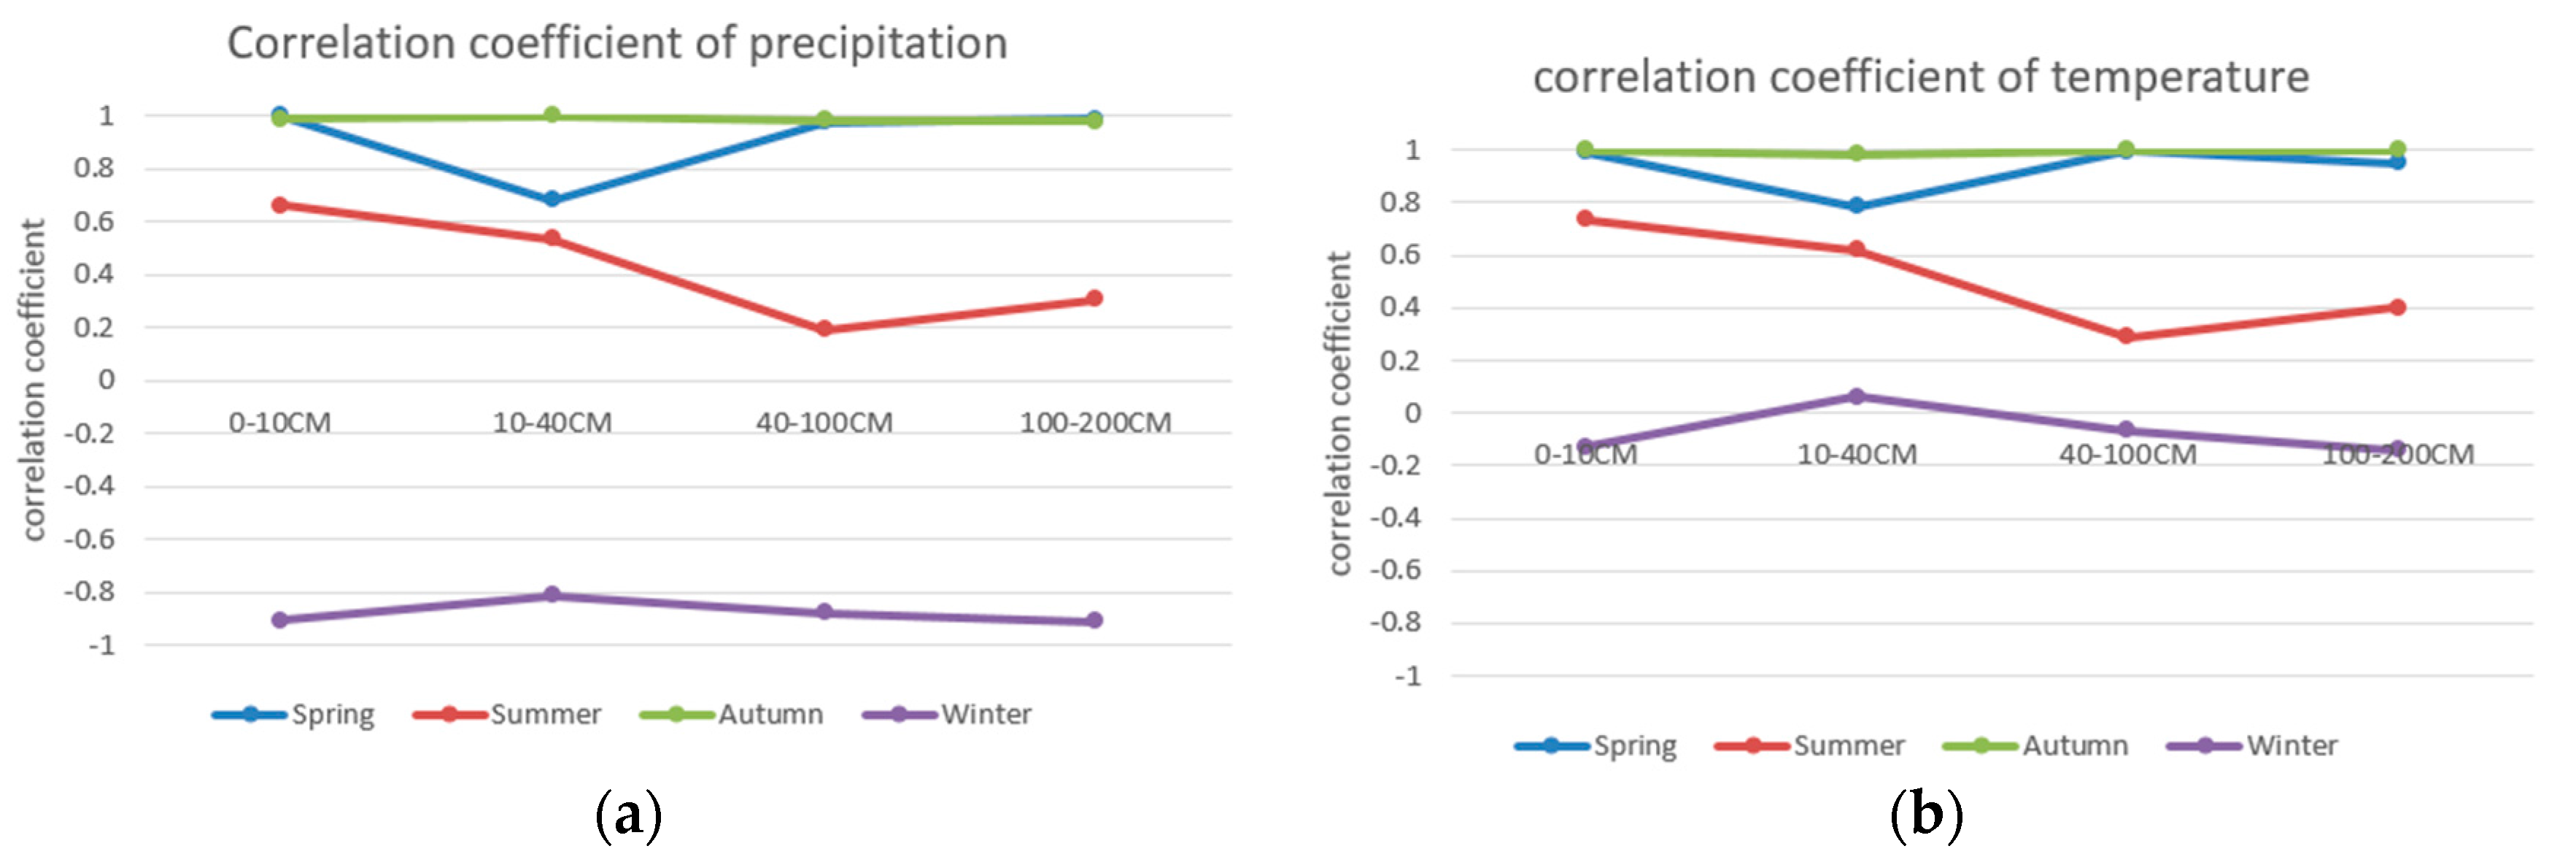
The above analysis demonstrates that the evolution characteristics of soil moisture are influenced by temperature and precipitation. Specifically, the change of precipitation affects the surface soil, but the temperature has a more pronounced effect on deep soil. With their hot, rainy summers and cold, dry winters, the large temperature differences can be ascribed to the monsoon in eastern China. As a result, there is an evident difference in temperature and precipitation in different seasons. Figure 11 shows the correlation coefficient of each seasonal precipitation, temperature, and the levels of precipitation and temperature in relation to soil moisture in different seasons for the four layers (0–10 cm, 10–40 cm, 40–100 cm, and 100–200 cm) of soil moisture from 1961 to 2011. From the correlation coefficient of precipitation and soil moisture, we find that precipitation and soil moisture in different depths have a positive correlation in spring, summer and autumn, but it is negative in winter. Correlation coefficients in summer and winter fall roughly in line with the decreasing of soil, while the correlation coefficient is close to 1 in spring and winter, which means precipitation and soil moisture are highly correlated. It is only in the 10–40 cm layer that the correlation coefficient decreases slightly in spring.
Combined with the correlation coefficient of temperature and soil moisture, temperature is positively associated with different depths of soil moisture from spring to autumn. Temperature in winter is negatively correlated with soil layers at 0–10 cm, 40–100 cm, and 100–200 cm, with the exception being 10–40 cm. The correlation coefficient in spring, summer and winter drop with the decreasing of soil, while the correlation coefficient in autumn is close to 1, which means temperature and soil moisture are highly correlated. The correlation coefficients in the 40–100 cm layer of soil are different in spring and summer, as the correlation coefficient of spring and summer soil moisture is close to 1. This shows that moisture in the spring correlated highly in the 40–100 cm layer of soil. But the correlation coefficient of summer and soil moisture at the 10–40 cm layer of soil decreased. These results show that precipitation, temperature, and soil moisture have a high degree of correlation in the autumn, but this is not as significant in winter.
As temperature and precipitation are positively correlated with different depths of soil in spring, summer, and autumn, and China is located in the east of East Asia and the Pacific west bank, which belongs to the humid and sub-humid regions due to a short water cycle, the increase of temperature and evaporation turns more water into rainfall.
3.3. The Quantitative Relationship of Precipitation and Temperature to Soil Moisture
In the study we found that temperature and precipitation play an important role in the process of the evolution of soil moisture. In order to present the ability of constraints to temperature and precipitation to affect soil moisture, the multiple regression analysis method is used to analyze the quantitative relationship of precipitation and temperature to soil moisture in different depths of soil throughout the year, as shown in Table 3. It is clear that precipitation and temperature in spring, summer and autumn have positive correlations with soil moisture in different depths, but the correlations are negative in winter. In each season and at each layer of soil moisture, the effects of temperature and precipitation on soil moisture are varied. Among them, in autumn the temperature and precipitation have a significant effect on different depths of soil moisture, which is not the case for winter. The results also indicate that precipitation, temperature and soil moisture are consistent.
3.4. Discussion
As we know, GLDAS output can be highly uncertain [12,13], but if we combine data validation with in-situ observations, it may help us to overcome the limitation of short time scales and restricted space. With the advanced development of models and assimilation methods, we believe GLDAS outputs will be accurate and thus useful to help understand the correlation of soil moisture with climate elements and the causation of meteorological elements. In the future, we will focus on the further development of GLDAS output and its support to more studies of soil moisture’s responses and effects on climate change globally or regionally, such as in eastern China.
4. Conclusions
Analyzing each layer of soil moisture in eastern China based on GLDAS data, we found that the temperature and precipitation in different seasons have different degrees of influence on the characteristics of soil moisture in each layer. Several conclusions have been drawn from these analyses.
Comparing the results based on GLDAS data with those obtained from observation data, it is clear that there are some differences, although GLDAS data does roughly reflect the real characteristics of inter-annual variability of soil moisture and climate anomalies in eastern China. There has generally been an increase from 1961 to 2011 in eastern China. According to data analysis of the same 51 years, precipitation tended to decrease. The evolutions of temperature and precipitation are completely opposite, but both varied sharply year by year.
Soil moisture in the 0–10 cm layer is more influenced by precipitation in different seasons in the time series, but precipitation has a similar regularity. The change of precipitation delays soil moisture (10–40 cm, 40–100 cm, and 100–200 cm) about one to two months. Deeper soil has a certain memory function for climate change, which can accumulate a lot of information about the surface hydrological processes. According to the data analysis, soil moisture shows a decreasing trend over the 51 years, while inter-annual variability is significantly different, which indicates that eastern China may have future drought issues.
As for the correlation coefficient between soil moisture and temperature, the data analysis shows that for all layers aside from the 10–40 cm layer, temperature is positively associated with the layers of soil moisture in spring, summer and autumn, but precipitation is negatively correlated with soil moisture of each layer in winter. Temperature in winter is negatively correlated with soil moisture, again except for the 10–40 cm layer. Precipitation also has the largest effect on surface soil, while temperature has an obvious effect on the soil depth.
Acknowledgments
The GLDAS data and the local government data are highly appreciated. The authors thank Wenjian Hua for his help collecting the data. This research is partially supported by the National Key Research and Development Program of China (Project Ref. No. 2016YFB0501501) and 2015 Jiangsu Shuangchuang Program of China.
Author Contributions
All authors contributed equally to the writing of the article.
Conflicts of Interest
The authors declare no conflict of interest.
References
- Zhang, Q.; Wang, S.; Wei, G. A study on parameterization of local land-surface physical processes on the GOBI of northwest China. Chin. J. Geophys. 2003, 46, 616–623. [Google Scholar] [CrossRef]
- Guan, X.D.; Huang, J.P.; Guo, N. Variability of soil moisture and its relationship with surface albedo and soil thermal parameters over the Loess Plateau. Adv. Atmos. Sci. 2009, 26, 692–700. [Google Scholar] [CrossRef]
- Zhu, Q.; Lan, H.; Shen, T. Numerical study of the influence of soil moisture and surface albedo on climate of north part of China. Acta Meteoro-Log. Sin. 1996, 54, 493–500. [Google Scholar]
- Ma, Z.; Wei, H.; Fu, C. Progress in the research on the relationship between soil moisture and climate change. Adv. Earth Sci. 1999, 14, 300–303. [Google Scholar]
- Li, B.; Wen, X.; Wang, L.; Yan, P. Tendency of soil moisture in spring of Heilongjiang province in recent 30 years. J. Arid Meteorol. 2011, 29, 289–296. [Google Scholar]
- Wang, L.; Wen, J.; Wei, Z.; Hu, Z. Soil moisture over the west of northwest China and its response to climate. Plateau Meteorol. 2008, 27, 1257–1266. [Google Scholar]
- Chen, S.; Guo, Y.; Zheng, Y.; Wang, J. Impact of precipitation on soil moisture in Gansu arid agricultural regions. J. Desert Res. 2012, 32, 155–162. [Google Scholar]
- Zhang, Q.; Xiao, F.; Niu, H.; Dong, W. Analysis of vegetation index sensitivity to soil moisture in northern China. Chin. J. Ecol. 2005, 24, 715–718. [Google Scholar]
- Guo, N.; Chen, T.; Lei, J.; Yang, L. Estimating farmland soil moisture in eastern Gansu province using NOAA satellite data. J. Appl. Meteorol. 1997, 8, 212–218. [Google Scholar]
- Liu, S.; Lin, H.; Hu, F.; Liang, F.; Wang, J.; Liu, H. Numerical simulation of evapotranspiration mechanism over soil-vegetation-atmosphere system. Arid Meteorol. 2004, 22, 1–10. [Google Scholar]
- Tapley, B.; Bettadpur, S.; Ries, J. GRACE Measurements of Mass Variability in the Earth System. Science 2004, 305, 503–505. [Google Scholar] [CrossRef] [PubMed]
- Long, D.; Scanlon, B.; Longuevergne, L.; Sun, A.; Fernando, D.; Save, H. GRACE satellite monitoring of large depletion in water storage in response to the 2011 drought in Texas. Geophys. Res. Lett. 2013, 40, 3395–3401. [Google Scholar] [CrossRef]
- Long, D.; Shen, Y.; Sun, A.; Hong, Y.; Longuevergne, L.; Yang, Y.; Chen, L. Drought and flood monitoring for a large karst plateau in Southwest China using extended GRACE data. Remote Sens. Environ. 2014, 155, 145–160. [Google Scholar] [CrossRef]
- Reichle, R.; Koster, R.; Liu, P.; Mahanama, S.; Njoku, E.; Owe, M. Comparison and assimilation of global soil moisture retrievals from the Advanced Microwave Scanning Radiometer (AMSR) for the Earth Observing System (AMSR-E) and the Scanning Multichannel Microwave Radiometer (SMMR). J. Geophys. Res. Atmos. 2007. [Google Scholar] [CrossRef]
- Niu, G.; Yang, Z.; Dickinson, R. Development of a simple groundwater model for use in climate models and evaluation with Gravity Recovery and Climate Experiment data. J. Geophys. Res. Atmos. 2007, 112, 277–287. [Google Scholar] [CrossRef]
- Quintana, P.; Moigne, P.; Durand, Y. Analysis of near-surface atmospheric variables: Validation of the SAFRAN analysis over France. J. Appl. Meteorol. Climatol. 2008, 47, 92–107. [Google Scholar] [CrossRef]
- Koster, D.; Dirmeyer, P.; Guo, Z. Regions of strong coupling between soil moisture and precipitation. Science 2004, 305, 1138–1140. [Google Scholar] [CrossRef] [PubMed]
- Hu, M.; Ding, H.; Liao, F. An improvement on summer regional climate simulation over East China: Importance of data assimilation of soil moisture. Chin. Sci. Bull. 2009, 54, 2388–2394. [Google Scholar] [CrossRef]
- Zhang, X.; Wu, X.; He, J. Vertical character of soil moisture in China. Acta Geogr. Sin. 2004, 62, 60. [Google Scholar]
- Ma, Z.; Wei, H.; Fu, C. Relationship between regional soil moisture variation and climatic variability over east China. Acta Geogr. Sin. 2000, 58, 284–286. [Google Scholar]
- Houser, R.; Michael, B.; Brian, C. NASA/NOAA’s Global Land Data Assimilation System (GLDAS): Recent Results and Future Plans; Hydrological Sciences Branch NASA Goddard Space Flight Center: Greenbelt, MD, USA, 2000.
- Rodell, M.; Houserp, R.; Jambor, U. The global land data assimilation system. Am. Meteorol. Soc. Bull. 2004, 85, 381–394. [Google Scholar] [CrossRef]
- Pearson, K. Notes on regression and inheritance in the case of two parents. Proc. R. Soc. A Math. 1895, 58, 240–242. [Google Scholar] [CrossRef]
- Mann, B. Non-parametric tests against trend. Econometrica 1945, 13, 163–171. [Google Scholar] [CrossRef]
- Kendall, G. Rank Correlation Methods, 4th ed.; Charles Griffin: London, UK, 1975; p. 202. [Google Scholar]
- Huang, P.; Guan, D.; Ji, F. Enhanced Cold-Season Warming in Semi-Arid Regions. Atmos. Chem. Phys. 2012, 12, 5391–5398. [Google Scholar] [CrossRef]
- Sun, C.; Gao, F.; Qu, J. Latest knowledge on global climate change. Chin. J. Nat. 2002, 24, 114–122. [Google Scholar]
Figure 1.
The spatial distribution of annual average precipitation from 1961 to 2011.

Figure 2.
The national distribution of annual average temperatures from 1961 to 2011.
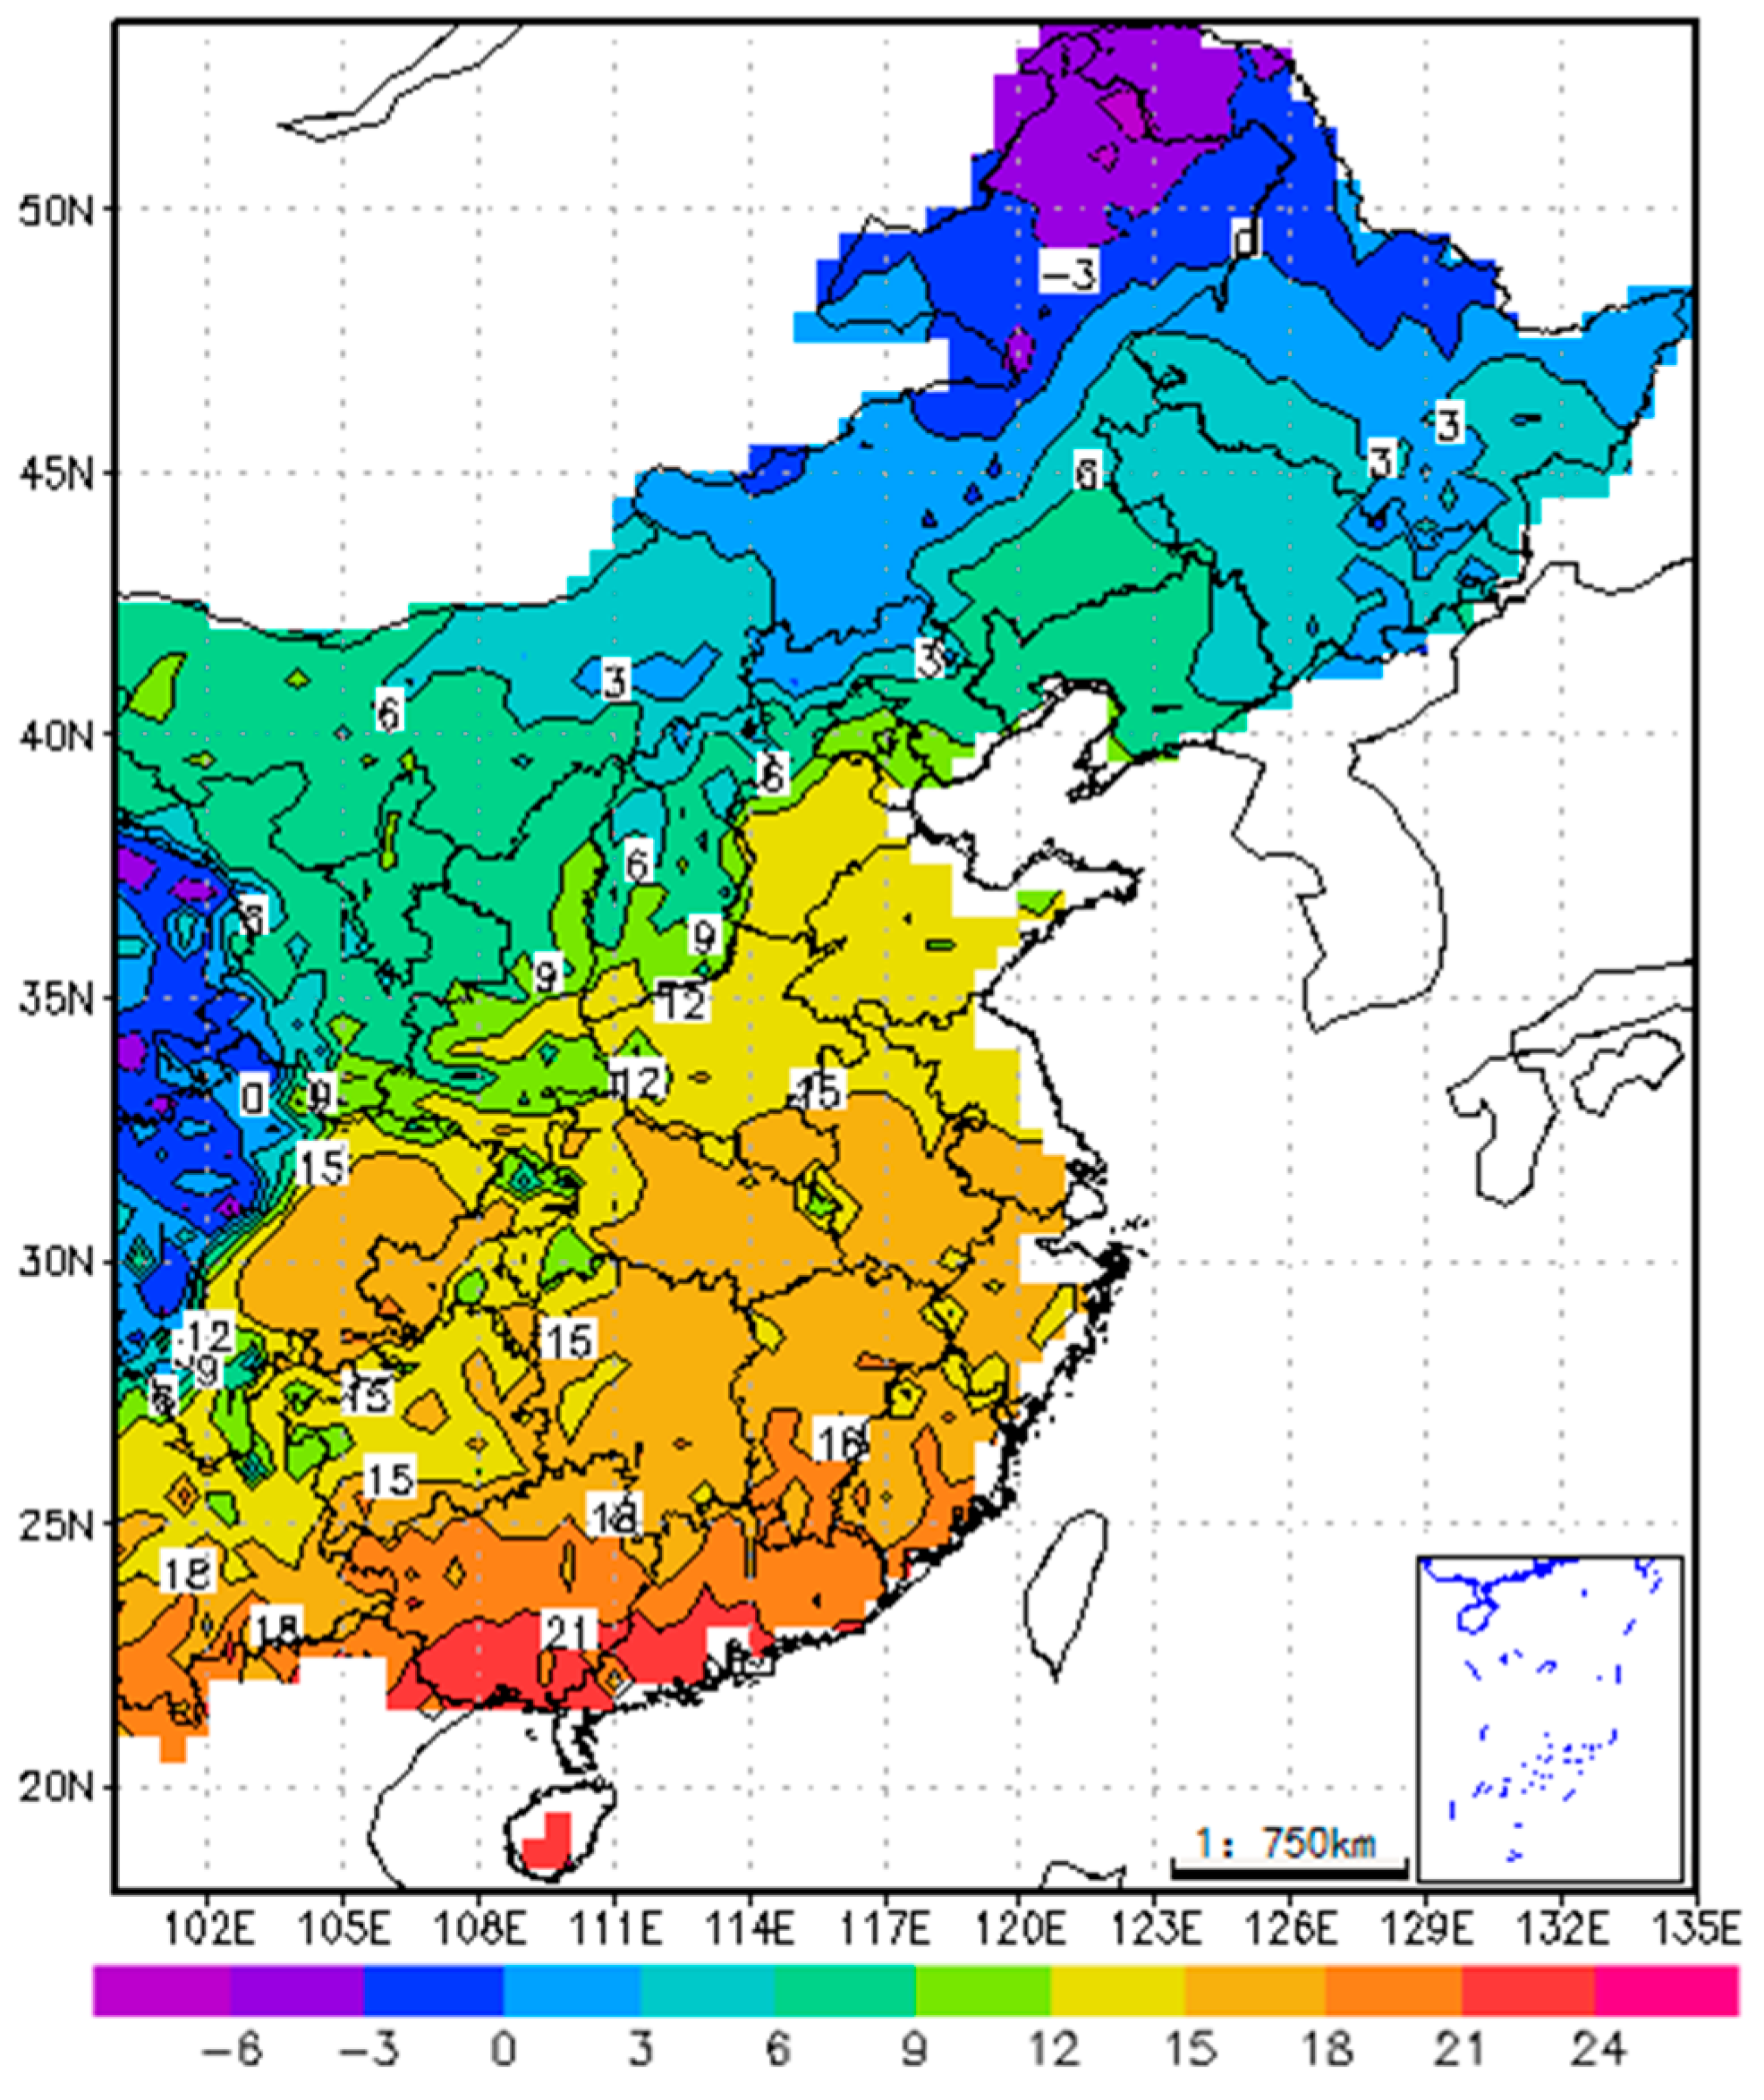
Figure 3.
Annual average temperature change in eastern China from 1961 to 2011.
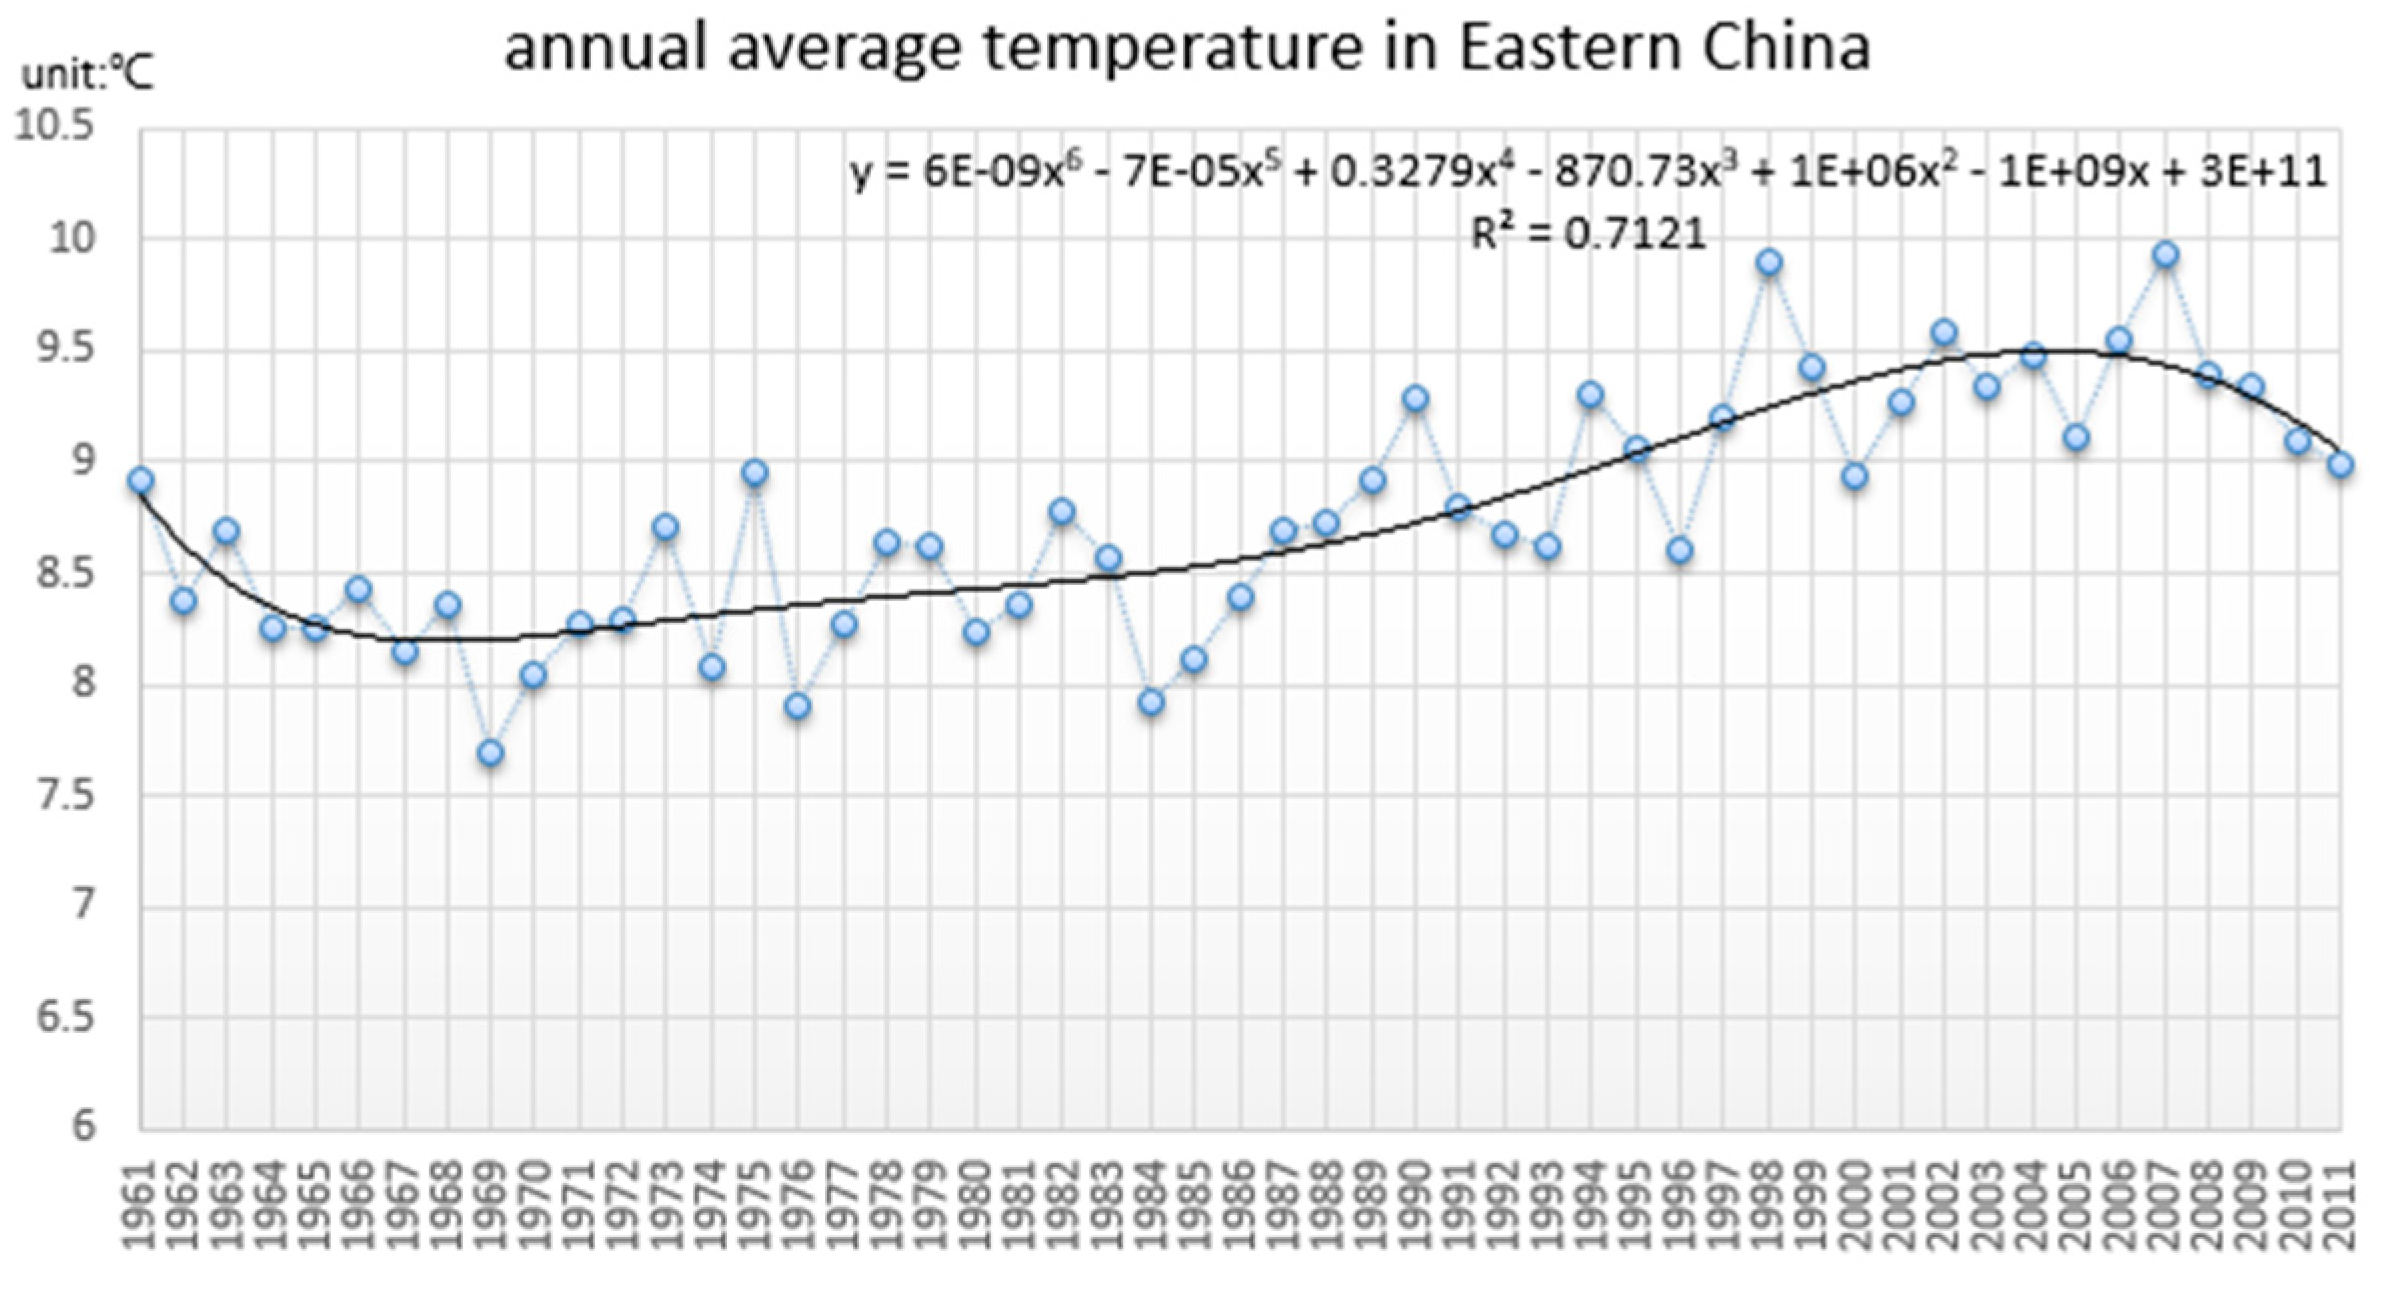
Figure 4.
The inter-annual variability of average temperature anomaly in eastern China from 961 to 2011.
Figure 4.
The inter-annual variability of average temperature anomaly in eastern China from 961 to 2011.
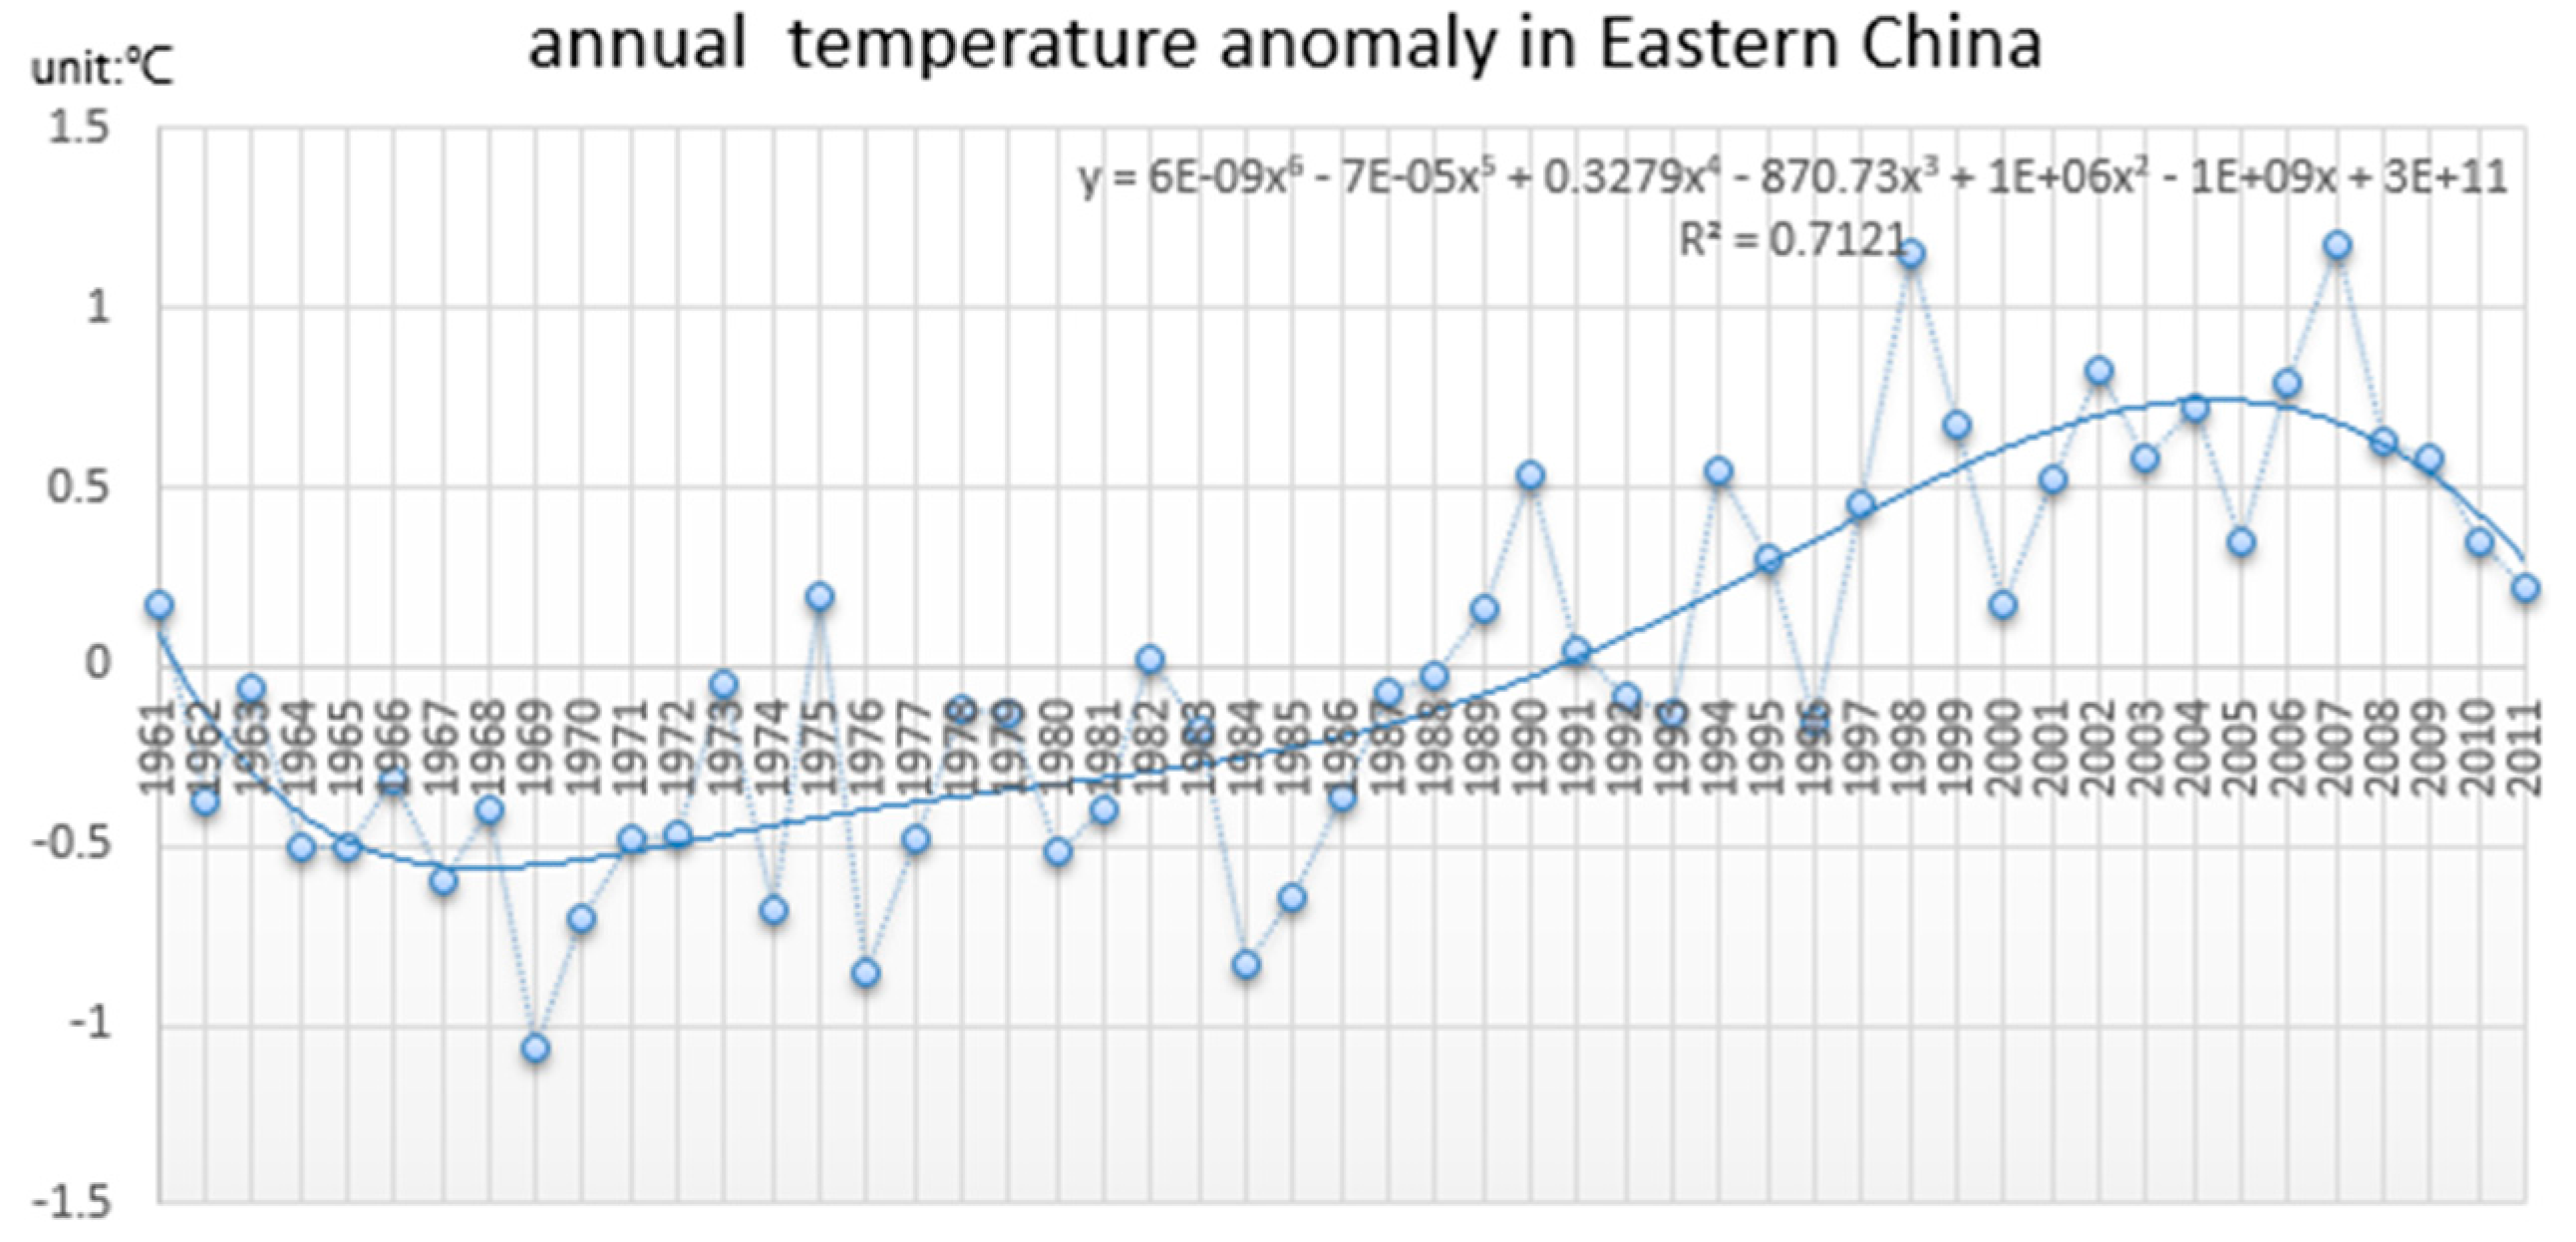
Figure 5.
The inter-annual variability of average annual precipitation in eastern China from 1961 to 2011.
Figure 5.
The inter-annual variability of average annual precipitation in eastern China from 1961 to 2011.
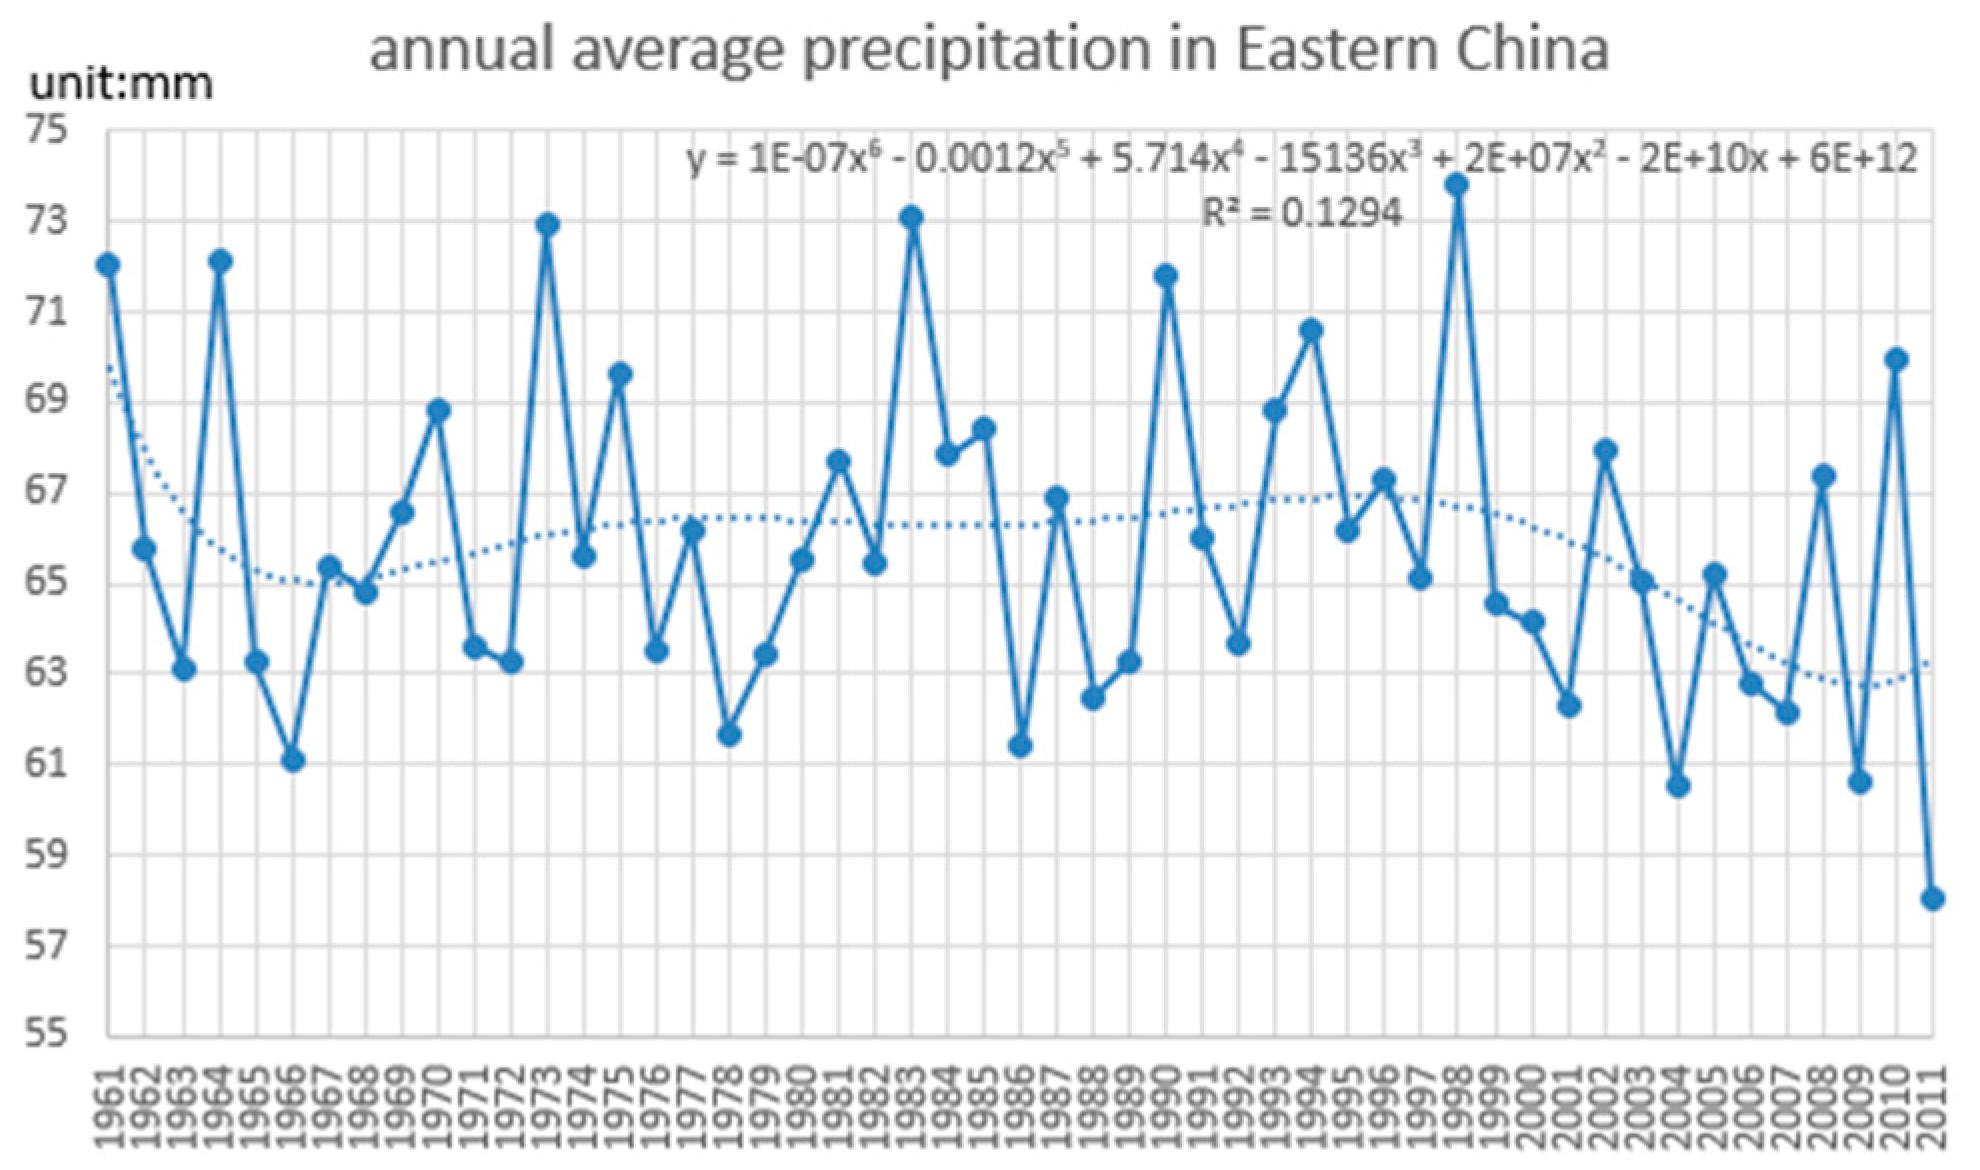
Figure 6.
The inter-annual variability of average annual precipitation anomaly in eastern China from 1961 to 2011.
Figure 6.
The inter-annual variability of average annual precipitation anomaly in eastern China from 1961 to 2011.

Figure 7.
The evolution of each layer of soil moisture and precipitation in eastern China: (a) 0–10 cm and precipitation; (b) 10–40 cm and precipitation; (c) 40–100 cm and precipitation; (d) 100–200 cm and precipitation.
Figure 7.
The evolution of each layer of soil moisture and precipitation in eastern China: (a) 0–10 cm and precipitation; (b) 10–40 cm and precipitation; (c) 40–100 cm and precipitation; (d) 100–200 cm and precipitation.

Figure 8.
The average changes of soil moisture in different years in eastern China from 1961 to 2011: (a): 0–10 cm; (b) 10–40 cm; (c) 40–100 cm; (d) 100–200 cm.
Figure 8.
The average changes of soil moisture in different years in eastern China from 1961 to 2011: (a): 0–10 cm; (b) 10–40 cm; (c) 40–100 cm; (d) 100–200 cm.

Figure 9.
The relationship of annual average precipitation anomaly (red line) and the layers of soil moisture (blue line) from 1961 to 2011 in eastern China: (a) 0–10 cm; (b) 10–40 cm; (c) 40–100 cm; (d) 100–200 cm.
Figure 9.
The relationship of annual average precipitation anomaly (red line) and the layers of soil moisture (blue line) from 1961 to 2011 in eastern China: (a) 0–10 cm; (b) 10–40 cm; (c) 40–100 cm; (d) 100–200 cm.

Figure 10.
The relationship of annual average temperature anomaly (red line) and the layers of soil moisture (blue line) from 1961 to 2011 in eastern China: (a) 0–10 cm; (b) 10–40 cm; (c) 40–100 cm; (d) 100–200 cm.
Figure 10.
The relationship of annual average temperature anomaly (red line) and the layers of soil moisture (blue line) from 1961 to 2011 in eastern China: (a) 0–10 cm; (b) 10–40 cm; (c) 40–100 cm; (d) 100–200 cm.

Figure 11.
The correlation coefficient of precipitation and temperature with soil moisture in different seasons: (a) correlation coefficient of precipitation; (b) correlation coefficient of temperature.
Figure 11.
The correlation coefficient of precipitation and temperature with soil moisture in different seasons: (a) correlation coefficient of precipitation; (b) correlation coefficient of temperature.


Table 1.
Mann-Kendall test of temperature and precipitation change trends
| Category | Value Zc | Slope |
|---|---|---|
| Precipitation | −1.0072 | −0.0318 |
| Temperature | 5.4744 *** | 0.0267 |
Note: *** Represent passed 99% significance testing.
Table 2.
The climate tendency rate of soil moisture in four layers (Unit: kg/m2/10a).
| Category | Spring | Summer | Autumn | Winter | Yearly |
|---|---|---|---|---|---|
| 0–10cm | 1.319 | 1.259 | −1.418 | 0.624 | −0.019 |
| 10–40cm | 0.177 | 3.717 | −2.278 | −0.378 | −0.107 |
| 40–100cm | 0.181 | 5.642 | −3.074 | −0.992 | −0.269 |
| 100–200cm | 0.848 | 5.398 | −3.837 | −2.024 | −0.332 |
Table 3.
Regression coefficients of temperature, precipitation, and soil depth in different seasons.
Table 3.
Regression coefficients of temperature, precipitation, and soil depth in different seasons.
| Category | Regression Coefficient | 0–10 cm | 10–40 cm | 40–100 cm | 100–200 cm |
|---|---|---|---|---|---|
| Spring | Temperature | 0.992 | 0.787 | 0.998 | 0.951 |
| Precipitation | 0.999 | 0.682 | 0.975 | 0.987 | |
| Summer | Temperature | 0.736 | 0.620 | 0.289 | 0.401 |
| Precipitation | 0.663 | 0.536 | 0.190 | 0.305 | |
| Autumn | Temperature | 0.999 | 0.985 | 0.999 | 0.999 |
| Precipitation | 0.989 | 0.999 | 0.986 | 0.980 | |
| Winter | Temperature | −0.128 | 0.062 | −0.067 | −0.141 |
| Precipitation | −0.908 | −0.812 | −0.880 | −0.913 |
© 2017 by the authors. Licensee MDPI, Basel, Switzerland. This article is an open access article distributed under the terms and conditions of the Creative Commons Attribution (CC BY) license (http://creativecommons.org/licenses/by/4.0/).
Share and Cite
MDPI and ACS Style
Cai, J.; Zhang, Y.; Li, Y.; Liang, X.S.; Jiang, T. Analyzing the Characteristics of Soil Moisture Using GLDAS Data: A Case Study in Eastern China. Appl. Sci. 2017, 7, 566. https://doi.org/10.3390/app7060566
AMA Style
Cai J, Zhang Y, Li Y, Liang XS, Jiang T. Analyzing the Characteristics of Soil Moisture Using GLDAS Data: A Case Study in Eastern China. Applied Sciences. 2017; 7(6):566. https://doi.org/10.3390/app7060566
Chicago/Turabian StyleCai, Jingze, Yuanzhi Zhang, Yu Li, X. San Liang, and Tingchen Jiang. 2017. "Analyzing the Characteristics of Soil Moisture Using GLDAS Data: A Case Study in Eastern China" Applied Sciences 7, no. 6: 566. https://doi.org/10.3390/app7060566
Note that from the first issue of 2016, this journal uses article numbers instead of page numbers. See further details here.