Article

The Use of the Surface Roughness Value to Quantify the Extent of Supercritical CO2 Involved Geochemical Reaction at a CO2 Sequestration Site

1
Petroleum and Marine Research Division, Korea Institute of Geoscience and Mineral Resources, Daejeon 34132, Korea
2
Department of Earth Environmental Sciences, Pukyong National University, 45 Yongso-ro, Nam-gu, Busan 48513, Korea
3
Department of Architectural Engineering, Pukyong National University, 45 Yongso-ro, Nam-gu, Busan 48513, Korea
4
Department of Energy Resources Engineering, Pukyong National University, 45 Yongso-ro, Nam-gu, Busan 48513, Korea
*
Author to whom correspondence should be addressed.
Appl. Sci. 2017, 7(6), 572; https://doi.org/10.3390/app7060572
Submission received: 21 April 2017 / Revised: 18 May 2017 / Accepted: 22 May 2017 / Published: 2 June 2017
(This article belongs to the Special Issue The Applications of Supercritical Carbon Dioxide)

Abstract

:
Changes in the physical properties of the supercritical CO2 (scCO2) reservoir rock is one of the most important factors in controlling the storage safety at a scCO2 sequestration site. According to recent studies, it is probable that geochemical reactions influence changes in the rock properties after a CO2 injection in the subsurface, but quantitative data that reveal the interrelationship of the factors involved and the parameters needed to evaluate the extent of scCO2-rock-groundwater reactions have not yet been presented. In this study, the potential for employing the surface roughness value (SRRMS) to quantify the extent of the scCO2 involved reaction was evaluated by lab-scale experiments. For a total of 150 days of a simulation of the scCO2-sandstone-groundwater reaction at 100 bar and 50 °C, the trends in changes in the physical rock properties, pH change, and cation concentration change followed similar logarithmic patterns that were significantly correlated with the logarithmic increase in the SRRMS value. These findings suggest that changes in surface roughness can quantify the extent of the geochemical weathering process and can be used to evaluate leakage safety due to the progressive changes in rock properties at scCO2 storage sites.

Graphical Abstract

1. Introduction

Various CO2 capture and sequestration technologies have been developed to reduce CO2 emissions and the International Energy Agency (IEA) has announced that CO2 capture and sequestration (CCS) technology will cover 19% of the total CO2 reductions by 2050 [1,2,3,4,5,6]. Among them, geological sequestration will be deeply considered to reduce CO2 emissions at low cost [7,8,9,10,11]. Several CO2 sequestration projects in the world have been successfully conducted [12,13,14,15], but some CO2 injection sites were found to be impractical, even though their site characterization, such as geophysical exploration, geo-structural investigation, and drilling core analysis, was thoroughly conducted [16,17]. For successful CO2 sequestration in heterogeneous subsurface formations, the practicability of the CO2 sequestration process based on storage capacity and leakage prevention should be guaranteed before the field scale CO2 injection. The previous research over the last two decades revealed that the injection of supercritical CO2 (scCO2) into a reservoir rock initiates a geochemical reaction in the scCO2-rock-groundwater system, but it does not threaten the storage safety of CO2 reservoir formations because of its long reaction time [18,19,20]. However, in the past five years, several studies have cast doubts on whether the rate of the scCO2-rock-groundwater reaction is too slow to affect the change of CO2 storage capacity and leakage safety after scCO2 injection [21,22,23,24,25,26].
If there exists the possibility of a fast reaction, and thus the geochemical reaction is one of the more important parameters controlling CO2 storage and leakage safety, then a quantitative understanding of the scCO2-rock-groundwater reaction occurring in the CO2 storage site is essential for successful CO2 sequestration in the subsurface [27,28,29]. Over the last decade, meaningful information about what kinds of geochemical reactions dominate in CO2 sequestration sites have been qualitatively acquired through laboratory scale experiments, but most of these have been limited to qualitative investigations such as compositional and/or mineralogical analyses [30,31,32,33,34,35,36]. These results verified only the occurrence of a geochemical reaction at the CO2 sequestration system, and they were limited in providing the extent of the reaction or discovering its influence on sequestration capacity, such as leakage or storage capacity, because it is difficult to reenact the geochemical reaction occurring at a CO2 storage site and also to determine the interrelationship between the geochemical reaction and the other property changes of the reservoir rock [37,38,39]. It is now more important than ever to search for the available CO2 reservoir sites in the subsurface locations and to prevent the accidental leakage of CO2 originating from a geochemical reaction. However, the development of a new quantitative parameter for evaluating the scCO2 involved geochemical reaction in sequestration conditions has almost never been attempted in previous studies [40,41].
The present study focuses on the quantitative investigation of the scCO2 involved reaction occurring at CO2 storage sites and provides the potential use of changes in surface roughness of the CO2 reservoir rock to quantify the extent of the scCO2-reservoir rock-groundwater reaction. The interrelationship among property changes originating from the geochemical reaction is also bound to be revealed by the laboratory scale experiments. This is a novel approach to developing a quantitative technique that uses the surface roughness to investigate the scCO2-rock-groundwater reaction and also to evaluate the long-term rock property changes originating from the geochemical reaction in scCO2 storage conditions. The results of this study will provide ideas for the development of a method for safety estimation based on the extent of the geochemical reaction in a CO2 sequestration site and of a future plan for strengthening the successful confrontation technology for CO2 leakage.

2. Materials and Methods

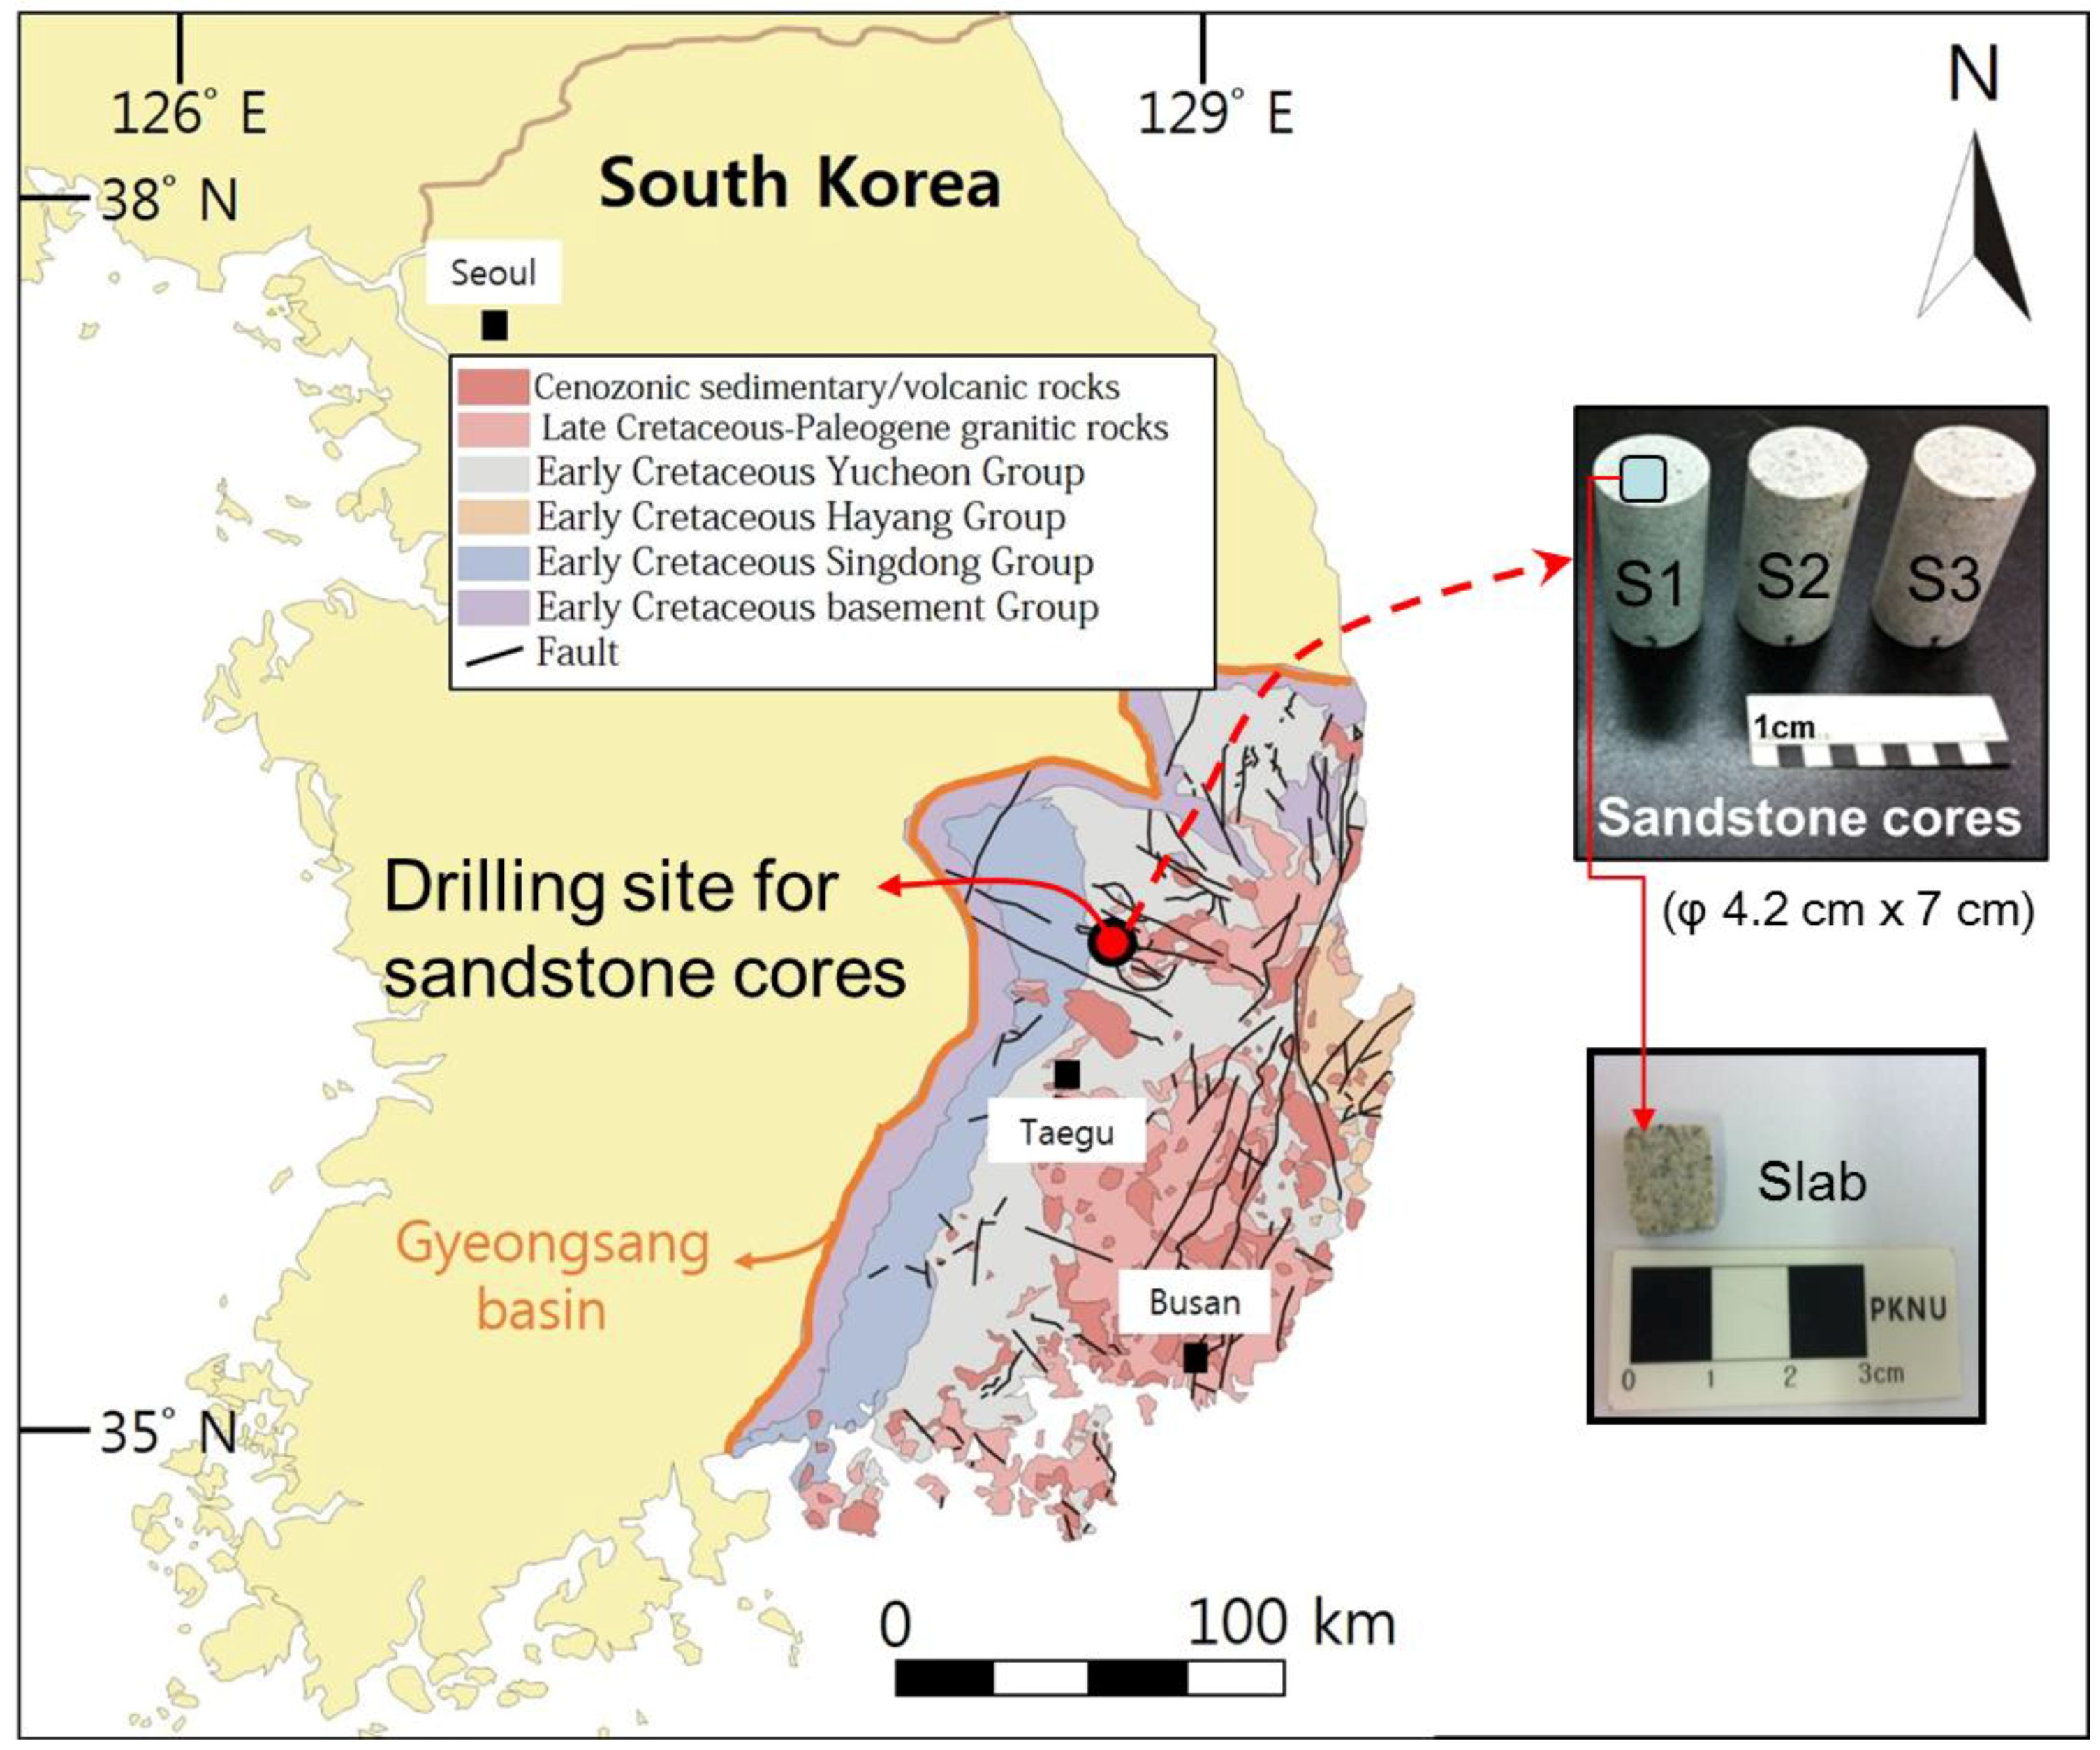
2.1. Sandstone Cores and Groundwater Samples

Currently, South Korea is ranked seventh in the world in terms of CO2 emissions, having produced a total of 739 megatons in 2011 alone [42], and the Korean government currently plans to inject more than 100 megatons of CO2 into the subsurface by 2020 [43]. From a previous study, the Sindong lithostratigraphic group of the Gyeongsang basin was considered as an available CO2 storage site on the Korean peninsula (CO2 storage capacity of 1011 megatons) [44]. In 2014, the Gyeongsang basin was announced as one of the candidate sites for a scCO2 storage test in Korea, and continuous drill cores (4.2 cm of average diameter) were collected at two drilling sites (average 1200 m in depth). From the property analysis of these cores, three coarse sandstone formations (850, 1000, and 1050 m in depth) with medium porosity (porosity of 7.0%–9.8%) and moderate thickness (total of 100 m) were found, and their sandstone cores (S1, S2, and S3) were used for this study. A total of nine consolidated cylindrical sandstone cores (each 4.2 cm in diameter and 6–7 cm in length) without cracks or fractures were used to measure the physical and geochemical property changes of the cores during the scCO2-water-core reaction. For each sandstone core, several thin slabs (1 × 1 × 0.2 cm each) were additionally prepared to observe the surface roughness change and the cation concentration change for the whole reaction time. The geological map around the drilling site, the sandstone core, and the slab used for the experiment are shown in Figure 1. The mineral composition of each core was identified by modal analysis and more than 500 locations on each thin section surface were observed using the point counter attached in a polarizing microscope.
The results of the modal analysis for the three cores (S1, S2, and S3) reveal that the sandstone surface is mostly composed of quartz, perthite, plagioclase, calcite, muscovite, biotite, and chlorite, and their average proportions were 47.4%, 18.5%, 10.5%, 5.4%, 1.7%, 1.5%, and 1.4%, respectively (Table 1). The surface roughness changes for these seven minerals were specifically targeted during the experiment.
Groundwater was sampled from a monitoring well near the drilling site (>400 m in depth) and analytical results for the groundwater quality are shown in Table 2. The concentrations of Na+ and Cl were higher than those of fresh water, suggesting the groundwater was mixed with sea water below the drilling site.

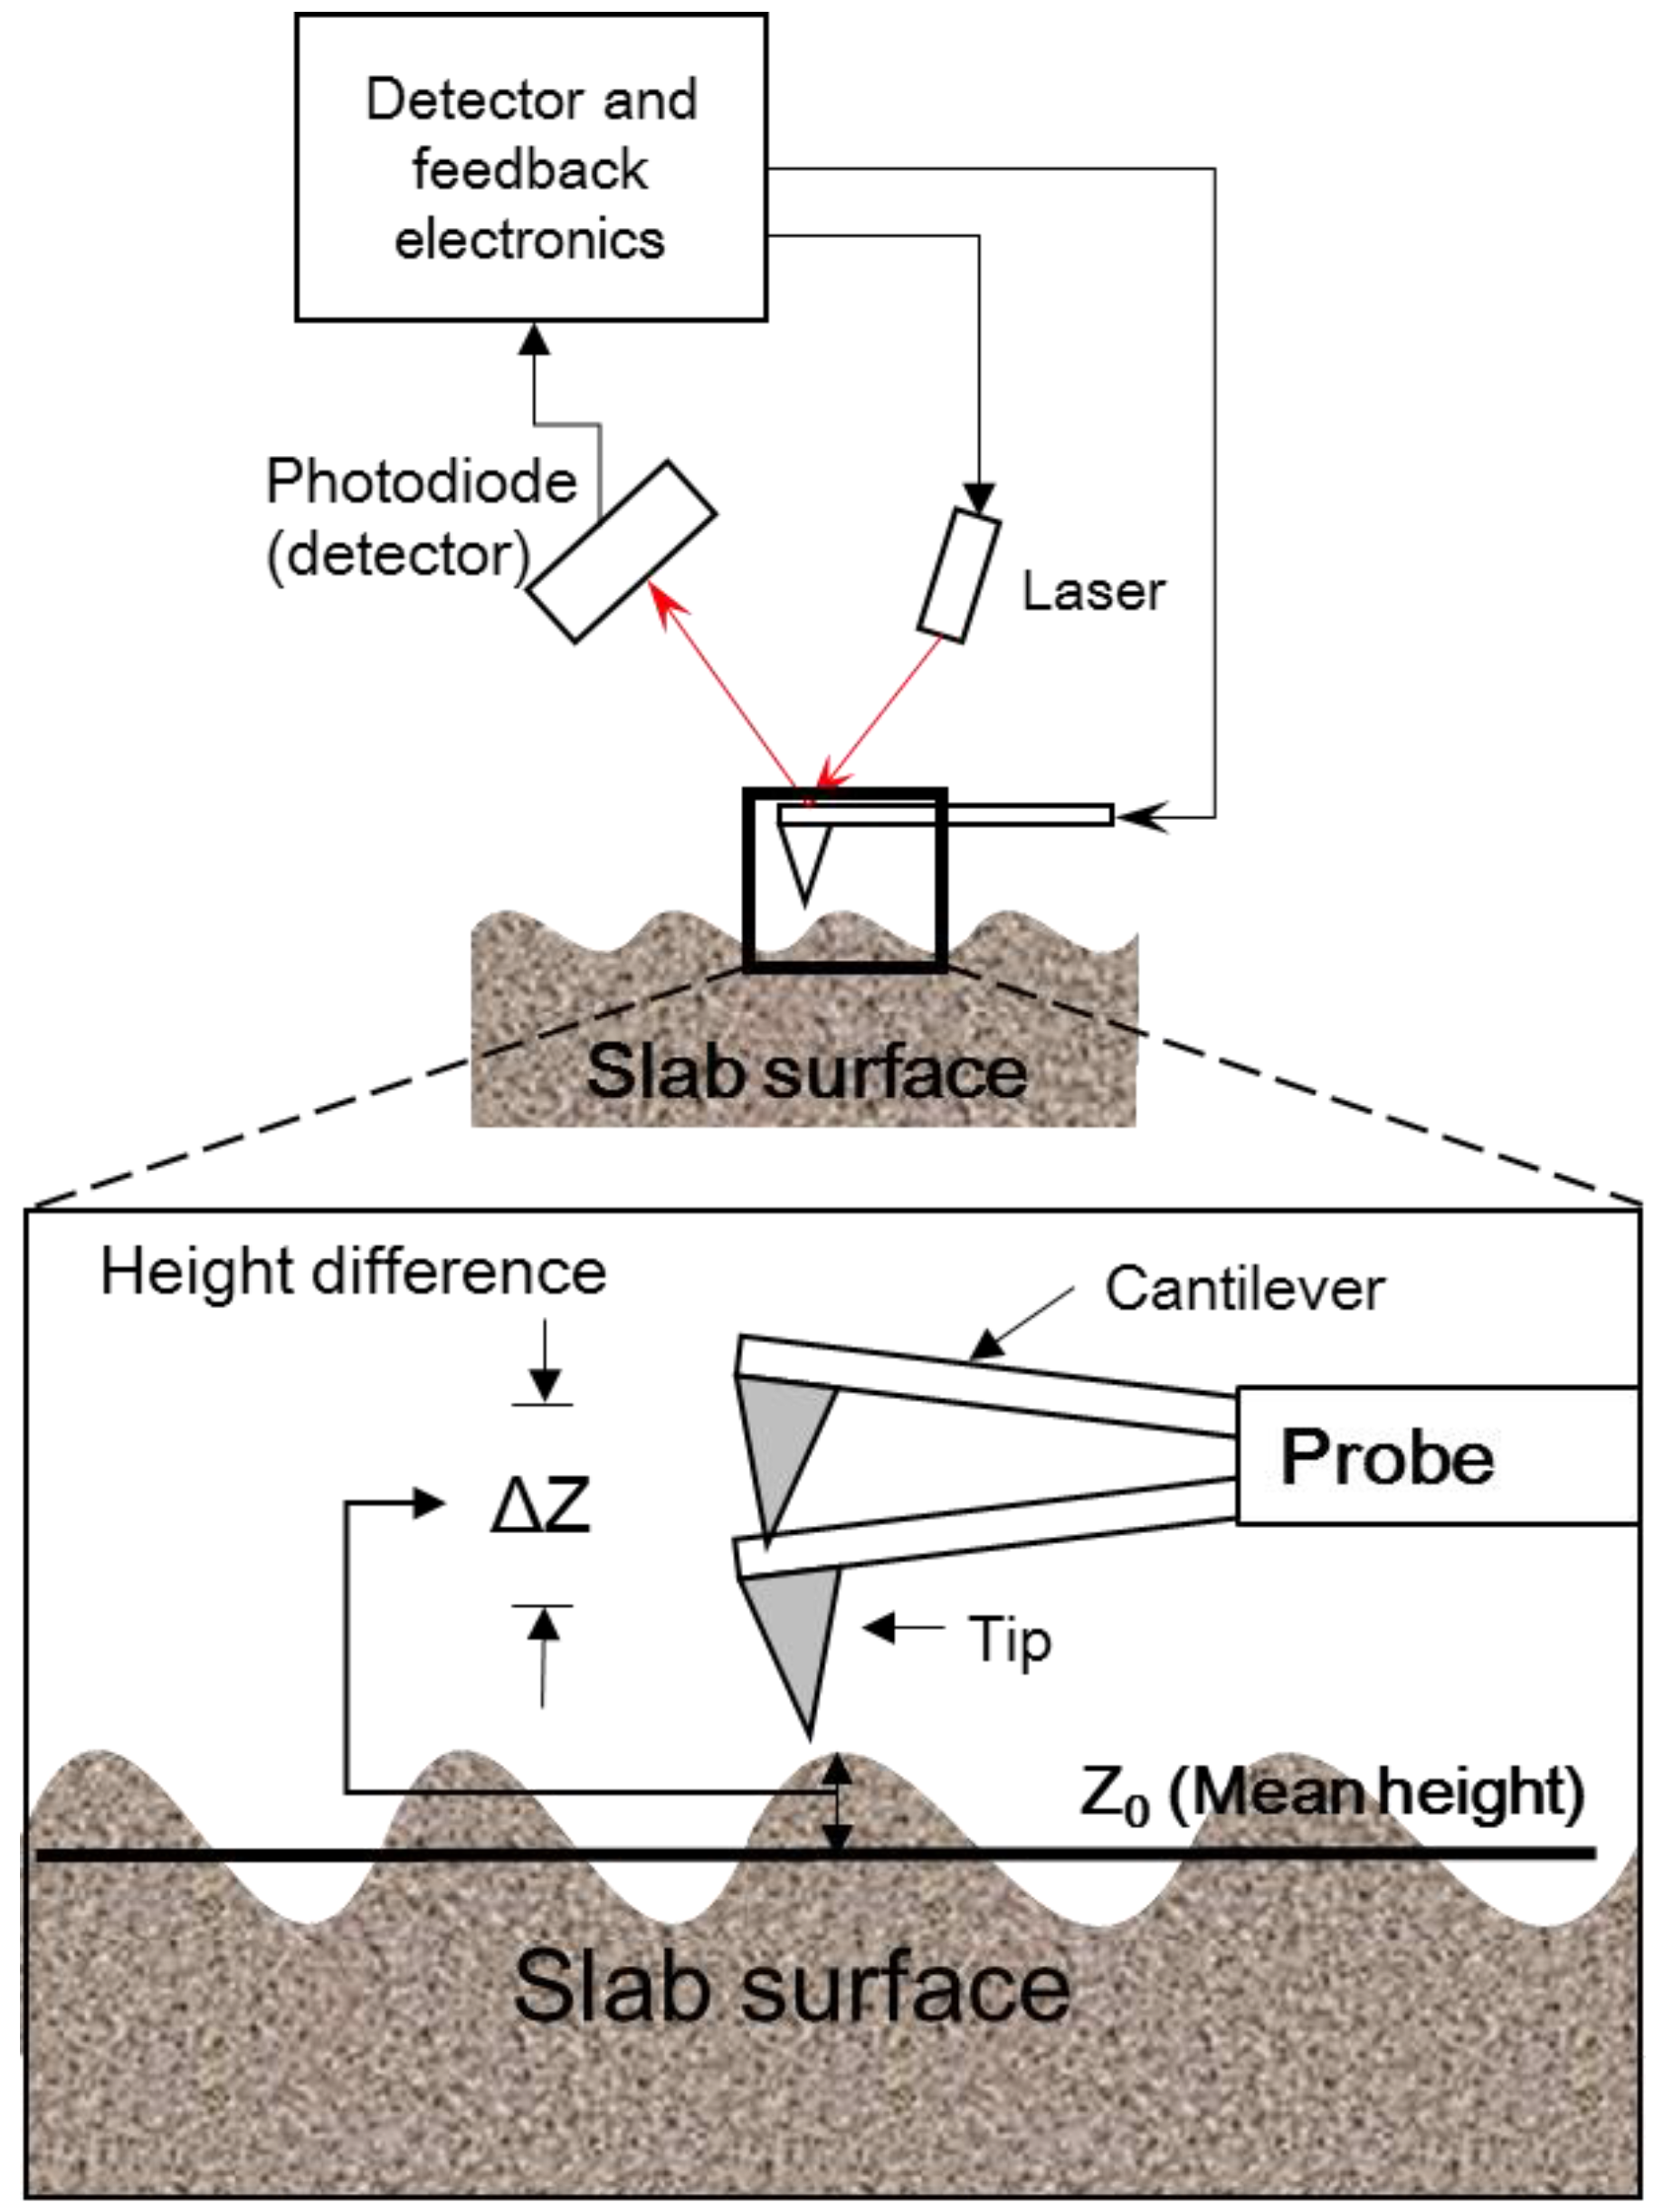
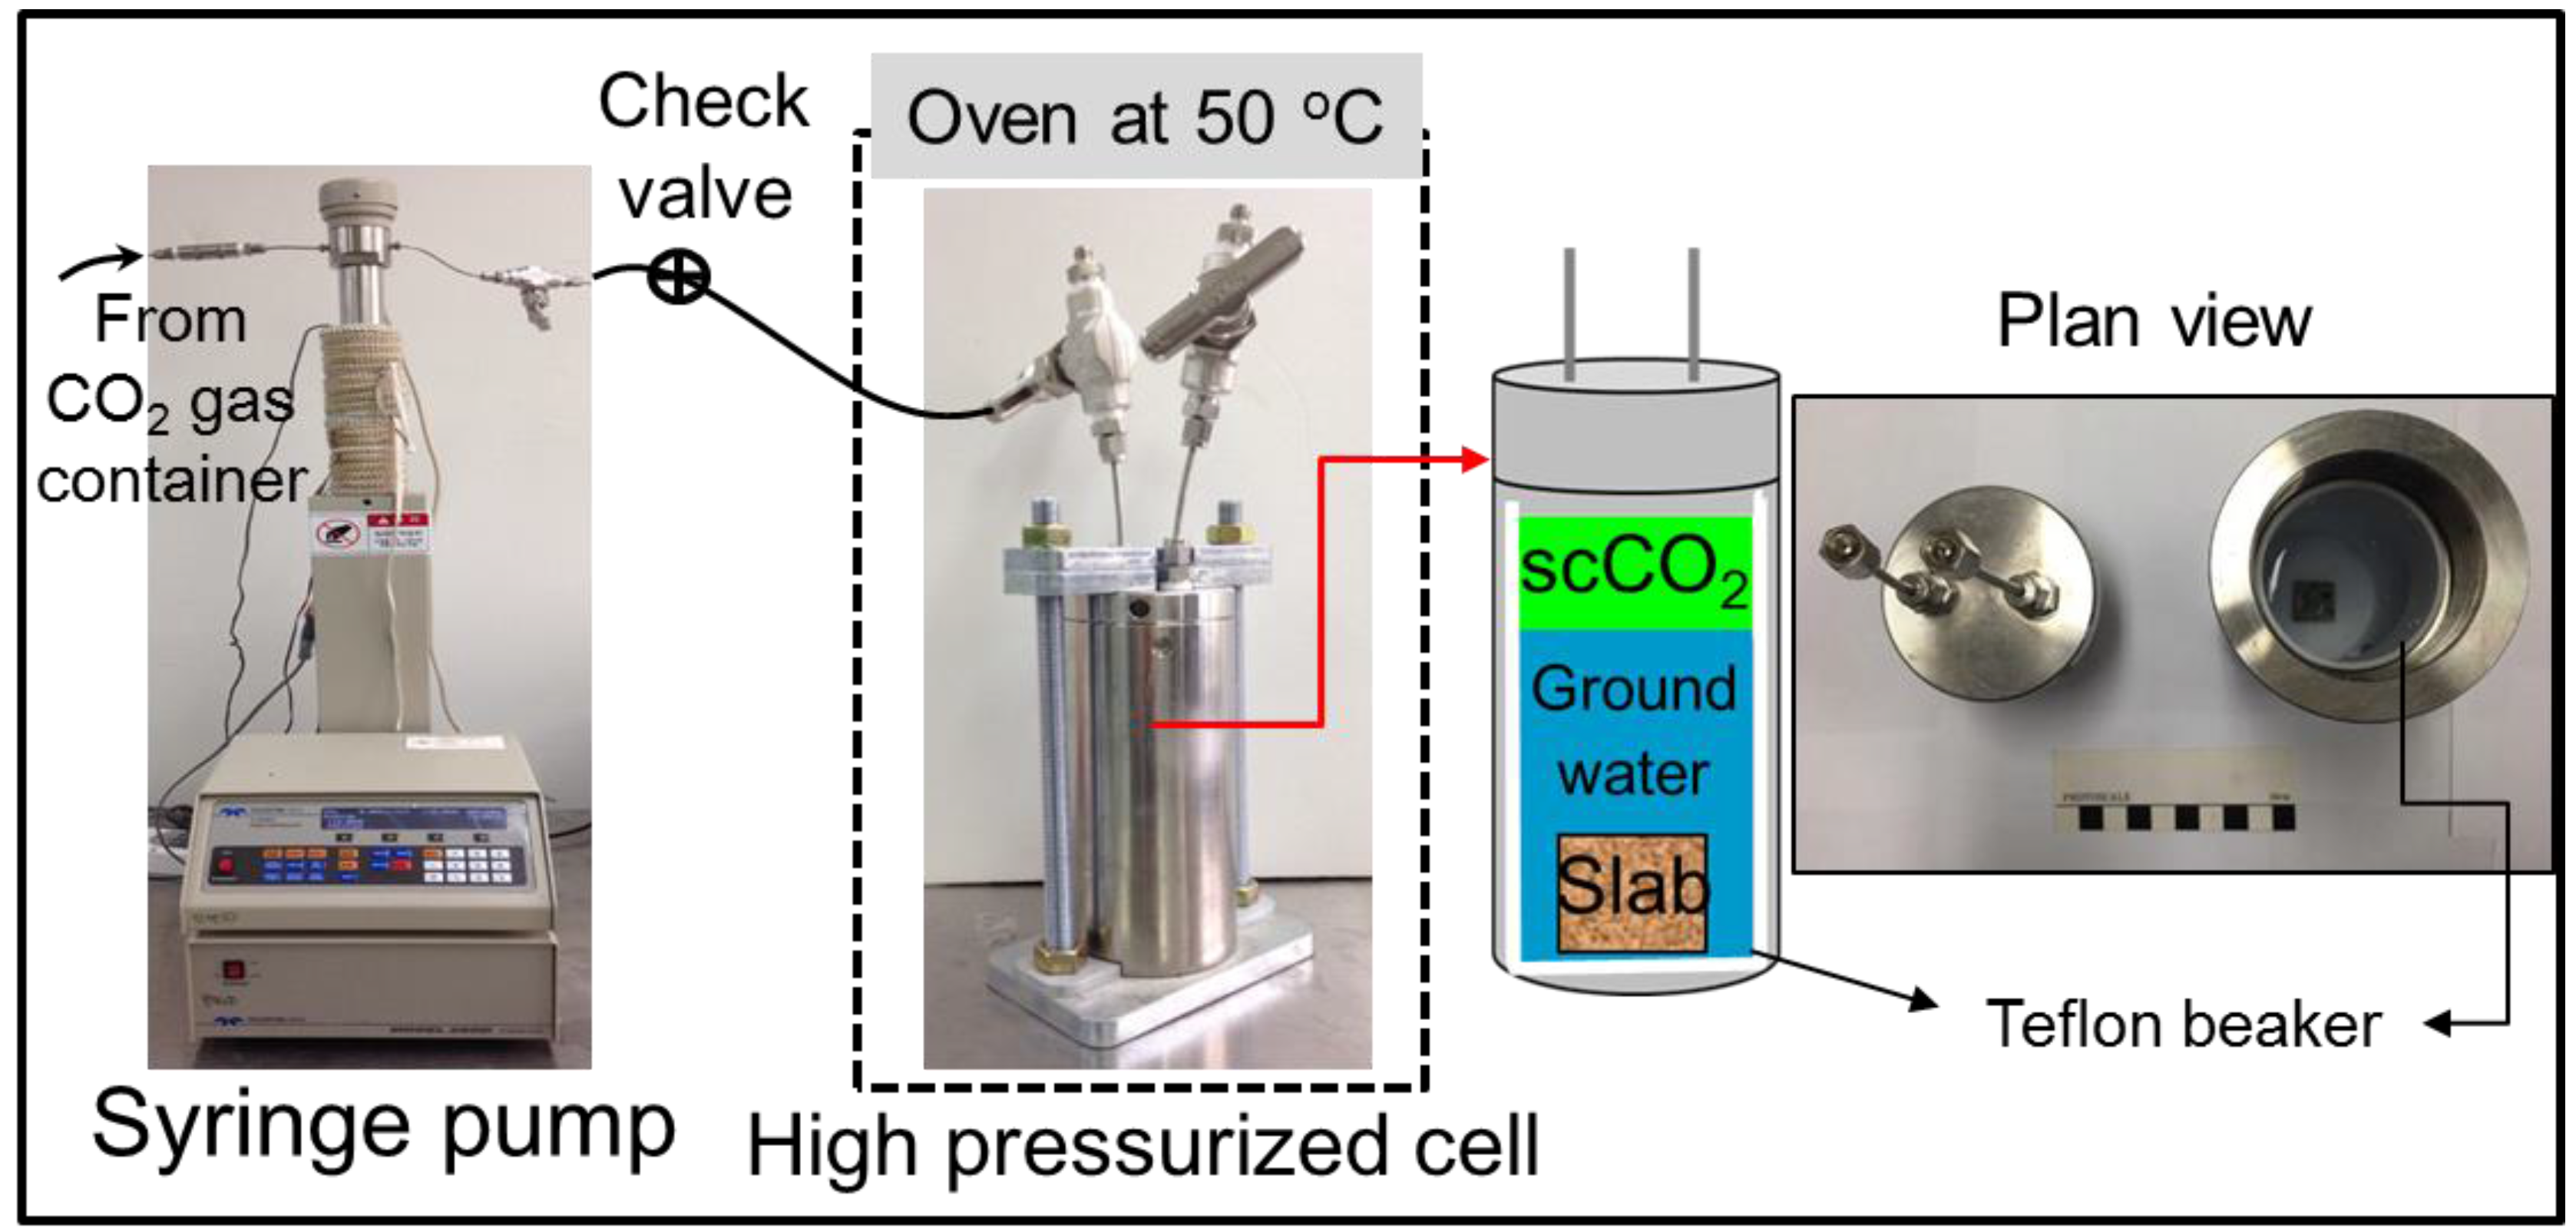
2.2. Measurement of the Surface Roughness Value for Sandstone Slabs

The identification of the scCO2-rock-pore water geochemical reaction at scCO2 sequestration conditions has been studied by various analytical processes. These approaches include qualitative processes mostly depending on visual inspection or compositional analysis using SEM/EDS (Scanning Electron Microscope/Energy Dispersive X-Ray Spectrometer; VEGA II LSU, Tescan, Brno, Czech Republic), XRD (X-Ray Diffractometer; X′Pert-MPD, Philips, Eindhoven, The Netherlands), and XRF (X-Ray Fluorescence Spectrometer; XRF-1800, Shimadzu, Kyoto, Japan) [45,46]. However, quantitative information acquired from this study was very limited, such as in mineral composition transfer and structural change [47,48]. To supplement these limitations, the surface roughness change of the rock surface during the scCO2-sandstone-groundwater reaction was investigated, and the feasibility of its use as a parameter to evaluate the geochemical weathering process was verified by comparing the physical property change of the sandstone with the cation concentration change in groundwater during the geochemical reaction.
To observe the surface roughness change of the slab surface over the reaction time, one surface of each slab prepared from the sandstone core was polished with diamond-coated paper and the other slab surface was attached to a glass slide plate with epoxy resin. After being washed with methanol, each thin slab was placed at the bottom of a Teflon beaker, which was fixed inside a high pressurized stainless steel cell (with a capacity of 150 mL), and 100 mL of groundwater was poured into the Teflon beaker. The inside of the cell was pressurized up to 100 bar using a high-pressure syringe pump (Isco-D260, TELEDYNE ISCO, Lincoln, NE, USA) and the empty space in the cell was filled with scCO2 by a gas flow regulator attached to a high-pressure syringe pump. Each cell was placed in an oven to maintain a constant temperature of 50 °C, which led to a scCO2-rock-groundwater reaction in the cell at scCO2 sequestration conditions. The scCO2-sandstone slab-groundwater reaction in the cell was executed at 100 bar and 50 °C for 150 days and the apparatus of the slab experiment is shown in Figure 2.
According to previous studies related to geochemical reactions, the weathering process of the reservoir rock after scCO2 injection was closely related to the surface roughness change of the rock because dissolution and precipitation occur simultaneously and lead to surface roughness change until the geochemical system turns back to a status of equilibrium [22,49]. To observe the surface roughness change of sandstone slabs during the geochemical reaction, seven minerals, quartz, perthite, plagioclase, muscovite, calcite, biotite, and chlorite for each slab surface were determined using a reflecting microscope (Nikon eclipse LV100N, Nikon, Fukasawa, Japan), and three locations for each mineral were randomly selected to acquire 3-dimensional surface images. Each slab was taken out from the cell and dried in an oven at certain reaction time intervals. Then, a total of 262,144 points (512 × 512) around each selected location (the certain surface domain of 50 × 50 µm) of the slab were scanned by an SPM (Scanning Probe Microscope; Icon-PT-PLUS, Bruker, Bremen, Germany). The SPM included a cantilever tip connected to a probe with the laser beam, which was used to measure the height difference at each point and at the standard level (mean height), in nanometers, finally acquiring a 3-dimensional surface image profile for the certain surface domain of a slab (Figure 3). The information acquired from SPM analysis is useful not only for the surface image but also for more quantitative parameters to evaluate the roughness degree of the surface [50,51]. Several surface roughness parameters have been developed, and in this study, a surface roughness value (SRRMS) was used to reduce all of the information in the 3-dimensional surface image to a single number representing the degree of the surface roughness [52,53]. For this study, the SRRMS for the specific surface domain on each slab was calculated from the RMS (root mean square), for which the data can be acquired by measuring the height difference between the standard level (Z0 is the mean height from all points in a surface domain) and the height of each point in a domain [52].
The following equation was used to calculate the SRRMS (unit: µm) for a specific surface domain:
S R RMS = 1 n     i = 1 n   Δ z i 2  
where n is the total point number (262,144) in the surface domain, and Δzi is the vertical height difference from the mean height (Zo) to the ith point in the domain [54].
The degree to which the initial surface roughness differed from the reacted surface roughness at a certain reaction time was determined by comparing their SRRMS values. The interrelationship between the degree of the surface roughness and the extent of the geochemical reaction was investigated and the potential application of SRRMS to quantify the weathering process originating from the scCO2-sandstone-groundwater reaction was also evaluated by the experiment. The SRRMS values acquired from all minerals′ SRRMS values were plotted at different reaction times, and the trend of SRRMS change was compared with the trend of the physical property change of sandstones and the cation concentration change in groundwater, which verified that the surface roughness change reflects the extent of the geochemical weathering process and the rock property change. To verify that the scCO2-sandstone-groundwater reaction occurs actively, SEM/EDS analyses for the slab surface were performed and the mineralogical transfer and compositional change on the slab surface were investigated. Three milliliters of groundwater were sampled from the cell at different reaction times (maximum of 150 days) for the chemical analysis, and the same amount of groundwater was added into the cell. The pH and the concentrations of six main cations (Al3+, Ca2+, Fe2+, K+, Na+, and Si4+) in the groundwater sample were analyzed via ICP/AES (Inductively Coupled Plasma/Atomic Emission Spectrometer; Optima 7300V, Perkin Elmer, Waltham, MA, USA) and using a pH meter, and they were plotted at different reaction times (0–150 reaction days). The relationship among pH change, cation concentration change, physical property change, and SRRMS change was investigated to verify the feasibility of SRRMS usage as a parameter to quantify the extent of the geochemical reaction.

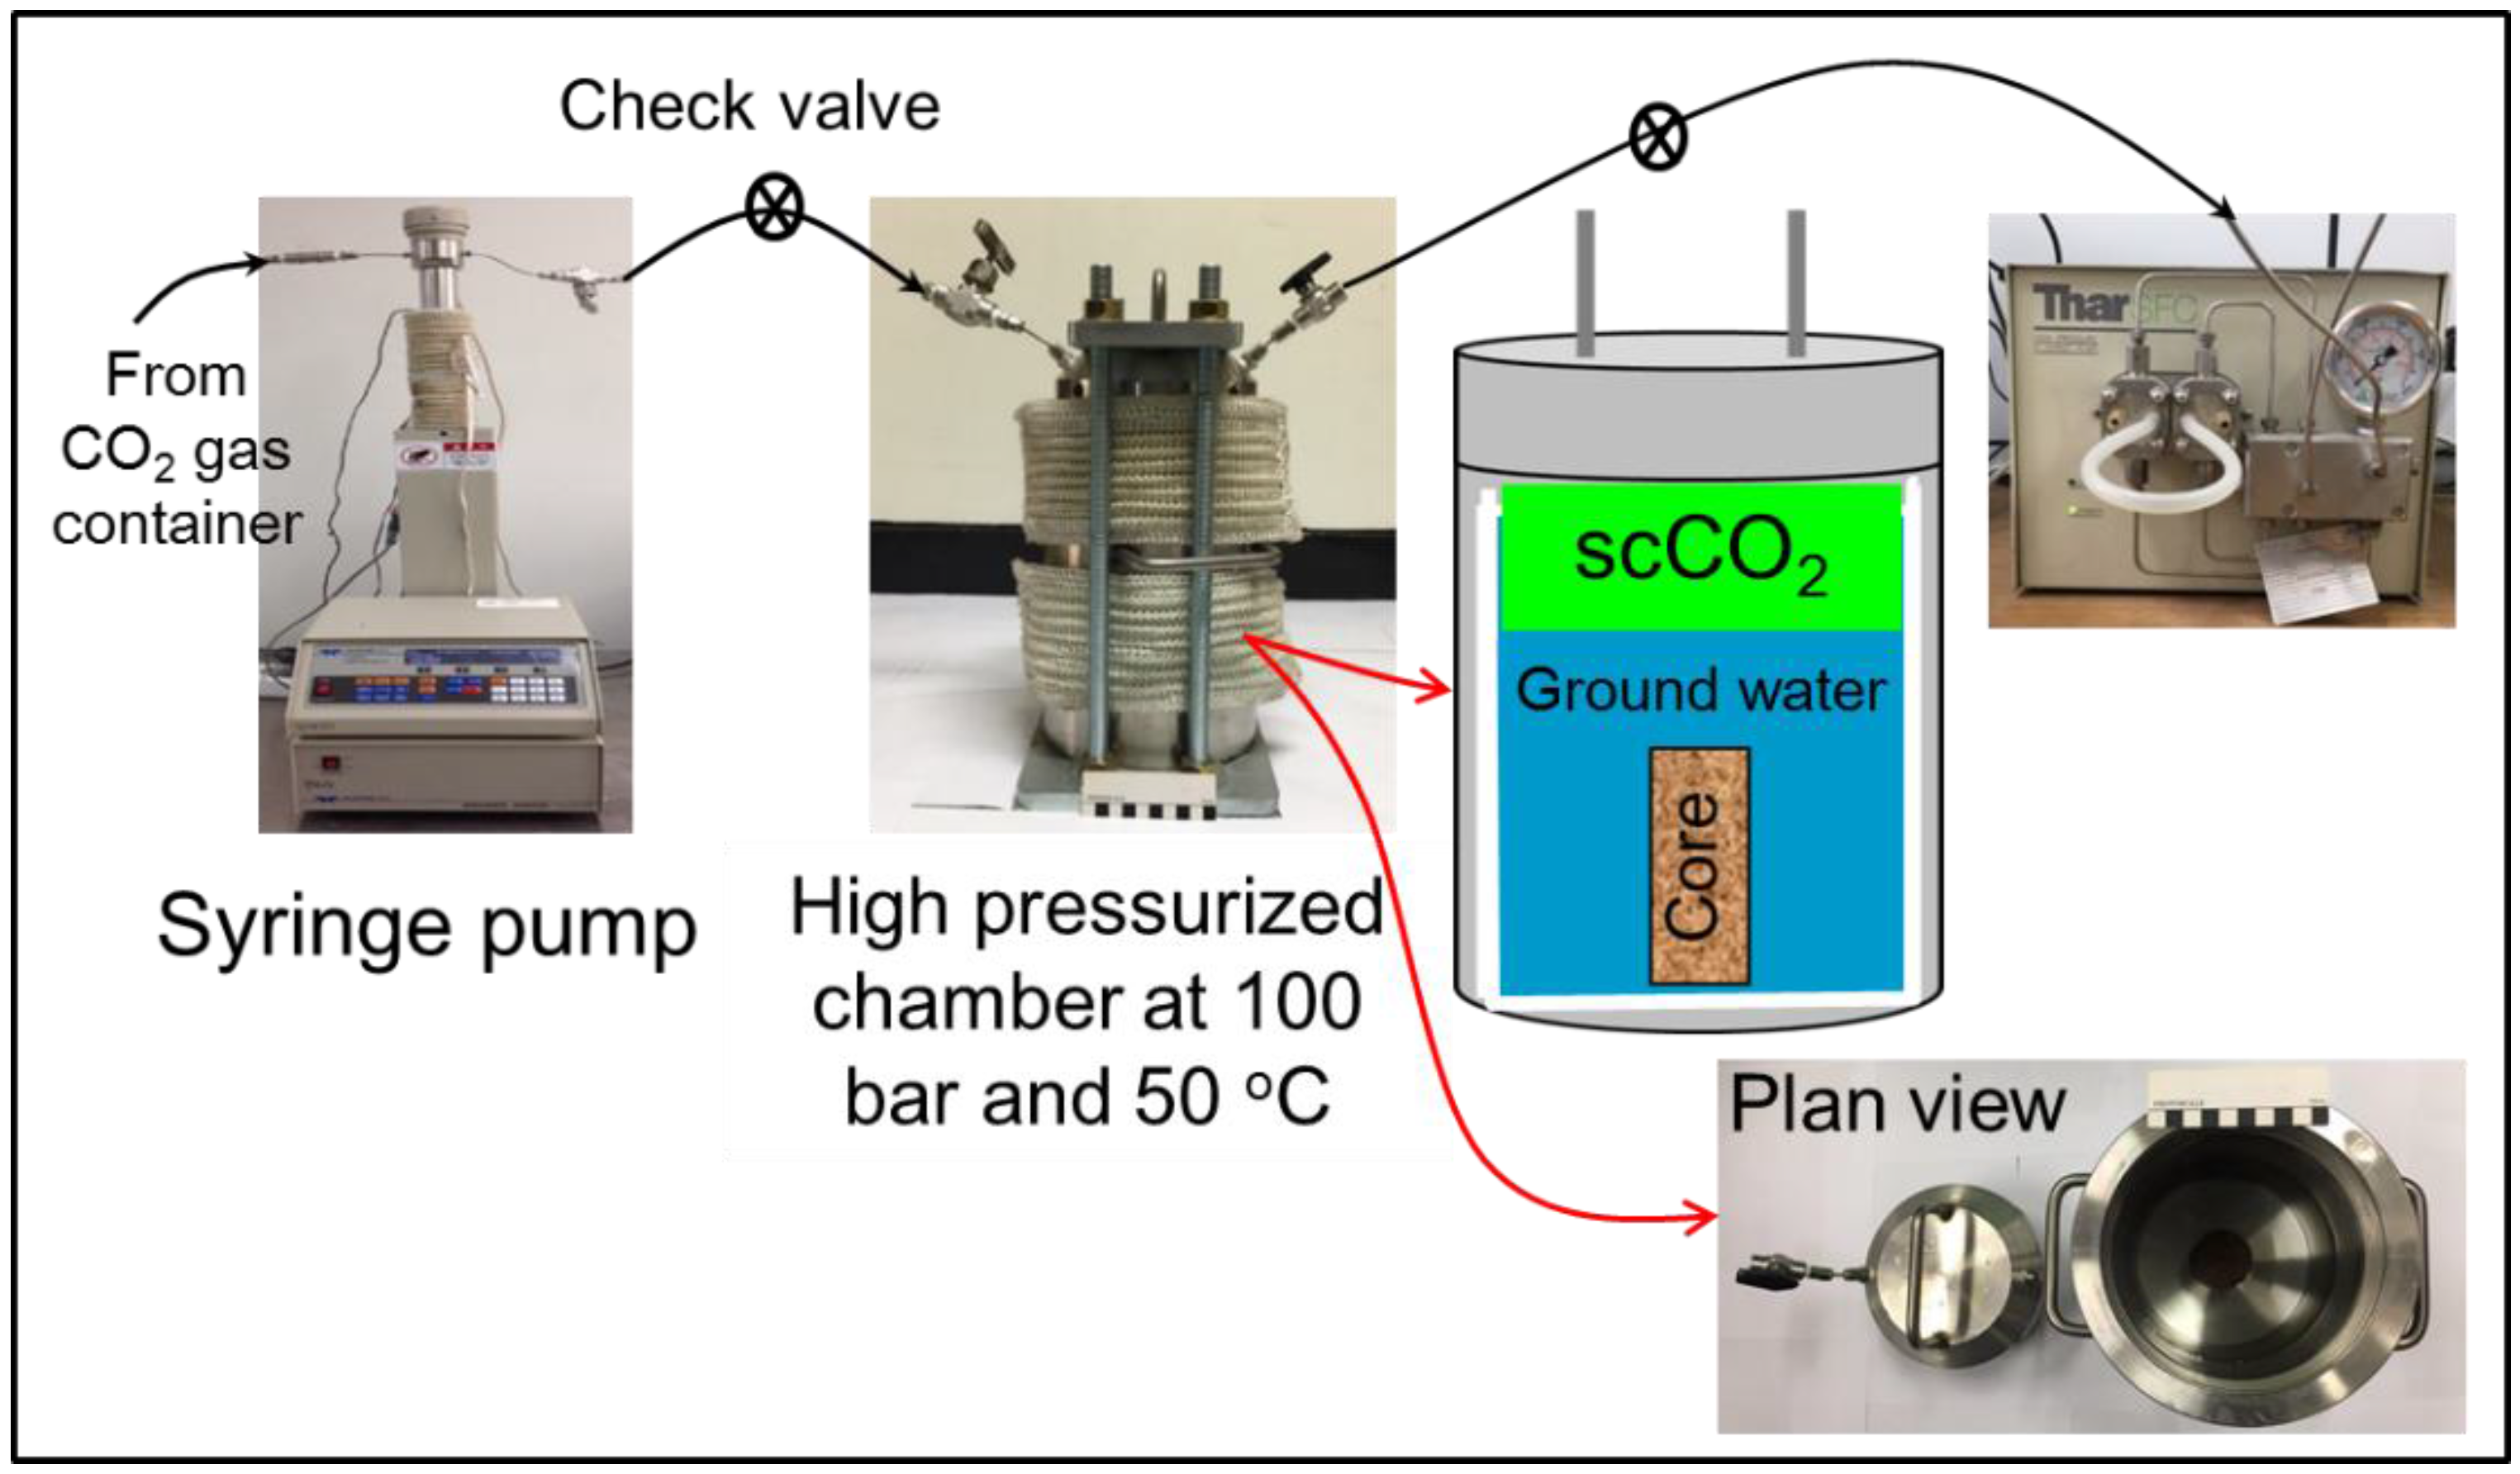
2.3. Measurement of Physical Property Changes for the Sandstone Cores

Several previous studies confirmed that physical properties, such as the porosity, density, and seismic wave velocity of CO2 reservoir rock can change after CO2 injection into the reservoir formation [23,32,38,55]. However, it has not been clearly proved what the main reason is for the property change of the reservoir rock and how the change proceeds so rapidly. It is important to quantify the extent of the rock property change because it can affect both leakage safety and CO2 storage capacity of the reservoir. Changes in porosity, density, and Primary/Secondary (P/S) seismic velocity for nine sandstone cores were measured at different scCO2-core-groundwater reaction times, and the results were compared with those of the SRRMS results. To quantify the physical property changes of three sandstones (S1, S2, and S3) due to the geochemical reaction, each core (three cores for each sandstone) was placed in a large stainless steel chamber (1.5 L of capacity), and 1 L of groundwater was added at 100 bar and 50 °C. Then, scCO2 was injected into the chamber by a high-pressure syringe pump to fill the empty space of the chamber. The inside pressure of the chamber was maintained at 100 bar by a back-pressure controller and the chamber was coated with a heating jacket at 50 °C to maintain the CO2 as a super critical fluid during the whole reaction time. After each core was taken from the chamber and dried in an oven, the physical properties of the core were measured at different reaction times (total 150 reaction days). The control experiment without scCO2 in the chamber (zero air instead) was also repeated to separate the effects of scCO2 injection on rock property changes. Dry density, porosity, and seismic velocity of the cores were measured by the “ASTM/C97” test, “ASTM/C97M-09” test, and ”ASTM/D2845-08” test referred from the American Society of Testing Materials. A more detailed procedure for the core experiment can be found in [54]. The property values for the three sandstones vs. reaction time were plotted and their changes were also compared with those of SRRMS and the cation concentration in groundwater. The schematic of the core experiment to measure the physical property changes of sandstone is shown in Figure 4.

3. Results and Discussion

3.1. Measurement of the Surface Roughness Value for the Sandstone Slabs

Three-dimensional SPM surface images of the sandstone slab before and after the reaction confirmed that the serious surface roughness change occurred rapidly by the scCO2-sandstone-groundwater reaction (Figure 5). As seen by comparison with the initial surface, the polished surface of three major minerals (quartz, plagioclase, and biotite) transformed into a bumpy surface at 120 reaction days, suggesting that the weathering processes such as dissolution and precipitation actively occurred on the mineral surfaces of the S1 sandstone, directly increasing the surface roughness. SPM analysis of the calcite surfaces for the sandstone slabs was impossible because the calcites were perforated or seriously damaged by dissolution within 30 reaction days. Results of the SPM image analyses confirmed that the scCO2-groundwater-sandstone reaction directly resulted in a surface roughness change of the sandstones.
The SRRMS values for three different locations of three minerals for the three sandstone slabs were used to estimate the extent of the surface weathering process of the sandstone at different reaction times. A total of nine SRRMS values for each sandstone slab at a certain reaction time and their average value for each sandstone (S1, S2, and S3) are shown in Table 3 and all the SRRMS values are plotted in Figure 6. In the case of the S1 slab, the average SRRMS of quartz increased from 0.573 to 1.293 µm within 30 reaction days, and the rate of the change became gradually stable after 60 days (Table 3). The average SRRMS of plagioclase and biotite also increased from 0.344 and 0.772 µm to 1.905 and 1.485 µm, respectively, within 30 days, and their SRRMS values gently increased after 60 days. The trends of the SRRMS change for the S2 and the S3 slabs were very similar to that for the S1 slab. The results suggest that the surface roughness increased actively at the early reaction stage, but the change in roughness stabilized after a few months of reaction.
Figure 6 shows the average SRRMS for the three sandstones at different reaction days, comparing SRRMS with the control slab (S1 slab reacted with only groundwater). The increase in the average SRRMS for the S1 slab with only groundwater was negligible for 120 reaction days (only a 2.8% increase). However, the average SRRMS for the S1 slab with scCO2 and groundwater increased by 2.5 times during 120 reaction days and 4.4 and 3.5 times for the S2 and the S3 slab, respectively. For all three sandstones with the scCO2 and groundwater reaction, the average SRRMS increased precipitously for 30 days of the reaction. After 60 days of the reaction, the SRRMS increase became less severe, suggesting that no more serious increase in surface roughness occurred. For quantitative analysis of the surface roughness change for the three sandstones (S1, S2, and S3), the curve fitting results for their SRRMS values using the logarithmic Equation (2) are delineated in Figure 6:
S R RMS   ( t ) = a ln ( t ) + b
where t is the reaction time (day); a is the rate constant of the surface roughness change; and b is the intercept constant [54]. The r-square values for all fitted curves are higher than 0.83 (average of 0.891 in Figure 6), indicating that the SRRMS change follows a well-defined logarithmic pattern.
The pH of the groundwater decreased to 5.3 due to the dissolved scCO2, which led to the dissolution of the sandstone slab in groundwater, but it became stable after 60 reaction days, suggesting that the amount of hydrogen ions in the groundwater increased due to the dissolution of CO2 at an early stage, but the pH levels remained stable due to the buffering of dissolved ions with the increase of the reaction time (within 90–120 days). The trend of the pH decrease in the groundwater vs. the reaction time was also very similar to that of the SRRMS increase of the slabs (the logarithmic decrease (or increase) pattern in Figure 6), indicating that the geochemical weathering process of the sandstone reservoir was very active in the early CO2 injection time but stabilized within a few months. If the trend of the scCO2 involved geochemical reaction is similar to that of the SRRMS, the surface roughness change could be used to quantify the extent of the scCO2-rock-groundwater reaction.
In this study, the trend of the dissolved ion concentration change in the groundwater during the scCO2-involved reaction was also compared to the trend of the SRRMS and pH change. The concentration of five cations in the groundwater during the reaction is shown in Figure 7.
The average K+ and Si4+ concentrations in the groundwater increased from 23.3 and 12.4 mg/L to 30.0 and 26.0 mg/L after 30 reaction days, respectively, and were then stabilized by gradually decreasing after 90 days. The results suggest that the concentration of K+ and Si4+ mainly increased by the dissolution of silicate minerals such as K-feldspar and then decreased by the precipitation of secondary minerals, including K+ ions (this is also supported by SEM/EDS analyses in Figure 8 and Figure 9). The average concentration of Ca2+ and Na+ increased from 547.1 and 633.2 mg/L to 663.8 and 692.0 mg/L after 30 days, respectively. However, after 90 days, they gradually decreased to 579.4 and 627.0 mg/L. The results showed that most minerals in the sandstone slab had a tendency to dissolve in the groundwater during the early reaction days (about 30–60 days), but the dissolution became stable after 90 days of reaction, resulting from the secondary precipitations overcoming the continuous dissolution during the geochemical reaction in the cell. The trend of cation concentration change in the groundwater after 30 days was also similar to those of the SRRMS and pH change during the scCO2-sandstone-groundwater reaction, showing an interesting possibility for the use of SRRMS change of the rock surface to estimate the process of the geochemical reaction (Figure 7). From these comparisons of trends, it was concluded that the dissolution process of the CO2 reservoir sandstones was dominant at the early CO2 injection time (less than 60 days), but precipitation also occurred sequentially to decrease the concentrations of dissolved ions and to stabilize the unbalanced geochemical system within a few months after CO2 injection.
To identify the weathering process of the reservoir rock by the scCO2-reservoir rock-groundwater reaction, the surfaces of the S1-1 sandstone slab were analyzed using SEM/EDS before the reaction and after 120 reaction days and their SEM images are shown in Figure 8.
The SEM images show that the slab surface was heavily deformed by the geochemical reaction and the weathering process actively occurred along the existing fractures or mineral boundaries. The crack that existed at the mineral boundaries before the reaction was clearly expanded, and the calcites were perforated by the dissolution during the reaction, suggesting that these geochemical weathering processes can increase the porosity or the permeability of the reservoir rocks (this is discussed in detail in Section 3.2). In contrast, some pre-existing pores on the mineral surface were filled with secondary precipitates after the reaction, and additional precipitation on mineral surfaces such as quartz and biotite also occurred (Figure 8). The typical precipitates created on the S2-1 and S3-1 slab surfaces were analyzed using SEM/EDS after 120 reaction days, where they were determined to be amorphous silicate minerals as well as calcite, halite, and kaolinite, mostly consisting of Si4+, Na+, K+, Ca2+, Al3+, and Fe2+ (Figure 9). These SEM/EDS analyses also indicated that both dissolution and precipitation occur on the sandstone surface due to the weathering process during the scCO2-rock-groundwater reaction, which directly caused the roughness change of the rock surface and which represented the extent of the geochemical reaction over the reaction time. If these experimental results confirm that the SRRMS change is directly proportional to the extent of the geochemical reaction, the trend of the SRRMS change can be used to estimate the progress of the reaction, which mostly results from dissolution and precipitation. If the active dissolution and precipitation of sandstones occur over a short period of reaction time, accompanying the SRRMS and physical property changes when CO2 is injected into the sandstone reservoir, the activity of the geochemical reaction is likely to be an important parameter in determining the optimal CO2 injection site, and further studies will be necessary to conclusively link the extent and influence with leakage safety of CO2 sequestration.

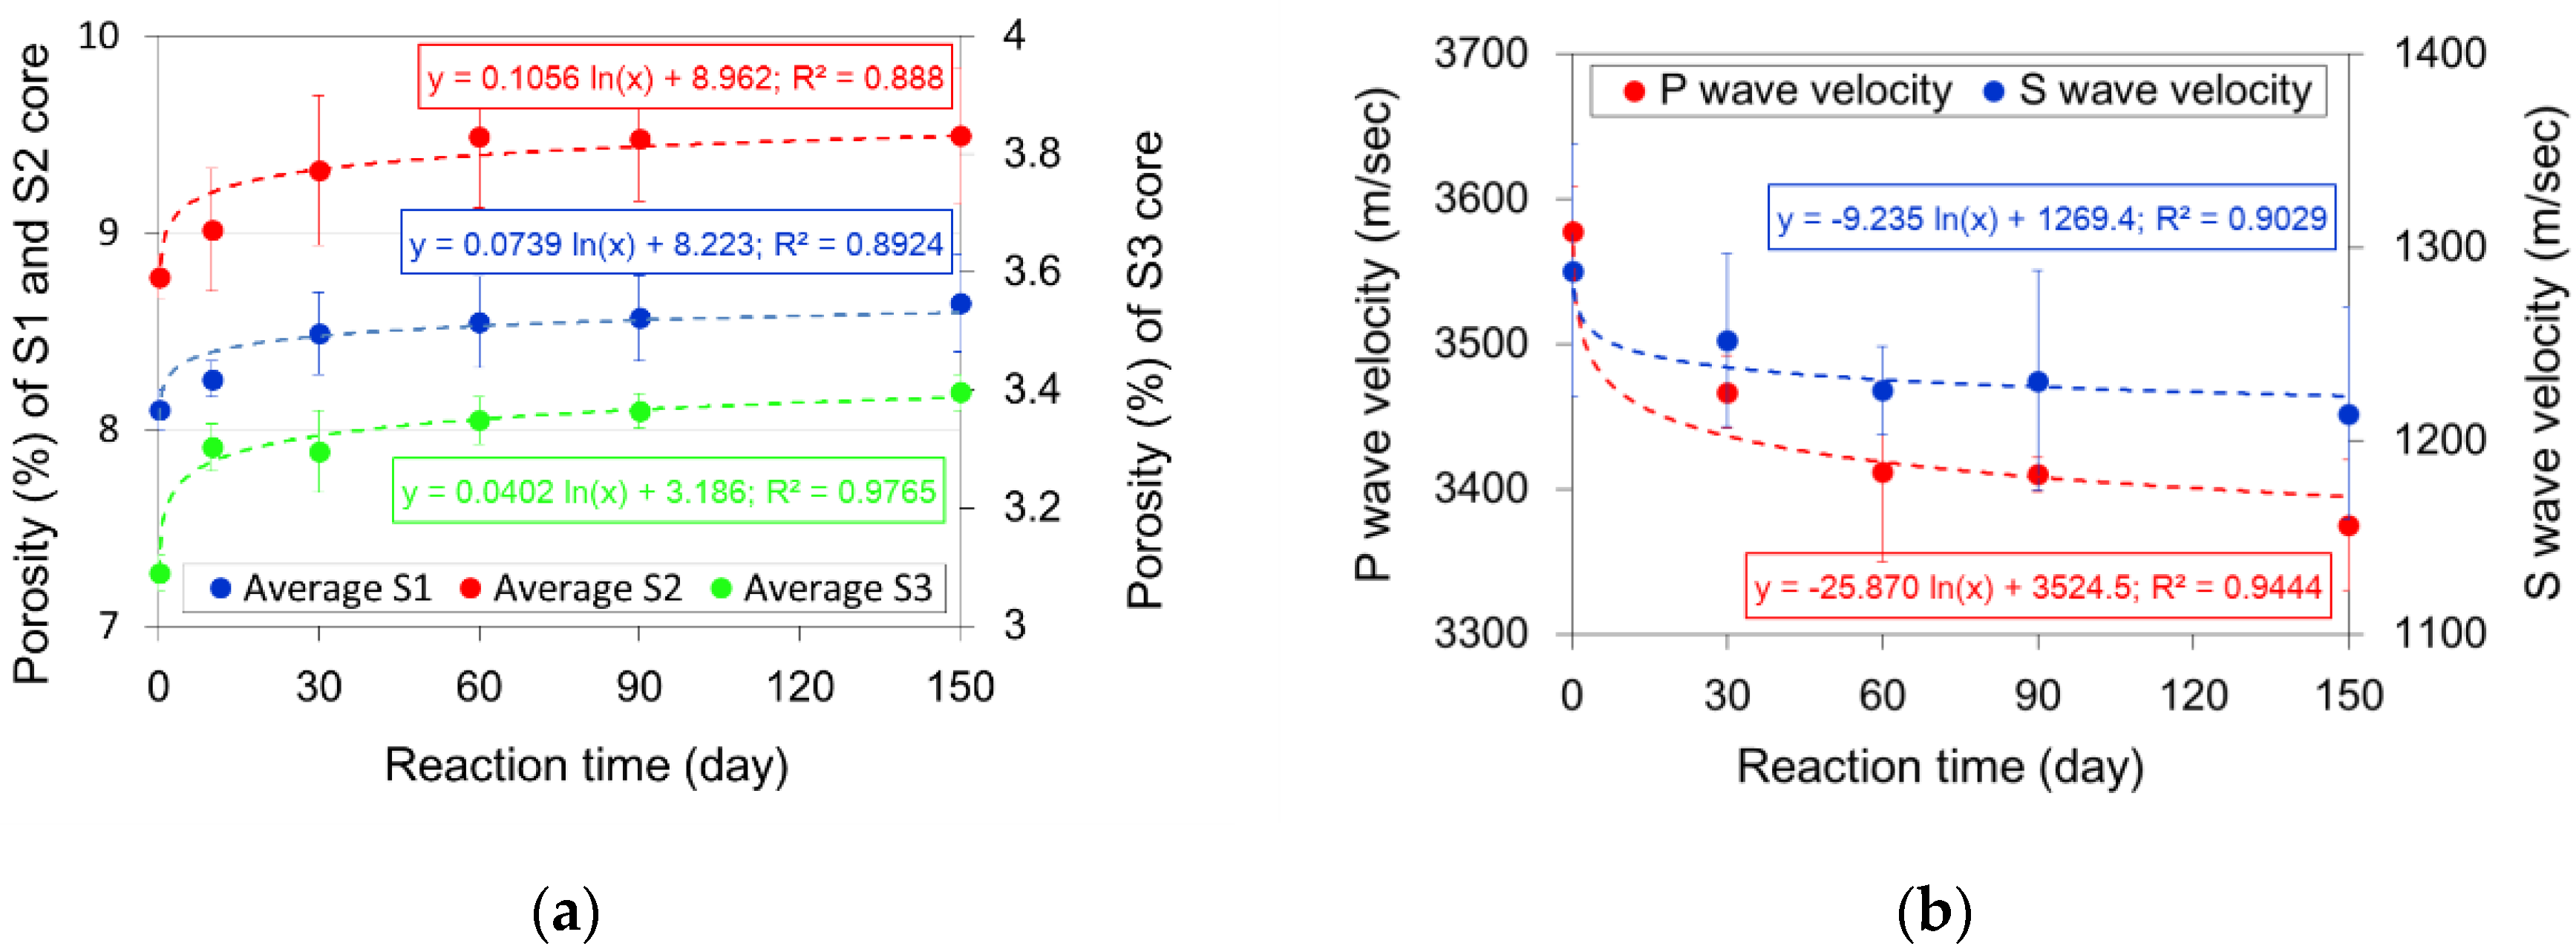
3.2. Measurement of Physical Property Changes for the Sandstone Cores

Table 4 shows the porosity changes for the three sandstones (total nine cores) vs. the reaction time (total of 150 days). The initial average porosity of the S1 sandstone cores was 8.097%, and it increased to 8.642% after 150 reaction days (6.7% increase from the initial value). The average porosity of the S2 and S3 sandstones also increased to 8.2% and 9.9% compared with the initial values, respectively. Even though the porosity increase of the rock cores occurred at the early stage of the reaction because of crack extension and perforation dominated by the dissolution, this was moderated within a few months, showing a logarithmic increase vs. reaction time (Figure 10a). The average dry density of the sandstone cores decreased from 2.390 to 2.384 g/cm3 for 120 reaction days (0.25% decrease from the initial value) (Table 5). The average seismic wave velocities of the sandstones also decreased in a logarithmic manner to 5.67% for P-wave and to 5.75% for S-wave from the initial values for 150 reaction days (Figure 10b and Table 5). The decrease in the dry density and seismic wave velocity for the sandstones was associated with an increase in porosity due to the geochemical weathering process during the reaction, which considers their interrelation characteristics. For a more quantitative analysis of the physical property changes for the nine sandstone cores, the curve fitting results for their property values using the logarithmic Equation (2) are delineated in Figure 10. The r-squared values for all fitted curves are higher than 0.88 (average of 0.921), indicating that the rock property changes follow a well-defined logarithmic increase (or decrease) pattern, which were very similar to those of the geochemical parameter changes such as pH, cation concentration, and SRRMS over the reaction time.
These similarities are evidence demonstrating that the rock property change directly originated from the geochemical reaction with the injected scCO2, which further resulted in the rock surface roughness change and ion concentration change in the groundwater, and also that the surface roughness measurement provides a lot of quantitative information regarding the extent of the geochemical reaction related to the scCO2 in the subsurface. The results showed that the physical properties of the sandstone changed rapidly within a few months due to the geochemical reaction with the injected CO2, but the rate decreased in a relatively short time (a few months), verifying that the physical property change of the CO2 reservoir rocks occurred faster than expected from previous research [56,57,58]. Because the effect of the geochemical reaction on the reservoir rock property change is moderated after a short time, attention to the geochemical reaction at the early CO2 injection stage is very important in preventing leakage and in understanding CO2 sequestration site characteristics from the CO2 storage capacity point of view.

4. Conclusions

During the last decade, one of the main issues for CO2 storage sites has been how the scCO2 involved geochemical reaction affects the storage capacity and the leakage safety after scCO2 injection into the subsurface. Several studies confirmed that the geochemical reaction rate was much faster than expected. Such findings suggested the possibility that the geochemical reaction may generate further changes in the reservoir rock properties. For a specific CO2 storage site, it becomes very important to evaluate whether or not the geochemical reaction is significant enough to threaten the leakage safety of the CO2 sequestration site. Through a novel approach for determining the correlations among changes in SRRMS, physical properties, pH, and dissolved cation concentration in the groundwater during the scCO2-rock-groundwater reaction, this study successfully verified the potential of using SRRMS values as a new parameter to quantify the extent of a geochemical reaction.
For sandstone sites in the Gyeongsang basin of South Korea, the trends of several property changes originating from the scCO2 involved reaction displayed similar logarithmic patterns, which confirmed that the scCO2-sandstone-groundwater reaction occurs actively in the early CO2 injection stage (a few months), but it then becomes stable and further rock property changes are halted. As a result of this study, the CO2 sequestration site in the Gyeongsang basin can be evaluated as an appropriate site from the viewpoint of geochemical safety if a careful observation over the geochemical reaction in the early CO2 injection stage is performed. The use of SRRMS values to evaluate the extent of the geochemical reaction will be available for any other CO2 site in the world to secure leakage safety for reservoirs or formations.

Acknowledgments

This research was supported by a grant (16CTAP–C115166–01) from the Technology Advancement Research Program (TARP) funded by the Ministry of Land, Infrastructure, and Transport of the Korean government. The authors would like to express their gratitude to the anonymous reviewers for their critical comments and advice.

Author Contributions

Minhee Lee and Jinyoung Park conceived and designed the experiments; Jinyoung Park and Kyoungbae Baek performed the experiments and the data analyses; Sookyun Wang and Chul-Woo Chung contributed materials and data interpretation; Minhee Lee wrote the paper.

Conflicts of Interest

The authors declare no conflict of interest.

References

  1. Safdarmejad, M.; Hedengren, D.; Baxter, L. Dynamic optimization of a hybrid system of energy-storing cryogenic carbon capture and a baseline power generation unit. Appl. Energy 2016, 172, 66–79. [Google Scholar] [CrossRef]
  2. Gopan, A.; Kumfer, M.; Phillips, J.; Thimsen, D.; Smith, R.; Axelbaum, R.L. Process design and performance analysis of a Staged, Pressurized Oxy-Combustion (SPOC) power plant for carbon capture. Appl. Energy 2014, 125, 179–188. [Google Scholar] [CrossRef]
  3. Cohen, M.; Rochelle, T.; Webber, E. Optimizing postcombustion CO2 capture in response to volatile electricity prices. Int. J. Greenh. Gas Control 2012, 8, 180–195. [Google Scholar] [CrossRef]
  4. Bachu, S.; Gunter, D.; Perkins, H. Aquifer disposal of CO2: Hydrodynamic and mineral trapping. Energy Convers. Manag. 1994, 35, 269–279. [Google Scholar] [CrossRef]
  5. Gunter, D.; Perkins, H.; McCann, J. Aquifer disposal of CO2-rich gases, reaction design for added capacity. Energy Convers. Manag. 1993, 3, 941–948. [Google Scholar] [CrossRef]
  6. International Energy Agency(IEA). World Energy Outlook 2010. Annual Report; OECD/IEA: Paris, France, 2010. [Google Scholar]
  7. Holloway, S. An overview of the underground disposal of CO2. Energy Convers. Manag. 1997, 3, 193–198. [Google Scholar] [CrossRef]
  8. Klara, M.; Srivastava, D.; Mcllvried, G. Integrated collaborative technology development program for CO2 sequestration in geologic formations-United States Department of Energy R&D. Energy Convers. Manag. 2003, 44, 2699–2712. [Google Scholar] [CrossRef]
  9. Ampomah, W.; Balch, R.; Cather, M.; Rose-Coss, D.; Dai, Z.; Heath, J.; Dewers, T.; Mozley, P. Evaluation of CO2 storage mechanisms in CO2 enhanced oil recovery sites: Application to Morrow sandstone reservoir. Energy Fuels 2016, 30, 8545–8555. [Google Scholar] [CrossRef]
  10. Dai, Z.; Viswanathan, H.; Middleton, R.; Pan, F.; Ampomah, W.; Yang, C.; Jia, W.; Xiao, T.; Lee, S.; McPherson, B.; et al. CO2 accounting and risk analysis for CO2 sequestration at enhanced oil recovery sites. Environ. Sci. Technol. 2016, 50, 7546–7554. [Google Scholar] [CrossRef] [PubMed]
  11. Pan, F.; McPherson, J.; Dai, J.; Jia, W.; Lee, S.; Ampomah, W.; Viswanathan, H.; Esser, R. Uncertainty analysis of carbon sequestration in an active CO2-EOR field. Int. J. of Greenh. Gas Control 2016, 51, 18–28. [Google Scholar] [CrossRef]
  12. Kirste, D.; Haese, R.; Boreham, C.; Schacht, U. Evolution of formation water chemistry and geochemical modeling of the CO2CRC Otway site residual gas saturation test. Energy Proc. 2014, 63, 2894–2902. [Google Scholar] [CrossRef]
  13. Mito, S.; Xue, Z.; Ohsumi, T. Case study of geochemical reactions at the Nagaoka CO2 injection site, Japan. Int. J. Greenh. Gas Control 2008, 2, 309–318. [Google Scholar] [CrossRef]
  14. Neele, F.; Quinquis, H.; Read, A.; Wright, M.; Lorsong, J.; Poulussen, D.F. CO2 storage development: Status of the large European CCS projects with EEPR funding. Energy Proc. 2014, 63, 6053–6066. [Google Scholar] [CrossRef]
  15. Zhang, K.; Xie, J.; Li, C.; Hu, L.; Wu, X.; Wang, Y. A full chain CCS demonstration project in northeast Ordos basin, China: Operational experience and challenges. Int. J. Greenh. Gas Control 2016, 50, 218–230. [Google Scholar] [CrossRef]
  16. Miocic, J.M.; Gilfillan, S.M.V.; Roberts, J.J.; Edlmann, K.; McDermott, C.I.; Haszeldine, R.S. Controls on CO2 storage security in natural reservoirs and implications for CO2 storage site selection. Int. J. Greenh. Gas Control 2016, 51, 118–125. [Google Scholar] [CrossRef]
  17. Pereira, N.; Carneiro, J.F.; Araŭjo, A.; Bezzeghoud, M.; Borges, J. Seismic and structural geology constraint to the selection of CO2 storage sites-The case of the onshore Lusitanian basin, Portugal. J. Appl. Geophys. 2014, 102, 21–38. [Google Scholar] [CrossRef]
  18. Gunter, W.D.; Wiwehar, B.; Perkins, E.H. Aquifer disposal of CO2-rich greenhouse gases: Extension of the time scale of experiment for CO2-sequestering reactions by geochemical modeling. Mineral. Petrol. 1997, 59, 121–140. [Google Scholar] [CrossRef]
  19. Koide, G.; Takahashi, M.; Tsukamoto, H. Self-trapping mechanisms of carbon dioxide. Energy Convers. Manag. 1995, 36, 505–508. [Google Scholar] [CrossRef]
  20. Perkins, E.; Lauriol, C.; Azaroual, M.; Durst, P. Long term predictions of CO2 storage by mineral and solubility trapping in the Weyburn Midale Reservoir. In Proceedings of the 7th International Conference on Greenhouse. Gas Control Technologies (GHGT-7), Vancouver, BC, Canada; 2005; pp. 2093–2096. [Google Scholar]
  21. Kampman, N.; Bickle, M.; Wigley, M.; Dubacq, B. Fluid flow and CO2-fluid-mineral interactions during CO2-storage in sedimentary basins. Chem. Geol. 2014, 369, 22–50. [Google Scholar] [CrossRef]
  22. Kang, H.; Baek, K.; Wang, S.; Park, J.; Lee, M. Study on the dissolution of sandstones in Gyeongsang basin and the calculation of their dissolution coefficients under CO2 injection condition. Econ. Environ. Geol. 2012, 45, 661–672. [Google Scholar] [CrossRef]
  23. Park, J.; Baek, K.; Lee, M.; Wang, S. Physical property changes of sandstones in Korea derived from the supercritical CO2-sandstone-groundwater geochemical reaction under CO2 sequestration condition. Geosci. J. 2015, 19, 313–324. [Google Scholar] [CrossRef]
  24. Pham, P.; Lu, P.; Agraard, P.; Zhu, C.; Hellevang, H. On the potential of CO2-water-rock interactions for CO2 storage using a modified kinetic model. Int. J. Greenh. Gas Control 2011, 5, 1002–1015. [Google Scholar] [CrossRef]
  25. Wang, T.; Wang, H.; Zhang, F.; Xu, T. Simulation of CO2–water–rock interactions on geologic CO2 sequestration under geological conditions of China. Mar.Pollut. Bull. 2013, 76, 307–314. [Google Scholar] [CrossRef] [PubMed]
  26. Yu, Z.; Liu, L.; Yang, S.; Li, S.; Yang, Y. An experimental study of CO2-brine-rock interaction at in situ pressure-temperature reservoir conditions. Chem. Geol. 2012, 326, 88–101. [Google Scholar] [CrossRef]
  27. Cao, P.; Karpyn, T.; Li, L. The role of host rock properties in determining potential CO2 migration pathways. Int. J. Greenh. Gas Control 2016, 45, 18–26. [Google Scholar] [CrossRef]
  28. Yasuhara, H.; Kinoshita, N.; Lee, D.S.; Choi, J.; Kishida, K. Evolution of mechanical and hydraulic properties in sandstone induced by simulated mineral trapping of CO2 geo-sequestration. Int. J. Greenh. Gas Control 2017, 56, 155–164. [Google Scholar] [CrossRef]
  29. Zhang, K.; Cheng, Y.; Li, W.; Wu, D.; Liu, Z. Influence of supercritical CO2 on pore structure and functional groups of coal: Implications for CO2 sequestration. J. Nat. Gas Sci. Eng. 2017, 40, 288–298. [Google Scholar] [CrossRef]
  30. Alonso, J.; Navarro, V.; Calvo, B.; Asensio, L. Hydro-mechanical analysis of CO2 storage in porous rocks using a critical state model. Int. J. Rock Mech. Min. 2012, 54, 19–26. [Google Scholar] [CrossRef]
  31. Auquě, F.; Acero, P.; Gimeno, J.; Gŏmez, B.; Asta, P. Hydrogeochemical modeling of a thermal system and lessons learned for CO2 geologic storage. Chem. Geol. 2009, 268, 324–336. [Google Scholar] [CrossRef]
  32. Buscheck, A.; Sun, Y.; Chen, M.; Hao, Y.; Wolery, J.; Bourcier, L.; Court, B.; Celia, A.; Friedmann, S.J.; Aines, R.D. Active CO2, reservoir management for carbon storage: Analysis of operational strategies to relieve pressure buildup and improve injectivity. Int. J. Greenh. Gas Control 2012, 6, 230–245. [Google Scholar] [CrossRef]
  33. Choi, Y.; Yun, T.; Mayer, B.; Hong, Y.; Kim, H.; Jo, Y. Hydrogeochemical processes in clastic sedimentary rocks, South Korea: A natural analogue study of the role of dedolomitization in geologic carbon storage. Chem. Geol. 2012, 306, 103–113. [Google Scholar] [CrossRef]
  34. Irina, G. Role and impact of CO2–rock interactions during CO2 storage in sedimentary rocks. Int. J. Greenh. Gas Control 2010, 4, 73–89. [Google Scholar] [CrossRef]
  35. Koornneef, J.; Ramîres, A.; Urkenburg, W.; Faaij, A. The environmental impact and risk assessment of CO2 capture, transport and storage—An evaluation of the knowledge base. Prog. Energy Combust. Sci. 2012, 38, 62–86. [Google Scholar] [CrossRef]
  36. Xu, T.; Apps, A.; Pruess, K. Numerical simulation to study mineral trapping for CO2 disposal in deep aquifers. Appl. Geochem. 2004, 19, 917–936. [Google Scholar] [CrossRef]
  37. Bachu, S.; Bonijoly, D.; Bradshaw, J.; Burruss, R.; Holloway, S.; Christensen, P.; Mathiassen, M. CO2 storage capacity estimation: Methodology and gaps. Int. J. Greenh. Gas Control 2007, 1, 430–443. [Google Scholar] [CrossRef]
  38. Berrezueta, E.; González-Menéndez, L.; Breitner, D.; Luquot, L. Pore system changes during experimental CO2 injection into detritic rocks: Studies of potential storage rocks from some sedimentary basins of Spain. Int. J. Greenh. Gas Control 2013, 17, 411–422. [Google Scholar] [CrossRef]
  39. Zhao, F.; Liao, W.; Yin, D. An experimental study for the effect of CO2-brine-rock interaction on reservoir physical properties. J. Energy Inst. 2015, 88, 27–35. [Google Scholar] [CrossRef]
  40. Bader, G.; Thibeau, S.; Vincke, O.; Jannaud, D.; Saysset, S.; Joffre, H.; Giger, M.; David, M.; Gimenez, M.; Dieulin, A.; Copin, D. CO2 storage capacity evaluation in deep saline aquifers for an industrial pilot selection, methodology and results of the France Nord project. Energy Proc. 2014, 63, 2779–2788. [Google Scholar] [CrossRef]
  41. Li, P.; Zhou, D.; Zhang, C.; Chen, G. Assessment of the effective CO2 storage capacity in the Beibuwan Basin, offshore of southwestern P. R. China. Int. J. Greenh. Gas Control 2015, 37, 325–339. [Google Scholar] [CrossRef]
  42. IWR (International Economic Platform for Renewable Energies). Climate: Global CO2 emissions rise to new record level in 2011. Pressed on Renewable Energy Industry, Germany. Available online: http://www.cerina.org/en/co2-global/co2-2011 (accessed on 1 June, 2017).
  43. Park, Y.; Huh, D.; Yoo, D.; Hwang, S.; Lee, H.; Roh, E. A review of business model for CO2 geological storage project in Korea. J. Geol. Soc. Korea 2009, 45, 579–587. [Google Scholar]
  44. Egawa, K.; Hong, S.; Lee, H.; Choi, T.; Lee, M.; Kang, J.; Yoo, K.; Kim, J.; Lee, Y.; Kihm, J.; Kim, J. Preliminary evaluation of geological storage capacity of CO2 in sandstones of the Sindong Group, Gyeongsang Basin (Cretaceous). J. Geol. Soc. Korea 2009, 45, 463–472. [Google Scholar]
  45. Alemu, B.L.; Aagaard, P.; Munz, I.A.; Skurtveit, E. Caprock interaction with CO2: A laboratory study of reactivity of shale with supercritical CO2 and brine. Appl. Geochem. 2011, 26, 1975–1989. [Google Scholar] [CrossRef]
  46. Dawson, W.; Pearce, K.; Biddle, D.; Golding, D. Experimental mineral dissolution in Berea Sandstone reacted with CO2 or SO2-CO2 in NaCl brine under CO2 sequestration conditions. Chem. Geol. 2015, 399, 87–97. [Google Scholar] [CrossRef]
  47. Farquhar, M; Pearce, K; Dawson, W; Golab, A; Sommacal, S; Kirste, D; Biddle, D; Golding, D. A fresh approach to investigating CO2 storage: Experimental CO2-water-rock interactions in a low-salinity reservoir system. Chem. Geol. 2015, 399, 98–122. [Google Scholar] [CrossRef]
  48. Liu, F.; Lu, P.; Griffith, C.; Hedges, S.W.; Soong, Y.; Hellevang, H.; Zhu, C. CO2-brine-caprock interaction: Reactivity experiments on Eau Claire shale and a review of relevant literature. Int. J. Greenh. Gas Control 2012, 7, 153–167. [Google Scholar] [CrossRef]
  49. Ko, M.; Kang, H.; Wang, S.; Lee, M. The weathering process of olivine and chlorite reacted with the supercritical CO2 on the sequestration condition. J. Geol. Soc. Korea 2011, 45, 463–472. [Google Scholar]
  50. Senetakis, K.; Coop, R.; Todisco, C. The inter-particle coefficient of friction at the contacts of Leighton Buzzard sand quartz minerals. Soils Found. 2013, 53, 746–755. [Google Scholar] [CrossRef]
  51. Yang, H.; Baudet, A.; Yao, T. Characterization of the surface roughness of sand particles using an advanced fractal approach. Proc. R. Soc. A 2016, 472, 1–20. [Google Scholar] [CrossRef]
  52. Degarmo, P.; Black, T.; Kohser, A. Materials and Processes in Manufacturing, ninth ed.Wiley: New Jersy, NJ, USA, 2003. [Google Scholar]
  53. Den Outer, A.; Kaashoek, F.; Hack, K. Difficulties of using continuous fractal theory for discontinuity surfaces. Int. J. Rock Mech. Min. 1995, 32, 3–9. [Google Scholar] [CrossRef]
  54. Lee, M.; Wang, S.; Kim, S.; Park, J. Investigation of the relationship between CO2 reservoir rock property change and the surface roughness change originating from the supercritical CO2-sandstone-groundwater geochemical reaction at CO2 sequestration condition. Energy Proc. 2015, 76, 495–502. [Google Scholar] [CrossRef]
  55. Javadpour, F. CO2 injection in geological formations: Determining macroscale coefficients from pore scale processes. Transp. Porous Med. 2009, 79, 87–105. [Google Scholar] [CrossRef]
  56. Kjøller, C.; Weibel, R.; Bateman, K.; Laier, T.; Nielsen, H.; Frykman, P.; Springer, N. Geochemical impacts of CO2 storage in saline aquifers with various mineralogy-results from laboratory experiments and reactive geochemical modeling. Energy Proc. 2011, 4, 4724–4731. [Google Scholar] [CrossRef]
  57. Silva, D.; Ranjith, G.; Perera, A. Geochemical aspects of CO2 sequestration in deep saline aquifers: A review. Fuel 2015, 155, 128–143. [Google Scholar] [CrossRef]
  58. Mitiku, B.; Li, D.; Bauer, S.; Beyer, C. Geochemical modeling of CO2-water-rock interactions in a potential storage formation of the North German sedimentary basin. Appl. Geochem. 2013, 36, 168–186. [Google Scholar] [CrossRef]
Figure 1. Geological map around the drilling site ( Applsci 07 00572 i001
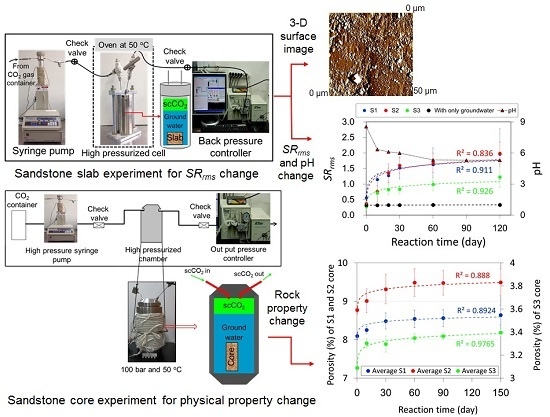
) and photographs of sandstone cores and a slab for the experiment (modified from [22]).
Applsci 07 00572 g001
Figure 2. Apparatus used for the slab experiment to simulate the scCO2-sandstone-groundwater reaction.
Applsci 07 00572 g002
Figure 3. Schematic of the SPM (Scanning Probe Microscope) analysis to calculate SRRMS (surface roughness value).
Applsci 07 00572 g003
Figure 4. Schematic of the sandstone core experiment for physical property changes.
Applsci 07 00572 g004
Figure 5. Scanning Probe Microscope (SPM) images of three mineral surfaces for the S1 slab before (left) and after 120 reaction days (right).
Applsci 07 00572 g005
Figure 6. The SRRMS and pH change by the scCO2-sandstone-groundwater reaction.
Applsci 07 00572 g006
Figure 7. Concentration change of five cations in the groundwater during the scCO2 involved reaction (trend lines calculated from the data after 30 days).
Applsci 07 00572 g007
Figure 8. Scanning Electron Microscope (SEM) images of the S1-1 slab surface (a) before and (b) after 120 reaction days (Q: quartz, Pl: plagioclase, Pe: perthite, B: biotite, C: calcite, and : secondary precipitates).
Applsci 07 00572 g008
Figure 9. SEM images for precipitates created on the slab surface after 120 reaction days (: halite, : calcite, and : amorphous silicate minerals).
Applsci 07 00572 g009
Figure 10. Average porosity change (a) and average seismic wave velocity change (b) for the sandstone cores during the scCO2-sandstone-groundwater reaction.
Applsci 07 00572 g010
Table 1. Petrographic detrital modal analysis for sandstones.
Thin Section No.Mineral Portion (%)
QuartzPlagioclaseK-FeldsparMuscoviteBiotiteCalciteChloriteOthers
S1-150.77.825.50.32.33.13.17.2
S1-243.49.227.60.31.55.35.17.6
S1-350.511.323.51.10.24.33.25.9
S1-446.18.123.21.42.16.24.78.2
Average ± standard deviation47.7 ± 3.69.1 ± 1.625.0 ± 2.00.8 ± 0.61.5 ± 0.94.7 ± 1.34.0 ± 1.07.2 ± 1.0
S2-138.713.417.90.72.29.50.117.5
S2-235.615.513.41.52.712.40.018.9
S2-340.511.716.90.11.46.40.023.0
S2-441.916.819.81.41.94.10.114.0
Average ± standard deviation39.2 ± 2.714.4 ± 2.317.0 ± 2.70.9 ± 0.72.1 ± 0.58.1 ± 3.60.1 ± 0.118.4 ± 3.7
S3-161.67.613.23.30.40.30.113.5
S3-257.55.17.75.90.63.50.319.4
S3-355.18.714.32.70.43.80.214.8
Average ± standard deviation58.1 ± 3.37.1 ± 1.811.7 ± 3.54.0 ± 1.70.5 ± 0.12.5 ± 1.90.2 ± 0.115.9 ± 3.1
Table 2. Temperature, pH, and chemical composition of groundwater used in the experiment.
Temp. (°C)pHAverage Concentration (mg/L)
Na+Ca2+K+Mg2+Si4+Al3+Fe2+ClSO42NO3HCO3
40.68.6633.2547.123.320.912.44.30.02109.1259.3212.051.7
Table 3. SRRMS (unit: µm) vs. reaction time for the three sandstone slabs.
Slab TypeMineral TypeReaction Time (day)
01020306090
S1Quartz-10.8781.0571.1761.1361.2231.261
Quartz-20.3221.1641.4381.5411.4411.446
Quartz-30.5180.9450.9761.2011.2421.041
Plagioclase-10.1641.0071.0121.7111.1432.017
Plagioclase-20.4421.5981.1331.7482.7603.068
Plagioclase-30.4271.1301.2941.9052.1603.391
Biotite-10.9081.1731.7522.0521.8152.091
Biotite-20.7490.9941.2591.0781.6122.071
Biotite-30.6581.2501.4351.3261.2731.297
S1 average ± std 0.563 ± 0.251.146 ± 0.201.275 ± 0.241.522 ± 0.351.630 ± 0.541.965 ± 0.82
S2Quartz-10.2750.1691.6121.5121.9972.011
Quartz-20.2760.6631.0351.3621.5401.581
Quartz-30.2710.5901.2741.4202.0551.998
Plagioclase-10.1570.4361.2871.9091.2012.318
Plagioclase-20.1921.1511.2051.9551.8542.101
Plagioclase-30.1840.8401.2031.6791.7881.991
Biotite-10.6981.1661.9881.7471.6892.485
Biotite-20.6661.1221.1311.2441.2151.303
Biotite-30.6120.7461.4991.5851.8102.13
S2 average ± std 0.370 ± 0.220.765 ± 0.341.359 ± 0.301.601 ± 0.241.683 ± 0.311.991 ± 0.36
S3Quartz-10.2590.6810.7020.7390.8650.998
Quartz-20.1420.6610.8980.9800.9391.103
Quartz-30.2260.5710.8600.8010.8880.998
Plagioclase-10.0840.6230.6350.6840.7541.774
Plagioclase-20.2240.9220.6000.6351.1891.696
Plagioclase-30.1960.7020.8520.8430.8281.033
Biotite-10.5540.7821.1101.0171.3581.551
Biotite-20.3940.6560.7970.8361.1790.966
Biotite-30.3620.8040.9770.9550.8990.954
S3 average ± std 0.271 ± 0.140.711 ± 0.110.826 ± 0.160.832 ± 0.130.989 ± 0.201.230 ± 0.25
Table 4. Porosity change for the three sandstone cores for 150 reaction days.
SandstoneReaction Time (day)Porosity Change Rate (%) during 150 Days (1)
010306090150
S18.1838.3218.4648.5698.5538.6495.7
8.1218.1498.2938.2998.3508.393.3
7.9868.2988.7058.7678.7918.88811.3
S1 average ± std8.097 ± 0.108.256 ± 0.098.487 ± 0.218.545 ± 0.238.565 ± 0.228.642 ± 0.256.7
S28.7608.9919.3609.4609.4629.4598.0
8.8899.3349.6739.8579.8119.85910.9
8.6808.7138.9199.1489.1639.1605.5
S2 average ± std8.776 ± 0.119.013 ± 0.319.318 ± 0.389.488 ± 0.369.479 ± 0.329.493 ± 0.358.2
S33.1213.2783.2213.3053.3533.4129.3
3.0563.2823.333.383.3363.3589.9
3.0933.3493.3373.3613.4023.41910.5
S3 average ± std3.090 ± 0.033.303 ± 0.043.296 ± 0.073.349 ± 0.043.364 ± 0.033.396 ± 0.039.9
* (1): | value   for   150   day value   for   0   day value   for   0   day |   ×   100.
Table 5. Average density and seismic wave velocity changes for the three sandstones during the reaction.
PropertyReaction Time (day)Property Change Rate (%) during 150 Days (1)
0306090150
Dry density (g/cm3)2.390 ± 0.00032.387 ± 0.00072.386 ± 0.00032.384 ± 0.00042.384 ± 0.00080.25
P-wave velocity (m/s)3.578 ± 313.467 ± 253.412 ± 623.410 ± 123.375 ± 455.67
S-wave velocity (m/s)1.288 ± 651.252 ± 451.226 ± 231.231 ± 571.214 ± 555.75
* (1): | value   for   150   day value   for   0   day value   for   0   day |   ×   100.

