Bionic Walking Foot and Mechanical Performance on Soil


1
Key Laboratory of Bionic Engineering, Ministry of Education, Jilin University, Changchun 130025, China
2
Key Laboratory of Automobile Materials, Ministry of Education, Department of Materials Science and Engineering, Jilin University, Changchun 130025, China
*
Author to whom correspondence should be addressed.
Appl. Sci. 2017, 7(6), 575; https://doi.org/10.3390/app7060575
Submission received: 8 April 2017
/
Revised: 22 May 2017
/
Accepted: 30 May 2017
/
Published: 2 June 2017
(This article belongs to the Section Mechanical Engineering)
Abstract
:The surface structure of the Chinese mitten crab dactylopodite was investigated. The results indicated that the Chinese mitten crab dactylopodite has grooves with variable section structure on the surface of dactylopodite for achieving good traveling behavior on soft terrain. Surface structure plays a key role in the walking performance of the leg mechanism. Based on the bionics coupling theory, three bionic walking feet with different section shapes, including circular (Bio 1), circular with grooves (Bio 2), hexagon (Bio 3) and a cylinder foot used for comparison on the aluminum alloy, were designed and fabricated successfully. Meanwhile, comparative experiments on intrusion, extraction and propulsion for walking feet were conducted on different soil. Experimental results show that a bionic walking foot reduced the energy consumption of insertion and extraction, which topped out to 93.95% and 92.78% of cylinder foot, and Bio 2 behaves better. Propulsion is closely correlated with intrusion depth; therefore, compared with cylinder foot, the sinkage of a bionic walking foot helps to achieve a larger propulsion force with the same pressure. Furthermore, the proper depth in balancing the sinkage and propulsion was discussed, which enables us to optimize the structure and performance of a walking foot.
1. Introduction
Severe sinkage and slipping of terrain vehicles often happens on soft terrain with low pressure-bearing capacity and low shearing strength. The discrete footfalls of a legged machine allow it to overcome obstacles with greater ease and to travel over soft terrain with less energy loss due to soil work [1]. Achieving good traveling behavior has long been an important issue. Compared with wheeled vehicles, legged mechanisms have superiority on unstructured terrain such as loose, muddy roads. The leg can pierce the soil to gain a grip [2] and pass through the places that other forms of vehicles are harder to reach. Therefore, much more research focuses on the traffic ability of legged vehicles on various terrains and the interaction between the leg and its environments.
As the contact part with soil, the walking foot plays a fundamental role in legged vehicles. Many factors contribute to the performance of the walking foot, including the shape, dimension, material and so on [3]. However the shape of the conventional walking foot for legged vehicles (robots) are not varied. Ding et al. [3] summarized the main shapes of foot: (1) flat, for increasing the contact area, such as TITAN [4]; (2) cylindrical, spherical or cambered, including crab-like robot Bigdog [5], SILO 6 [6], fits for multi-freedom legs; and (3) irregular shape. After millions of years of adaptation in the natural environment, animal legs have evolved and diversified their leg morphology into various forms [7], with feet of various shapes and functions to adjust to complex terrains [8]. Thus, more and more feet of legged vehicles are beyond the traditional shape, such as the “C” leg of RHex [9] and Sandbot [10,11]. So far, much research [12,13,14] has regarded the leg and foot as a whole, and there is little attention to the influence of the structure of the walking foot on a legged mechanism.
It is well known Chinese mitten crabs (Eriocheir sinensis) live in soft, muddy conditions, such as shore and wetland. They move fast and freely: the speed reaches greater than 0.4 m/s in trotting [15,16]. By the support of stomach, the crab can walk even though its legs sink into the mire, which is meaningful for the bionic research of a legged mechanism. The second and third paraeiopods contribute most to the walking performance [17,18,19]. Further, the dactylopodites are particularly significant during contact with soil. Surface structure plays a key role in the walking performance of the legged mechanism. Thus, the dactylopodite of the third paraeiopod was chosen as a subject and the surface structure was studied. Based on the bionics coupling theory, three bionic walking feet and a cylinder foot used for comparison on the aluminum alloy were designed and fabricated successfully. The performance of bionic samples and the cylinder foot on three kinds of soil were investigated through comparison experiments, which was evaluated by intrusion force, extraction force; energy consumption and propulsion force. The influence of the depth on propulsion was discussed. Meanwhile, the optimal depth, balancing the sinkage and propulsion, was determined further. The results are helpful to optimize the structure and improve the performance of the walking foot.
2. Design of Bionic Walking Foot
2.1. Characteristics of Chinese Mitten Crab Dactylopodite
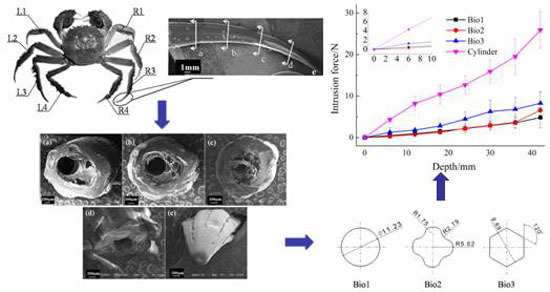
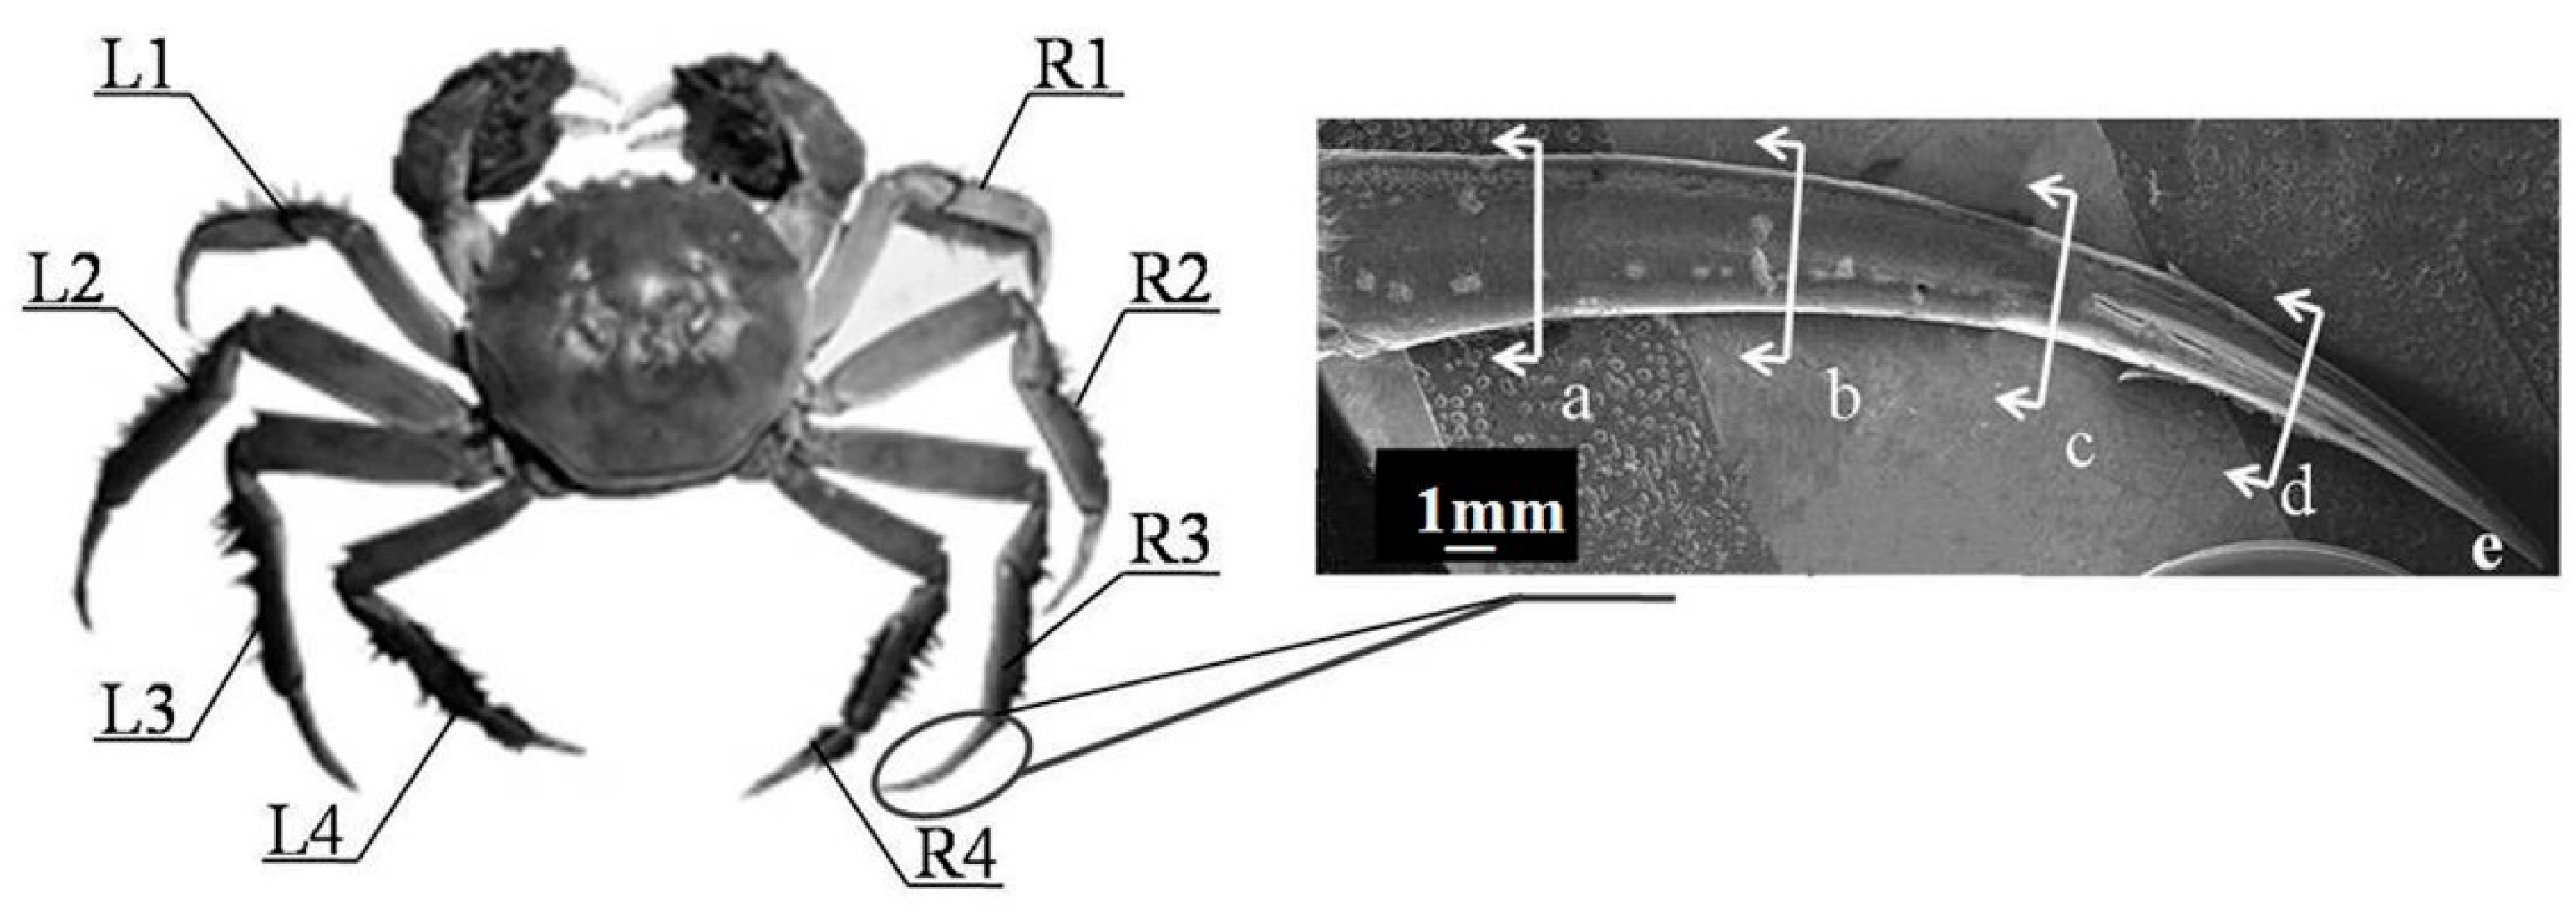
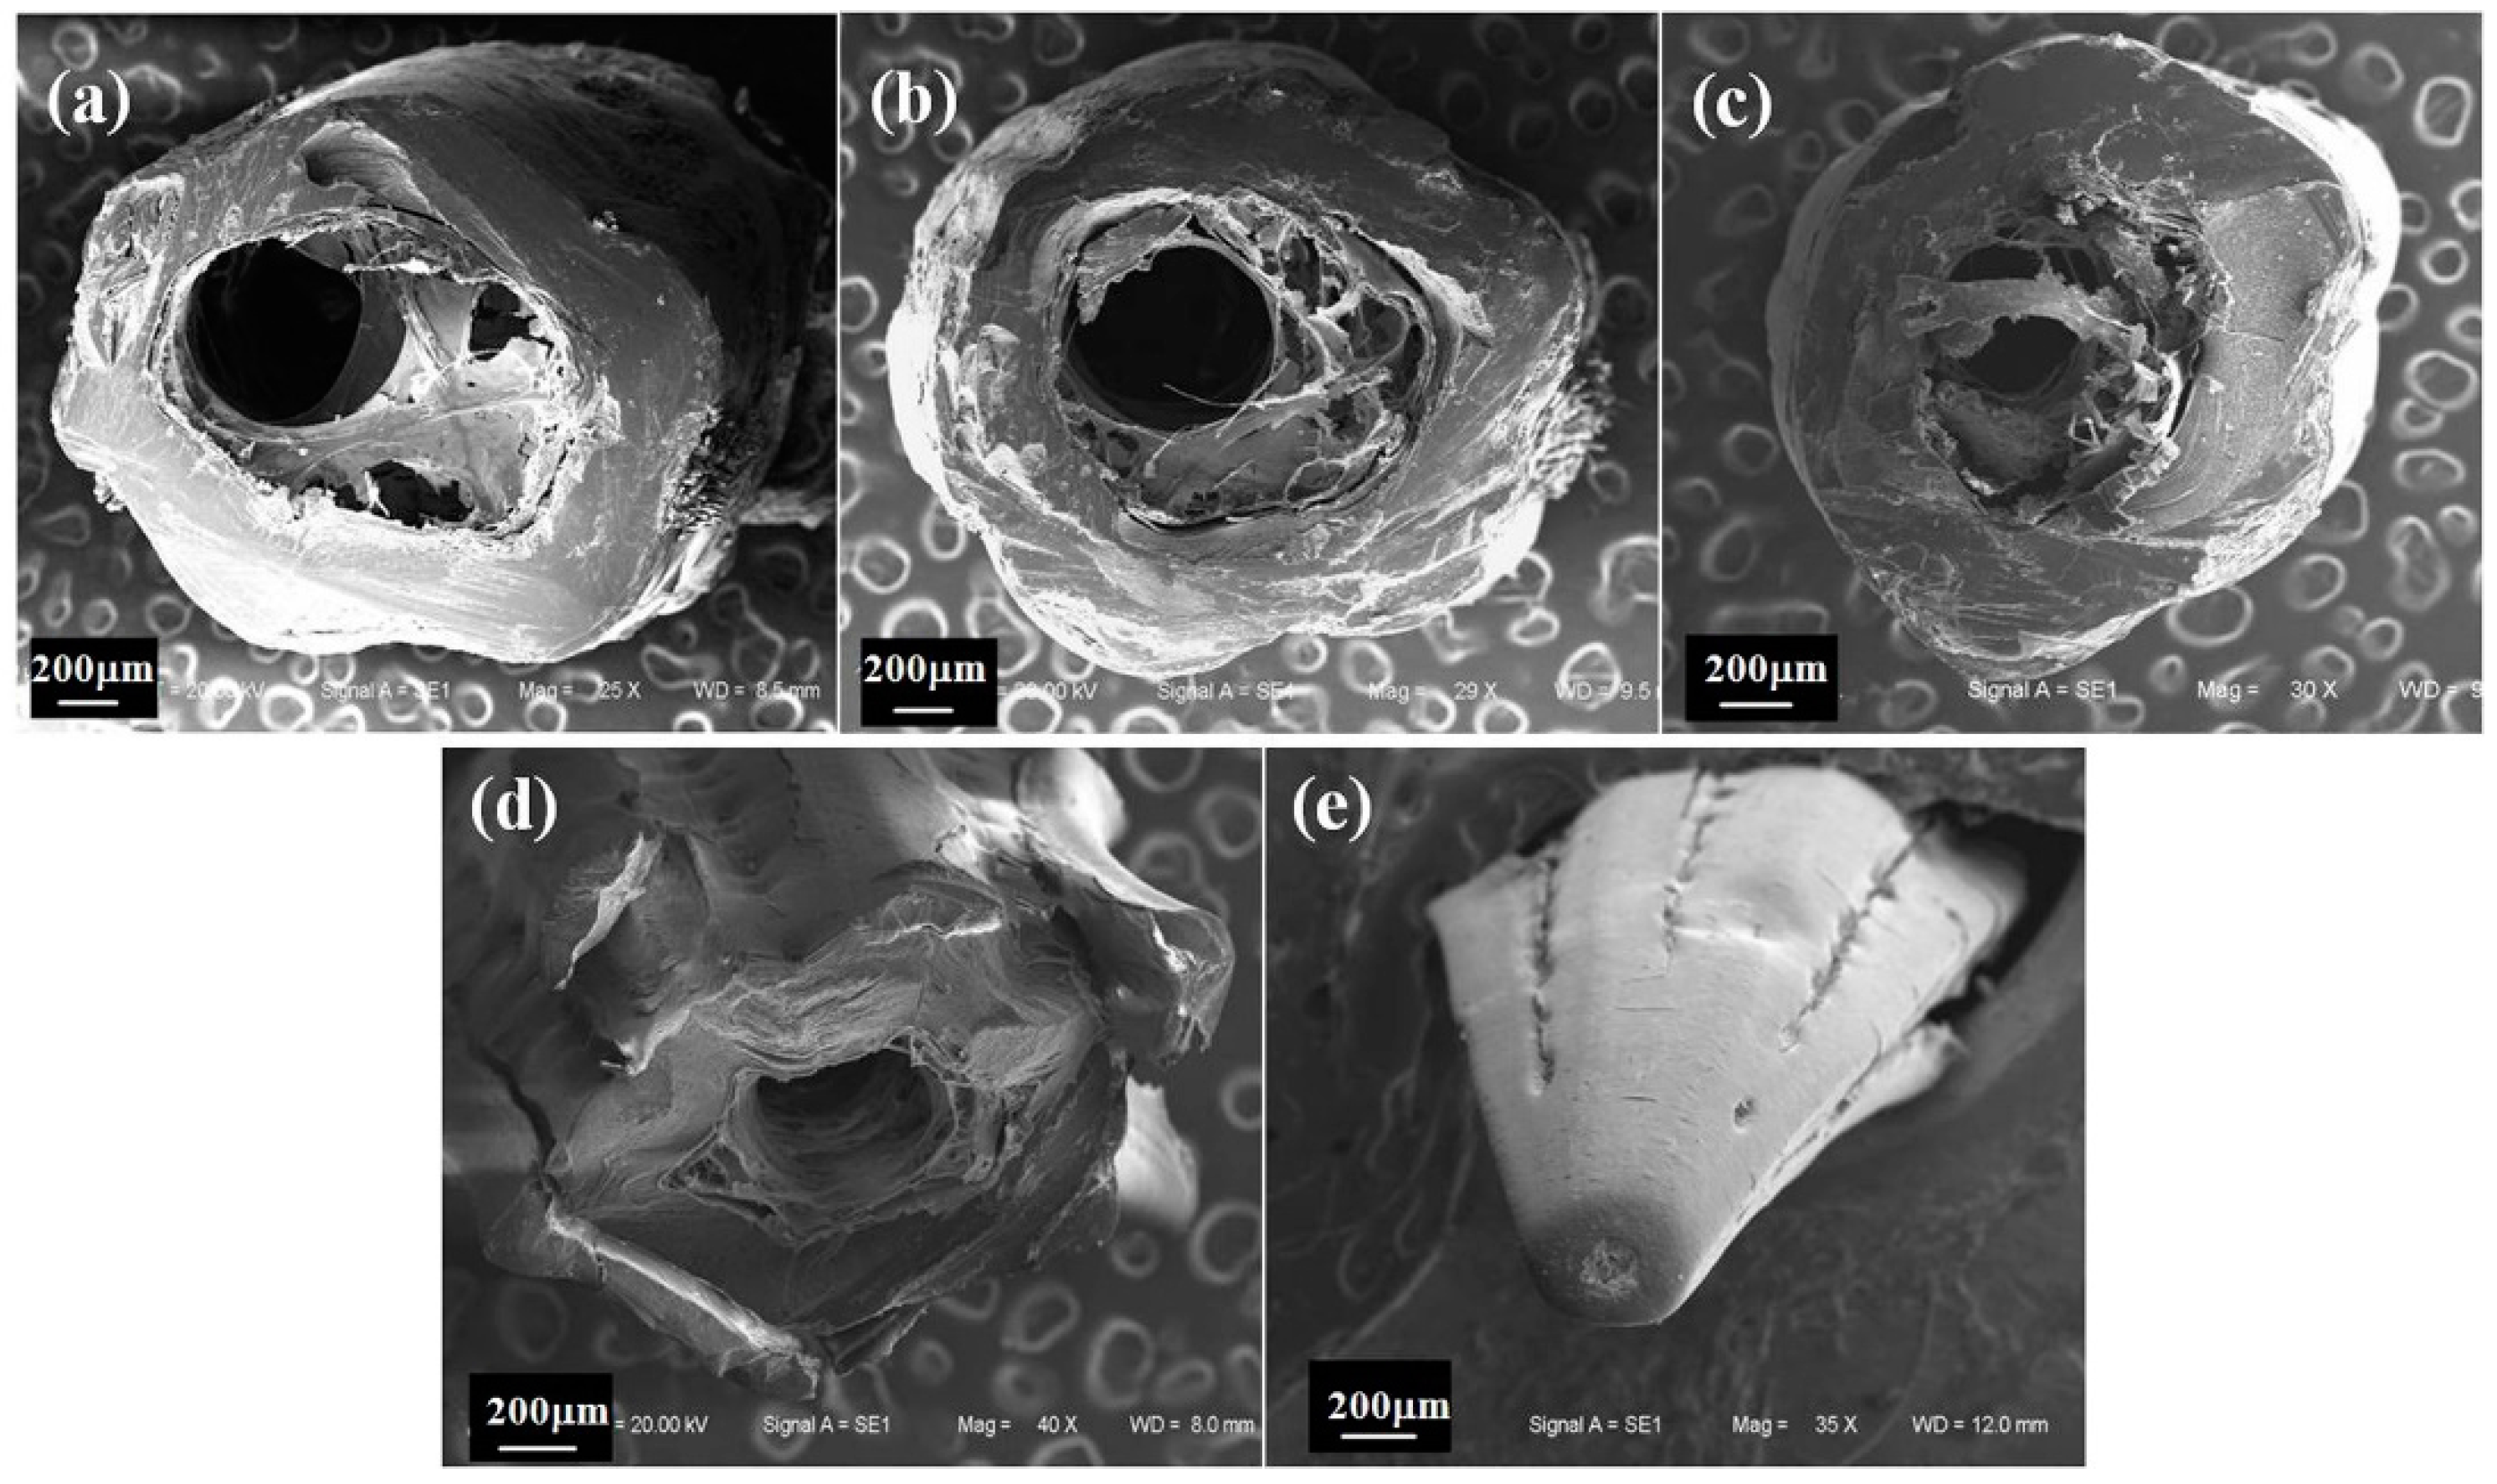
Four pairs of paraeiopods with different lengths are distributed symmetrically around the carapace. We took the dactylopodite of the third paraeiopod as the research object and observed the structure by scanning electron microscope (SEM) (Zeiss EVO 18, Cambridge, UK). The dactylopodite curved towards the end with variable section structure, as revealed in Figure 1. The dry dactylopodite is fragile, so wet dactylopodites were chosen for sampling. In order to get a smooth observation section, structure and outline of cross-section, the dactylopodites were cut into five parts of equal length along the curve with surgical knife. The cutting placements are shown in Figure 1. The normal sections under electron microscopy are shown in Figure 2. The figures illustrate all the sections are oblate, and the hollow inside is filled by muscle tissue and body fluid. Six different depth of grooves are distributed on the surface of dactylopodite, which makes the cross-sectional shape look like a plum flower. The grooves near the root are wider and shallower (Figure 2a–c). When it reaches the end, however, grooves become narrow and deepen (Figure 2d,e).
2.2. Samples
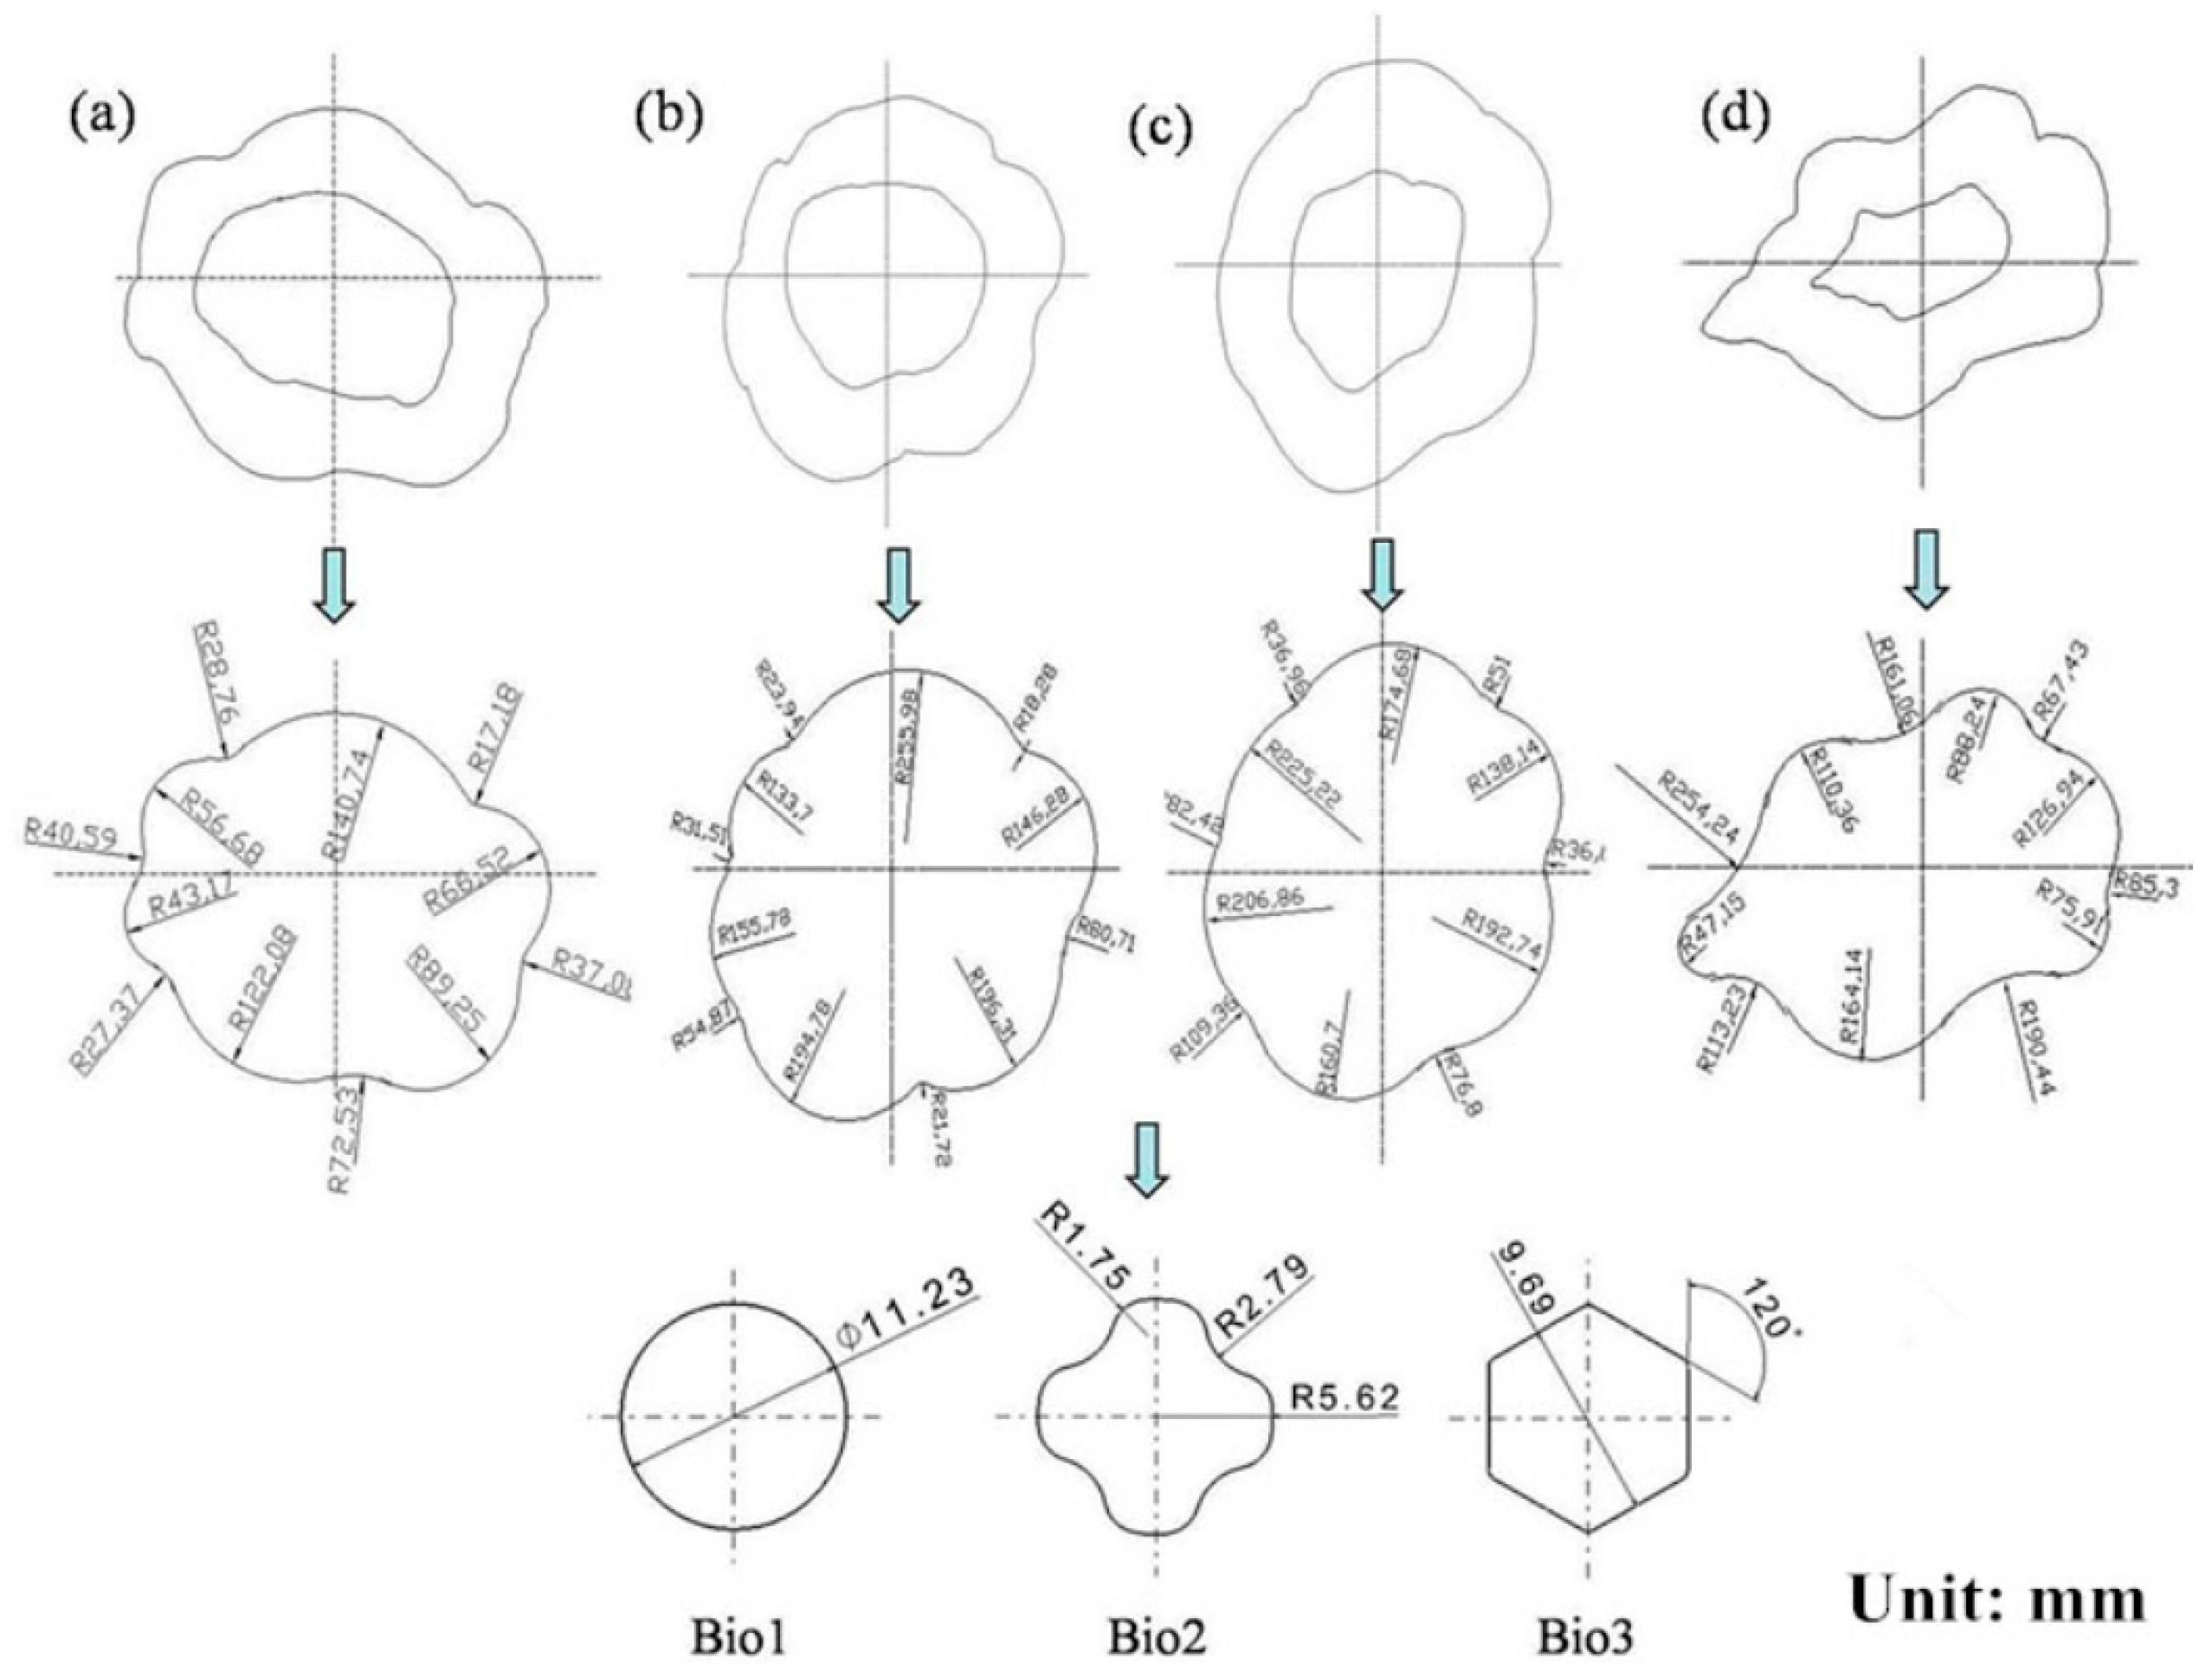
Bionic models of cross-sections were built by extracting the image edges, fitting curves and pattern regularization (Figure 3). Although the profiles of sections were not identical, they displayed shapes similar to circular (Figure 3b,c) or polygon (Figure 3a,d) morphology. Hence we designed three kinds of model by referring to the curves: circular, circular with grooves, and hexagon, which were denoted by Bio 1, Bio 2 and Bio 3.
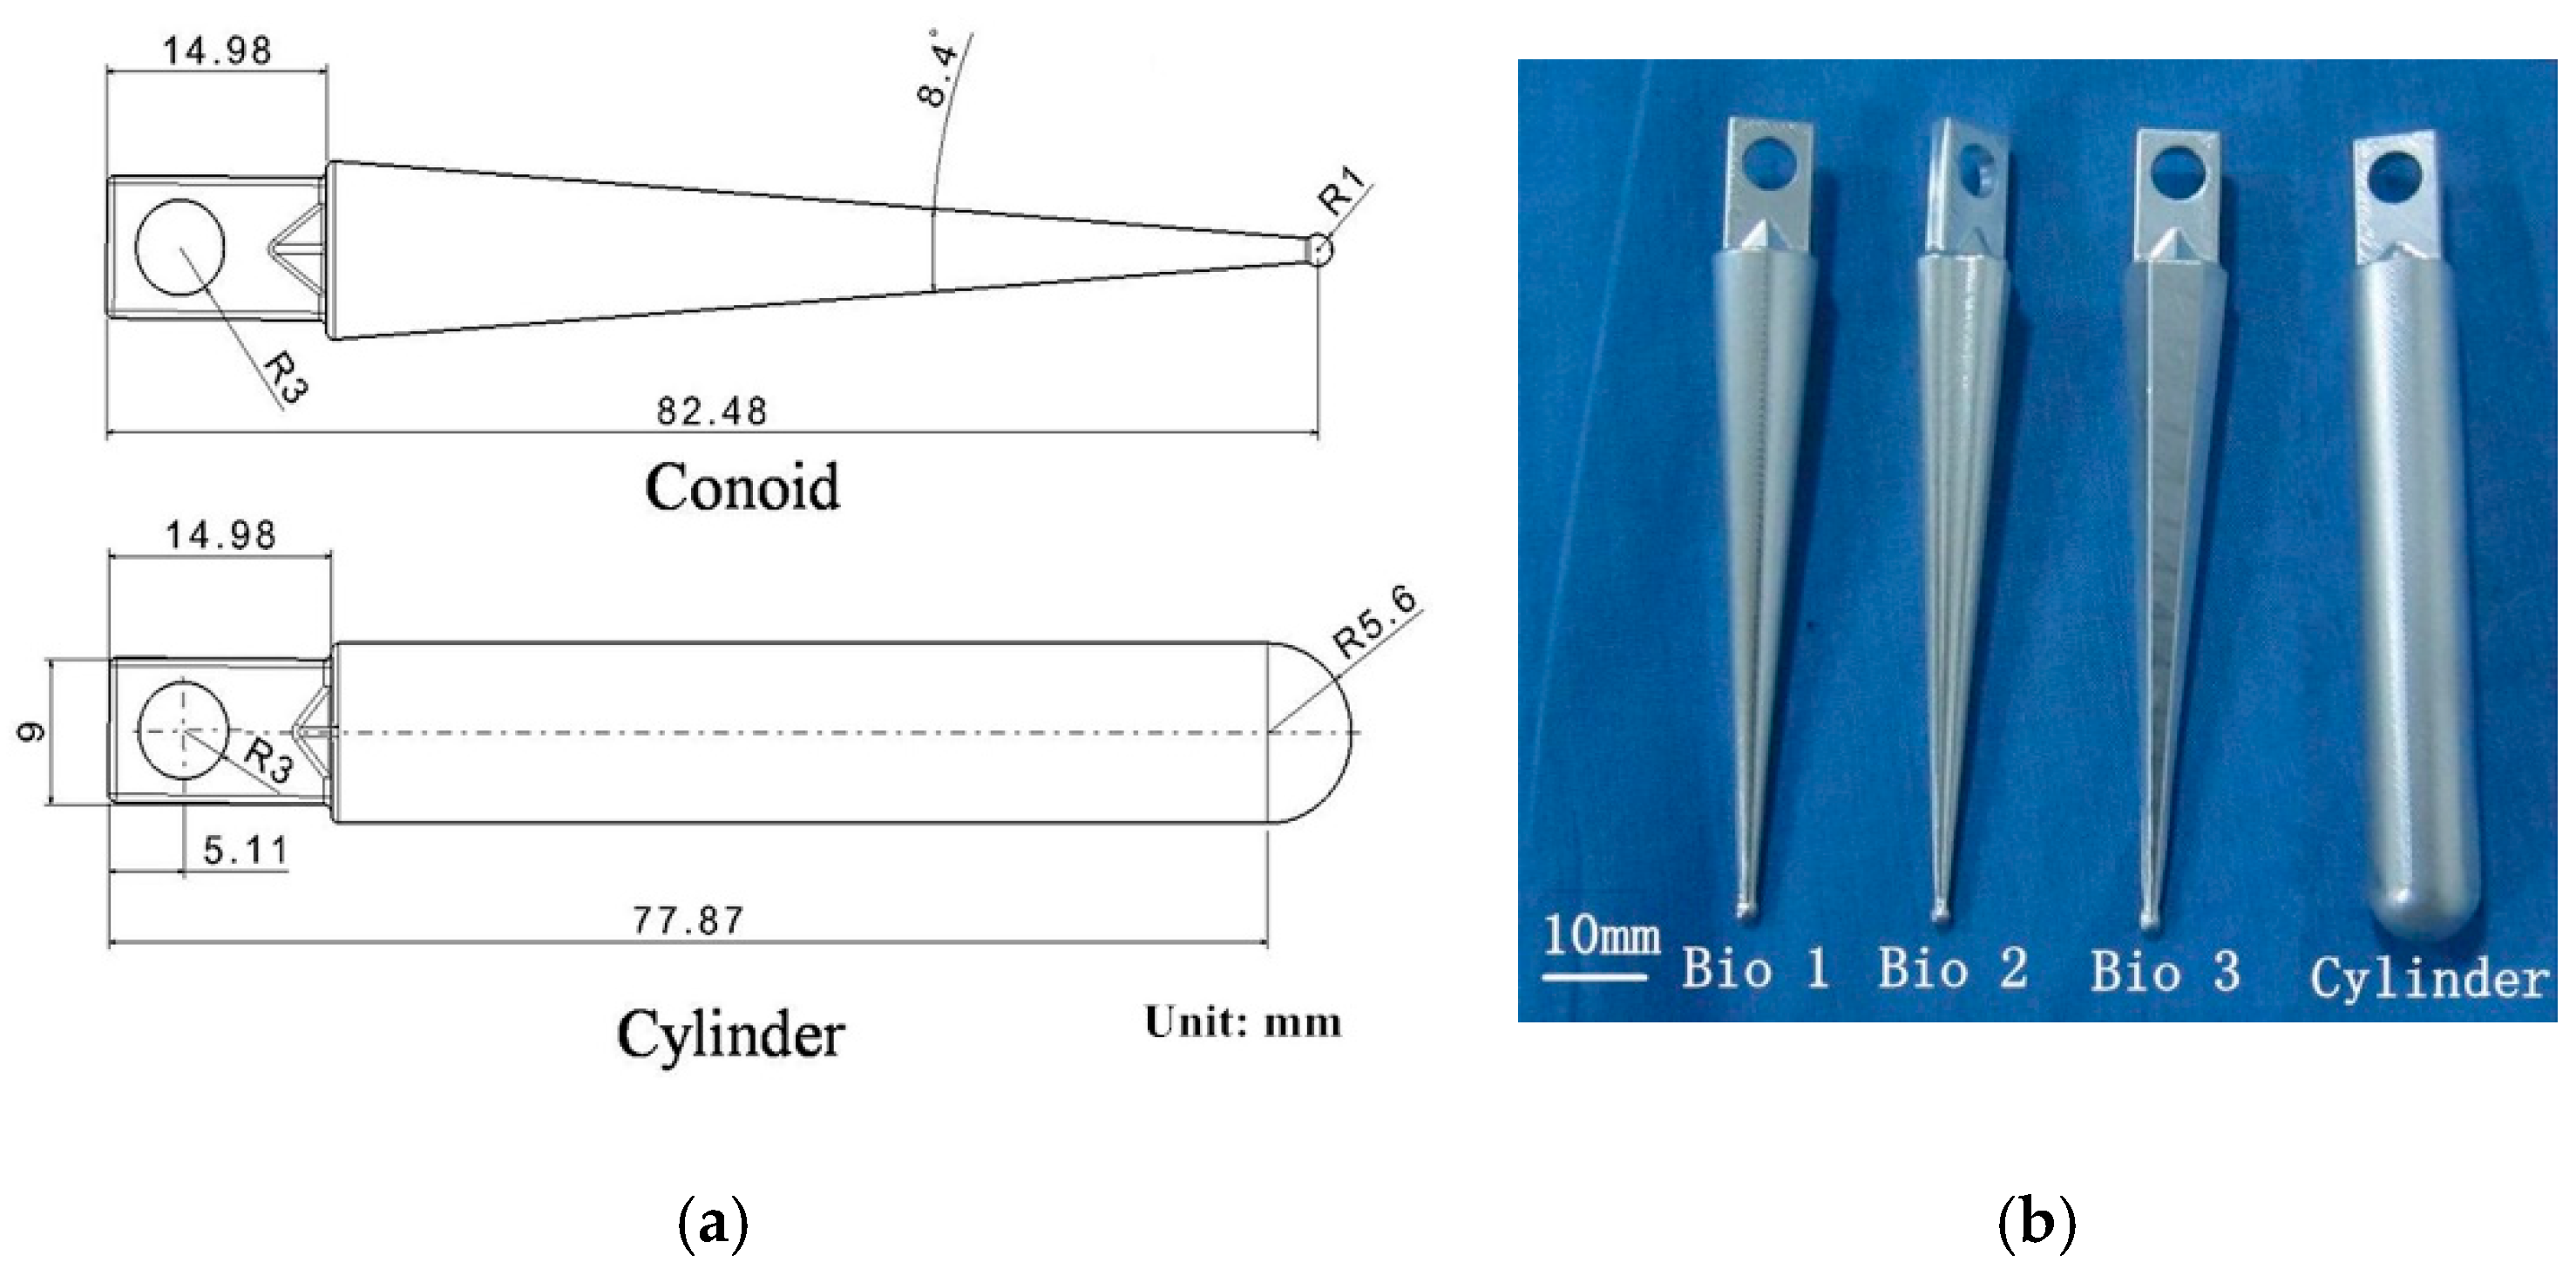
Besides, bionic walking feet were designed into a cone according to the structure of the variable section (Figure 4a). The curved shape of dactylopodite was ignored, given the difficulty in controlling it. For comparison, a cylinder walking foot with the same length and maximum diameter was built. Thus, four foot samples made from aluminum alloy 6561T6 were fabricated for the experiment, shown in Figure 4b.
3. Performance of Bionic Walking Feet
To explore the performance of the bionic walking feet, we tested the force during intrusion, horizontal motion and extraction according to the locomotion of foot in the soil. Thus, vertical forces and horizontal force were measured respectively.
3.1. Experimental Apparatus
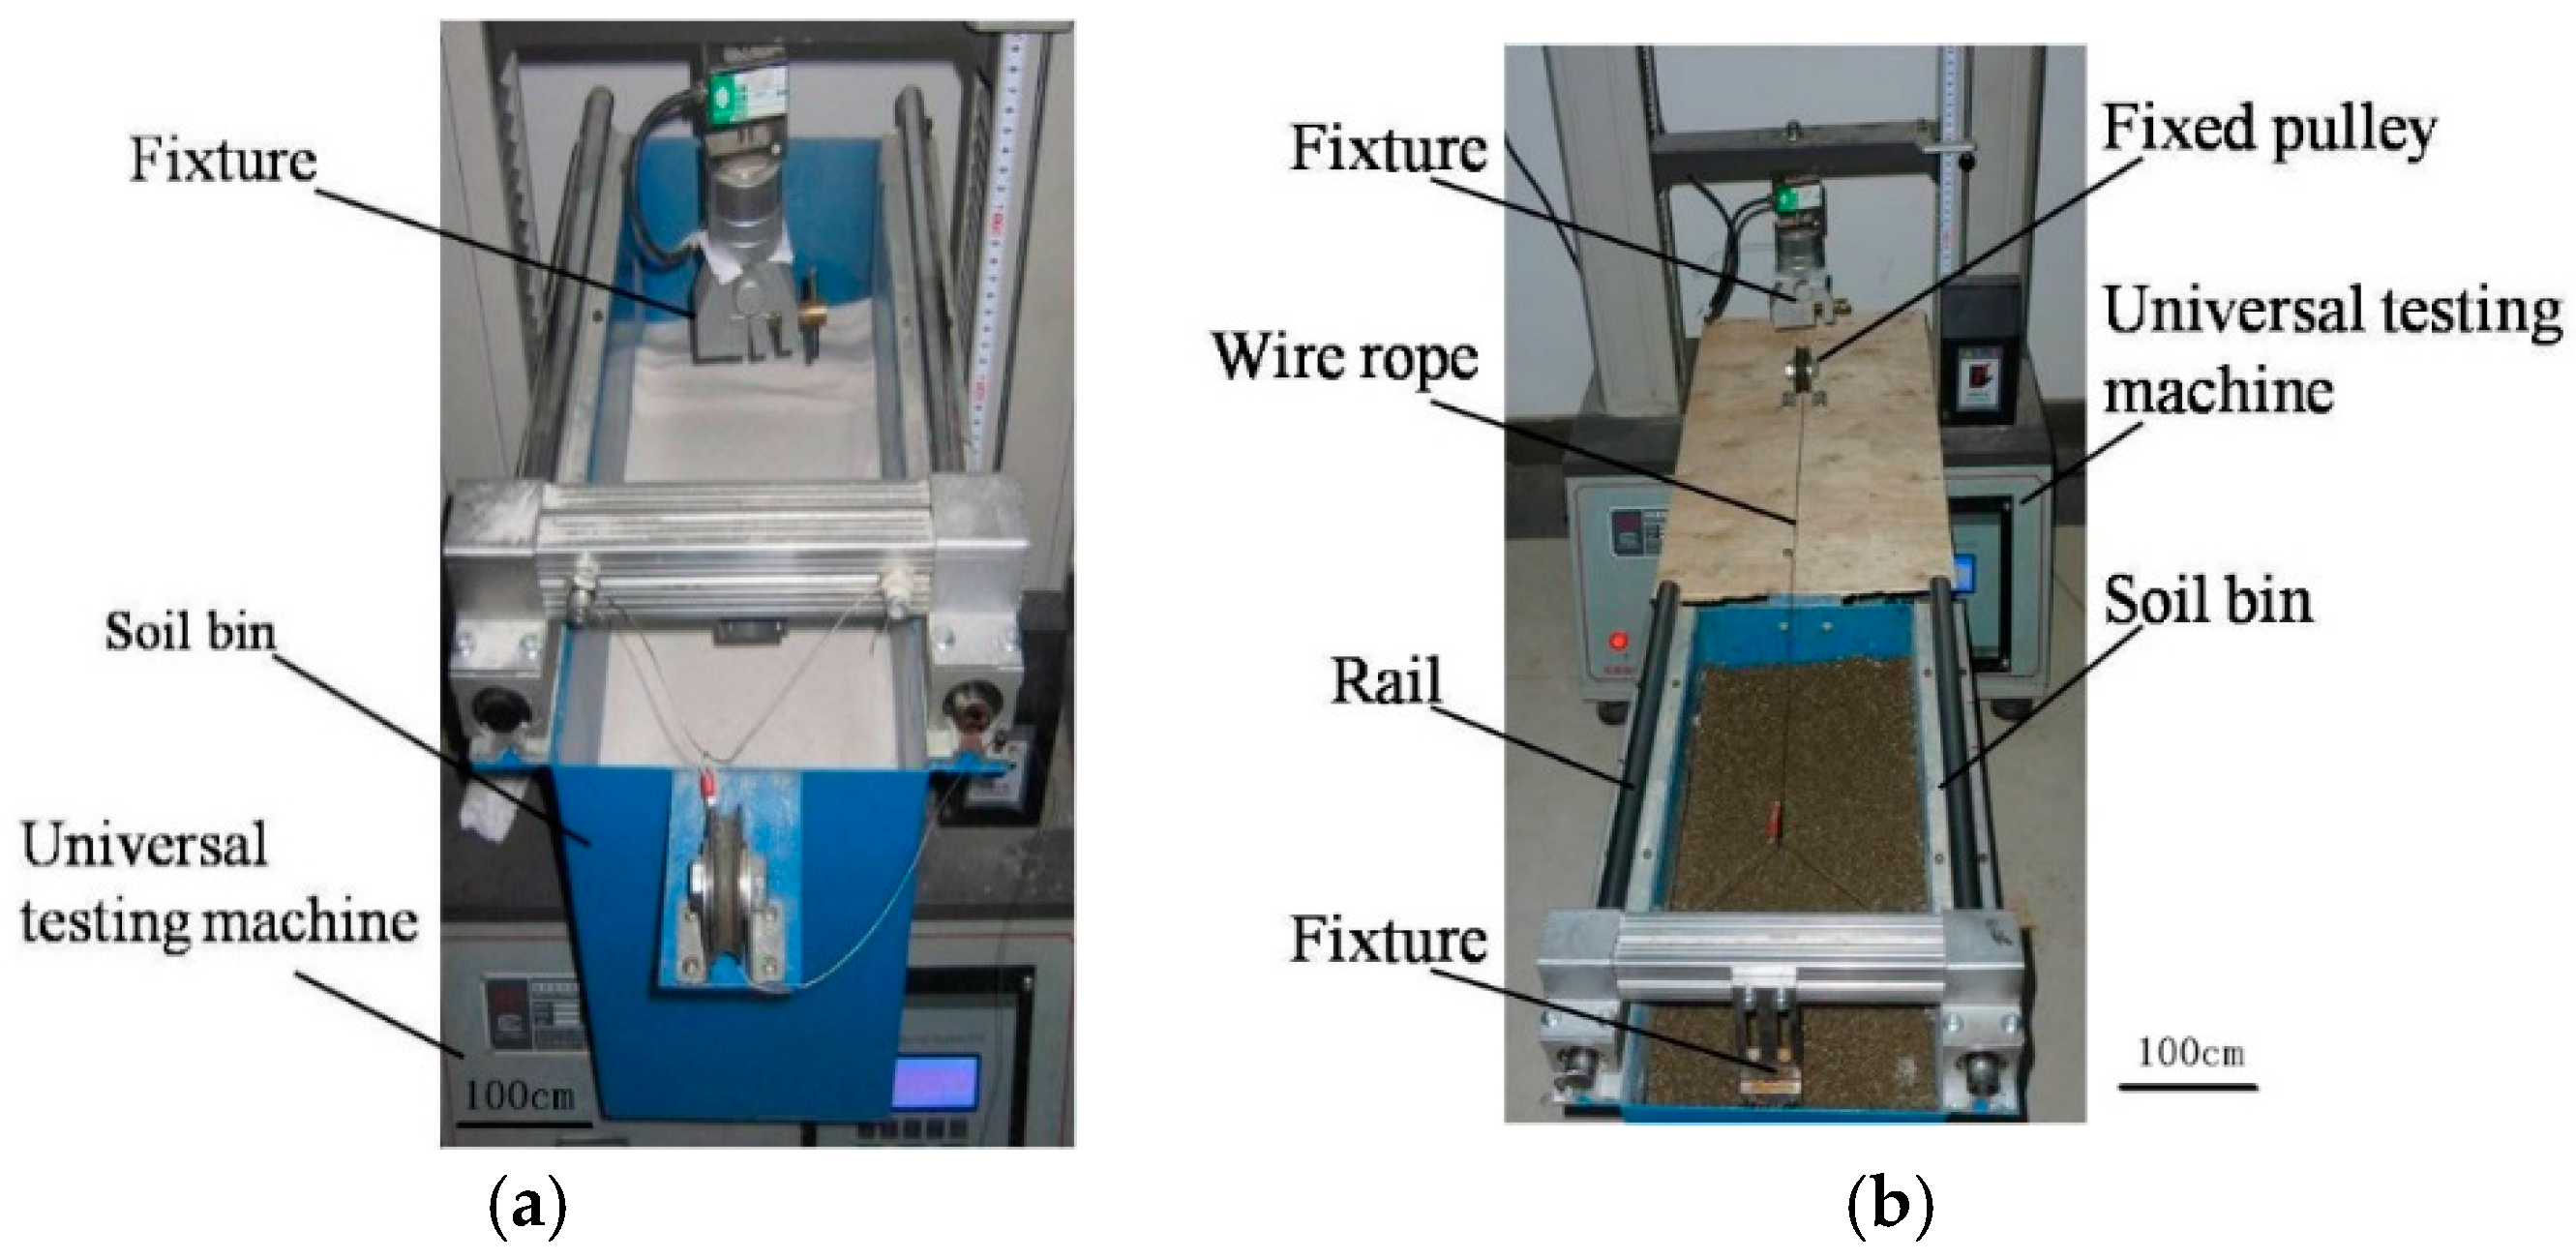
The experimental apparatus comprise several parts: a soil bin, a universal testing machine (Qualitest, QT-1186, Dongguan, China) to produce a driver, and foot samples. The size of the soil bin is 500 mm × 250 mm × 300 mm in length × width × depth, which is large enough for the samples without boundary effects in the trials. It is shown in Figure 5 that there is something different in the layout of equipment for vertical force and horizontal force:
(1) Vertical force. Shown in Figure 5a, the soil bin was located under the fixture of a universal testing machine; samples were clamped and inserted in the soil to a fixed depth or extracted from a certain depth at a constant speed.
(2) Horizontal force. The soil bin was arranged in parallel with the testing machine (Figure 5b). The foot sample, fixed vertically, was dragged to move in linear horizontal motion along the rail by wire rope, which was clamped using a fixture on the testing machine. A fixed pulley was in a vertical line with a fixture to change the direction of force.
There were different views about the impact of velocity on horizontal resistance for the soil-engagement part of previous studies. Wieghardt [20] found the horizontal resistance increased with velocity (20~180 cm/s), while some studies deemed that the resistance was independent of velocity (v = 0.041~1 mm/s [21], v = 10~50 mm/s) [22]. A larger velocity may cause greater friction between the soil and soil-engagement part, which gives an illusion that the resistance increased with velocity. Therefore, in order to lower the impact on the friction coefficient and ensure the accuracy of the test, we chose a small velocity in our work. The linear velocity was selected for 10 mm·min−1, 20 mm·min−1 and 30 mm·min−1. Meanwhile, the three depths of insertion were 40 mm, 50 mm and 60 mm. Each test was repeated to obtain a minimum of three consistent data sets for each sample type, velocity and depth of insertion, and the averages and variance were calculated.
3.2. Parameters and Preparation of Soil
Three soil stimulant types—two kinds of quartz sand and one yellow clay—were utilized in the experiments. The volume weigh was tested using a cutting ring. By using the sieving method, the particle sizes of quartz sand were measured. In addition, the particle distribution of yellow clay was measured by laser particle analyzer (Better, BT-1600, Dandong, China). The data about the parameters of soil and the particle size distribution of yellow clay are summarized in Table 1 and Table 2. Coarse quartz sand, which comprises angular grains, and fine quartz sand, with rounder grains, were obtained by a commercial method. Yellow clay was obtained from the soil bed of Key laboratory of bionic engineering, Jilin University.
The soil depth was 20 mm. In order to avoid big errors, all soil should be of status, the materials should be fully disturbed and the surface smoothed in horizontal lines before each test. In the experiments of clay, the water content was controlled artificially in vacuum bags, and the bags were maintained for a period of time to ensure the water penetrated evenly. Each test should be carried out on new soil.
4. Experimental Results and Discussion
4.1. Intrusion
Figure 6 shows the intrusion force of the walking feet at the insert depth of 10 mm·min−1. The results indicated that it took little force for Bio 1, Bio 2 and Bio 3 to insert into the soil, in which Bio 1 and Bio 2 used less force, especially at the beginning of insertion (where the depth was less than 10 mm). In the coarse quartz sand (Figure 6a), the insertion force for the bionic feet was 86.38~92.41% lower than the cylinder foot to reach the same depth in soil. Meanwhile, the values were 90.05~94.38% and 86.20~91.25% respectively in fine quartz sand and clay (Figure 6b,c). It can be seen that there was a sharp rise after the head of foot immerged into the soil, which indicated the load-bearing capability increased largely. The bearing capacities of the bionic walking feet were poorer, especially in sand. While the difference shows a convergence trend in clay, this is a result of the water and elastic plastic enhancing the deformability of the clay. However, the bearing capacity of the bionic walking feet can meet the demands of the proper proportion load, just like the Chinese mitten crab. Therefore bionic walking feet better suit lightweight-legged mechanisms relatively.
4.2. Extraction
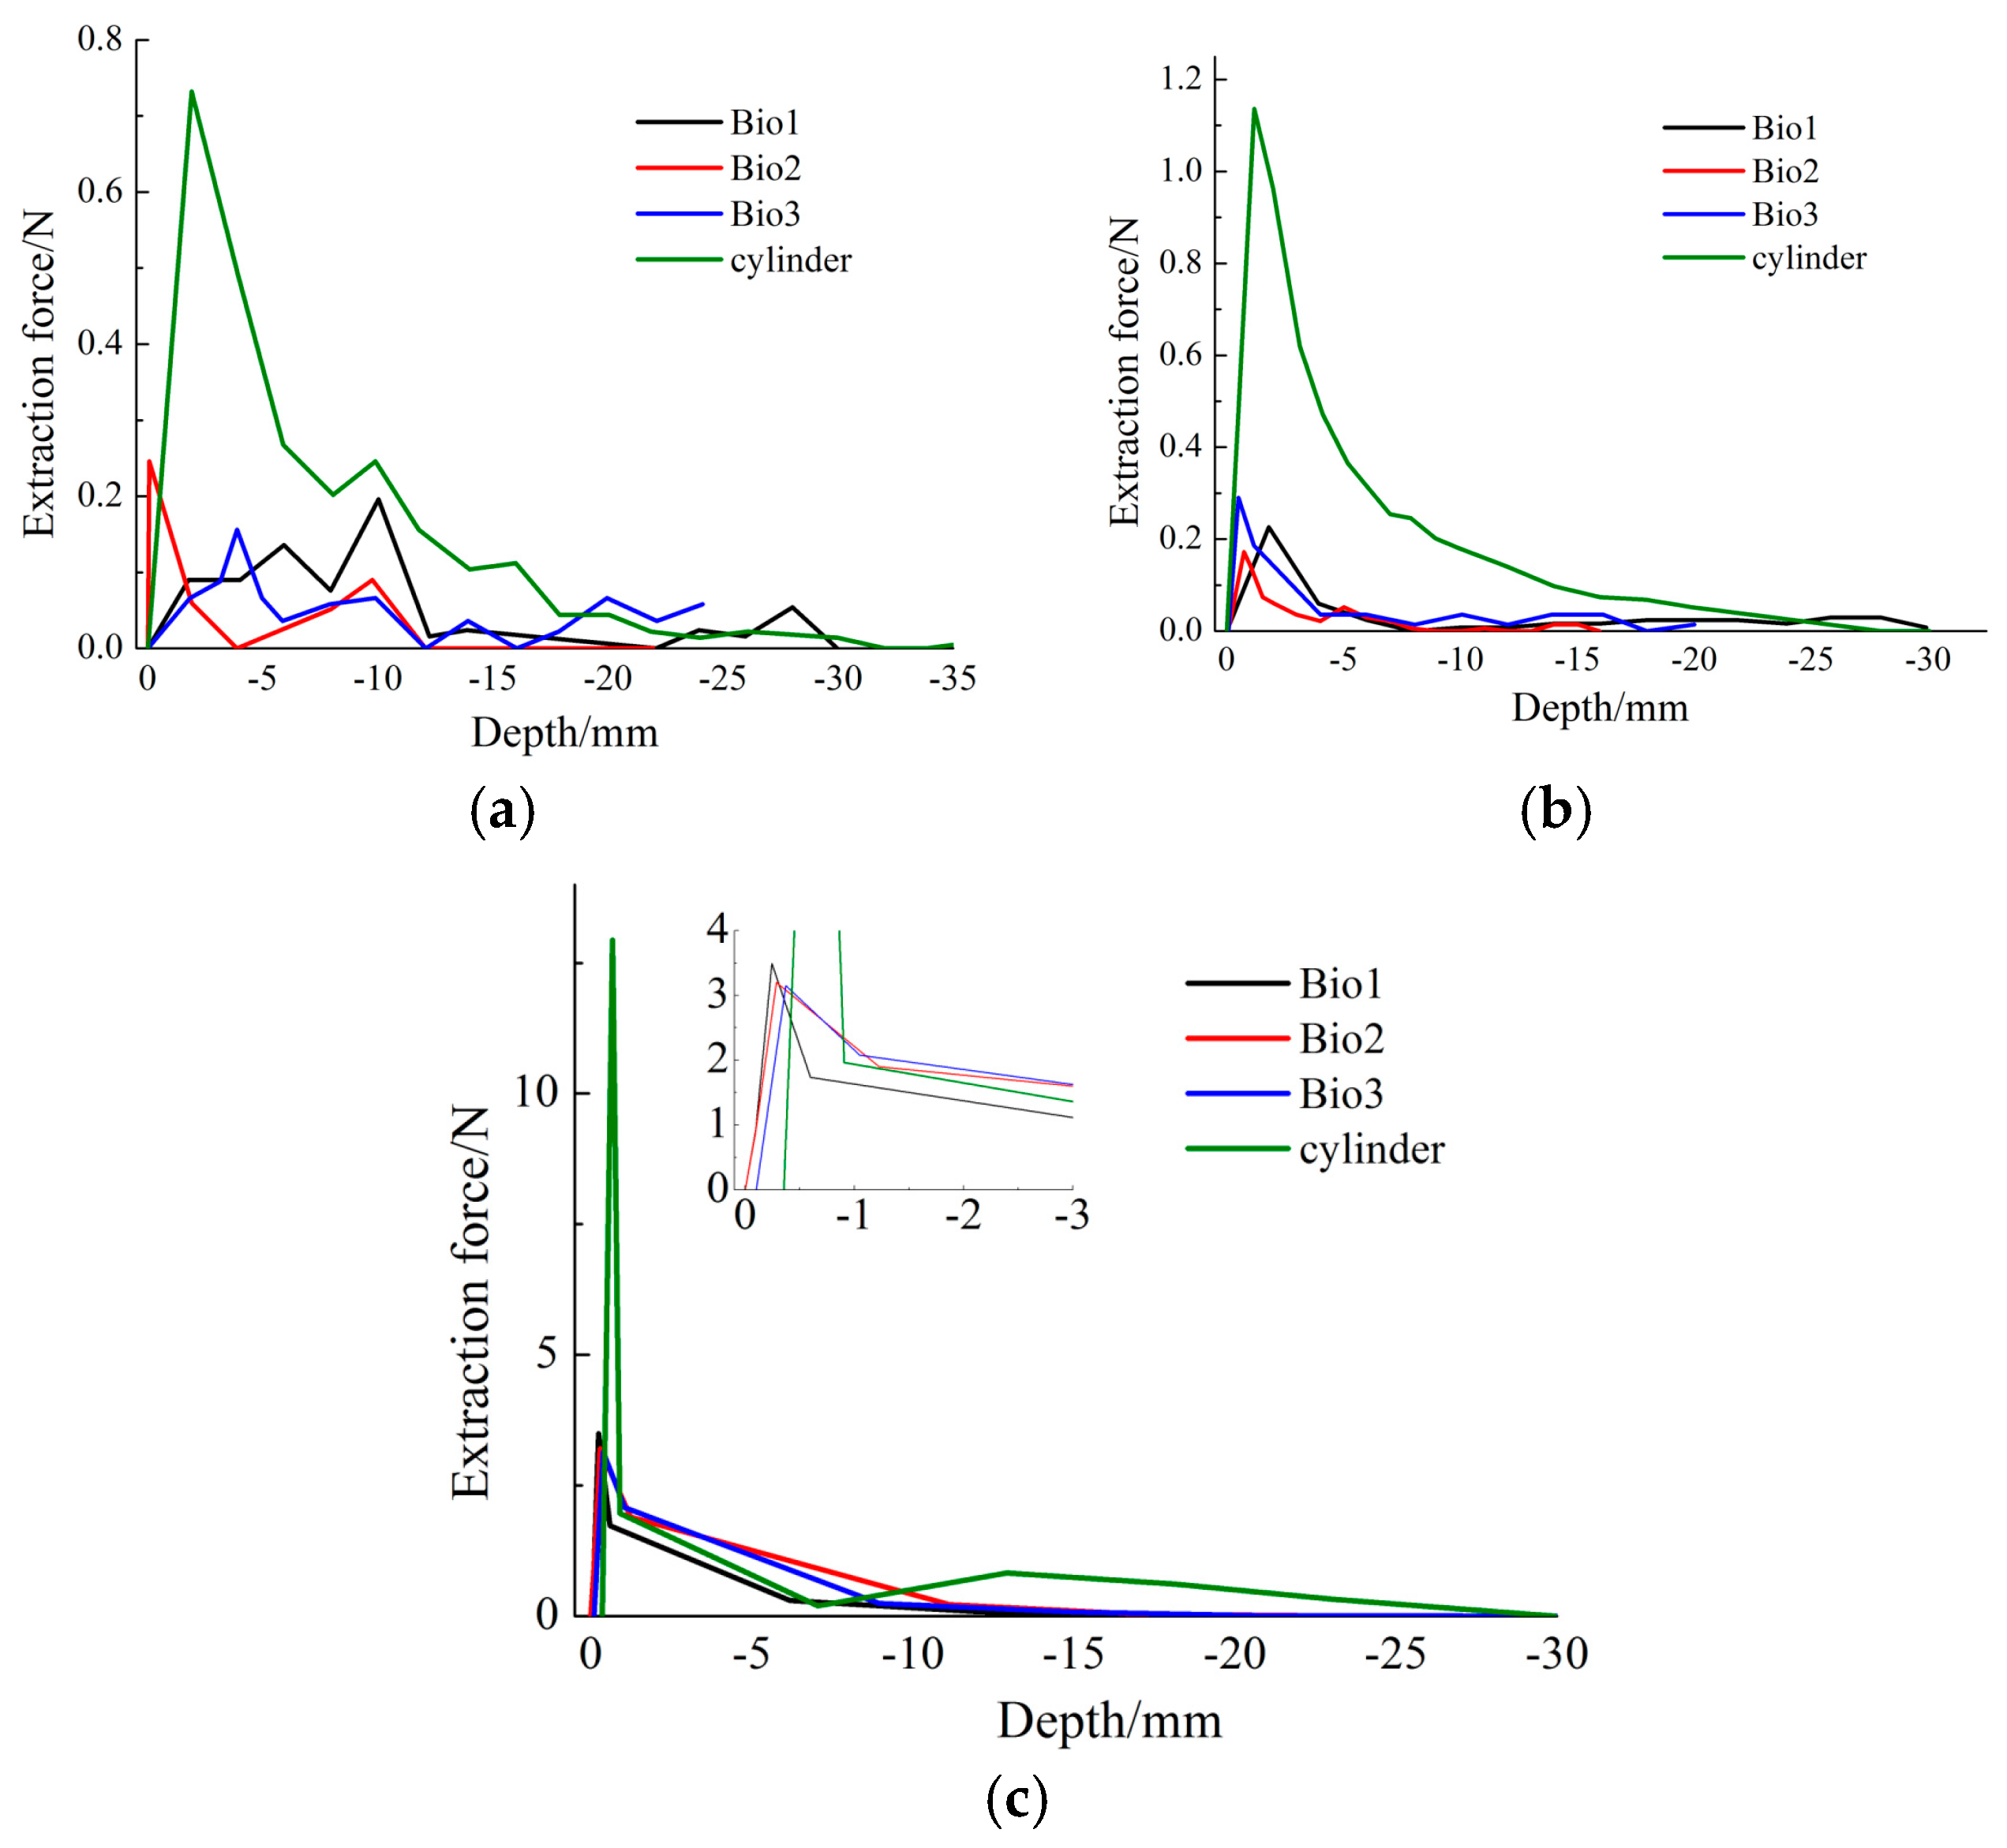
Figure 7 displays the extraction force of walking feet in the motion at 10 mm·min−1. It can be seen that the curves are distinctly different between the bionic walking feet and the cylinder foot. The changes of extraction force showed a characteristic of viscosity. The peak value of the cylinder foot is much higher, which means extraction caused a larger instantaneous pull force. Furthermore, the work can be inferred from the area under the curve (in Section 4.3). The data denoted that it took more force to pull out the cylinder foot from the soil than the bionic walking feet. Meanwhile, the extraction force in clay increased to the peak and then declined sharply because of the adhesive force (Figure 7c).
4.3. Energy Consumption
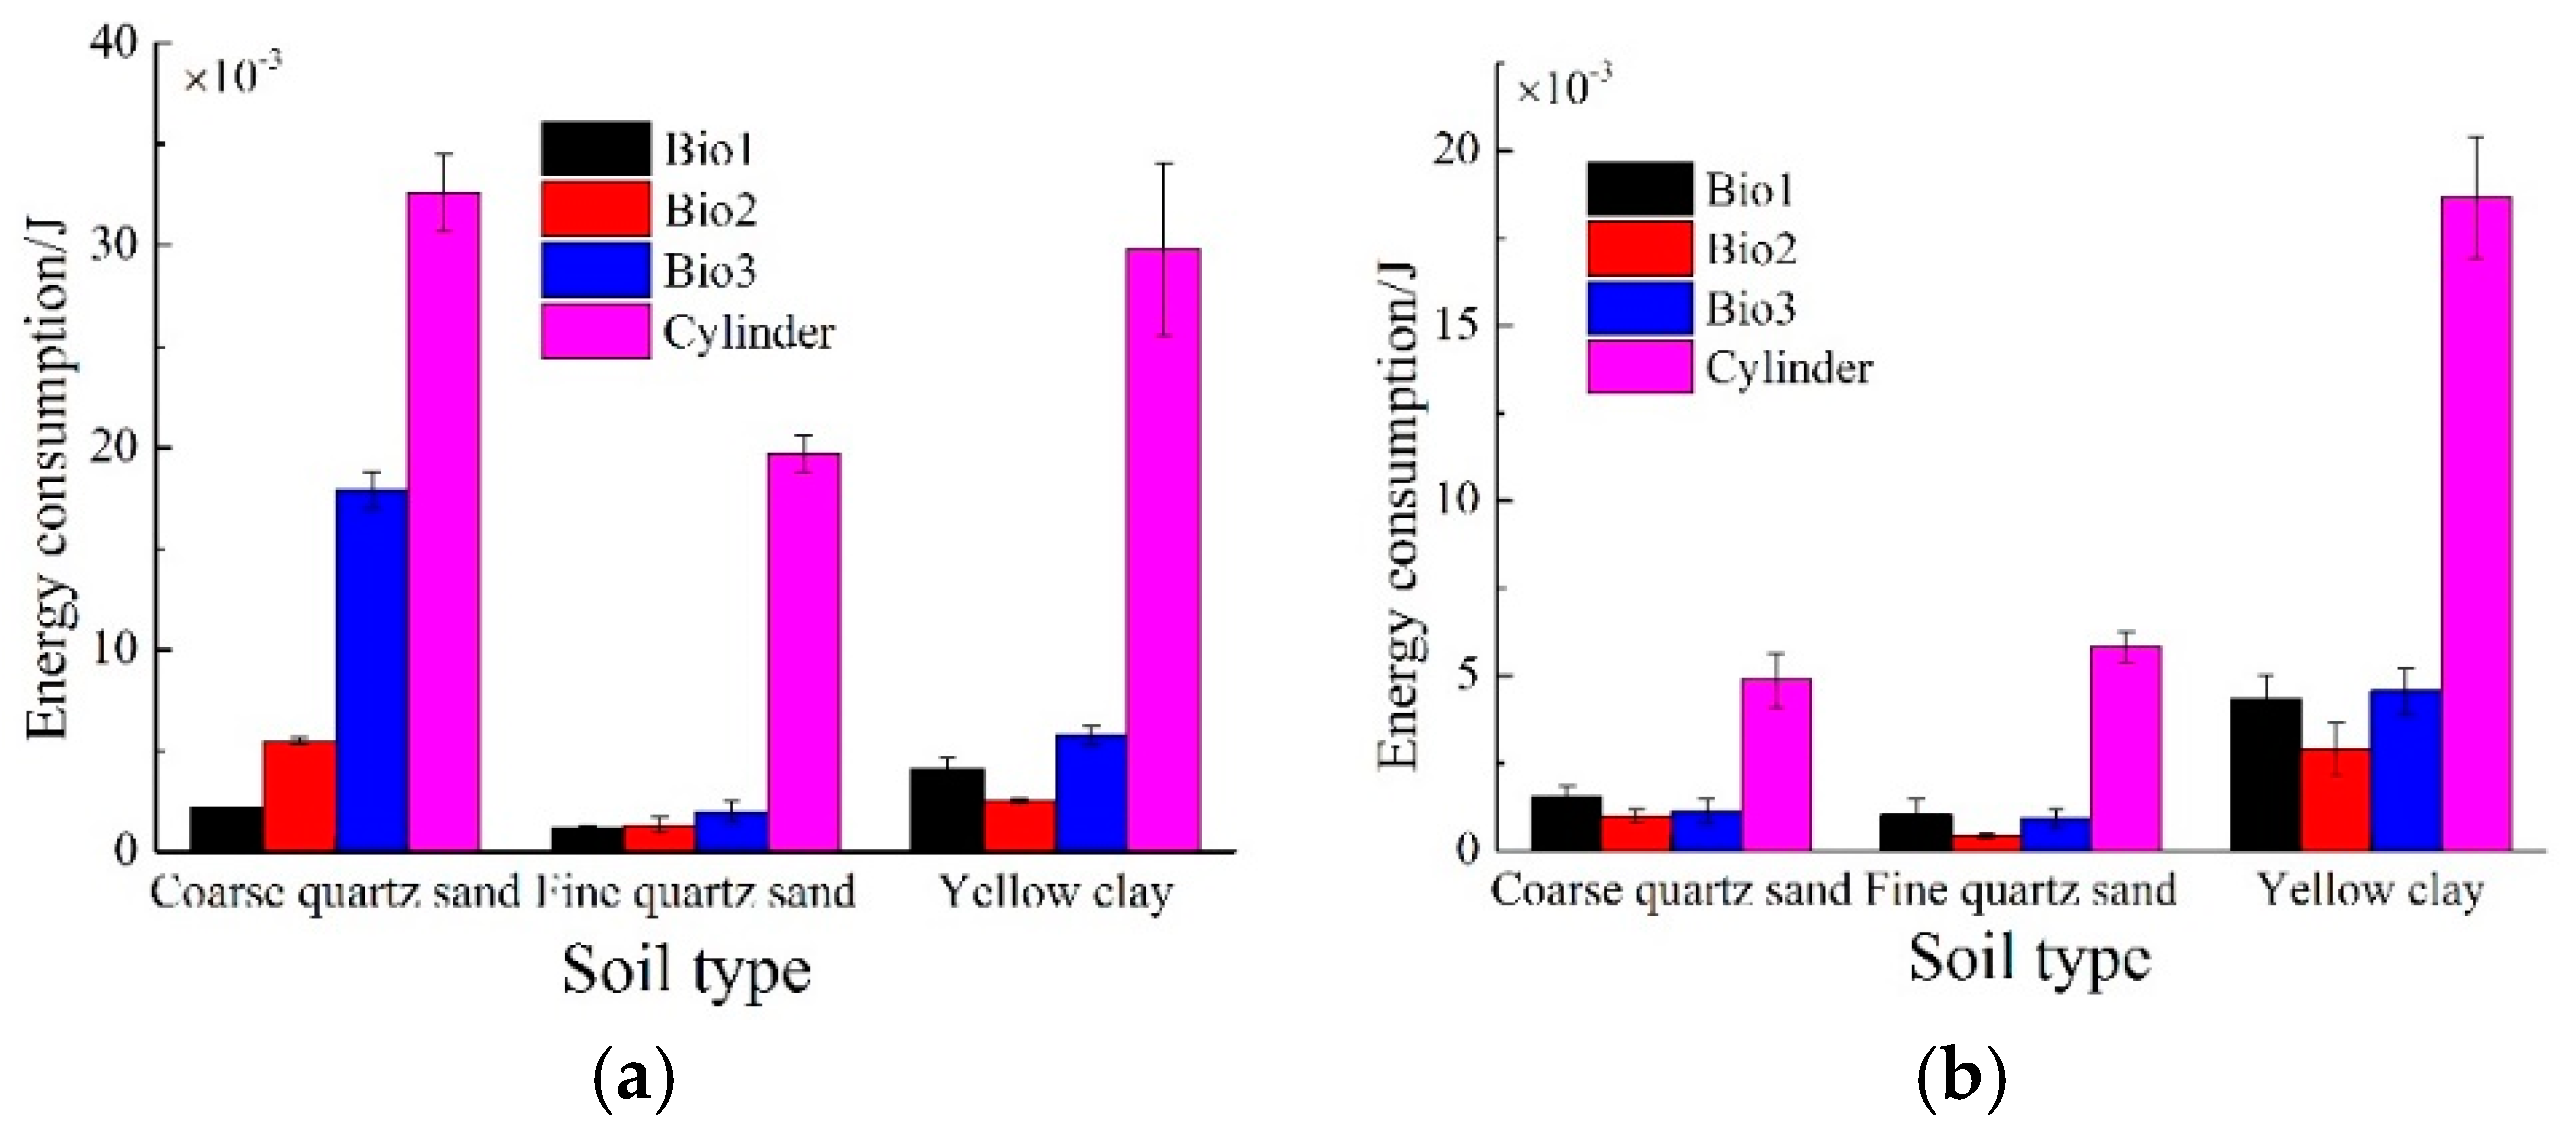
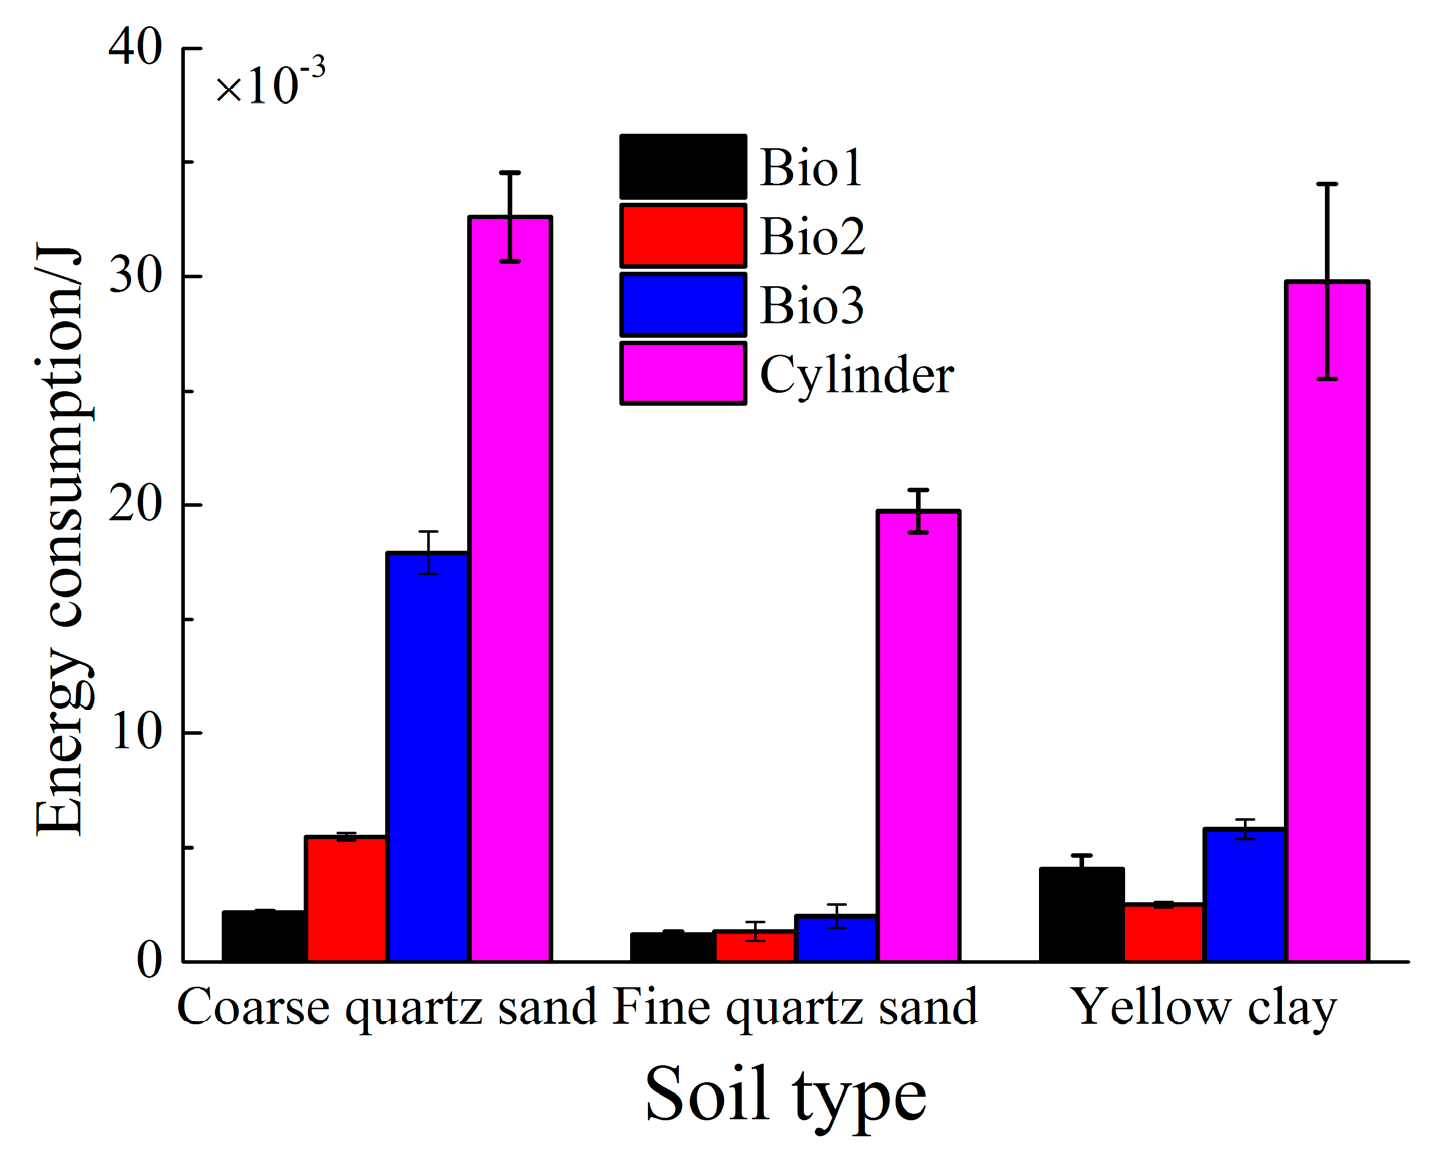
Besides the energy used for work in the motion of the walking foot, part of the energy lost is because of friction, adhesion and so on. What is most hoped for is a decrease in the energy cost for the duration of insertion and extraction. Irrespective of the energy going into heat, the energy consumption of the walking foot can be calculated by equation , where F denotes the intrusion force or extraction force; s denotes the displacements that the walking foot moves. Figure 8 shows the energy consumption of walking feet at 10 mm·min−1. In the tests, the bionic walking feet consumed less energy both in intrusion (Figure 8a) and extraction (Figure 8b). The energy consumption of the bionic walking feet was as low as 1.19 × 10⁻³ in intrusion, and 0.996 × 10⁻³ in extraction. The energy could be reduced by as much as 93.95% (e.g., Bio 1 on fine quartz sand) in the intrusion and 92.78% (e.g., Bio 2 on fine quartz sand) in extraction, compared with cylinder foot. Moreover, Bio 2 behaved better in reducing energy cost among the bionic walking feet, because the adhesive and frictional forces between foot and soil were reduced [23] by the bionic structure (grooves).
4.4. Propulsion Force
The curve of propulsion force relative to displacement (Bio 1, fine quartz sand) is shown in Figure 9. The result showed data fluctuated around a mean value. There is an initial phase where the foot is accelerating and the final phase where boundary effects increase the force, which should be excluded in data gathering.
Propulsion force is formed mainly by the drag of soil. It was investigated in [22] that the force is related to velocity, depth and cross-section. Figure 10 is the change over insertion depth and velocity of Bio 1 on fine quartz sand. It indicated that propulsion force approximately linearly increased with the increase of depth and velocity within the range shown in the figure. Meanwhile, the propulsion force is mainly correlated with depth for the bigger slope. In the experiments, the walking feet showed different performance, shown in Figure 11 (v = 20 mm·min−1, at the depth of 60 mm). The propulsion force of the cylinder foot was larger than the bionic walking feet, which increased by 48.28%. However, there was no significant difference in the propulsion forces among the bionic walking feet. It is consistent with the studies of Wieghardt [20,24].
4.5. Sinkage Versus Propulsion
Previous research on legged vehicles for soft terrain focused on increasing the ground contact area to avoid sinkage, rather than changing the structure of walking foot. It seems that the idea of a cone walking foot is contrary to the theory, but experimental results suggest that great penetrating depth was conducive to generating a larger propulsion force. On the other hand, excessive sinkage may expend more energy during intrusion and extraction, and even make vehicles trapped. Albert [21] found propulsion force was proportional to depth squared for granular material composed of spherical glass beads. For sand with non-spherical grains, it was 2.5th power of the depth. Also propulsion force was linearly associated with cross-section. Therefore, depth was a major influence factor theoretically.
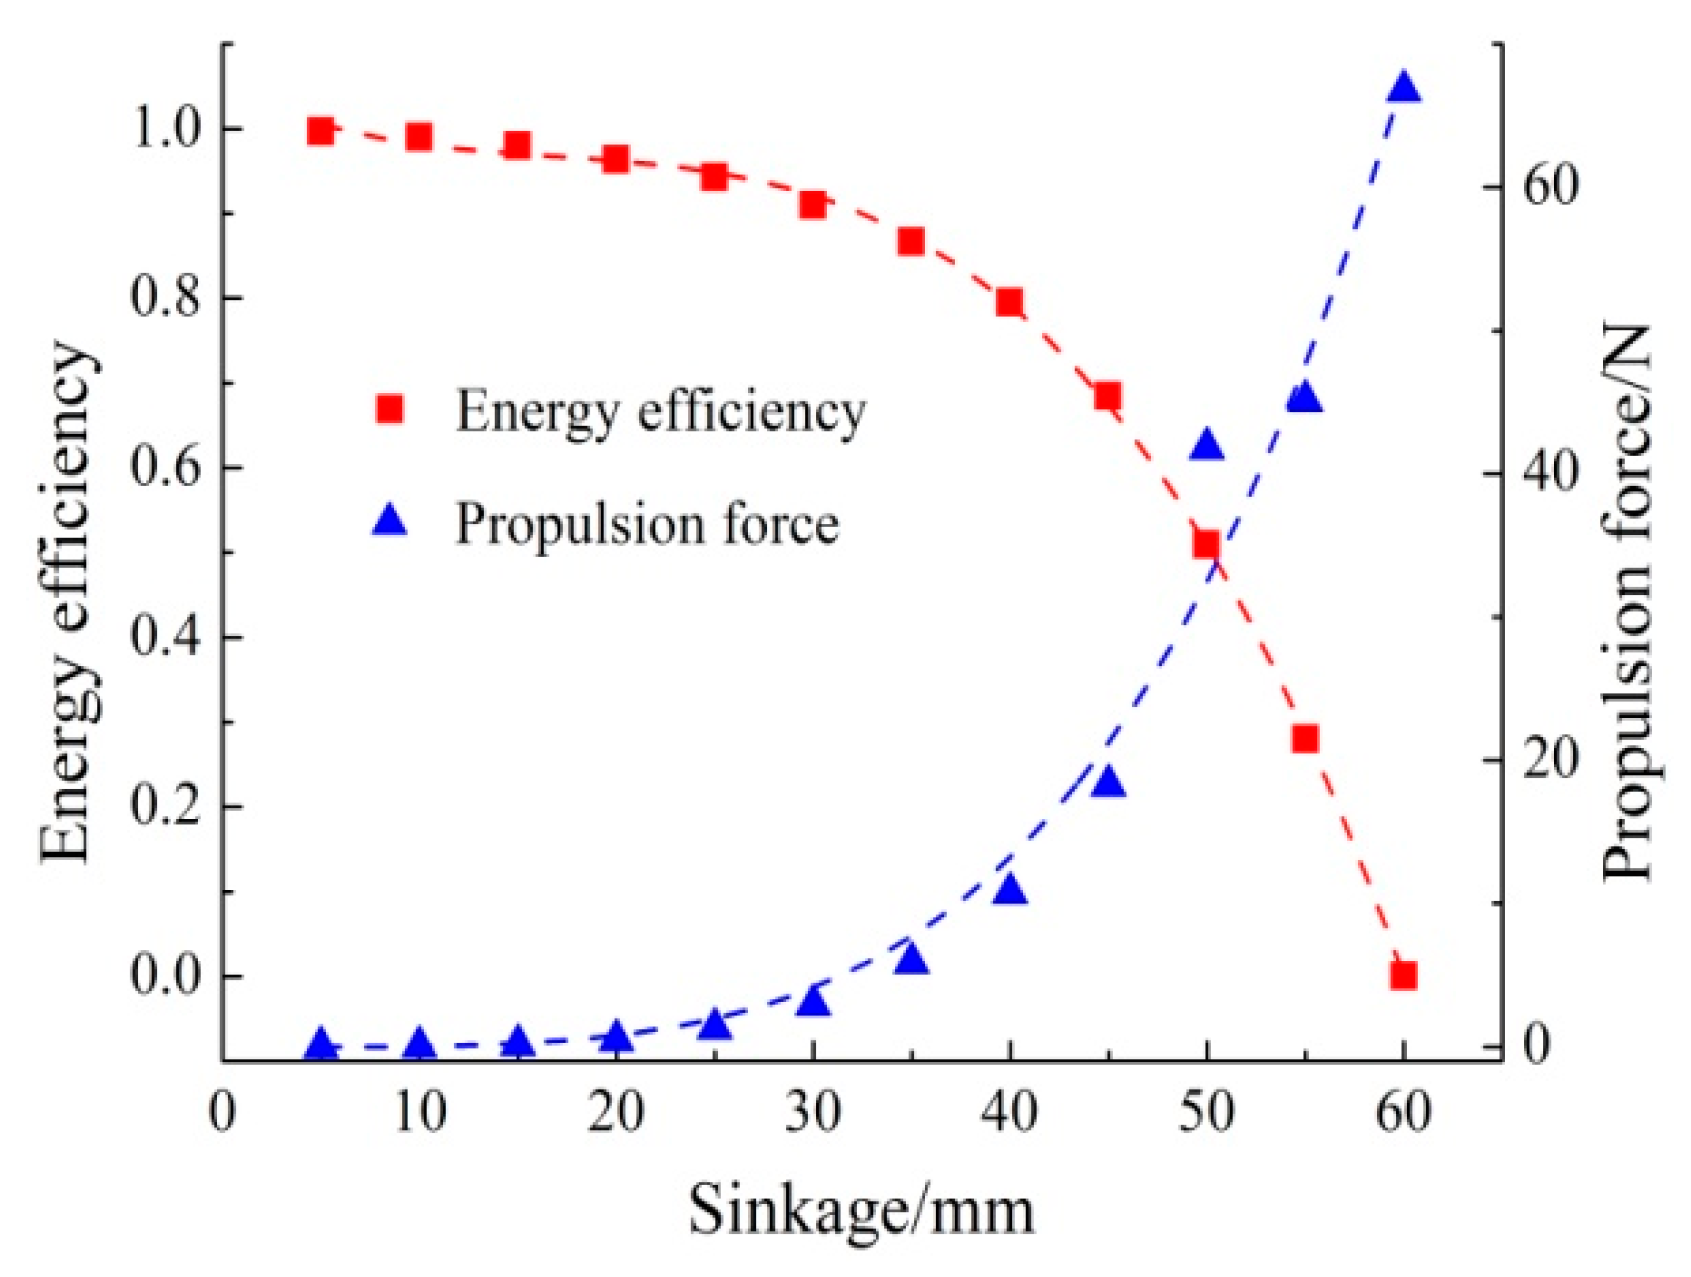
Now we tried to find the balance for sinkage and propulsion in the trials. Take the motion of Bio 1 on fine quartz sand (v = 10 mm·min−1), for example (Figure 12): energy efficiency decreased with sinkage depth sharply in the deeper depth (≥40 mm). By contrast, the curve of propulsion force rose with sinkage sharply at the same point (≥40 mm) as well. It can be found that the sinkage at about 50 mm is the best point to balance the sinkage and propulsion force. Similarly, there would be an optimal value for other walking feet. Hence the cone walking foot translated the sinkage into advantages, integrating the motion of legged vehicles, and they may give larger propulsion than a cylinder foot under the same loading. Thus, it is suitable for lightweight vehicles on soft terrain.
5. Conclusions
In this research, we studied the surface structure of the Chinese mitten crab (Eriocheir sinensis) dactylopodite. Based on the bionics coupling theory, three bionic walking feet and a cylinder foot used for comparison on the aluminum alloy were designed and fabricated successfully. The comparative experiments of mechanical performance on intrusion, extraction and propulsion for walking feet was conducted on different soil. The main conclusions are as follows:
(1) The Chinese mitten crab dactylopodite has six grooves with variable section structure on the surface for achieving good traveling behavior on soft terrain.
(2) Compared with the common cylinder foot, the bionic feet manifested higher reduction of intrusion force and extraction force, reaching a maximum of 90.05~94.38%. The energy consumption in the duration of insertion and extraction were reduced accordingly, which were reduced by as much as 93.95% and 92.78%; Bio 2 behaved better than others.
(3) Propulsion is closely correlated with intrusion depth. Therefore, compared with the cylinder foot, the sinkage of the bionic walking foot helps to achieve larger propulsion force with the same pressure.
(4) The performance of the bionic walking feet were superior in improving the motion efficiency, considering the locomotion procedure of walking foot, which may be applied to lightweight vehicles on soft terrain.
Supplementary Files
Supplementary File 1Acknowledgments
This work was supported by the National Natural Science Foundation of China (No. 51375199, 51405186 and 51375006), Postdoctoral Science Foundation of China (No. 801161050414) and Youth Natural Science Foundation of JILIN province (No. 20140520121JH).
Author Contributions
Jianqiao Li conceived and designed the initial idea; Ying Wang wrote the article manuscript; Xiujuan Li analyzed and interpreted experiments data; Han Huang collected and assembled data; Feng Qiu revised the manuscript for publication.
Conflicts of Interest
The authors declare that there is no conflict of interest regarding the publication of this paper.
References
- Schmiedeler, J.P.; Waldron, K.J. The mechanics of quadrupedal galloping and the future of legged vehicles. Int. J. Robot. Res. 1999, 18, 1224–1234. [Google Scholar] [CrossRef]
- Najmuddin, A.; Fukuoka, Y.; Aoshima, S. A leg-Wheel prototype rover designed to climb steep slope of uncompacted loose sand. In Proceedings of the IEEE International Conference on Robotics and Biomimetics (ROBIO), Shenzhen, China, 12–14 December 2013; pp. 1930–1935. [Google Scholar]
- Ding, L.; Gao, H.; Deng, Z.; Song, J.; Liu, Y.; Liu, G.; Iagnemma, K. Foot-terrain interaction mechanics for legged robots: Modeling and experimental validation. Int. J. Robot. Res. 2013, 32, 1585–1606. [Google Scholar] [CrossRef]
- Shigeo, H.; Yasushi, F.; Kan, Y. Quadruped walking robots at Tokyo institute of technology. IEEE Robot. Autom. Mag. 2009, 16, 104–114. [Google Scholar]
- Raibert, M.; Blankespoor, K.; Nelson, G.R.; The BigDog Team. Bigdog, the rough-terrain quadruped robot. In Proceedings of the 17th International Federation of Automatic Control (IFAC) World Congress, Seoul, Korea, 6–11 July 2008; pp. 10822–10825. [Google Scholar]
- Gonzalez de Santos, P.; Cobano, J.A.; Garcia, E.; Estremera, J.; Armada, M.A. A six-legged robot-based system for humanitarian demining missions. Mechatronics 2007, 17, 417–430. [Google Scholar] [CrossRef]
- Lin, S.C.; Hu, C.J.; Shih, W.P.; Lin, P.C. Model-based experimental development of passive compliant robot legs from fiberglass composites. Appl. Bionics Biomech. 2015, 2015, 754832. [Google Scholar] [CrossRef] [PubMed]
- Zhang, Q.; Ding, X.; Xu, K. Terrain adaptability mechanism of large ruminants’ feet on the kinematics view. Appl. Bionics Biomech. 2015, 2015, 151686. [Google Scholar] [CrossRef] [PubMed]
- Spagna, J.C.; Goldman, D.I.; Lin, P.C.; Koditschek, D.E.; Full, R.J. Distributed mechanical feedback in arthropods and robots simplifies control of rapid running on challenging terrain. Bioinspir. Biomim. 2007, 2, 9–18. [Google Scholar] [CrossRef]
- Li, C.; Zhang, T.; Goldman, D.I. A terradynamics of legged locomotion on granular media. Science 2013, 339, 1408–1412. [Google Scholar] [CrossRef] [PubMed]
- Li, C.; Umbanhowar, P.B.; Komsuoglu, H.; Koditschek, D.E.; Goldman, D.I. Sensitive dependence of the motion of a legged robot on granular media. Proc. Natl. Acad. Sci. USA 2009, 106, 3029–3034. [Google Scholar] [CrossRef] [PubMed]
- Mayyas, M. Bioinspired legged-robot based on large deformation of flexible skeleton. Bioinspir. Biomim. 2014, 9, 46013–46028. [Google Scholar] [CrossRef] [PubMed]
- Oren, Y.K.; Aaron, M.D. Kinematic design of an underactuated robot leg for passive terrain adaptability and stability. J. Mech. Robot. 2013, 5, 1–9. [Google Scholar]
- Zhuang, H.C.; Gao, H.B.; Deng, Z.Q. Analysis method of articulated torque of heavy-duty six-legged robot under its quadrangular gait. Appl. Sci. 2016, 6, 323. [Google Scholar] [CrossRef]
- Full, R.J.; Weinstein, R.B. Integrating the physiology, mechanics and behavior of rapid running ghost crabs: Slow and steady doesn’t always win the race. Am. Zool. 1992, 32, 382–395. [Google Scholar] [CrossRef]
- Blickhan, R.; Full, R.J. Locomotion energetic of the ghost crab II. Mechanics of the centre of mass during walking and running. Exp. Biol. 1987, 130, 155–174. [Google Scholar]
- Martinez, M.M.; Full, R.J.; Koehl, M.A.R. Underwater punting by an intertidal crab: A novel gait revealed by the kinematics of pedestrian locomotion in air versus water. Exp. Biol. 1998, 201, 2609–2623. [Google Scholar]
- Chapple, W. Kinematics of walking in the hermit crab, Pagurus pollicarus. Arthropod. Struct. Dev. 2012, 41, 119–131. [Google Scholar] [CrossRef] [PubMed]
- Herreid, C.F., II; Full, R.J. Locomotion of hermit crabs (Coenobita Compressus) on beach and treadmill. Exp. Biol. 1986, 120, 283–296. [Google Scholar]
- Wieghardt, K. Forces in granular flow. Mech. Res. Commun. 1974, 1, 3–7. [Google Scholar] [CrossRef]
- Albert, R.; Pfeifer, M.A.; Barabási, A.-L.; Schiffer, P. Slow drag in a granular medium. Phys. Rev. Lett. 1999, 82, 205–208. [Google Scholar] [CrossRef]
- Yeomans, B.; Saaj, C.M.; Winnendael, M.V. Walking planetary rovers—Experimental analysis and modeling of leg thrust in loose granular soils. J. Terramech. 2013, 50, 107–120. [Google Scholar] [CrossRef]
- Tong, J.; Almobarak, M.A.M.; Ma, Y.; Ye, W.; Zheng, S. Biomimetic anti-abrasion surfaces of a cone form component against soil. J. Bionic Eng. 2010, 7, 36–42. [Google Scholar] [CrossRef]
- Wieghardt, K. Experiments in granular flow. Annu. Rev. Fluid Mech. 1975, 7, 89–114. [Google Scholar] [CrossRef]
Figure 1.
Dactylopodite of Chinese mitten crab.

Figure 2.
Shapes of cross-section for dactylopodite. (a–e) The images of cross sections under SEM corresponding to the parts (a–e) of dactylopodite in Figure 1, respectively.
Figure 2.
Shapes of cross-section for dactylopodite. (a–e) The images of cross sections under SEM corresponding to the parts (a–e) of dactylopodite in Figure 1, respectively.

Figure 3.
Cross-section of bionic models for dactylopodite. (a–d) The contour curves of cross sections (a–d) in Figure 2, respectively.
Figure 3.
Cross-section of bionic models for dactylopodite. (a–d) The contour curves of cross sections (a–d) in Figure 2, respectively.

Figure 4.
The dimensions and the shapes of walking feet: (a) The dimensions and outline shapes of walking feet; (b) Samples in the trials.
Figure 4.
The dimensions and the shapes of walking feet: (a) The dimensions and outline shapes of walking feet; (b) Samples in the trials.

Figure 5.
Experimental apparatus: (a) apparatus for vertical force test; (b) apparatus for horizontal force test.
Figure 5.
Experimental apparatus: (a) apparatus for vertical force test; (b) apparatus for horizontal force test.

Figure 6.
Intrusion force in different soil: (a) the intrusion force in coarse quartz sand; (b) the intrusion force in fine quartz sand; (c) the intrusion force in yellow clay.
Figure 6.
Intrusion force in different soil: (a) the intrusion force in coarse quartz sand; (b) the intrusion force in fine quartz sand; (c) the intrusion force in yellow clay.
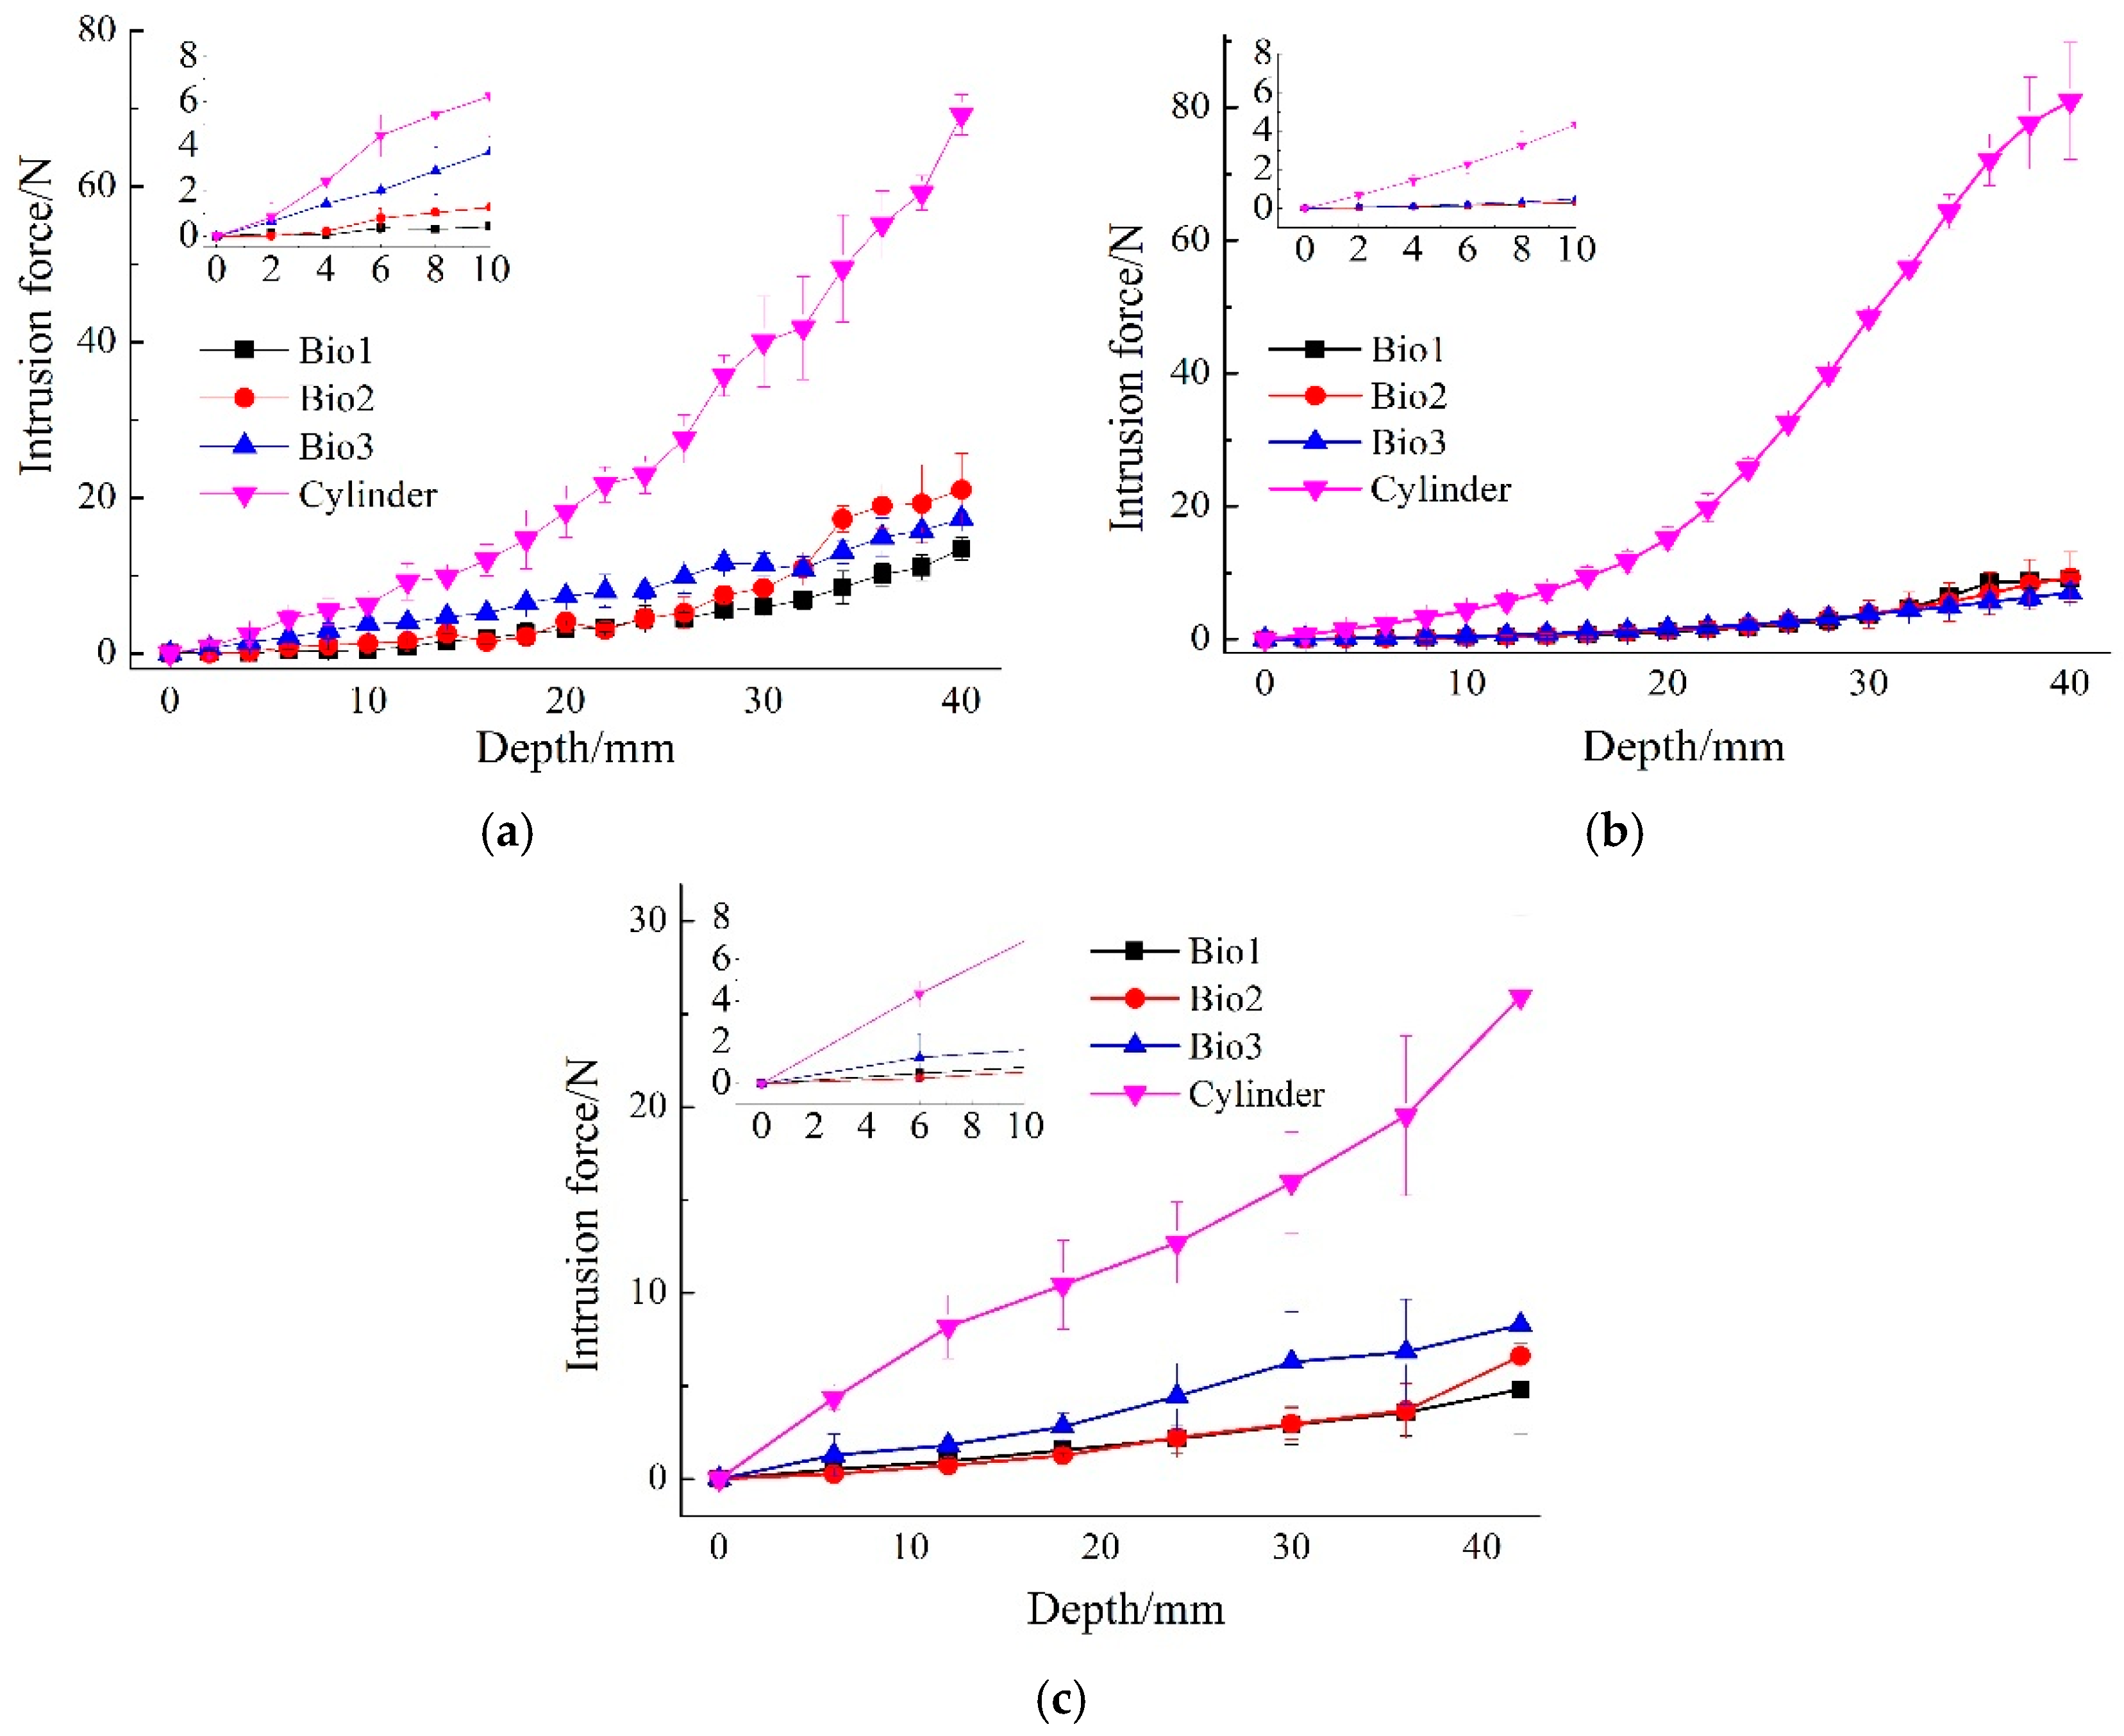
Figure 7.
Extraction force in different soil: (a) the extraction force in coarse quartz sand; (b) the extraction force in fine quartz sand; (c) the extraction force in yellow clay.
Figure 7.
Extraction force in different soil: (a) the extraction force in coarse quartz sand; (b) the extraction force in fine quartz sand; (c) the extraction force in yellow clay.

Figure 8.
Energy consumption: (a) energy consumption during intrusion; (b) energy consumption during extraction.
Figure 8.
Energy consumption: (a) energy consumption during intrusion; (b) energy consumption during extraction.

Figure 9.
Raw data of propulsion force, Bio 1.
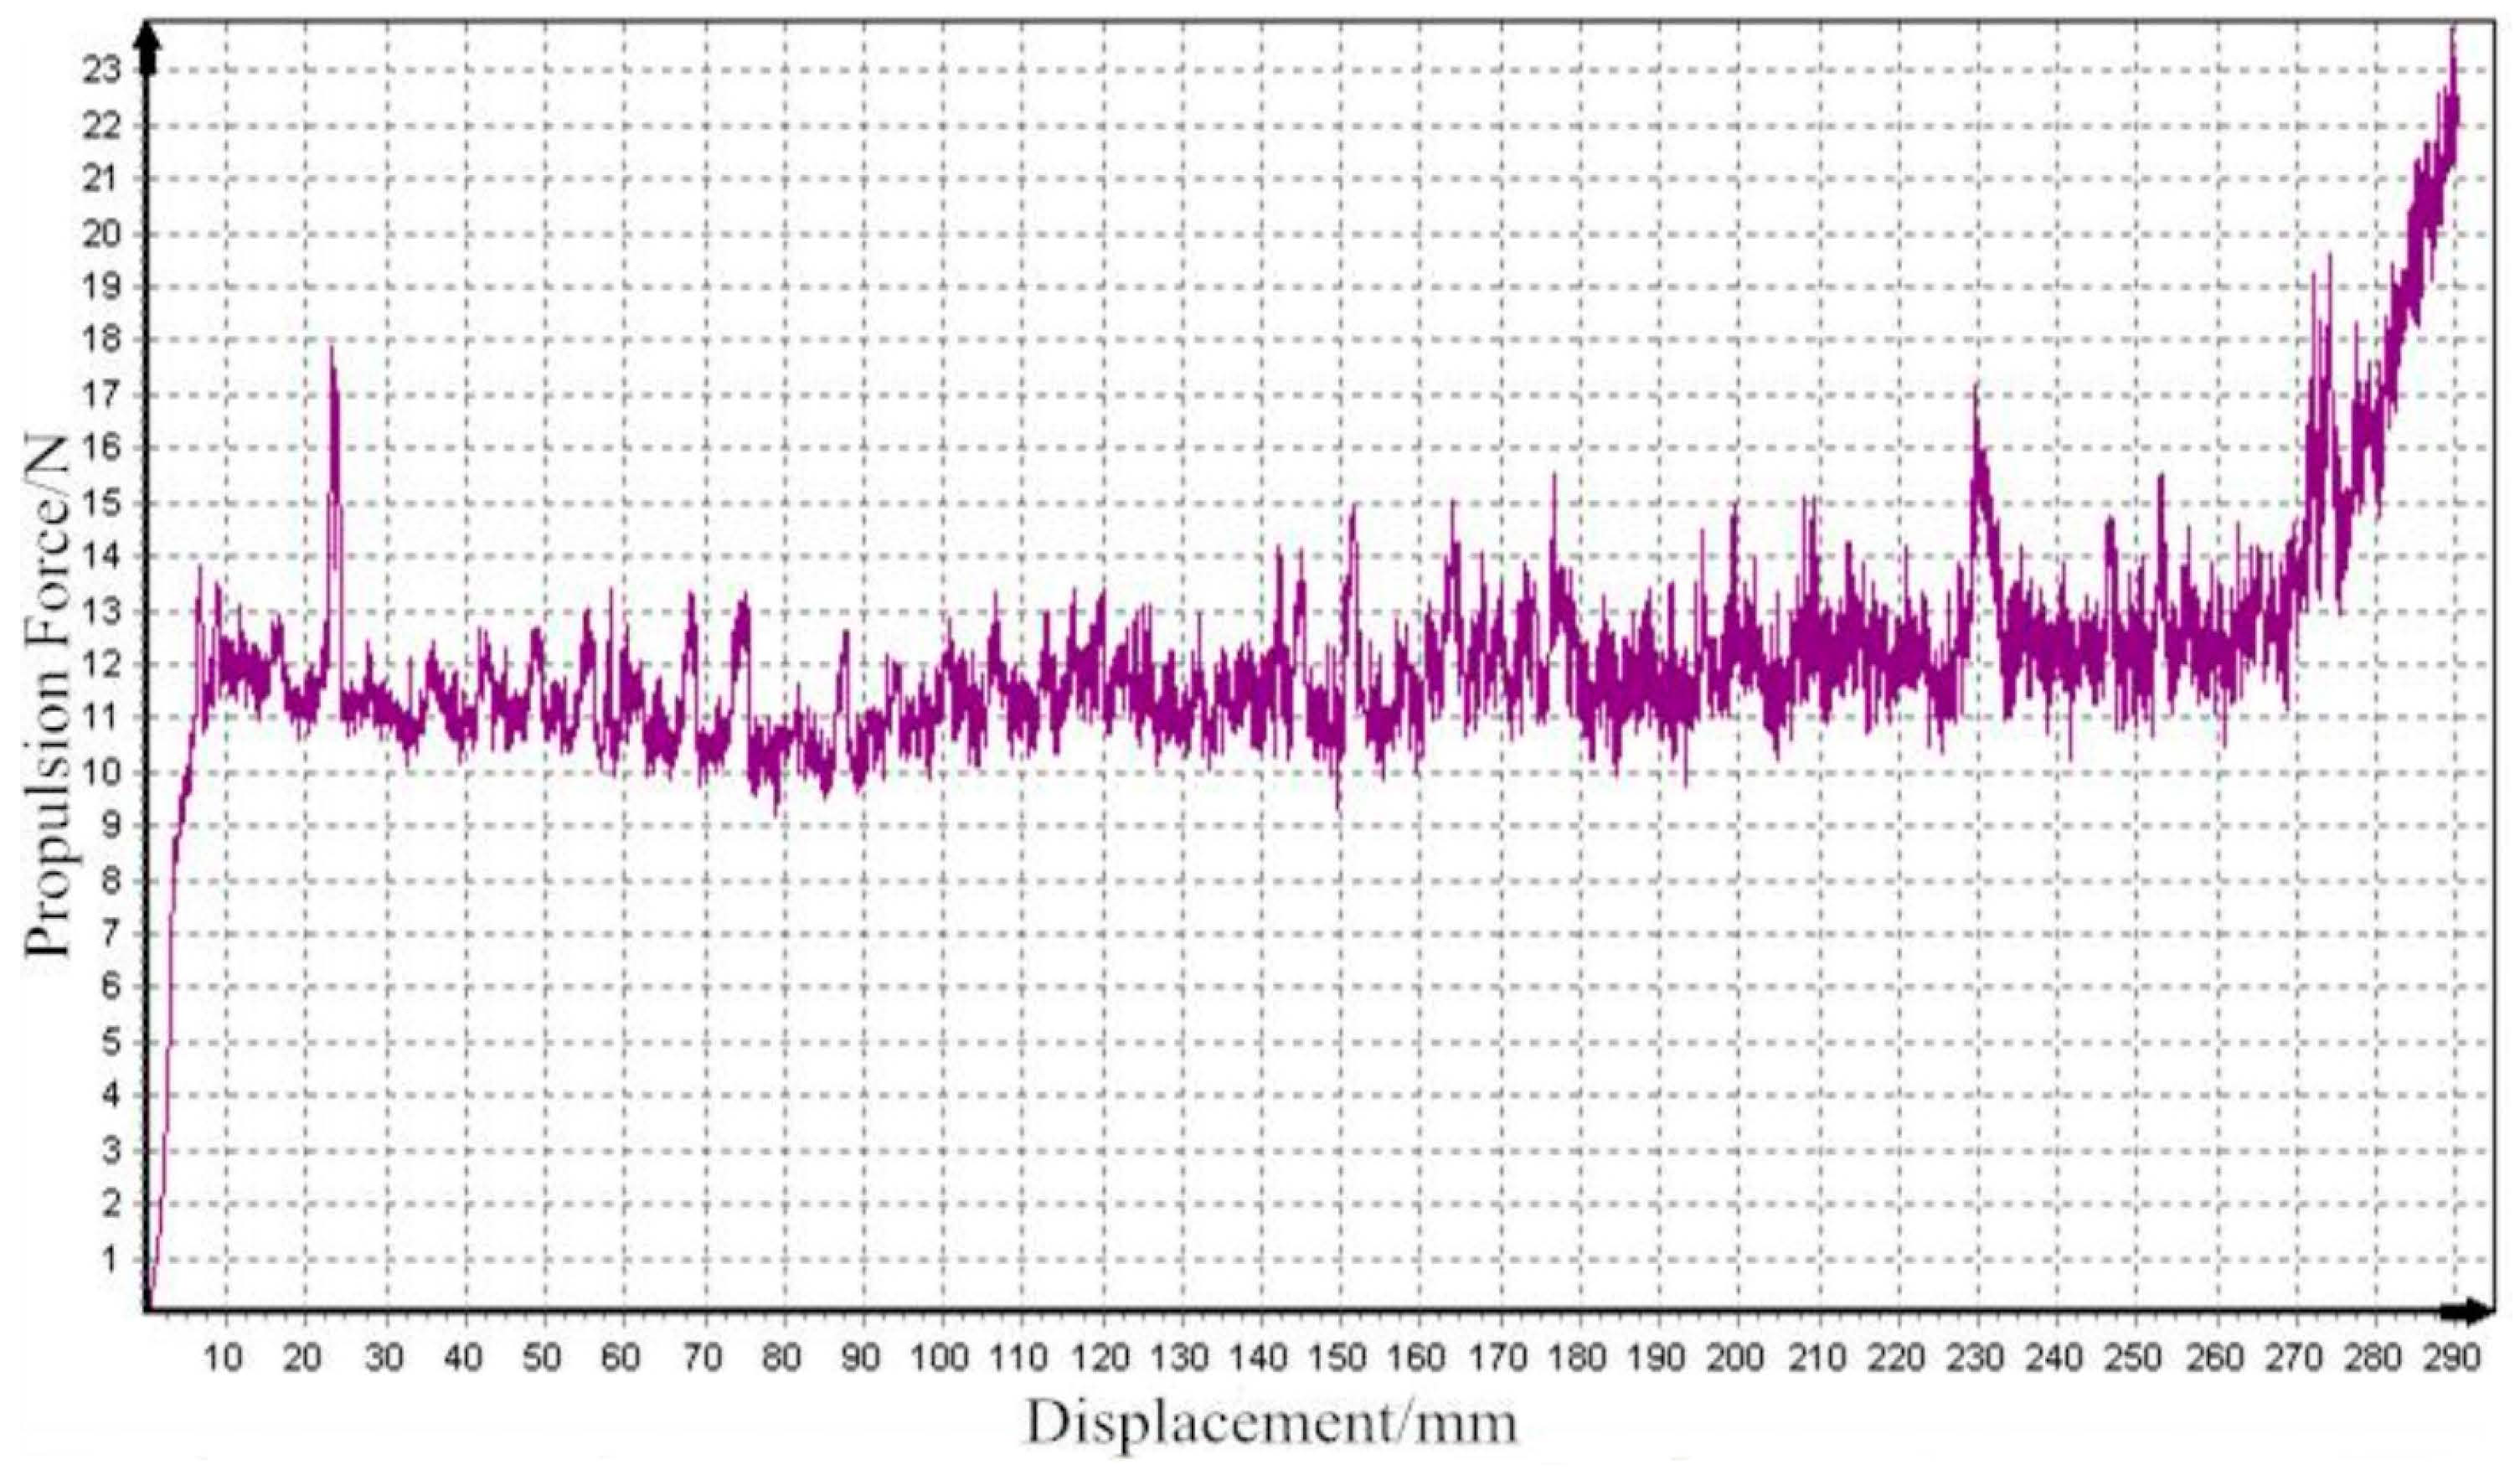
Figure 10.
Propulsion force of Bio 1.
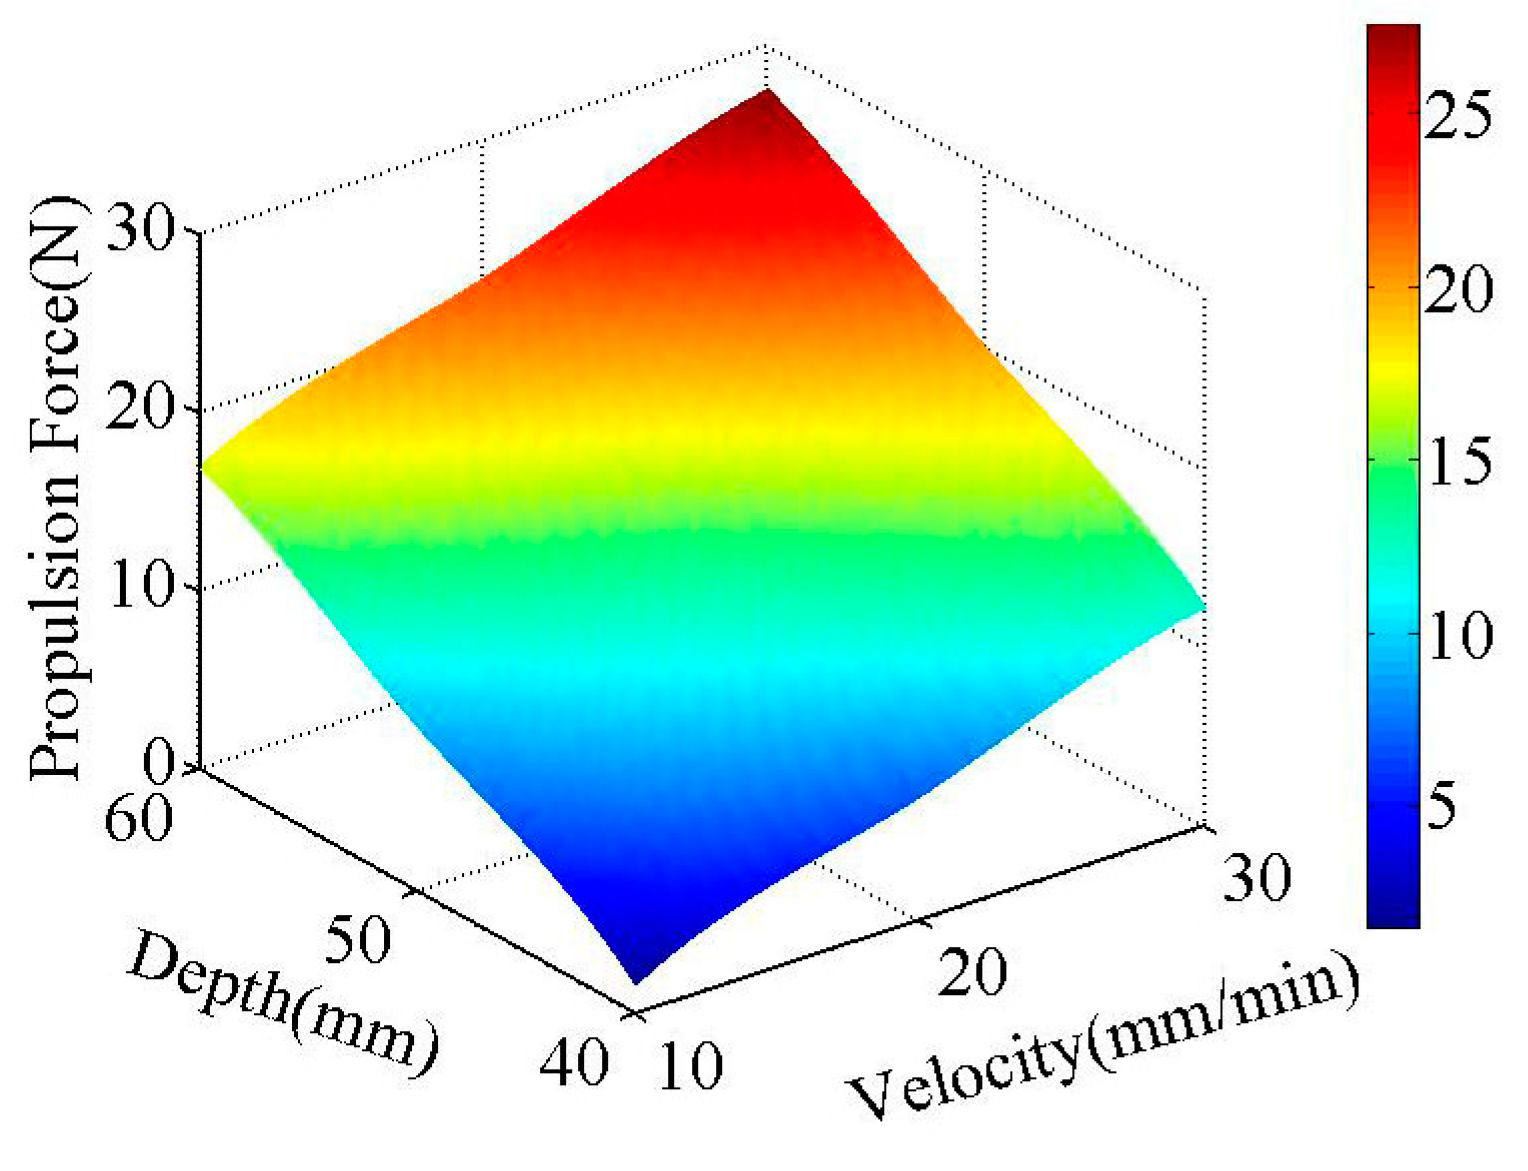
Figure 11.
Propulsion of different walking feet in three kinds of soil (v = 20 mm·min−1, at the depth of 60 mm).
Figure 11.
Propulsion of different walking feet in three kinds of soil (v = 20 mm·min−1, at the depth of 60 mm).

Figure 12.
Changes of energy efficiency and propulsion force versus sikage (Bio 1, v = 10 mm·min−1).
Figure 12.
Changes of energy efficiency and propulsion force versus sikage (Bio 1, v = 10 mm·min−1).


Table 1.
Parameters of soil for the experiments.
| Parameters | Coarse Quartz Sand | Fine Quartz Sand | Yellow Clay |
|---|---|---|---|
| Volume weigh/g·cm−3 | 1.41 ± 0.04 | 1.22 ± 0.03 | 1.69 ± 0.04 |
| Particle size/mm | 0.16–0.2 | 1–2 | In Table 2 |
| Water content/% | 0 | 0 | 27 |
Table 2.
Particle size distribution of yellow clay.
| Particle Size/mm | >2 | 1–2 | 0.5–1 | 0.25–0.5 | 0.1–0.25 | 0.075–0.1 | <0.075 |
|---|---|---|---|---|---|---|---|
| Proportion/% | 11.69 | 20.84 | 23.38 | 13.54 | 15.42 | 1.22 | 13.91 |
© 2017 by the authors. Licensee MDPI, Basel, Switzerland. This article is an open access article distributed under the terms and conditions of the Creative Commons Attribution (CC BY) license (http://creativecommons.org/licenses/by/4.0/).
Share and Cite
MDPI and ACS Style
Wang, Y.; Li, J.; Li, X.; Huang, H.; Qiu, F. Bionic Walking Foot and Mechanical Performance on Soil. Appl. Sci. 2017, 7, 575. https://doi.org/10.3390/app7060575
AMA Style
Wang Y, Li J, Li X, Huang H, Qiu F. Bionic Walking Foot and Mechanical Performance on Soil. Applied Sciences. 2017; 7(6):575. https://doi.org/10.3390/app7060575
Chicago/Turabian StyleWang, Ying, Jianqiao Li, Xiujuan Li, Han Huang, and Feng Qiu. 2017. "Bionic Walking Foot and Mechanical Performance on Soil" Applied Sciences 7, no. 6: 575. https://doi.org/10.3390/app7060575
Note that from the first issue of 2016, this journal uses article numbers instead of page numbers. See further details here.