Article

Impact of the Fused Deposition (FDM) Printing Process on Polylactic Acid (PLA) Chemistry and Structure

1
Engineering Bldg. Rm 309, Department of Materials Science and Chemical Engineering, Stony Brook University, Stony Brook, NY 11794-2275, USA
2
Department of Physics, SUNY New Paltz, New Paltz, NY 12561, USA
3
Department of Materials Science and Engineering, Binghamton University, Binghamton, NY 13901, USA
*
Author to whom correspondence should be addressed.
Appl. Sci. 2017, 7(6), 579; https://doi.org/10.3390/app7060579
Submission received: 31 March 2017 / Revised: 18 May 2017 / Accepted: 25 May 2017 / Published: 4 June 2017
(This article belongs to the Special Issue Materials for 3D Printing)

Abstract

:

Featured Application

Detailed chemical and structural changes to polylactid acid (PLA) from source material through 3D printing needs to be quantified in order to use PLA 3D printed structures for specific applications. This work was specifically motivated for specific applications for in situ synthesis of silver nanoparticles on printed PLA surfaces used in antimicrobial applications and the development and characterization of PLA constructs for tissue engineering.

Abstract

Polylactic acid (PLA) is an organic polymer commonly used in fused deposition (FDM) printing and biomedical scaffolding that is biocompatible and immunologically inert. However, variations in source material quality and chemistry make it necessary to characterize the filament and determine potential changes in chemistry occurring as a result of the FDM process. We used several spectroscopic techniques, including laser confocal microscopy, Fourier transform infrared (FTIR) spectroscopy and photoacousitc FTIR spectroscopy, Raman spectroscopy, and X-ray photoelectron spectroscopy (XPS) in order to characterize both the bulk and surface chemistry of the source material and printed samples. Scanning electron microscopy (SEM) and differential scanning calorimetry (DSC) were used to characterize morphology, cold crystallinity, and the glass transition and melting temperatures following printing. Analysis revealed calcium carbonate-based additives which were reacted with organic ligands and potentially trace metal impurities, both before and following printing. These additives became concentrated in voids in the printed structure. This finding is important for biomedical applications as carbonate will impact subsequent cell growth on printed tissue scaffolds. Results of chemical analysis also provided evidence of the hygroscopic nature of the source material and oxidation of the printed surface, and SEM imaging revealed micro- and submicron-scale roughness that will also impact potential applications.

1. Introduction

3D printing is an emerging technology that can be used to construct complex structures inexpensively for modeling, prototyping, or production through deposition or solidification. Fused deposition modeling (FDM) is a standard method for 3D printing using thermoplastic feedstock, in which heated extruders deposit material in patterns determined by translated computer-assisted design (CAD) files, and build up structures layer by layer [1].
Polylactic acid (PLA) is a racemic mixture of D and L lactide [2,3], an aliphatic polyester thermoplastic derived from starches of corn and sugarcane. PLA is immunologically inert [4] as it gradually degrades into innocuous lactic acid over time (six months to two years) [5] making it attractive for use in the field of medicine, such as for medical implants (screws, pin, rods, and meshes) [6]. Additionally, PLA has a low glass transition temperature (Tg = 60–65 °C) and melting temperature (Tm = 173–178 °C), making it very useful for 3D printing since it does not require a heated surface for the objects being printed. While there is a good amount of anecdotal evidence that PLA materials supplied by various vendors produces final prints which vary considerably in terms of mechanical properties, interlayer adhesion, and appearance [7], very few published studies exist which discuss the relationship between source material chemistry and the properties (including chemistry and structure) of the structures created by desktop FDM printers, despite their use in research applications. In addition, no studies which the authors could find in the literature employ advanced chemical and surface spectroscopic techniques to characterize these relationships.
This study involved only one commercial source of PLA filament and one popular type of FDM printer. While a more extensive comparison would no doubt be useful, a more narrow in-depth study was selected due to constraints and the realization that disseminating these results to the wider community would likely benefit a broad range of studies (while we continue to expand the scope of the study). The reported results were also critical to our other ongoing work using the printed surfaces described in this report, which is pending publication. These two studies focus on the in situ synthesis of silver nanoparticles on printed PLA surfaces used in antimicrobial applications, and the development and characterization of PLA constructs for tissue engineering. These studies extend the current research through understanding the role of surface chemistry and structure on surface functionalization and cell growth and attachment, two areas critical to the emerging applications of printed PLA.

2. Materials and Methods

2.1. Fused Deposition (FDM) Printing

Makerbot Replicator and Replicator 2× FDM-type 3D printers (Makerbot, New York City, NY, USA), in conjunction with Makerware software version 2.4.1.62 were used to build 1.0 cm2 × 0.2 cm thick PLA samples from natural 1.75 mm PLA filament (Nature Works). Printing parameters were set to standard (0.2 mm) or high (0.1 mm) resolution (100–200 micron) with an extruder temperature of 229 °C and an extrusion speed of 90 mm/s with 150 mm/s traveling speed with a 0.5 mm diameter brass nozzle. The printer extruder head deposits the melted PLA layer by layer with the aid of rafts or support structures to create the intended structure. All materials were handled with gloved hands and following standard surface analysis laboratory practices to minimize any possible contamination.

2.2. Optical Microscopy

All optical images were collected with a Meiji optical microscope with a Nikon DXM 1200 digital camera and a 0.6× HRD 060-CMT by Diagnostic Instruments using ACT 1 version 2.20 software. Images were also collected from test samples before and after Raman microspectroscopy to compare the overall appearance of areas analyzed to their respective chemical spectra. This also aided in ensuring no damage had been induced by the Raman laser.

2.3. Scanning Electron Microscopy (SEM)

The system used was a Schottky field emission scanning electron microscope (SEM) LEO Gemini 1550 equipped with a Robinson backscatter Gemini detector with Energy dispersive X-ray analysis (EDAX) detector, in-lens secondary electron (SE) detector, a Rutherford backscatter electron detector (RBSD), and an electron backscattered electron diffraction (EBED) analysis system. SEM was used primarily for determining surface morphology and to determine impurities in the material.

2.4. Confocal Microscopy

Confocal microscopy data was collected with an upright Leica DM 6000 microscope, with adaptive focus, motorized XY-Stage (15 nm step size) and Super Z Galvo (1500 µm/3 nm step size). The system is equipped with an 8 khZ tandem scanner and both white light (470–670 nm) and UV (405 nm) lasers, capable of providing a 400–800 nm detection range for fluorescence imaging. The sample was mounted on a non-fluorescing slide, and the filament and finished print were imaged using a 10× objective and a broad band UV laser excitation.

2.5. Raman Spectroscopy

Raman analysis was conducted using an Almega dispersive Raman microscope (Thermo Nicolet, Madison WI, USA) with a 785 nm laser source. Alignment of the laser and all the optical components was conducted prior to analysis. The detector was cooled to −50 °C throughout the experiment. The samples were analyzed with 64 cumulative scans with optimized laser power, aperture size, and duration (1–6 s) per exposure in order to achieve the best signal to noise ratio, and/or spot size. All analyzed locations of the respective samples analyzed by Raman spectroscopy had their color, texture, laser power, and aperture size recorded and several were photographed using the optical microscope and camera. Throughout the Raman analysis the laser power was kept below 50% in order to insure no thermal damage was induced as reported by de Faria [8], and Hanesch [9]. Our previous work has shown that lowering Raman laser intensity can preserve even samples known to be thermally unstable [10]. Samples were placed on a quartz microscope slide (Ted Pella) which is Raman-inactive and, therefore, will not produce any spurious peaks in the analyzed samples.

2.6. Fourier Transform Infrared (FTIR) Spectroscopy

FTIR was conducted with a Nicolet 560 IR spectrometer or an iS50 FTIR spectrometer, both using a liquid nitrogen cooled MCT-A detector or a DGTS detector (at room temperature), A data resolution of 4 cm−1 and data spacing of 0.482 cm−1 were used, and data was summed over 256 scans for a better signal to noise ratio. Sampling areas were continuously purged with dry air throughout the experiments in order to prevent the additional absorption of water vapor in the samples being analyzed.

2.7. X-ray Photoelectron Spectroscopy (XPS)

XPS was conducted using a custom-designed system with an X-ray source from PHI Electronics (10–12 KV at 10 m amps at 65–75 Watts) with a spectrometer utilizing a V.G. Scientific (Fisons) CLAM 100 hemispherical analyzer with a VGX900I controller data collection system. The X-ray source was Al Kα1,2 (1486.6 eV) with a pass energy of 20 or 50 eV, and 100 eV for the wide scan only and a work function of 4.55 eV. All XPS analysis was conducted at an ultrahigh vacuum of 1.0 × 10⁻⁹ to 1.0 × 10⁻⁸ torr. All XPS Spectra were taken at 90° take off angle with respect to the sample surface and all spectra were corrected for charging by using the C 1 s line of adventitious carbon at 284.6 eV as a reference. All curve fitting followed the methods outlined by Savitsky and Golay [11], and Sherwood [12], as well as procedures developed over the years by Halada and Clayton [13,14,15] using CASA software version 1.001. XPS was performed on select samples to determine the surface (depth analysis 5–10 nm) chemical changes taking place on the spool material and the resulting printed 3D structures.

2.8. Differential Scanning Calorimetry (DSC)

Differential scanning calorimetry (DSC) was conducted using a TA Instruments Q2000 [16], under a 20 mm/min nitrogen atmosphere. All samples were weighed prior to the experiment and all were to be approximately 10 mg. The heat was increased at a rate of 10 °C per minute and reached a maximum temperature of 210 °C and then reversed in a cooling phase of 5 °C per minute to reach a final temperature of 25 °C. This data was used to generate a graph of the heat flux versus temperature.

3. Results and Discussion

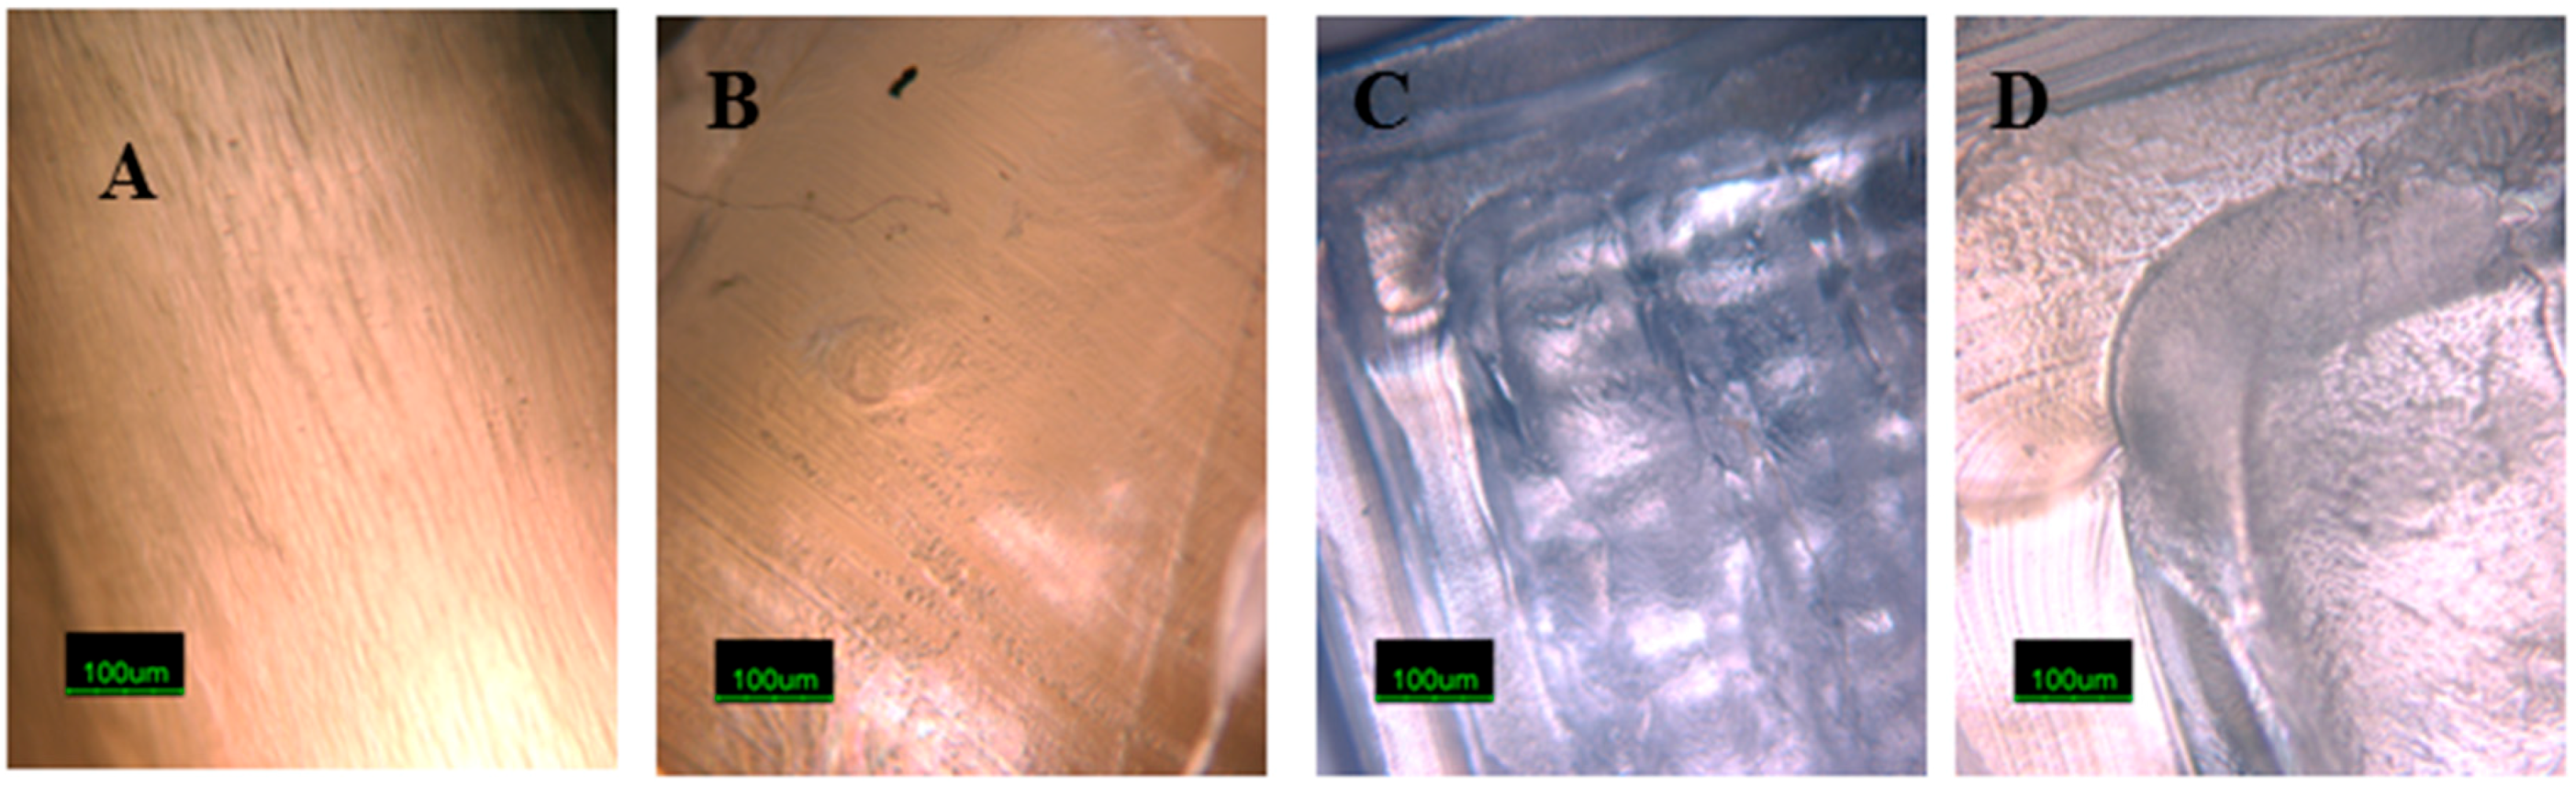
3.1. Optical Microscopy

Optical microscope imaging of the test samples was used to determine surface morphology, location of pores or any other potential defects that can occur in the printed samples at different printing resolutions. Three printing resolutions were used: low (0.3 mm), standard (0.2 mm), and high (0.1 mm).
Figure 1A,B are microscope images of the PLA spool material, lengthwise section and cross-section, respectively. It can be observed that the spool material has noticeable features possibly attributable to impurities or variability in material properties created by the extrusion process. Figure 1C,D are microscope images of a corner of a 3D printed test sample at different magnifications, highlighting the porous nature and roughness of the material.

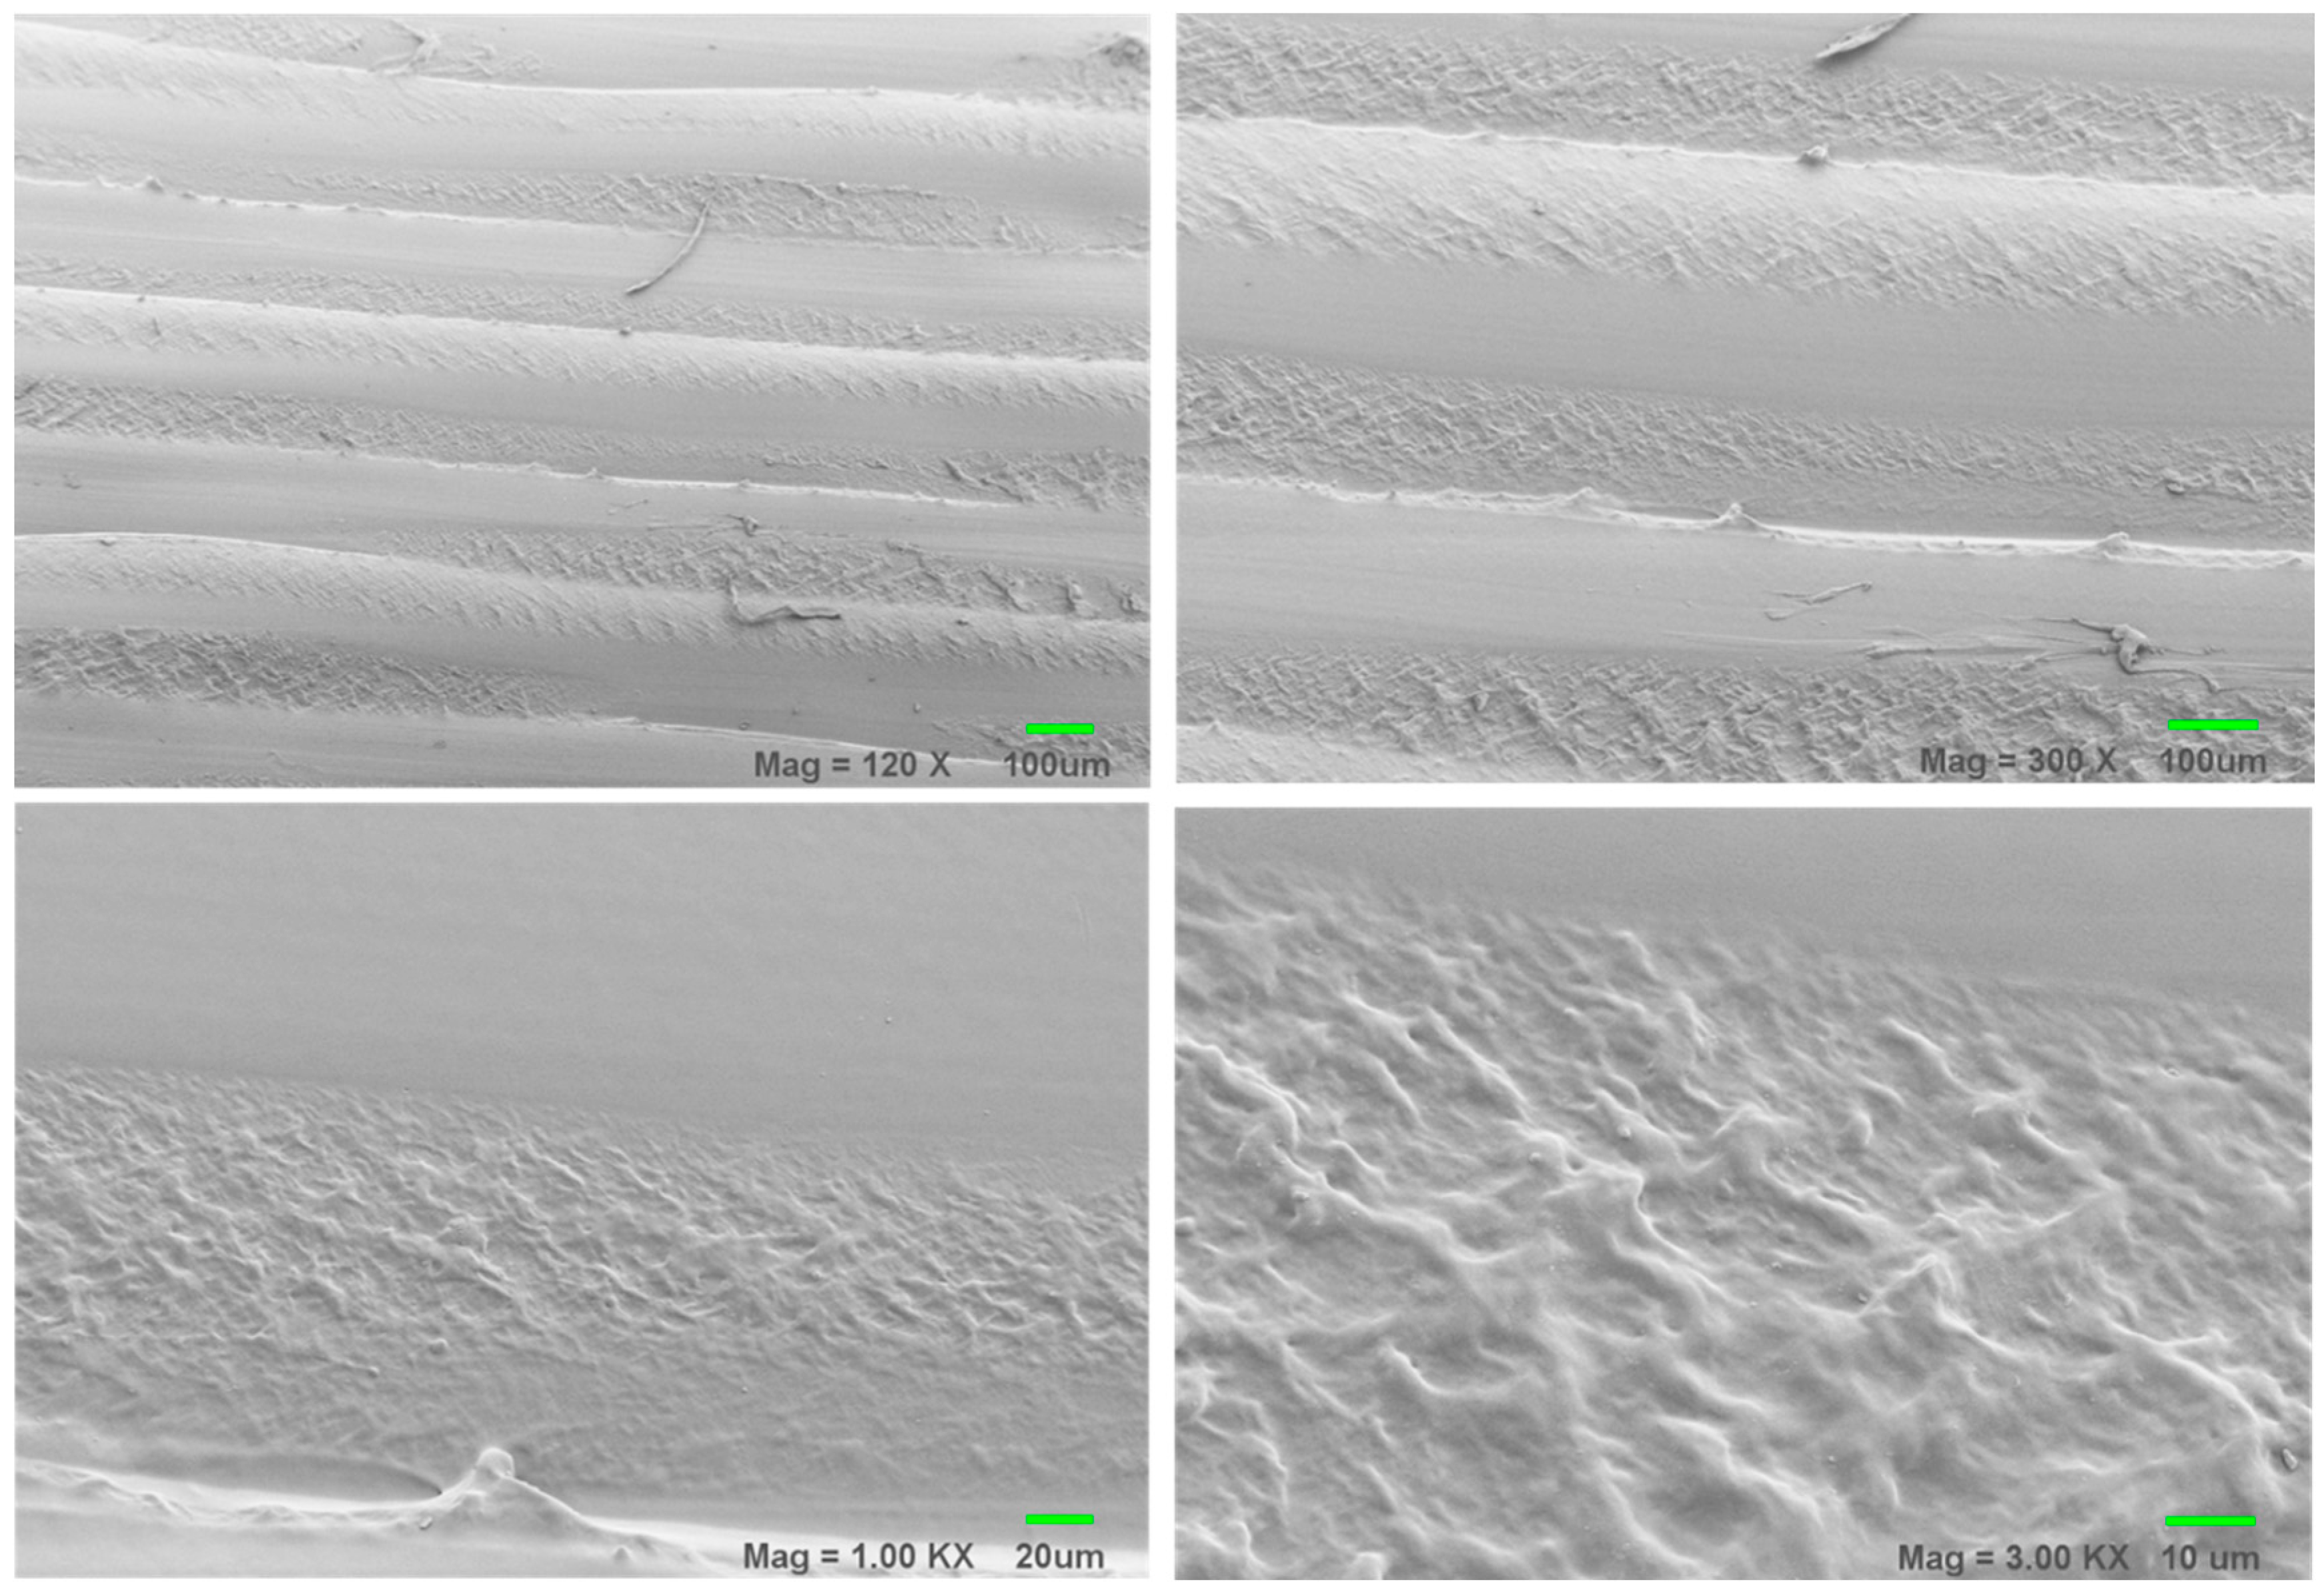
3.2. Scanning Electron Microscopy (SEM) Results

The SEM images in Figure 2 show the morphology of the PLA 3D-printed test samples with increasing magnification. At 120× magnification it is clear that the extruded PLA at standard (0.2 mm) resolution fused well; however, it can be noted that integrated filaments had a micron and sub-micron scale roughness (which as noted later may be beneficial for cell adhesion and growth when used in scaffolding applications [17,18]). The ridged structure likely results from the movement of the print head during extrusion and cooling, and may be affected by the retention of heat in the sample.

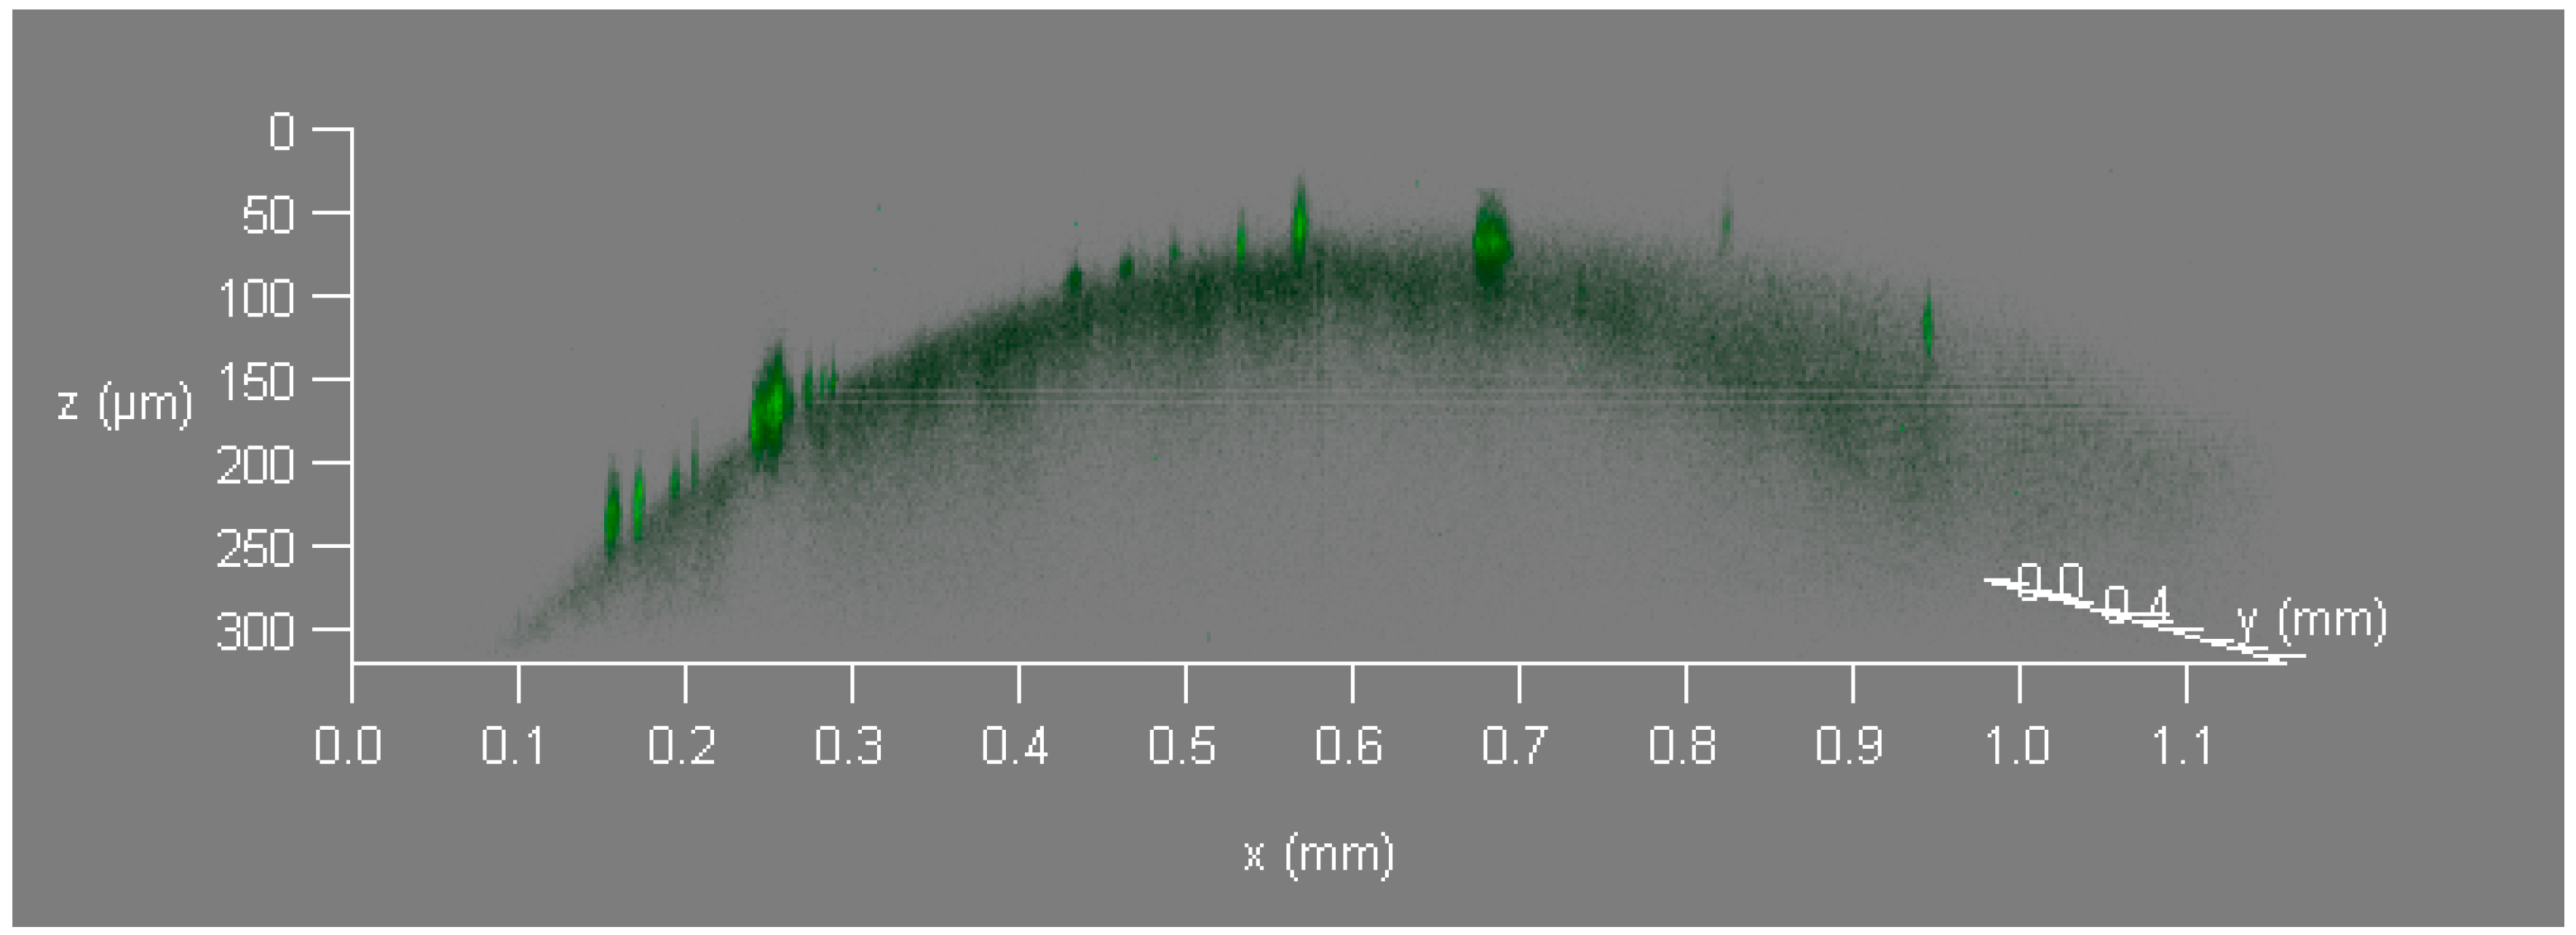
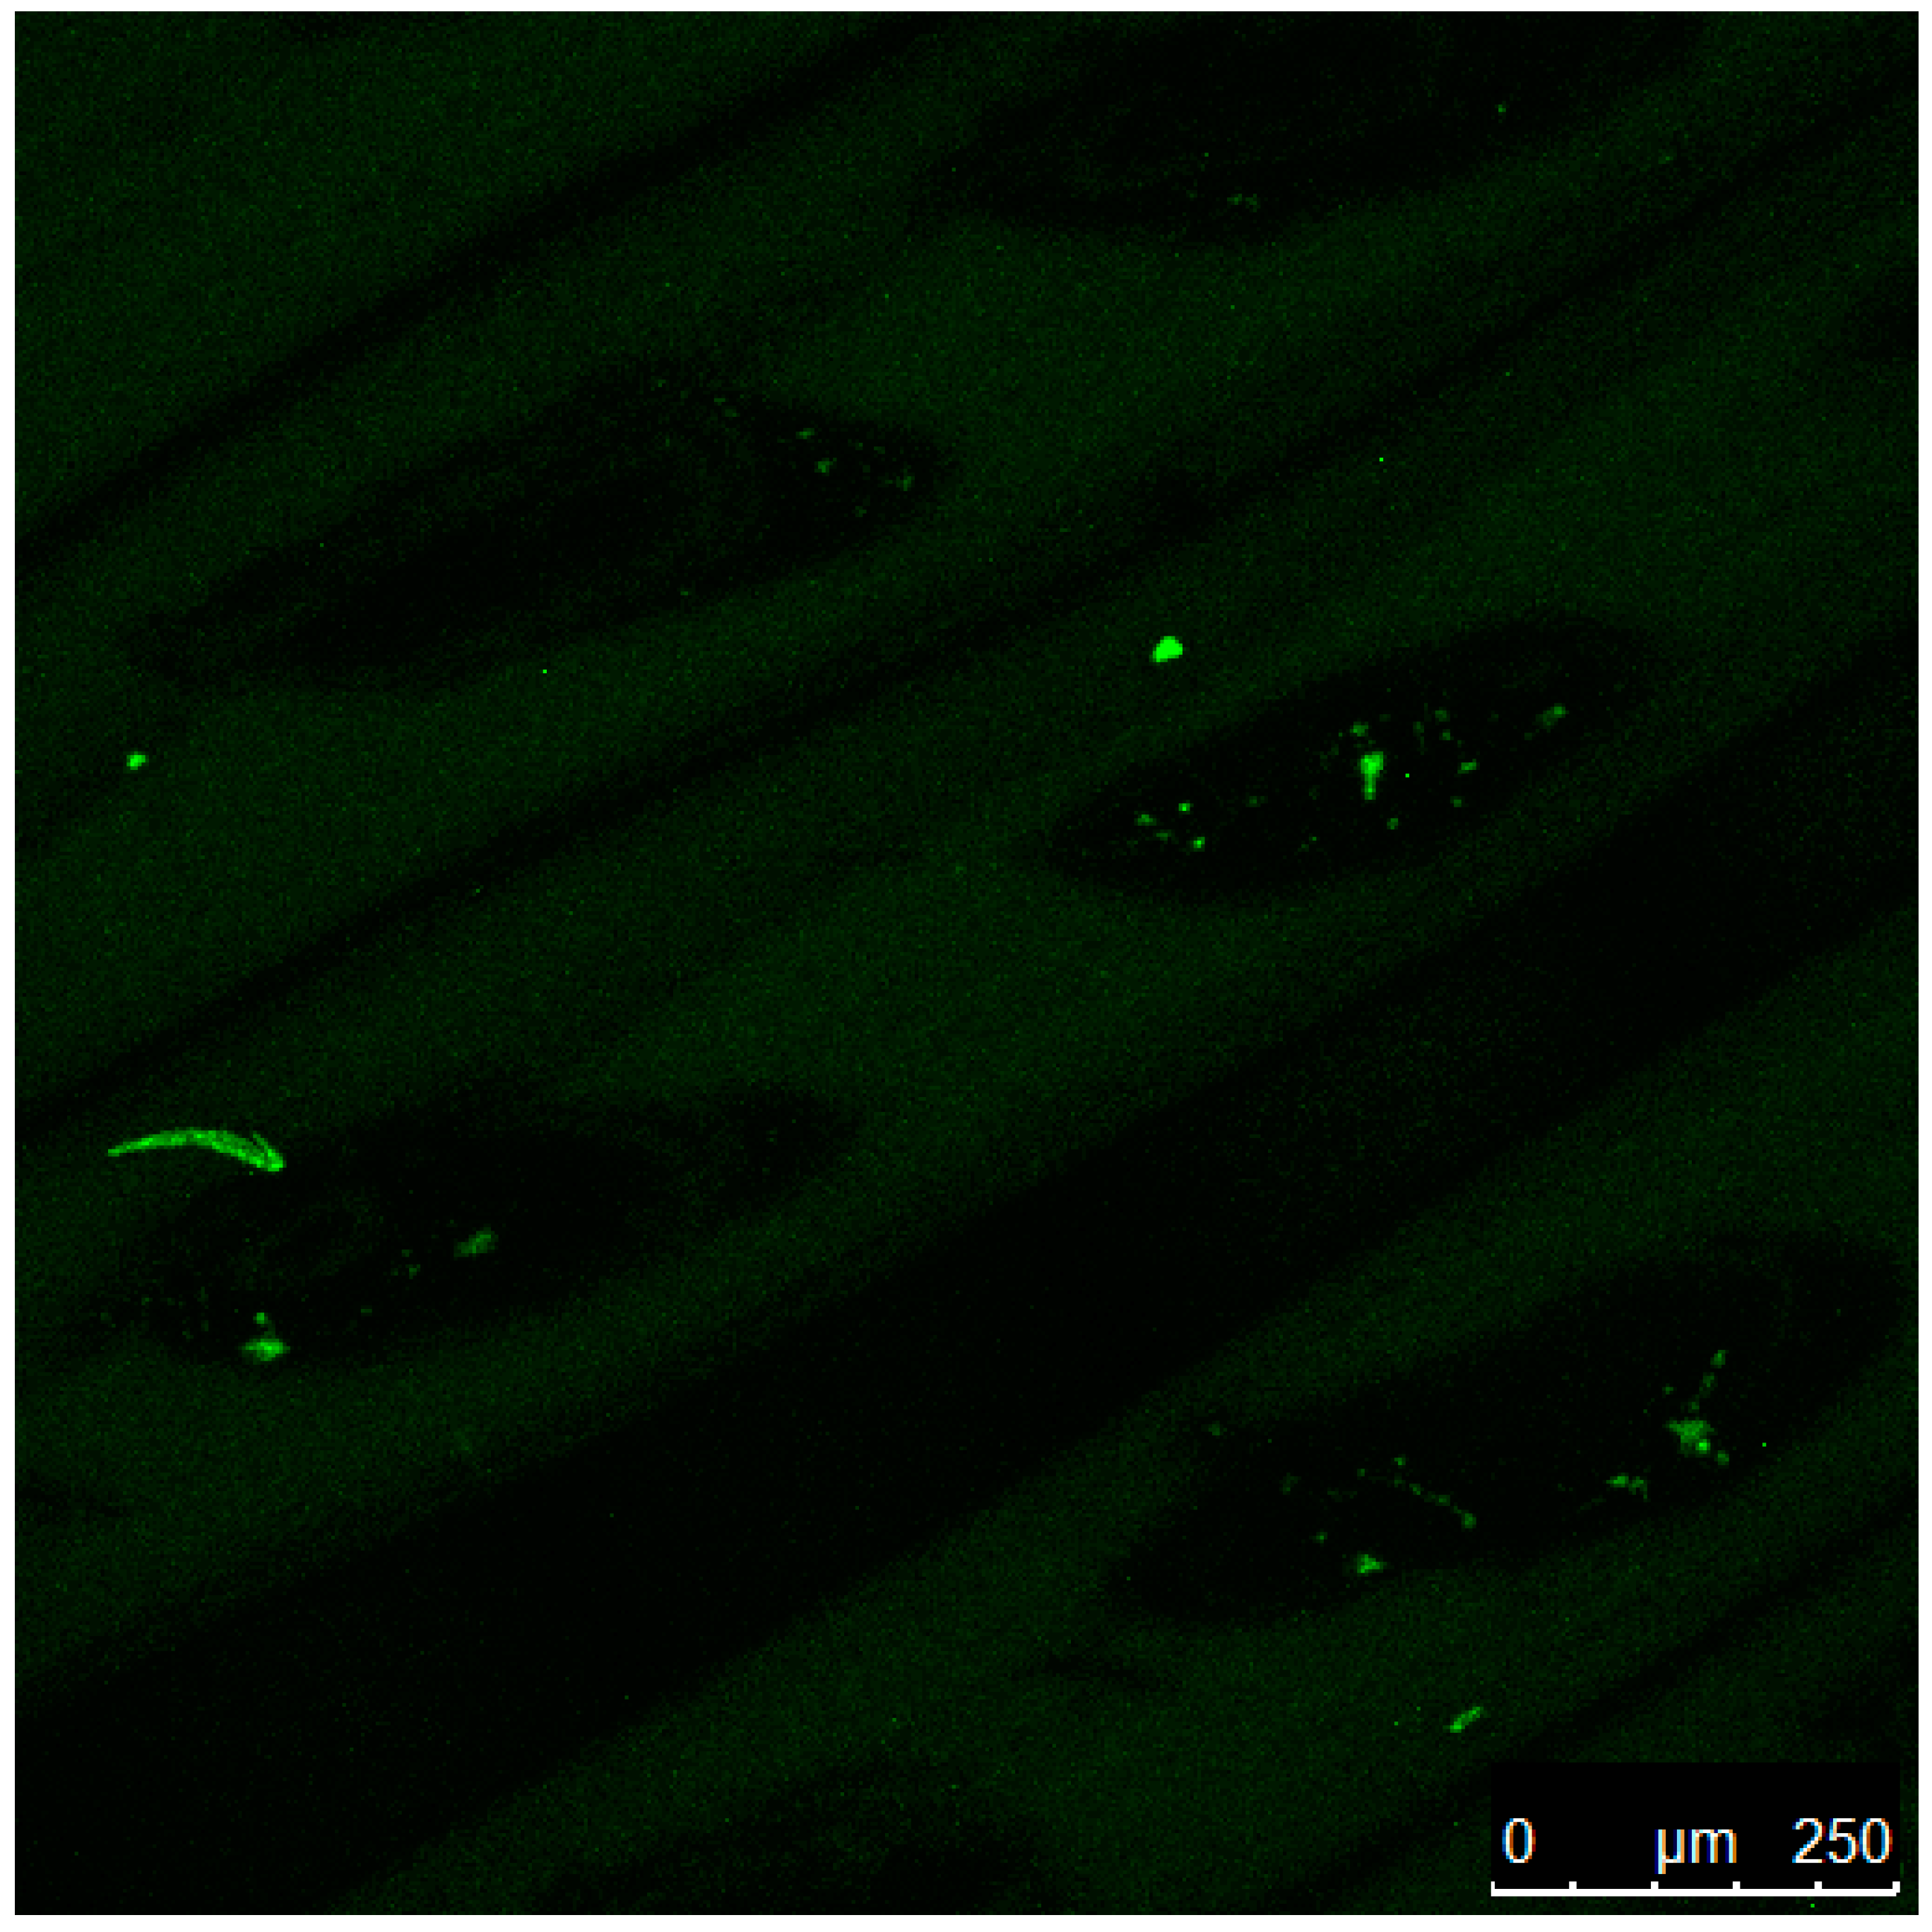
3.3. Laser Confocal Microscopy

Laser confocal microscopy was used in order to identify any possible fluorescing species present in the filament or the printed sample and was used to obtain depth profiling data which would not be possible with a simple fluorescence microscopy. In general, micro-chemical analysis combined with large area surface-sensitive spectroscopies and imaging, has proved to be essential for understanding the mechanisms controlling processing-performance relationships [19]. Figure 3 shows a side view of the source filament. Clearly, there are fluorescing species visible (seen as bright green patches) on the surface of the filament, fairly evenly distributed.
Figure 4 shows a top view of a printed PLA sample. Again, bright fluorescing areas are evident, mostly about 5–30 microns in size (the one larger streak being about 15 × 115 microns). However, most of the fluorescent materials are concentrated in the dark voids in the 3D print. Views from a number of regions on the sample surface showed the same thing. Hence, whatever process may have led to the formation of voids in the surface most likely also either preserved or preferentially concentrated the fluorescent material.
In determining what species are fluorescing under irradiation by the 405 nm wavelength laser, we use a combination of vibrational and electron spectroscopies (as detailed below) and X-ray fluorescence (XRF) using a Niton XL3t Thermoscientific system. XRF from the source filament and the printed samples show a number of similarities, as indicated in Table 1.
While significant P appears in the sample, it is not likely to be the source of fluorescence unless it is present as phosphate. However, the Raman and FTIR spectra (shown below) do not indicate the presence of phosphate, nor is there a significant signal associate with silica. Calcium carbonate, a common additive in processing of polymers, may account for the Ca found (and is in agreement with evidence from Raman and FTIR spectroscopy). However, CaCO3 alone does not fluoresce under irradiation at 405 nm. It does, however, fluoresce if reacted with organic ligands or if containing trace amounts of transition metal ions [20]. Therefore, it is possible that the fluorescent particles seen represent a form of calcium carbonate which has reacted with organic ligands (from PLA or other unknown additives) or due to association with trace amounts of transition metal contaminants. The concentration of fluorescent particles in voids may indicate that whatever process resulted in the formation of voids also resulted in preferential retention or formation of CaCO3-based particles. It has also been found that inclusion of additives such as pigments in PLA may themselves cause the formation of small voids [20,21]. As we will discuss, the presence of carbonate may have important implications for biomedical applications of printed PLA structures.

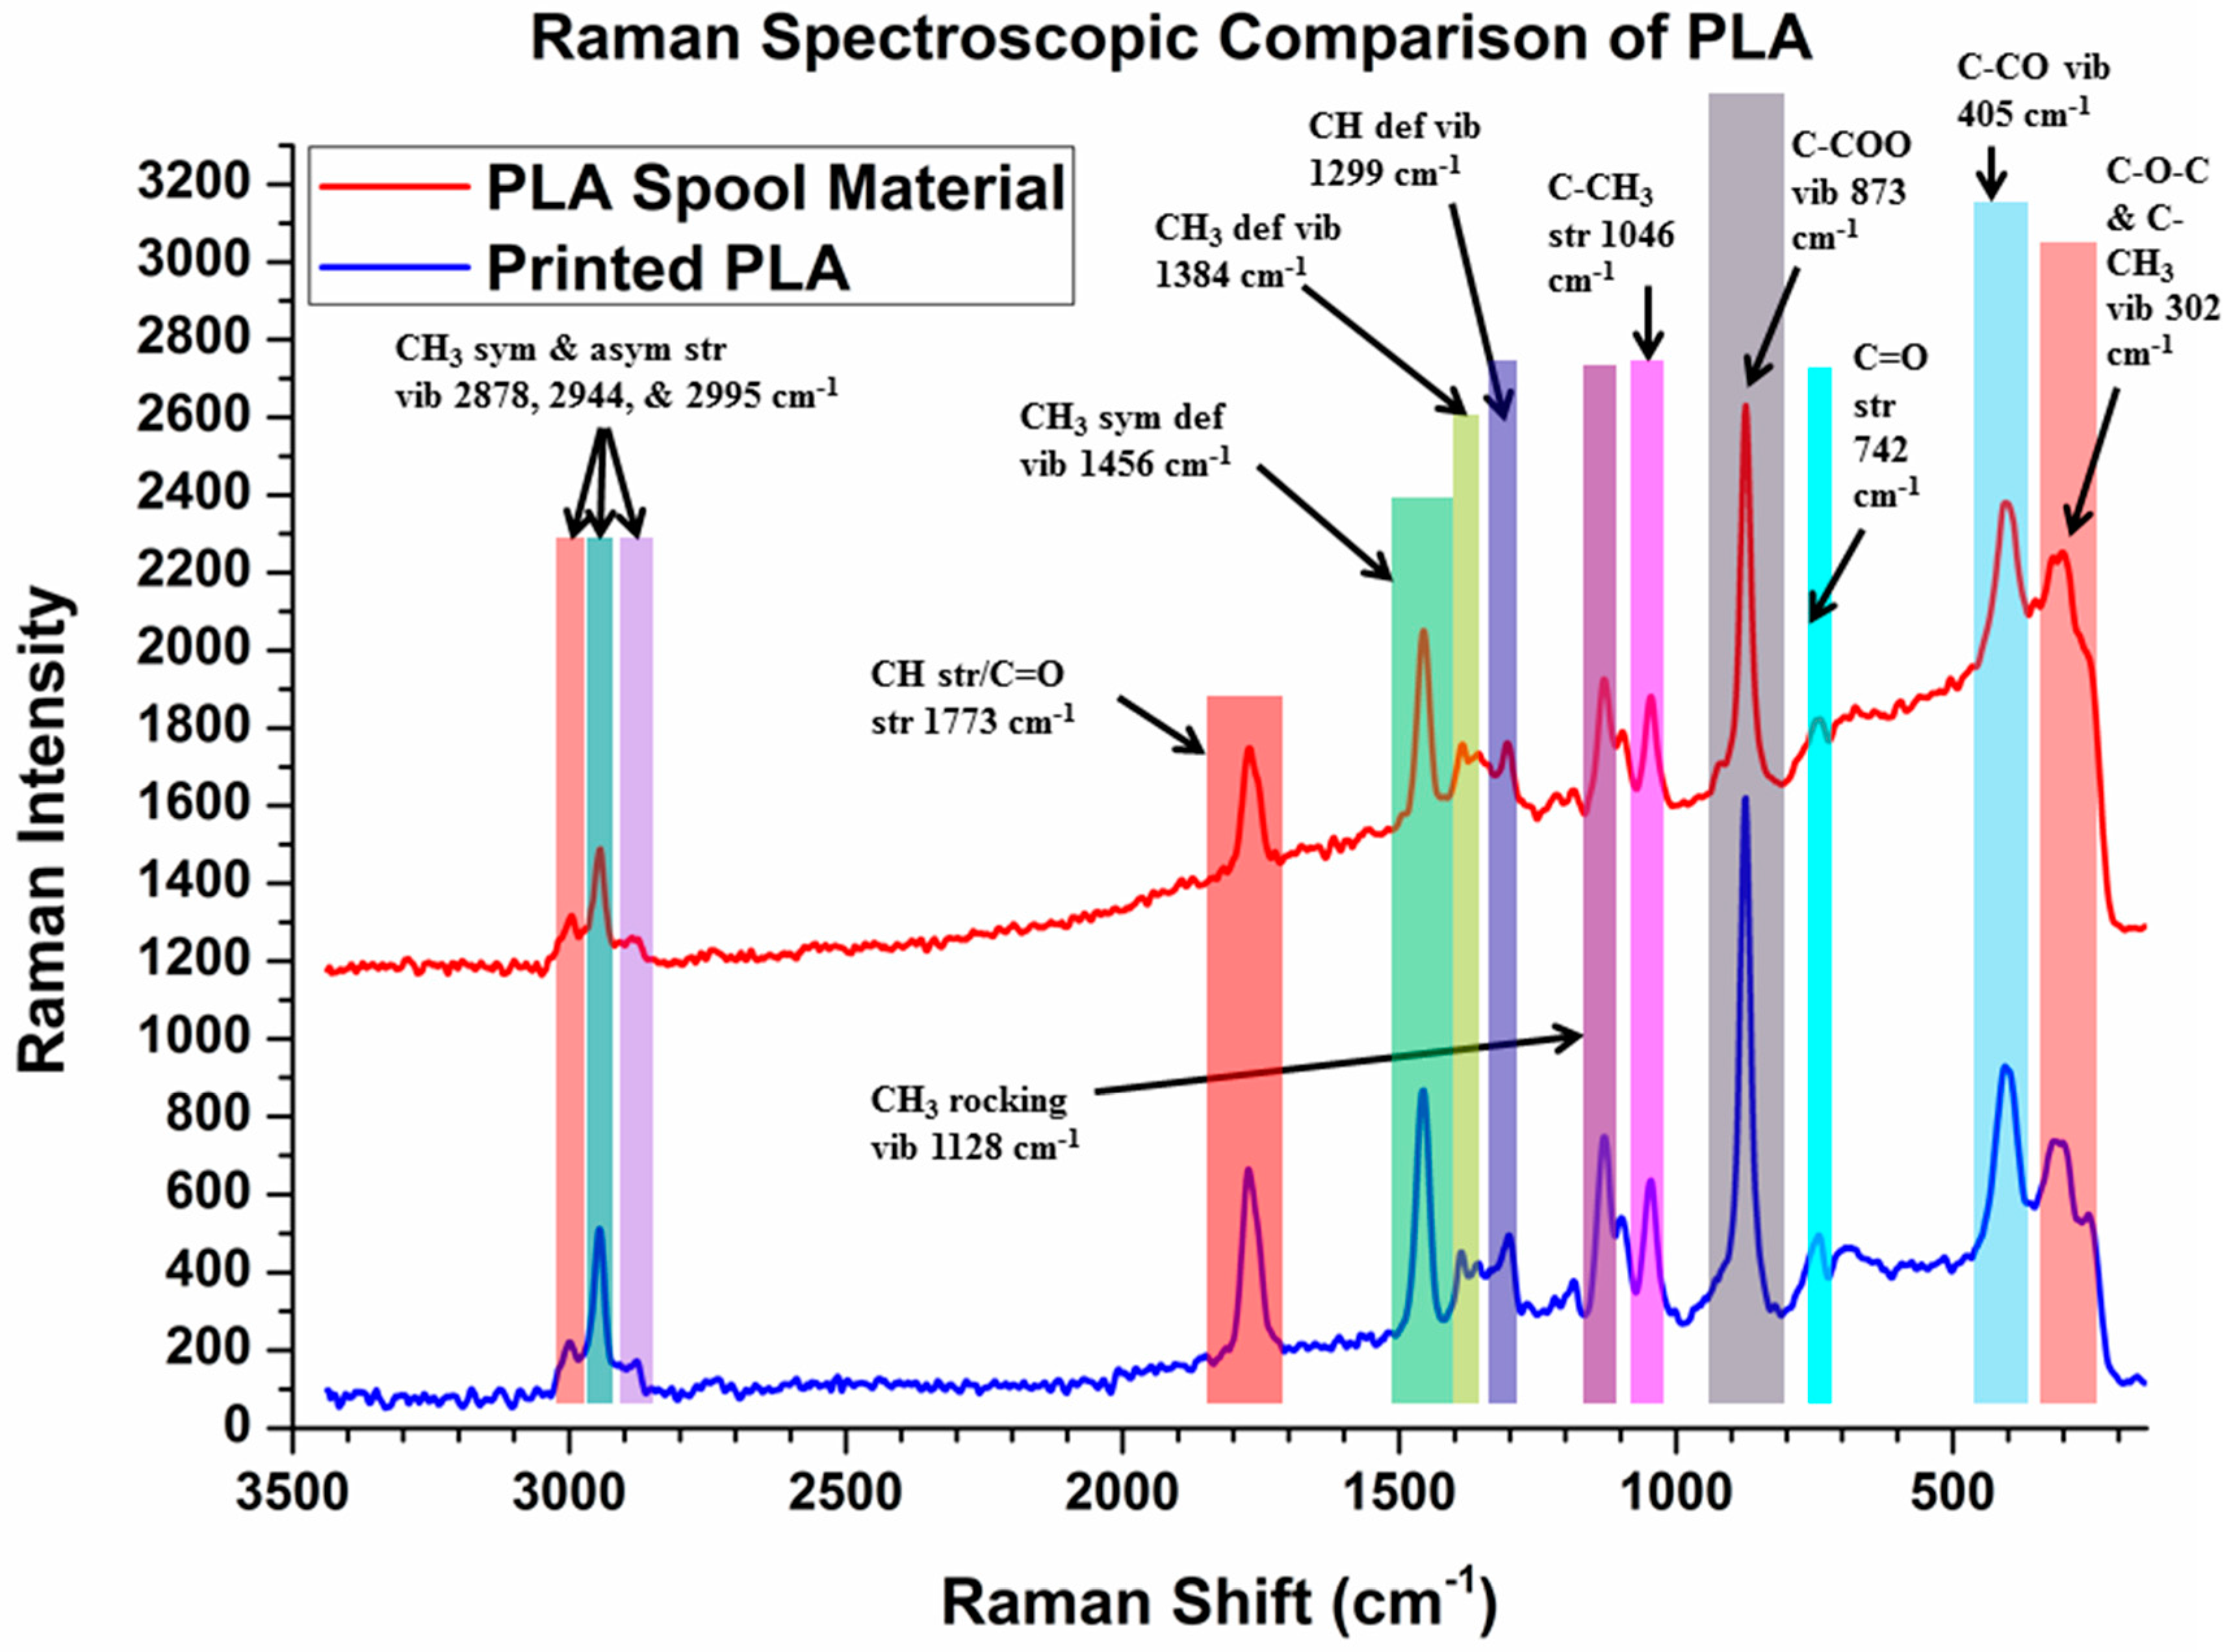
3.4. Raman Spectroscopy

Figure 5 shows the comparison of the full spectra of PLA spool material and printed PLA. The spectra look very similar and show minimal intensity changes. Peak assignments were made using Socrates, Suzuki, and Kister [22,23,24], respectively. Peaks similar in all spectra include: CH3 vibrations assigned to asymmetric stretching at 2995–3002 cm−1 and, symmetric stretching 2944–2947, and 2878–2889 cm−1. CH stretching/C=O stretching at 1769–1773 cm−1, CH3 symmetric deformation vibration at 1454–1456 cm−1, CH3 rocking vibration assigned to 1128 cm−1, C-O-C stretching assigned to 1095–1098 cm−1, C-CH3 stretching at 1042–1046 cm−1, C-COO vibration assigned to 873 cm−1, (possibly due to the presence of CaCO3), C=O stretching assigned to 742 cm−1, C-CO vibrational states assigned to 399–408 cm−1, and C-O-C + C-CH3 vibration assigned to 302–315 cm−1.
Intensity changes following printing are seen in the highlighted regions of Figure 3, including changes in the CH3 deformation vibration at 1383–1387 cm−1, and the CH deformation vibration peak at 1299–1305 cm1. The light blue highlighted region of Figure 3 shows an increase in the intensity of the C=O deformation peak at 742 cm−1 after printing the PLA. This suggests that the printing process of PLA increases the relative abundance of the C=O ligand, considered a primary active binding site in PLA. At the moment we suspect that calcium in the form of calcium carbonate may be responsible for the peaks assigned to 679 cm−1, 873 cm−1, and 1085 cm−1, all of which are present in the spool material and printed PLA test samples. It will be shown below that spectral features associated with calcium-related groups are also present in the FTIR spectra of the spool material and the printed PLA.

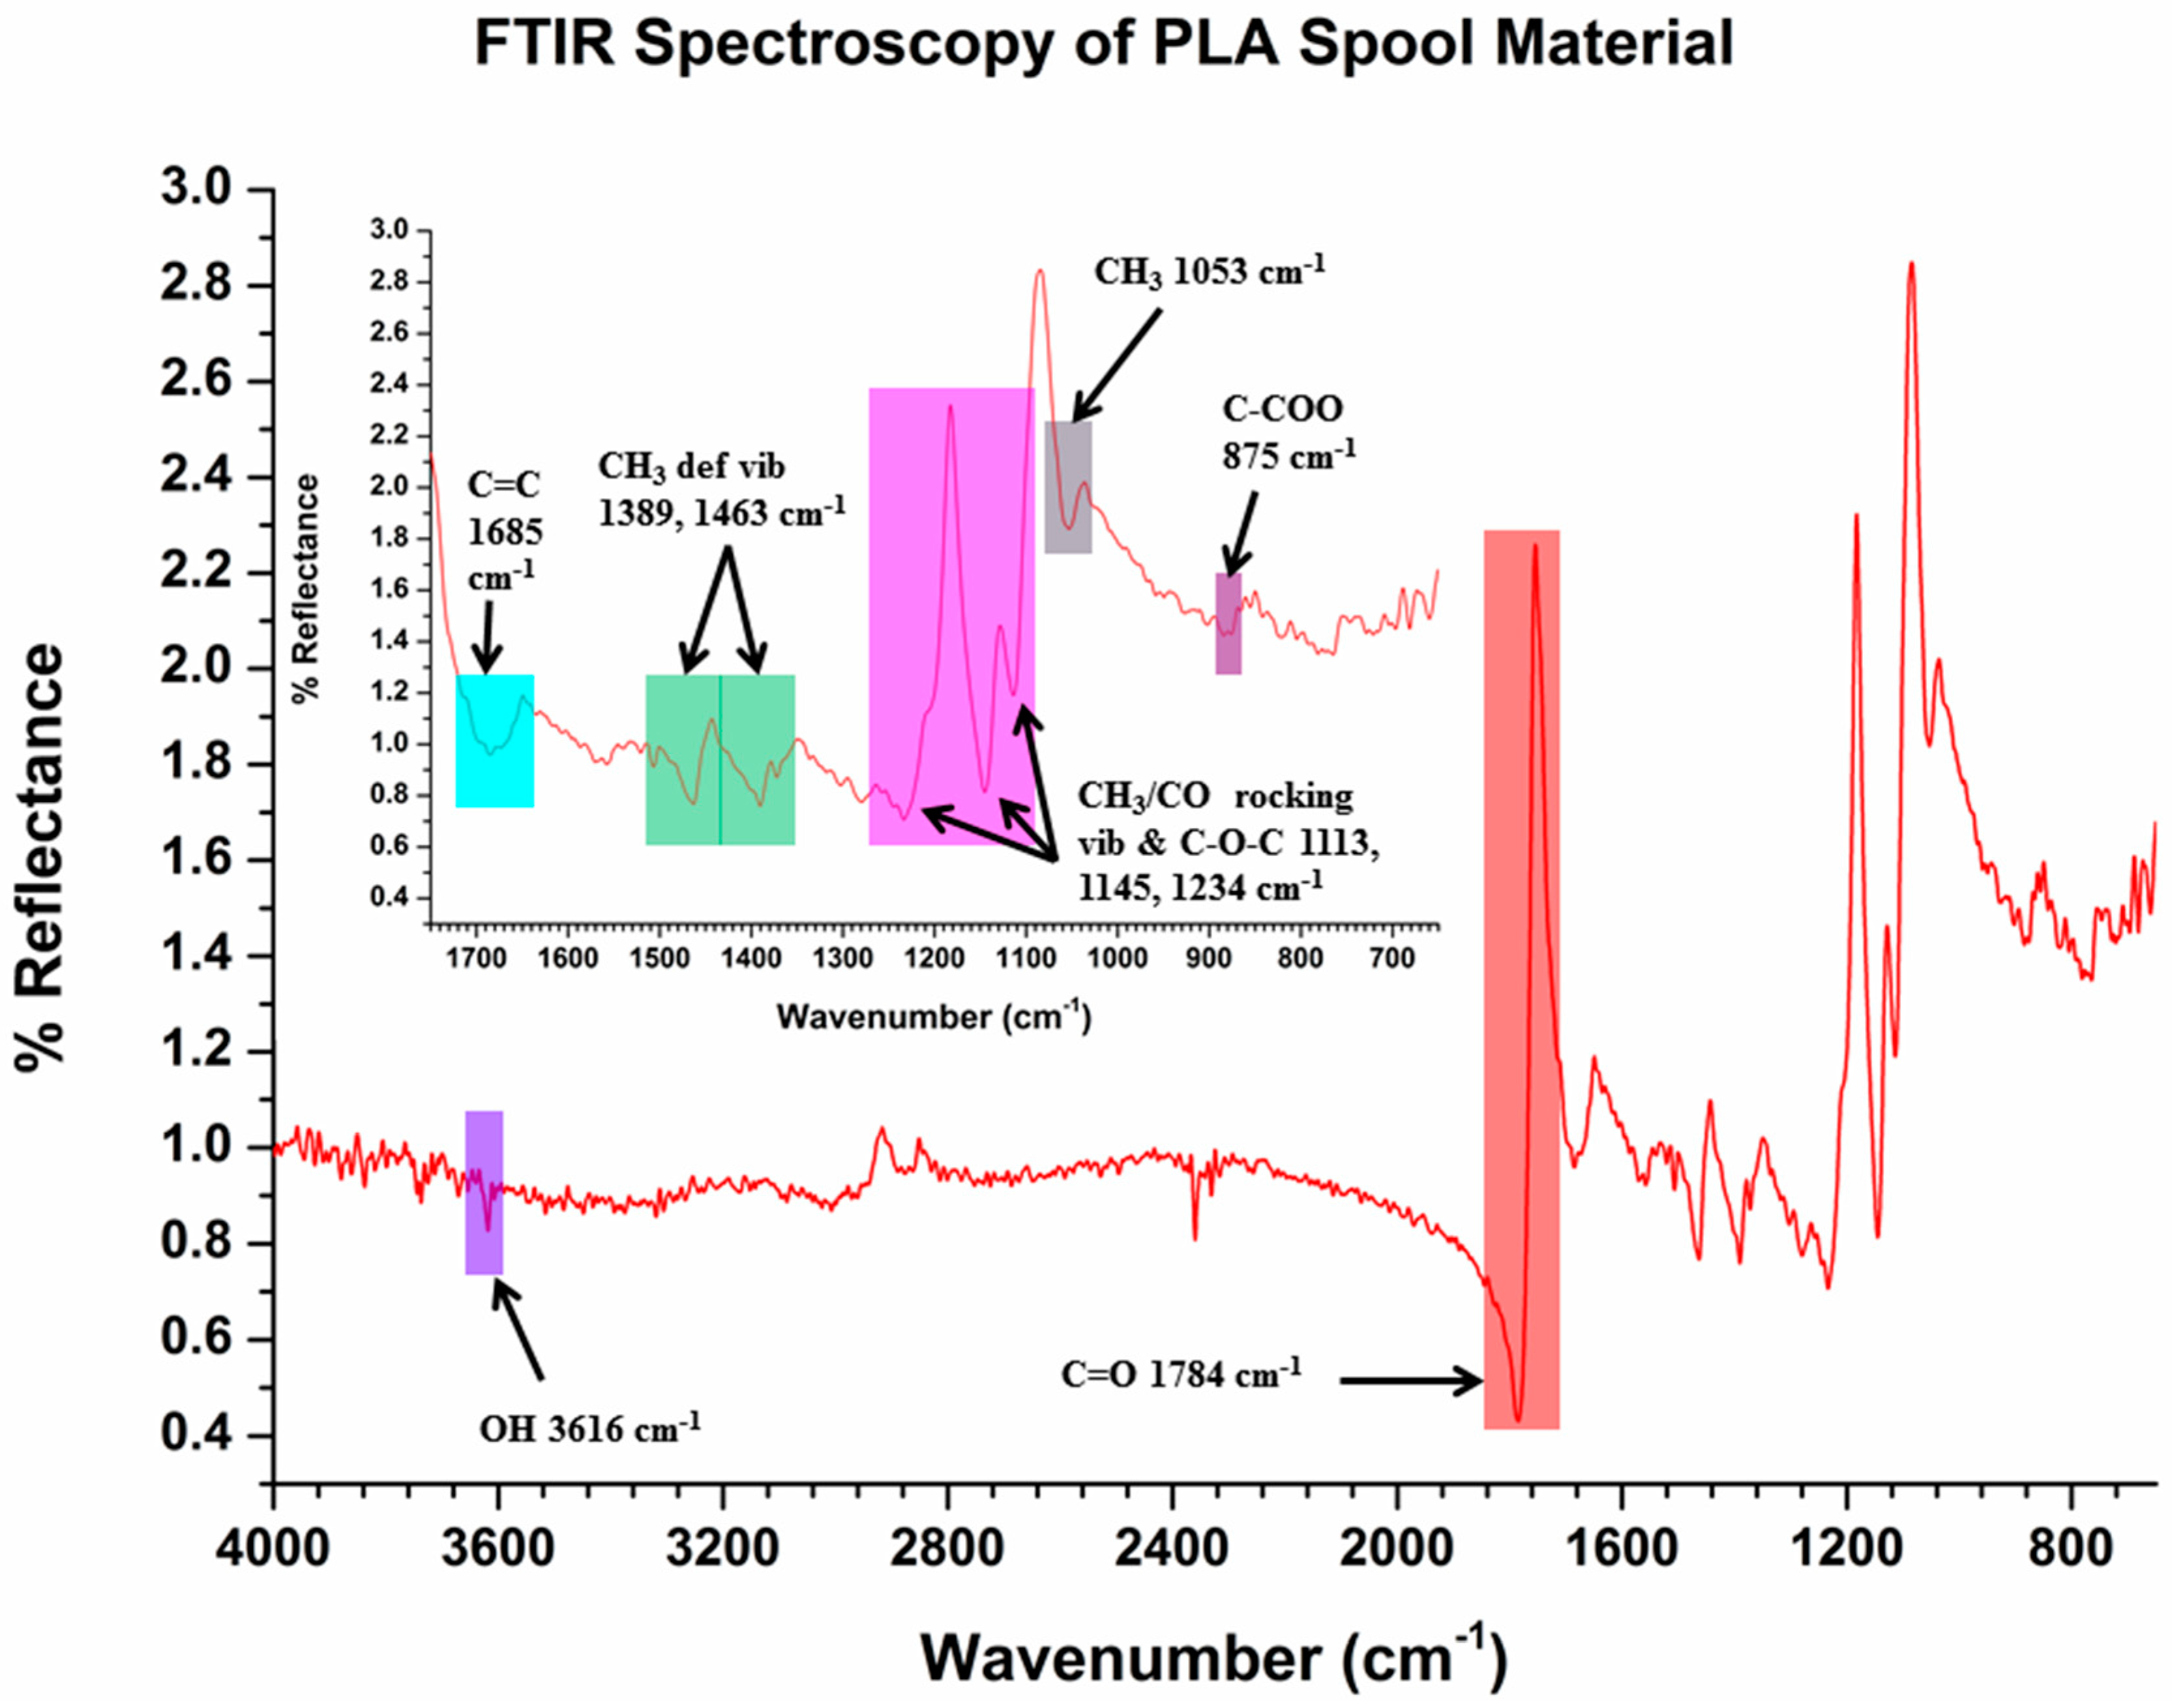
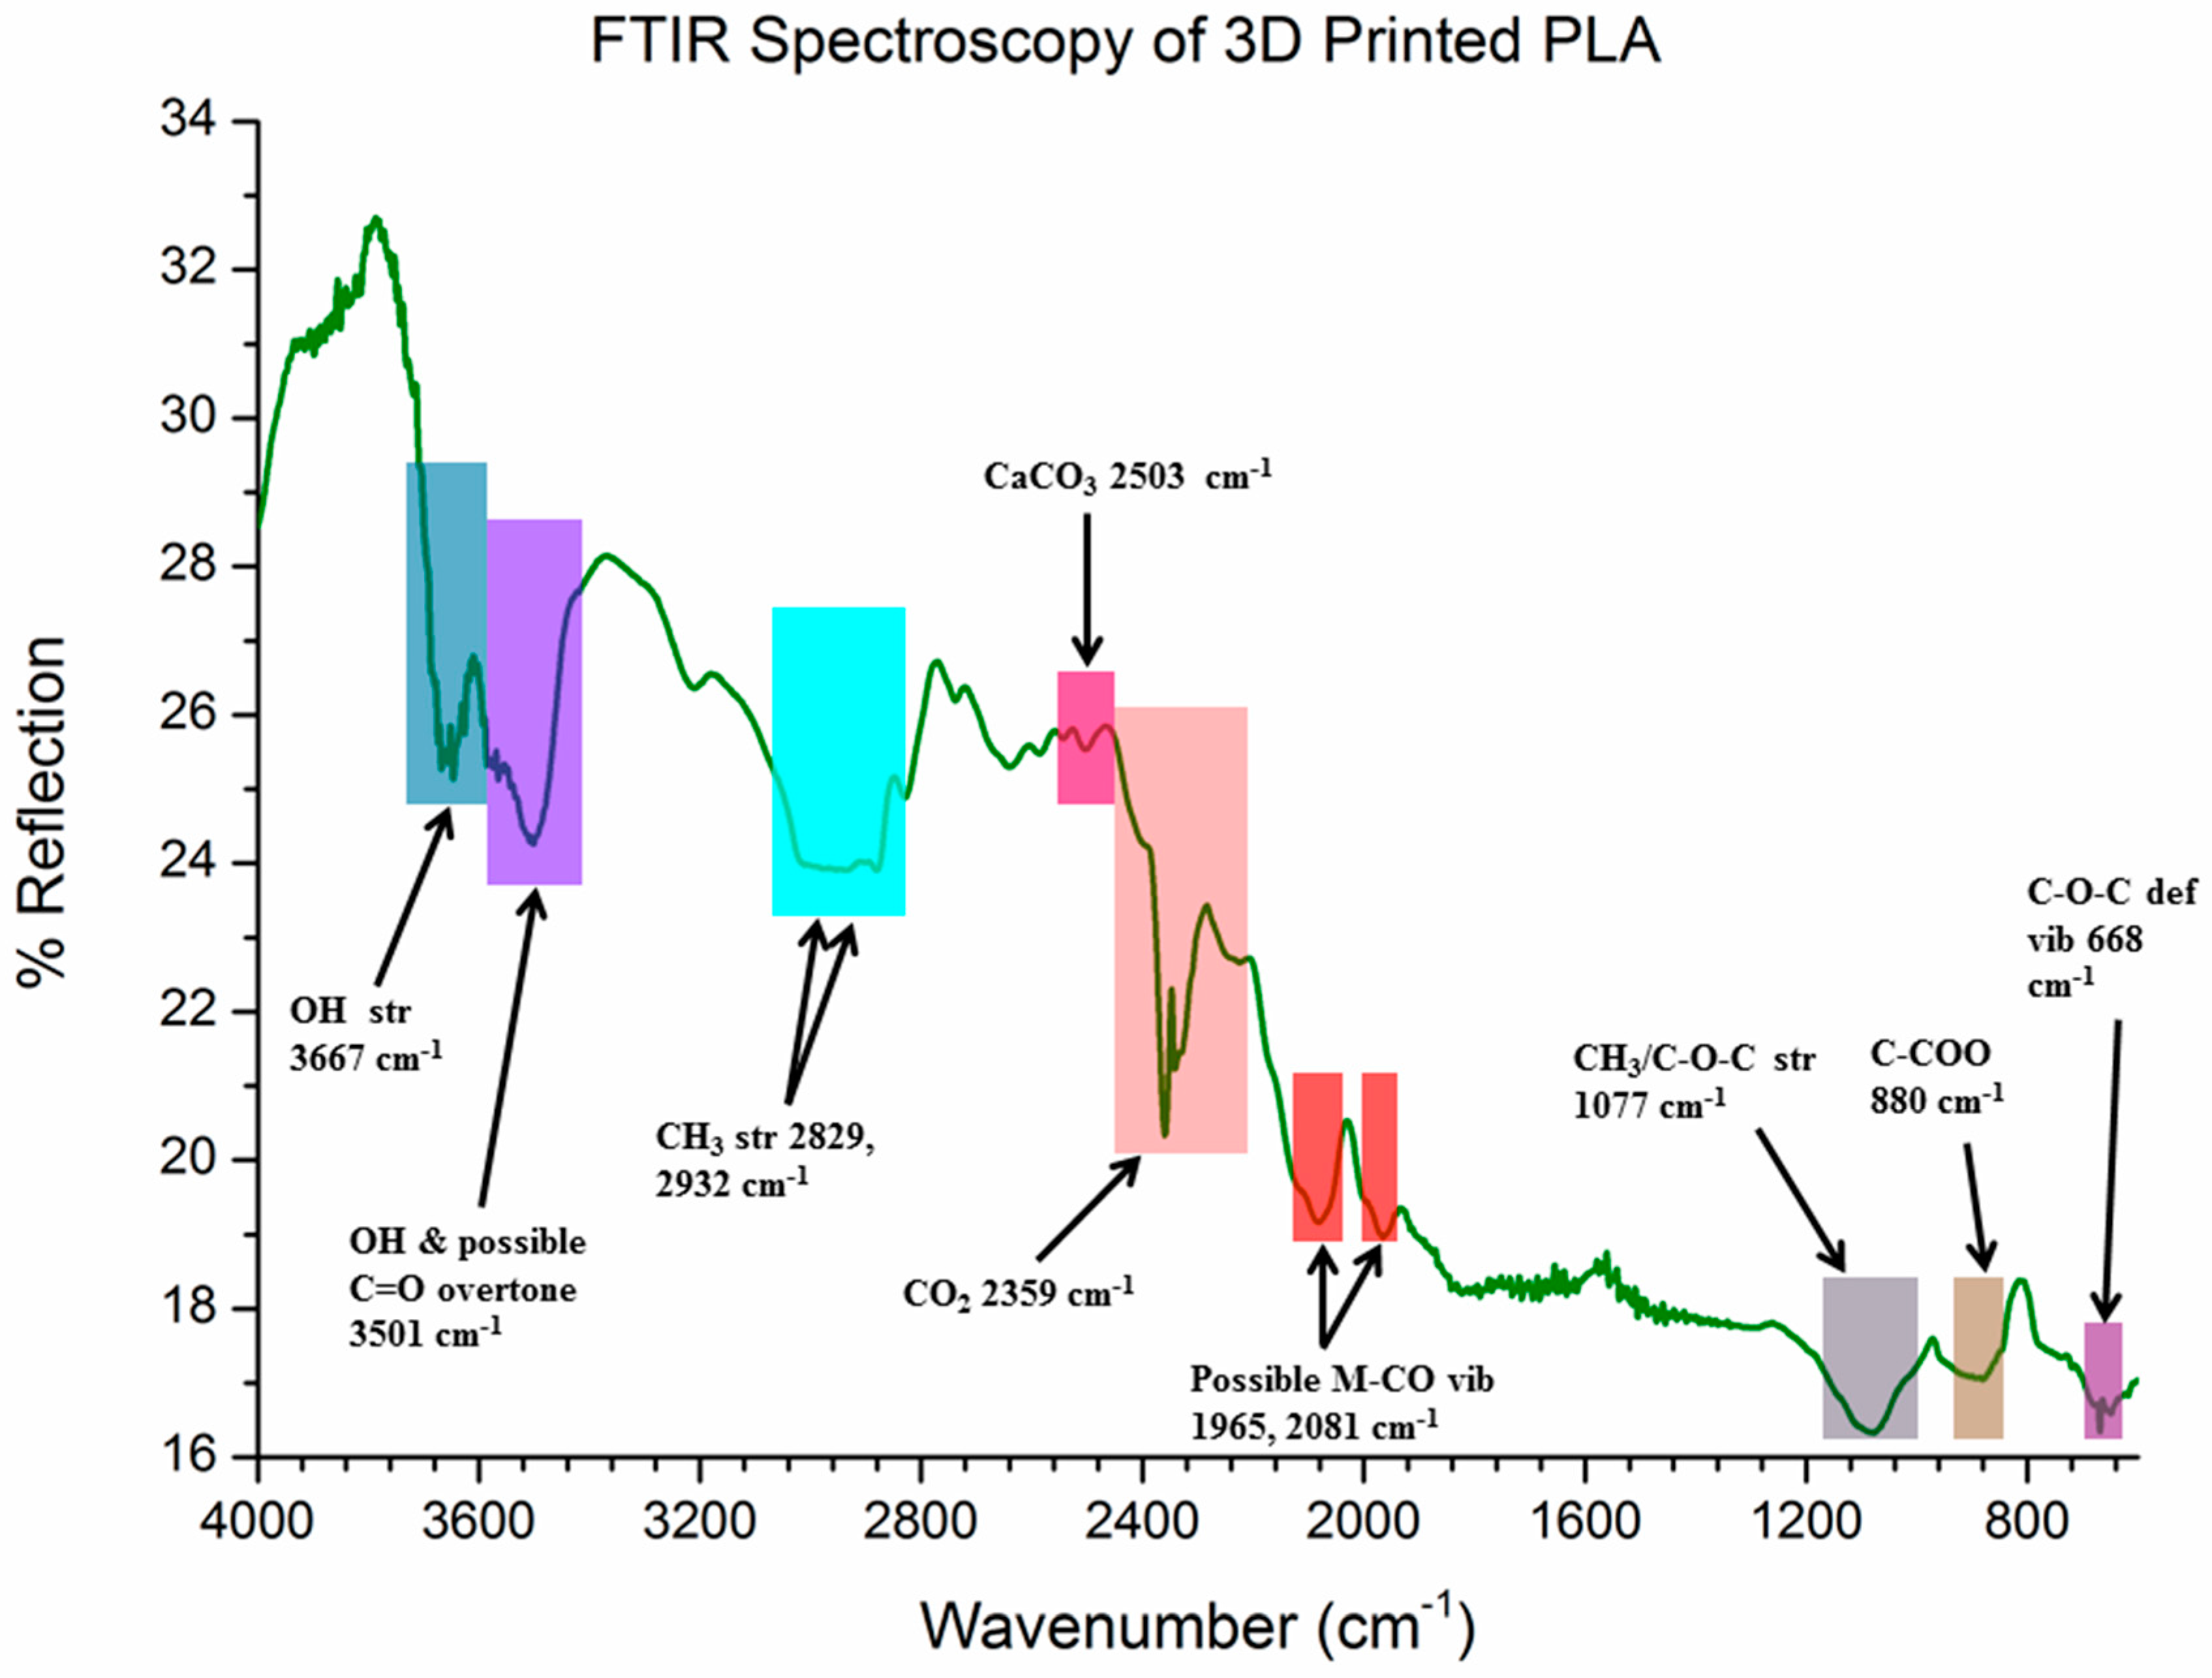
3.5. Diffuse Reflection FTIR (DRIFTS)

Using diffuse reflectance FTIR (DRIFT) we compared the PLA spool material and the PLA material after printing. The FTIR spectrum collected from the PLA spool material, Figure 6, is of somewhat lower intensity as compared to the other spectra, likely due to difficulties in analytical sampling configuration for the filaments. It also shows a number of differences as compared to spectra from post-printed surfaces.
Peaks of interest from the PLA spool material include: a C-COO peak at 875 cm−1 (which can also be attributed to CaCO3 as found in the Raman spectroscopic analysis); a CH3 peak at 1053 cm−1; and CH3/CO rocking vibrations with overlapping C-O-C stretching at 1113, 1145, and 1234 cm−1. Other CH3 deformation vibrations occur at 1389 and 1463 cm−1. There is a peak associated with the C=C bond at 1685 cm−1 and a sharp, strong C=O peak at 1784 cm−1. There is also a small OH peak at 3616 cm−1 which, over time, becomes more pronounced, as PLA spool material was discovered to be hygroscopic in nature.
A number of chemical changes were observed as the PLA spool material is heated to 230 °C, is extruded, and then cools and recrystallizes, significantly changing bonding at least in the near surface region of the printed PLA. Some characteristic peaks in printed PLA test samples (Figure 7) are: the C-O-C deformation vibration at 668 cm−1; the CH3 deformation with overlapping C-O-C stretching as 1077 cm−1; and the C-COO peak at 880 cm−1—which can be associated with CaCO3 (which is also indicated by the peak at 2503 cm−1). This shows that the calcium carbonate-based additive indicated by the Raman spectra and FTIR of the spool material was retained after the printing process. Finding calcium carbonate in the PLA is significant due to the fact that PLA can also be used as support structure material for growing cells [25], and calcium is a required element for the growing cells. Other peaks in printed PLA include: the CH3 stretching vibrations at 2829 and 2932 cm−1 and OH stretching vibrations at 3501 and 3667 cm−1 due to the hygroscopic nature of PLA (although these features can also be attributed to the C=O overtone stretching vibration at 3501 cm−1). Additionally, there is an increase in CO2 possibly due to a partial breakdown on calcium carbon to CaO and CO2 which becomes bound the printed PLA material (see XPS of 3D printer PLA). There are two vibrations at 1965 and 2081 cm−1 that may be possible M-CO vibrations. These two M-CO vibrations may be due to metal contamination formed during the extrusion process.

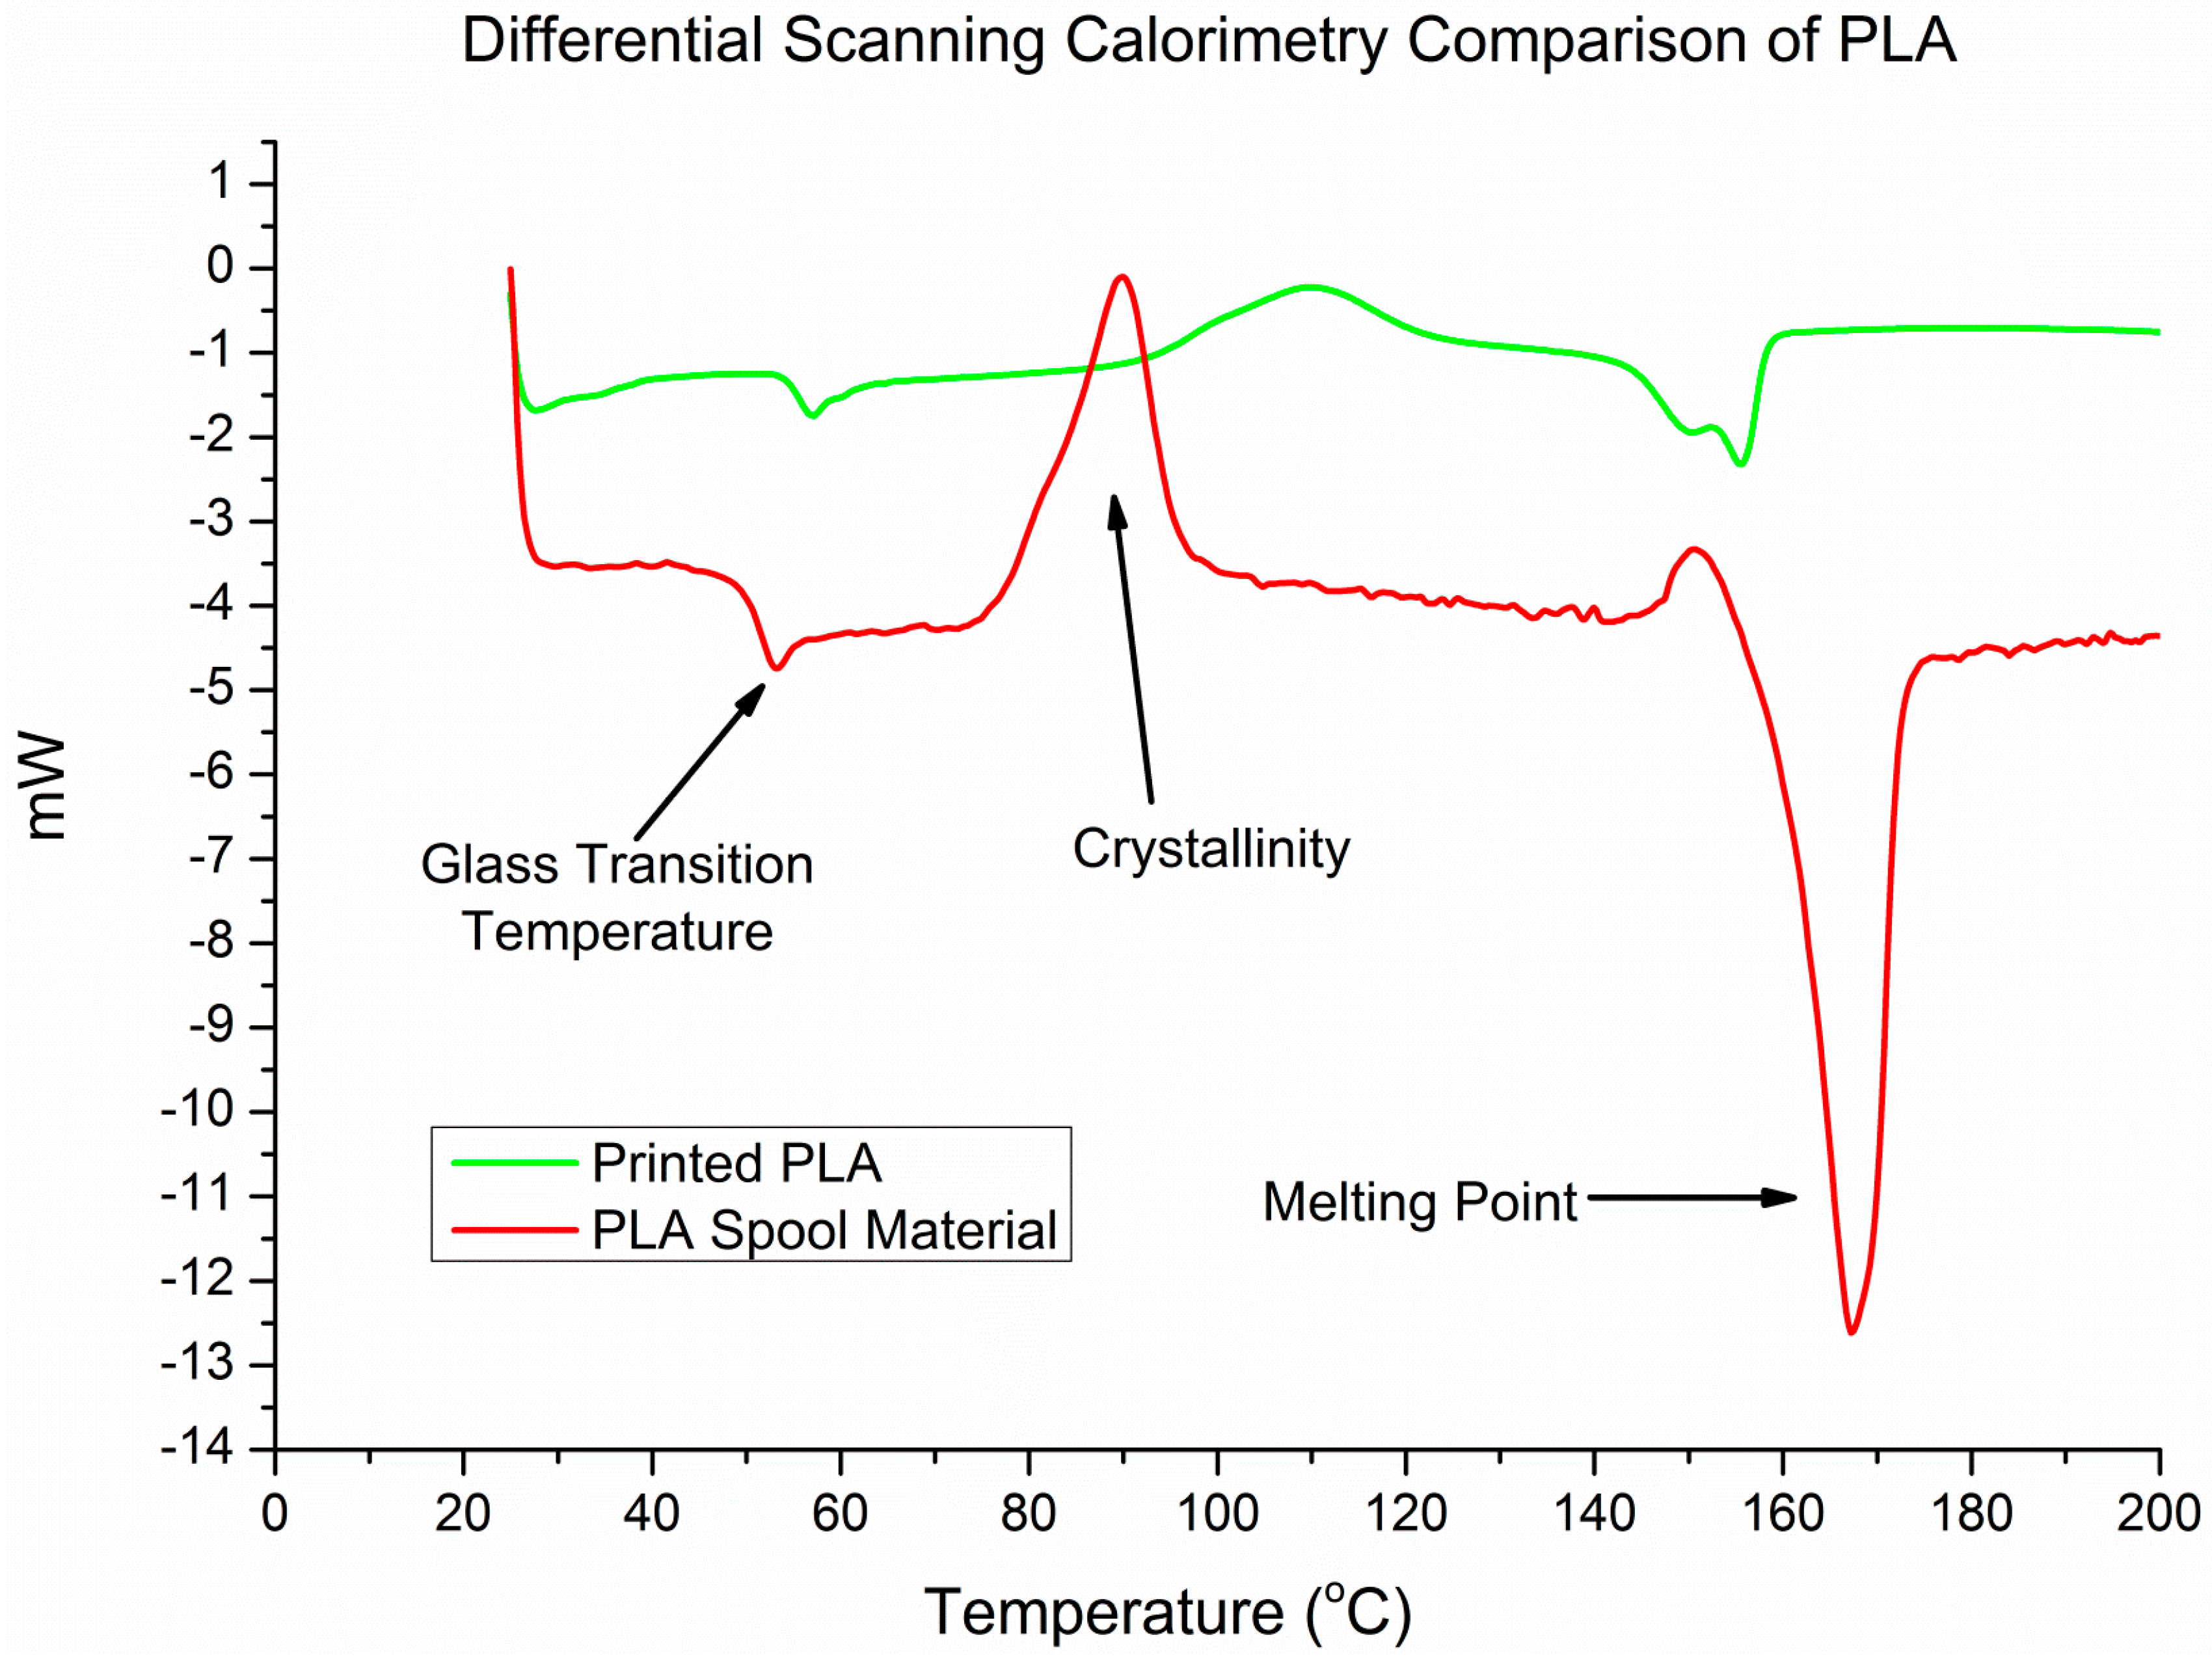
3.6. Differential Scanning Calorimetry

Figure 8 shows a DSC graph of heat flux (mW) versus temperature (°C) for the PLA spool material and the printed PLA. The spectra shows three features typical of semi-crystalline thermoplastics, including PLA, from left to right: heat flux at the glass transition temperature (Tg), an exotherm associated with cold crystallization, and a melting endotherm [26]. The Tg of the spool material at 57.7 °C is slightly lower than that of reported values for PLA, while the melting temperature (Tm) at 166.7 °C is with the range of reported values. Differences in these values may be due to additives in the spool material, as well as the extrusion process itself, though this is beyond the scope of the current study. The Tg of the printed PLA shifts to a slightly lower temperature (53.1 °C), and the melting temperature not only decreases by approximately 10 degrees but, in addition to the melting endotherm shows two peaks (150 °C and 155.1 °C). This effect has been seen by other authors in the case of PLA which has been attributed to the formation of multiple crystalline states (α and α’) which can form during thermal cycling [27]. A more complete study of these states (which can contribute to the stability of the printed structures) will be considered in our further studies, but may be impacted by the presence of inorganic additives or contaminants. Indeed, both the spool material and printed samples show clear evidence of cold crystallization, a process associated with the exothermal self-nucleation of the crystalline phases above the glass transition temperature. The cold crystallization exotherm is present in both samples, though it is noted to shift from a peak centered at 90.2 °C to a broad peak centered at about 110 °C following printing. While further work, including diffraction to identify crystalline states, would help to clarify these results, studies have shown that the lower crystallization temperature is associated with solid-state transitions between crystalline states, while the higher Tc range correlates to a melt recrystallization process. This may indicate that the printing process may result in changes in the nature and distribution of crystalline phases which form, as well as the capacity for phase changes in the materials above the glass transition temperature.

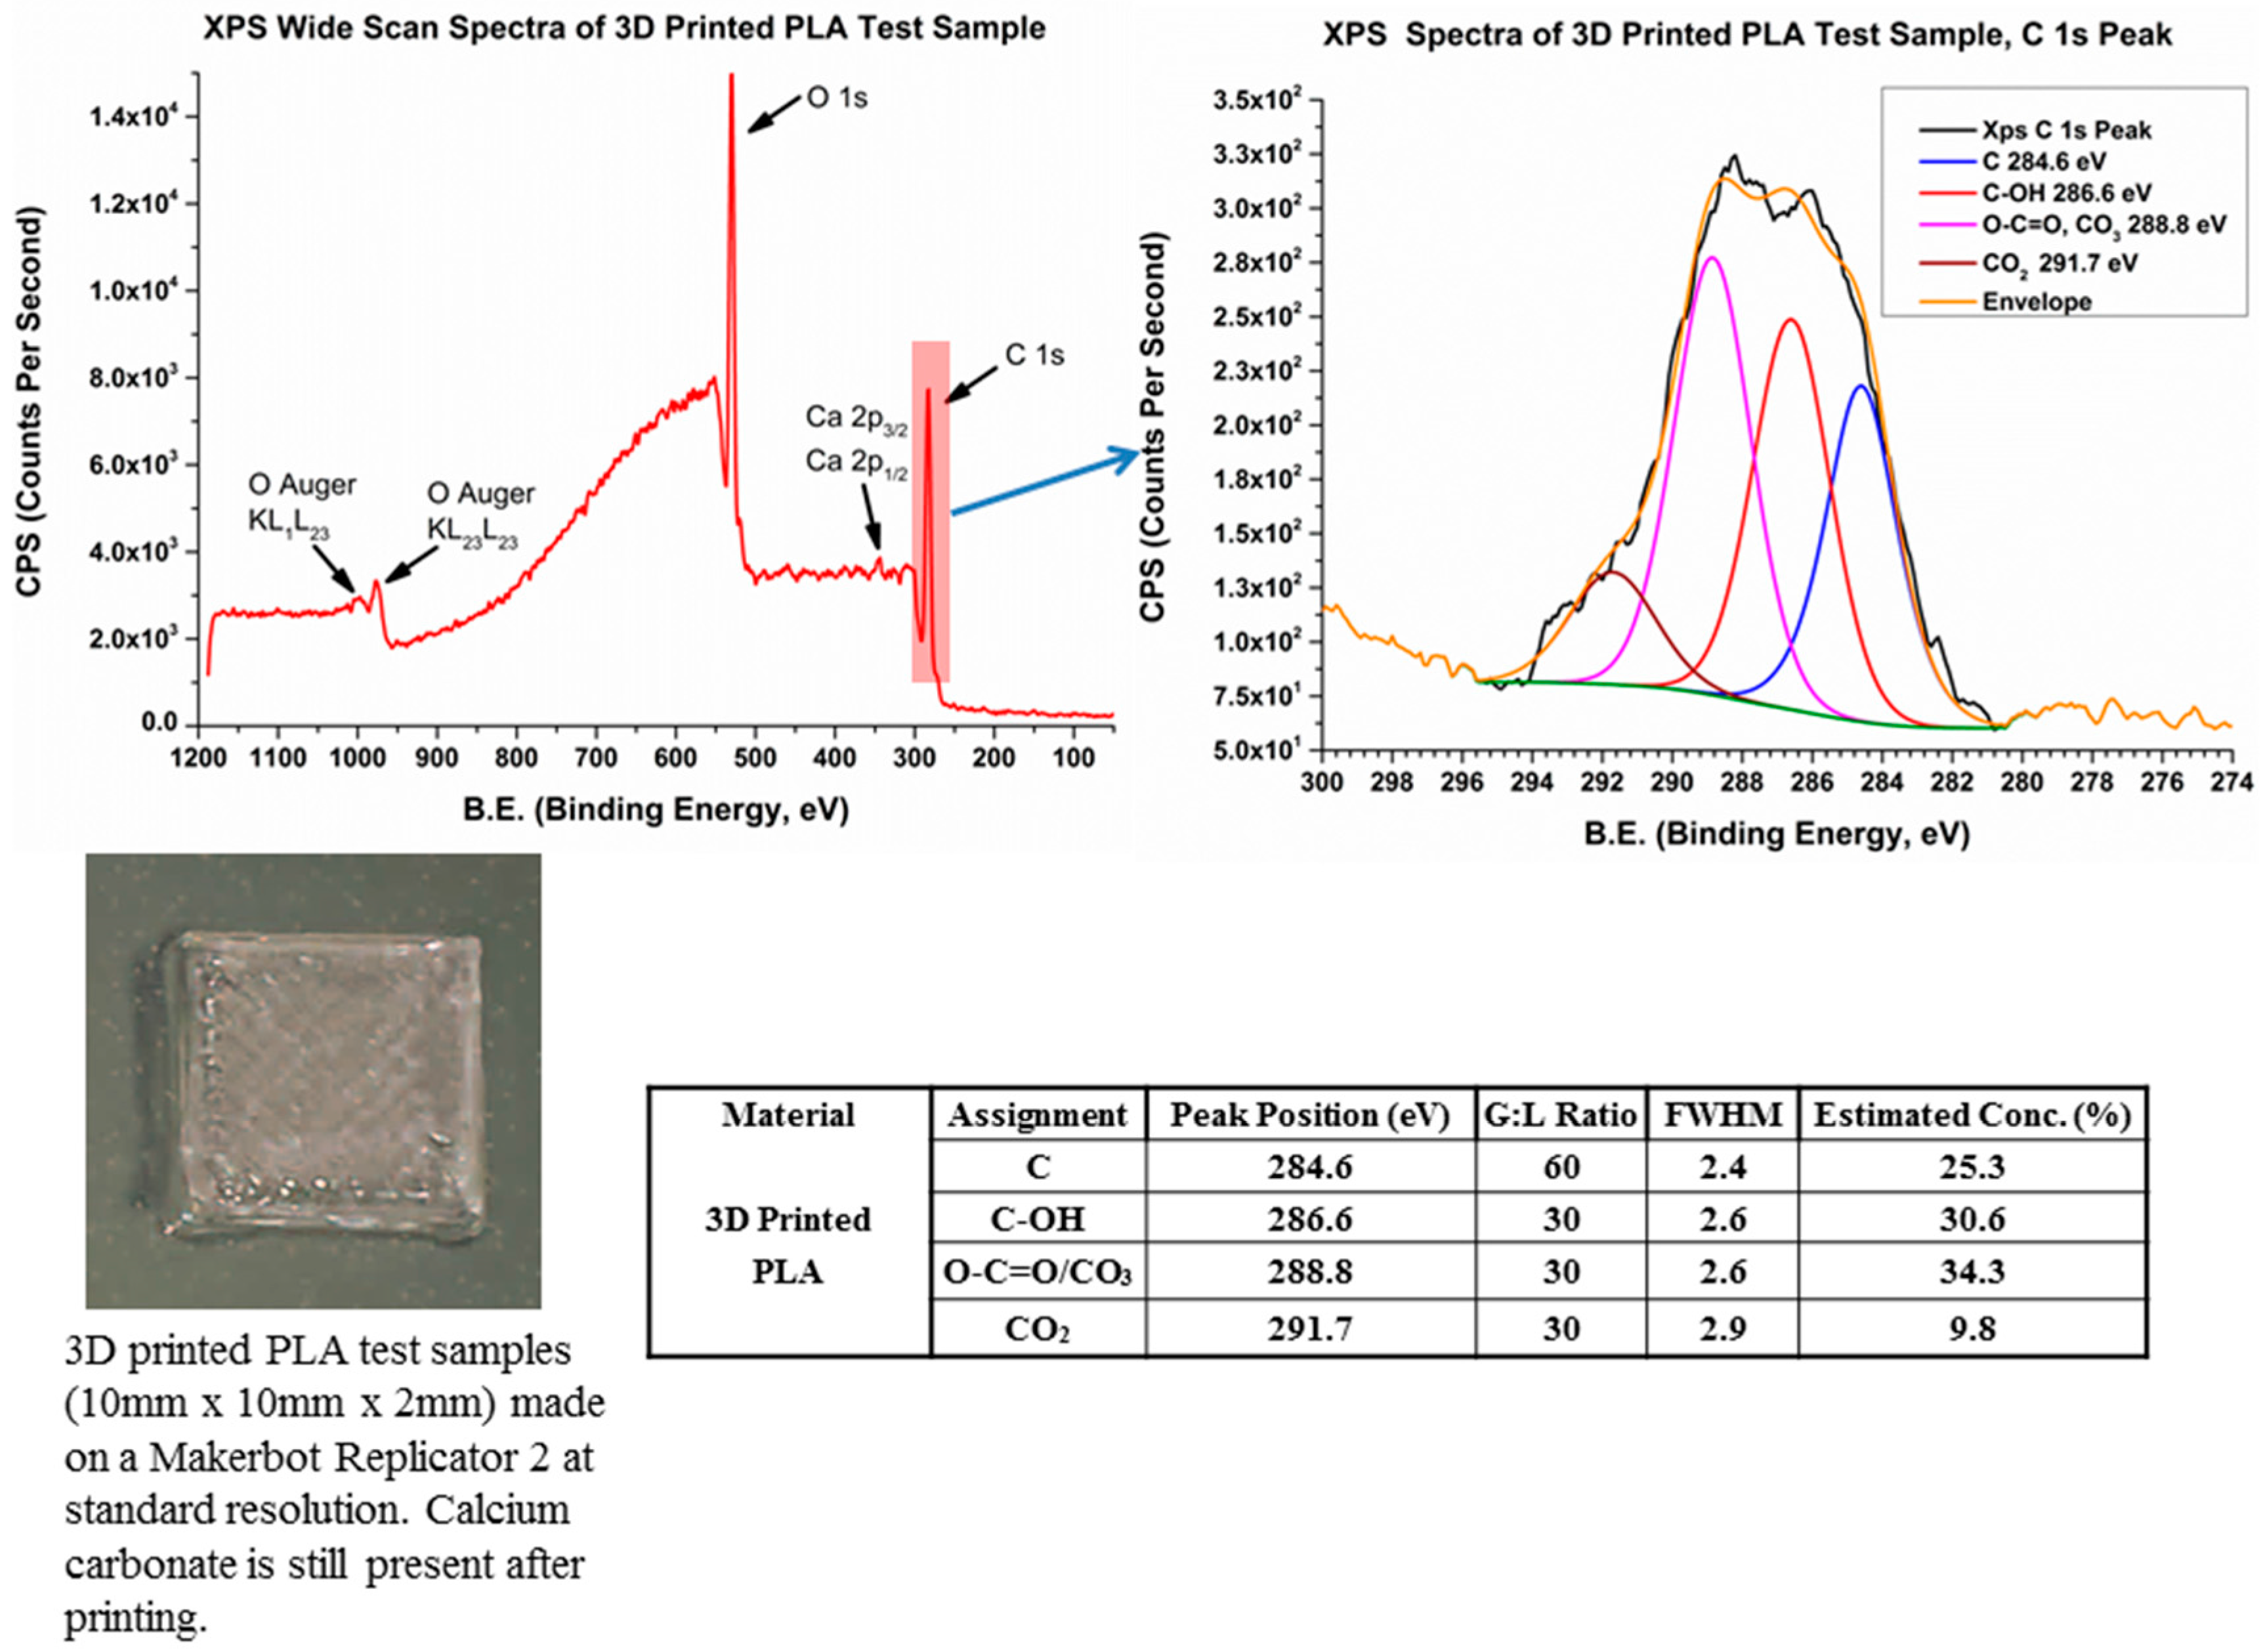
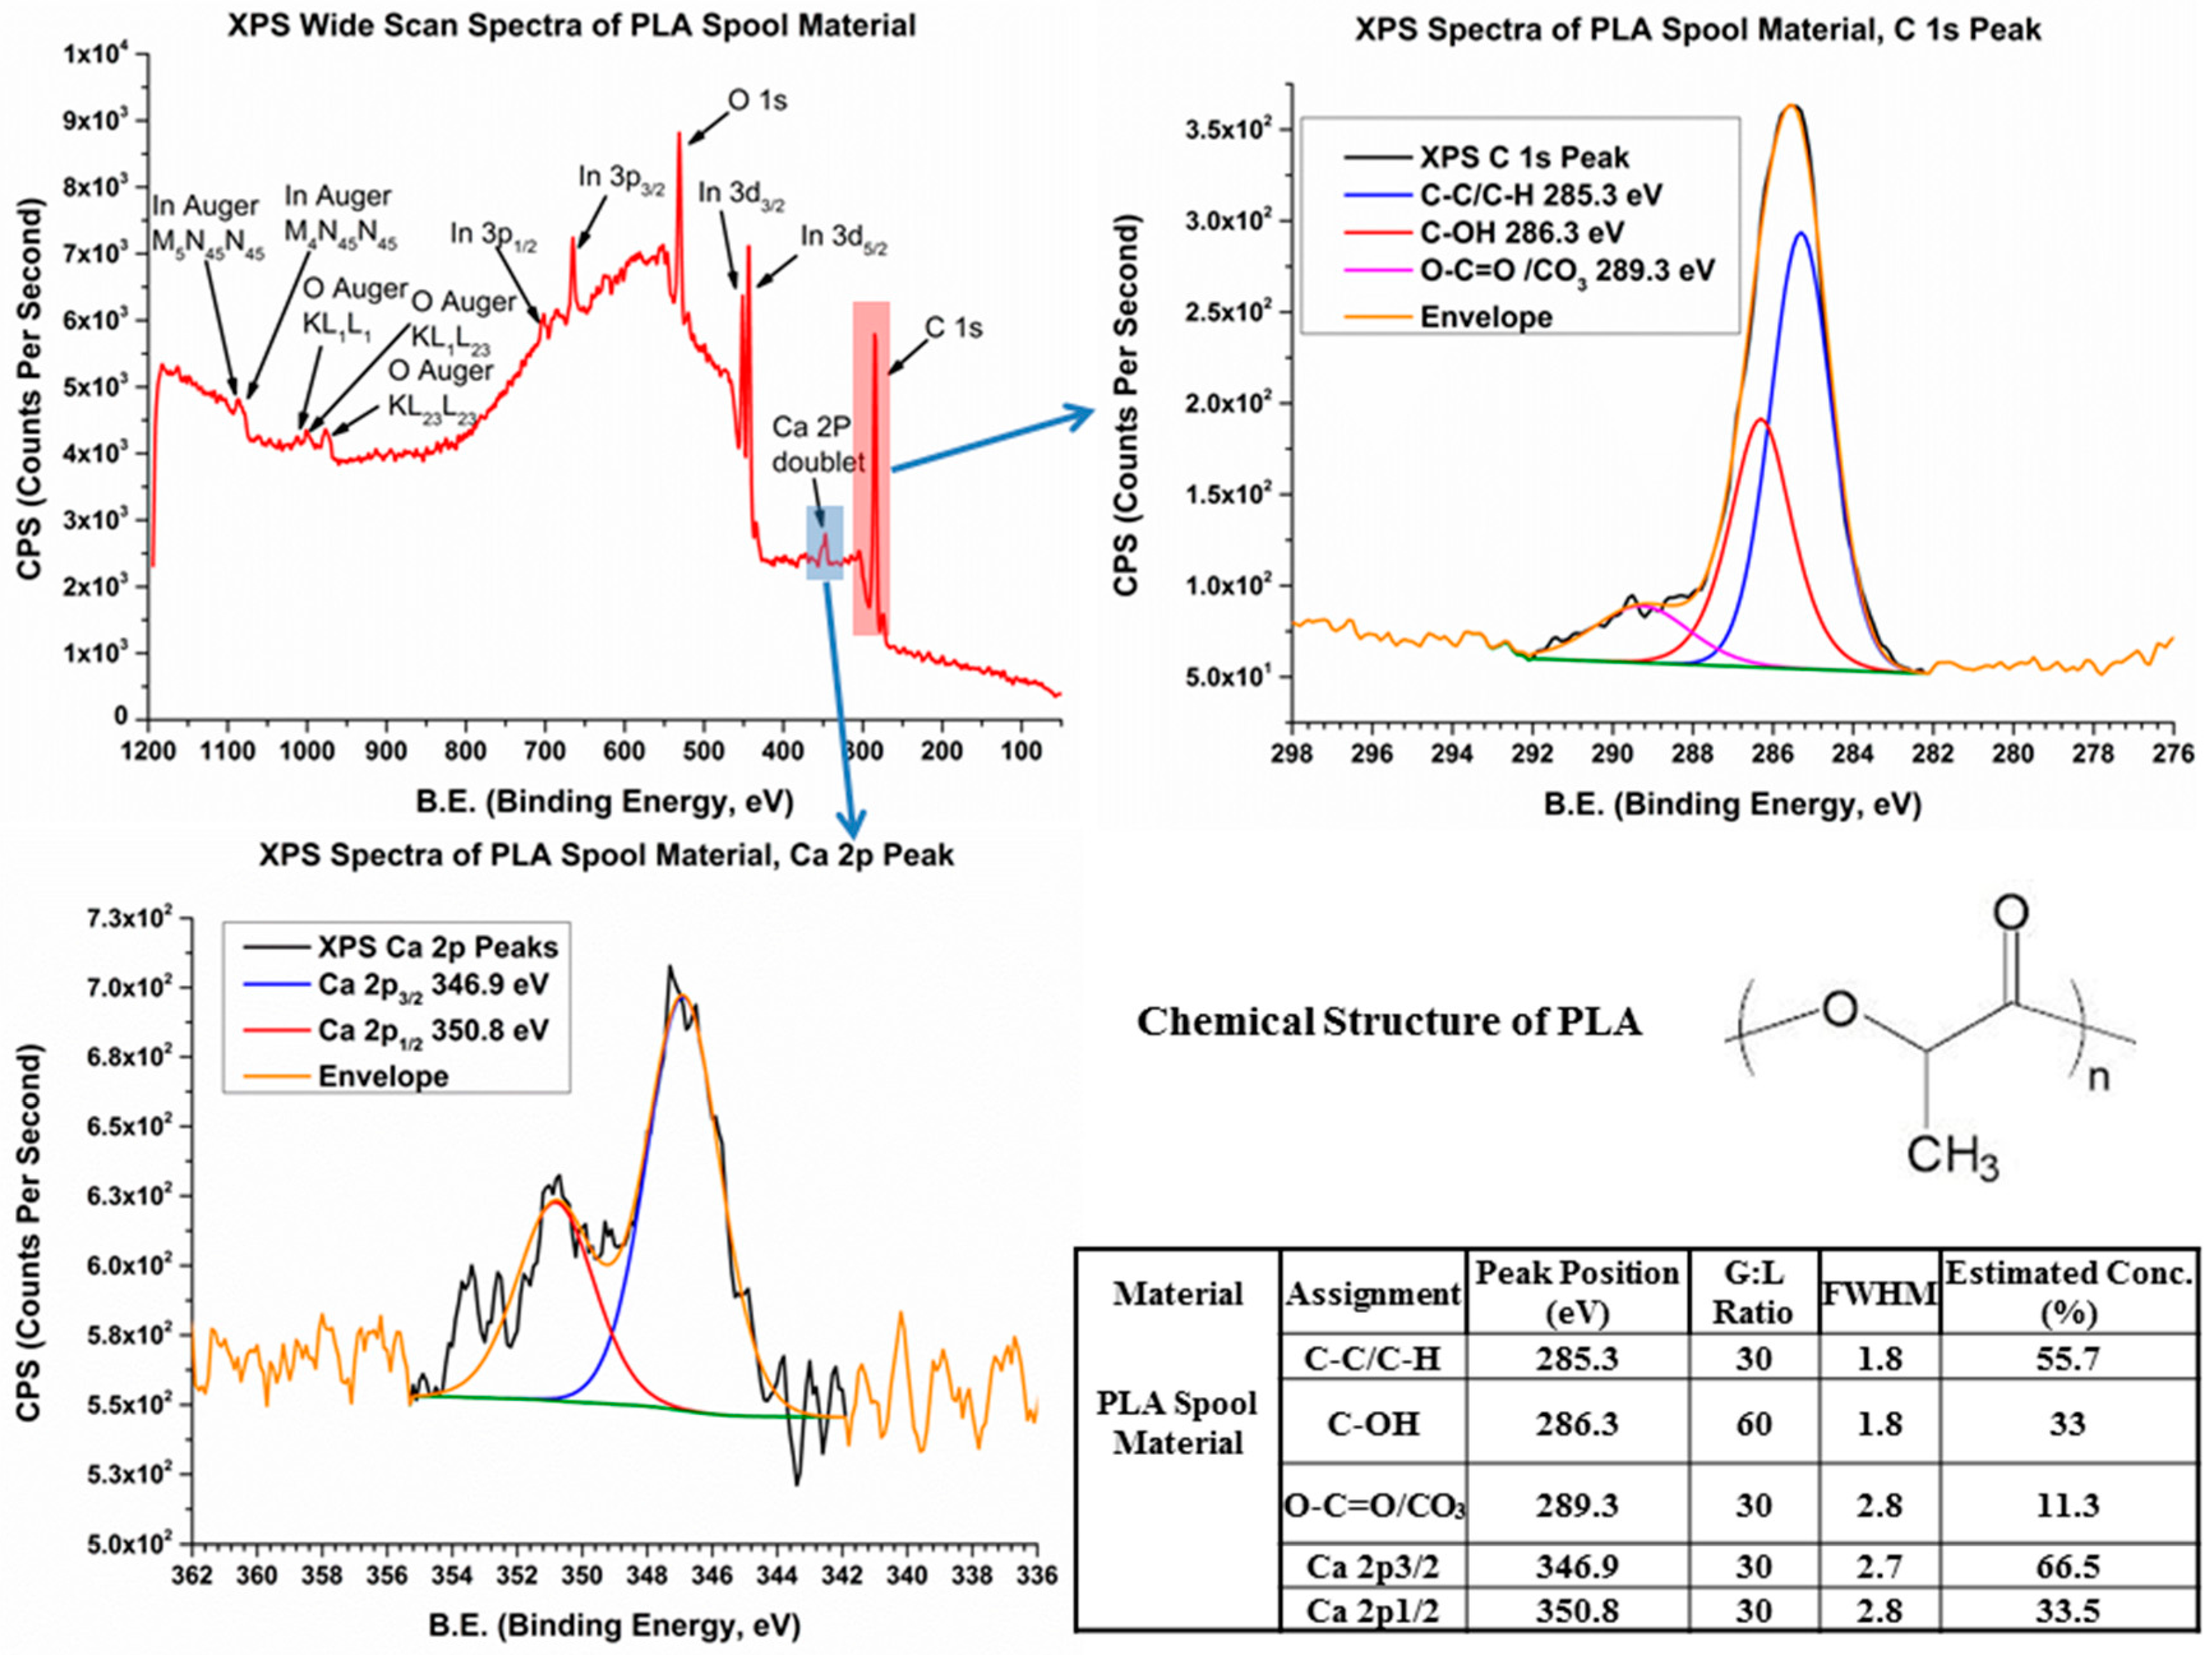
3.7. X-ray Photoelectron Spectroscopy (XPS)

The presence of a Ca2p photoelectron peak in the XPS spectra of as-received PLA spool material, Figure 9, indicates the presence of calcium (at least in the surface region). The high-resolution scan of the Ca2p photoelectron region is consistent with CaCO3 (Ca 2p3/2/Ca 2p1/2 binding energy of 346.9 eV/350.8 eV). The C 1 s peak deconvolution shows the presence of C-C/C-H at 285.3 eV, C-OH at 286.3 eV, and O-C=O at 289.3 eV. These peaks are consistent with PLA, as well as carbonate, though the high intensity of the peak at 285.3 eV most likely represents additional hydrocarbons present on the surface of the spool material. These hydrocarbons can be associated with a coating layer used in storage, winding, or handling during the manufacturing process. It is believed that calcium carbonate in the PLA spool material is also due to the manufacturing process as a component to aid in the extrusion and overall stability of the PLA filament.
XPS analysis of printed PLA, Figure 10, indicates that calcium carbonate remains present on the surface of the despite extrusion conditions (melting at 230 °C and cooling rapidly to room temperature following printing). The C 1 s spectrum deconvolution shows a ratio of C-C/C-H (284.6 eV), C-OH (286.6 eV), and O-C=O (288.8 eV) closer to what one would expect from PLA with some additional enrichment of the higher energy peak due to the remaining presence of CO3. However, the C 1 s spectrum from printed PLA now also shows a peak at 291.7 eV. We attributed this new peak to CO2, which was seen to have a slightly elevated presence in the FTIR spectrum from printed PLA. While some CO2 is noted by FTIR due to normal atmospheric conditions (as in the case of most materials) the presence under UHV (ultra-high vacuum) conditions (10−9–10−1 torr) during XPS indicates some additional incorporation and sorption in the surface layer of the printed PLA. This is likely due to the decomposition of CaCO3:
CaCO3 ↔ CaO + CO2
Therefore, the increase in CO2 seen in both the FTIR and this XPS spectra indicates that calcium carbonate is breaking down slightly and, due to the porous nature of printed PLA, it is likely becoming trapped (and subsequently chemisorbed) in the pores and voids of the material. This is consistent with results observed from laser confocal microscopy of the printed materials.
In general, our results have shown that heating, melting, and recrystallization of the PLA as a function of the printing process has drastically changed the nature of the PLA, making it stronger (via tensile testing measurements) and more chemically reactive (indicated by the increase in abundance of the C=O ligand). However, while this more chemically reactive nature is of value for in situ synthesis and stabilization of metal nanoparticles [28], or for use as support structure for growth and calcification of cells, it also results in some disadvantages which can impact its use in medical and other settings, such as increased susceptibility to water, alcohol, acetone, and heat. Water will decompose the material over time and alcohols, acetone, and heating will degrade the printed material as well [29,30,31,32,33]. This means that sterilization with alcohol, typical in medical use, may alter the chemistry of FDM-printed PLA samples. Additionally, PLA cannot be sterilized in an autoclave as both chemical alteration and degradation of the PLA will result. However, future testing of the PLA materials will look into using an FDA (Food and Drug Administration)-approved gas (ethylene oxide) used for sterilization of medial materials that cannot be subjected to alcohols or heat. Preliminary testing has also been conducted on PLA test samples with in situ-synthesized metal nanoparticles with minor to no observable degradation of the printed PLA structures themselves—such a method will enhance the usefulness of these 3d printed products for the medical industry [34].

4. Conclusions

In this study we have explored the chemical, thermal, and morphological changes that occur to PLA from source material to finished product. We have focused on source material from a single commercial source, and have used a single set of recommended, common printing parameters on a popular FDM-style printer. While there will obviously be differences between source material from different manufacturers and, hence, potentially different additives, pigments, and fillers, this study indicates the importance of complimentary characterization tools to understand the chemical transformations associated with possible additives and contaminants. We have made a number of important observations, which may certainly impact the applications and design considerations when using printed PLA:
  • The chosen spool (source) material contains a calcium carbonate-based additive which is retained following printing and which becomes concentrated in pores or voids in the printed surface. Evidence indicates that these additives are, in some way, reacted with polymer components or with trace transition metals found to be present in the filament.
  • The FDM printing process results in chemical changes in PLA (indicated by changes in the vibrational frequencies associated with CH3, C-O-C, and C=O ligands), as well as increased hydroxyl groups (which may be due to absorbed water).
  • The FDM printing process likely results in changes to the structure of the PLA, which is reflected in shifts in the temperature range and potential mechanism of cold crystallization, as well as the resulting melting characteristics.
  • Surface analytical studies indicate a surface which is likely more chemically reactive, in particular for processes which involve interaction of sorbed species with oxidized carbon ligands.
In general, it is likely that both the presence of inorganic additives or fillers, as well as chemical and structural changes produced by printing have the potential to significantly impact surface reactivity, functionalization, and association with atmospheric contaminants, organic species, cells and organisms. While the current study is limited in scope, it demonstrates the need for scientists, engineers, health professional and anyone who uses the current methods for additive manufacturing of PLA to be aware of potential issues related to material transformations during printing, as well as the somewhat uncertain nature of commercial material sources.

Acknowledgments

The undergraduate students who participated in this work were supported by an NSF-EEC REU site grant, “REU Site for Nanotechnology in Health, Energy and the Environment”, award 1359167 (Mary Poats, program officer). The authors would also like to acknowledge and thank James Quinn for assistance with the scanning electron microscopy, and Clive Clayton for guidance, helpful advice, and additional support.

Author Contributions

M. Cuiffo and G. Halada conceived and designed the experiments. M. Cuiffo, J. Snyder, A. Elliott, N. Romero, and S. Kannan preformed experiments and data collection. M. Cuiffo, J. Snyder, A. Elliott, N. Romero, and S. Kannan, performed data analysis for FTIR, Raman, and DSC. M. Cuiffo preformed XPS analysis and analyzed XPS data. G. Halada provided material and analysis tools. M. Cuiffo, G. Halada and S. Kannan wrote the paper.

Conflicts of Interest

The Authors declare no conflict of interest.

References

  1. Lipson, H.; Kurman, M. Fabricated: The New World of 3D Printing; John Wiley and Sons, Inc.: Indianapolis, IN, USA, 2013. [Google Scholar]
  2. Garlotta, D. A Literature Review of Poly(Lactic Acid). J. Polym. Environ. 2002, 9, 36–84. [Google Scholar]
  3. Henton, D.E.; Patrick, G.; Lunt, J.; Randall, J. Polylactic Acid Technology, Natural Fibers, Biopolymers, and Biocomposites; Taylor & Francis: Boca Raton, FL, USA, 2005; pp. 527–578. [Google Scholar]
  4. Athanasiou, K.A.; Niederauer, G.G.; Agrawal, C.M. Sterilization, Toxicity, Biocompatibility and Clinical Applications of Polylactic Acid/Polyglycolic Acid Copolymers. Biomaterials 1996, 17, 93–102. [Google Scholar] [CrossRef]
  5. Proikakis, C.S.; Tarantili, P.A.; Andreopoulos, A.G. The role of Polymer/Drug interactions on the Sustained Release from Poly(d, l-Lactic acid) Tablets. Eur. Polym. J. 2006, 4, 3269–3276. [Google Scholar] [CrossRef]
  6. Kulkarni, R.K.; Pani, K.C.; Neuman, C.; Leonard, F. Polylactic Acid for Surgical Implants; Technical Report 6608; U.S. Army Medical Biomechanical Research Laboratory/Walter Reed Army Medical Center: Washington, DC, USA, April 1966. [Google Scholar]
  7. Timrak, B.M.; Kreiger, M.; Pearce, J.M. Mechanical properties of components fabricated with open-source 3-D printers under realistic environmental conditions. Mater. Des. 2014, 58, 242–246. [Google Scholar] [CrossRef]
  8. De Faria, D.L.A.; Venancio Silva, S.; Oliveira, M.T. Raman Microspectroscopy of Some Iron Oxides and Oxyhydroxides. J. Raman Spectrosc. 1997, 28, 873–878. [Google Scholar] [CrossRef]
  9. Hanesch, M. Raman Spectroscopy of Iron Oxides and (oxy)hydroxides at Low laser Power and Possible Applications in Environmental Magnetic Studies. Geophys. Int. 2009, 177, 941–948. [Google Scholar] [CrossRef]
  10. Luo, L.; Wilhelm, C.; Young, C.N.; Grey, C.P.; Halada, G.P.; Xiao, K.; Ivanov, I.N.; Howe, J.Y.; Geohegan, D.B.; Goroff, N.S. Characterization and Carbonization of Highly Oriented Poly(diiododiacetylene) Nanofibers. Macromolecules 2011, 44, 2626–2631. [Google Scholar] [CrossRef]
  11. Savutsky, A.; Golay, M.J. Smoothing and Differentiation of Data by Simplified Least Squares Procedures. Anal. Chem. 1964, 36, 1627–1639. [Google Scholar] [CrossRef]
  12. Sherwood, P.M.A. Practical Surface Analysis; Briggs, D., Seah, M.P., Eds.; Wiley, John and Sons: New York, NY, USA, 1993. [Google Scholar]
  13. Halada, G.P.; Clayton, C.R. Comparison of Mo-N and W-N Synergism During Passivation of Stainless Steel through X-ray Photoelectron Spectroscopy and Electrochemical Analysis. J. Vac. Sci. Technol. A 1993, 11, 2342–2347. [Google Scholar] [CrossRef]
  14. Halada, G.P.; Kim, D.; Clayton, C.R. The Influence of Nitrogen on the Electrochemical Passivation of High Ni Stainless Steels and Thin Mo-Ni Films. Corrosion 1996, 52, 36–46. [Google Scholar] [CrossRef]
  15. Chidambaram, D.; Clayton, C.R.; Halada, G.P. A Duplex Mechanism-Based Model for the Interaction Between Chromate Ions and the Hydrated Oxide Film on Aluminum Alloys. J. Electrochem. Soc. 2003, 150, B224–B237. [Google Scholar] [CrossRef]
  16. Solarski, S.; Ferreira, M.; Devaux, E. Charicterization of the Thermal Properties of PLA Fibers by Modulated Differential Scanning Calorimetry. Polymer 2005, 46, 11187–11192. [Google Scholar] [CrossRef]
  17. Giannitelli, S.M.; Mozetic, P.; Trombetta, M.; Rainer, A. Combined additive manufacturing approaches in tissue engineering. Acta Biomater. 2015, 24, 1–11. [Google Scholar] [CrossRef] [PubMed]
  18. Wang, M.; Favi, P.; Cheng, X.; Golshan, N.H.; Ziemer, K.S.; Keidar, M.; Webster, T.J. Cold atmospheric plasma (CAP) surface nanomodified 3D printed polylactic acid (PLA) scaffolds for bone regeneration. Acta Biomater. 2016, 46, 256–265. [Google Scholar] [CrossRef] [PubMed]
  19. Vasquez, M.J.; Kearns, J.R.; Halada, G.P.; Clayton, C.R. Spatially resolved microchemical analysis of chromate-conversion-coated aluminum alloy AA2024-T3. Surf. Interface Anal. 2002, 33, 796–806. [Google Scholar] [CrossRef]
  20. Berg, B.L.; Ronholm, J.; Applin, D.M.; Mann, P.; Izawa1, M.; Cloutis, E.A.; Whyte, L.G. Spectral features of biogenic calcium carbonates and implications for astrobiology. Int. J. Astrobiol. 2014, 13, 353–365. [Google Scholar] [CrossRef]
  21. Roberson, D.A.; Carmen, R.R.; Piñon, M. Evaluation of 3D Printable Sustainable Composites. Available online: https://sffsymposium.engr.utexas.edu/sites/default/files/2015/2015-75-Roberson.pdf (accessed on 15 March 2017).
  22. Socrates, G. Infrared and Raman Characteristic Group Frequencies, Tables and Charts, 3rd ed.; John Wiley and Sons: West Sussex, UK, 2001. [Google Scholar]
  23. Suzuki, T.; Takahashi, K.; Uehara, H.; Yamanobe, T. Applications and Analysis of a DSC-Raman Spectroscopy for Indium and Poly(lactic acid). J. Therm. Anal. Calorim. 2013, 113, 1543–1549. [Google Scholar] [CrossRef]
  24. Kister, G.; Cassanas, G.; Vert, M. Effects of Morphology, Conformation and Configuration on the IR and Raman Spectra of Various Poly(lactic acid)s. Polymers 1998, 39, 267–273. [Google Scholar] [CrossRef]
  25. Hutmacher, D.W. Scaffolding in Tissue Engineering Bone and Cartilage. Biomaterial 2000, 21, 2529–2543. [Google Scholar] [CrossRef]
  26. Cao, X.; Mohamed, A.; Gordon, S.H.; Willett, J.L.; Sessa, D.J. DSC Study of Biodegradable Poly(lactic acid) and Poly(hydroxyl ester ether) Blends. Thermochim. Acta 2003, 406, 115–127. [Google Scholar] [CrossRef]
  27. Jalali, A.; Huneault, M.A.; Elkoun, S.J. Effect of Thermal History on Nucleation and Crystallization of Poly(lactic acid). Mater. Sci. 2016, 51, 7768–7779. [Google Scholar] [CrossRef]
  28. Halada, G.P.; Jha, P.; Cuiffo, M.; Acquah, K.; Carl, S. Aqueous Electrochemical Synthesis of Stable Silver Metal Nanoparticles onto a Chitosan Matrix on Stainless Steel. ECS Trans. 2014, 58, 19–32. [Google Scholar] [CrossRef]
  29. Li, S.; McCarthy, S. Further investigations on Hydrolytic Degradation of Poly (dl-Lactide). Biomaterial 1999, 20, 34–44. [Google Scholar] [CrossRef]
  30. De Jong, S.J.; Arias, E.R.; Rijkers, D.T.S.; Van Nostrum, C.F.; Kettenes-Van den Bosch, J.J.; Hennink, W.E. New Insights into Hydrolytic Degradation of Poly (lactic acid) Participation of the Alcohol Terminus. Polymers 2001, 42, 2795–2802. [Google Scholar] [CrossRef]
  31. Al-Itry, R.; Lamnawar, K.; Maazouz, A. Improvement of Thermal Stability, Rheology and Mechanical Properties of PLA, PBAT and Their Blends by Reactive Extrusion with Functionalized Epoxy. Polym. Degrad. Stab. 2012, 97, 1898–1914. [Google Scholar] [CrossRef]
  32. Carrasco, F.; Pages, P.; Gámez-Pérez, J.; Santana, O.O.; Maspoch, M.L. Processing of Poly(lactic acid): Characterization of chemical Structure, Thermal Stability and Mechanical Properties. Polym. Degrad. Stab. 2010, 90, 116–125. [Google Scholar] [CrossRef]
  33. Yuzay, I.E.; Auras, R.; Soto-Valdez, H.; Selke, S. Effects of Synthetic and Natural Zeolites on Morphology and Thermal Degradation of Poly(lactic acid) Composites. Polym. Degrad. Stab. 2010, 95, 1769–1777. [Google Scholar] [CrossRef]
  34. Ventola, C.L. Medical Applications for 3D Printing: Current and Projected Uses. Pharm. Ther. 2014, 39, 700–711. [Google Scholar]
Figure 1. Optical images of the source and printed polylactic acid (PLA). (A) Lengthwise section of PLA spool material (B) Cross-section of spool material (C & D) 3D printed PLA
Applsci 07 00579 g001
Figure 2. Scanning electron microscopy image of printed PLA showing micro- and sub-micron-scale roughness.
Applsci 07 00579 g002
Figure 3. Laser confocal image of PLA source filament, collected from a side view with a 10× objective.
Applsci 07 00579 g003
Figure 4. Laser confocal image of top surface of a printed PLA Sample.
Applsci 07 00579 g004
Figure 5. Raman spectroscopic comparison of PLA spool material, printed PLA.
Applsci 07 00579 g005
Figure 6. Diffuse Reflectance FTIR (DRIFTS) spectroscopy of PLA spool material as received.
Applsci 07 00579 g006
Figure 7. Diffuse Reflectance FTIR (DRIFTS) spectroscopy of 3D-printed PLA.
Applsci 07 00579 g007
Figure 8. Differential scanning calorimetry (DSC) comparison of PLA spool material and printed PLA.
Applsci 07 00579 g008
Figure 9. XPS spectra of PLA spool material as received, showing the wide-scan spectra and analysis of the C 1s and Ca 2p photoelectron peaks.
Applsci 07 00579 g009
Figure 10. XPS spectra of 3-D printed PLA test samples, showing the wide scan spectra, and the analyzed C 1 s photoelectron peak, along with an image of the test sample analyzed by XPS.
Applsci 07 00579 g010
Table 1. Results of XRF measurements from PLA natural source filament and printed PLA.
ElementSource Filament (Averaged over Three Samples) (ppm)Printed PLA (Averaged over Three Areas) (ppm)
P2100 ± 501183 ± 70
Ca528 ± 40585 ± 25
Si310 ± 35180 ± 15
Cr110 ± 1061 ± 5
Ti80 ± 1040 ± 10
Cu35 ± 1013 ± 4
Sn(below detection)18 ± 5
Trace amounts of W, Cd, Zr, Nb, Mo

