
Performance Analysis of a Forecasting Relocation Model for One-Way Carsharing
by
 , , and
Ganjar Alfian
1,* ,
,
Jongtae Rhee
2, 
Muhammad Fazal Ijaz
2,
Muhammad Syafrudin
2 and
Norma Latif Fitriyani
2 1
u-SCM Research Center, Nano Information Technology Academy, Dongguk University, Seoul 100-715, Korea
2
Department of Industrial and Systems Engineering, Dongguk University, Seoul 100-715, Korea
*
Author to whom correspondence should be addressed.
Appl. Sci. 2017, 7(6), 598; https://doi.org/10.3390/app7060598
Submission received: 27 March 2017
/
Revised: 30 May 2017
/
Accepted: 6 June 2017
/
Published: 9 June 2017
(This article belongs to the Special Issue Modeling, Simulation, Operation and Control of Discrete Event Systems)
Abstract
:A carsharing service can be seen as a transport alternative between private and public transport that enables a group of people to share vehicles based at certain stations. The advanced carsharing service, one-way carsharing, enables customers to return the car to another station. However, one-way implementation generates an imbalanced distribution of cars in each station. Thus, this paper proposes forecasting relocation to solve car distribution imbalances for one-way carsharing services. A discrete event simulation model was developed to help evaluate the proposed model performance. A real case dataset was used to find the best simulation result. The results provide a clear insight into the impact of forecasting relocation on high system utilization and the reservation acceptance ratio compared to traditional relocation methods.
1. Introduction
Increasing numbers of private vehicles provide high flexibility to users, but have several negative impacts, such as congestion, pollution, and excessive energy consumption. Public transport could be a good alternative, but has several limitations, such as the lack of service flexibility. Carsharing services can be a solution, providing the flexibility of private cars and the benefits of public transport. Previous research has shown the benefits of carsharing systems include cost savings, environmentally friendly transportation, and reducing gas consumption [1,2]. Implementation of carsharing has reduced the CO2 per average carsharing user in Germany [3], vehicle distance travelled in London [4], and vehicle distance travelled per year in North America [5].
One-way carsharing systems enable a car to be driven between multiple stations, whereas for traditional services (round-trip) users must return the car to the originating station. Previous studies have shown that almost all round-trip operators viewed one-way carsharing as a complement to round-trip carsharing [6]. However, one-way carsharing systems present operational problems with unbalanced vehicle inventories across the station network [7]. Considerable effort has been undertaken to solve unbalanced car distribution, with several proposed approaches: user based relocation, i.e., allowing users to relocate the vehicles [8,9,10]; and operator based relocation, i.e., operators replenish vehicle stocks to high demand stations [7,11]. Forecasting models for relocation have also been suggested to optimize relocation [12,13].
Studies have shown that to satisfy customer vehicle demand, forecasting relocation is required to predict the vehicle net flow for each station [12,13]. Barth and Todd [7] showed that predictive relocation is more efficient in terms of reducing the customer wait time compared to other relocation systems. Previous studies have mostly compared forecasting or predictive relocation performance with other relocation systems using forecasting model accuracy [12] and customer satisfaction [7,13]. However, other evaluations are required, related to company profit, i.e., relocation cost and system utilization [11,14]. Another critical factor that influences carsharing services is the different user behavior [15,16,17]. Thus, it is important that forecasting relocation performance evaluation includes the relocation costs, system utilization, and customer satisfaction, with respect to various types of customer transactions before being implemented as a practical business model.
In addition, Boyaci et al. [18] and Repoux et al. [19] have presented integrated optimization-simulation framework to evaluate the performance of long-term and last-minute one-way reservation systems. In long-term reservation, the one-way system can be optimized as all the demand is known in advance (reservations are performed at least a day before) thus it can serve a higher number of requests compared to last-minute reservation. However, the last-minute reservation gave more flexibility to the customer as it allows customers to reserve a car for a trip starting in a short period of time (a couple of hours). Our study proposed a simulation model to evaluate forecasting relocation for one way carsharing with last-minute reservation. The customer satisfaction (i.e., reservation acceptance ratio), relocation cost, and utilization ratio are used as performance indicators for a different number of customer demands. The simulation results provide a benchmark for management to optimize the relocation model for one-way services as well as to optimize the number of car operations based on their current customer trip demands.
2. Literature Review
2.1. Carsharing
Carsharing, or what is traditionally referred to as neighborhood carsharing, began in Europe and placed a network of vehicles in strategic parking areas (mostly in residential neighborhoods) located throughout dense cities [20]. Basically, members subscribed to a carsharing company and paid a fee each time they used a vehicle, which covered the cost of vehicle use, insurance, maintenance, and fuel. One of the formal carsharing demonstrations in the United States was Mobility Enterprise, operated as a Purdue University research program from 1983 to 1986. Studies have shown that operators are more likely to be economically successful when they provide a dense network and a variety of vehicles; serve a diverse mix of users; create joint marketing partnerships; design a simple, flexible rate system; and provide easy emergency access to taxis and long-term car rentals [21].
The implementation of carsharing services can reduce vehicle distance travelled and also strengthen public transportation services. Vine et al. showed that the greatest reduction in overall vehicle distance travelled including carsharing and private cars resulted from introducing round-trip carsharing across all of London [4]. In North America, station based car sharing has resulted in reduced emissions, due to fewer cars on the roads, and a 27% reduction in average vehicle distance travelled per year [5]. Shaheen and Rodier showed that carsharing strengthened public transportation services, as revealed by its members who tended to reside in medium to high density areas and used public transportation frequently [22]. Millard-Ball et al. [1] showed that carsharing provided the best option in terms of flexibility for intermediate length trips, while for longer trips, rental cars were usually less expensive, and for short distances, taxis tended to be more cost effective. Another important factor in carsharing is determining the optimal locations of future stations so that more people can be attracted by the carsharing service. Li et al. [23] utilized an analytic hierarchy process (AHP) and a geographical information system (GIS) to determine the location of carsharing stations. The potential users, travel demand, travel purposes, and distance from existing stations were selected as decision criteria. The study suggests that if there were enough parking spaces near a candidate site and the cost was acceptable, then the candidate site from the proposed model could be selected.
Various reservation mechanisms are used in carsharing, ranging from manual systems, where users call a reservation center; to automated systems that can be accessed via the phone or Internet [24]. Reservation based carsharing provides control over demand flow and allows better prediction of the system’s future state. Current services allow customer flexibility such as instant access (i.e., no reservations). Alfian et al. [25] compared instant access and reservation based one-way system performances by discrete event simulation, and showed that reservation based systems were better in terms of the utilization ratio and customer satisfaction (acceptance ratio). Reservation systems also help the operator to maximize car operation by minimizing uncertain return cars from previous customers. The study also suggested that the operator needed to provide a high number of operational cars for instant access one-way, maximizing profit and customer satisfaction.
Rhee et al. [26] proposed a simulation model to optimize car operation for round-trip services. They showed that the number of cars and customer reservations impact customer satisfaction (acceptance ratio) and the utilization ratio. Thus, deciding the correct number of cars based on the current number of reservations allows target acceptance and utilization ratios to be achieved. Implementation of one-way services can be complementary to round-trip services, increasing customer trip flexibility. Shaheen and Chan [6] surveyed operators in North and South America (USA, Canada, Mexico, and Brazil) and showed that almost 70% of round-trip operators viewed one-way carsharing as complementary to round-trip carsharing. Simulation approaches are useful to validate design performances for carsharing services, i.e., the possible combination of round-trip, one-way, and other services, and help managers prioritize the best service model before implementation. Alfian et al. showed that combining round-trip and one-way services can improve company profit while maintaining customer satisfaction compared to other service models [27]. However, in order to evaluate the performance of the one-way carsharing system, the one-way demand should be considered as an input for evaluation. Boyaci et al. have presented the conversion of round-trip data to one-way data [28]. The conversion is done by splitting single round-trip data into multiple one-way data when the idle time of the rented vehicle at a given location exceeded one hour and the location is near a station by less than 500 m.
2.2. Relocation Model
Recent research in the area of carsharing has focused on the relocation model as an operational problem of imbalances in vehicle inventories across the network of stations. Simulation can provide a very detailed representation of carsharing operational services, and is typically used to identify system behavior when business constraints change. In this study, forecasting relocation was implemented for a last-minute reservation based one-way system. Multiple stations (station based or non-floating system) were used based on a real carsharing dataset. In reservation based carsharing system services, customers are usually able to make reservations by calling customer services, and/or using a web based reservation system. Once the reservation is accepted, the customer can arrive at the station and start using the car. After some time, the customer completes his/her travel and returns the car to the destination station. At the end of the day, the operator relocates a number of vehicles to increase the customer service level. In this scenario, certain events (calling, starting, ending, and relocation) that change system situations must be considered. In a discrete-event simulation, the operation of a system is represented as a chronological sequence of events. Each event occurs at an instance in time and marks a change of state in the system. Thus, in this case the discrete event simulation is needed to evaluate the one-way system given different events.
Barth and Todd designed a simulation model to evaluate the overall system performance of a one-way system combined with operator based relocation [7]. Static relocation was proposed to move a car based on immediate needs at a particular station. They showed that predictive relocation based on historical data was more efficient in terms of reducing the customer wait time compared to static relocation. Kek et al. proposed the shortest time and inventory balancing relocation methods. Shortest time relocation involves moving a car from a neighboring station in the shortest possible time, while inventory balancing relocation moves a car to a station with a shortage of cars from another station with an oversupply of cars [11]. They showed that inventory balancing reduced the relocation cost, but shortest time improved the zero vehicle time (ZVT), i.e., increased car utilization. Alfian et al. also tested different combinations of relocation models: static, shortest time, inventory balancing, and rebalancing (resetting the number of cars at each station at the end of the day, i.e., midnight) [27]. They showed that static shortest time generated higher profit and customer satisfaction compared to other relocation schemes.
Boyaci et al. have proposed an integrated optimization-simulation framework for one-way electric carsharing system [18]. The study considered station clustering in order to reduce the computation time for the optimization model. The clusters of stations are created using the technique similar to the k-Medoid algorithm. The simulation is used to test the feasibility of the optimization outcome in terms of the vehicle recharging requirement. The study considered the long-term reservation system which allows customers to perform reservations at least one day before (all demand is considered to be known in advance). The results showed that the long-term reservation can serve more demands from the customers as the operator can perform relocation to serve these reservations. On the other hand, Repoux et al. utilized a last-minute reservation system which allows customer to reserve a car for a trip starting in a short period of time [19]. If a demand is accepted, the assigned vehicle is kept reserved until it is picked up by the user who reserved the car. The study used an optimization framework to decide the best relocation plan in the coming hours (dynamic relocation). The relocation plan includes the information such as relocation choice, personnel tasking, and time for relocation; to serve the demands from customers. The result showed that the proposed relocation model is more efficient in terms of serving a higher number of requests.
Compared to operator based relocation algorithms, user based relocation, i.e., allowing the user to relocate the car, is relatively rare. Di Frebbraro et al. proposed a user based relocation scheme offering greater flexibility to the users [8]. The discrete event simulation (DES) model was applied to a case study to evaluate the proposed approach, and showed a significantly decreased rejection rate from the worst (no relocation) to the best (relocation of all vehicles by their users) scenario.
Uesugi et al. proposed simulation based user relocation methods for optimal vehicle assignment for station based one-way carsharing systems, including user based strategies of divided (trip splitting) and combined (trip joining) assignment [10]. Divided assignment can be implemented at a station with excess vehicles, reducing the number of vehicles at the initial station and increasing the vehicles at drop-off stations. Combined assignment can be implemented at a station that has less vehicles, increasing the available vehicles at the initial station and decreasing the parked vehicles at the drop-off station. They showed that this method was effective at keeping vehicle distribution balanced among stations for one-way carsharing systems.
Cheu et al. proposed a forecasting model to predict the net flow of vehicles in a three-hour period using neural networks and support vector machines (SVMs) [12]. The net vehicle flow is supply (number of vehicles being returned to a station)—demand (number of vehicles being rented from a station). They showed that the multilayer perceptron neural network model had a slightly better forecast accuracy compared to SVM. Wang et al. compared several time series forecasting methods, such as selective moving averages, Holt’s model, Winter’s model, and Tabu Search heuristics, and they were also compared to predict the net vehicle flow, with the predicted net flow being used by operators to decide the inventory and threshold of vehicles for each station [13]. They showed that implementing forecasting relocation models on real carsharing services improved the service level. Alfian et al. also studied the effects of the relocation time period, i.e., when to relocate vehicles; and showed that periodical relocation, i.e., relocation triggered every 6 h, had lower relocation costs compared to static relocation (immediate relocation once a station net flow exceeded or fell below a given threshold) [14].
Another critical factor influencing carsharing services is user behavior differences [15,16,17]. Many studies have shown that customers require a variety of transactions and distance configurations. Thus, this paper used a last-minute reservation, neural network based forecasting relocation models, and evaluated their performance with respect to various customer transactions by simulation.
3. Methodology
3.1. Carsharing Simulation
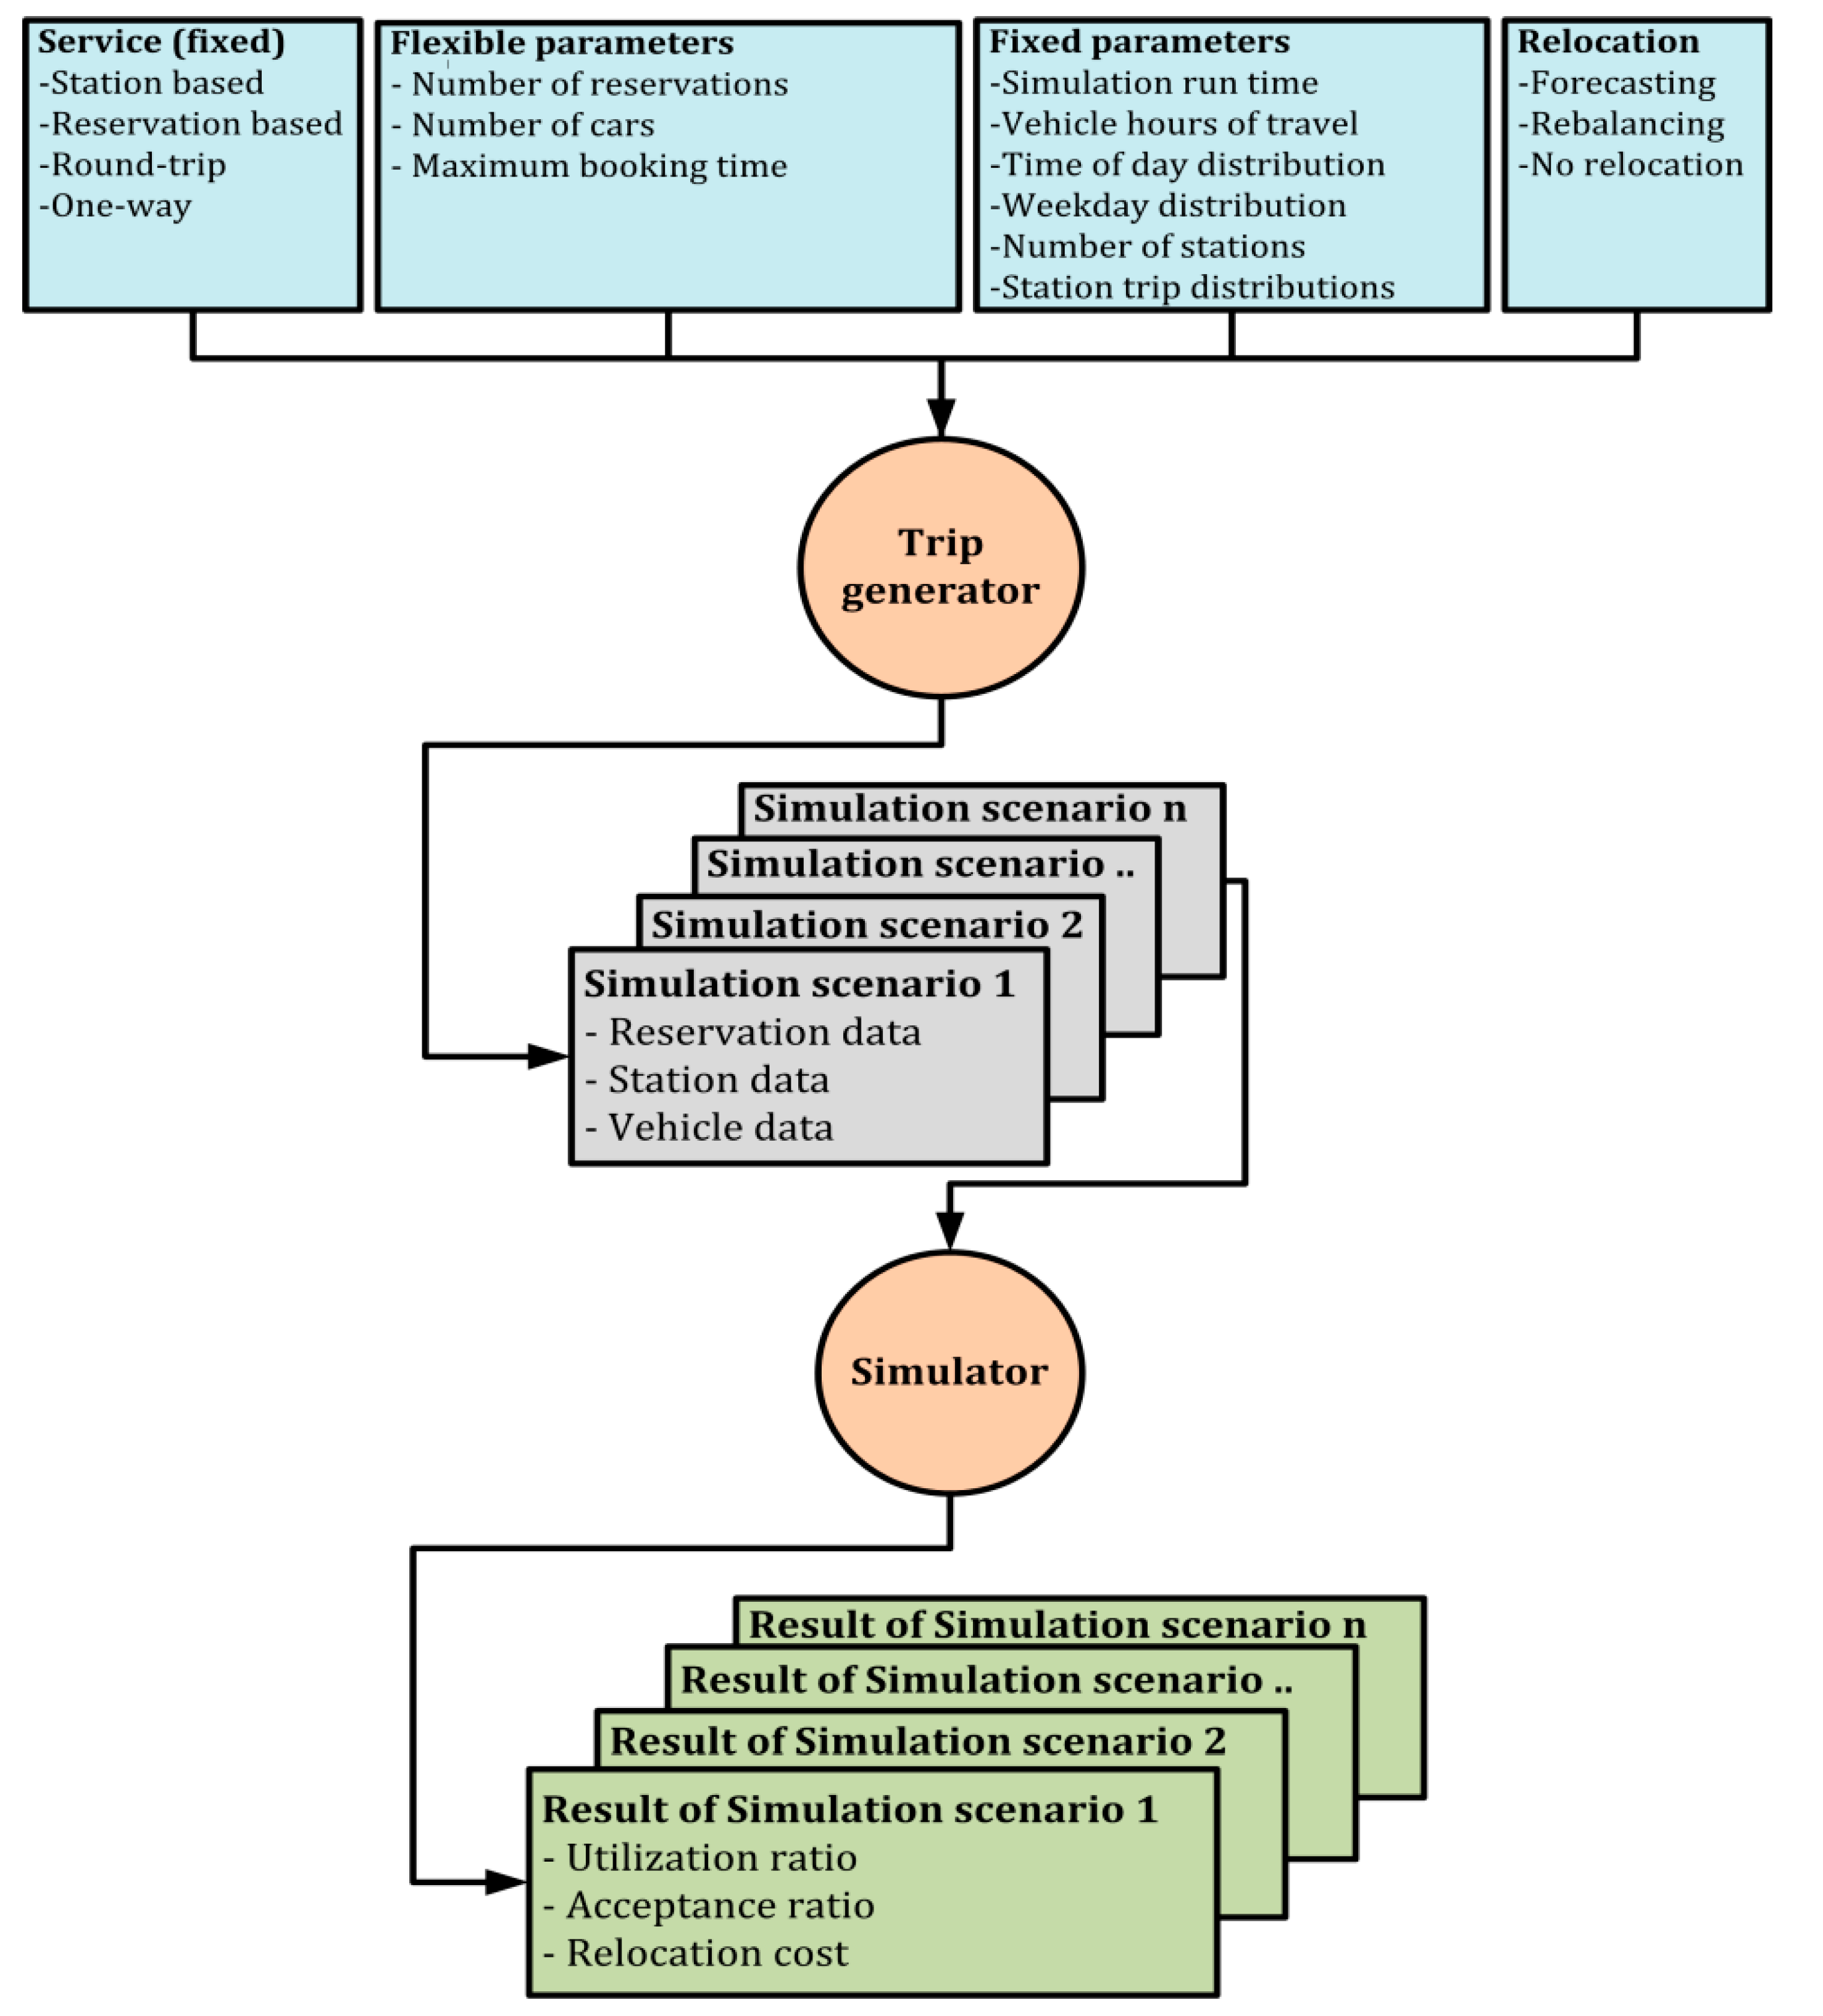
This paper used a simulation model for a station based one-way service, which allowed customers to use a car and return it to a different station. Reservation based carsharing was applied, i.e., all the customers were required to reserve a vehicle in advance. Round-trip and one-way services were considered, and if a company operated a one-way service, it also allowed customers to use the round-trip service since the round-trip service is a standard service for car sharing businesses. The proportion of round-trip and one-way reservations was assumed to be 50:50, i.e., one-way reservations comprised 50% of the total reservations with the remainder being round-trip reservations. The simulation was run for every reasonable combination of parameters (flexible parameters), such as the number of cars, number of reservations, and maximum booking time. Customer travel demand of the carsharing company (fixed parameters) was used as a simulation input, such as vehicle hour trips (VHT), time of day, day of the week, number of stations, and trip distribution of the stations. Forecasting and rebalancing relocation models were compared for each simulation scenario, as shown in Figure 1.
First, simulation scenarios containing artificial data (reservation, station, and vehicle data) were generated by the trip generator, based on customer travel demand, the relocation model, number of vehicles, and reservations. Different combinations of parameters generated different simulation scenarios.
Second, the simulator evaluated every scenario, i.e., the combination of travel demands with the number of cars, number of reservations, and the relocation model. For each scenario, the generated artificial data was updated once the simulation process was completed. The simulation checks customer reservations, so some reservation, station, and vehicle data changed during the simulation process.
Finally, the simulation results were presented and analyzed to define the performance of the relocation model in one-way car sharing. Output parameters included the utilization ratio, acceptance ratio, and relocation cost. The simulation implemented DES, generating a list of events from the reservation based one-way system, such as calling, assign, starting, and ending times. A reservation via phone/internet (calling time) is required. Once the reservation is accepted, the system assigns a parked car to a particular reservation. Customers visit the departure station at the starting time to pick up the booked car and return it to the destination station at the ending time.
In this study, last-minute reservation based one-way carsharing system with 10 stations will be evaluated by the simulation model. The reservation system allows customers to request a reservation with a maximum of three hours before the starting time. To guarantee the vehicle availability to the customer, we used a strict policy for reservation, i.e., the car is reserved until it is picked-up by the customer. Previous research (Boyaci et al. [18]) used dynamic relocation (relocate during the day) and safety gap (i.e., 30 min of additional time, starting at the end time reservation to guarantee the space at the destination station; and avoid the car being reserved and relocated until the end of the safety gap duration) [18]. In our study, static relocation is used as we only focus on the performance of the forecasting relocation model at the end of the day. Different operational policies were applied in our study, such as when the customer made the reservation, a space at the destination station was reserved by the system starting from the reservation time until the end of the simulation time. It will prevent other customers from parking their car until the status of the particular space is changed to free again (i.e., the car is out from the station). In addition, we assumed that every customer returned the car at the returning time precisely, thus the next reservation is ready to be made.
The simulation allowed round-trip and one-way service: the round-trip destination station was the same as the departure station, whereas the one-way destination station differed from the departure station.
3.2. Data Collection
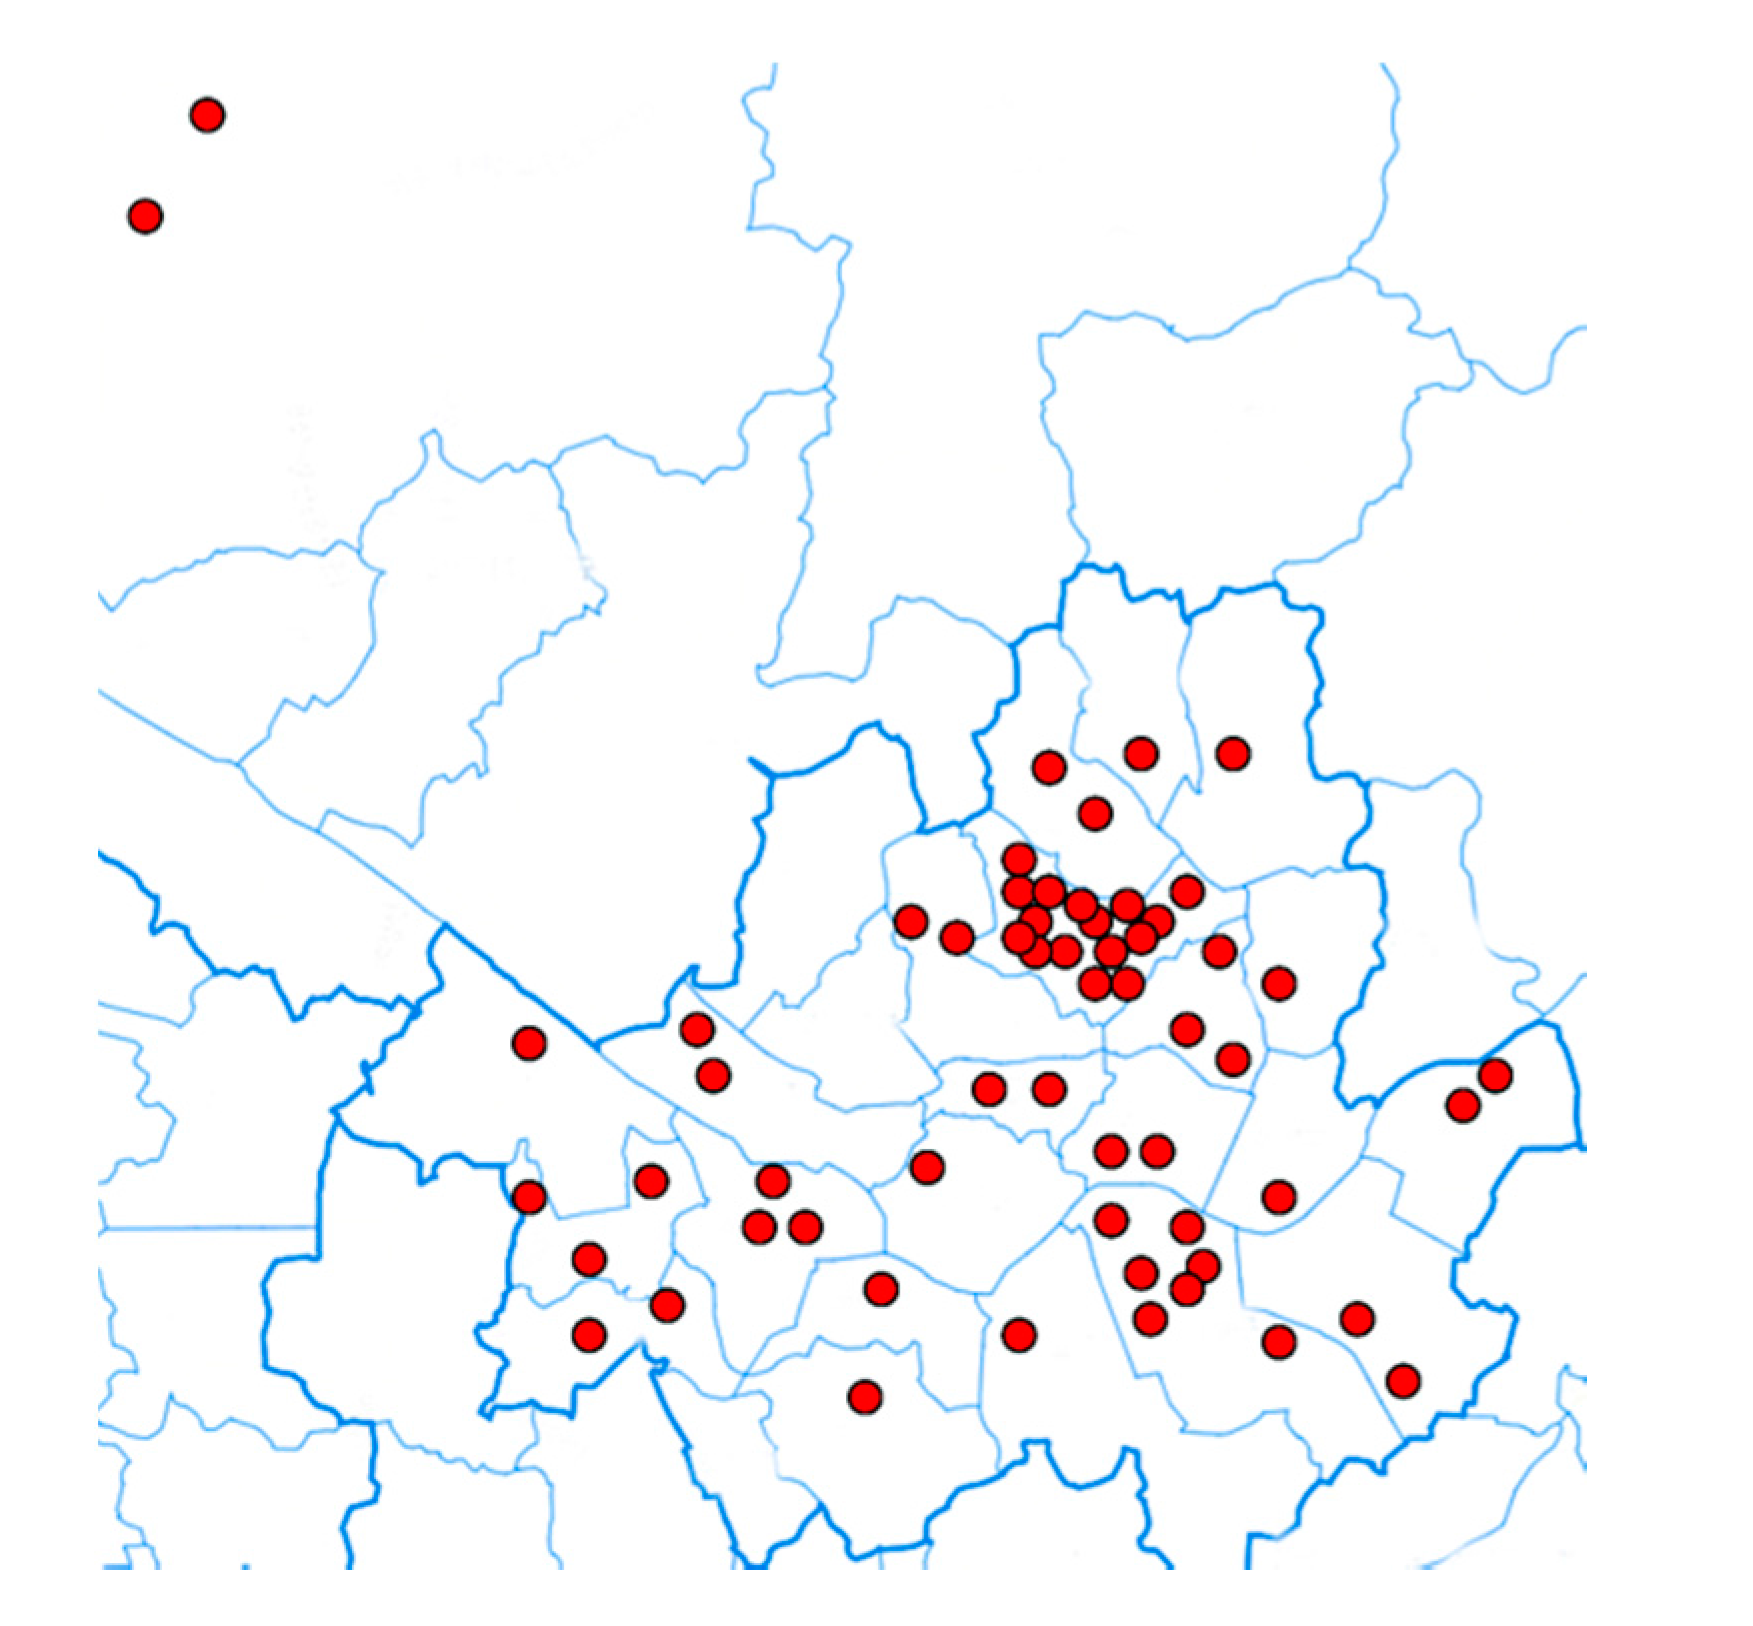
This paper used a real carsharing service dataset from Korea, provided by HanCar (carsharing company in Korea), which operates in Seoul Metropolitan City. The customer reservation data was gathered for three months from May to July 2015. HanCar operates a reservation based round-trip service with 59 stations and 103 vehicles spread around the Seoul area. Figure 2 shows the carsharing station locations as red markers.
The simulation input follows the time of day travel pattern, where customer reservation proportions for morning, afternoon, and evening were 22.15%, 44.15%, and 33.70%, respectively, as shown in Figure 3a. The HanCar dataset showed that the average customer VHT was 120 min, with 30 min as the minimum and the maximum as one day (Figure 3b). However, in order to simplify our simulation input (but still follow the HanCar distribution), the trip duration is assigned for 2, 4, and 6 h and its distributions are 20%, 50%, and 30%, respectively. The percentage of trips was lowest at the beginning of the week, increasing as the week progressed, as shown in Figure 3c.
The original 59 stations are grouped into 10 stations based on the district area (administrative unit). In Figure 2, the original stations and district boundaries are presented in red and blue colors respectively. In our dataset, the original stations mostly have three cars and their customer demands are almost similar. By grouping the original stations based on the district, it will create high unbalance demand since some of districts have more stations compared to others. It is expected that cars become unbalanced, with most cars ending up in unpopular departure groups, and most customers (from the high demand group) are unable to make a reservation. In this situation, the forecasting relocation can be evaluated in terms of its capability to solve the high unbalance demand problem. To simplify the simulation process, only the top 10 highest groups are used as inputs of the simulation. Based on the departure distribution of each group, customers mostly departed from Seongbuk-gu and Gyeongido-paju (38% and 22%, respectively), and the detailed departure distribution is shown in Figure 3d. However, the clustering based on the district is not the only solution, as other studies (Boyaci et al. [18]) used different techniques to group the stations. The k-medoid based algorithm was used to cluster the stations.
The HanCar company only offered round-trip service (i.e., the same destination and departure station), whereas the simulation also considered one-way service. Boyaci et al. have proposed the scenario to convert the round-trip data into one-way data [28]. Given the GPS data, the conversion is done by splitting the single round-trip data into multiple one-way data when the idle time of the rented vehicle at a given location exceeded one hour. However, due to the limitation of the dataset (i.e., GPS data), other types of conversion were applied. To generate the artificial reservation data for different departure and destination stations, the trip generator considered that the departure station followed the HanCar distribution and the destination station was assigned randomly.
3.3. Evaluation Criteria
Three evaluation criteria were defined in the simulation to evaluate the relocation model performances: car utilization ratio, reservation acceptance ratio, and relocation cost.
The car utilization ratio is the percentage of total actual driving hours of rented cars over total possible driving hours of cars,
Alfian et al. has revealed that the utilization ratio is proportional to the average profit per day [27]. Thus, it is important that the carsharing company needs to ensure that all cars can be rented (fully operated) to increase profit.
The acceptance ratio is the number of reservations that have been accepted compared to the total number of requested reservations,
An accepted reservation means that when a customer makes a reservation, the carsharing reservation system checks whether there is an available car at the departure station and free parking space at the destination station. In this study, we assumed that there were no cancelations for an earlier reservation, and that the customer drives the car from the departure station at the starting time and parks the car at the expected destination at the ending time of the reservation. Thus, the acceptance ratio probes customer satisfaction.
Relocation cost provides information about the number of cars being relocated by the operator at the end of the day,
Carsharing companies normally want to reduce the relocation cost, and, hence, increase the total profit. The relocation will be triggered at the end of the day (midnight). The stations are located in the downtown area which are close to each other and the maximum relocation time from one station to another is no more than 1 h. Thus in this study, a 1 h relocation time was assumed at midnight, when cars would generally not be operated due to sparse reservations. The status of a relocated car should be a parked car, i.e., there was no existing reservation for the car.
3.4. Forecasting Relocation Model
This paper used forecasting relocation to solve the imbalanced distribution of cars at each station. Thus, the performance of the forecasting model, multilayer perceptron (MLP), must be evaluated first. The MLP consisted of input, hidden, and output layers. Inputs were fed forward from the input layer through the hidden layer(s), ultimately providing the output. For an untrained network, the output differs from the known targets. The training process consisted of estimating weights to minimize deviations between the network outputs and actual data. The deviations were then propagated backwards through the network and weights were adjusted to reduce error. Detailed explanations of MLP are described elsewhere, e.g., [29].
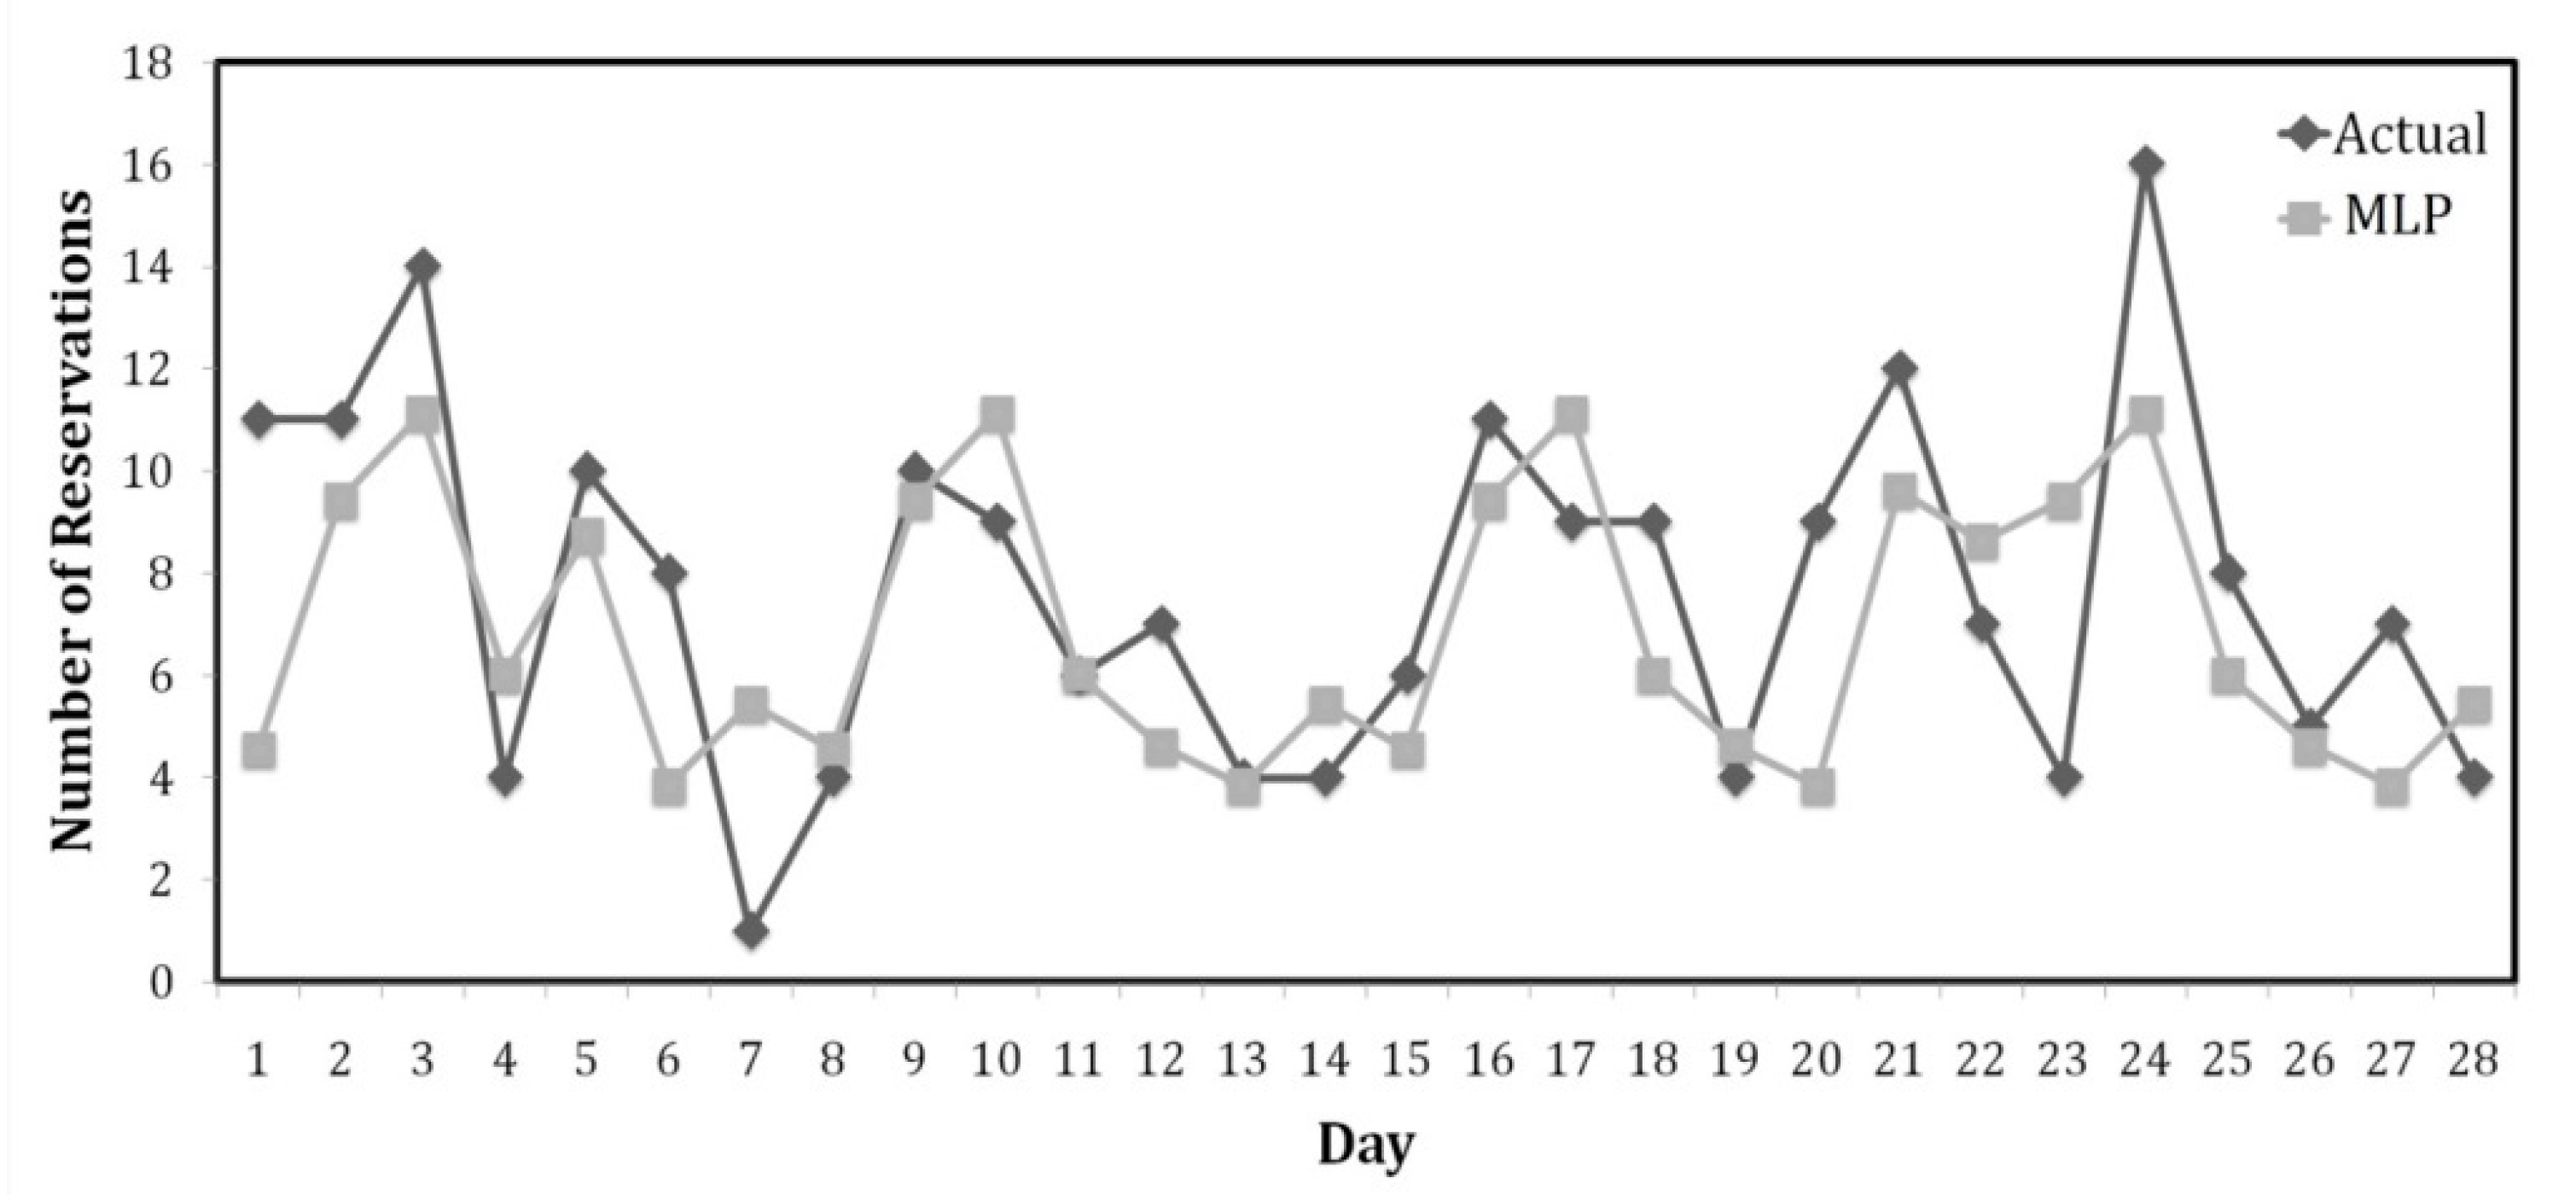
MLP was used to predict the daily number of trips for each station, which allows prediction of the number of cars needed at each station. In our study, the daily demand is considered as an input to be used by MLP for prediction. The demand based on the time (i.e., different demand between morning, afternoon, and night) is not considered in this study as we only focus on the static relocation (relocation is done at the end of the day). Thus, predicting the total number of cars needed by each station for the next day and relocating the cars at midnight are the main tasks in order to maximize the customer demand. The MLP was trained for a particular month using data from the previous 3 months, where the oldest 2 months comprised the training set and the most recent month comprised the validation set (28 days). For a particular station, the output layer was the daily total trips made by customers to particular stations and the input layer included the day type and number of trips in the previous week. Day types are defined by eight binary digits: Monday, Tuesday, Wednesday, Thursday, Friday, Saturday, or Sunday, and holiday, where 0 was “no” and 1 was “yes”. The number of trips in the previous week was the total reservations by customers in the previous week for that particular station. The training and testing process was implemented in the Weka 3.6 data mining tool (University of Waikato, Hamilton, New Zealand). Figure 4 shows the trip predictions for 28 days in the Seongbuk-gu area.
MLP captured the daily number of reservation patterns for 28 days in Seongbuk-gu area quite well. The mean absolute error and root mean squared error of the forecasting model were 2.9003 and 3.5166 trips, respectively. Daily reservation forecasting was also applied to the other stations (details not shown), and overall the MLP model predicted the daily reservations made by the customer in each station accurately, i.e., with low errors.
The relocation model proposed in this study was based on periodical relocation, i.e., relocation was triggered at the end of the day (midnight), with the total number of cars required at each station for the next day predicted by the forecasting model. That is, this relocation was not triggered by customer demand (as per dynamic relocation). Consequently, the total number of relocations is expected to be lower than dynamic relocation, i.e., lower relocation cost.
Predicting the total number of cars based on customer reservation demands is also expected to increase the system utilization. To implement vehicle relocations, the operator sets the vehicle inventory threshold at each station. The vehicle inventory threshold is defined as present cars (number of present or parked cars)—predicted cars (number of predicted cars for the next day). The predicted cars are calculated based on the predicted customer demand (trips) using the MLP model, thus the high demand stations will have a high number of predicted cars. The system relocates the number of cars from an overstocked station (exceeding the inventory threshold) to the nearest understocked station (below the threshold) in terms of the lowest travel cost at the time of relocation.
3.5. Simulation Input and Experimental Scenario
The trip generator generates three matrices from the data distributions: reservation data, vehicle data, and station data. Customer reservation data is presented as , where m is the total number of reservations, and n is the total hours of simulation, e.g.,
where = {calling, 0, 6, 9, 4, 7, 0} represents {RESERVATION_EVENT, DECISION, DEPARTURE_STATION_ID, DESTINATION_STATION_ID, STARTING_TIME, ENDING_TIME, VEHICLE_ID}, respectively. Thus, the above case means that the customer made a reservation (calling) to the system to request a car from station id 6 at the 4th hour to station id 9 at the 7th hour. In our study, the full hour reservation made by customers is assumed. The default DECISION is always initialized to 0.
Station data is presented as , where q is the number of stations, and n is the number of hours for the simulation, e.g.,
where = represents {STATION_ID, TOTAL_LOTS, VIN, VOUT, VPRESENT, AV_SPACE}, respectively. Thus, this entry means that initially station ID 1 has 25 lots, there is no car expected to come in (VIN) or go out (VOUT) from this particular station, the total of parked cars (VPRESENT) is 10, and the available space (AV_SPACE) is 15.
Finally, the vehicle data is presented as , where p is the number of vehicles, and n is the number of hours for the simulation, e.g.,
where = represents {VEHICLE_ID, VEHICLE_STATUS, CURRENT_STATION}, respectively. Thus, this entry means that at the initial time vehicle id 1 was parked at station ID 1.
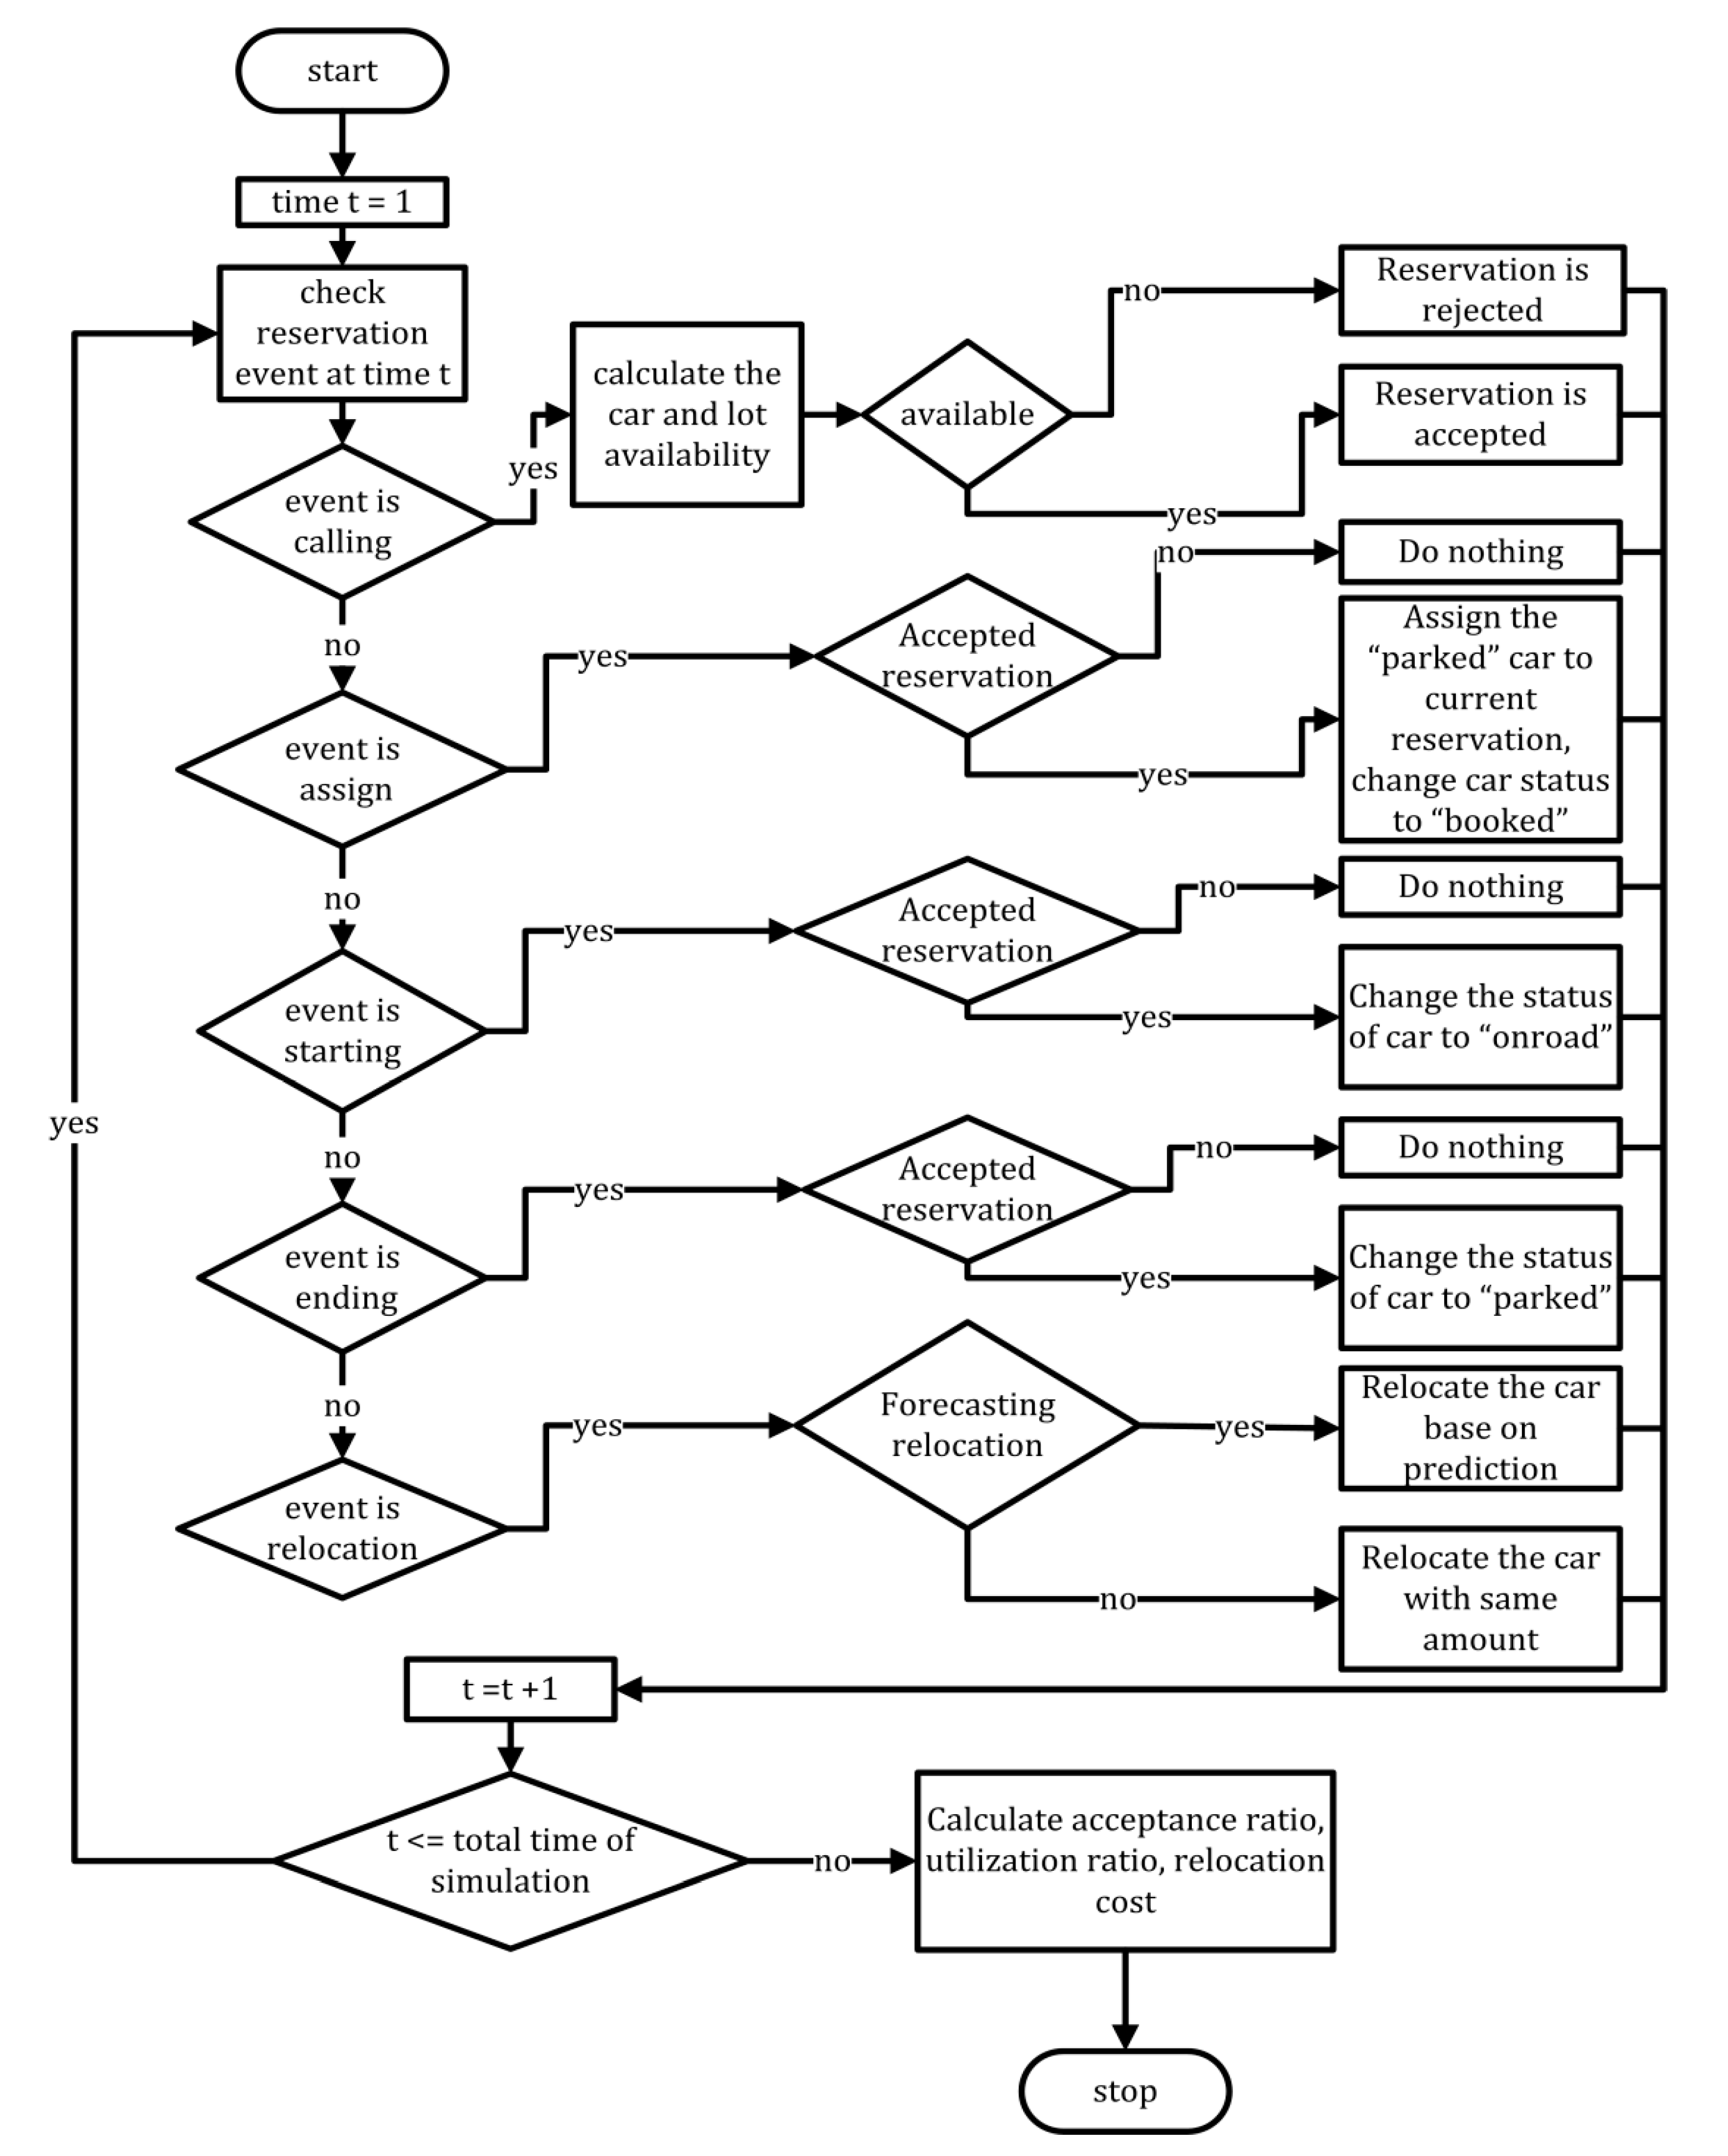
The simulation program reads the reservation data from the earliest to the last hour of the simulation. The program checks the RESERVATION_EVENT (calling, assign, starting, ending, or relocation) and does the task based on the identified event. Figure 5 shows the simulation flowchart.
The program checks , the event status of reservation i at time t. There are five possible cases for reservation status (RESERVATION_EVENT), as follows.
(i)
The system calculates the vehicle availability from the departure station and lot availability in the destination station. The vehicle availability at calling time t in departure station j is
where is the real number of parked vehicles in departure station j at time t, is the total number of vehicles scheduled to return to departure station j at time t, and is the number of vehicles that are not available for use because they have been reserved (scheduled to be out) from departure station j at time t. If (vehicle is available at the departure station) and > 0 (available space at the destination station), then the reservation decision will be accepted (), otherwise it will be rejected. For an accepted reservation, starting from t until the simulation end of time, n, has 1 added and has 1 subtracted. From the reservation i ending time, u, until n simulation, has 1 added, since the car is scheduled to be away from station j at t and arrive at station k at u for this particular reservation. The system also reserves one space at the station k, that starts from t for the reservation.
(ii)
The system finds a car, d, located in the departure station for reservation i at starting time h, () with parked status (). The system randomly selects a parked car and assigns it to the particular reservation (). Once the process finishes, the car status is changed from parked to booked, starting from t () until n (). The car status is changed to booked to prevent the car from being assigned to another reservation until the status of that particular car changes to parked again.
(iii)
Starting from t until n, and at departure station j are decreased by 1, and is increased by 1. At t, the car is no longer scheduled to be OUT or parked, but is being driven by the customer. The system also adds one available space at the departure station when the car leaves at t. Thus, the car status is changed from booked to on the road from t until n ().
(iv)
Once the customer trip ends, the system increments the parked cars at destination station k by 1, from t until n. The system also decreases VIN by 1 at the destination station from t until n. The car is not scheduled to arrive at the destination station at some future time, because it has already arrived at the destination station. The car status is also changed from on road to parked () and its current location is updated to the destination station () t until n.
(v)
The system implements the relocation model, relocating a number of cars, u, from an overstocked station j to an under stocked station k based on their relocation type ().
The matrices were implemented as multidimensional arrays in the C++ programming language, ensuring that simulation performance was maximized. At time n, the simulation shows an average car utilization ratio, reservation acceptance ratio, and relocation cost for a given scenario. Different scenarios were implemented for the total number of cars, number of reservations, and relocation type. The simulation results were then collected for analysis and performance evaluation.
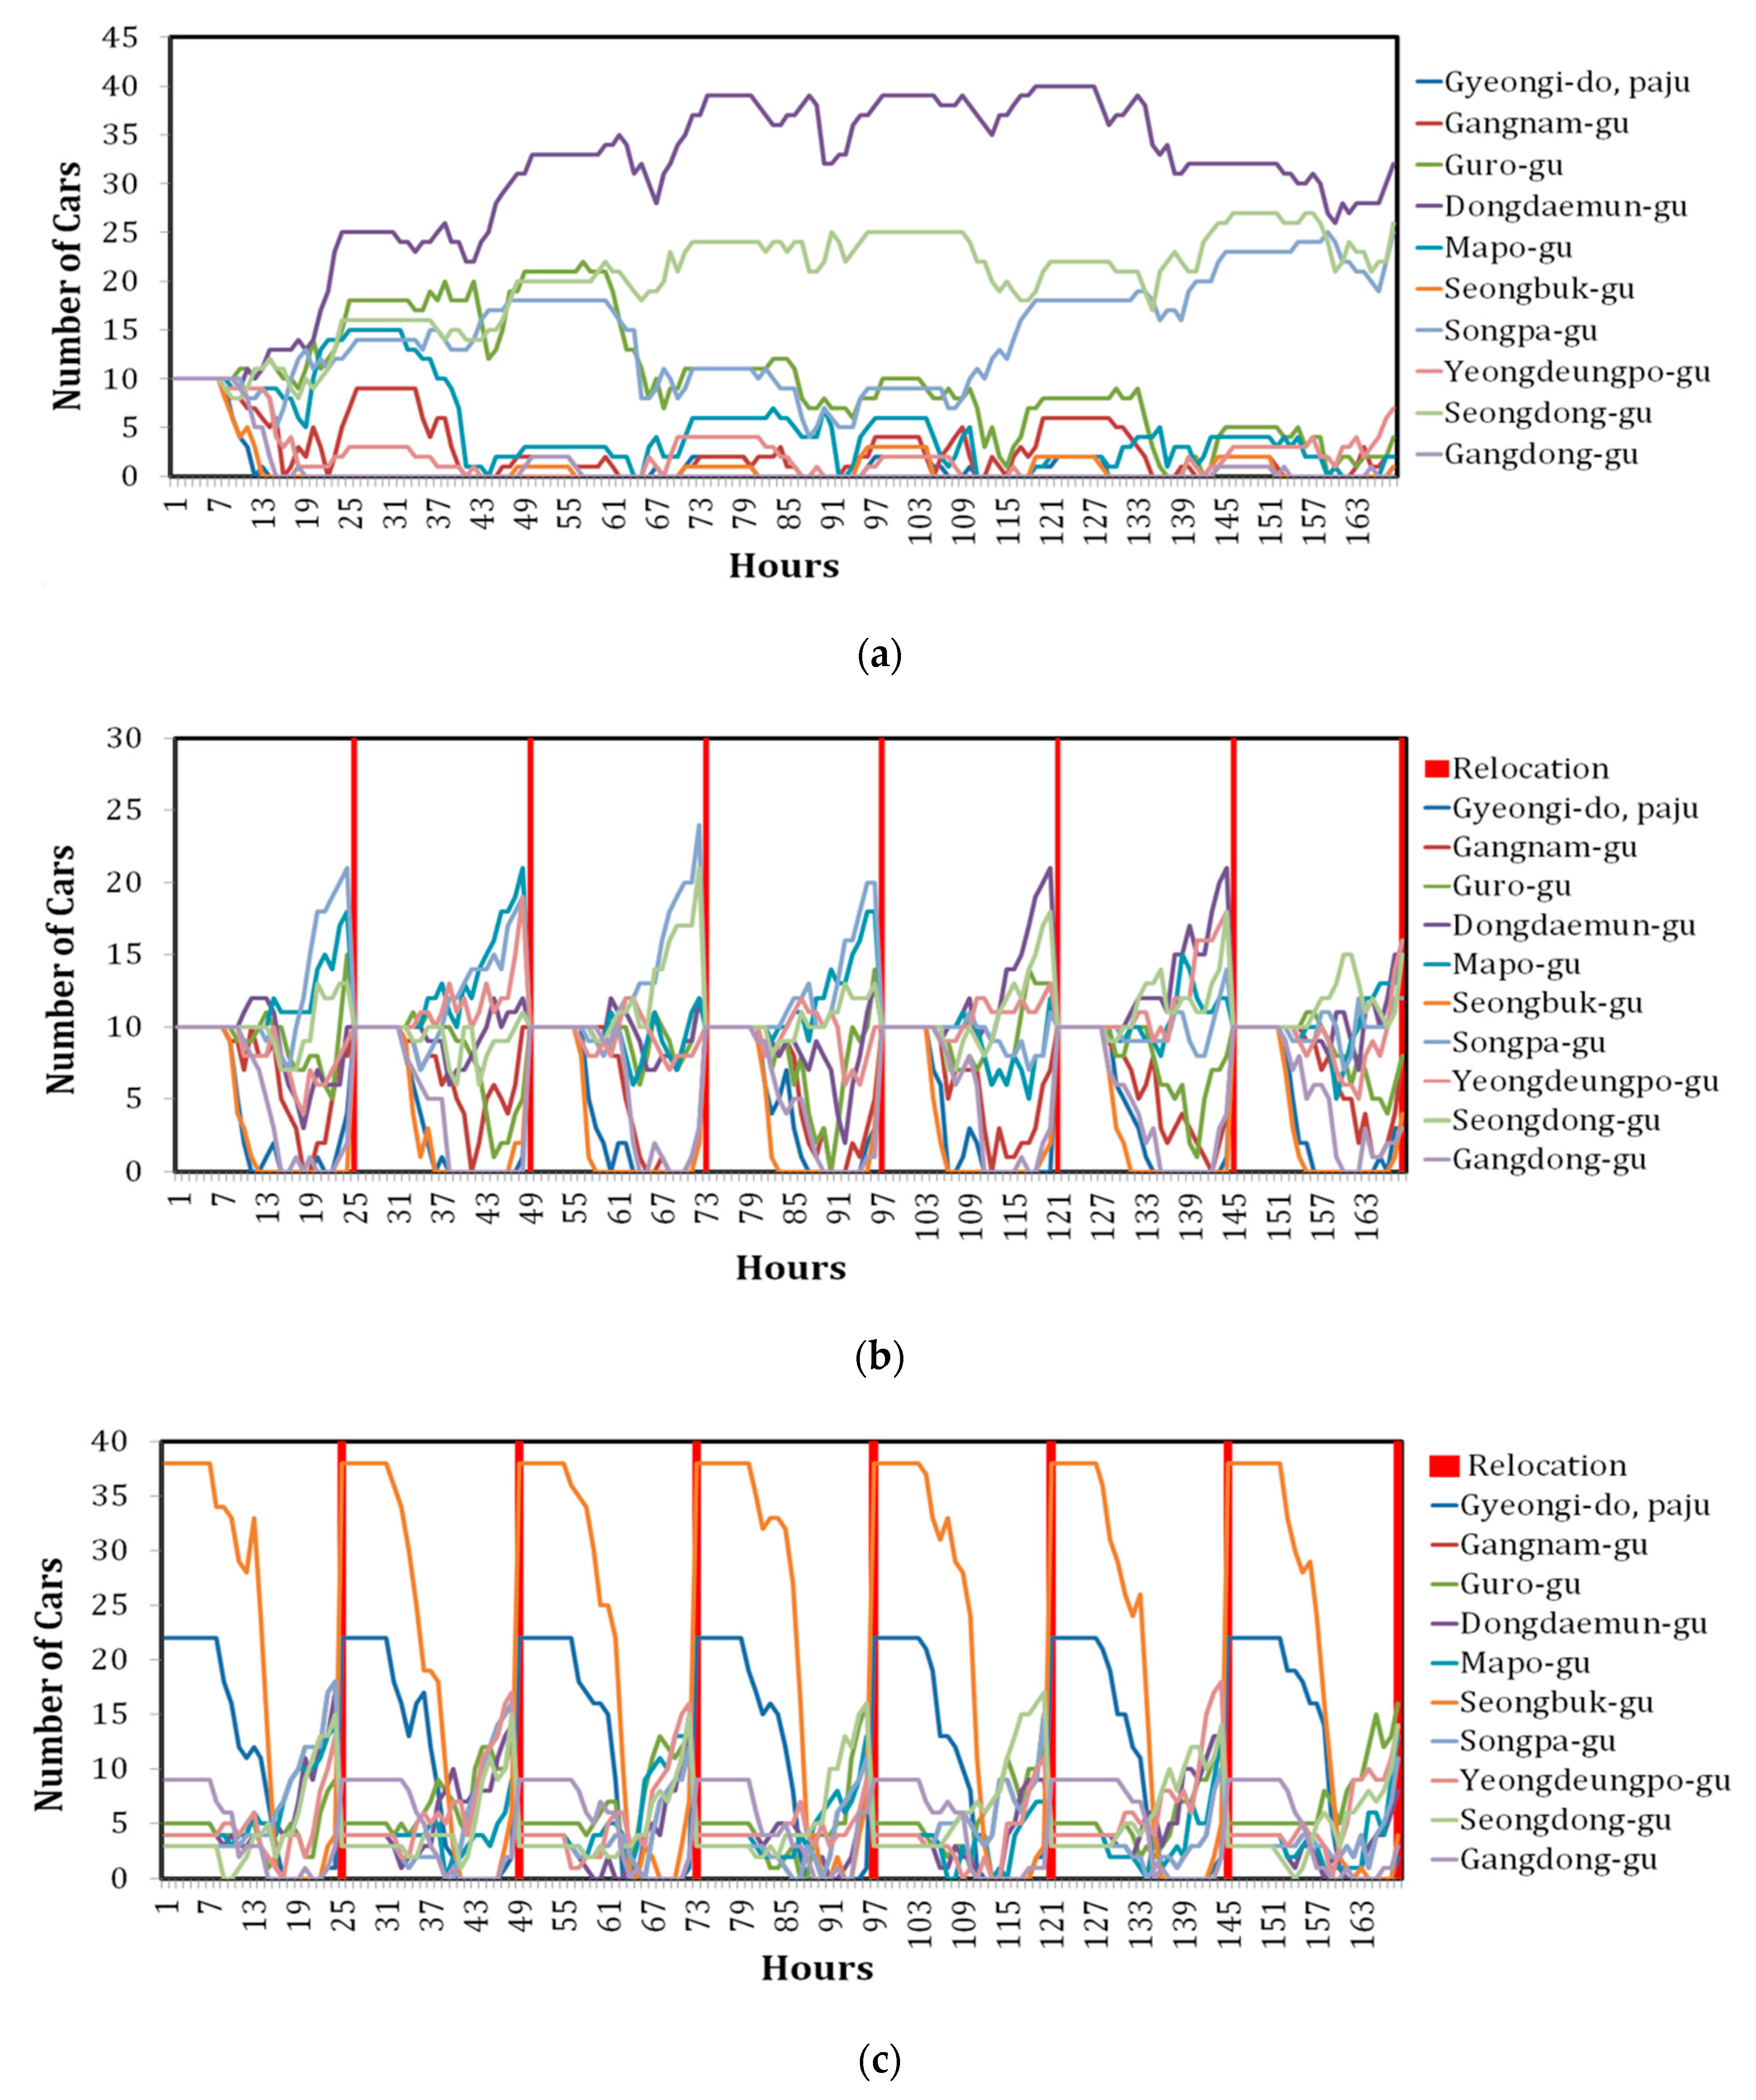
The program also provides the status of parked cars for all stations during the simulation on an hourly basis for the week, as shown in Figure 6 for the case of 2800 total reservations in a week, 100 cars, and 10 stations.
Figure 6a shows an example of a non-relocation simulation where the initial number of parked cars was set as 10 cars in each station. The number of parked cars at each station is changed once the simulation is complete, and the unbalanced distribution is clear.
Figure 6b shows a rebalancing relocation with the same inputs. The number of parked cars at the various stations changes once the simulation is run. However, at midnight the rebalancing relocation is triggered, and the number of cars at each station resets to 10 cars again. Thus, to implement this model the operator needs to relocate approximately 30 cars per day.
Figure 6c shows forecasting relocation with the same inputs. However, the initial cars in each station was not set to be equal, but was based on prediction from the customer demand history. Thus, the number of cars initially at each station are different. Forecasting relocation is triggered at midnight, and the total number of cars in each station for the next day will be different based on customer demand at a particular station, calculated using the proposed MLP method. The relocation cost for this model was approximately 60 relocated cars per day.
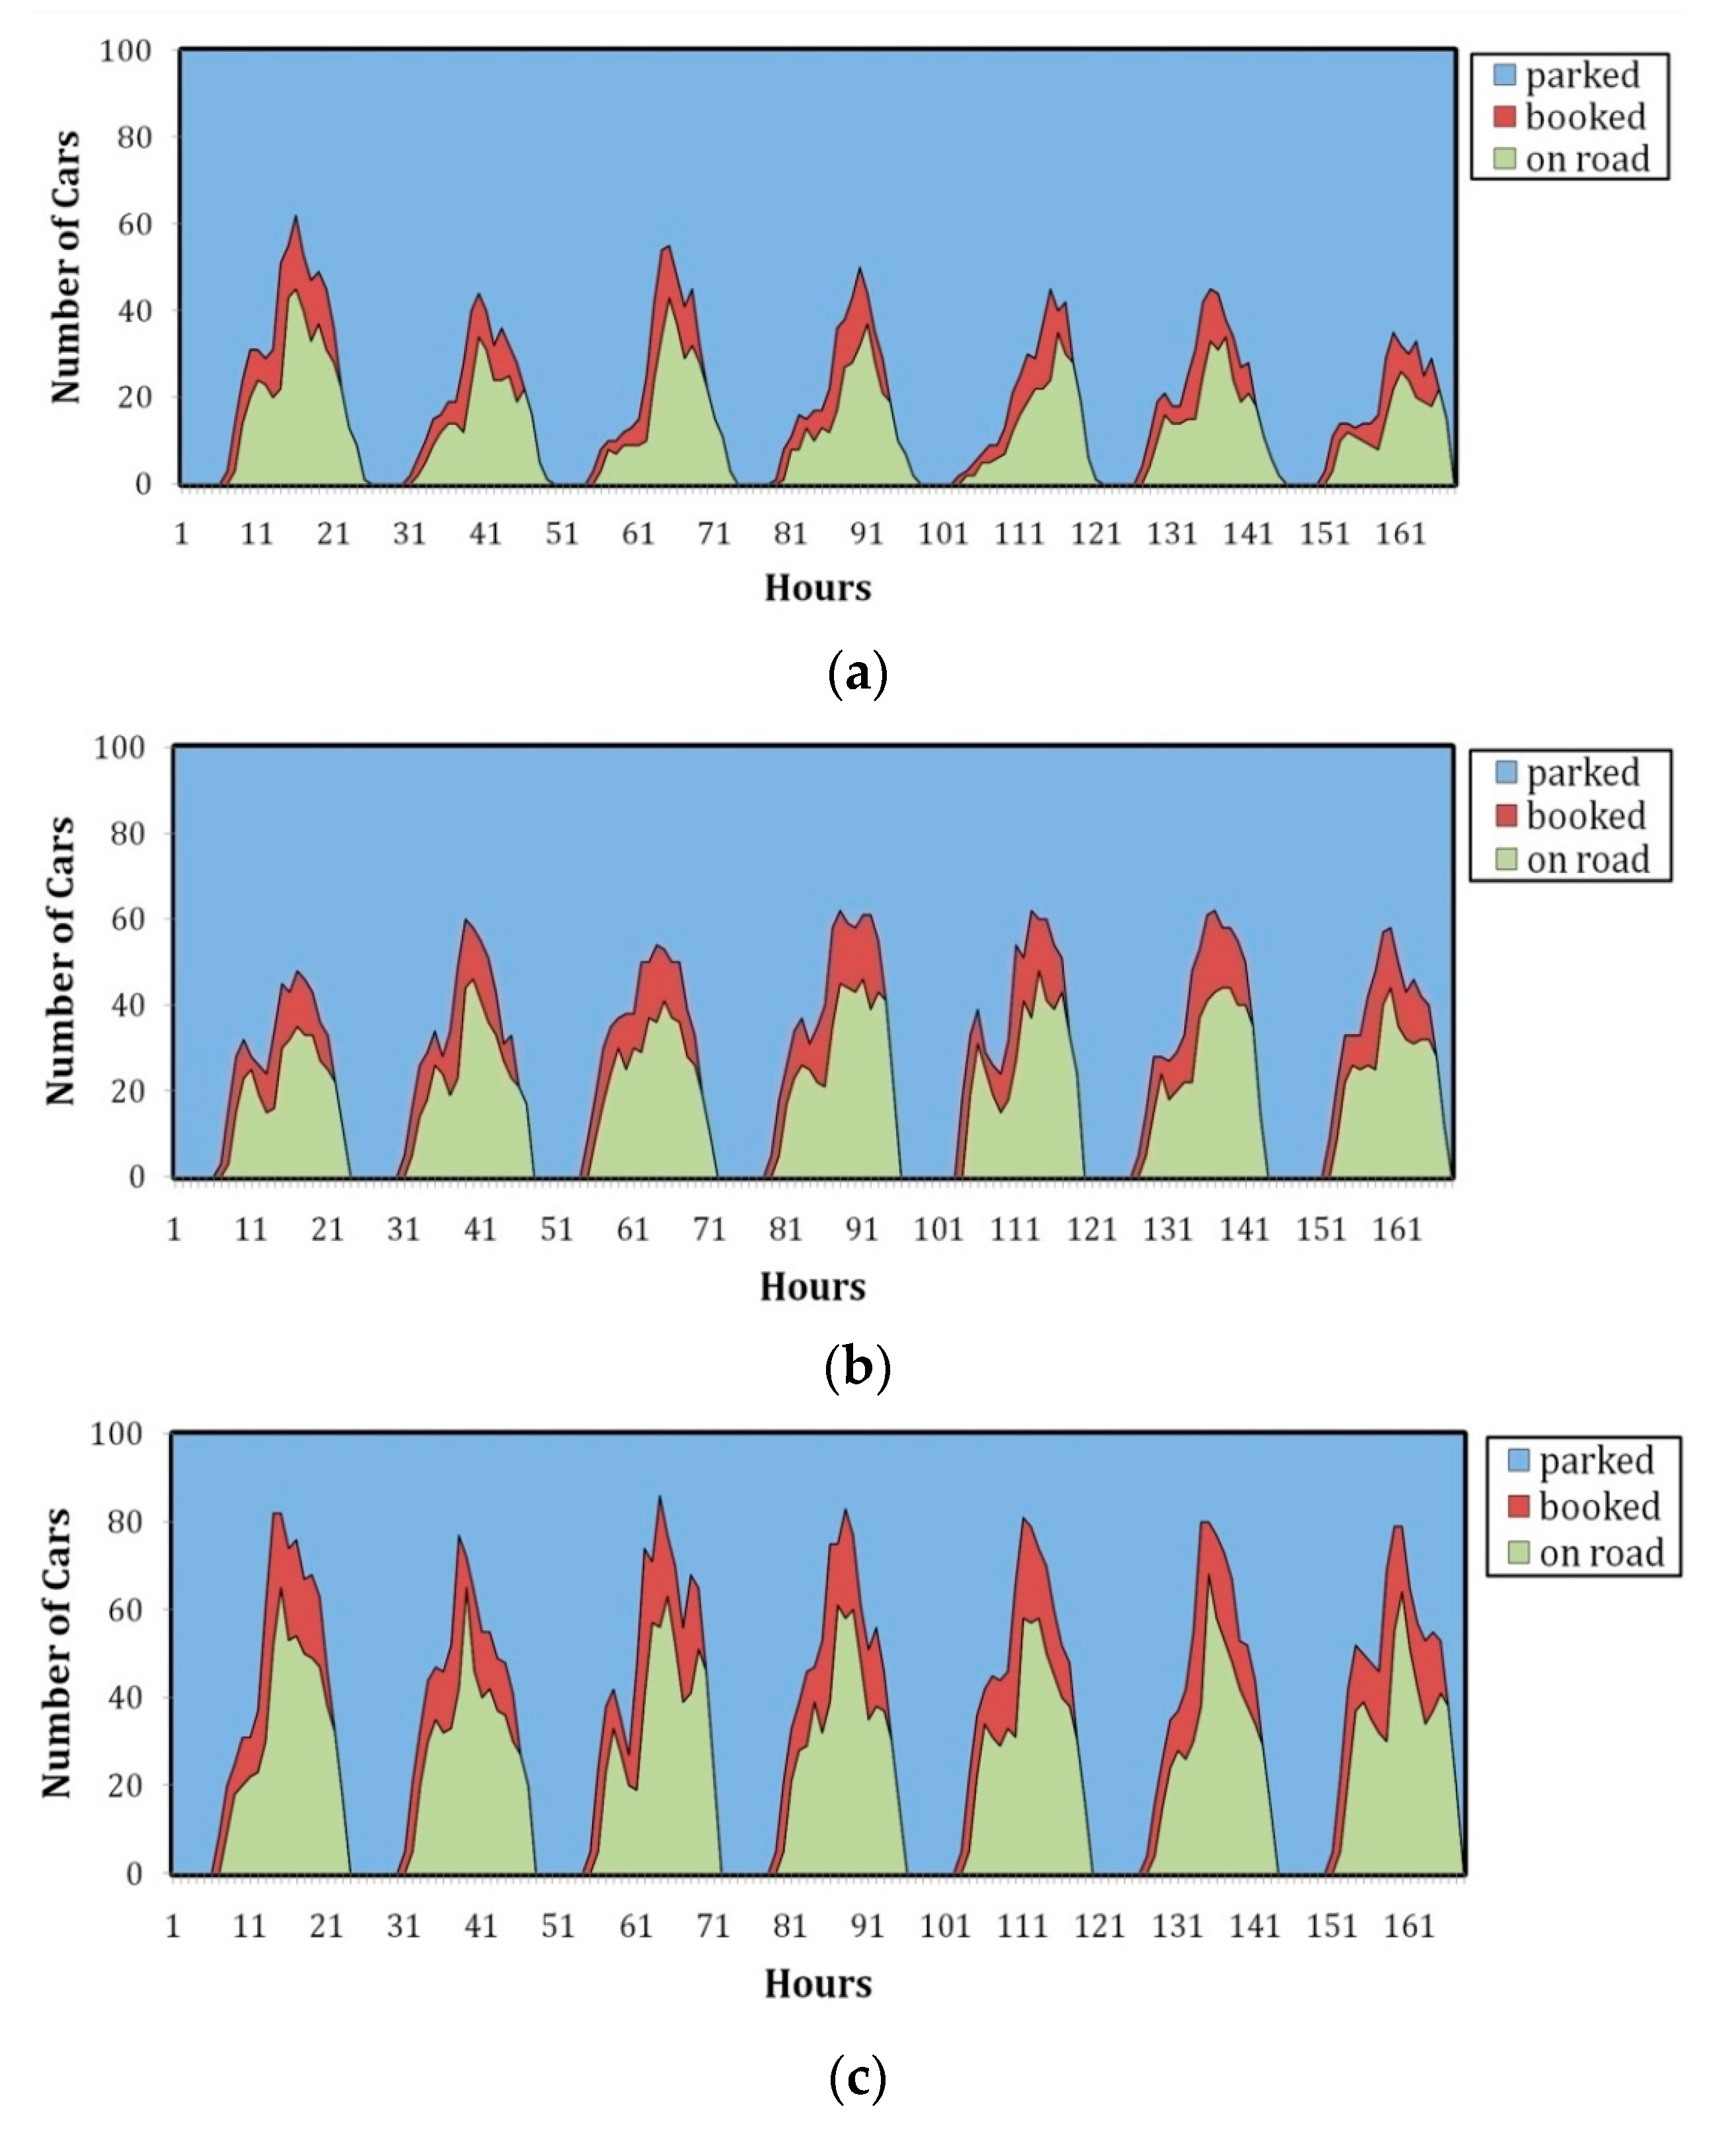
Figure 7 show the status of all 100 cars for each different simulation scenario. The total number of cars is a combination of booked, parked, and on road cars. Figure 7a shows that omitting a relocation scheme results in a high number of parked cars and a low number of on road cars. Cars in each station become unbalanced, with most cars ending up in unpopular departure stations, and most customers (from high demand stations) are unable to make a reservation for the parked cars. The average car utilization was 14.32% with an acceptance ratio of 34.25%.
Figure 7b shows that rebalancing relocation reduced the number of parked cars, and increased the utilization and acceptance ratio to 19.31% and 47.6%, respectively.
Figure 7c shows that implementing forecasting relocation generates the lowest number of parked cars compared to the previous scenarios, and achieves the highest acceptance and utilization ratios, 26.95% and 67.53%, respectively.
4. Result and Discussion
The relocation models for one-way carsharing are evaluated by the simulation model. The impact of the number of cars and reservations was also analyzed. The simulation models were applied for one week of reservation data with three evaluation criteria: relocation cost, acceptance ratio, and utilization ratio. A trip generator was developed to provide the artificial reservation data from real carsharing data. The reservation data was a combination of round-trip and one-way reservations. Since the carsharing company in Korea only operates round-trip services, the real proportion of one way reservations cannot be presented. As a solution, in this study the trip generator generated the same amount of round-trip and one-way reservations for the week, i.e., 50% round-trip, 50% one-way. In addition, regarding the distribution of one-way and round-trip reservations, Alfian et al. has revealed its impact on the system performance [25]. The study showed that as the distribution of one-way reservations increases, the utilization ratio as well as the acceptance ratio will be reduced. The high number of one-way reservations leads to imbalance in the distribution of cars at each station as most cars end up in unpopular departure stations (low demand stations) and most customers (from high demand stations) are unable to make a reservation.
4.1. Impact of the Number of Reservations and Cars on Relocation Cost
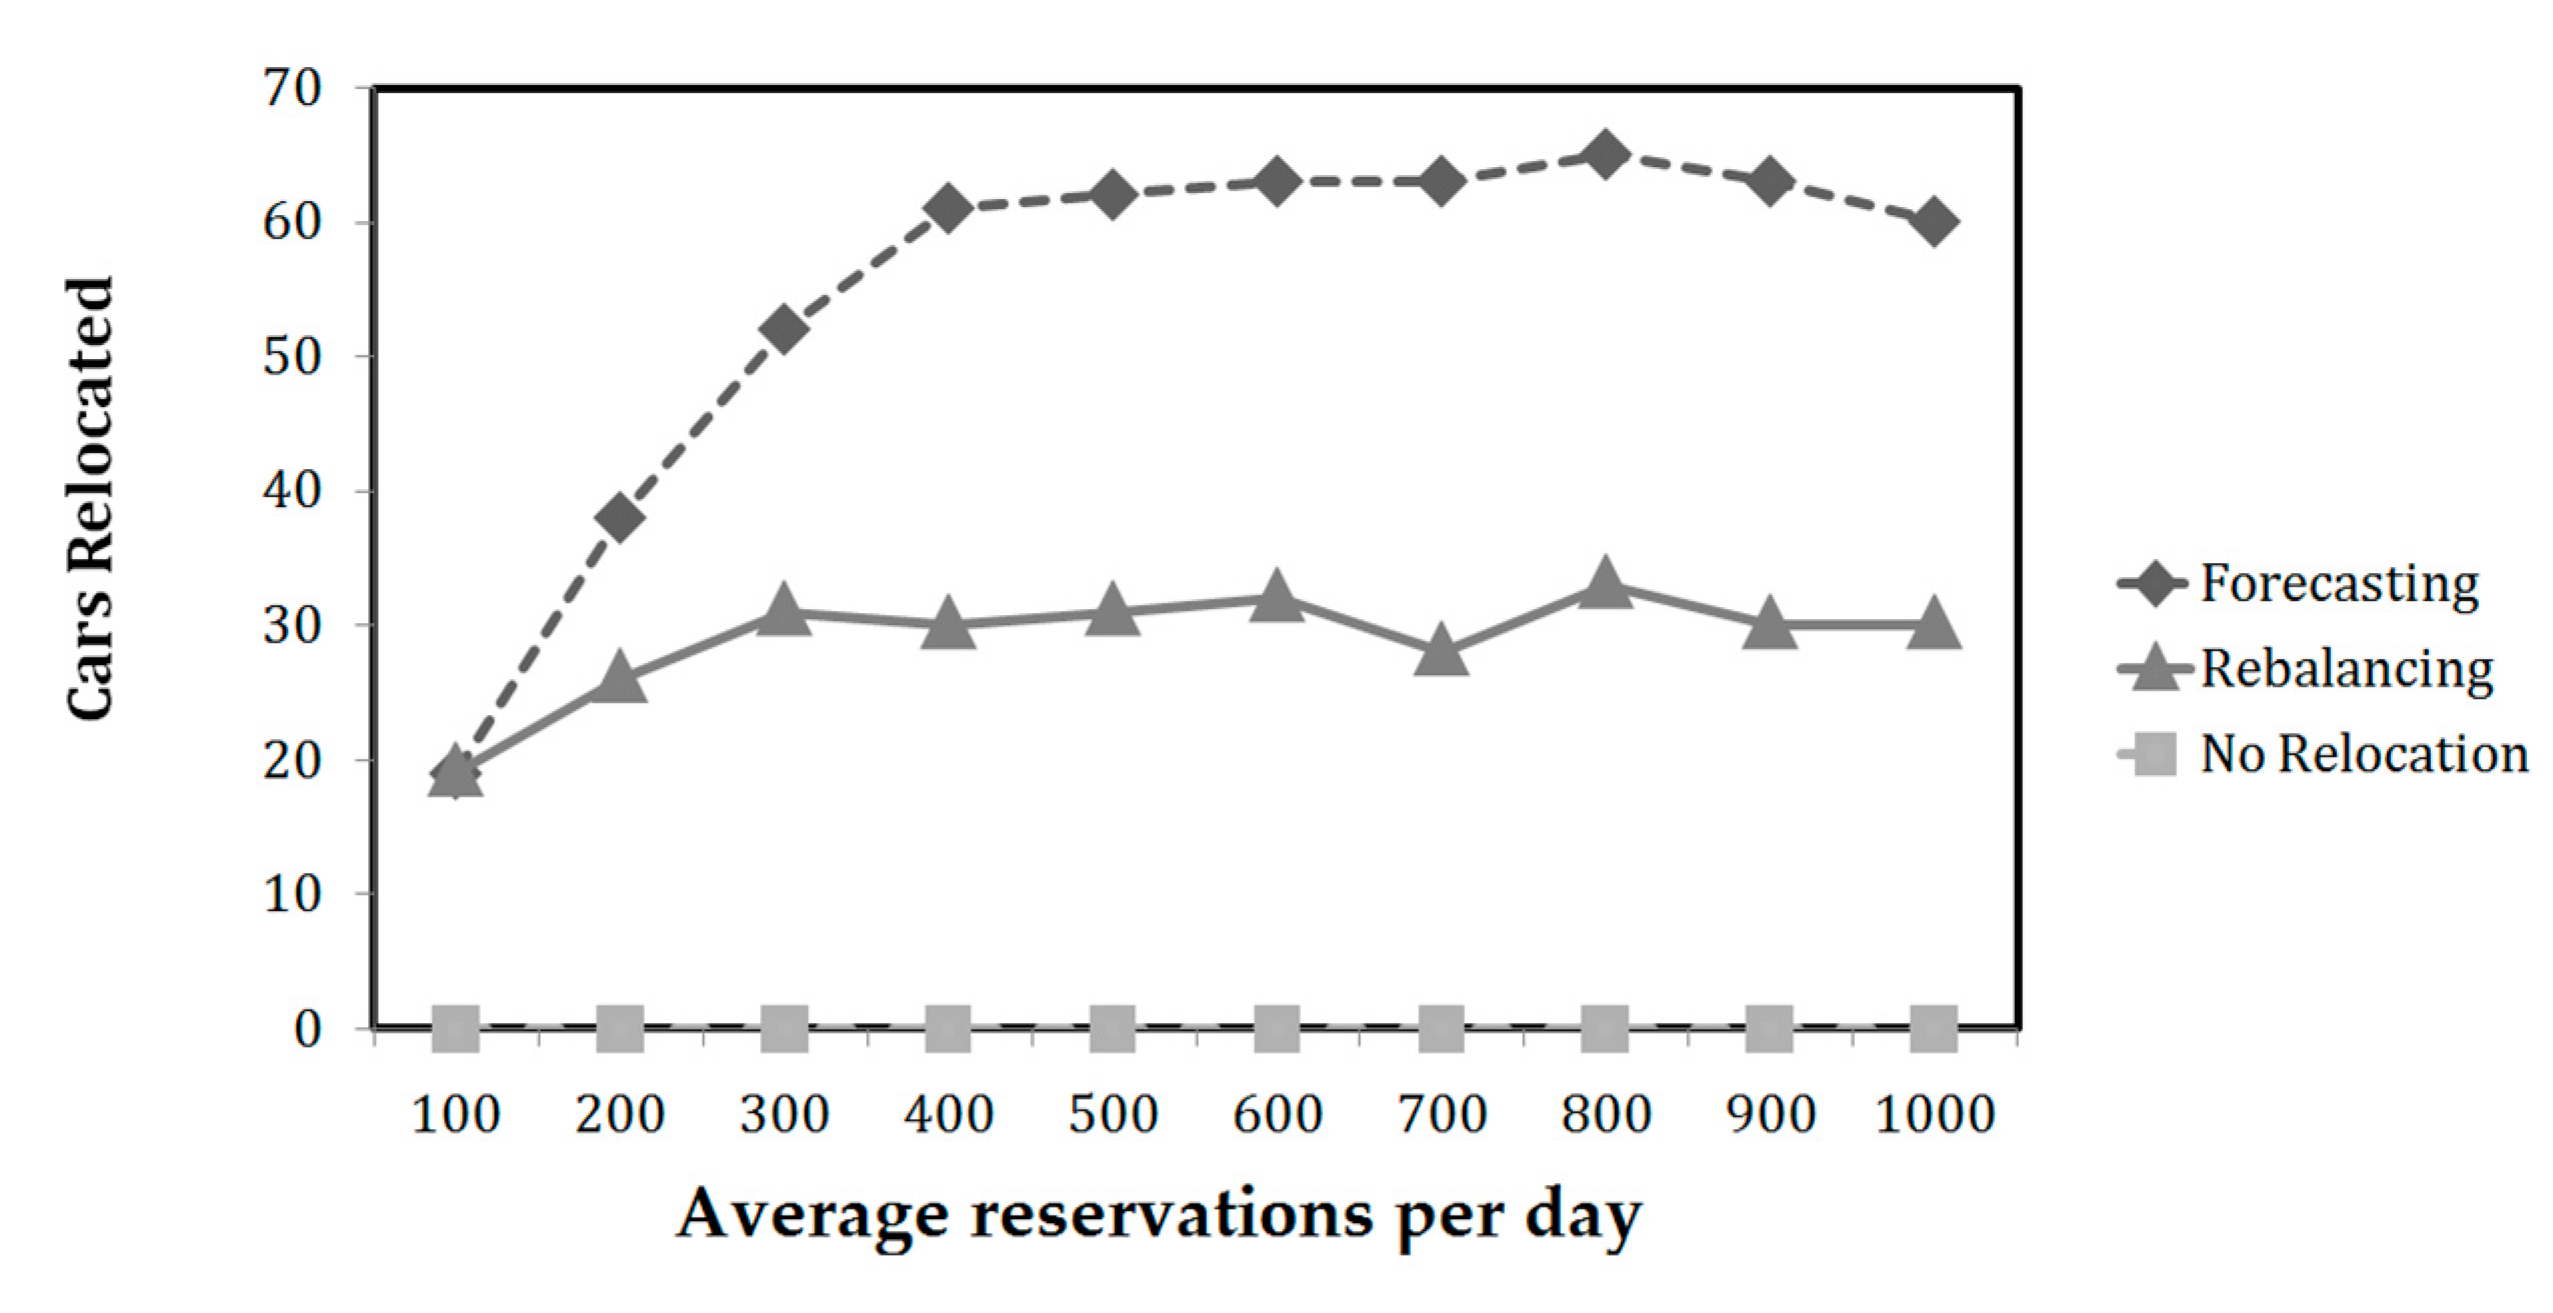
Figure 8 shows the level of relocations required for the forecasting and rebalancing relocation models. The simulation was run for 10 stations and 100 cars for a week. The input was the average number of reservations per day (x-axis) and the output was the relocation cost (number of relocated cars).
The choice of the relocation model was significant for the vehicle used (number of vehicles rented by customers). However, increasing the vehicles used for one-way carsharing leads to highly imbalanced distributions of cars at each station, and hence a high number of relocations. High relocation leads to negative impacts, due to the additional relocation cost. Operators must pay staff to move or drive cars from oversupplied to undersupplied car stations. This paper considered a daily relocation period (midnight) for both forecasting and rebalancing models to reduce the relocation cost. A 1 h relocation time was assumed at midnight, when cars would generally not be operated due to sparse reservations. The status of a relocated car should be a parked car, i.e., there was no existing reservation for the car.
Forecasting and rebalancing relocation schemes were compared with non-relocation for one-way service. If the operator does not apply any relocation scheme, they need not consider relocation cost at the end of the day, i.e., the relocation cost was always 0. Figure 8 shows that the forecasting relocation model has a high relocation cost compared to rebalancing. Forecasting relocation sets the number of cars at each station differently based on the previous reservation history. If management operates forecasting relocation for a high number of reservations, most cars end up in unpopular departure stations (low demand stations). Thus, the operator needs to relocate a high number of cars from low to high demand stations at the end of the day (midnight). On the other hand, rebalancing relocation only resets the number of cars at each station to the same number of cars at the end of the day (midnight). Thus, the relocation cost is lower. With an increasing number of reservations, the relocation cost for forecasting relocation will increase and then become constant after ~400 reservations per day, whereas the cost of rebalancing relocation becomes constant after ~300 reservations per day. The scenario included 100 car operations. Therefore, when the number of reservations exceeds 400 per day, some reservations will be rejected (there is not enough free cars), and there will be no increase in vehicles used, i.e., no increase in relocated cars.
Figure 9 shows relocation costs for different numbers of cars. The simulation assumed an average of 1000 daily reservations and 10 stations, and was run for a week. The input was the total number of operation cars (x-axis), and the output was the relocation cost (y-axis).
The relocation cost for rebalancing was similar to forecasting relocation. As the number of cars increased, vehicles used (cars rented by customers) also increased, thus the relocation costs for rebalancing and forecasting relocation also increased. High vehicle usage in one-way carsharing generates highly imbalanced car distributions at each station. For the case of one-way carsharing with forecasting relocation, when the number of cars exceeds 500, relocated cars remain constant, as all of the reservations will always be accepted, and thus there are no more relocation activities.
Thus, if an operator allows one-way services, they must consider a relocation model to address imbalanced distribution of cars in each station. As the number of reservations and number of cars increase, relocation costs will also increase (Figure 8 and Figure 9). Rebalancing relocation provides benefits by reducing relocation cost, and hence, increases profit. However, the operator should consider other evaluation criteria, such as the utilization ratio and acceptance ratio, in addition to the relocation cost.
4.2. Impact of the Number of Reservations and Cars on the Utilization Ratio
Both relocation models had significant impacts on the vehicles used. Relocation means that high demand stations get additional cars, increasing the vehicles used. Increasing vehicles used means an increased utilization ratio, and increased profit.
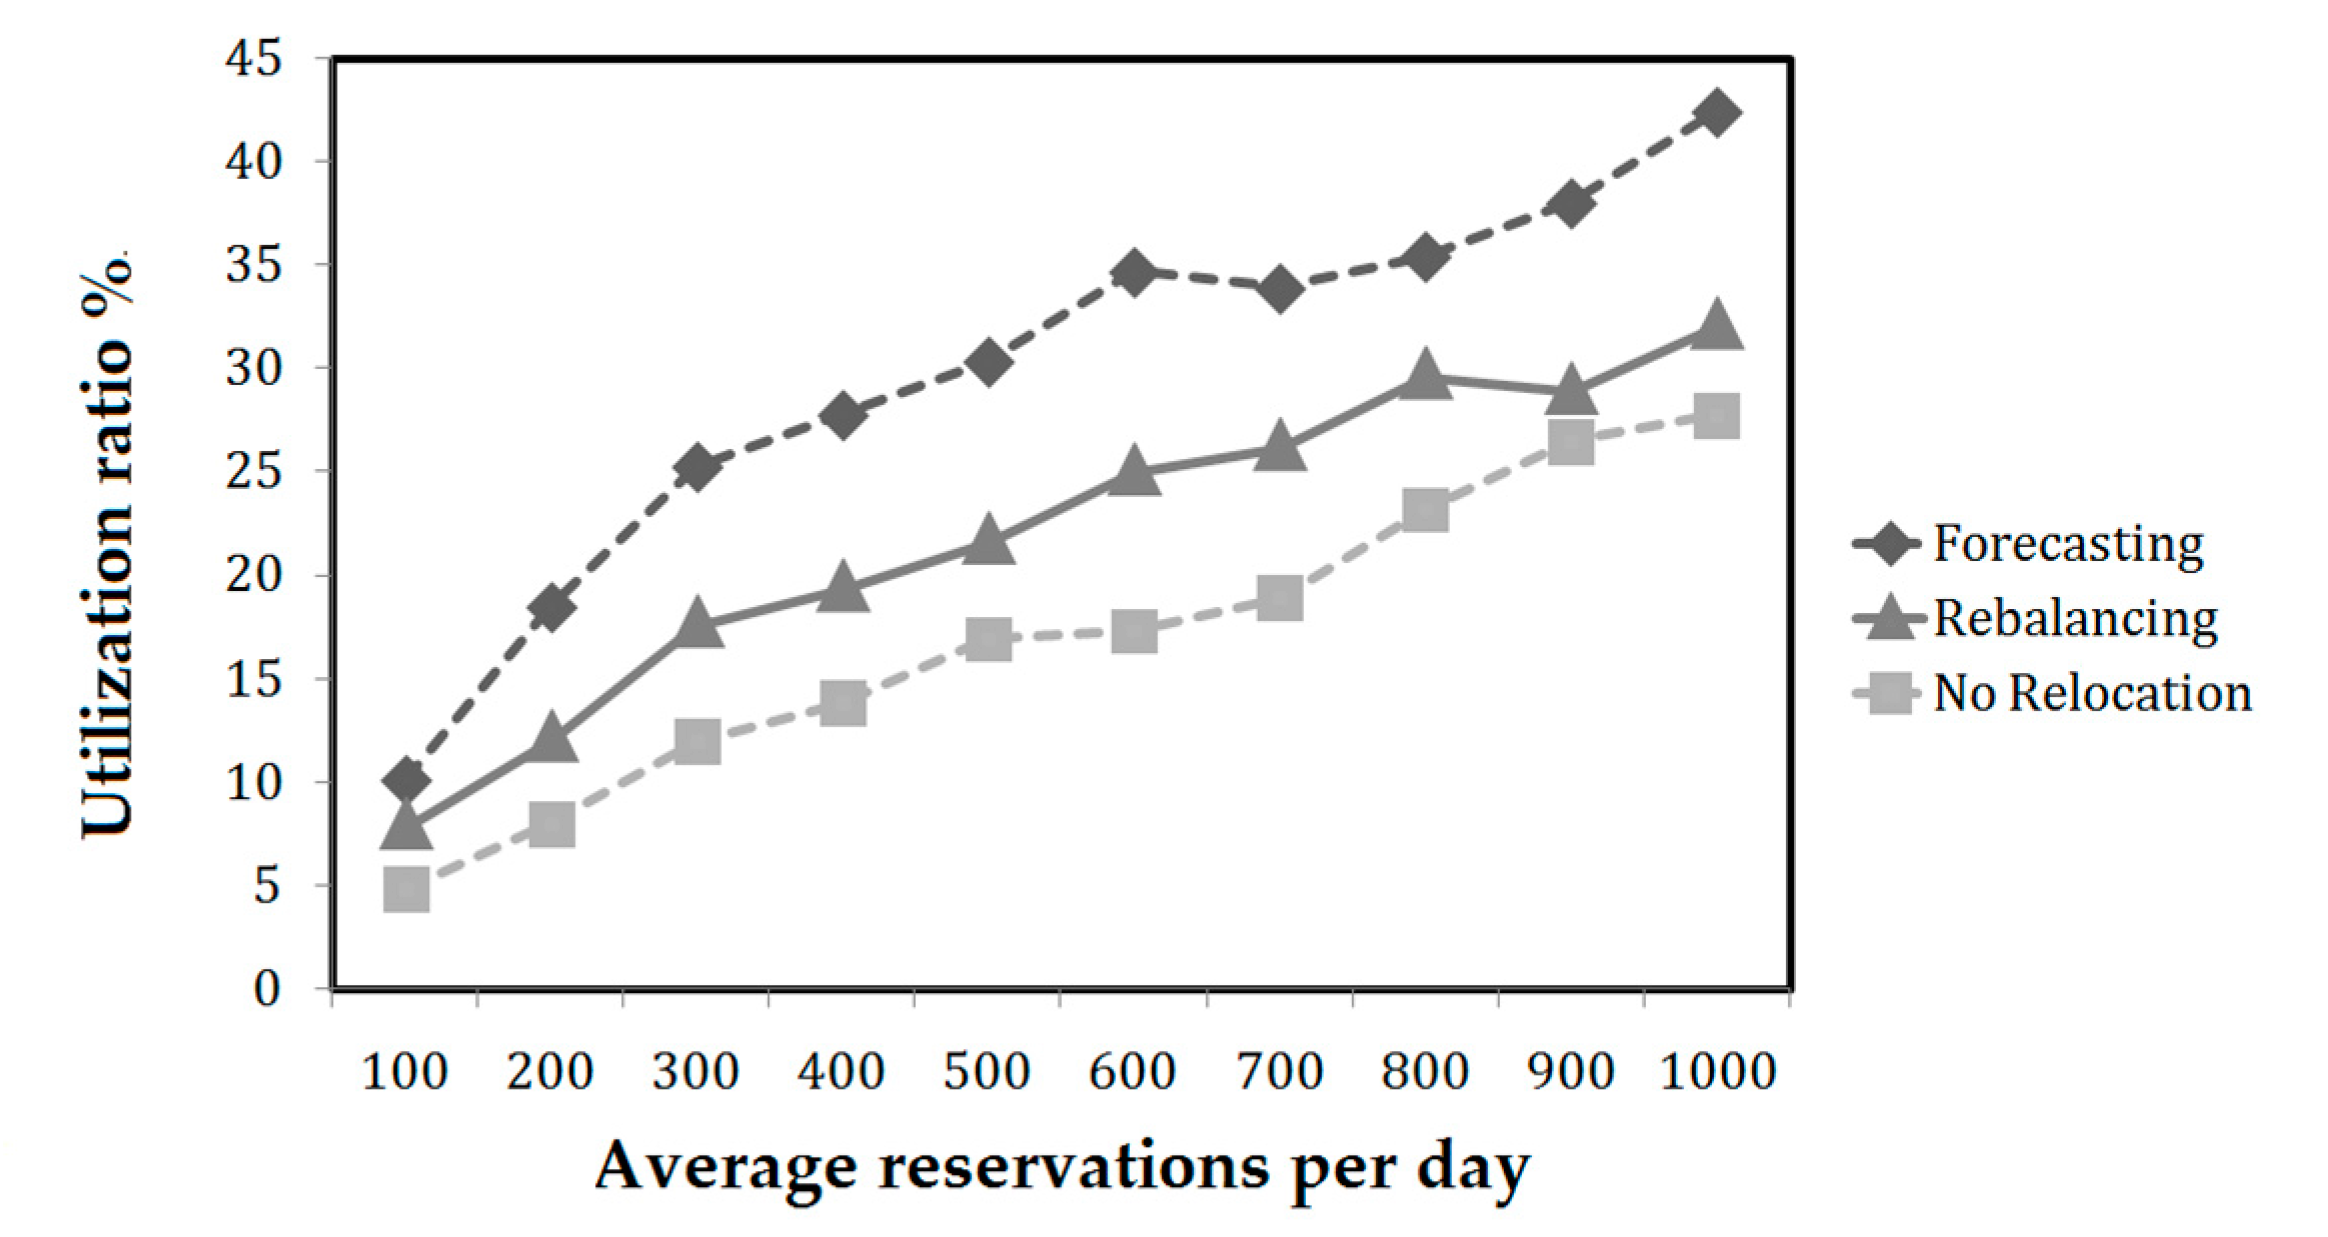
The simulation was run for 10 stations and 100 cars for a week. The input for comparison was the average number of reservations per day (x-axis), and the output was the utilization ratio. Figure 10 shows that for all scenarios, increasing the total number of reservations increases the utilization ratio (more cars are rented by customers). Forecasting relocation was significantly superior to rebalancing relocation with an increasing number of reservations. Thus, if an operator implements forecasting relocation in a real case, as the number of reservations increases, profit will increase compared to rebalancing relocation. The forecasting model will help the operator to predict the demand level for each station, allowing higher vehicle use. Both relocation models showed better utilization compared to one-way carsharing without relocation.
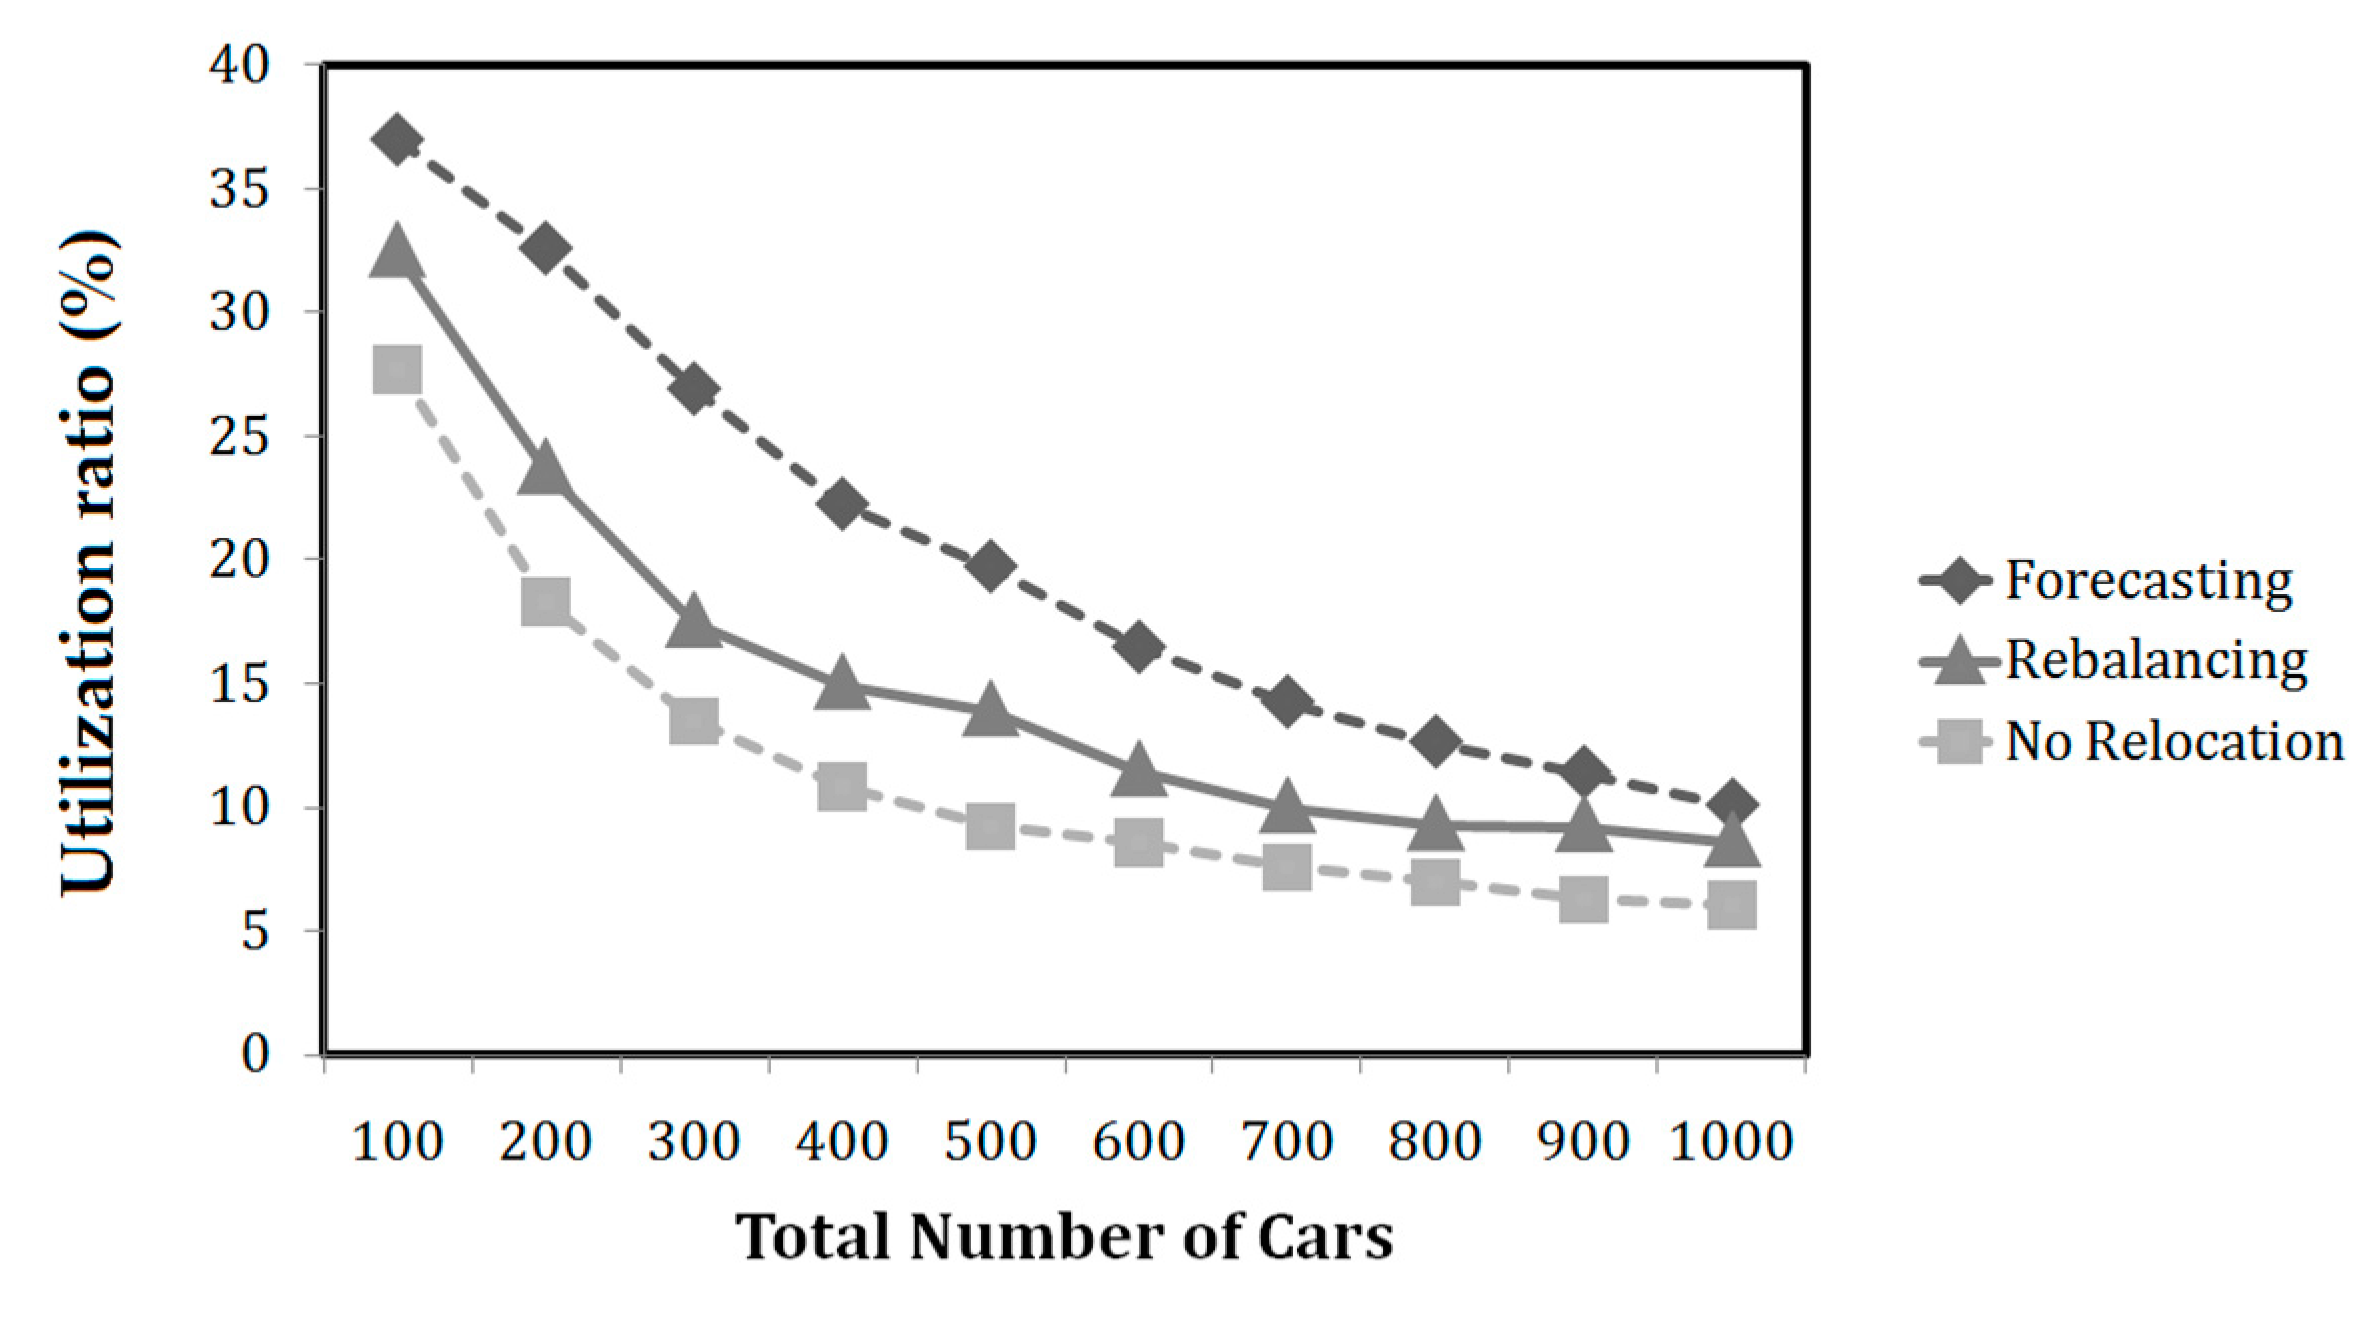
Figure 11 shows the utilization ratio for the different numbers of cars. The simulation assumed an average of 1000 daily reservations and 10 stations and was run for a week. The input for comparison was the total number of cars (x-axis), and the output was the utilization ratio. As the number of cars increased, the utilization ratio decreased for all models. Forecasting relocation showed a better utilization ratio than rebalancing relocation, but one-way services with rebalancing relocation still had better utilization performance than without relocation.
Thus, an operator must consider the ratio of their total number of customers and total number of cars to maximize their profit. Increasing customers or reservations increases utilization, since more cars are used by the customers, but increasing the number of cars reduces utilization (most cars are parked). If the operator allows one-way service, they need to consider relocation models, as these increase the vehicles used (utilization ratio) compared to the no relocation scheme. Forecasting relocation is the superior option due to allocating cars to high demand stations, enhancing the utilization ratio.
4.3. Impact of the Number of Reservations and Cars on the Acceptance Ratio
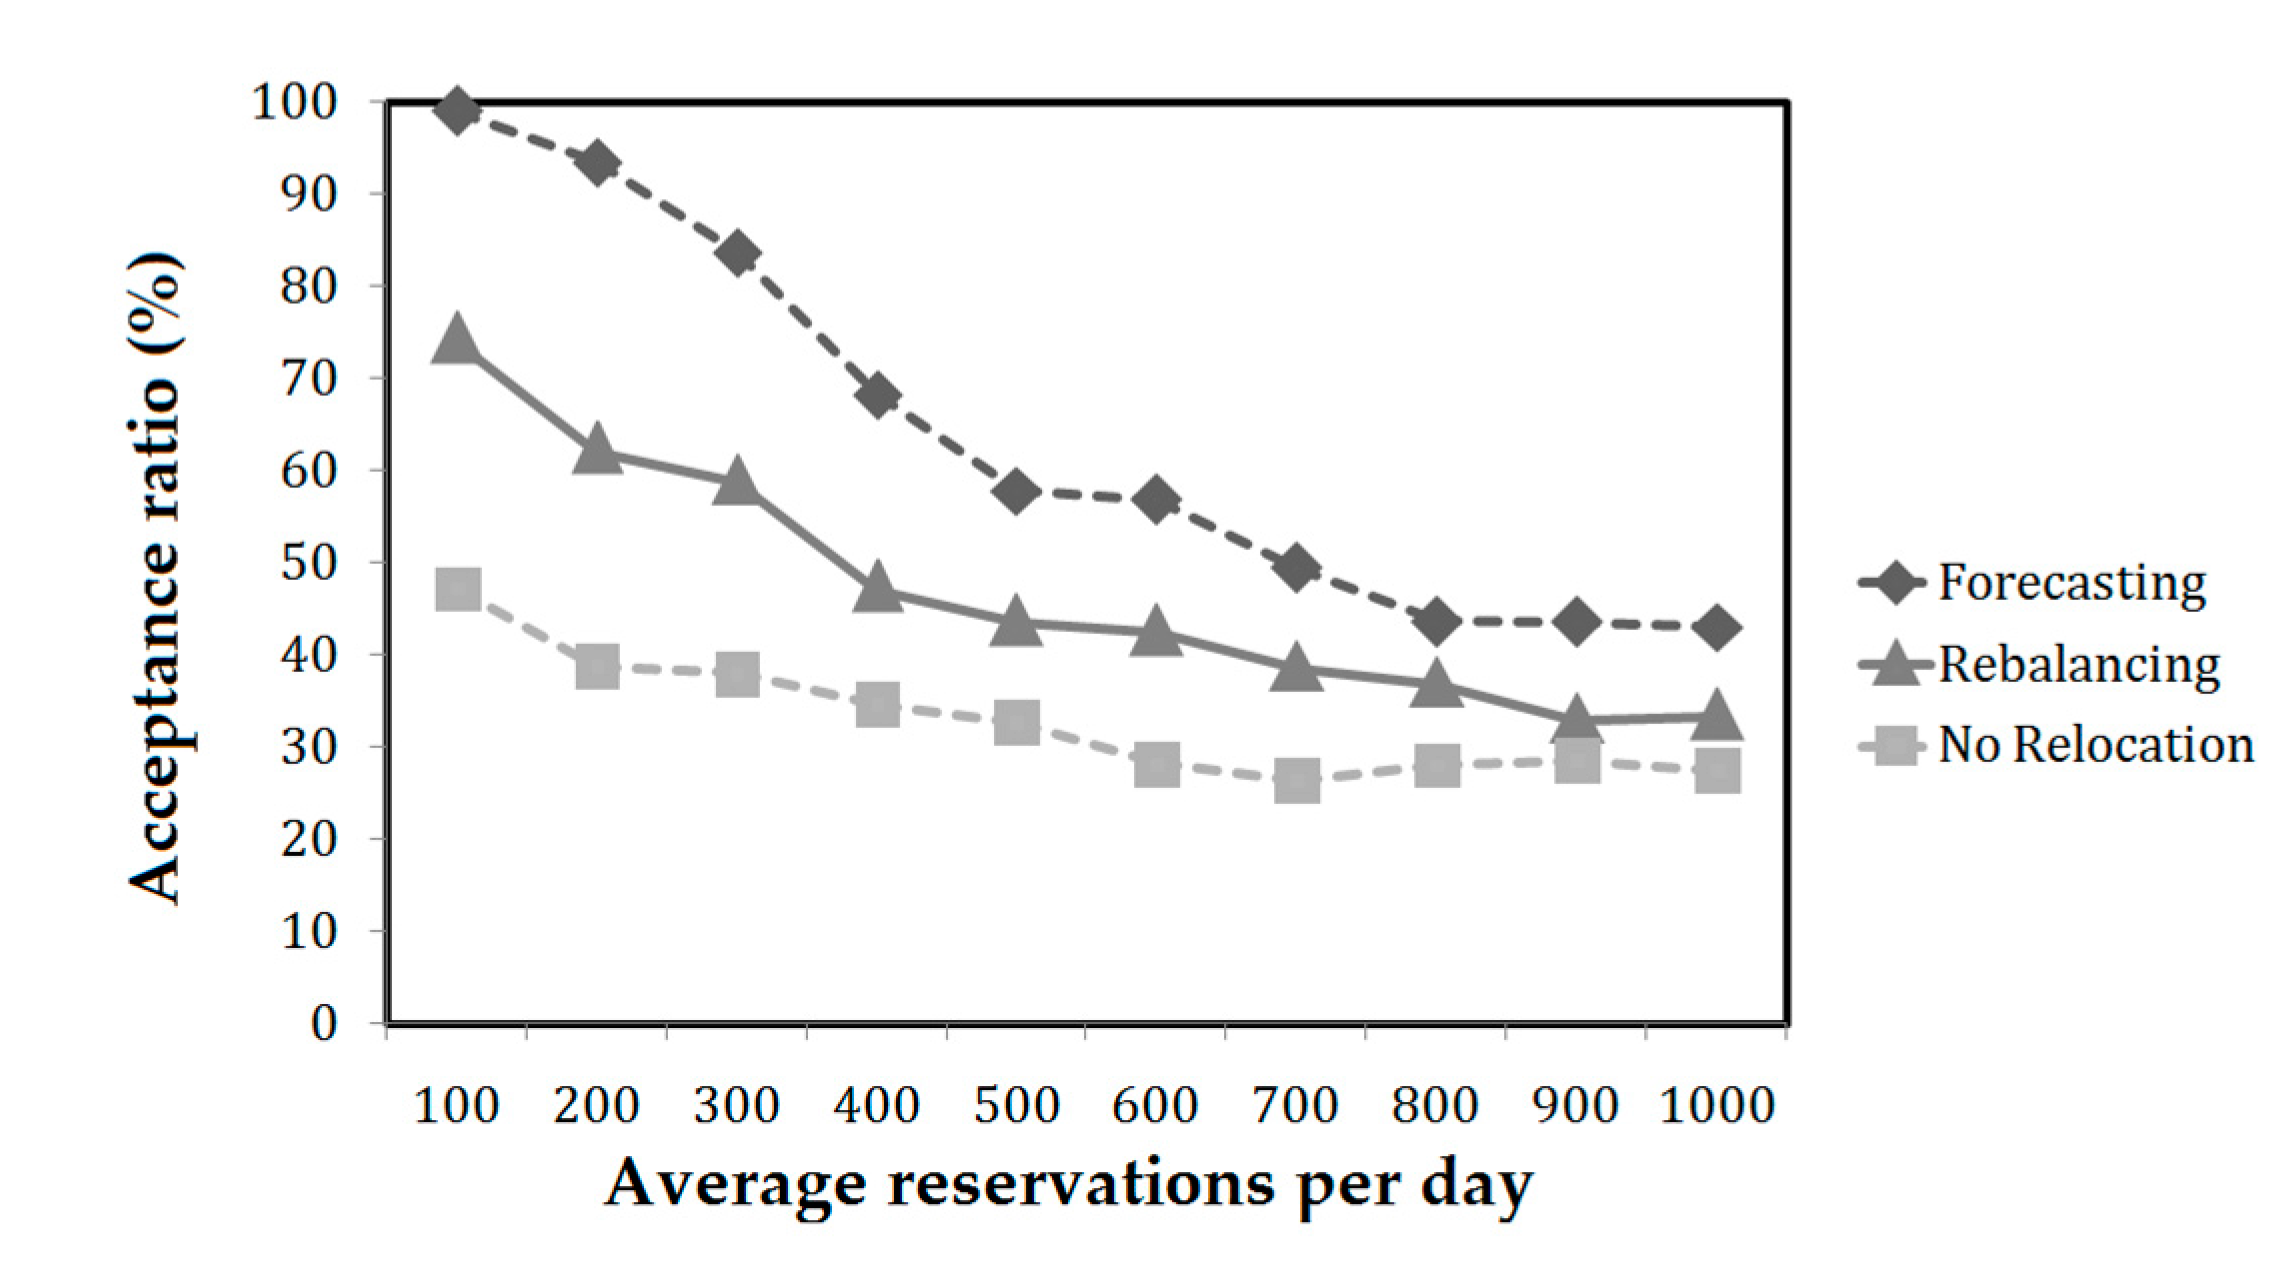
The simulation was run for 10 stations and 100 cars for a week. The input for comparison was the average number of reservations per day (x-axis), while the output was the acceptance ratio. Figure 12 shows that as the number of reservations increases, the acceptance ratio decreases (more customers do not receive a parked car). One-way schemes with relocation models showed better acceptance ratio compared to those without relocation. Forecasting relocation was superior in terms of the acceptance ratio compared to the rebalancing relocation and no relocation schemes. The forecasting model helps the operator predict car demand for each station, increasing the chance of customers renting a car. Rebalancing relocation also showed better performance than the no relocation scheme.
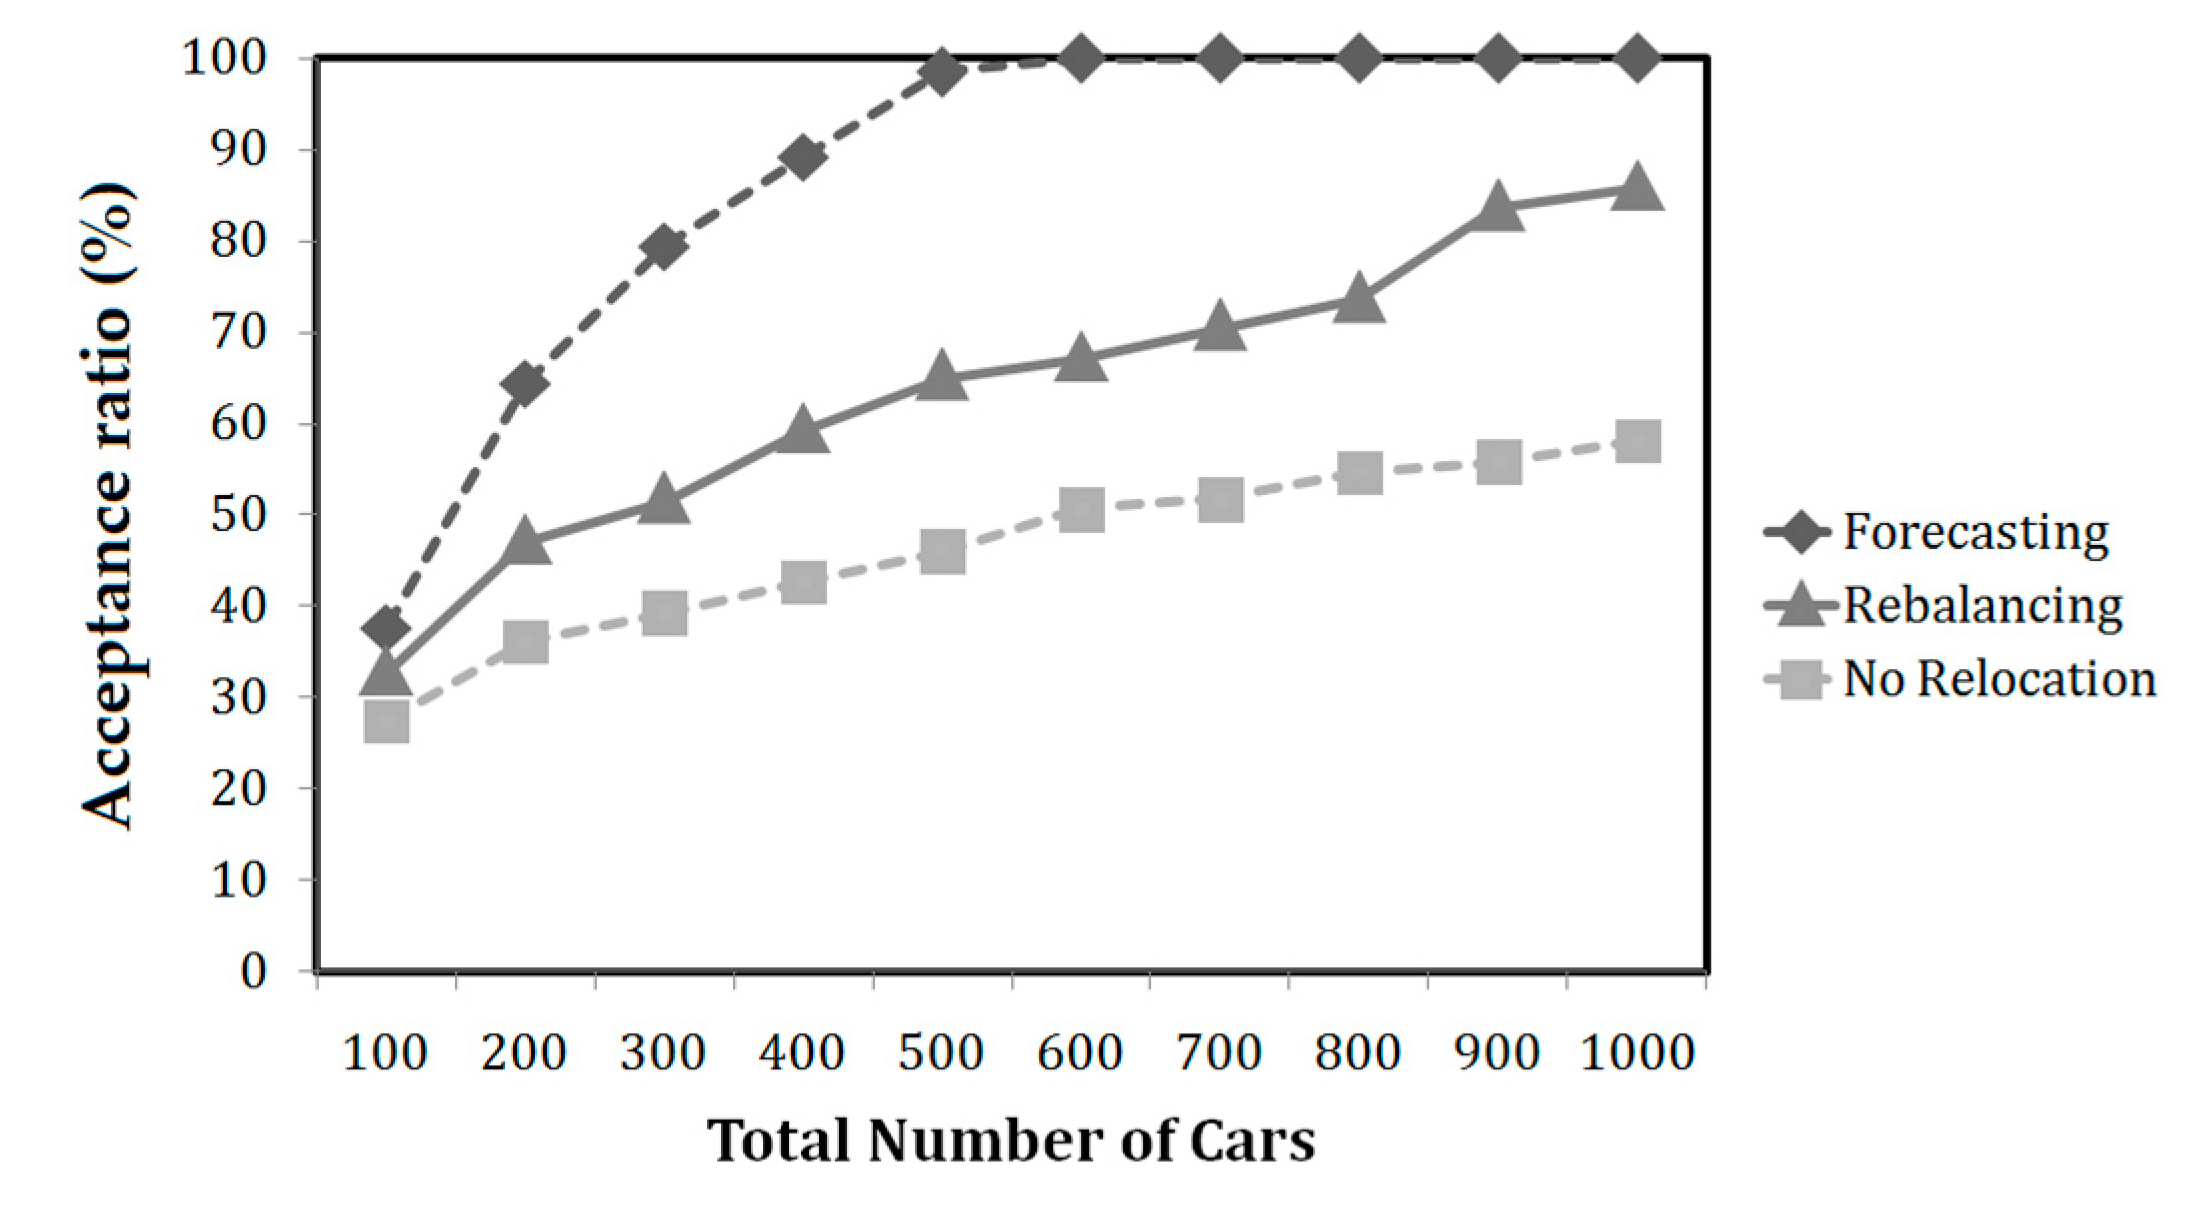
Figure 13 shows the impact on the acceptance ratio for different numbers of cars. The simulation was run with an average of 1000 daily reservations and 10 stations for a week. The input for comparison was the total number of cars (x-axis), while the output was the acceptance ratio. All scenarios show that as the number of cars increases, the acceptance ratio increases (more customers rent a car). Forecasting relocation showed a better acceptance ratio compared to the other scenarios (rebalancing and no relocation). Forecasting relocation preferentially relocates cars to high demand stations, increasing the chance of a customer finding a parked car compared to rebalancing relocation. One-way services with rebalancing relocation were still superior to those without relocation. For the case of one-way service with 1000 daily reservations and forecasting relocation, the operator only requires 500 cars to satisfy almost all the customers (98.5% acceptance ratio).
Increasing the number of customers (reservations) will decrease the acceptance ratio (more reservations are rejected by the system), whereas increasing the number of cars increases the acceptance ratio (more reservations are accepted by the system). Thus, the appropriate ratio of total number of customers (reservations per day) and total number of cars must be considered to maximize the acceptance ratio (customer satisfaction). If the operator allows one-way service, they must consider relocation models, since these increase the acceptance ratio compared to the no relocation scheme. Forecasting relocation provides the best option, due to allocating cars to high demand stations, leading to high customer satisfaction.
Every company has a different assessment for the best relocation model for one-way service. Evaluation criteria such as relocation cost, acceptance ratio, and utilization ratio are not the only metrics to measure relocation model performance, but at least they provide a benchmark to understand the relocation model comparison. From the current study, companies can consider their policy in regards to two options. They can implement rebalancing relocation, reducing the relocation cost but also reducing utilization and customer satisfaction; or forecasting relocation, increasing relocation costs, but also increases utilization and customer satisfaction.
However, other potential inputs should be considered as they can affect one-way carsharing service performance. Alfian et al. showed that station size also affects the utilization and acceptance ratio [25]. Nourinejad discussed other potential inputs, such as the number of relocation staff, that also affect system performance [30]. The current study set the station and staff size as unlimited, and focused only on comparing relocation models. Alfian et al. also showed that the distribution of one-way and round-trip service reservations will affect system performance [25].
4.4. Impact of Maximum Booking Time
We investigated the impact of maximum booking time on the utilization ratio. The maximum booking time is how many hours the carsharing system allows customers to make reservations before its starting time. Increasing the booking time gives more flexibility to the customer, since they can plan their trips in advance. For round-trips, the operator only checks the time constraint. However, if the operator allows round-trips and one-way trips, they should consider time and station constraints, since when the one-way service car is returned to another station, it prevents a new reservation from the same departure station to use the car. The simulation was run with a 50:50 proportion of reservations between round-trips and one-way trips.
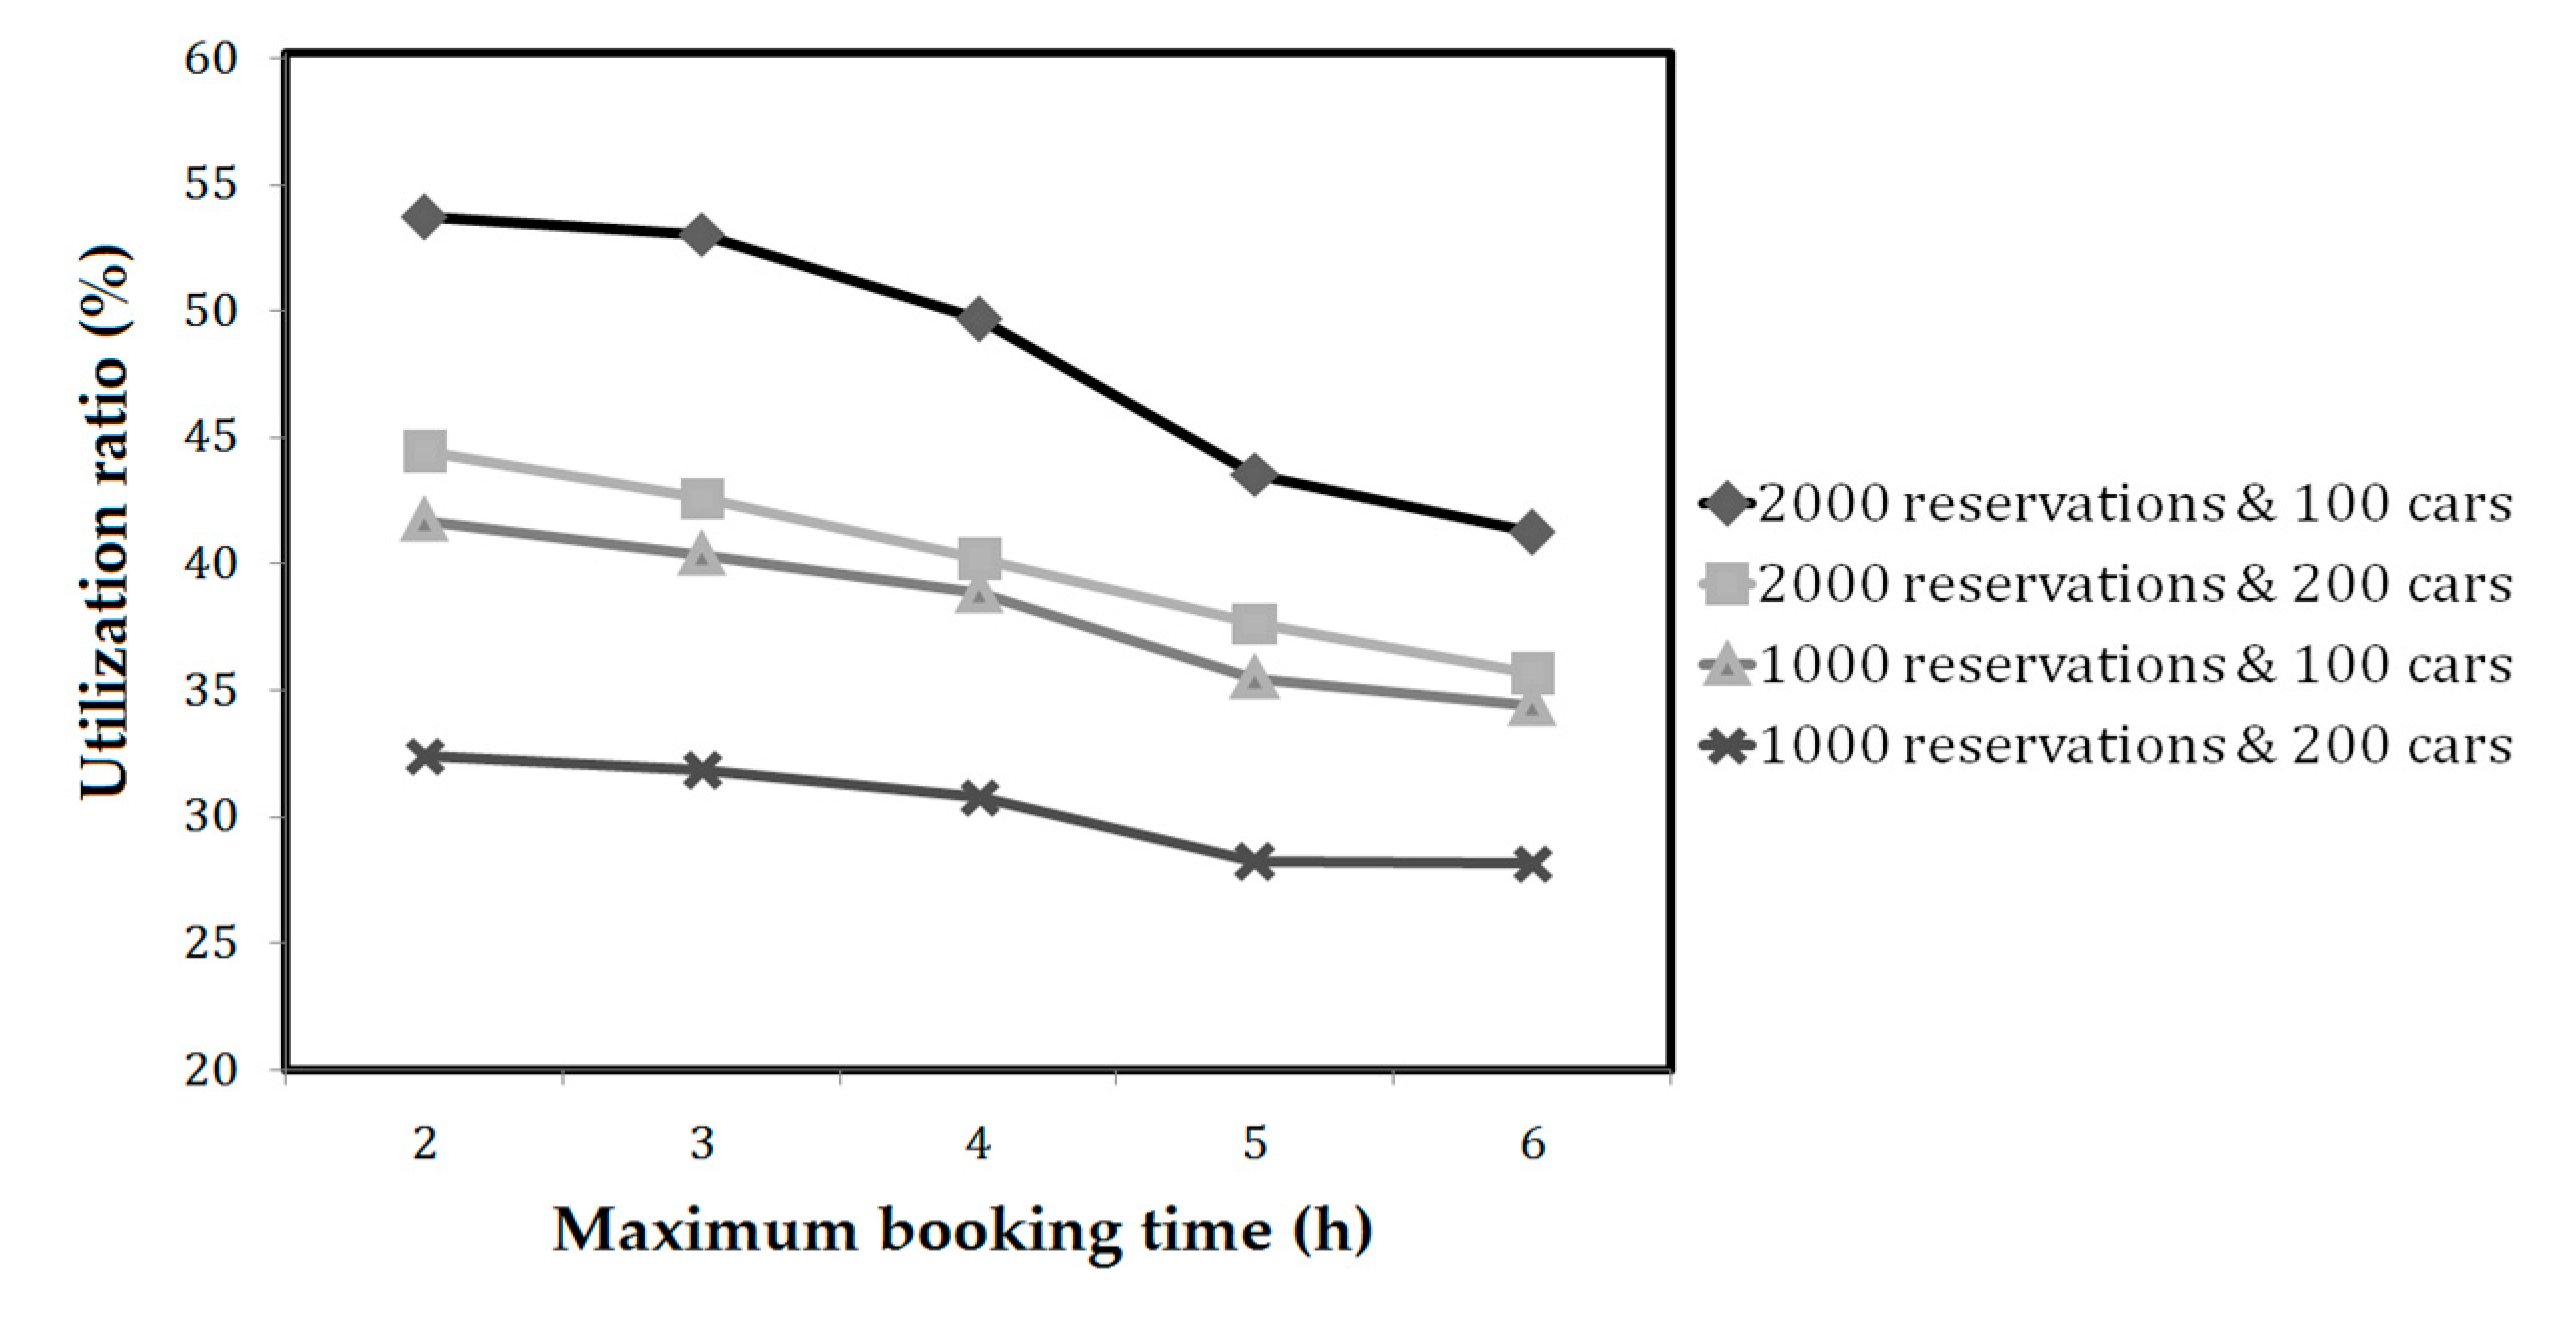
The previous results had a fixed maximum booking time of three hours, i.e., customers could make reservations a maximum of three hours before the starting time. This simulation used different maximum booking times and investigated the effect on the utilization ratio, as shown in Figure 14. Four simulation scenarios were considered: combinations between the average number of reservations per day and the total number of cars. Over all the scenarios considered, increasing the maximum booking slightly reduced the utilization ratio. This is because as the booking time increases, the chance of a free car reduces as more cars are booked by customers. If the number of reservations is high, then the utilization is high, and vice versa. The simulation with 2000 reservations showed high utilization compared to the case of 1000 reservations. The maximum booking time had more impact for high numbers of reservation and low numbers of cars, as shown in Figure 14.
In this study, when the car is booked by the customer, the car is reserved by the system. The next reservation is allowed when the car is returned to the destination station. Thus, if an operator allows one-way service, they should decide the maximum booking time with respect to their current total number of reservations and operational cars. A long booking time will reduce utilization (i.e., reduce the number of accepted requests), particularly if the operator has a high number of reservations and a low number of operational cars. However, a previous study showed that a long-term reservation system can produce better results, i.e., it can serve more demands from customers [18]. In a previous study, a different operational model was applied as the reservations are performed at least one day before (all demand is known in advance), thus the operator can perform relocation to serve these reservations. In our study, we only focus on last-minute reservation, i.e., the customer has information about the state of the system and reserves a car for a trip starting in a short period of time. Furthermore, in our study, for accepted reservations the operators keep the selected vehicle reserved until it is picked up by the customer who reserved the car.
5. Conclusions and Future Work
Relocation models were presented to solve problems with one-way carsharing services. A discrete event simulation model was first developed to evaluate alternative relocation models on relocation cost, acceptance ratio, and utilization ratio based on real customer traveling patterns. The three months of carsharing trip data in Korea was collected and converted into artificial reservation data according to its distribution. Simulations were used to analyze the performance of alternative relocation methods, and impacts for every combination of the number of cars and reservations in a week. The total number of reservations and cars affect the relocation cost, acceptance ratio, and utilization ratio of the relocation models. Forecasting relocation outperformed rebalancing or no relocation in terms of the utilization ratio and acceptance ratio. However, forecasting relocation generates a high relocation cost compared to the other relocation schemes, since more cars end up in unpopular departure stations. Thus, if an operator implements a forecasting model, they relocate a high number of cars from low to high demand stations, with consequential higher relocation costs. Forecasting relocation will help the operator predict car demand for each station based on the reservation history, increasing the chance of customers using the car, i.e., high acceptance and utilization ratios. The operator can consider different policies to implement either rebalancing relocation, reducing relocation cost (reducing the number of staff for relocation), but also reducing utilization and customer satisfaction; or forecasting relocation, increasing relocation costs, but also increasing utilization and customer satisfaction.
One-way operators must also decide the maximum allowable booking time to make the reservations. A long maximum booking time will reduce profit, particularly when the operator has a high number of reservations and a low number of operational cars.
There are a number of limitations to the current study. There were no relocation or station constraints, i.e., the number of relocation staff and station size were effectively infinite. Different types of carsharing datasets should be considered for comparison to the current simulations. Comparison with other relocation models should be considered.
Acknowledgments
This work was supported by the Korea Institute of Planning and Evaluation for Technology in Food, Agriculture, Forestry, and Fisheries (IPET) through the Agriculture, Food, and Rural Affairs Research Center Support Program, funded by the Ministry of Agriculture, Food, and Rural Affairs (MAFRA) (Grant number: 710003).
Author Contributions
Jongtae Rhee and Muhammad Fazal Ijaz conceived and designed the experiments; Ganjar Alfian performed the experiments; Muhammad Syafrudin and Norma Latif Fitriyani analyzed the data; Ganjar Alfian wrote the paper.
Conflicts of Interest
The authors declare no conflict of interest.
References
- Millard-Ball, A.; Murray, G.; Schure, J.T.; Fox, C. Car-Sharing: Where and How It Succeeds, TCRP Report 108; Transportation Research Board of the National Academies: Washington, DC, USA, 2005. [Google Scholar]
- Shaheen, S.; Cohen, A. Growth in Worldwide Carsharing: An International Comparison. Transp. Res. Rec. 1992, 81–89. [Google Scholar] [CrossRef]
- Firnkorn, J.; Muller, M. What will be the environmental effects of new free-floating car-sharing systems? The case of car2go in Ulm. Ecol. Econ. 2011, 70, 1519–1528. [Google Scholar] [CrossRef]
- Vine, S.L.; Lee-Gosselin, M.; Sivakumar, A.; Polak, J. A new approach to predict the market and impacts of round-trip and point-to-point carsharing systems: Case study of London. Transp. Res. D 2014, 32, 2018–2229. [Google Scholar] [CrossRef]
- Martin, E.; Shaheen, S. Greenhouse Gas Emission Impacts of Carsharing in North America. IEEE Trans. Intell. Transp. 2011, 12, 1074–1086. [Google Scholar] [CrossRef]
- Shaheen, S.; Chan, N.D.; Micheaux, H. One-way carsharing’s evolution and operator perspectives from the Americas. Transportation 2015, 42, 519–536. [Google Scholar] [CrossRef]
- Barth, M.; Todd, M. Simulation Model Performance Analysis of a Multiple Station Shared Vehicle System. Transp. Res. C 1999, 7, 237–259. [Google Scholar] [CrossRef]
- Di Frebbraro, A.; Sacco, N.; Saeednia, M. One-Way Carsharing Solving the Relocation Problem. Transp. Res. Rec. 2012, 2319, 113–120. [Google Scholar] [CrossRef]
- Jorge, D.; Molnar, G.; Correia, G. Trip pricing of one-way station based carsharing networks with zone and time of day price variations. Transp. Res. B 2015, 81, 461–482. [Google Scholar] [CrossRef]
- Uesugi, K.; Mukai, N.; Watanabe, T. Optimization of Vehicle Assignment for Car Sharing System. In Knowledge Based Intelligent Information and Engineering Systems, Lecture Notes in Computer Science; Apolloni, B., Howlett, R.J., Jain, L., Eds.; Springer: Berlin/Heidelberg, Germany, 2007; pp. 1105–1111. [Google Scholar]
- Kek, A.G.H.; Cheu, R.L.; Chor, M.L. Relocation simulation model for multiple-station shared-use vehicle systems. Transp. Res. Rec. 2006, 1868, 81–88. [Google Scholar] [CrossRef]
- Cheu, R.L.; Xu, J.; Kek, A.G.H.; Lim, W.P.; Chen, W.L. Forecasting of shared-use vehicle trips using neural networks and support vector machines. Transp. Res. Rec. 2006, 1968, 40–46. [Google Scholar] [CrossRef]
- Wang, H.; Cheu, R.; Lee, D. Dynamic Relocating Vehicle Resources Using a Microscopic Traffic Simulation Model for Carsharing Services. In Proceedings of the Computational Science and Optimization (CSO), 2010 Third International Joint Conference, Huangshan, China, 28–31 May 2010; pp. 108–111. [Google Scholar]
- Alfian, G.; Rhee, J.; Yoon, B. A Relocation Simulation Model for One-way carsharing service. In Proceedings of the IEEE International Conference on Industrial Technology, Busan, Korea, 26 February 2014. [Google Scholar]
- Morency, C.; Trepanier, M.; Agard, B.; Martin, B.; Quashie, J. Car sharing system: What transaction datasets reveal on users’ behaviors. In Proceedings of the IEEE Intelligent Transportation Systems Conference (ITSC 2007), 30 September–3 October 2007; pp. 284–289. [Google Scholar]
- Habib, K.M.N.; Morency, C.; Islam, M.T.; Grasset, V. Modeling users’ behavior of a carsharing program: Application of a joint hazard and zero inflated dynamic ordered probability model. Transp. Res. A 2012, 46, 241–254. [Google Scholar]
- Costain, C.; Ardron, C.; Habib, K.N. Synopsis of users behavior of a carsharing program: A case study in Toronto. Transp. Res. A 2012, 46, 421–434. [Google Scholar]
- Boyaci, B.; Zografos, K.; Geroliminis, N. An integrated optimization-simulation framework for vehicle and personnel relocations of electric carsharing systems with reservations. Transp. Res. B 2017, 95, 214–237. [Google Scholar] [CrossRef]
- Repoux, M.; Boyaci, B.; Geroliminis, N. Simulation and optimization of one-way car-sharing systems with variant relocation policies. In Proceedings of the Transportation Research Board 94th Annual Meeting, Washington, DC, USA, 11–15 January 2015. No. 15-1907. [Google Scholar]
- Barth, M.; Han, J.; Shaheen, S. Shared-use vehicle systems: Framework for classifying carsharing, station cars, and combined approaches. Transp. Res. Rec. 2002, 1791, 105–112. [Google Scholar] [CrossRef]
- Shaheen, S.A.; Cohen, A.; Roberts, J. Carsharing in North America Market Growth, Current Developments, and Future Potential. Transp. Res. Rec. 2006, 1986, 116–124. [Google Scholar] [CrossRef]
- Shaheen, S.; Rodier, C. Travel effects of a suburban commuter carsharing service: CarLink case study. Transp. Res. Rec. 2005, 1927, 182–188. [Google Scholar] [CrossRef]
- Li, W.; Li, Y.; Fan, J.; Deng, H. Siting of Carsharing Stations Based on Spatial Multi-Criteria Evaluation: A Case Study of Shanghai EVCARD. Sustainability 2017, 9, 152. [Google Scholar] [CrossRef]
- Barth, M.; Todd, M. Intelligent Transportation System Architecture for a Multi-Station Shared Vehicle System. In Proceedings of the IEEE Intelligent Transportation Systems Conference, Dearborn, MI, USA, 1–3 October 2000; p. 240. [Google Scholar]
- Alfian, G.; Rhee, J.; Kang, Y-S.; Yoon, B. Performance Comparison of Reservation Based and Instant Access One-Way Car Sharing Service through Discrete Event Simulation. Sustainability 2015, 7, 12465–12489. [Google Scholar] [CrossRef]
- Rhee, J.; Alfian, G.; Yoon, B. Application of Simulation method and regression analysis to optimize car operations in carsharing service: A case study in South Korea. J. Public Transp. 2014, 17, 121–160. [Google Scholar] [CrossRef]
- Alfian, G.; Rhee, J.; Yoon, B. A Simulation tool for prioritizing product-service system (PSS) models in a carsharing service. Comput. Ind. Eng. 2014, 70, 59–73. [Google Scholar] [CrossRef]
- Boyaci, B.; Zografos, K.; Geroliminis, N. An optimization framework for the development of efficient one-way car-sharing systems. Eur. J. Oper. Res. 2015, 240, 718–733. [Google Scholar] [CrossRef]
- Han, J.; Kamber, M.; Pei, J. Data Mining: Concepts and Techniques, 3rd ed.; Morgan Kaufmann Publishers: Waltham, MA, USA, 2011. [Google Scholar]
- Nourinejad, M.; Zhu, S.; Bahrami, S.; Roorda, M.J. Vehicle relocation and staff rebalancing in one-way carsharing systems. Transp. Res. E 2015, 81, 98–113. [Google Scholar] [CrossRef]
Figure 1.
Simulation architecture.

Figure 2.
Location of carsharing stations (red makers) separated by district area around Seoul.

Figure 3.
Dataset distributions: (a) time of the day; (b) vehicle hour trips (VHT); (c) day of the week; and (d) customer departure.
Figure 3.
Dataset distributions: (a) time of the day; (b) vehicle hour trips (VHT); (c) day of the week; and (d) customer departure.

Figure 4.
Predicted total number of reservations using MLP (multilayer perceptron) in the Seongbuk-gu area.
Figure 4.
Predicted total number of reservations using MLP (multilayer perceptron) in the Seongbuk-gu area.

Figure 5.
Flow chart for reservation based one-way simulation.

Figure 6.
Simulation time history for cars present at each station (a) without relocation; (b) rebalancing relocation; and (c) proposed forecasting relocation.
Figure 6.
Simulation time history for cars present at each station (a) without relocation; (b) rebalancing relocation; and (c) proposed forecasting relocation.

Figure 7.
Car status over time (a) without relocation; (b) rebalancing relocation; and (c) proposed forecasting relocation.
Figure 7.
Car status over time (a) without relocation; (b) rebalancing relocation; and (c) proposed forecasting relocation.

Figure 8.
Effect of the number of reservations on relocation cost.

Figure 9.
Impact of the number of cars on relocation cost.

Figure 10.
Impact of the number of reservations on vehicle utilization.

Figure 11.
The impact of the number of cars on the utilization.

Figure 12.
Impact of the number of reservations on the acceptance ratio.

Figure 13.
The impact of the number of cars on the acceptance ratio.

Figure 14.
Impact of the booking time on the utilization ratio.

© 2017 by the authors. Licensee MDPI, Basel, Switzerland. This article is an open access article distributed under the terms and conditions of the Creative Commons Attribution (CC BY) license (http://creativecommons.org/licenses/by/4.0/).
Share and Cite
MDPI and ACS Style
Alfian, G.; Rhee, J.; Ijaz, M.F.; Syafrudin, M.; Fitriyani, N.L. Performance Analysis of a Forecasting Relocation Model for One-Way Carsharing. Appl. Sci. 2017, 7, 598. https://doi.org/10.3390/app7060598
AMA Style
Alfian G, Rhee J, Ijaz MF, Syafrudin M, Fitriyani NL. Performance Analysis of a Forecasting Relocation Model for One-Way Carsharing. Applied Sciences. 2017; 7(6):598. https://doi.org/10.3390/app7060598
Chicago/Turabian StyleAlfian, Ganjar, Jongtae Rhee, Muhammad Fazal Ijaz, Muhammad Syafrudin, and Norma Latif Fitriyani. 2017. "Performance Analysis of a Forecasting Relocation Model for One-Way Carsharing" Applied Sciences 7, no. 6: 598. https://doi.org/10.3390/app7060598
Note that from the first issue of 2016, this journal uses article numbers instead of page numbers. See further details here.