
A Multi-Year Study on Rice Morphological Parameter Estimation with X-Band Polsar Data


1
Institute of Environmental Engineering ETH Zurich, 8093 Zurich, Switzerland
2
Faculty of Civil Engineering, Istanbul Technical University, 34469 Istanbul, Turkey
3
Microwaves and Radar Institute, German Aerospace Center (DLR), 82234 Oberpfaffenhofen, Germany
*
Author to whom correspondence should be addressed.
Appl. Sci. 2017, 7(6), 602; https://doi.org/10.3390/app7060602
Submission received: 29 March 2017
/
Revised: 24 May 2017
/
Accepted: 8 June 2017
/
Published: 9 June 2017
(This article belongs to the Special Issue Polarimetric SAR Techniques and Applications)
Abstract
:Rice fields have been monitored with spaceborne Synthetic Aperture Radar (SAR) systems for decades. SAR is an essential source of data and allows for the estimation of plant properties such as canopy height, leaf area index, phenological phase, and yield. However, the information on detailed plant morphology in meter-scale resolution is necessary for the development of better management practices. This letter presents the results of the procedure that estimates the stalk height, leaf length and leaf width of rice fields from a copolar X-band TerraSAR-X time series data based on a priori phenological phase. The methodology includes a computationally efficient stochastic inversion algorithm of a metamodel that mimics a radiative transfer theory-driven electromagnetic scattering (EM) model. The EM model and its metamodel are employed to simulate the backscattering intensities from flooded rice fields based on their simplified physical structures. The results of the inversion procedure are found to be accurate for cultivation seasons from 2013 to 2015 with root mean square errors less than 13.5 cm for stalk height, 7 cm for leaf length, and 4 mm for leaf width parameters. The results of this research provided new perspectives on the use of EM models and computationally efficient metamodels for agriculture management practices.

1. Introduction
Rice is the main source of food and income for several highly populated countries. The increasing population and limited arable lands bring out the need for higher yields that depends on the development of better management practices. The traditional method monitoring by visual inspection is not possible for kilometer-square areas. For such large scales, remote sensing based methods are good alternatives. Among different data sources, information provided by Synthetic Aperture Radar (SAR) is advantageous with its sensitivity to geometric and dielectric properties of the objects and its availability in all light and weather conditions. Therefore, SAR is a valuable tool for monitoring the rice fields [1].
Understanding the phenological evolution of rice fields is important to develop effective management strategies. In the literature, several SAR data based algorithms have been developed to investigate the phenological evolution of rice fields including their canopy height, growth stage, leaf area index and yields. In SAR based rice monitoring, one way of monitoring the phenological cycle is the use of different SAR data analysis techniques including temporal trend analysis [2,3], interferometric analysis [4,5] and polarimetric interferometry analysis [6,7]. The other approach employs EM models to simulate the polarimetric parameters from plant properties [5,8,9].
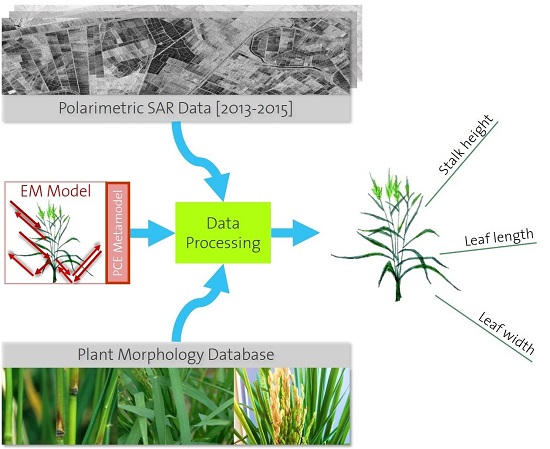
This letter presents the inversion results of the metamodel-driven EM model for the estimations of stalk height, leaf length, and leaf width parameters from copolar X-band TerraSAR-X time series data, by following the methodology given in Figure 1, detailed and presented in [10] for a single year and growth stage parameter, specifically BBCH. Unlike [10], this study focuses on the feasibility of the proposed approach for morphology parameter estimation under different conditions. The chosen EM model [11] uses the biophysical properties of rice plants to simulate the backscattering intensities () with Monte-Carlo simulations. The computation costs related to the multi-dimensional algorithm and the Monte-Carlo simulations were reduced by introducing metamodels, which mimics the EM model after trained for once. The stability of the inversion was tested over a dataset of three different cultivation periods (2013–2015), which includes data from rice fields under different agricultural and environmental conditions.
2. Methodology
2.1. Theoretical EM Model and Its Metamodel
In this study, the EM model [11], , is employed to simulate the backscattering intensities, , from a set of rice plant morphology parameters, ξ, through Monte Carlo simulations for varying scatterer locations. The ξ set includes stalk dimensions (height and diameter), leaf dimensions (length and width), panicle dimensions (length and width), and their structural densities. The simulations are done for a unit area A, having randomly placed non-overlapping cylindrical stalks with a specific height and diameter. Each stalk is modeled to have elliptical leaves with a fixed length and width. In this study, we assumed flooded ground and plant components with fixed complex dielectric constants for the complete growth cycle by relying on the sensitivity analysis of the EM model [12]. The , given in (1), provides the relation between an incident and a scattered wave through the coherent sum of four different scattering mechanisms (Sn), as shown in Figure 2.
In the EM model given in (1), q and p subscripts correspond to transmitted and received horizontal (H) and vertical (V) linear polarization channels. The parameters k and r represent the free-space wavenumber and the distance between the sensor and the target, respectively. The for the different polarimetric channels, qq, are approximated from the ratio between and .
The has high computation cost due to its multi-dimensional algorithm and Monte Carlo simulations. The computation costs of the algorithm were reduced using sparse Polynomial Chaos Expansion (PCE) metamodels. The PCE metamodels are spectral variance decompositions of the original model with low training cost and wide coverage in the parameter domain [13]. For the chosen , its PCE metamodel, , is developed from the (2), given below.
In (2), is a set of scalar coefficients and the form a polynomial orthonormal basis [14]. For practical reasons and to avoid over fitting conditions, the metamodels were limited to N (=20) expansions. In this study, the metamodel, , was implemented the UQLab toolbox [15] with Legendre polynomial family with the uniform [−1,+1] input distributions. Details of the metamodel implementation for the EM model can be found in [10].
2.2. Probabilistic Particle Swarm Optimization
The inversions of multi-dimensional EM models are ill-posed problems with the higher number of unknowns compared to the number of equations. For such problems, optimization algorithms are used to reach the optimum solution in the parameter space using different constraints. However, the optimization of multi-dimensional EM model inversions may result in multiple optimum solutions since different inputs can lead to similar outputs. The presence of multiple optimum solutions prevents the use of deterministic optimization algorithms that focus on a single solution. For the existence of multiple solutions, stochastic optimization algorithms can be considered as an alternative. In stochastic optimization, the procedure is initiated several times to obtain all local solutions in a given parameter space based on the defined set of rules.
In this study, the Particle Swarm Optimization (PSO) algorithm [16] is utilized, which is based on updating the position of the particles, i.e., possible solutions, until they converge to an optimum solution within a parameter space. In each iteration, the locations of the particles are updated according to the position of the particle with the best position. The iterations continue until the particles converge to a solution that agrees with the defined constraints. For the estimation of rice morphology parameters from copolar X-band SAR backscattering intensities, the metamodel is inverted with the stochastic PSO algorithm.
The fitness function for the PSO is given in (3) for HH and VV polarimetric channels and an arbitrary ith iteration. The fitness function is defined to minimize the difference between measured and estimated values. The consistency of the solutions for different polarimetric channels is provided by considering the same input vector for both HH and VV polarimetric channels.
Optimization problems need constraints to simplify the problem by reducing the dimensional complexity. In metamodel inversion, three plant morphology dependent constraints were established that are based on the natural limitations excerpted from the available rice morphology data.
Positivity constraint ensures positive and real morphological estimations for all iterations.
Min-Max constraint limits the morphological estimations based on the phenological phase boundaries. Phenological phases are defined by the International Rice Research Institute (IRRI) [17]. The scale divides the growth cycle to five major phases. Figure 3 presents the boundaries obtained from ground data, for the chosen morphological parameters.
Natural limitations provide non-linear relationships among rice morphology parameters during their development. These relations eliminates the solutions which might be impossible for a healthy plant, such as a 10-cm-tall stalk having two 50-cm-length leaves. This condition restricts the parameter space with a convex hull. Convex hull defines non-linear boundaries in a parameter space according to the experimental ground measurements that involve the agronomically possible solutions.
The stochastic PSO optimization provides distributions for each morphology parameter. For the accuracy analysis, the mean value of the resulting stochastic distributions is assigned as the estimated dimensions of the rice morphological parameters. For a single stochastic PSO optimization, a total number of 200 iterations was found to be sufficient for the optimization convergence which changes less than 0.1% regarding the mean of the estimated values.
3. Datasets
3.1. The Ipsala Test Site and Ground Data
The selected test area, Ipsala, is located in the North-West part of Turkey with its center at 37°7′53″ N and 6°19′32″ N coordinates. Ipsala is one of the biggest rice cultivation sites in Turkey with approximate acreage of 190 square kilometers. Based on the knowledge gathered from the Trakya Agriculture Research Institute (TARI), rice cultivation is done in the area by local farmers between May and September.
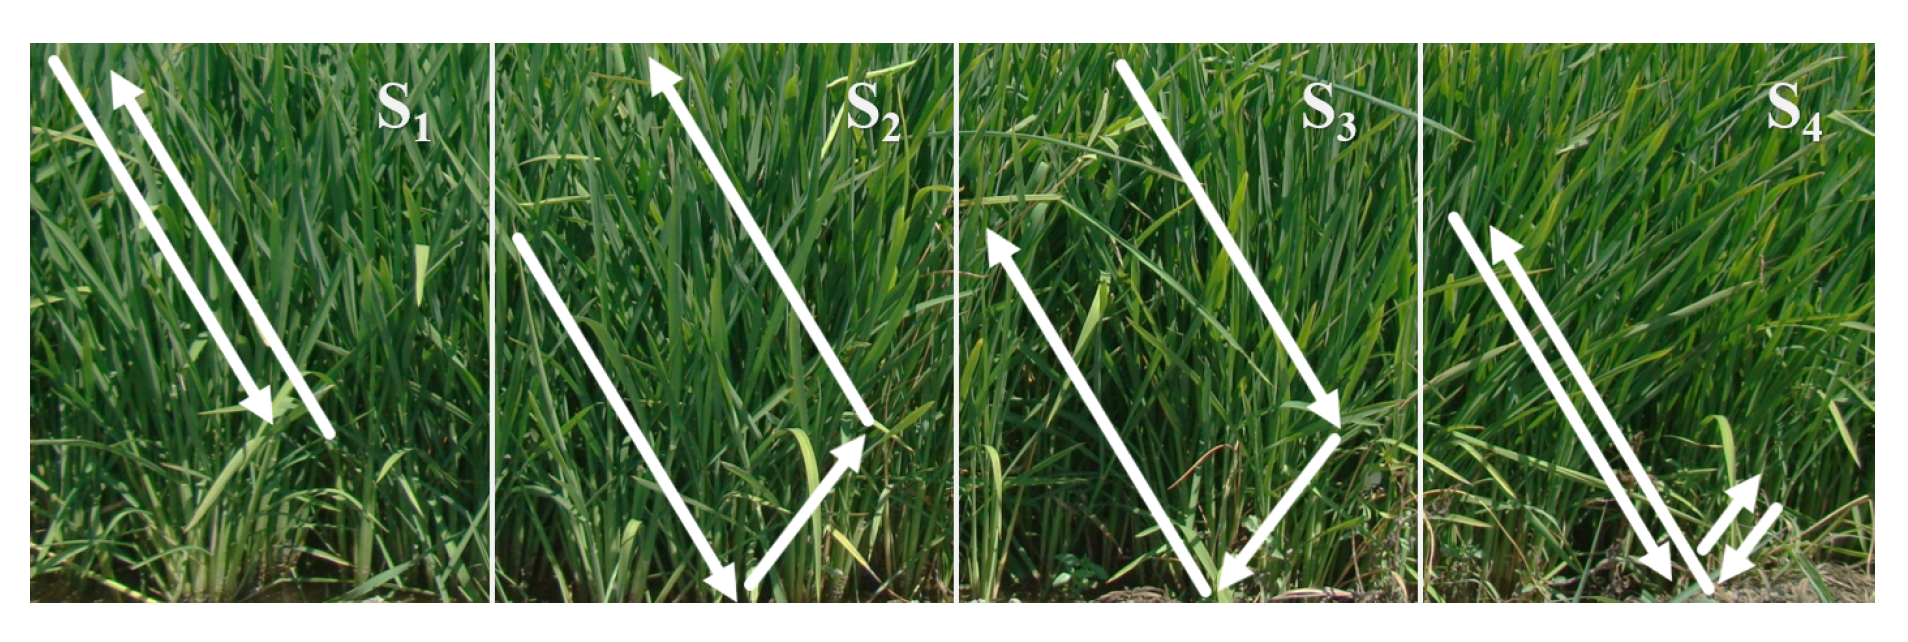
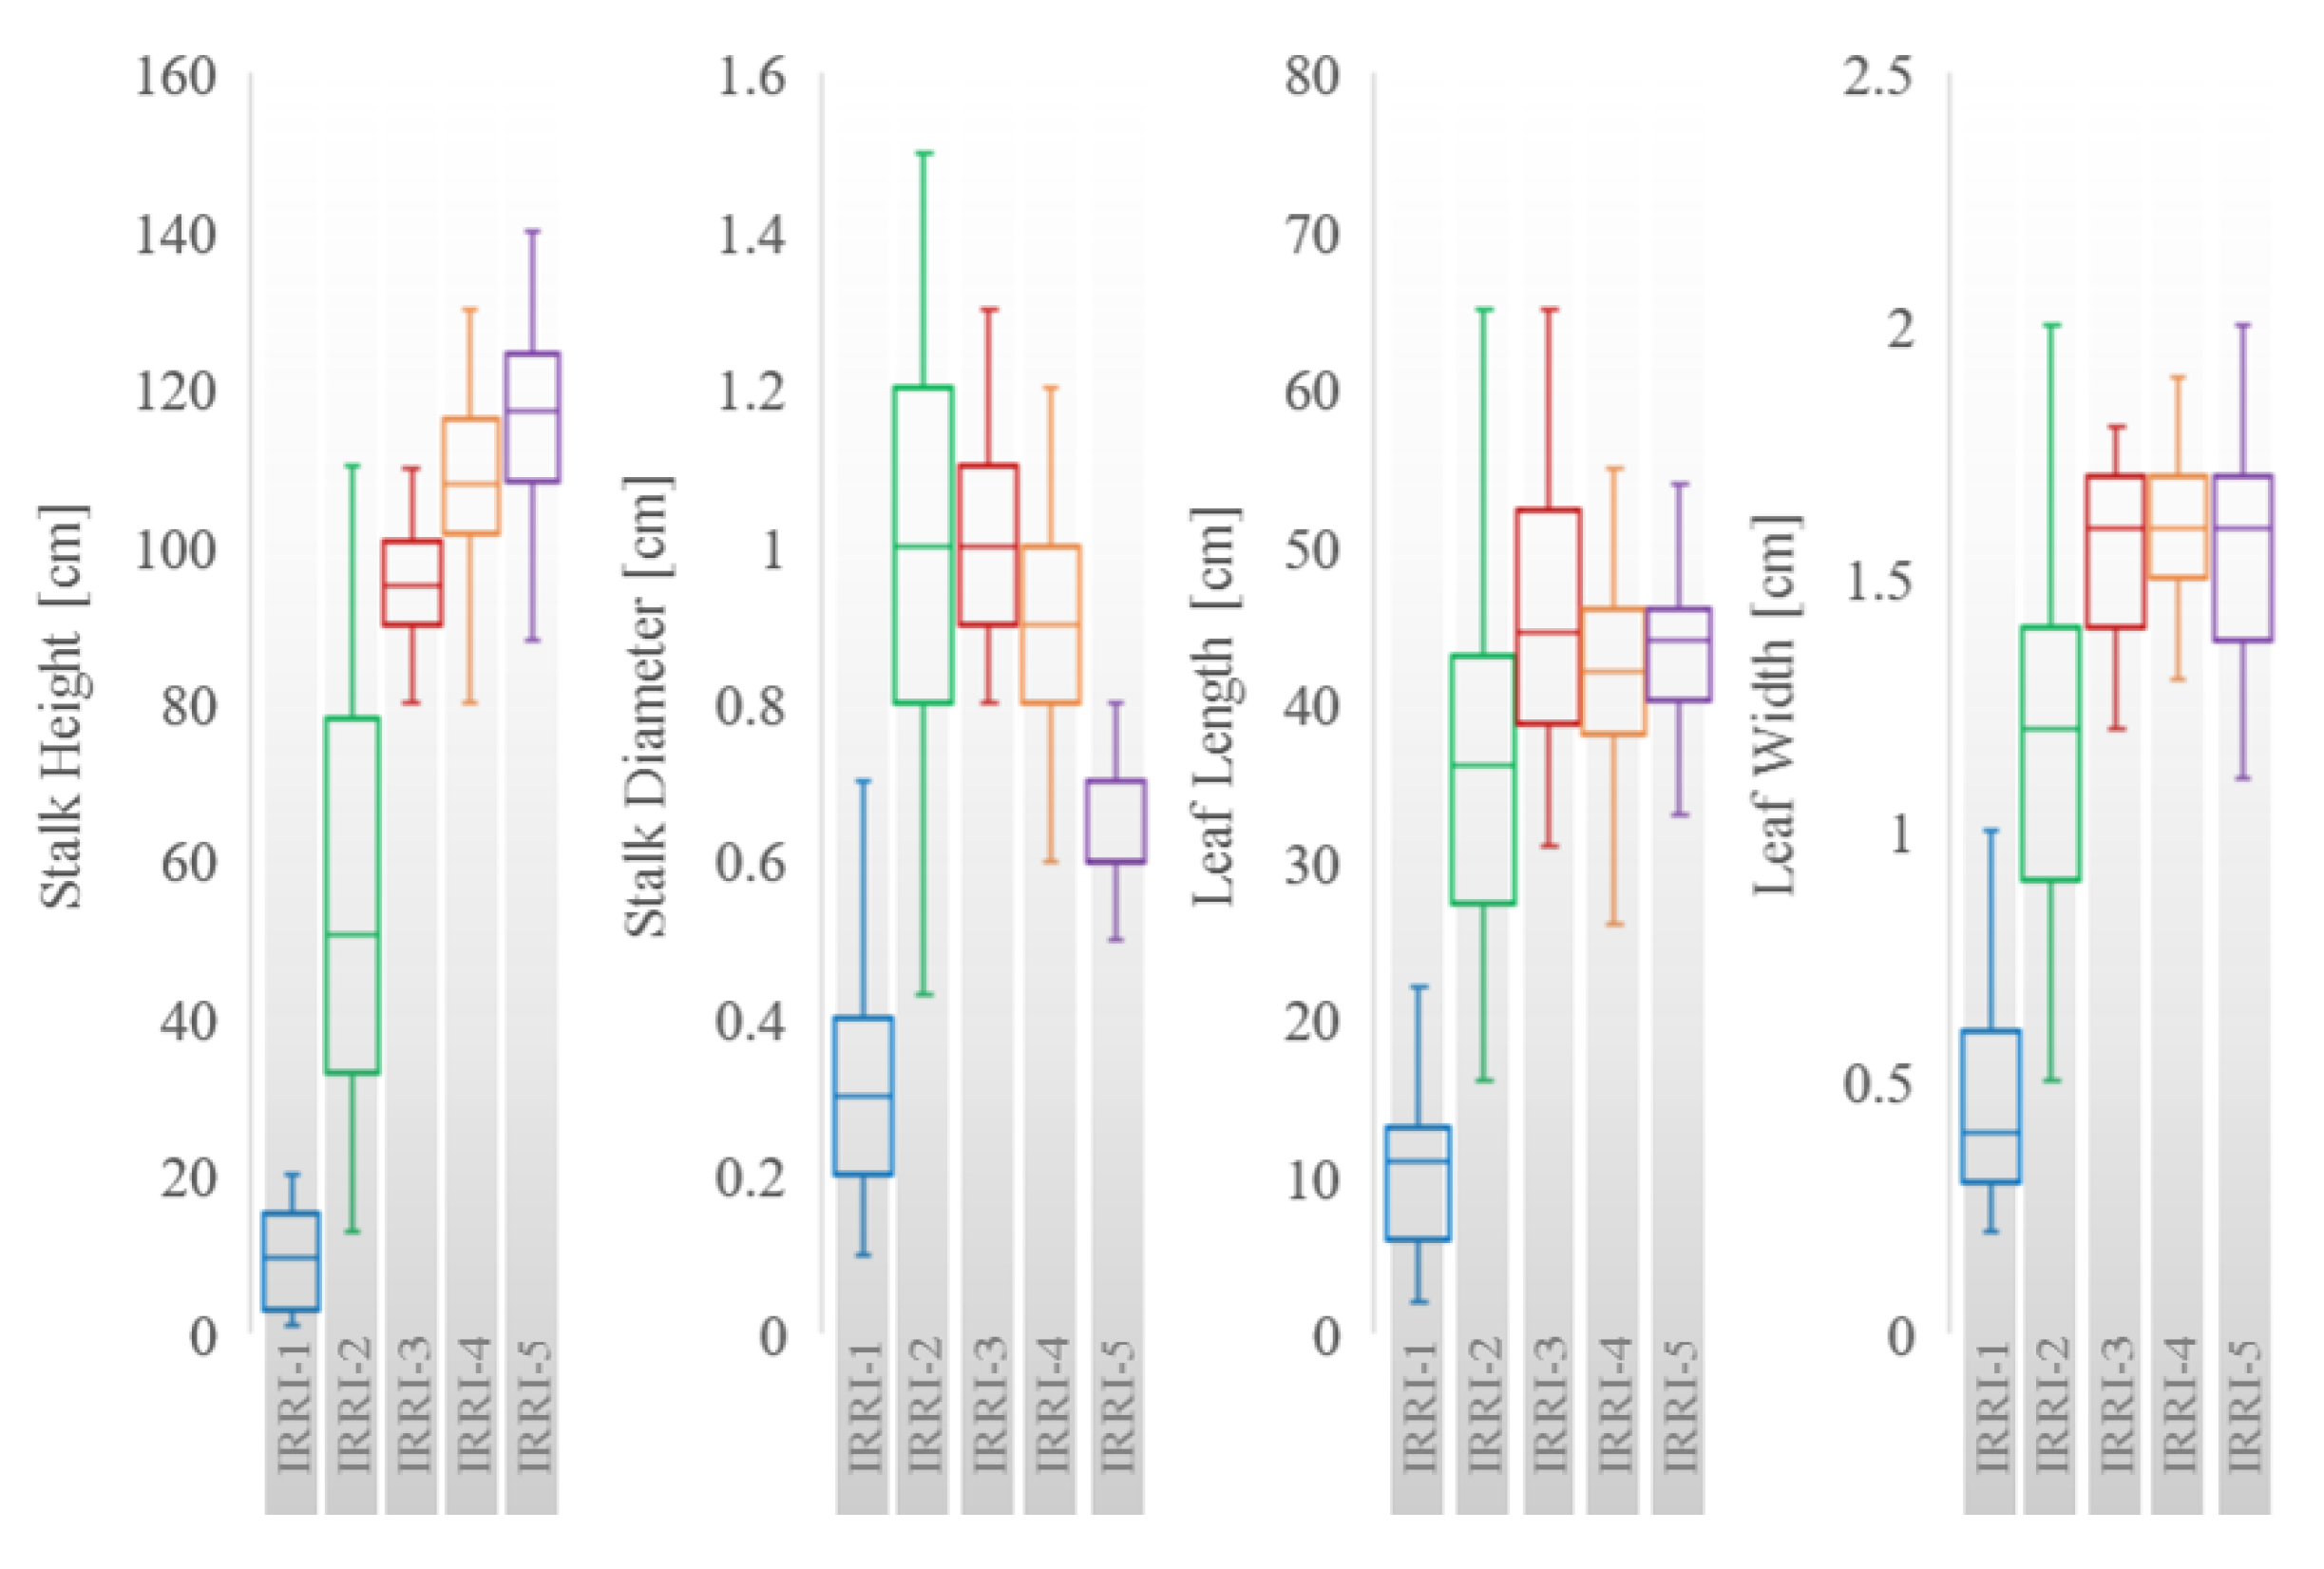
As shown in Figure 4, field campaigns were conducted ±5 days of SAR acquisitions to have representative rice morphology parameters. In each year, the test fields were selected by the expertise of the TARI researchers. To monitor the evolution of the morphology parameters, at each field following parameters were measured: above water stalk height, stalk diameter, leaf length, leaf width, the number of plants per m2, the number of tillers per plant, and the number of leaves per tiller. In Figure 3 the evolution of some morphology parameters is depicted for each IRRI phase using a box-whisker plot. For each parameter, a quasi-linear increase is observed until IRRI-3. From IRRI-3 on, a decrease is noticed in the stalk diameter due to reduced water content.
3.2. SAR Data
During the study, the Ipsala test site is monitored with the data acquired from the TerraSAR-X satellite with an average incidence angle of 31°. The TerraSAR-X satellite has the central frequency of 9.65 GHz and temporal resolution of 11 days. The acquisition dates are given in Figure 4. The data were delivered in single look complex format and were spatially and temporally co-registered by bilinear interpolation.
4. Results and Discussion
In this section, we present the stochastic inversion results of the same metamodel for the estimation of stalk height, leaf length and leaf width parameters from X-band co-polar SAR data on a dataset spanned over three cultivation periods. For the analysis, the noise in the TerraSAR-X data was reduced using 13 × 13 boxcar smoothing windows, resulting in 33 m × 25 m spatial resolution. The estimation accuracies of the chosen parameters are evaluated based on their correlation against the ground measured values. The results are reported with their coefficient of determination (R2) and the root-mean-square error (RMSE) values.
Table 1 provides the input parameters for the metamodel evolutions that were assumed constant. The details of the EM model, its metamodel, their simulation accuracies and growth phase based global sensitivity analysis results of the metamodel are provided in [12].
The chosen EM model and the proposed stochastic inversion approach consider the simplified plant morphology. As observed in Figure 3, the evolution of chosen morphological parameters are related to each other. In the proposed method these morphology based relations provide the base of the optimization constraints. As the stochastic inversion algorithm provides multi-dimensional parameter distributions, the mean values of the estimations are used for the calculation of R2 and RMSE values.
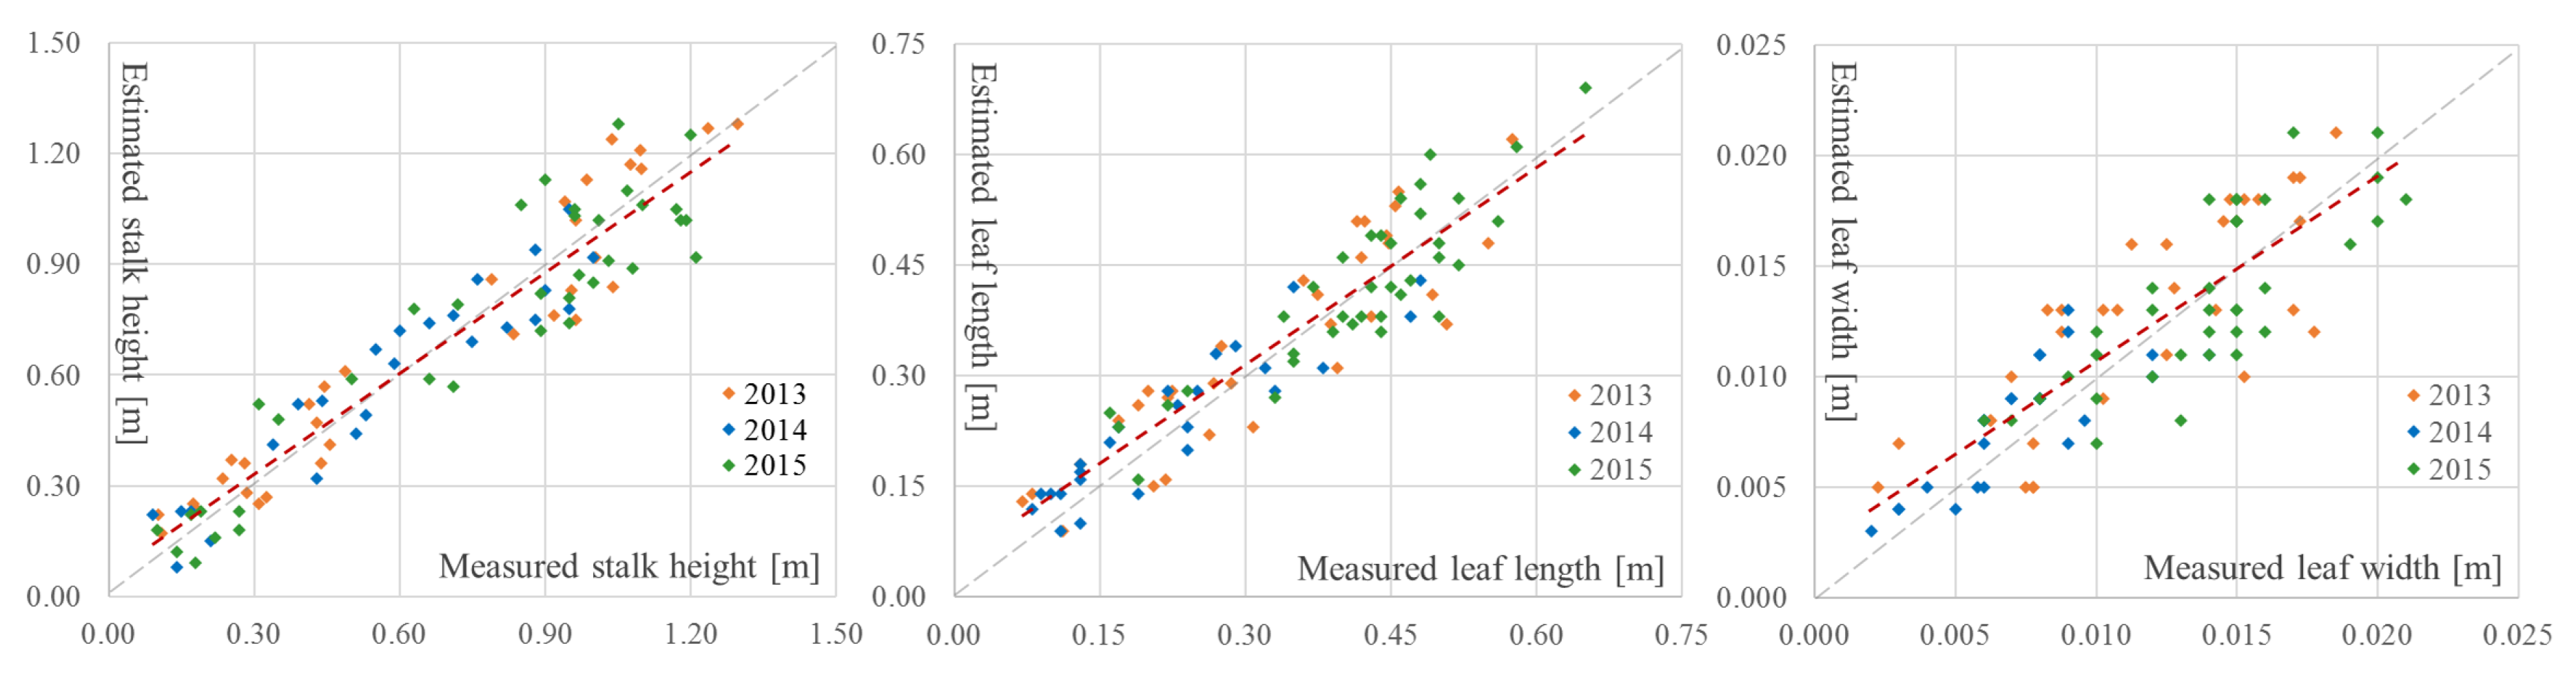
The stochastic inversion results for stalk height, leaf length, and leaf width parameters are presented in Figure 5 and Table 2. The R2 and RMSE were calculated against the estimated biophysical parameters are given for the cultivation periods from 2013 to 2015. The accuracy analyses were conducted using a total number of 93 different σo values (32 from 2013, 25 from 2014, and 36 from 2015) measured from different fields having different morphologies, agricultural practices and environmental conditions.
The global sensitivity analysis of the metamodel was previously discussed in [12]. The analysis results emphasize the importance of stalk height, leaf length and structural density parameters (number of plant components in a unit area) throughout the growth cycle. The following deductions can be made from the stochastic inversion results.
Stalk Height estimations had the highest accuracy (R2 ≥ 0.86) considering the entire dataset of three cultivation periods. As presented in Figure 5, the stalk height estimation results are slightly over-estimated for rice canopies shorter than 0.6 m and under-estimated for the taller canopies. The performance of the algorithm for the 2015 dataset was calculated to be lower compared to the other years with an RMSE value of 13.5 cm. This situation can be related to the variance of the σo values and the metamodel simulations for the corresponding morphology parameter ranges in the parameter space. On the other hand, the estimation bias between the measured and estimated values shows an increasing spread with increasing stalk height. The variation in the bias can be interpreted by the presence of plants with varying physical structures and similar backscattering behaviors at later phases of the growth cycle. The RMSE values were calculated to be less than 13.5 cm, which are acceptable for the stalk height estimations calculated from copolar SAR data.
Leaf Length estimation accuracy is calculated to be lower than the stalk height estimation accuracy for the dataset of three cultivation periods. As shown in Figure 5, the leaf lengths are mainly over-estimated when they are shorter than 50 cm and under-estimated when they become longer. The stochastic inversion results of the metamodel shows highly accurate results (R2 ≥ 0.78 and RMSE ≤ 7 cm) for the evaluations from the complete dataset. From three different years, the lowest accuracy was obtained from the data acquired during 2015, as it was observed for the stalk height. Regarding the estimation bias, it is noted that the errors tend to increase with increasing leaf length. Similar to the interpretation provided for stalk height estimations, the increasing error with increasing leaf length can be explained by the presence of higher variance in the parameter space at later growth phases.
Leaf Width is morphologically related to the leaf length due to natural growth limitations. The accuracy analysis on leaf width estimations presented acceptable values with R2 values higher than 0.61 and RMSE values lower than 3 mm. Similar to stalk height and leaf length parameters, the lowest accuracy was again obtained from the copolar SAR measurements of 2015. The estimation bias of the analysis is observed to vary between ±5 mm for the complete growth cycles of three years.
The stochastic inversion of the metamodel provided successful estimations for stalk height and leaf length parameters for the cultivation periods of three years. However, from the chosen rice morphology parameters, leaf width estimations had lower accuracies with higher relative RMSE values. This situation is supported by the global sensitivity analysis results, which states the importance of stalk height and leaf length parameters on the metamodel simulations, while mentions the lower effect of the leaf width [12].
The accuracy analysis exhibited in this study combines 93 different rice plant morphology and SAR measurements collected from the cultivation periods of 2013 to 2015. Concerning the presence of various environmental factors and agricultural practices, the results are considered to be representative for the wet-cultivated and broadcast seeded rice fields that are located in Ipsala (Turkey). Therefore, the results are encouraging for the development of new management practices, which can use the estimated morphology parameters to interpret the yield and the detailed growth stage.
5. Overview and Summary
In this research, a stochastic inversion method has been presented to invert a multi-dimensional metamodel, trained from an EM model [11]. Apart from the previous studies that focuses on the estimation of the stalk height, this study extends the estimations to the stalk height, leaf length and leaf width parameters of rice plants by considering the natural growth limitations. This study was conducted over three cultivation cycles for validation purposes.
We have tested the proposed inversion algorithm on a three-year cultivation period of ground, and copolar high spatial resolution and high frequency SAR datasets. The data were acquired by TerraSAR-X over broadcast seeded and flooded rice fields. For method validation we trained the metamodel by employing the EM model [11], ground measurements and field average SAR backscattering intensities.
As a result, we obtained significant correlations between the estimated and measured values of stalk height, leaf length and leaf width parameters using the proposed metamodel inversion scheme. From the analysis, we calculated RMSE values less than 13.5 cm for stalk height, 6.9 cm for leaf length and 34 mm for leaf width parameters. The results pointed out that the use of spaceborne X-band PolSAR data is powerful for the development of new agriculture monitoring practices. We should mention that the overall performance of the proposed approach mainly relies on the accuracy of the EM model and the metamodel, which shows the importance of EM model selection.
The presented algorithm has presented several advantages such as coupling the agronomical growth rules with the EM models for efficiency, inversion with stochastic optimization to handle environmental variability and most importantly being computationally efficient with the use of metamodels that are trained for once. In the presented study, the requirement of a priori knowledge of the growth phase and plant morphology information can be seen as a disadvantage. However, considering the importance of rice as the main source or food and income for several highly populated countries, related information can be found in the crop databases. Besides, the literature currently covers several different methodologies to determine the growth phase of rice plants [3,18,19].
In the future, our studies are going forward to improve the approach by substituting the a priori growth phase information with canopy height estimations that can be directly calculated from Pol-InSAR data. In addition, it is planned to extend the applicability of the inversion procedure to monitor other major crops.
Acknowledgments
This work has been supported by the Scientific and Technological Research Council of Turkey (TUBITAK) under Project 113Y446 and by the German Aerospace Center (DLR) under project XTILAND1476. Besides, the authors would like to thank for the support of Dr. Stefano Marelli and Prof. Dr. Bruno Sudret from the Chair of Risk, Safety & Uncertainty Quantification from ETH Zurich in setting up and providing help with the Polynomial Chaos Expansion metamodel and to the Directorate of Trakya Agricultural Research Institute with the ground campaigns.
Author Contributions
O.Y. developed and implemented the proposed inversion methodology, interpreted the results, wrote and revised the paper; E.E. supervised the work, contributed to the underlying ideas as well as to the interpretation and discussion of the results and revised the paper; I.H. supervised the work, contributed to the underlying ideas and revised the paper.
Conflicts of Interest
The authors declare no conflict of interest.
References
- Mulla, D.J. Twenty five years of remote sensing in precision agriculture: Key advances and remaining knowledge gaps. Biosyst. Eng. 2013, 114, 358–371. [Google Scholar] [CrossRef]
- Inoue, Y.; Kurosu, T.; Maeno, H.; Uratsuka, S.; Kozu, T.; Dabrowska-Zielinska, K.; Qi, J. Season-long daily measurements of multifrequency (Ka, Ku, X, C, and L) and full-polarization backscatter signatures over paddy rice field and their relationship with biological variables. Remote Sens. Environ. 2002, 81, 194–204. [Google Scholar] [CrossRef]
- Lopez-Sanchez, J.M.; Cloude, S.R.; Ballester-Berman, J.D. Rice Phenology Monitoring by Means of SAR Polarimetry at X-Band. IEEE Trans. Geosci. Remote Sens. 2012, 50, 2695–2709. [Google Scholar] [CrossRef]
- Erten, E.; Rossi, C.; Yuzugullu, O. Polarization Impact in TanDEM-X Data over Vertical-Oriented Vegetation: The Paddy-Rice Case Study. IEEE Geosci. Remote Sens. Lett. 2015, 12, 1501–1505. [Google Scholar] [CrossRef]
- Erten, E.; Lopez-Sanchez, J.M.; Yuzugullu, O.; Hajnsek, I. Retrieval of agricultural crop height from space: A comparison of SAR techniques. Remote Sens. Environ. 2017, 187, 130–144. [Google Scholar] [CrossRef]
- Ballester-Berman, J.; Lopez-Sanchez, J.; Fortuny-Guasch, J. Retrieval of biophysical parameters of agricultural crops using polarimetric SAR interferometry. IEEE Trans. Geosci. Remote Sens. 2005, 43, 683–694. [Google Scholar] [CrossRef]
- Lopez-Sanchez, J.M.; Vicente-Guijalba, F.; Erten, E.; Campos-Taberner, M.; Garcia-Haro, F.J. Retrieval of vegetation height in rice fields using polarimetric SAR interferometry with TanDEM-X data. Remote Sens. Environ. 2017, 192, 30–44. [Google Scholar] [CrossRef]
- Zhang, Y.; Liu, X.; Su, S.; Wang, C. Retrieving canopy height and density of paddy rice from Radarsat-2 images with a canopy scattering model. Int. J. Appl. Earth Obs. Geoinf. 2014, 28, 170–180. [Google Scholar] [CrossRef]
- Yuzugullu, O.; Erten, E.; Hajnsek, I. Estimation of Rice Crop Height From X- and C-Band PolSAR by Metamodel-Based Optimization. IEEE J. Sel. Top. Appl. Earth Obs. Remote Sens. 2017, 10, 194–204. [Google Scholar] [CrossRef]
- Yuzugullu, O.; Marelli, S.; Erten, E.; Sudret, B.; Hajnsek, I. Determining Rice Growth Stage with X-Band SAR: A Metamodel Based Inversion. Remote Sens. 2017, 9, 460. [Google Scholar] [CrossRef]
- Toan, T.L.; Ribbes, F.; Wang, L.F.; Floury, N.; Ding, K.H.; Kong, J.A.; Fujita, M.; Kurosu, T. Rice crop mapping and monitoring using ERS-1 data based on experiment and modeling results. IEEE Trans. Geosci. Remote Sens. 1997, 35, 41–56. [Google Scholar] [CrossRef]
- Yuzugullu, O.; Marelli, S.; Erten, E.; Sudret, B.; Hajnsek, I. Global sensitivity analysis of a morphology based electromagnetic scattering model. In Proceedings of the 2015 IEEE International Geoscience and Remote Sensing Symposium (IGARSS), Milan, Italy, 26–31 July 2015; Institute of Electrical and Electronics Engineers (IEEE): Piscataway, NJ, USA, 2015. [Google Scholar]
- Blatman, G.; Sudret, B. Efficient computation of global sensitivity indices using sparse polynomial chaos expansions. Reliab. Eng. Syst. Saf. 2010, 95, 1216–1229. [Google Scholar] [CrossRef]
- Sudret, B. Global sensitivity analysis using polynomial chaos expansions. Reliab. Eng. Syst. Saf. 2008, 93, 964–979. [Google Scholar] [CrossRef]
- Marelli, S.; Sudret, B. UQLab User Manual-Polynomial Chaos Expansion; Technical Report, Report-UQLab-V0.9-104; Chair of Risk, Safety & Uncertainty Quantification, ETH Zurich: Zurich, Switzerland, 2015. [Google Scholar]
- Eberhart, R.; Kennedy, J. A new optimizer using particle swarm theory. In Proceedings of the Sixth International Symposium on Micro Machine and Human Science, Nagoya City, Japan, 4–6 October 1995; Institute of Electrical and Electronics Engineers (IEEE): Piscataway, NJ, USA, 1995. [Google Scholar]
- GRiSP (Global Rice Science Partnership). Rice Almanac, 4th ed.; International Rice Research Institute: Los Banos, Philippines, 2011. [Google Scholar]
- Vicente-Guijalba, F.; Martinez-Marin, T.; Lopez-Sanchez, J.M. Crop Phenology Estimation Using a Multitemporal Model and a Kalman Filtering Strategy. IEEE Geosci. Remote Sens. Lett. 2014, 11, 1081–1085. [Google Scholar] [CrossRef]
- Yuzugullu, O.; Erten, E.; Hajnsek, I. Rice Growth Monitoring by Means of X-Band Co-polar SAR: Feature Clustering and BBCH Scale. IEEE Geosci. Remote Sens. Lett. 2015, 12, 1218–1222. [Google Scholar] [CrossRef]
Figure 1.
Block-diagram of the proposed stochastic inversion of metamodel-driven electromagnetic scattering (EM) model.
Figure 1.
Block-diagram of the proposed stochastic inversion of metamodel-driven electromagnetic scattering (EM) model.
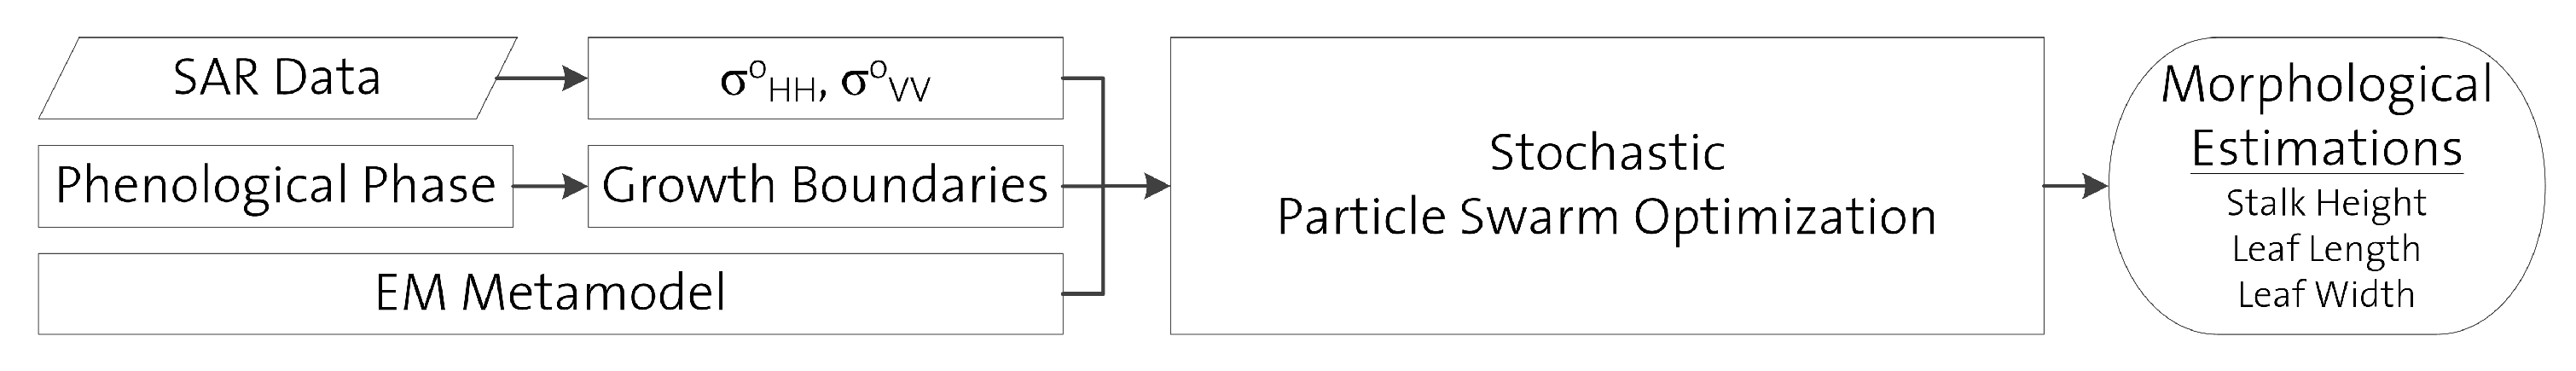
Figure 2.
The four different scattering mechanisms considered within the EM model [11]. : Direct scattering from the scatterers, : Scattering from the canopy followed by reflection from the ground, : Reflection from the ground followed by scattering from the canopy, : Reflection from the ground followed by scattering from the canopy and followed by reflection from the ground.

Figure 3.
Temporal variations of the rice crop biophysical collected between 2013–2015 from the regularly conducted ground campaigns in Ipsala (Turkey). Due to technical limitations, stalk diameter data was not measured in 2015. The measurements are grouped according to the IRRI growth phases as a Box-and-Whisker plot. Box presents the information for the quartiles while the whiskers present minimum and maximum values for IRRI growth stages IRRI-1 [Early vegetative], IRRI-2 [Late vegetative], IRRI-3 [Early reproductive], IRRI-4 [Late reproductive], IRRI-5 [Maturative].

Figure 4.
The ground and Synthetic Aperture Radar (SAR) data collection dates for the cultivation period between 2013 and 2015. On the right side, the VV channel PolSAR intensity image is also provided from the 30 June 2013. In the image, rice fields can be detected with their higher backscattering intensities.
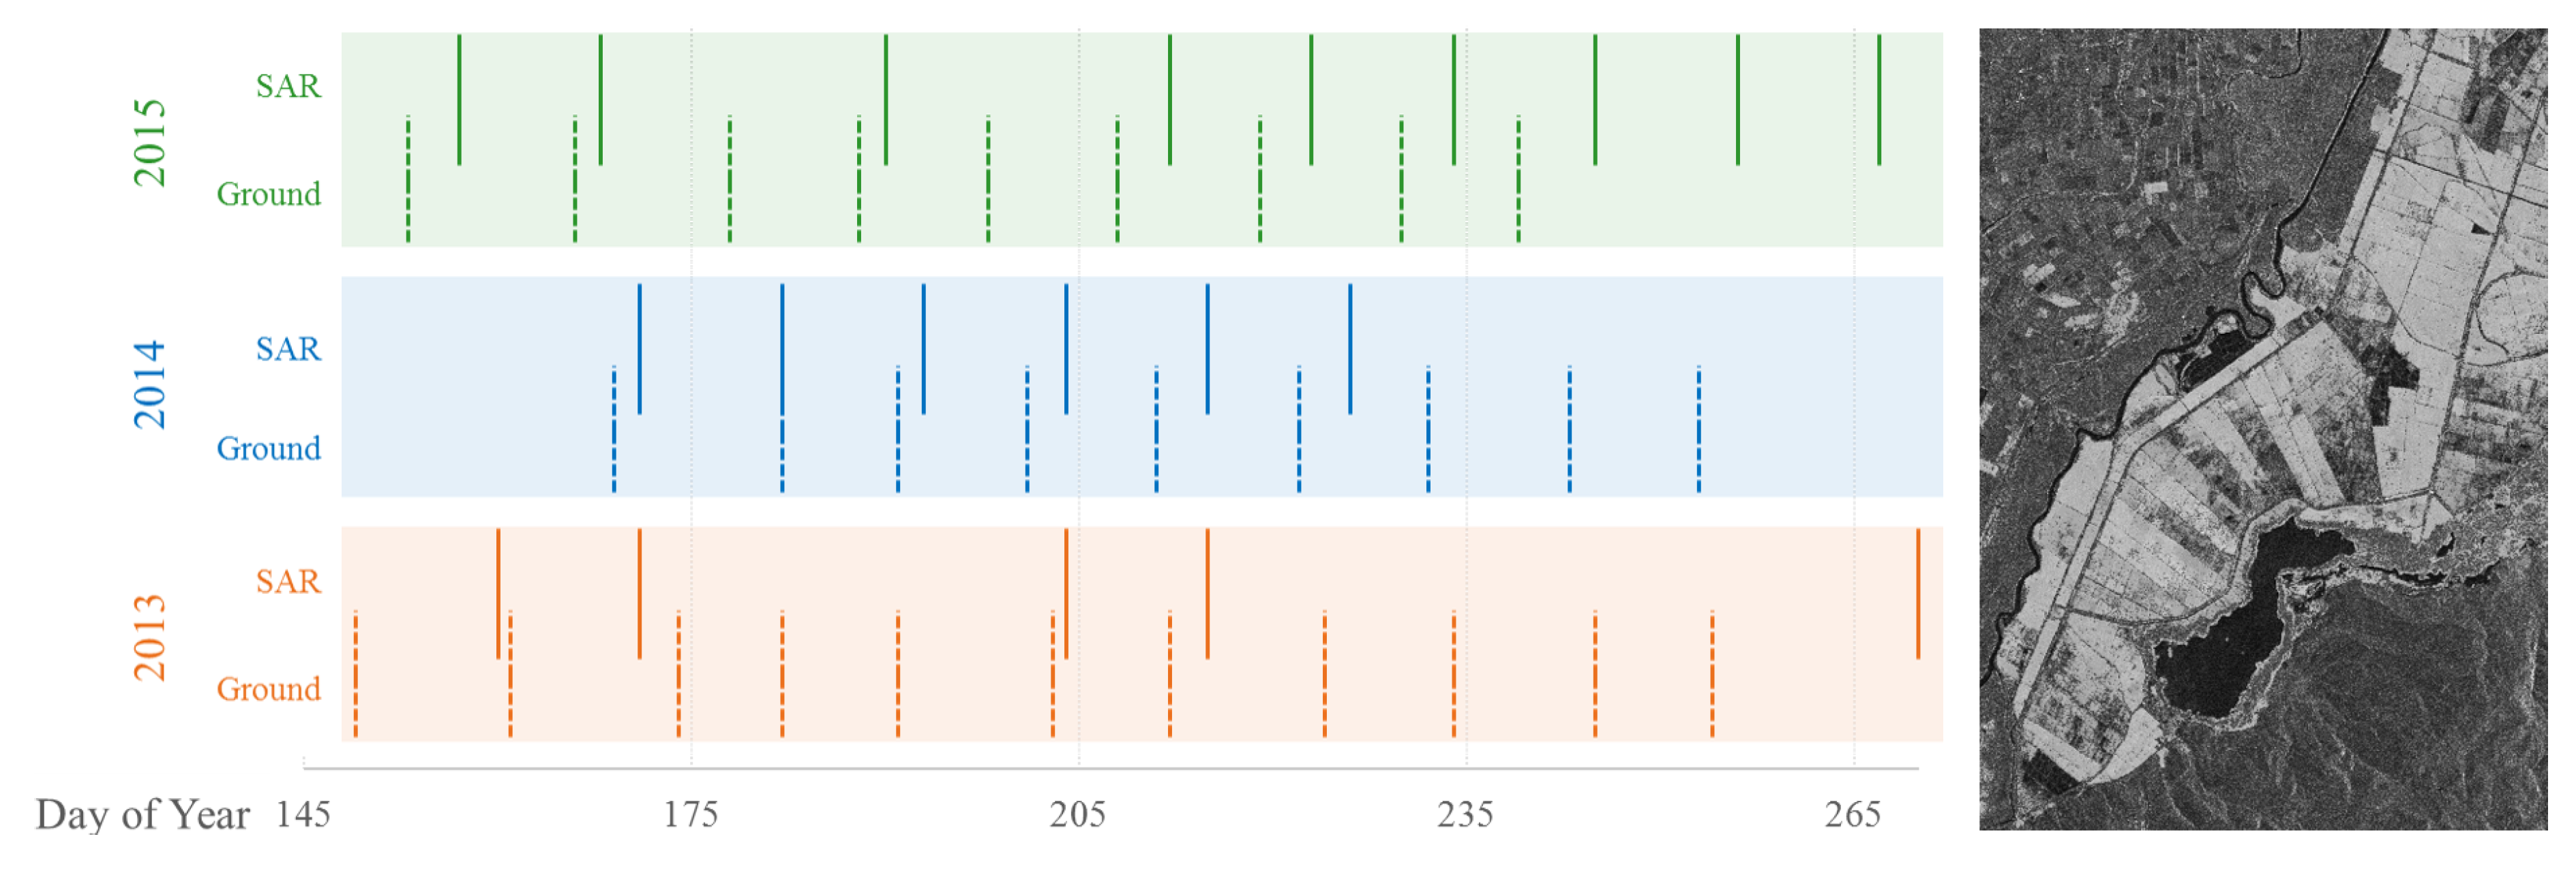
Figure 5.
The measured values of stalk height, leaf length and leaf width parameters versus their estimations given in a correlation scatter plot for years 2013 to 2015 with a reference line. Symbols are colored with respect to the year: 2013 (◆), 2014 (◆) and 2015 (◆).
Figure 5.
The measured values of stalk height, leaf length and leaf width parameters versus their estimations given in a correlation scatter plot for years 2013 to 2015 with a reference line. Symbols are colored with respect to the year: 2013 (◆), 2014 (◆) and 2015 (◆).

Table 1.
Input parameters that are assumed constant during the EM model and metamodel simulations.
| Parameter | Value |
|---|---|
| Central frequency | 9.65 GHz |
| Dielectric constant () | 25 + 8 j |
| Dielectric constant () | 70 + 20 j |
| Average incidence angle (θ) | 31° |
| Distance to target | 514 km |
| Illuminated area x-size | 2.58 m |
| Illuminated area y-size | 1.79 m |
| Number of MC iterations | 200 |
Table 2.
Accuracy analysis of the stochastic inversion of metamodel given with the calculated R2 and root-mean-square error (RMSE) values for the years 2013, 2014, 2015 and the complete dataset.
Table 2.
Accuracy analysis of the stochastic inversion of metamodel given with the calculated R2 and root-mean-square error (RMSE) values for the years 2013, 2014, 2015 and the complete dataset.
| Stalk Height | Leaf Length | Leaf Width | ||||
|---|---|---|---|---|---|---|
| R2 | RMSE | R2 | RMSE | R2 | RMSE | |
| 2013 | 0.921 | 0.108 | 0.804 | 0.069 | 0.646 | 0.003 |
| 2014 | 0.891 | 0.092 | 0.831 | 0.048 | 0.628 | 0.002 |
| 2015 | 0.868 | 0.135 | 0.776 | 0.055 | 0.613 | 0.003 |
| Complete | 0.894 | 0.116 | 0.848 | 0.057 | 0.717 | 0.003 |
© 2017 by the authors. Licensee MDPI, Basel, Switzerland. This article is an open access article distributed under the terms and conditions of the Creative Commons Attribution (CC BY) license (http://creativecommons.org/licenses/by/4.0/).
Share and Cite
MDPI and ACS Style
Yuzugullu, O.; Erten, E.; Hajnsek, I. A Multi-Year Study on Rice Morphological Parameter Estimation with X-Band Polsar Data. Appl. Sci. 2017, 7, 602. https://doi.org/10.3390/app7060602
AMA Style
Yuzugullu O, Erten E, Hajnsek I. A Multi-Year Study on Rice Morphological Parameter Estimation with X-Band Polsar Data. Applied Sciences. 2017; 7(6):602. https://doi.org/10.3390/app7060602
Chicago/Turabian StyleYuzugullu, Onur, Esra Erten, and Irena Hajnsek. 2017. "A Multi-Year Study on Rice Morphological Parameter Estimation with X-Band Polsar Data" Applied Sciences 7, no. 6: 602. https://doi.org/10.3390/app7060602
Note that from the first issue of 2016, this journal uses article numbers instead of page numbers. See further details here.