
Fractal Prediction of Grouting Volume for Treating Karst Caverns along a Shield Tunneling Alignment
by
 ,
,
Wen-Chieh Cheng
1,2, 
Qing-Long Cui
1,2,3, 
Jack Shui-Long Shen
1,2,4,*,
Arul Arulrajah
4 and
Da-Jun Yuan
5 1
State Key Laboratory of Ocean Engineering, Shanghai Jiao Tong University, Shanghai 200240, China
2
Collaborative Innovation Center for Advanced Ship and Deep-Sea Exploration (CISSE), Shanghai Jiao Tong University, Shanghai 200240, China
3
China Communications Construction Company Second Highway Consultants Co. Ltd., Wuhan 430056, China
4
Department of Civil and Construction Engineering, Swinburne University of Technology, Hawthorn 3122, Australia
5
School of Civil Engineering, Beijing Jiao Tong University, Beijing 100044, China
*
Author to whom correspondence should be addressed.
Appl. Sci. 2017, 7(7), 652; https://doi.org/10.3390/app7070652
Submission received: 8 May 2017
/
Revised: 1 June 2017
/
Accepted: 8 June 2017
/
Published: 25 June 2017
Abstract
:Karst geology is common in China, and buried karst formations are widely distributed in Guangdong province. In the process of shield tunneling, the abundant water resources present in karst caverns could lead to the potential for high water ingress, and a subsequent in situ stress change-induced stratum collapse. The development and distribution of karst caverns should therefore be identified and investigated prior to shield tunnel construction. Grouting is an efficient measure to stabilize karst caverns. The total volume of karst caverns along the shield tunneling alignment, and its relationship with the required volume of grouts, should be evaluated in the preliminary design phase. Conventionally, the total volume of karst caverns is empirically estimated based on limited geological drilling hole data; however, accurate results are rarely obtained. This study investigates the hydrogeology and engineering geology of Guangzhou, the capital of Guangdong province, and determines the fractal characteristics of the karst caverns along the tunnel section of Guangzhou metro line no. 9. The karst grouting coefficients (VR) were found to vary from 0.11 in the case of inadequate drilling holes to 1.1 in the case where adequate drilling holes are provided. A grouting design guideline was furthermore developed in this study for future projects in karst areas.
1. Introduction
Shield tunneling has been extensively used in the construction of underground infrastructures under various geological conditions with a high groundwater level and gassy conditions [1,2,3,4,5,6]. In China, there are a total of 41 cities including Beijing, Shanghai, Guangzhou, and Shenzhen with metro tunnels currently in operation or under construction. Three types of strata are frequently encountered during shield tunneling: soft soils (clay, silt, and sand); sand and gravels; and mixed ground (karst and variably weathered granite) [7,8,9,10,11,12,13,14,15,16,17,18,19,20]. In spite of several studies on shield tunneling in karst geology, many problems are still encountered which impact the construction of metros. Furthermore, the treatment of karst caverns remains one of the most challenging engineering construction problems in shield tunneling projects. The formation of a karst system [21] exerts a huge impact on the features of both the surface and the subterranean environments, and has a long duration. Furthermore, a karst system can be of hundreds of kilometers in length. A recent case history of a metro system’s construction in Nanjing, China, indicated that excessive volumes of grout injected during construction resulted in side effects on the urban environment [8]. Due to limited studies on the treatment methods of karst geological formations, there is an urgent need to carry out in-depth research to better understand critical uncertainties during the grouting process (e.g., the grouting parameters and the injected volume of grouts) in grouting and jet grouting construction [22,23,24,25,26,27].
Karst caverns that contain abundant fissure water and have high collapse potential need to be treated prior to tunnel construction. Cui et al. [28] reported that the construction procedure for the treatment of karst caverns included site geological investigation, decision making, the treatment of karst caverns, and an effectiveness verification. Firstly, a preliminary geological investigation is carried out to identify the karst caverns. Secondly, the quantity, location, and filling of the karst caverns is detected to determine whether the karst caverns require treatment. Finally, an unconfined compression test (UCT) or a standard penetration test (SPT) is carried out to verify the effectiveness of the treatment. The factors largely affecting the unconfined compressive strength (UCS) of treated materials have been extensively investigated in previous studies [29,30,31]. Using the empirical formula proposed by Du et al. [29,30], the UCS value of treated materials can be well predicted, and used as an indicator of quality control (QC) and quality assurance (QA) for the treatment of karst caverns.
As a karst cavern is irregularly distributed and has various shapes, it is difficult to evaluate the total volume of karst caverns in the way of shield tunneling. Additionally, there are also fill materials with groundwater in caverns, so that there is no reliable measure to calculate the injected volume of grouts [32,33]. A project’s budget can be further reduced or well managed if the injected volume of grouts can be predicted during the preliminary design stage. To tackle these problems, there is a need to develop a measure to predict the total volume of karst caverns, and establish its relationship with the required volume of grouts. Mandelbrot (1983) [34] developed the fractal theory, which can be utilized to describe the distribution of geotechnical objects that are neither random nor homogeneous. Wang et al. [35] established an estimation method for an ore reserve based on the number–size model. Since fractal theory can handle irregularly distributed karst caverns with various shapes, this may be helpful in predicting the total volume of karst caverns along a shield tunneling alignment [36,37,38,39].
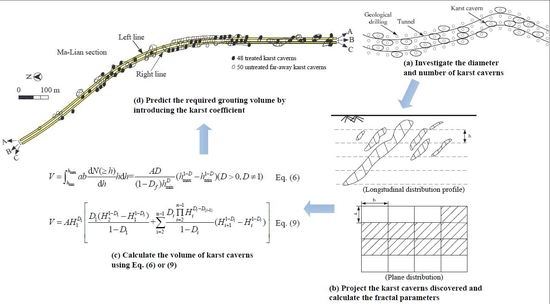
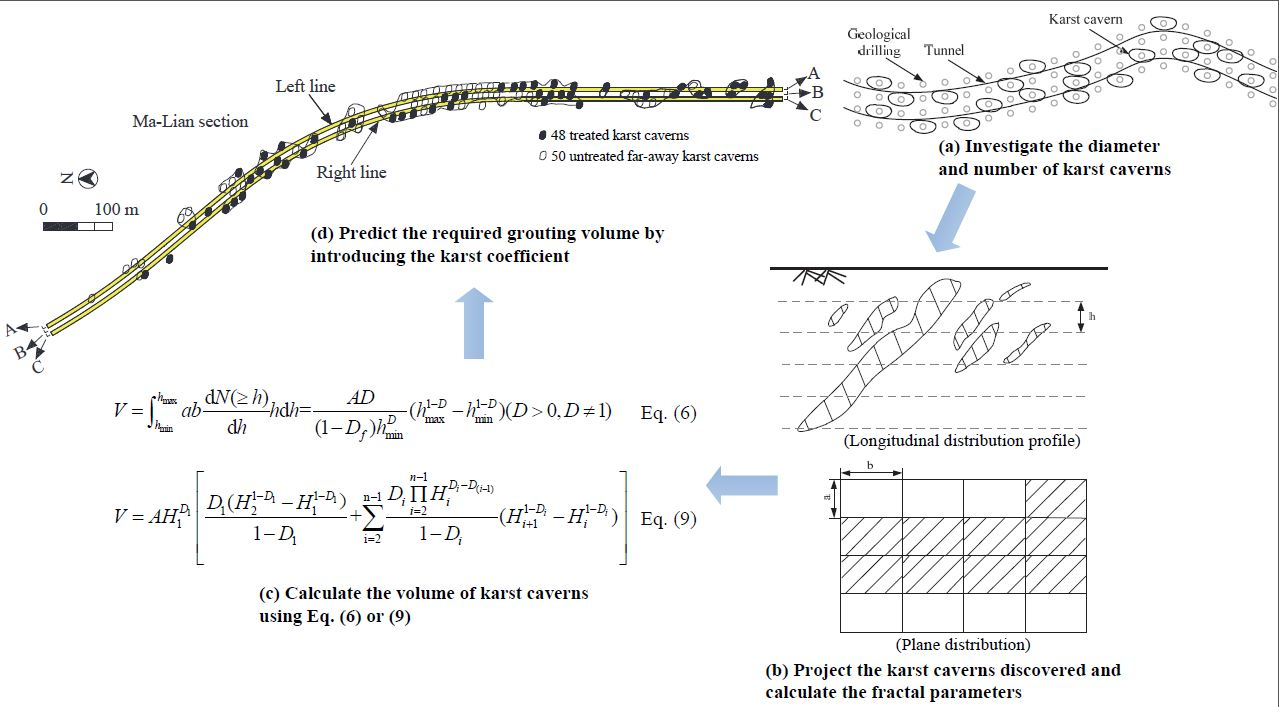
As most karst caverns distributed in Guangzhou are not large, this research study primarily focuses on the treatment of small karst caverns at depths varying from a few metres up to 50 m below the ground surface. The objectives of this study are: (i) to summarize the hydrogeology and engineering geology of Guangzhou; (ii) to investigate the fractal characteristics of karst caverns for the Ma-Lian section of Guangzhou’s metro line no. 9; (iii) to apply the fractal model to the prediction of the total volume of karst caverns along the shield tunneling alignment, and to establish its relationship with the required volume of grouts; and (iv) to verify the proposed grouting volume prediction method through a case study. A workflow to explain how the objectives can be achieved is shown as follows. First, a literature review regarding the hydrogeology and engineering geology of Guangzhou will be carried out. Second, given that the Ma-Lian section can provide an opportunity for implementing a more detailed geological investigation for characterising the karst geology, a total of 98 geological drilling holes will be constructed, to understand the distribution of karst caverns and to examine their characteristics. Third, formulae to predict the grouting volume will be derived based upon the number–size model. Fourth, the 98 geological drilling holes and the further 937 grouting holes will be used to establish three datasets recognising the relationships between the diameter of a karst cavern, and the number of geological drilling holes (or grouting holes). Last, the total volume of karst caverns can thus be calculated, and for future similar projects the grouting volume required for treating the karst caverns can be predicted by introducing the proposed karst grouting coefficient.
2. Methodology
Fractal models are well-established, and have been extensively used to solve engineering problems including but not limited to characterizing the effective stress distribution of unsaturated soils, and the reserve size distribution of ore deposits [40,41]. The number–size model [42,43] is the most often used among the various fractal models, which also include the box counting model [44,45]; the radial density model [46]; the grade–tonnage model [44,47]; the self-affine model [43]; and the multifractal model [48,49]. Wang et al. [35] developed an ore estimation method based on the fractal number-size model. Since the traditional geometric and geo-statistic methods based on linear mathematics are not able to handle the skewed distribution of karst caverns, fractal models that belong to nonlinear mathematics are deemed as effective tools for describing the skewed distribution of geological objects [35,42,43]. The fractal number-size model is extensively applied in different fields, such as ore estimation. In this study, the fractal number-size model is utilized to estimate the total volume of karst caverns in a karst region. The expression of the model is as follows:
where N = number; h = one certain measuring parameter of an object; D = fractal dimension; and C = constant.
Equation (1) can also be rewritten as:
Equation (2) can be considered as a linear equation in a regular lnh (x) − lnN (y) coordinate system with a slope of −D and a horizontal intercept of lnC. If the plots of N and h in a double nature logarithmic coordinate can be fitted into one straight line, the distribution is called a simple fractal. In the case that the plots can be fitted with two straight line segments, the model is called a bifractal. Figure 1a shows a schematic illustration of simple fractal model, while Figure 1b shows an illustration of bifractal model. A simple fractal model has one fractal dimension. A bifractal model has two fractal dimensions, which are the slopes for each straight line segment. The prediction method of the total volume of karst caverns proposed in this study is detailed as follows.
The distribution of karst caverns along the shield tunneling alignment should be investigated prior to excavation. Geological drilling holes are often used to detect and measure karst caverns, provided that the distribution of the geological drilling holes, for which the spacing and penetration depths are to be in accordance with the Guangzhou Metro Design & Research Institute Co., Ltd. (GMDRI) (Guangzhou, China) (2010) [50], along the tunnel alignment is known, as shown in Figure 2a. Then, the distribution of karst caverns and the depth of each karst cavern can be understood, as shown in Figure 2b. Additionally, each installation might have drilled through more than one karst cavern. In this study, the karst caverns penetrated during each installation are still considered one karst cavern. The karst caverns are in fact either empty, or filled with groundwater, sand, or clay. For simplicity, this method does not account for the fillings in the karst caverns.
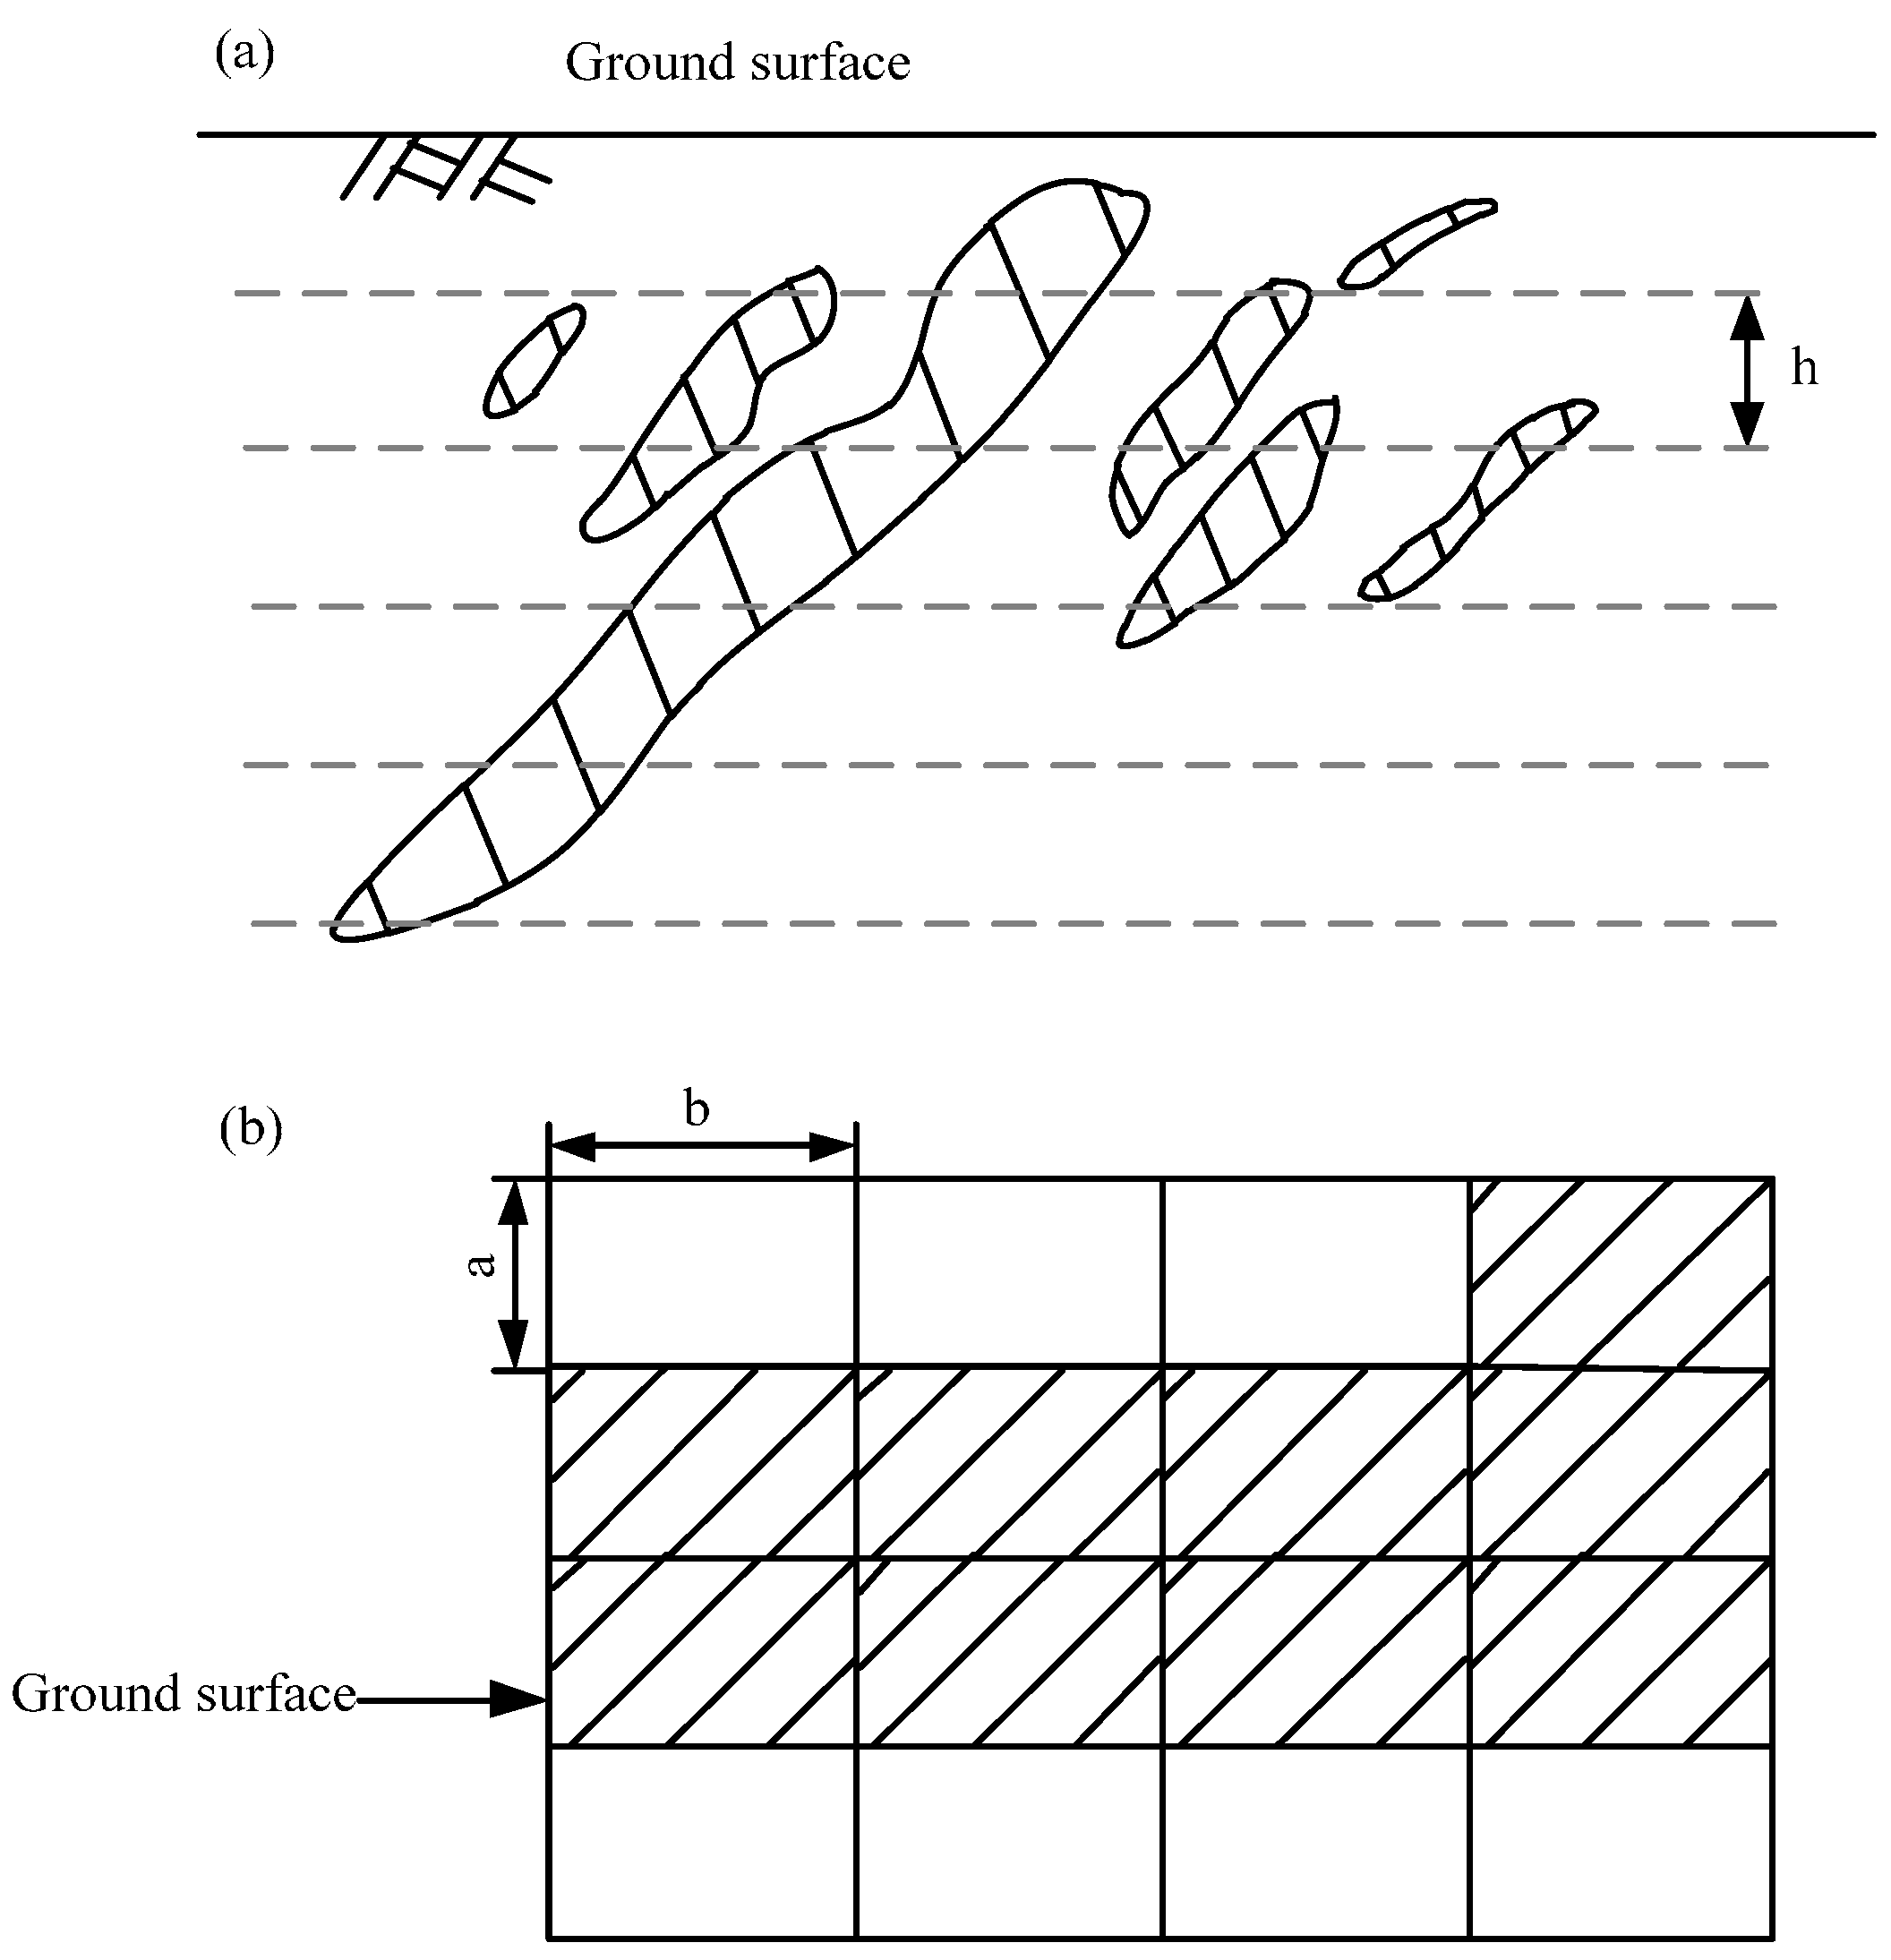
According to the data from the geological drilling holes, the karst caverns can be projected onto the longitudinal (Figure 3a) and ground surface planes (Figure 3b), respectively, thus producing three longitudinal distribution profiles, and one plane distribution of the karst caverns. In the projection, rectangles with a width of b and a height of a, representing the geological drilling holes, are used to overlay the proposed tunnels. The area Ai of each rectangle can be expressed by:
The total area A can be considered as the sum of the areas of all the rectangles, as expressed by Equation (4):
According to the number–size model, the diameter of a karst cavern and the number of geological drilling holes satisfies the following equation.
where h is the diameter of a karst cavern, which is the top level of the karst cavern minus its bottom level; N is the accumulated number of karst caverns, and the maximum of N is the total number of geological drilling holes; C is constant, which equals the number of geological drilling holes when the diameter of the karst cavern is minimal; and D is fractal dimension.
Provided that a and b are small enough, it is expected that the variation of the diameter of a karst cavern is continuous and that the volume of a karst cavern can be calculated by integration.
For a simple fractal model, volumes of karst caverns can be expressed by:
where V is the volume of the karst cavern; hmax is the maximum diameter of the karst cavern; hmin is the minimum diameter of the karst cavern; A is the total area.
For a bifractal model, the volumes of karst caverns become:
where H1 = hmin, which means the minimum diameter of the karst cavern; Hn = hmax, which means the maximum diameter of the karst cavern; and A is the total area of the drilling work.
The process of the estimation of the volume of a karst cavern is described as follows: (1) install a geological drilling hole, and investigate the diameter and number of karst caverns; (2) calculate the fractal parameters of the karst caverns; and (3) calculate the volume of karst caverns using Equation (6) or (9).
To predict the required volume of grouts for treating the karst caverns along the shield tunneling alignment, a karst grouting coefficient (VR), representing the ratio of the injected volume of grouts during treatment (RC) to the calculated total volume of karst caverns (V), is proposed in this study as shown in Equation (10).
where VR is the karst grouting coefficient; RC is the grouting volume recorded; V is the calculated total volume of karst caverns.
3. Hydrogeology and Engineering Geology of Guangzhou
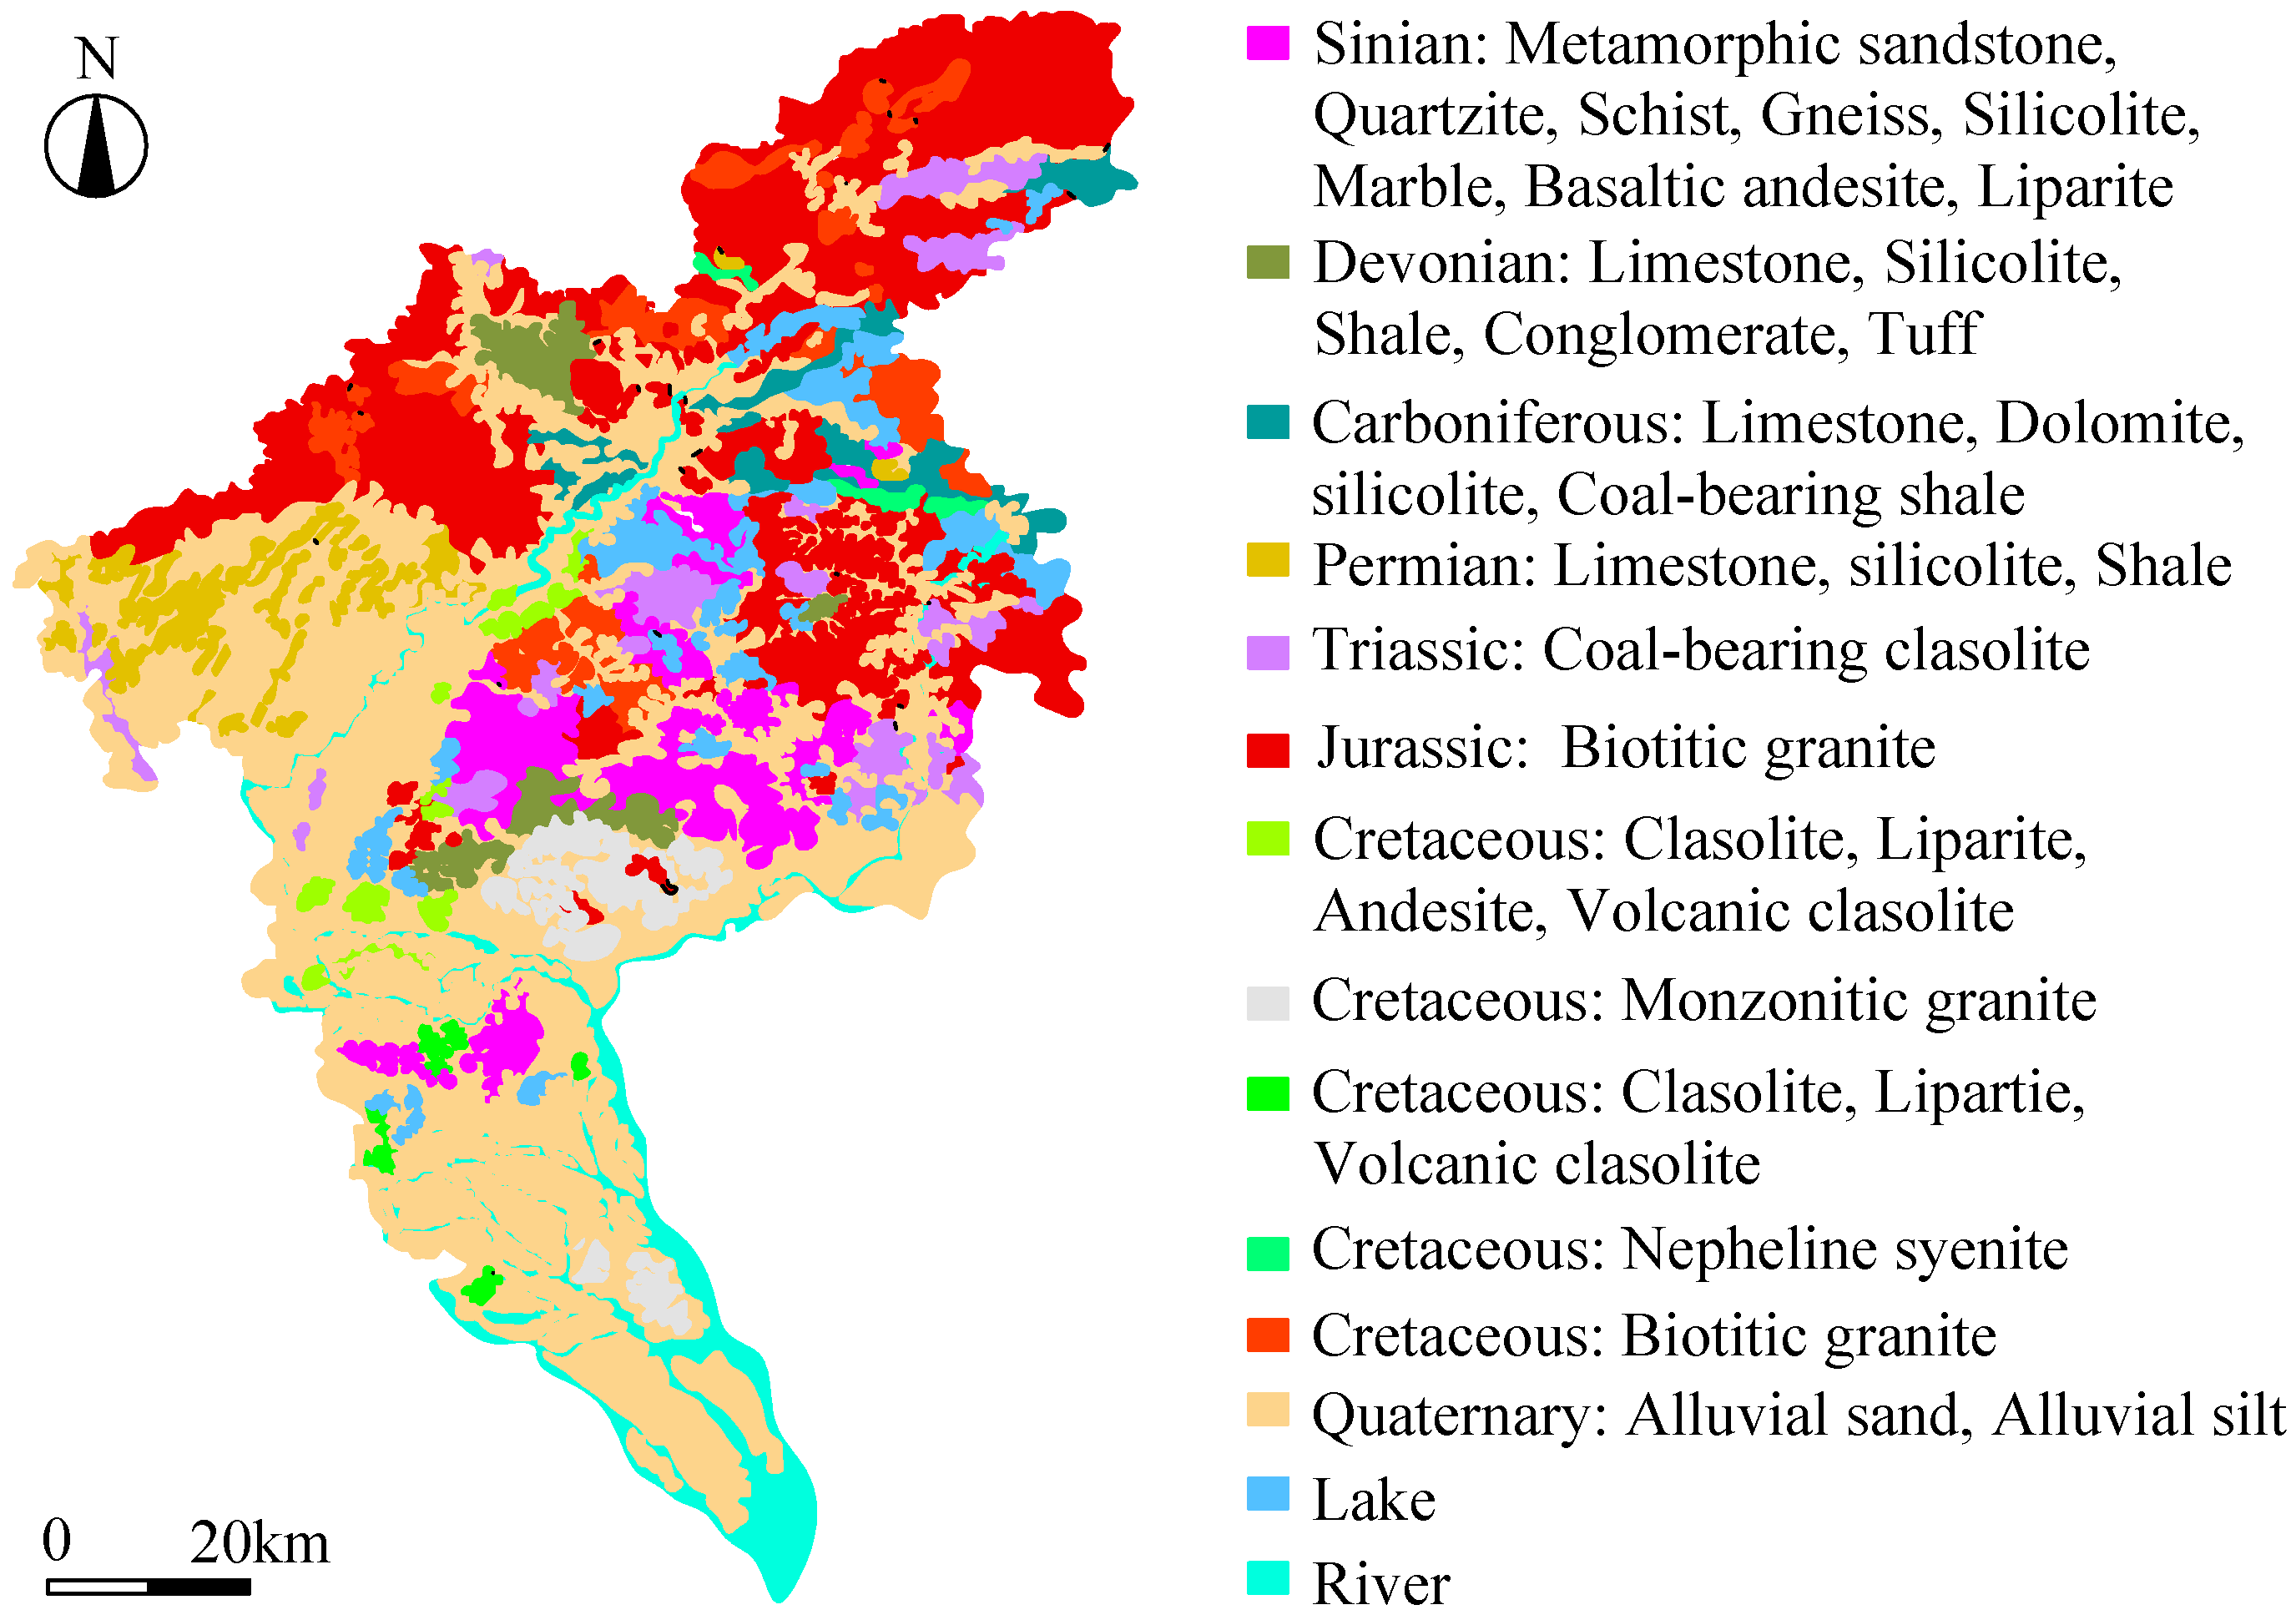
Guangzhou, the capital of Guangdong province, is located in a southeast karst geological formation, where carbonate rocks are widely but not continuously distributed due to the cutting effect of tectonic movement and the intrusion of igneous rocks, with an average thickness varying from 1000 to 4500 m (Figure 4) [51]. The landform in this area is predominantly hills formed by water erosion. The groundwater in Guangzhou can be classified into four types: (i) phreatic water; (ii) karst water; (iii) confined water; and (iv) fissure water. The 6 to 15 m thick phreatic water is distributed in the sand gravel layer, which occupies an area of 1898 km2. Generally, the phreatic water level is at a range of 0.2–4.5 m below the surface, with an annual variation of 1–2 m [28]. The karst water covering an area of about 488.2 km2 is widely distributed within the Guanghua Basin area. The quantity of karst water will vary, largely depending on the stage of development of the karst caverns. Because of the alluvial silt soil in the overlying Quaternary sediments, the underlying clasolite strata located at a depth range of 0.82–4.55 m can thus be deemed a confined aquifer. The piezometric level of this confined aquifer is close to the ground surface. Additionally, in the hilly region, the bedrock fissure water widely distributed across an area of 743.3 km2 usually has a very high piezometric level [52,53,54,55,56,57]. It is worth noting that the well-developed river network combined with the high precipitation provides abundant water resources that may worsen the geological conditions during shield tunneling [58,59,60,61,62,63,64,65,66].
The strata in Guangzhou can be divided into nine categories, from top to bottom: (1) back fill layer; (2) silt layer; (3) alluvial–diluvial sand layer; (4) alluvial–diluvial clay layer; (5) residual soil layer; (6) completely weathered bedrock layer; (7) highly weathered bedrock layer; (8) moderately weathered bedrock layer; and (9) slightly weathered bedrock layer. Based upon past experience [68], during shield tunneling the excavation face may encounter mixed ground containing a soft layer (e.g., clay) at the top and a hard layer (e.g., granite) at the bottom, namely the so-called upper-soft lower-hard strata. It is anticipated that while shield tunneling within the upper-soft lower-hard strata, an excessive wearing of the cutter bits and an upward alignment deviation would result in a reduction in the advance rate and additional frictional resistance, respectively, thus affecting construction progress [69,70,71,72]. Additionally, with the effect of chemical weathering, fractures can be well developed in the integrated granite. The weathered granite gradually becomes spherical and is buried with surrounding debris and deposits, thereby forming so-called solitary granite boulders. Since solitary granite boulders are easily omitted during geological investigations, they may cause great damage to the cutter bits and the cutterhead of the shield machine while tunneling through the soft strata [69].
At the beginning of the karst formation process, micro-karst erosion occurs, leading to voids with diameters varying from 0.1 to 5 cm. The erosion continues with time, and causes the voids to be extended and developed into channels. Once these channels are connected to each other, a karst system is formed [73]. The karst geology in China can be divided into seven zones, according to the geotechnical structure and the climatic conditions [74]. According to the exposure conditions, the karst can be divided into two categories: (1) exposed and semi-exposed karst; and (2) buried karst. The buried karst is mainly distributed to the north and south of Guangdong province, while the rest is distributed in eastern Guangdong province. The karst caverns located underground at a depth range varying from few meters to up to 50 m below the surface could largely impact shield tunneling activities. The karst caverns possess the following features: abundant fissure water; high permeability; high collapse potential; various cavern shapes; and irregular distribution [28]. When a tunnel is constructed within such a type of geo-environment, severe geo-hazards such as water ingress, stratum erosion, ground surface settlement, and sinkholes may occur [28,63].
4. Verification
4.1. Fractal Characteristics of Karst Caverns
In the geological investigation phase, a series of rows of geological drilling holes were deployed along the alignment, and each row included three geological drilling holes for which two are located at the northbound and southbound tunnels, respectively, and the other one is located in the middle. This facilitated the preparation of three longitudinal distribution profiles and one plane distribution of karst caverns. In the case where a karst cavern is discovered during an installation of a geological drilling hole, further installations with even smaller hole-to-hole spacing will be carried out in the vicinity of the karst cavern to largely refine its location and dimensions. Details regarding how the graphs can be produced have already been given in the Methodology section. Ninety-eight geological drilling holes distributed from the Maanshan Park Station to the Liantangnan Station (the Ma-Lian section) of Guangzhou’s metro line no. 9 were used for detecting karst caverns. After the analysis of the soil logs was obtained, a total of 98 karst caverns were discovered for the Ma-Lian section. The vertical diameter (D) distribution of the karst caverns was 24.5% for D < 1 m, 48% for 1 m < D < 3 m, 14.3% for 3 m < D < 5 m, and 13.3% for D > 5 m. Additionally, the karst cavern distribution was found to be irregular, with a buried depth range varying from a few metres up to 50 m below the ground surface. Rock properties, geological structure, and dynamic conditions of the groundwater are deemed the key factors affecting the development and distribution of the karst caverns [75]. Li [75] indicated that by comparing and analysing different karst units, the karst geology possesses two main fractal characteristics; namely, self-similarity and scale-invariance. Despite different shapes and scales of karst caverns, they are all developed from soluble carbonate rocks, so that karst caverns exhibit self-similar fractal structures. Also, the complexity and the irregularity of karst caverns cannot be changed as they are enlarged or contracted. Thus, karst caverns present scale-invariant features. The two fractal characteristics are also in line with those observed in the karst geology in the Ma-Lian section. Figure 5 presents a conceptual representation highlighting the two main fractal characteristics for the karst caverns discovered in the Ma-Lian section. It is deduced from previous studies that the fractal theory can be effectively applied to describe the distribution of karst caverns [36,37,38,39].
4.2. Method Verification
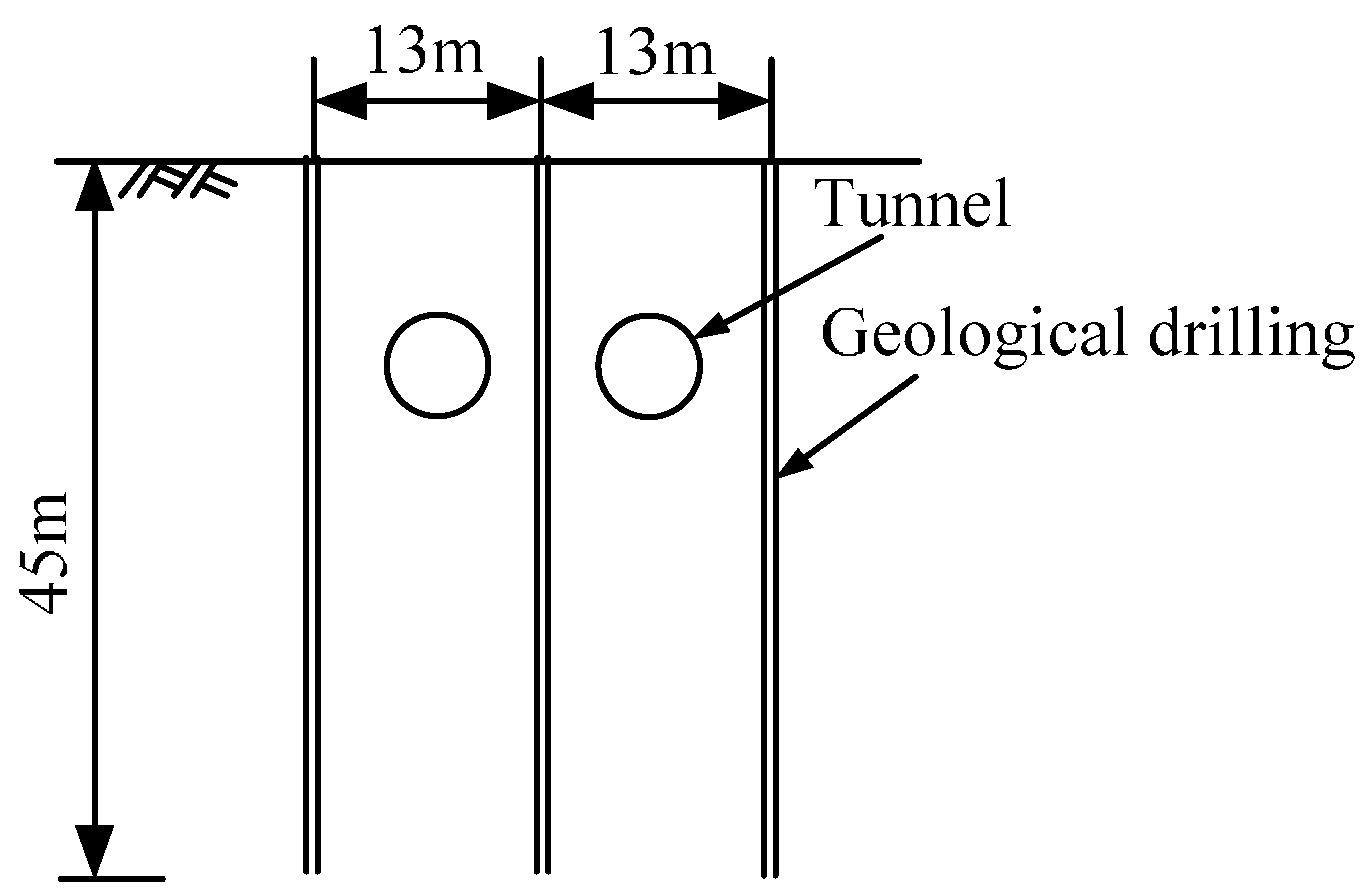
This section aims to verify the validity of the proposed grouting volume prediction method with a case study related to the Ma-Lian section of Guangzhou metro line no. 9, which has already been simply introduced in the previous section. The following will detail the case study, and demonstrate how the proposed method can be used to predict the required volume of grouts during the treatment of the karst caverns. Figure 6a shows a map of the Guangzhou metro system. Figure 6b shows the plan view of the Guangzhou metro line no. 9. Two earth pressure balance shields were involved during the construction of the Guangzhou metro line no. 9. The northbound and southbound tunnels located at a depth of 9.8 m below the ground surface were completed on July 2014, after the commencement of shield tunneling on 16 November 2013. The lining segment had an outer diameter of 6 m and an inner diameter of 5.4 m. A ground investigation was carried out three times to locate the karst caverns along the Ma-Lian section. Figure 7 shows the sectional view of the geological drilling holes. The analysis of the soil samples collected from underground during the drilling process indicated that a total of 98 karst caves were detected along the tunnel alignment. Three drilling hole datasets containing: (a) 98 geological drilling holes (traverse spacing = 13 m and longitudinal spacing = 16 m, as shown in Figure 7); (b) 48 out of 98 geological drilling holes; and (c) 937 grouting holes (traverse spacing = 2 m and longitudinal spacing = 2 m, as shown in Figure 8) were used not only to estimate the volume of karst caverns along the Ma-Lian section, but to produce three longitudinal distribution profiles and one plane distribution of the karst caverns.
4.2.1. Ninety-Eight Geological Drilling Holes
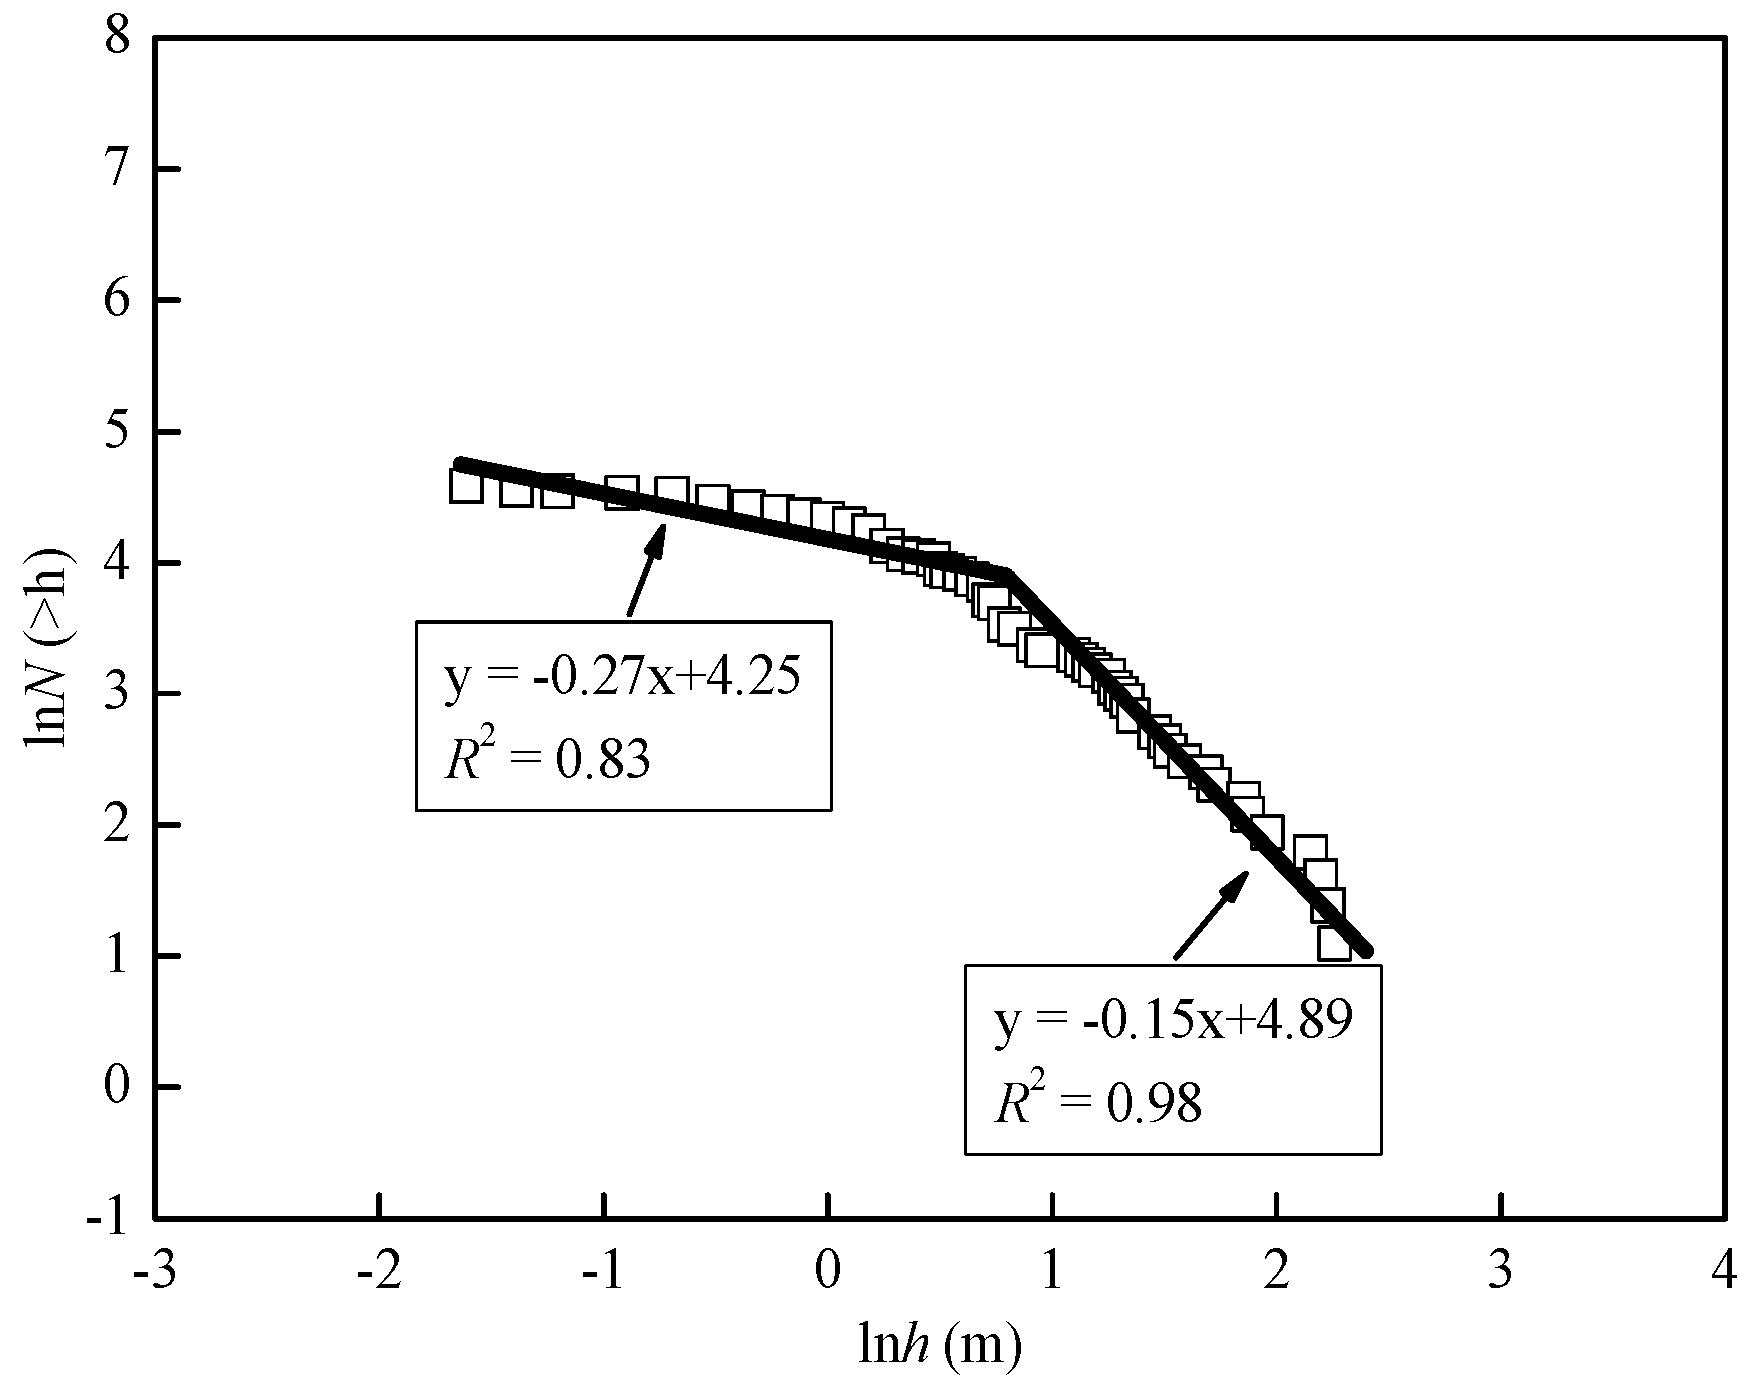
Ninety-eight geological drilling holes can cover an area of 20,384 m2 (i.e., 208 m2 per hole) for karst cavern detection. After installing the geological drilling holes along the Ma-Lian section, a total of 98 karst caverns were detected. The diameters of the karst caverns varied from 0.2 to 9.6 m. Figure 9 presents the relationship between the 98 geological drilling holes and the diameters of the karst caverns. The data were fitted with two straight line segments, as shown in Equation (11), indicating that the fractal model belongs to a bifractal.
4.2.2. Forty-Eight Geological Drilling Holes
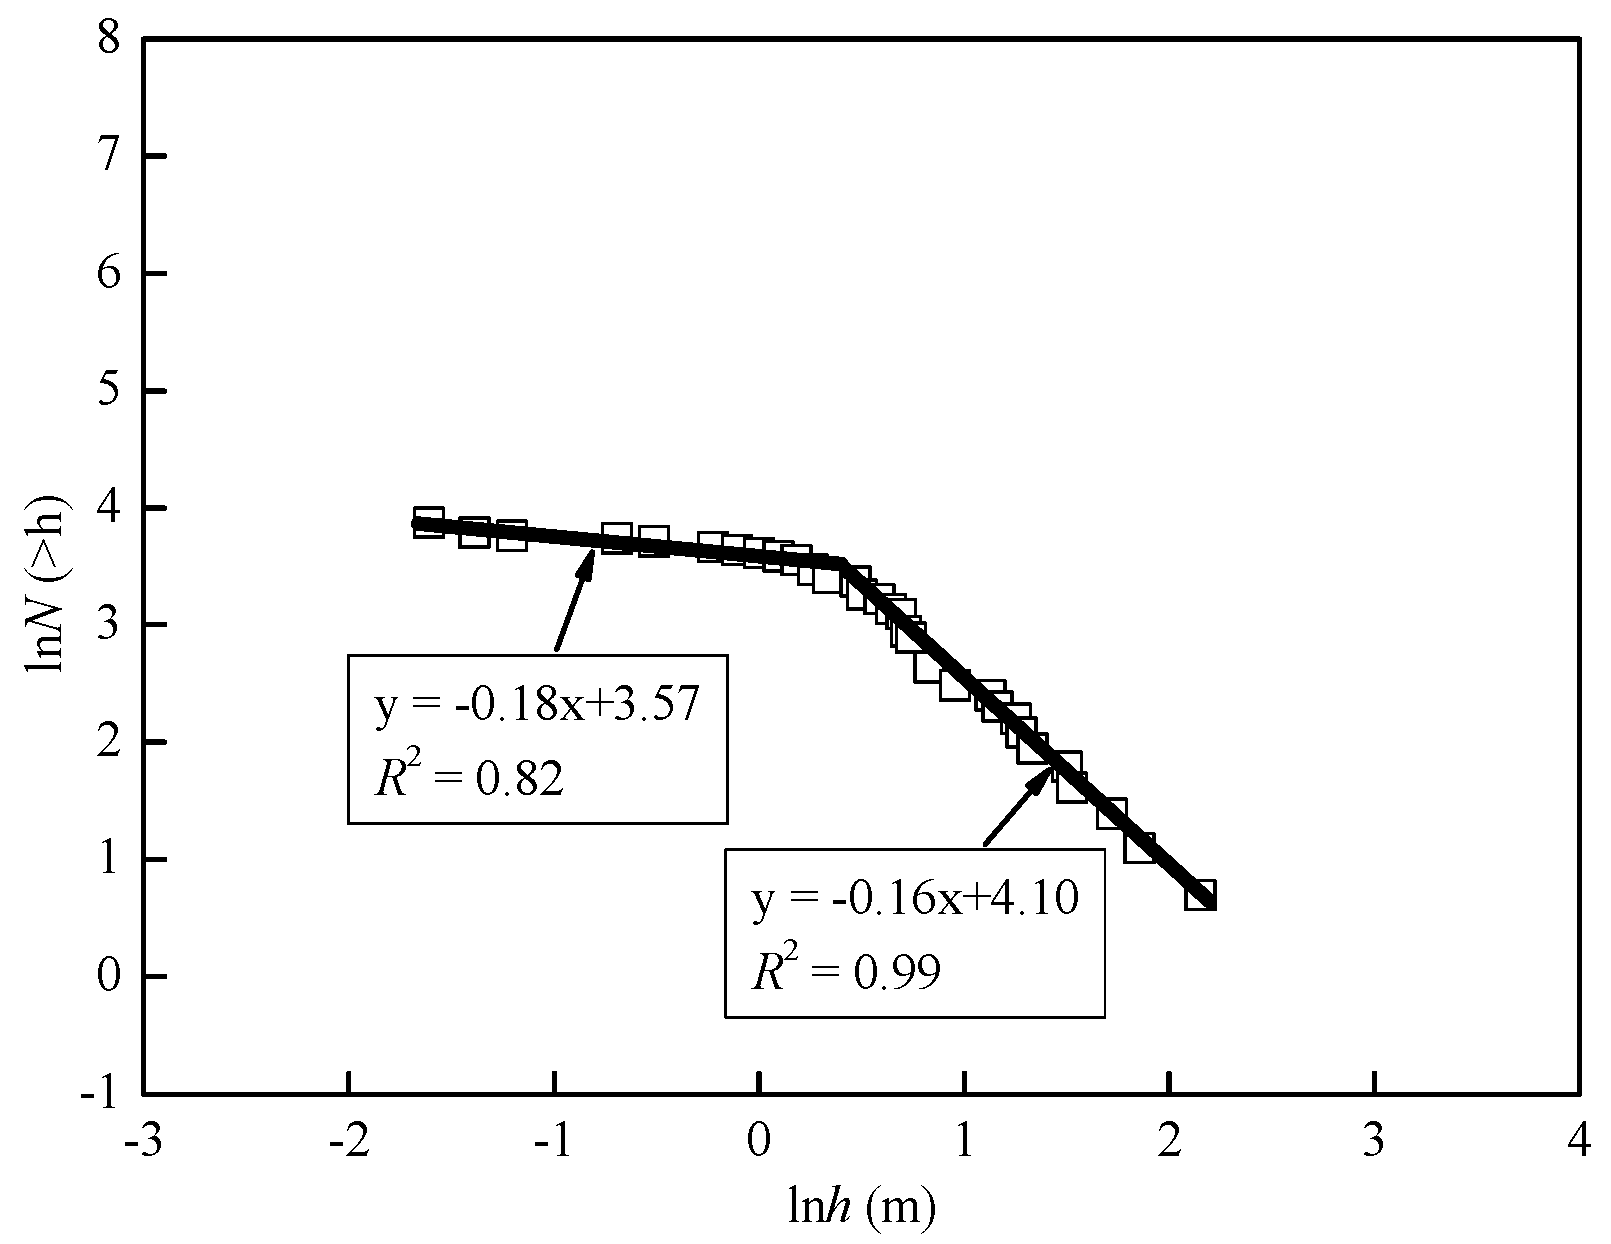
Forty-eight out of the 98 karst caverns required treatment prior to the tunnel’s construction, which can locate karst caverns distributed across an area of 9984 m2. Figure 10 shows the relationship between the 48 geological drilling holes and the diameters of the karst caverns. Similarly, the data were fitted with two straight line segments, as expressed in Equation (12), indicating that the model also belongs to a bifractal.
4.2.3. Nine Hundred and Thirty-Seven Grouting Holes
During the treatment, a total of 937 grouting holes were drilled to a depth range of 0.2–0.3 m below the bottom of the karst caverns in a rectangular pattern at a spacing of 2 m. Figure 8 shows the layout of the grouting holes for a single karst cavern. The injected volume of grouts for each hole was recorded during the treatment. Figure 11 shows the relationship between the 937 grouting holes and the diameters of the karst caverns. Two straight line segments representing the data are expressed as follows:
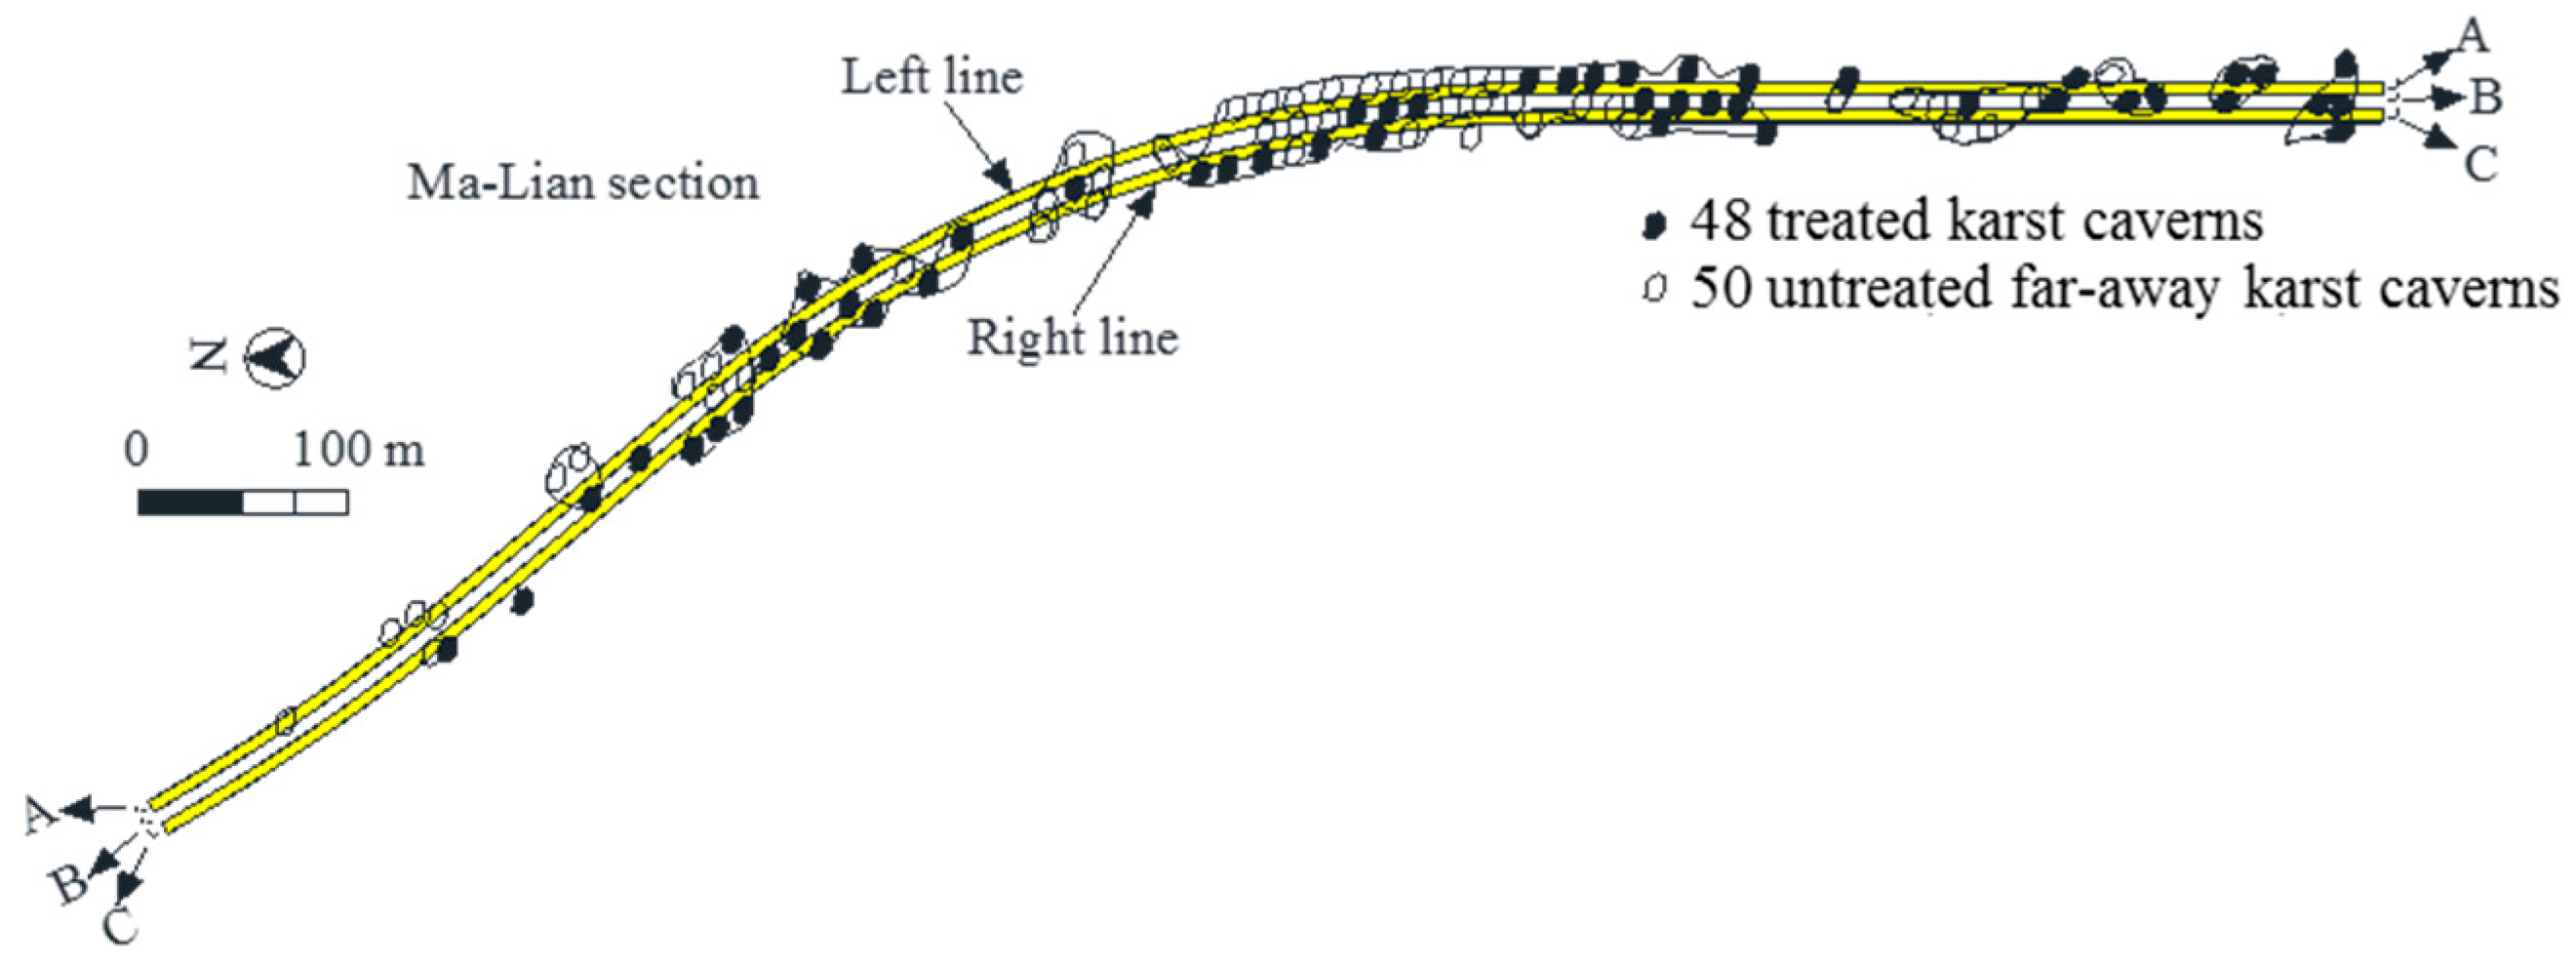
By Equation (9), the volume of the karst caverns can be calculated and visualized, as shown in Figure 12 and Figure 13. Table 1 summarizes the covering areas, fractal parameters, the calculated total volume of the karst caverns, and the karst grouting coefficients for the three datasets analyzed (the three datasets are called ‘Case A’, ‘Case B’, and ‘Case C’, respectively, in the following discussion). In fact, the three cases can represent three scenarios. Cases A and C represent inadequate drilling holes and adequate drilling holes, respectively, while Case B represents a scenario that often occurs during the ground investigation phase, in which the number of drilling holes is more than Case A but still less than Case C. In fact, the number of drilling holes for Case B is less than that of Case A. However, as Case B excluded drilling holes that did not detect karst caverns, its accuracy of detecting karst caverns is similar to cases having more drilling holes than Case A. Generally, the higher the number of geological drilling holes, the higher the accuracy of the calculated total volume (V) of karst caverns. This implies that the V value calculated from Case A could largely deviate from the actual value, and that derived from Case C should be close to the real value. However, due to a limited project budget and duration in most cases, it is not likely to provide adequate drilling holes for the detection of karst caverns. Thus, there is a higher chance to obtain the V value close to that from Case B, and the VR value can then be calculated to be 0.26, taking into account V = 8742.2 m3 and RC = 2292.1 m3. This higher RC value than the actual V value (i.e., 2083.7 m3) implies that there was a loss of grouts injected, most likely due to leaking fractures or fissures of the surrounding geology. As the V value from Case B could lead to misleading inferences regarding the RC value, an excessive injection of grouts may occur. As to the treatment also referred to as “void-filling grouting” [76,77,78], two types of slurry; namely, single slurry and binary slurry, were injected into the karst caverns. The single slurry consisted of water, cement, and sand at a mass ratio of 0.8:1:1, and was used to fill the central holes (Figure 8). The binary slurry consisted of water, cement, sand, and sodium silicate at a mass ratio of 0.8:1:1:0.1, and was used to fill the peripheral holes (Figure 8). The results indicated that the 28-day unconfined compressive strength of the recovered core samples, and the SPT values as well as the core recovery (CR) values are all above the engineering requirements, i.e., UCS > 0.2 MPa, SPT-N > 10, and CR > 90%, respectively. Additionally, there will be more construction projects located underground in buried karst in China in the near future. The distribution of karst caverns and the required volume of grouts would be the main concern for engineers and practitioners. The following outlines the procedure of predicting the required volume of grouts based on the findings of this study: (i) it is important to investigate the distribution of karst caverns along the tunnel alignment to identify which ones need to be treated prior to the tunnel’s construction; (ii) the total volume of karst caverns should be estimated throughout the ground investigation phase; and (iii) the required volume of grouts for treating the karst caverns along the tunneling alignment can be reasonably predicted using the VR value.
5. Conclusions
The method for predicting the required volume of grouts for treating the karst caverns in the way of shield tunneling was proposed and verified through a case study. The following conclusions can be drawn:
- (1)
- Since a karst cavern could be filled with groundwater, sand, or clay, this water along with other sources of groundwater may worsen the geological conditions during shield tunneling. Additionally, severe geo-hazards, such as water ingress, surface settlement, and sinkholes could easily be triggered while tunneling in the buried karst of Guangzhou.
- (2)
- Based on the fractal theory, the proposed method can be used to reasonably estimate the required volume of grouts during treatment. The procedure is: (i) to investigate the distribution of karst caverns along the tunnel alignment; (ii) to calculate the fractal parameters of the karst caverns; (iii) to calculate the total volume of karst caverns; and (iv) to predict the required volume of grouts by introducing the proposed karst grouting coefficient.
- (3)
- The two fractal characteristics—self-similarity and scaling invariance—identified in the literature are also in line with those observed in the karst geology in the Ma-Lian section of Guangzhou metro line no. 9, implying that the fractal theory can be effectively applied to investigate the distribution of karst caverns.
- (4)
- Three datasets including: (i) 98 geological drilling holes; (ii) 48 geological drilling holes; and (iii) 937 grouting holes were established via the presented case history. In the buried karst of Guangzhou, the karst grouting coefficient of 0.26 is recommended for predicting the required volume of grouts for treating karst caverns along tunnel alignment.
Acknowledgments
The research work described herein was funded by the National Nature Science Foundation of China (NSFC) (Grant No. 41672259) and National Basic Research Program of China (973 Program: 2015CB057802). This financial support is gratefully acknowledged.
Author Contributions
This paper represents a result of collaborative teamwork. Wen-Chieh Cheng, Qin-Long Cui, developed the concept and wrote the manuscript; Jack S. Shen, Arul Arulrajah, and Da-Jun Yuan provided constructive suggestions and revised the manuscript. The five authors contributed equally to this work.
Conflicts of Interest
The authors declare no conflict of interest.
References
- Liu, J.H.; Hou, X.Y. Shield Tunnelling Construction; China Railway Publishing House: Beijing, China, 1991. [Google Scholar]
- Mair, R.J. Tunnelling and geotechnics: New horizons. Géotechnique 2008, 58, 695–736. [Google Scholar] [CrossRef]
- Shen, S.L.; Wu, H.N.; Cui, Y.J.; Yin, Z.Y. Long-term settlement behavior of the metro tunnel in Shanghai. Tunn. Undergr. Space Technol. 2014, 40, 309–323. [Google Scholar] [CrossRef]
- Shen, S.L.; Cui, Q.L.; Ho, E.C.; Xu, Y.S. Ground response to multiple parallel microtunneling operations in cemented silty clay and sand. J. Geotech. Geoenviron. Eng. 2016, 142, 04016001. [Google Scholar] [CrossRef]
- Xu, Y.S.; Shen, S.L.; Wu, H.N.; Zhang, N. Risk and impacts on the environment of free-phase biogas in Quaternary deposits along the coastal region of Shanghai. Ocean Eng. 2017, 137, 129–137. [Google Scholar] [CrossRef]
- Wu, H.N.; Huang, R.Q.; Sun, W.J.; Shen, S.L.; Xu, Y.S.; Liu, Y.B.; Du, S.J. Leaking behaviour of shield tunnels under the Huangpu River of Shanghai with induced hazards. Nat. Hazards 2014, 70, 1115–1132. [Google Scholar] [CrossRef]
- Shin, H.S.; Kim, C.Y.; Kim, K.Y.; Bae, G.J.; Hong, S.W. A new strategy for monitoring of adjacent structures to tunnel construction in urban area. Tunn. Undergr. Space Technol. 2006, 21, 461–462. [Google Scholar] [CrossRef]
- Zhao, J.; Gong, Q.M.; Eisensten, Z. Tunnelling through a frequently changing and mixed ground: A case history in Singapore. Tunn. Undergr. Space Technol. 2007, 22, 388–400. [Google Scholar] [CrossRef]
- Standing, J.; Selemetas, D. Greenfield ground response to EPBM tunnelling in London Clay. Geotechnique 2013, 63, 989–1007. [Google Scholar] [CrossRef]
- Tóth, Á.; Gong, Q.; Zhao, J. Case studies of TBM tunneling performance in rock-soil interface mixed ground. Tunn. Undergr. Space Technol. 2013, 38, 140–150. [Google Scholar] [CrossRef]
- Fargnoli, V.; Boldini, D.; Amorosi, A. TBM tunnelling-induced settlements in coarse-grained soils: The case of the new Milan underground line 5. Tunn. Undergr. Space Technol. 2013, 38, 336–347. [Google Scholar] [CrossRef]
- Jiang, M.J.; Konrad, J.M.; Leroueil, S. An efficient technique for generating homogeneous specimens for DEM studies. Comput. Geotech. 2003, 30, 579–597. [Google Scholar] [CrossRef]
- Jiang, M.J.; Leroueil, S.; Konrad, J.M. Insight into strength functions of unsaturated granulates by DEM analysis. Comput. Geotech. 2004, 31, 473–489. [Google Scholar] [CrossRef]
- Jiang, M.J.; Yu, H.S.; Harris, D.A. Novel discrete model for granular material incorporating rolling resistance. Comput. Geotech. 2005, 32, 340–357. [Google Scholar] [CrossRef]
- Jiang, M.J.; Yan, H.B.; Zhu, H.H.; Utili, S. Modeling shear behavior and strain localization in cemented sands by two-dimensional distinct element method analyses. Comput. Geotech. 2011, 38, 14–29. [Google Scholar] [CrossRef]
- Yin, Z.Y.; Karstunen, M.; Chang, C.S.; Koskinen, M.; Lojander, M. Modeling time-dependent behavior of soft sensitive clay. J. Geotech. Geoenviron. Eng. 2011, 137, 1103–1113. [Google Scholar] [CrossRef]
- Yin, Z.Y.; Zhao, J.; Hicher, P.Y. A micromechanics-based model for sand-silt mixtures. Int. J. Solids Struct. 2014, 51, 1350–1363. [Google Scholar] [CrossRef]
- Yin, Z.Y.; Yin, J.H.; Huang, H.W. Rate-dependent and long-term yield stress and strength of soft Wenzhou marine clay: Experiments and modeling. Mar. Georesour. Geotech. 2015, 33, 79–91. [Google Scholar] [CrossRef]
- Yin, Z.Y.; Hicher, P.Y.; Dano, C.; Jin, Y.F. Modeling the mechanical behavior of very coarse granular materials. J. Eng. Mech. 2016, 143. [Google Scholar] [CrossRef]
- Tan, Y.; Li, X.; Kang, Z.; Liu, J.; Zhu, Y. Zoned excavation of an oversized pit close to an existing metro line in stiff clay: Case study. J. Perform. Constr. Facil. 2015, 29, 04014158. [Google Scholar] [CrossRef]
- Yuan, D.X. Karst in China; Shanghai People’s Publishing House: Shanghai, China, 1976. (In Chinese) [Google Scholar]
- Tan, Y.; Lu, Y. Why excavation of a small air shaft caused excessively large displacements: Forensic investigation. J. Perform. Constr. Facil. 2017, 31. [Google Scholar] [CrossRef]
- Shen, S.; Wang, Z.F.; Sun, W.J.; Wang, L.B.; Horpibulsuk, S. A field trial of horizontal jet grouting using the composite-pipe method in the soft deposit of Shanghai. Tunn. Undergr. Space Technol. 2013, 35, 142–151. [Google Scholar] [CrossRef]
- Shen, S.; Wang, Z.F.; Yang, J.; Ho, E.C. Generalized approach for prediction of jet grout column diameter. J. Geotech. Geoenviron. Eng. 2013, 139, 2060–2069. [Google Scholar] [CrossRef]
- Shen, S.; Wang, Z.F.; Horpibulsuk, S.; Kim, Y.H. Jet-Grouting with a newly developed technology: The Twin-Jet Method. Eng. Geol. 2013, 152, 87–95. [Google Scholar] [CrossRef]
- Shen, S.; Xu, Y.S. Numerical evaluation of land subsidence induced by groundwater pumping in Shanghai. Can. Geotech. J. 2011, 48, 1378–1392. [Google Scholar] [CrossRef]
- Wang, Z.F.; Shen, S.; Ho, E.C.; Kim, Y.H. Investigation of field installation effects of horizontal Twin-Jet grouting in Shanghai soft soil deposits. Can. Geotech. J. 2013, 50, 288–297. [Google Scholar] [CrossRef]
- Cui, Q.L.; Wu, H.N.; Shen, S.; Xu, Y.S.; Ye, G.L. Chinese karst geology and measures to prevent geohazards during shield tunnelling in karst region with caves. Nat. Hazards 2015, 77, 129–152. [Google Scholar] [CrossRef]
- Du, Y.J.; Wei, M.L.; Jin, F.; Liu, Z.B. Stress-strain relation and strength characteristics of cement treated zinc-contaminated clay. Eng. Geol. 2013, 167, 20–26. [Google Scholar] [CrossRef]
- Du, Y.J.; Jiang, N.J.; Liu, S.Y.; Jin, F.; Singh, D.N.; Pulppara, A. Engineering properties and microstructural characteristics of cement solidified zinc-contaminated kaolin clay. Can. Geotech. J. 2014, 51, 289–302. [Google Scholar] [CrossRef]
- Du, Y.J.; Horpibulsuk, S.; Wei, M.L.; Martin, L. Modeling compression behavior of cement treated zinc contaminated clayey soils. Soils Found. 2014, 54, 1018–1026. [Google Scholar] [CrossRef]
- Shen, S.L.; Ma, L.; Xu, Y.S.; Yin, Z.Y. Interpretation of increased deformation rate in aquifer IV due to groundwater pumping in Shanghai. Can. Geotech. J. 2013, 50, 1129–1142. [Google Scholar] [CrossRef]
- Xu, Y.S.; Shen, S.; Du, Y.J.; Chai, J.C.; Horpibulsuk, S. Modelling the cutoff behavior of underground structure in multi-aquifer-aquitard groundwater system. Nat. Hazards 2013, 66, 731–748. [Google Scholar] [CrossRef]
- Mandelbrot, B.B. The Fractal Geometry of Nature; W.H. Freeman and Company: San Francisco, CA, USA, 1983; p. 468. [Google Scholar]
- Wang, Q.F.; Deng, J.; Liu, H.; Yang, L.Q.; Wan, L.; Zhang, R.Z. Fractal models for ore reserve estimation. Ore Geol. Rev. 2010, 37, 2–14. [Google Scholar] [CrossRef]
- Li, W.X. The fractal bending of karst cave. Carsologica Sin. 1995, 14, 241–245. (In Chinese) [Google Scholar]
- Hu, Z.X.; Shen, J.F. Study on fractal characteristics of karst morphology system and its mechanism. J. Earth Sci. 1994, 19, 103–108. (In Chinese) [Google Scholar]
- Li, W.X. The change in space density (apparent represent element volume) of karst conduit media and fractal research. Carsologica Sin. 1995, 14, 161–168. (In Chinese) [Google Scholar]
- Pardo-Igúzquiza, E.; Durán, J.J.; Robledo-Ardila, P.A.; Paredes, C. Fractal modeling and estimation of karst conduit porosity. Hydrogeol. Environ. Investig. Karst Syst. 2015, 1, 271–276. [Google Scholar]
- Xu, Y.F.; Cao, L. Fractal representation for effective stress of unsaturated soils. Int. J. Geomech. 2014, 15, 04014098. [Google Scholar] [CrossRef]
- Wan, L.; Deng, J.; Wang, Q.F.; Gao, B.F. Fractal model of the reserve-size distribution of ore deposits and the mathematical analysis of its fractal dimension. Geol. Miner. Resour. South China 2005, 3, 35–37. (In Chinese) [Google Scholar]
- Turcotte, D.L. Fractals in petrology. Lithos 2002, 65, 261–271. [Google Scholar] [CrossRef]
- Wang, Q.F.; Deng, J.; Wan, L.; Yang, L.Q.; Gong, Q.J. Discussion on the kinetic controlling parameter of the stability of orebody distribution in altered rocks in the Dayingezhuang gold deposit, Shandong. Acta Petrol. Sin. 2007, 23, 590–593, (In Chinese with English Abstract). [Google Scholar]
- Deng, J.; Fang, Y.; Yang, L.Q.; Yang, J.C.; Sun, Z.S.; Wang, J.P.; Ding, S.J.; Wang, Q.F. Numerical modelling of ore-forming dynamics of fractal dispersive fluid systems. Acta Geol. Sin. 2001, 75, 220–232. [Google Scholar]
- Deng, J.; Wang, Q.F.; Huang, D.; Wan, L.; Yang, L.Q.; Gao, B.F. Transport network and flow mechanism of shallow ore-bearing magma in Tongling ore cluster area. Sci. China Ser. D 2006, 49, 397–407. [Google Scholar] [CrossRef]
- Feder, J. Fractal; Plenum Press: New York, NY, USA, 1988. [Google Scholar]
- Turcotte, D.L. Fractals and Chaos in Geology and Geophysics; Cambridge University Press: Cambridge, UK, 1997. [Google Scholar]
- Agterberg, F.P.; Cheng, Q.M.; Brown, A. Multifractal modelling of fractures in the Lac Bonnet Batholiths, Manitoba. Comput. Geosci. 1996, 22, 497–507. [Google Scholar] [CrossRef]
- Cheng, Q.M. Spatial and scaling modelling for geochemical anomaly separation. J. Geochem. Explor. 1999, 65, 175–194. [Google Scholar] [CrossRef]
- Guangzhou Metro Design & Research Institute Co., Ltd. (GMDRI). General Technical Requirement of Karst Treatment in Guangzhou Metro Line 9 (Trial); Guangzhou Metro Design & Research Institute Co., Ltd. (GMDRI): Guangzhou, China, 2010. (In Chinese) [Google Scholar]
- Lyu, H.M.; Wang, G.F.; Shen, J.; Lu, L.H.; Wang, G.Q. Analysis and GIS mapping of flooding hazards on 10 May, 2016, Guangzhou, China. Water 2016, 8, 447. [Google Scholar] [CrossRef]
- Ma, L.; Xu, Y.S.; Shen, S.; Sun, W.J. Evaluation of the hydraulic conductivity of aquifer with piles. Hydrogeol. J. 2014, 22, 371–382. [Google Scholar] [CrossRef]
- Shen, S.L.; Wu, Y.X.; Xu, Y.S.; Hino, T.; Wu, H.N. Evaluation of hydraulic parameter based on groundwater pumping test of multi-aquifer system of Tianjin. Comput. Geotech. 2015, 68, 196–207. [Google Scholar] [CrossRef]
- Wu, H.N.; Shen, S.; Ma, L.; Yin, Z.Y.; Horpibulsuk, S. Evaluation of the strength increase of marine clay under staged embankment loading: A case study. Mar. Georesour. Geotechnol. 2015, 33, 532–541. [Google Scholar] [CrossRef]
- Wu, Y.X.; Shen, S.; Wu, H.N.; Xu, Y.S.; Yin, Z.Y.; Sun, W.J. Environmental protection using dewatering technology in a deep confined aquifer beneath a shallow aquifer. Eng. Geol. 2015, 196, 59–70. [Google Scholar] [CrossRef]
- Wu, Y.X.; Shen, S.; Xu, Y.S.; Yin, Z.Y. Characteristics of groundwater seepage with cutoff wall in gravel aquifer. I: Field observations. Can. Geotech. J. 2015, 52, 1526–1538. [Google Scholar]
- Wu, Y.X.; Shen, S.; Yin, Z.Y.; Xu, Y.S. Characteristics of groundwater seepage with cutoff wall in gravel aquifer. II: Numerical analysis. Can. Geotech. J. 2015, 52, 1539–1549. [Google Scholar]
- Xu, Y.S.; Ma, L.; Shen, S.; Sun, W.J. Evaluation of land subsidence by considering underground structures penetrated into aquifers in Shanghai. Hydrogeol. J. 2012, 20, 1623–1634. [Google Scholar] [CrossRef]
- Xu, Y.S.; Ma, L.; Du, Y.J.; Shen, S. Analysis on urbanization induced land subsidence in Shanghai. Nat. Hazards 2012, 63, 1255–1267. [Google Scholar] [CrossRef]
- Xu, Y.S.; Shen, S.; Ma, L.; Sun, W.J.; Yin, Z.Y. Evaluation of the blocking effect of retaining walls on groundwater seepage in aquifers with different insertion depths. Eng. Geol. 2014, 183, 254–264. [Google Scholar] [CrossRef]
- Xu, Y.S.; Shen, S.; Ren, D.J.; Wu, H.N. Factor analysis of land subsidence in Shanghai: A view based on Strategic Environmental Assessment. Sustainability 2016, 8, 573. [Google Scholar] [CrossRef]
- Wu, Y.X.; Shen, S.; Yuan, D.J. Characteristics of dewatering induced drawdown curve under barrier effect of retaining wall in aquifer. J. Hydrol. 2016, 539, 554–566. [Google Scholar] [CrossRef]
- Wu, H.N.; Shen, S.; Liao, S.M.; Yin, Z.Y. Longitudinal structural modelling of shield tunnels considering shearing dislocation between segmental rings. Tunn. Undergr. Space Technol. 2015, 50, 317–323. [Google Scholar] [CrossRef]
- Shen, S.L.; Wang, J.P.; Wu, H.N.; Xu, Y.S.; Ye, G.L.; Yin, Z.Y. Evaluation of hydraulic conductivity for both marine and deltaic deposit based on piezocone test. Ocean Eng. 2015, 110, 174–182. [Google Scholar] [CrossRef]
- Shen, S.L.; Wang, Z.F.; Cheng, W.C. Estimation of lateral displacement induced by jet grouting in clayey soils. Geotechnique 2017, 67, 621–630. [Google Scholar] [CrossRef]
- Zhang, N.; Shen, S.; Wu, H.N.; Chai, J.; Yin, Z. Evaluation of effect of basal geotextile reinforcement under embankment loading on soft marine deposits. Geotext. Geomembr. 2015, 43, 506–514. [Google Scholar] [CrossRef]
- Ren, D.J.; Shen, S.L.; Cheng, W.C.; Zhang, N.; Wang, Z.F. Geological formation and geo-hazards during subway construction in Guangzhou. Environ. Earth Sci. 2016, 75, 934. [Google Scholar] [CrossRef]
- Liu, X.X.; Xu, Y.S.; Cheng, W.C.; Shen, S.L.; Horpibulsuk, S. Investigation of hydraulic parameters of a weathered mylonite fault from field pumping tests: A case study. Bull. Eng. Geol. Environ. 2016. [Google Scholar] [CrossRef]
- Ni, J.C.; Cheng, W.C. Steering efficiency of microtunneling in various deposits. Tunn. Undergr. Space Technol. 2012, 28, 321–330. [Google Scholar] [CrossRef]
- Ni, J.C.; Cheng, W.C. Characterising the failure pattern of a station box of Taipei Rapid Transit System (TRTS) and its rehabilitation. Tunn. Undergr. Space Technol. 2012, 32, 260–272. [Google Scholar] [CrossRef]
- Ni, J.C.; Ge, L.; Cheng, W.C. Variation of slurry pipe jacking force in coarse and fine soils. In Proceedings of the 4th GeoChina International Conference Sustainable Civil Infrastructures: Innovative Technologies for Severe Weathers and Climate Changes, Shandong, China, 25–27 July 2016; pp. 182–188. [Google Scholar]
- Cheng, W.C.; Ni, J.C.; Shen, S.L.; Huang, H.W. Investigation into factors affecting jacking force: A case study. ICE Proc. Geotech. Eng. 2017. [Google Scholar] [CrossRef]
- Ruiz, R.L.; Zapata, E.P.; Parra, R.; Harter, T.; Mahlknecht, J. Investigation of the geochemical evolution of groundwater under agricultural land: A case study in northeastern Mexico. J. Hydrol. 2015, 521, 410–423. [Google Scholar] [CrossRef]
- Lu, Y.R. China Karst; Higher Education Press: Beijing, China, 2010. (In Chinese) [Google Scholar]
- Li, C.S. The Applied Study on the Fractal Forecasting Method of Karst Geology. Ph.D. Thesis, Southwest Jiaotong University, Chengdu, China, 2006. [Google Scholar]
- Ni, J.C.; Cheng, W.C. Trial grouting under rigid pavement: A case history in Magong Airport, Penghu. J. Test. Eval. 2012, 40, 107–118. [Google Scholar]
- Ni, J.C.; Cheng, W.C. Field response of high speed rail box tunnel during horizontal grouting. J. Test. Eval. 2015, 43, 398–413. [Google Scholar] [CrossRef]
- Ni, J.C.; Cheng, W.C. Shield machine disassembly in grouted soils outside the ventilation shaft: A case history in Taipei Rapid Transit System (TRTS). Tunn. Undergr. Space Technol. 2011, 26, 435–443. [Google Scholar] [CrossRef]
Figure 1.
(a) simple fractal model; (b) bifractal model.

Figure 2.
(a) Plane distribution of geological drilling holes; (b) Plane distribution of karst caverns.
Figure 2.
(a) Plane distribution of geological drilling holes; (b) Plane distribution of karst caverns.
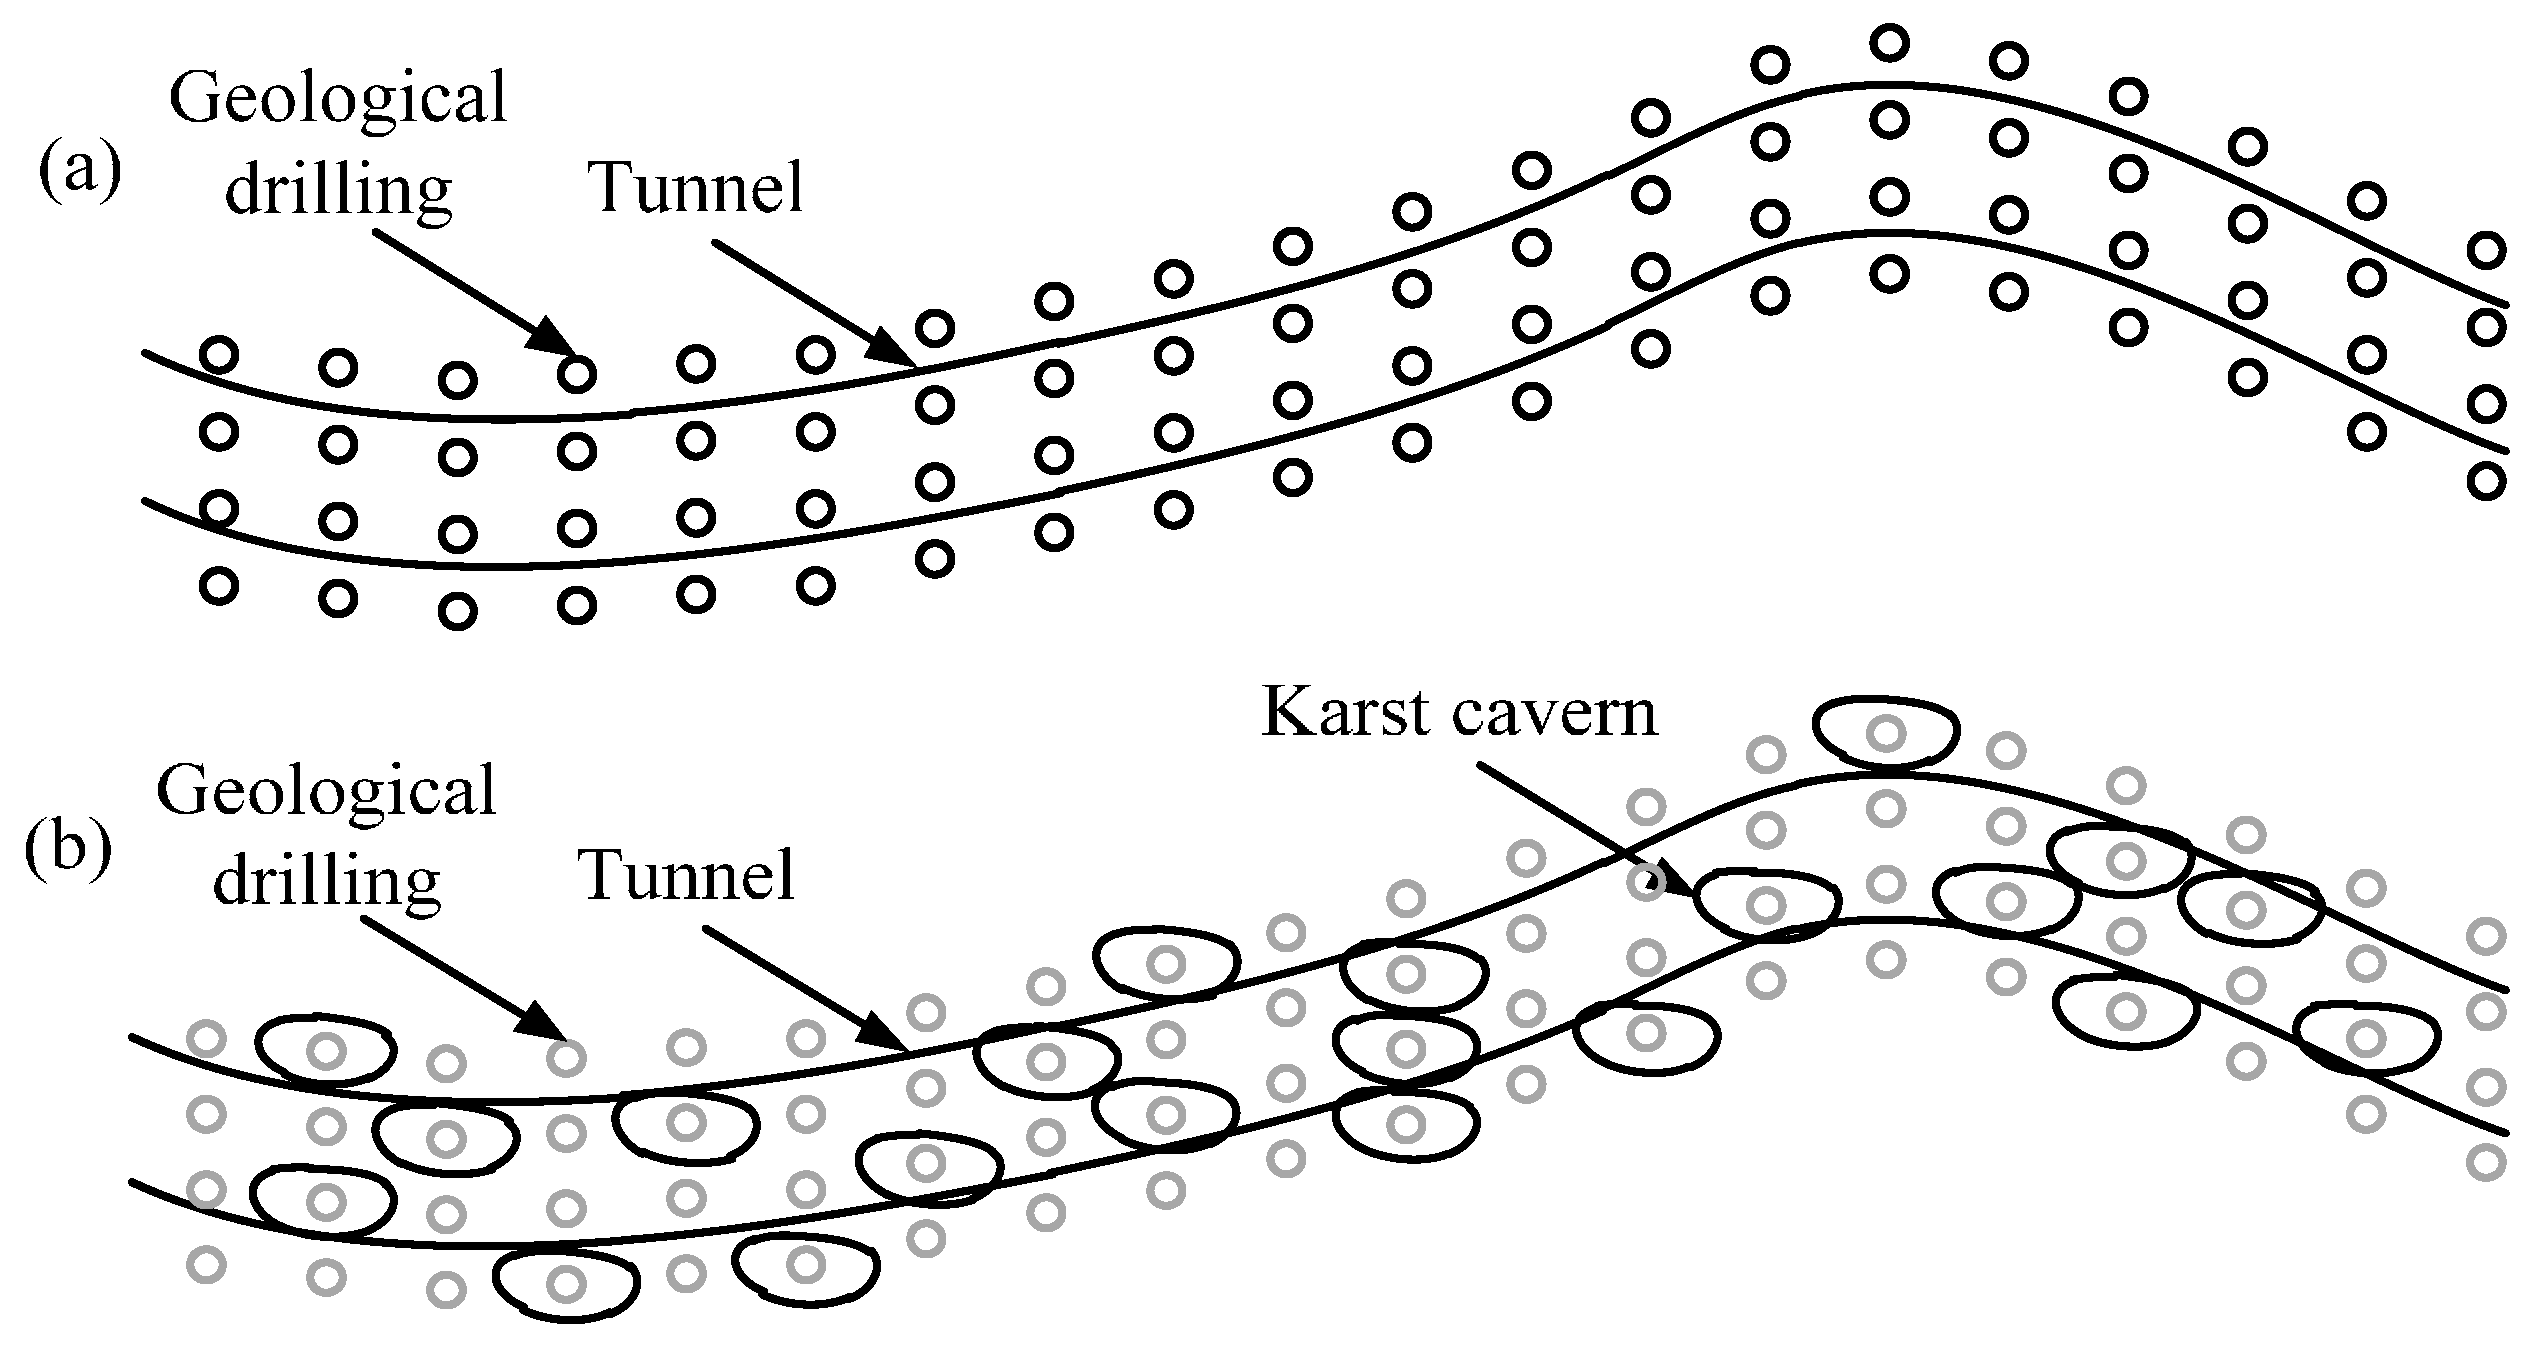
Figure 3.
(a) Projection of karst cavern onto longitudinal section; (b) Projection of karst cavern onto ground surface plane (after Wang et al., 2010) [35].
Figure 3.
(a) Projection of karst cavern onto longitudinal section; (b) Projection of karst cavern onto ground surface plane (after Wang et al., 2010) [35].

Figure 4.
Geological map of Guangzhou (data from Ren et al., 2016 [67]).
Figure 4.
Geological map of Guangzhou (data from Ren et al., 2016 [67]).

Figure 5.
Conceptual representation highlighting the fractal characteristics for the karst caverns discovered in the Ma-Lian section.
Figure 5.
Conceptual representation highlighting the fractal characteristics for the karst caverns discovered in the Ma-Lian section.
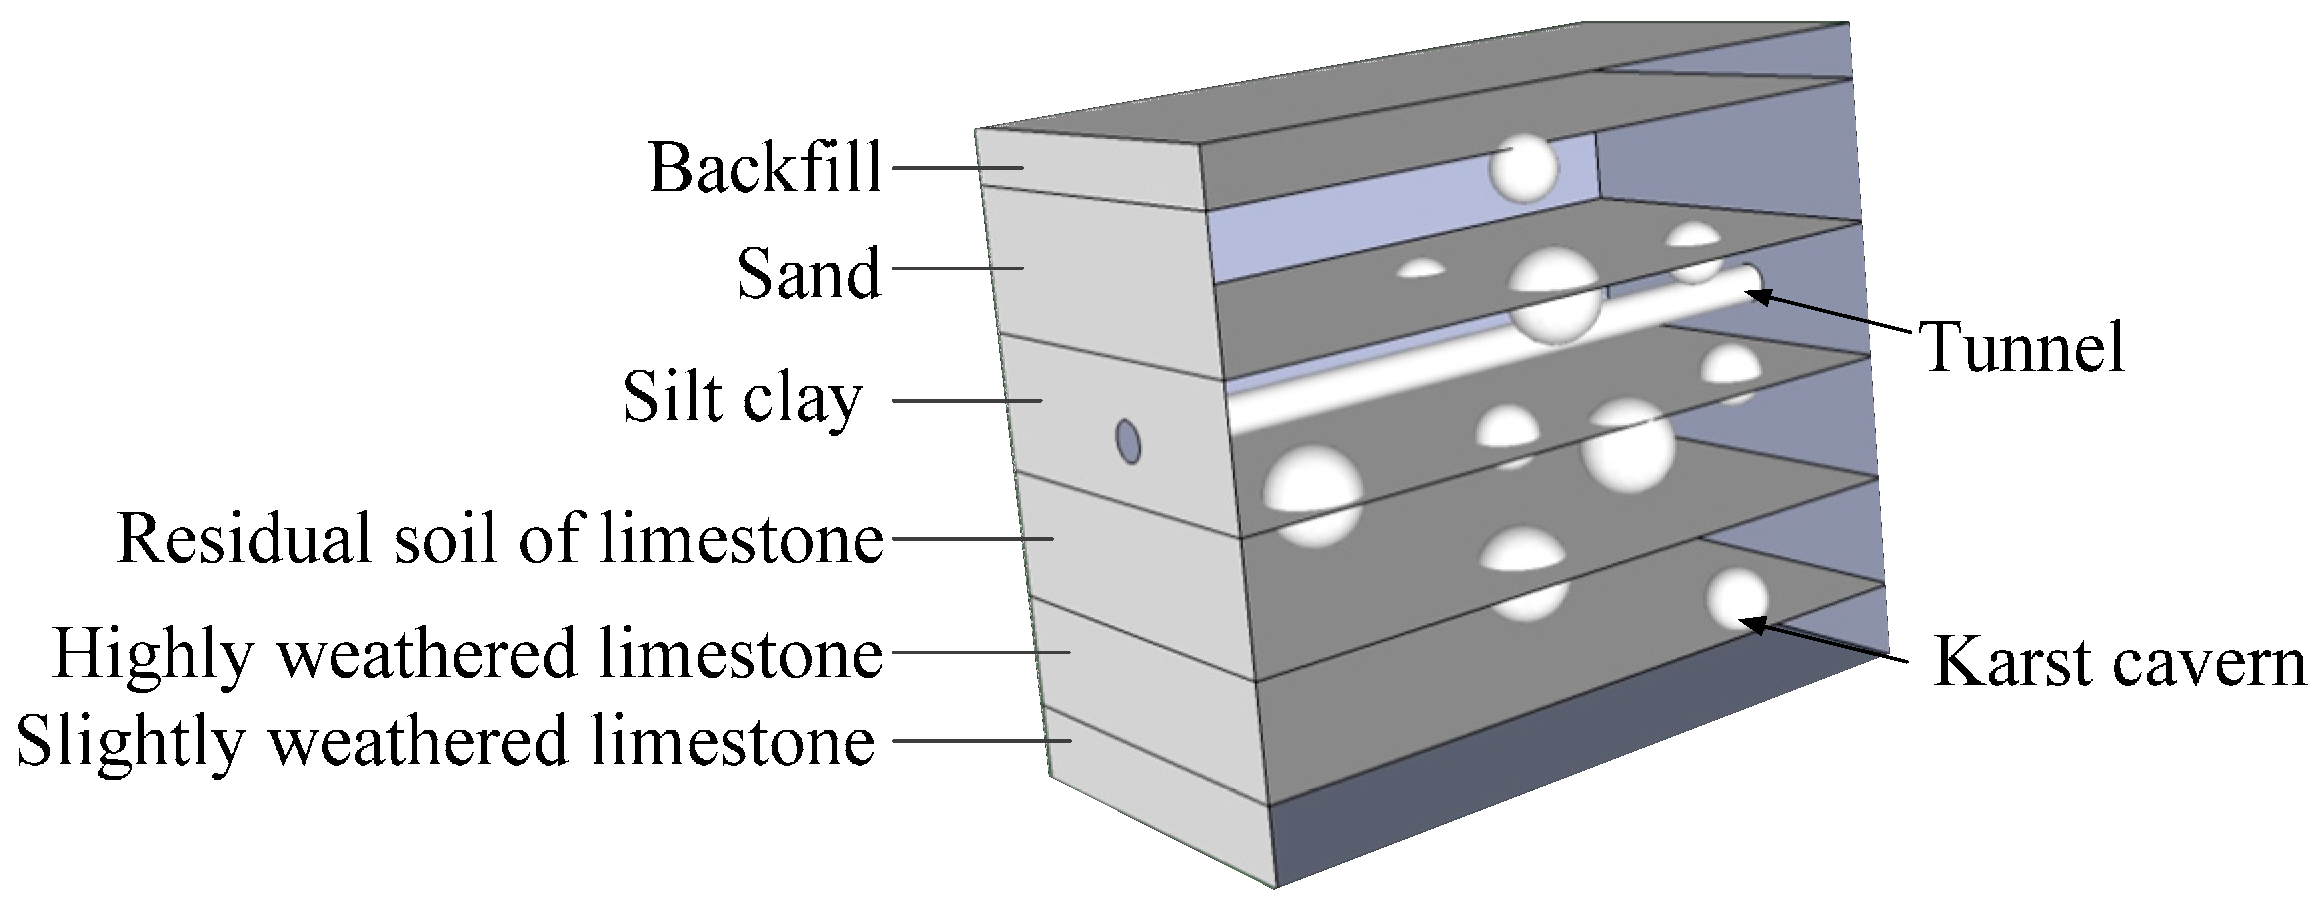
Figure 6.
Background description for the presented case study (a); Map of metro system of Guangzhou and location of the worksite (b).
Figure 6.
Background description for the presented case study (a); Map of metro system of Guangzhou and location of the worksite (b).
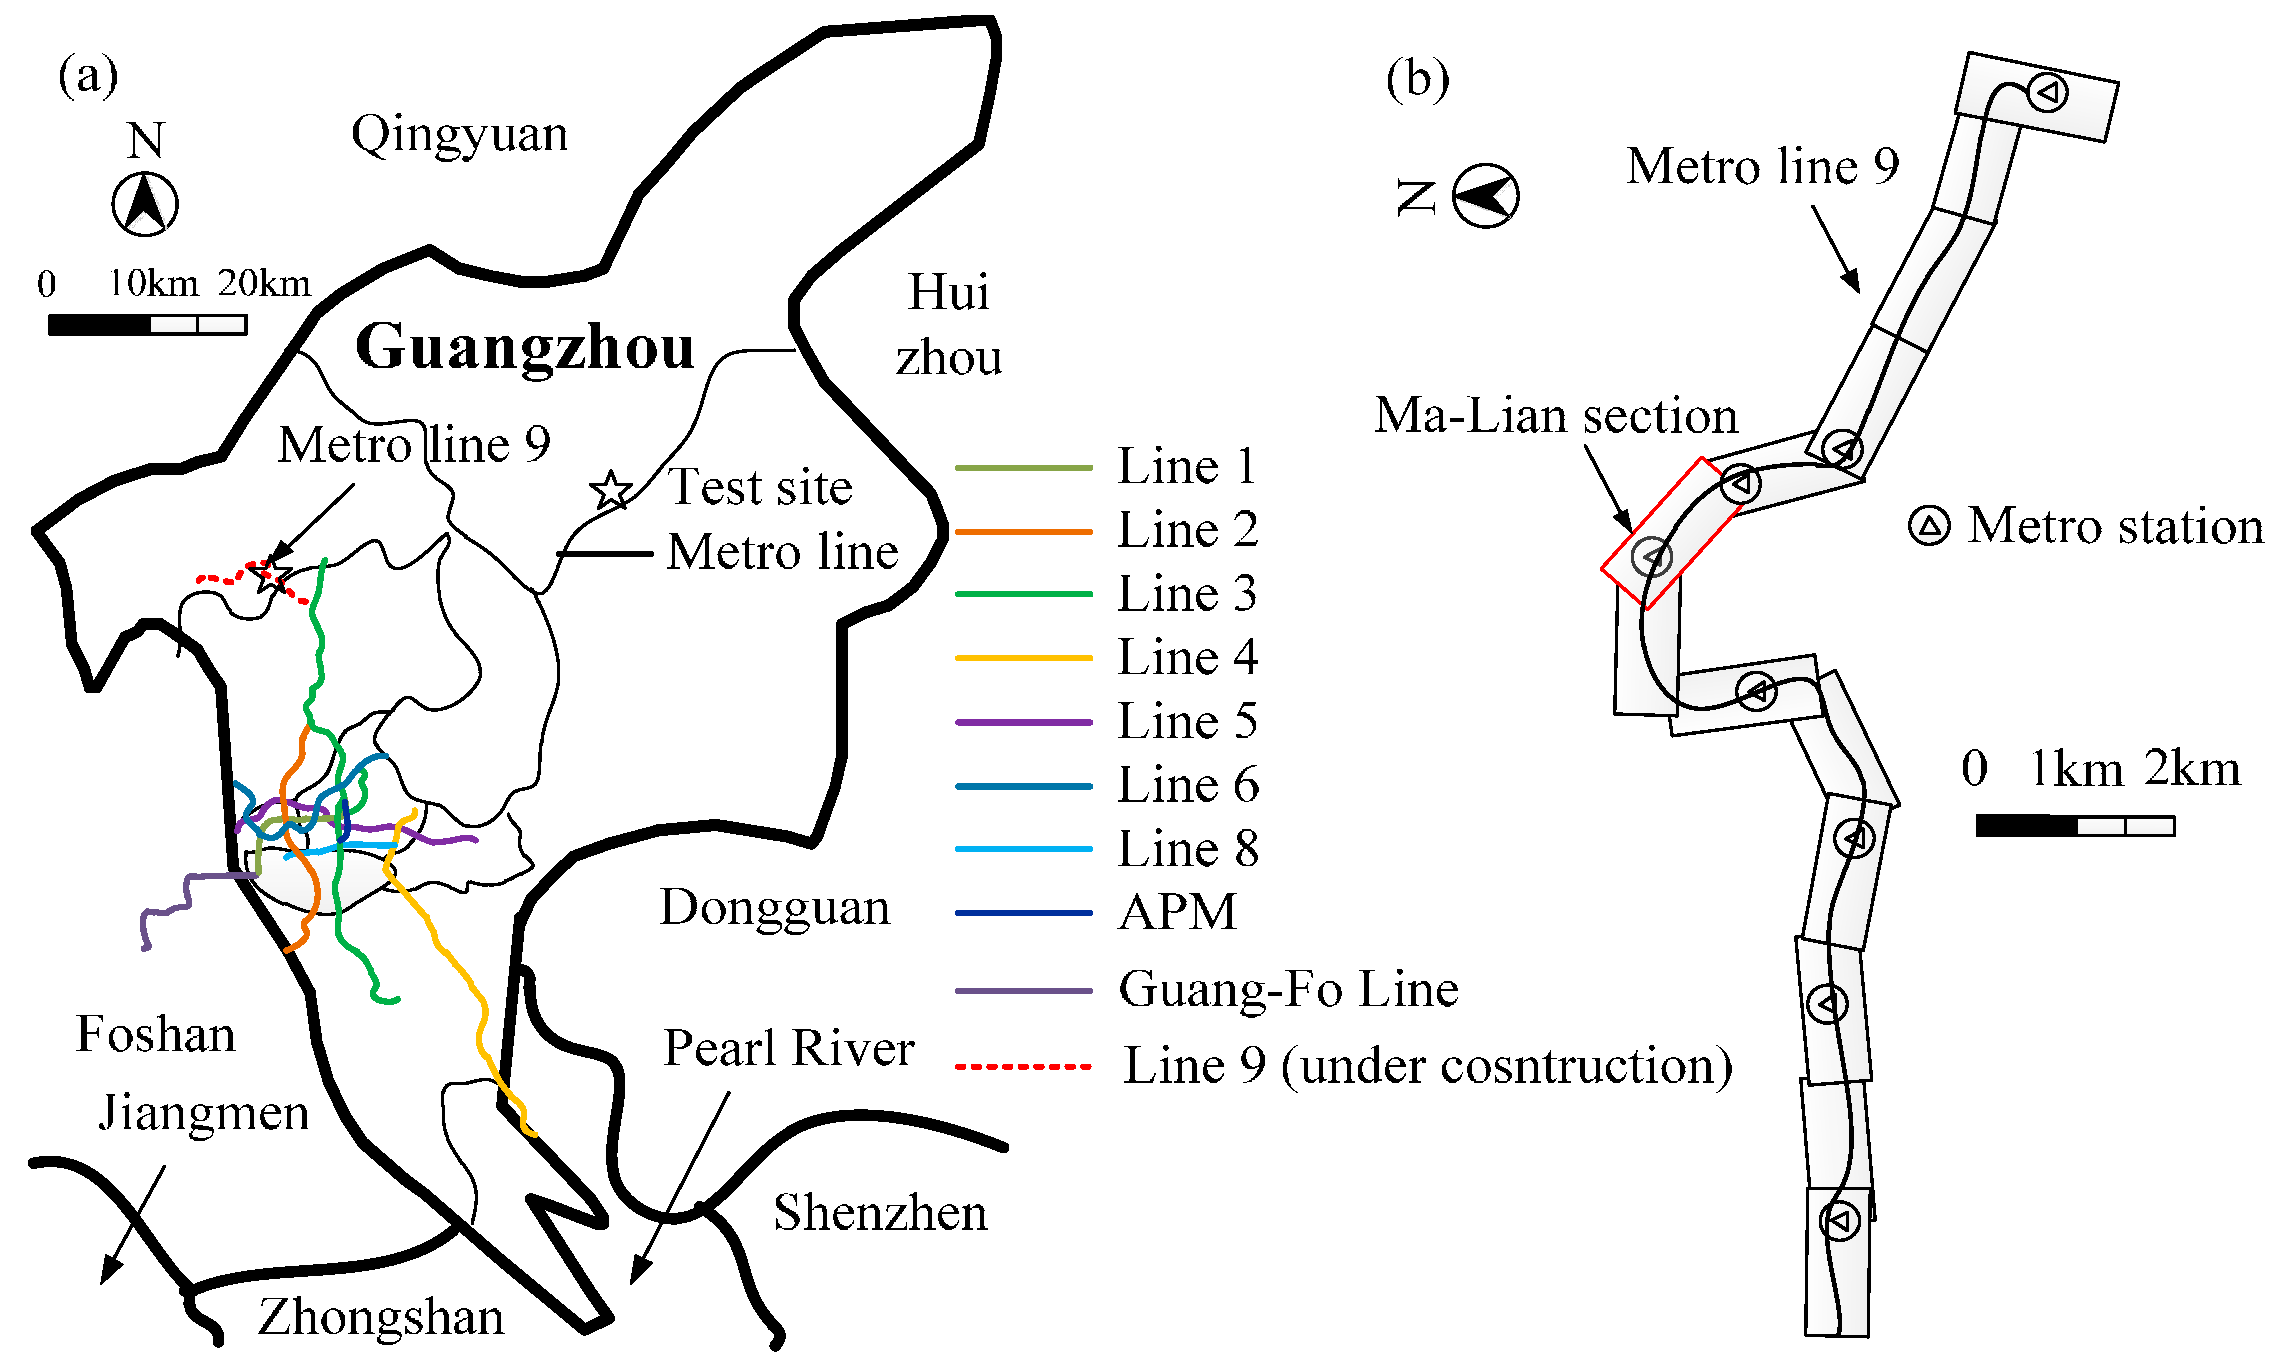
Figure 7.
Sectional view of the geological drilling holes.

Figure 8.
Layout of the grouting holes.
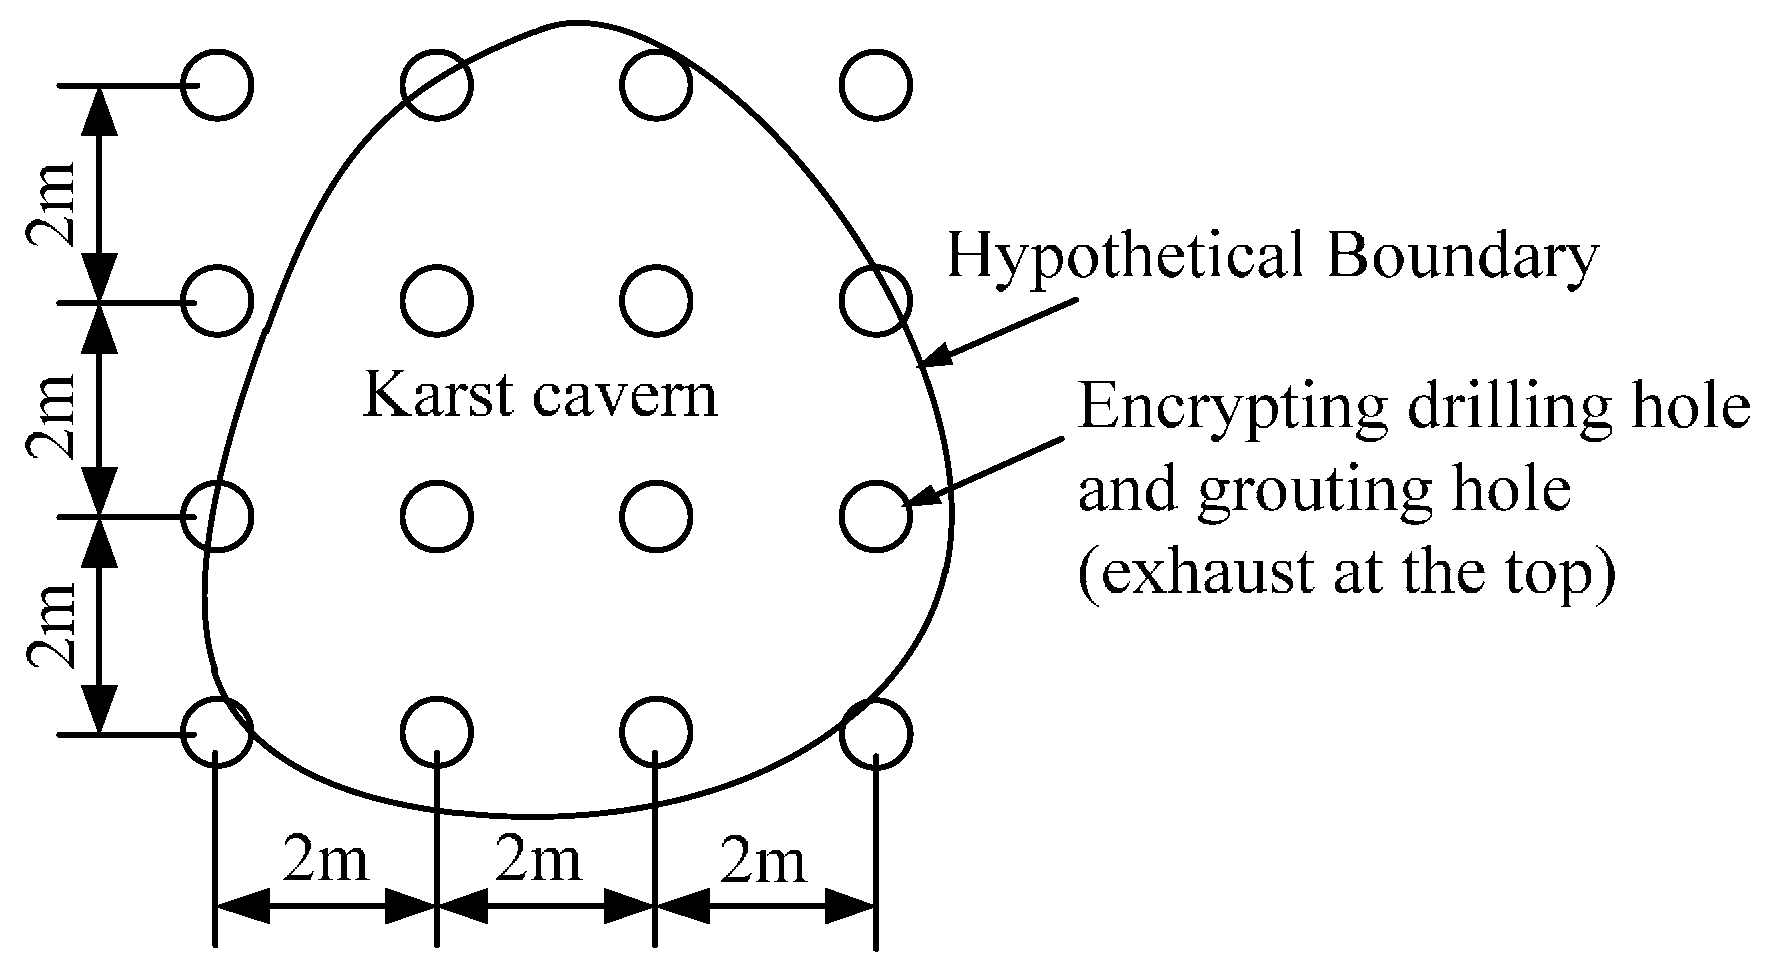
Figure 9.
Fractal model describing the relationship between the 98 geological drilling holes and the diameters of the karst caverns.
Figure 9.
Fractal model describing the relationship between the 98 geological drilling holes and the diameters of the karst caverns.

Figure 10.
Fractal model describing the relationship between the 48 geological drilling holes and the diameters of the karst caverns.
Figure 10.
Fractal model describing the relationship between the 48 geological drilling holes and the diameters of the karst caverns.

Figure 11.
Fractal model describing the relationship between the 937 grouting holes and the diameters of the karst caverns.
Figure 11.
Fractal model describing the relationship between the 937 grouting holes and the diameters of the karst caverns.
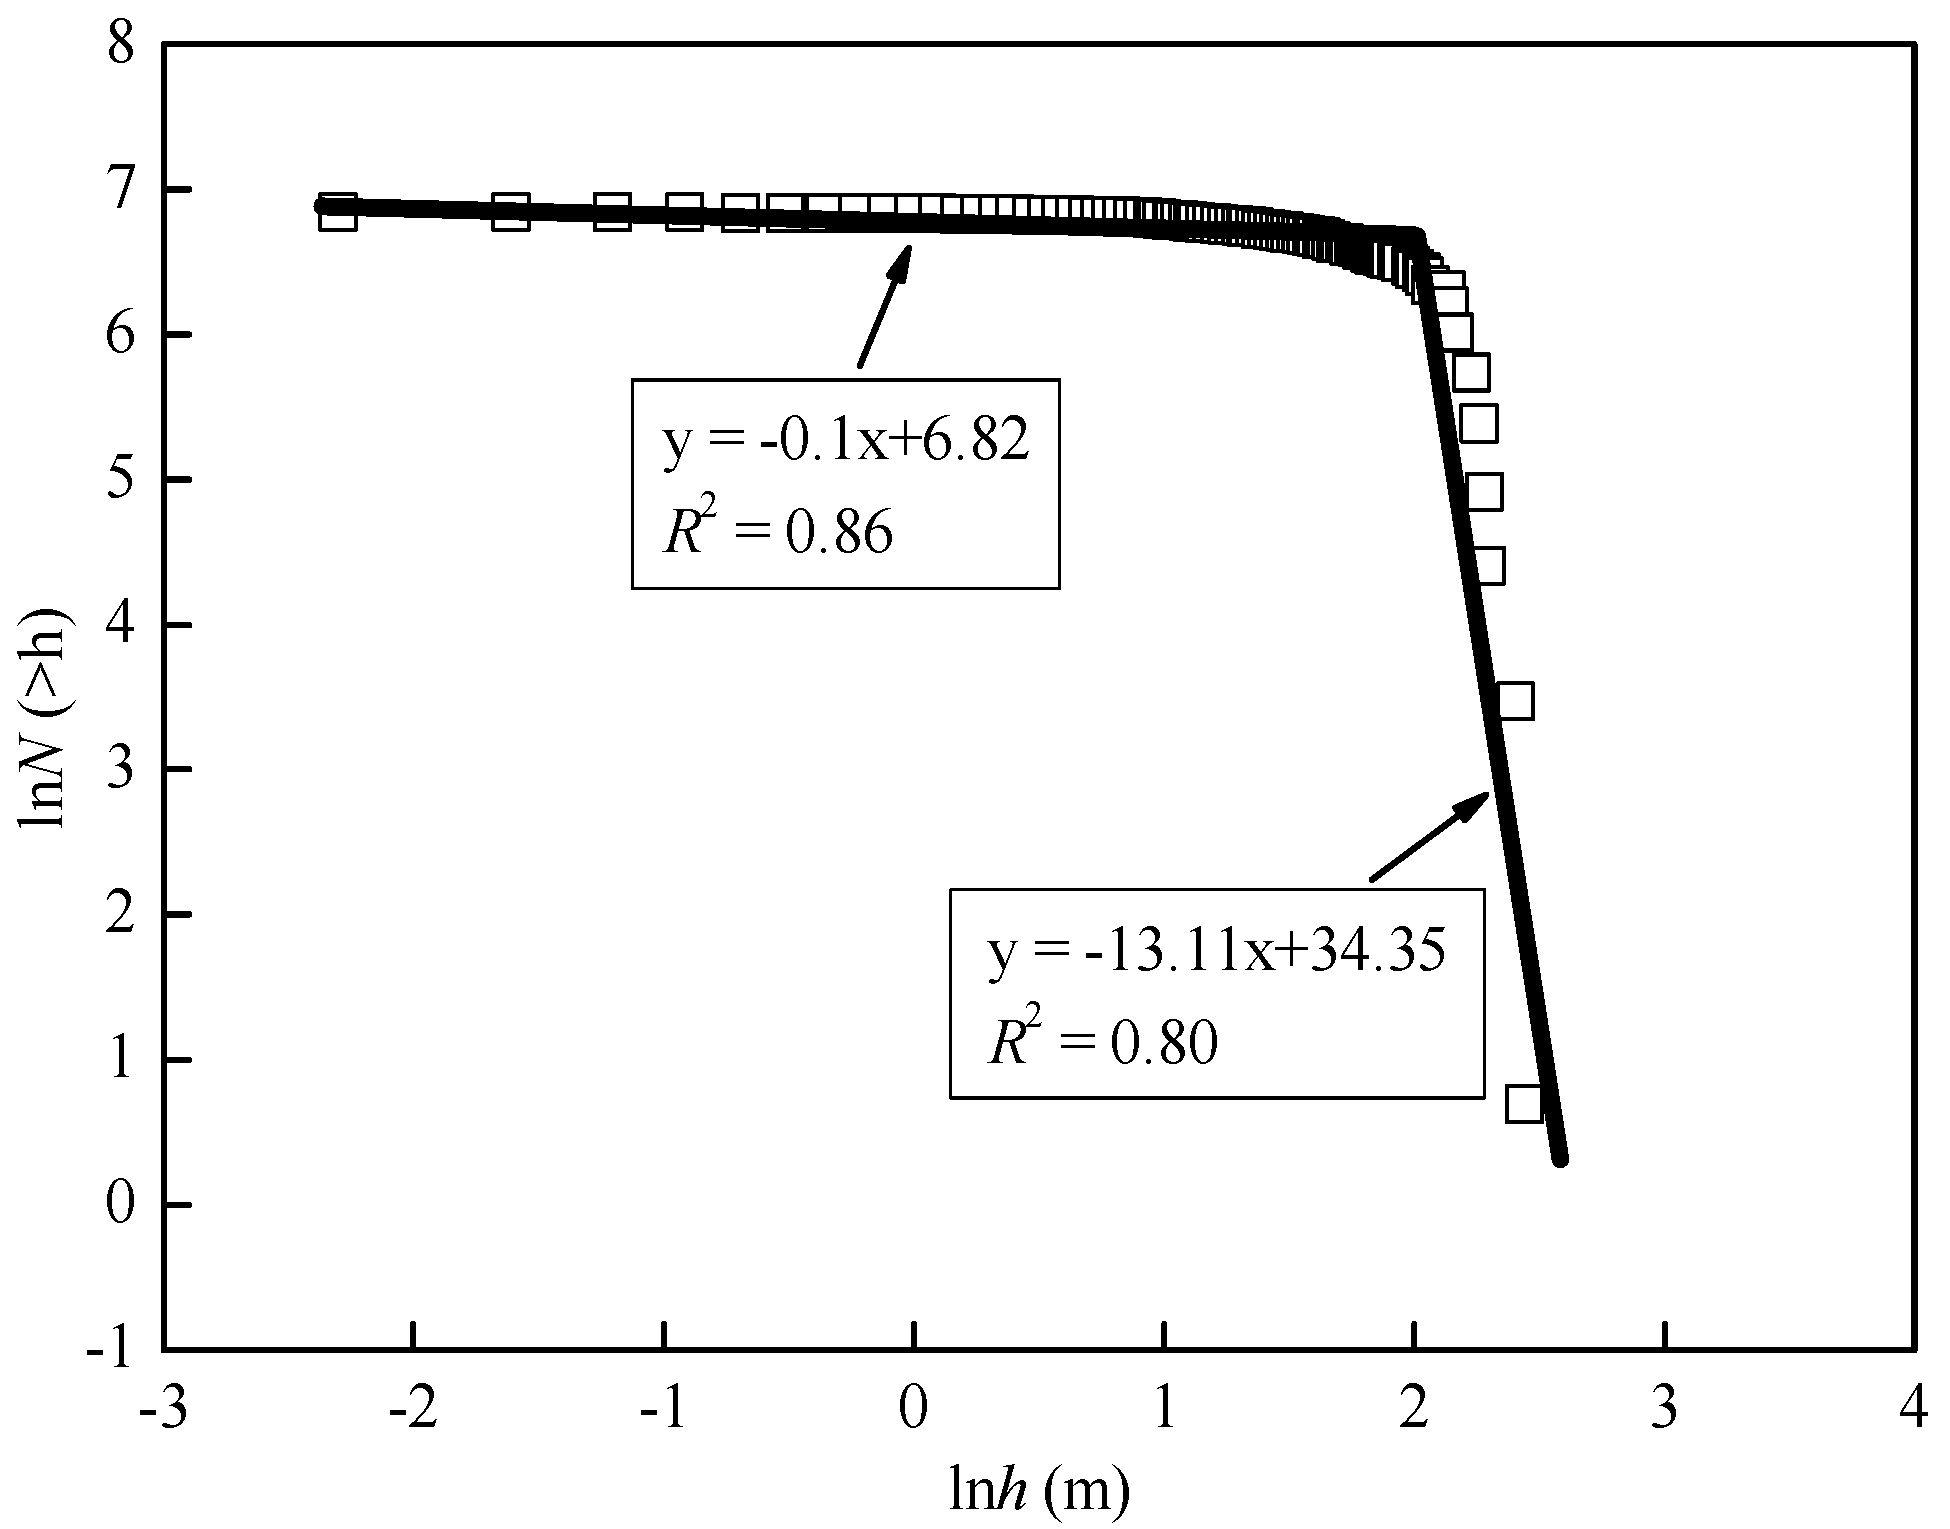
Figure 12.
Longitudinal distribution profiles of the karst caverns discovered in the Ma-Lian section (For location of profiles A-A, B-B, and C-C please refer to Figure 13).
Figure 12.
Longitudinal distribution profiles of the karst caverns discovered in the Ma-Lian section (For location of profiles A-A, B-B, and C-C please refer to Figure 13).
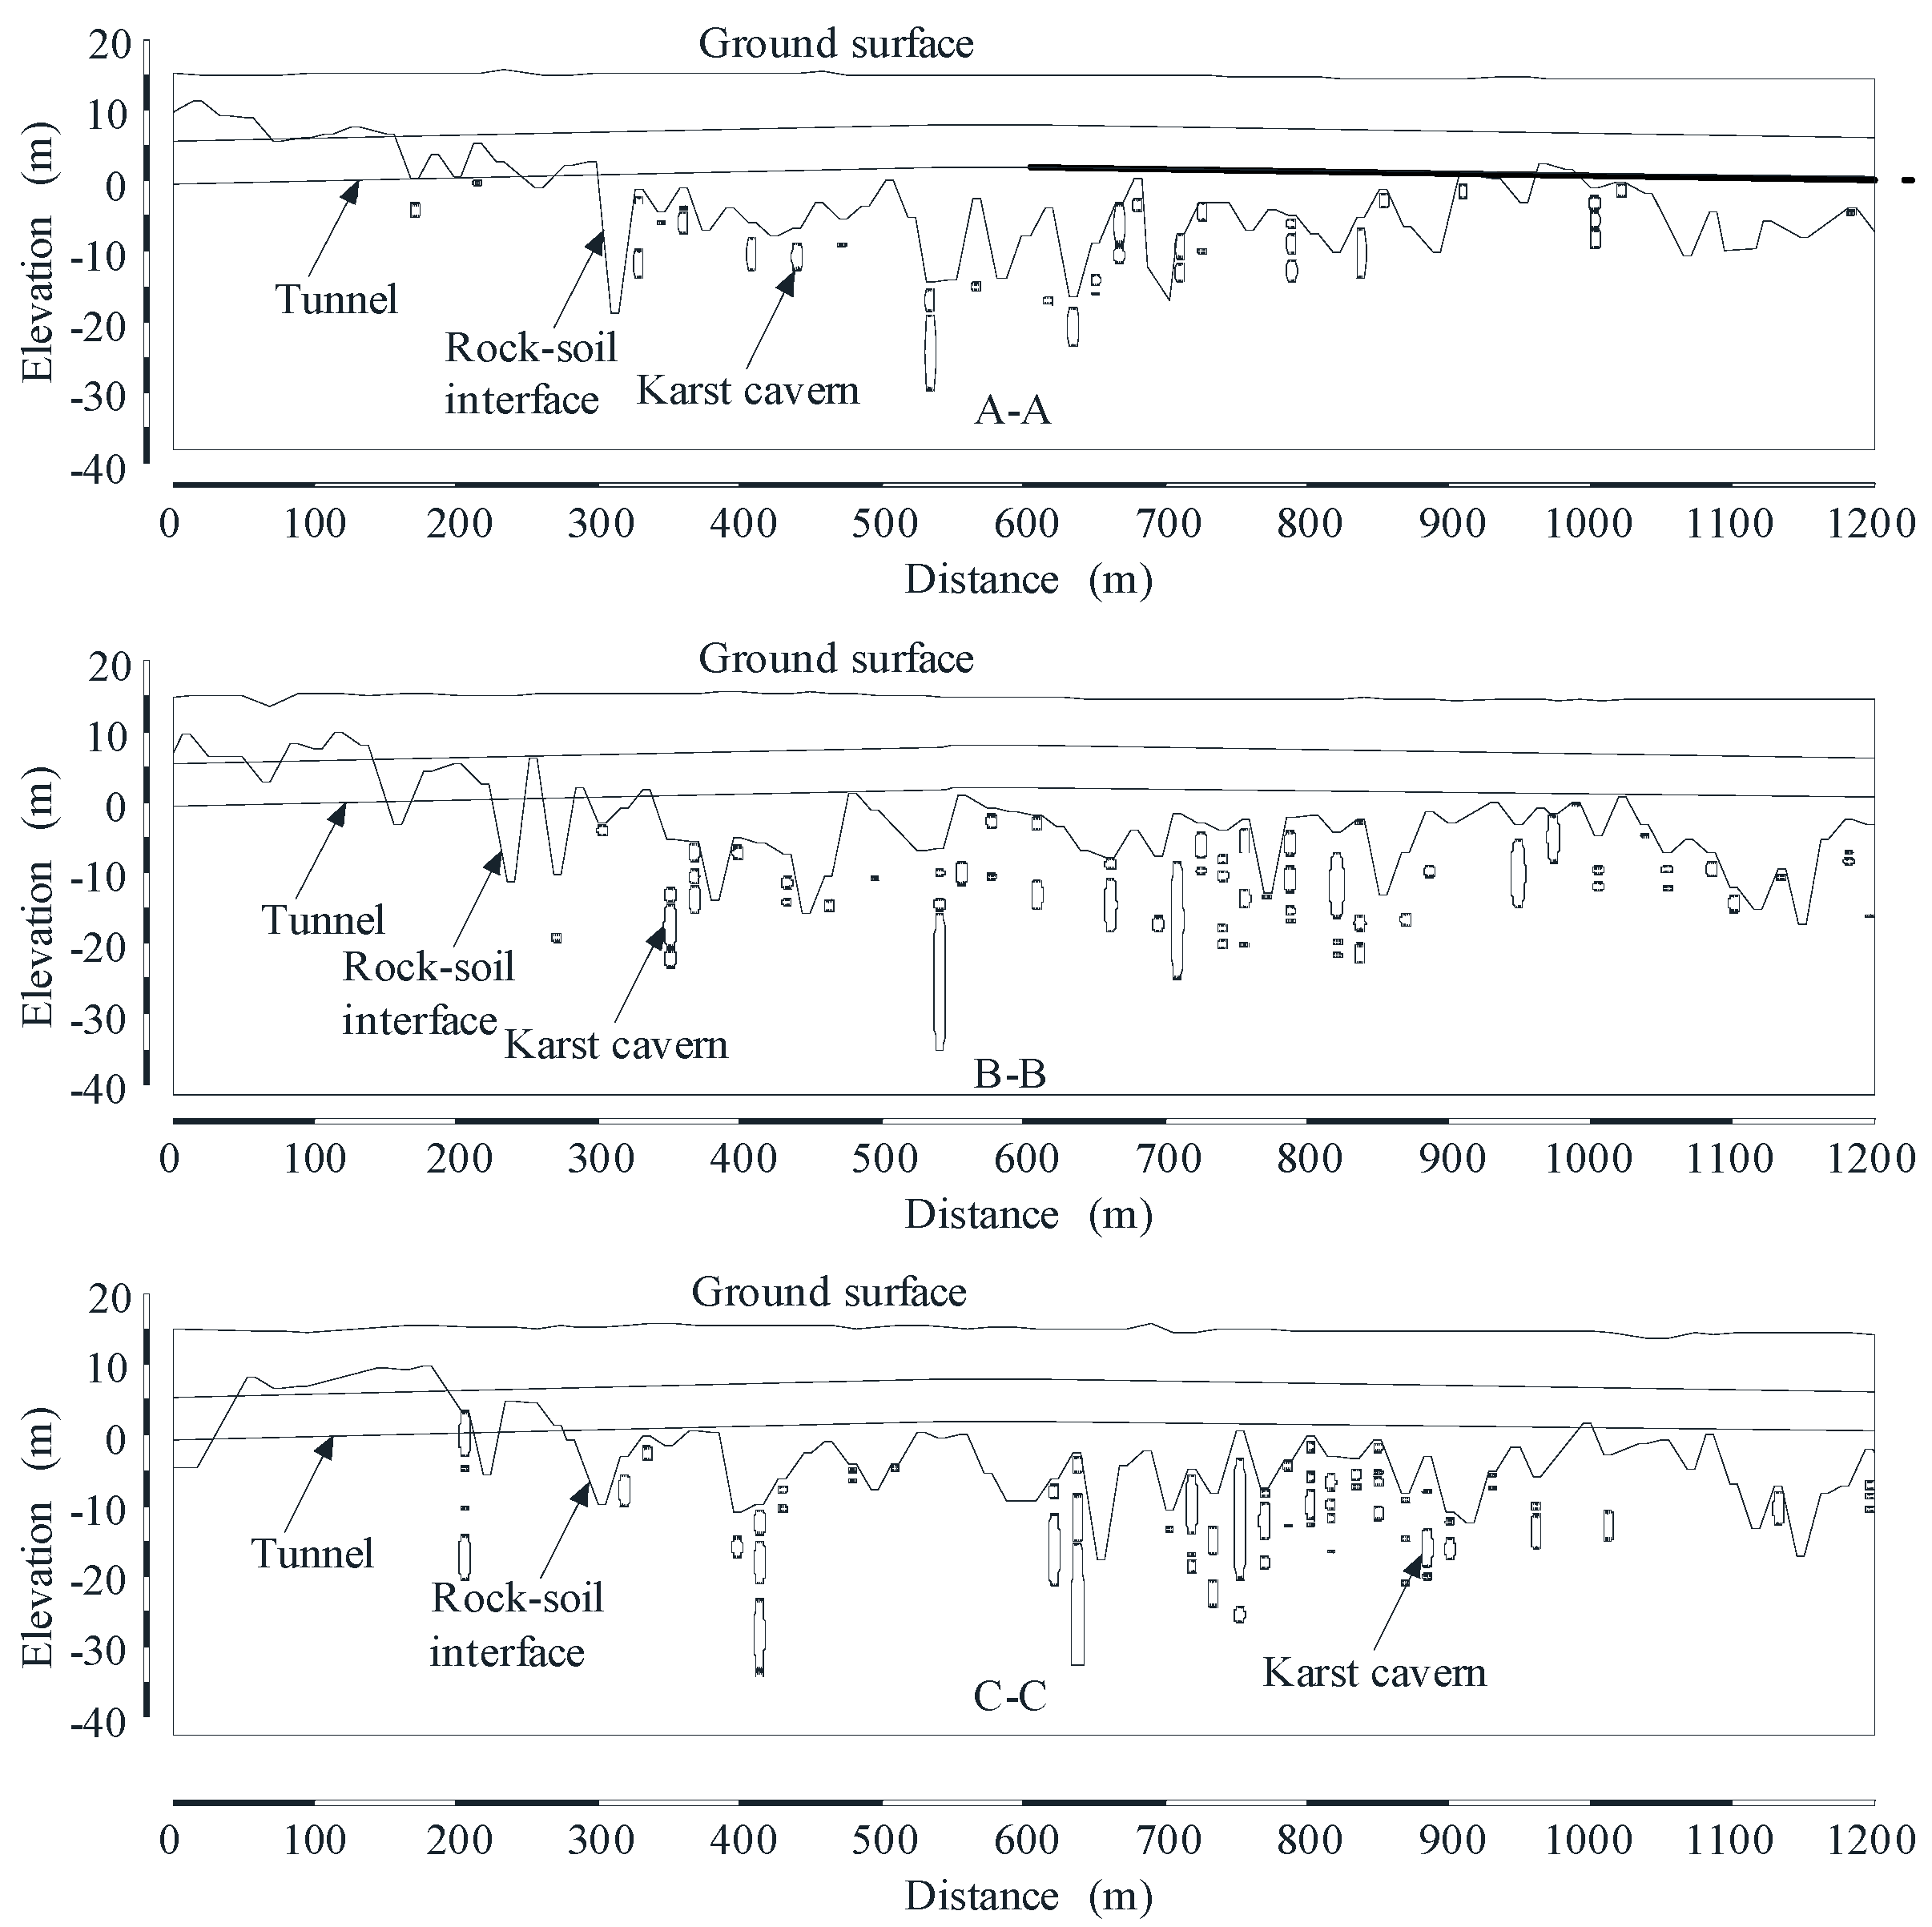
Figure 13.
Plane distribution of the karst caverns discovered in the Ma-Lian section.

Table 1.
Total volume estimates of the karst caverns and karst grouting coefficients for predicting the required volume of grouts.
Table 1.
Total volume estimates of the karst caverns and karst grouting coefficients for predicting the required volume of grouts.
| Case | Covering Area (m2) | Fractal Parameters | V (m3) | RC (m3) | VR | ||||
|---|---|---|---|---|---|---|---|---|---|
| h1 | D1 | h2 | D2 | hmax | |||||
| A | 20,384 | 0.2 | 0.27 | 1.6 | 0.15 | 9.6 | 20,446.9 | 2292.1 | 0.11 |
| B | 9984 | 0.12 | 0.18 | 1.5 | 0.16 | 8.6 | 8742.2 | 0.26 | |
| C | 3748 | 0.1 | 0.1 | 7.9 | 13.11 | 11.5 | 2083.7 | 1.1 | |
Case numbering refers to three datasets mentioned at the beginning of “Method Verification” section.
© 2017 by the authors. Licensee MDPI, Basel, Switzerland. This article is an open access article distributed under the terms and conditions of the Creative Commons Attribution (CC BY) license (http://creativecommons.org/licenses/by/4.0/).
Share and Cite
MDPI and ACS Style
Cheng, W.-C.; Cui, Q.-L.; Shen, J.S.-L.; Arulrajah, A.; Yuan, D.-J. Fractal Prediction of Grouting Volume for Treating Karst Caverns along a Shield Tunneling Alignment. Appl. Sci. 2017, 7, 652. https://doi.org/10.3390/app7070652
AMA Style
Cheng W-C, Cui Q-L, Shen JS-L, Arulrajah A, Yuan D-J. Fractal Prediction of Grouting Volume for Treating Karst Caverns along a Shield Tunneling Alignment. Applied Sciences. 2017; 7(7):652. https://doi.org/10.3390/app7070652
Chicago/Turabian StyleCheng, Wen-Chieh, Qing-Long Cui, Jack Shui-Long Shen, Arul Arulrajah, and Da-Jun Yuan. 2017. "Fractal Prediction of Grouting Volume for Treating Karst Caverns along a Shield Tunneling Alignment" Applied Sciences 7, no. 7: 652. https://doi.org/10.3390/app7070652
Note that from the first issue of 2016, this journal uses article numbers instead of page numbers. See further details here.