
Auditory Distance Control Using a Variable-Directivity Loudspeaker †


Institute of Electronic Music and Acoustics, University of Music and Performing Arts Graz, Inffeldgasse 10/III, 8010 Graz, Austria
*
Author to whom correspondence should be addressed.
†
This paper is an extended version of the paper published at the International Conference on Digital Audio Effects (DAFx-16), Brno, Czech Republic, 5–9 September 2016; pp. 295–300.
Appl. Sci. 2017, 7(7), 666; https://doi.org/10.3390/app7070666
Submission received: 19 April 2017
/
Revised: 14 June 2017
/
Accepted: 22 June 2017
/
Published: 29 June 2017
(This article belongs to the Special Issue Spatial Audio)
Abstract
:The directivity of a sound source in a room influences the D/R ratio and thus the auditory distance. This study proposes various third-order beampattern pattern designs for a precise control of the D/R ratio. A comprehensive experimental study is conducted to investigate the hereby achieved effect on the auditory distance. Our first experiment auralizes the directivity variations using a virtual directional sound source in a virtual room using playback by a 24-channel loudspeaker ring. The experiment moreover shows the influence of room, source-listener distance, signal, and additional single-channel reverberation on the auditory distance. We verify the practical applicability of all the proposed beampattern pattern designs in a second experiment using a variable-directivity sound source in a real room. Predictions of experimental results are made with high accuracy, using room acoustical measures that typically predict the apparent source width.
1. Introduction
Studies on sound localization mainly focus on the directional aspect and auditory distance perception receives substantially less scientific attention. However, a recent review of localization studies could show that when listeners are asked to describe the location of perceived auditory objects, the most commonly attribute used is distance [1]. The several distance cues assessed by the auditory system vary in their effective ranges and can be divided into two group, cf. [2,3]. While the first group of cues yields an absolute distance perception based on internal references, distance perception obtained from cues of the second group is a relative judgment. The most-studied indicator from the relative cues is amplitude. In the free field, where only the direct sound is present, the amplitude decreases with distance. As the auditory system is exquisitely sensitive to small changes in amplitude, it permits fine relative distance discrimination. For simple implementation electro-acoustic applications can use gain modifications to shape auditory scenes with regard to distance. The so-called D/R ratio (direct-to-reverberant energy ratio) is a cue providing coarse but absolute distance information, as shown in several studies [4,5,6,7]. In a room, the D/R ratio is inversely related to the distance of the sound source and characterizes the energy ratio of direct and reflected sound.
Laitinen [8] proposed an elegant solution to control the D/R ratio from a single point in the room. He employed a sound source controlled to approximate an omni-directional directivity and a second-order cardioid pattern steering away from or towards the listener. This variation of the directivity achieved control of the D/R ratio in a relatively dry and small room.
Our contribution extends Laitinen’s approach by an auralization-based listening experiment of (i) a directional source in various ideal higher-order beampattern designs/beam constellations, (ii) two different rooms, (iii) two different source-listener distances, (iv) including single-channel reverberation. In addition to Laitinen’s work, our paper establishes models of the hereby achieved auditory distance using simple acoustical measures. In extension to our previous study presented at DAFx [9], this article also includes the results of a second experiment using (v) the icosahedral loudspeaker (IKO), with a more elaborate third-order beampattern control [10] to synthesize the various beampatterns in a room.
The paper is arranged as follows: It outlines the first experiment based on auralized rooms and directivities and presents detailed results with discussions of the influence of room, signal, and reverberation. The second section presents models of the experimental results. The last section presents the second experiment that verifies the practical applicability of the beampattern designs to the directivity synthesis by the IKO in a real room.
2. Experiment I: Directivity-Controlled Auditory Distance in Auralized Rooms
Considered beampatterns up to the third order are based on frequency-independent beampattern designs by a combination of Legendre polynomials , using max- weights that are common in Ambisonics (cf. [11,12])
This exhibits a relatively narrow main lobe and sufficiently suppressed side lobes for any beam order i.
The proposed beampattern designs vary:
- A
- the beam order i from three to zero for and ;
- B
- the ratio of two opposing beams: ;
- C
- the angle of a beam pair: .
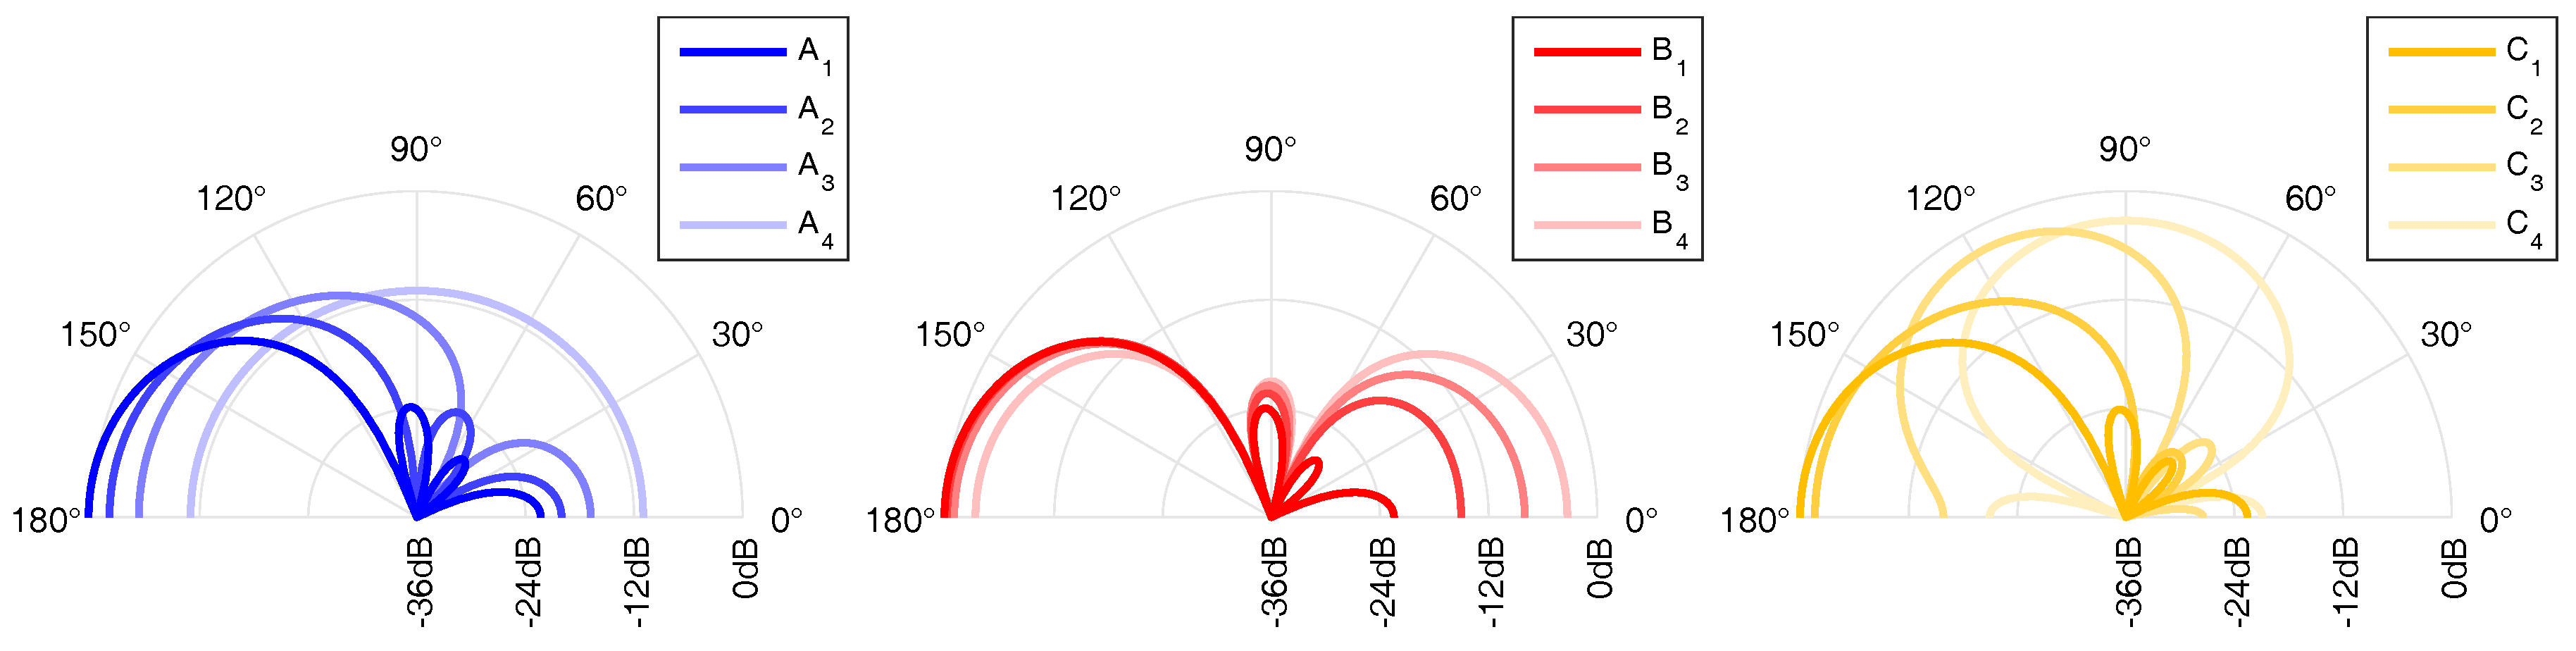
Table 1 lists all tested beampattern designs in particular, which differently modify the amount of diffuse, lateral, and direct energy, thus the D/R ratio. Each beampattern indicated by the index 1 and 7 corresponds to a 3rd-order beam facing towards and away from the listening position (, ). Furthermore, beam pairs indicated by indices , , and of each design are identical in their shape but horizontally rotated by . Figure 1 shows the beampatterns , , and normalized to constant energy.
2.1. Experimental Setup
The effect is evaluated in a first listening experiment, in which the variable-directivity source in a room is auralized using the image source method. The room is shoebox-shaped with a frequency-independent absorption coefficient . Specular reflections up to 3rd order are considered [13] and diffuse reflections are simulated as spherical harmonics using the software tool MCRoomSim [14]. For simplicity, diffuse reverberation of an omni-directional excitation is considered.
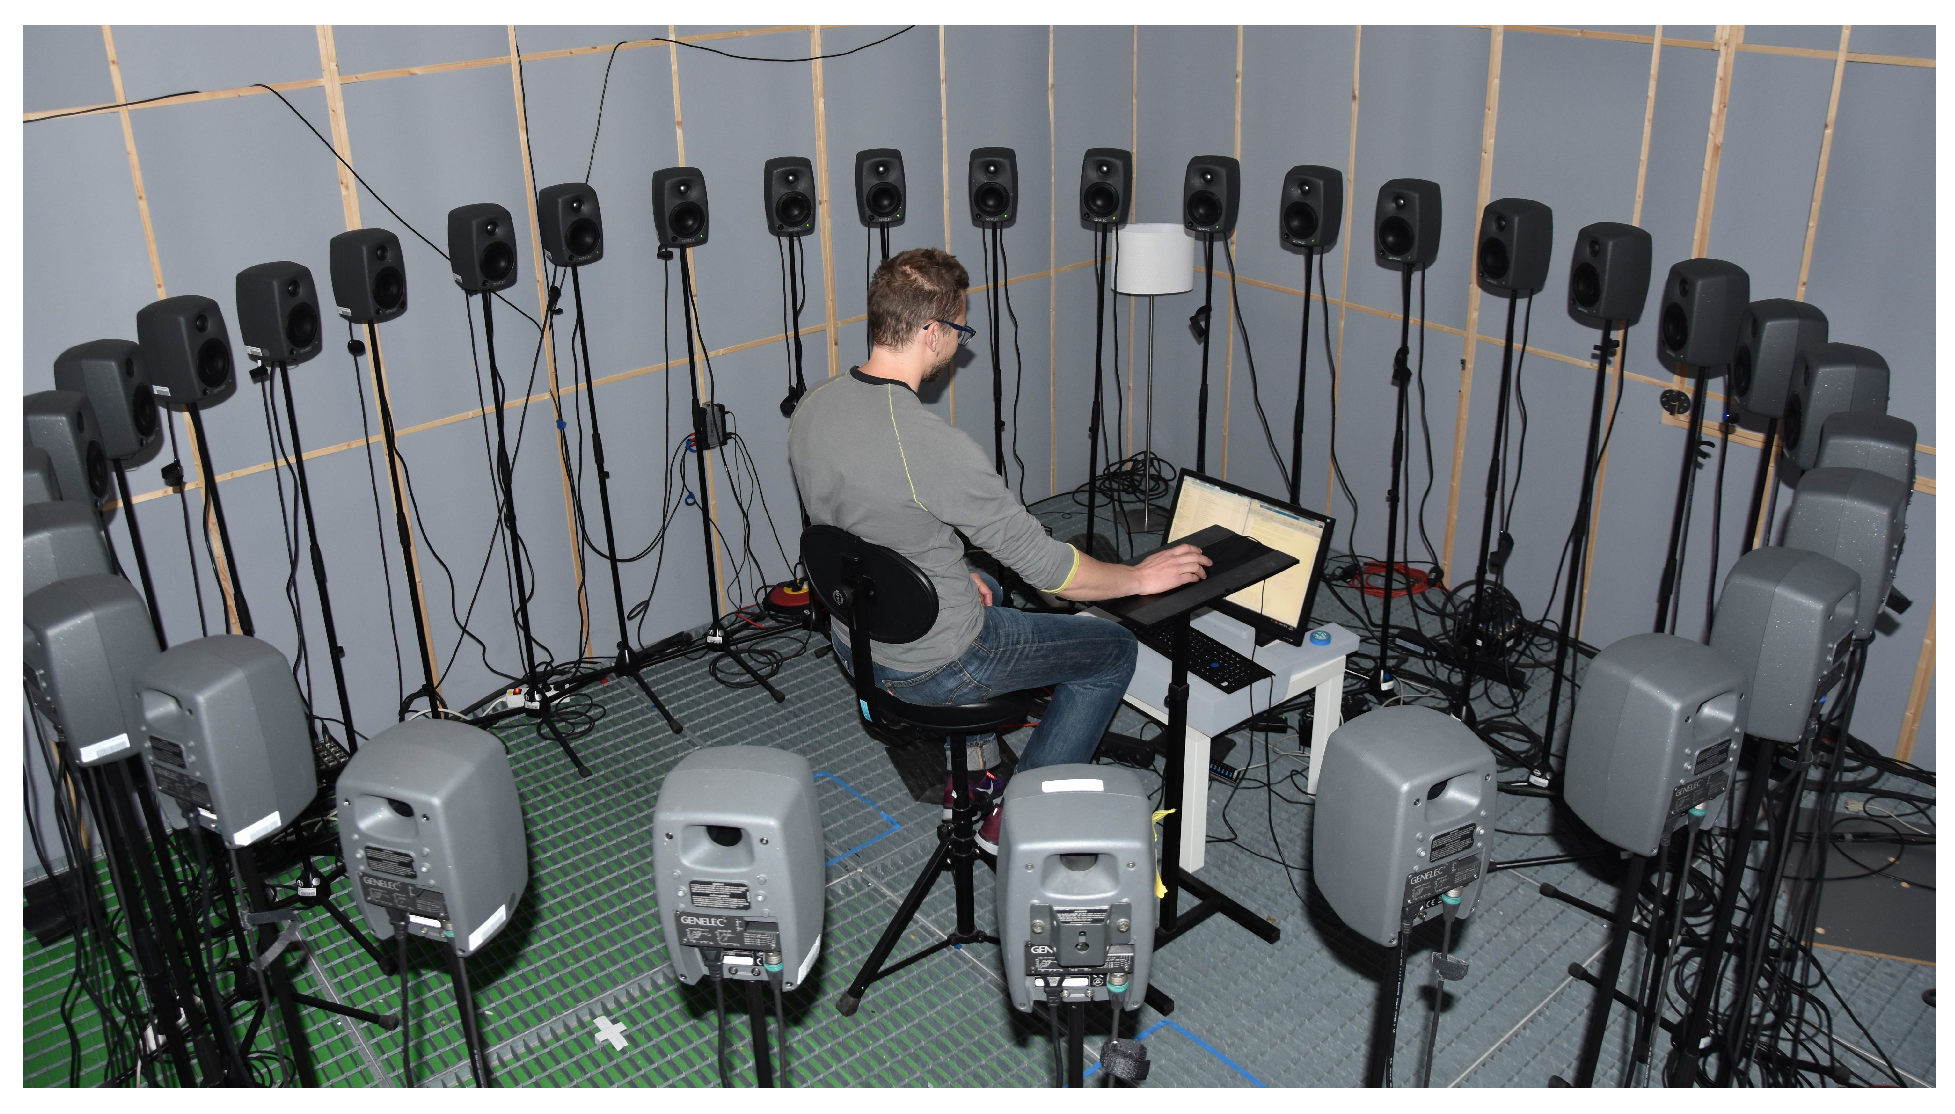
Playback employed a ring of 24 equally-distributed Genelec 8020 loudspeakers with a radius of placed in an anechoic laboratory. Each listener was sitting in the center of the arrangement with ear height adjusted to the loudspeaker ring, cf. Figure 2.
On the circular setup each specular reflection is auralized by the loudspeaker with the closest azimuth angle. This avoids timbral effects of amplitude panning [15]. Elevated specular reflections are attenuated in the auralization by the cosine of their elevation. Diffuse reflections are played back in Ambisonics format. The impulse response of the l-th loudspeaker is obtained after superimposing specular and diffuse reflections using MATLAB.
Obviously, a two-dimensional representation of a three-dimensional sound field is not optimal, but findings in [16] indicate that reflections from floor and ceiling do not have a significant influence on the auditory distance.
Each impulse response was convolved with the signals , yielding a 24-channel audio file for each condition. Audio playback was controlled by the open source software Pure Data on a standard PC with RME MADI audio interface and DirectOut D/A converters.
To monitor the influence of room acoustics, three different layouts were tested, including two rooms and two source-listener distances, cf. in Table 2.
Geometry and reverberation time of the auralized rooms are based on two rooms at our institute, namely the IEM CUBE, a large room with , and the IEM Lecture Room, with . Both rooms were chosen as they are typical venues for concerts or experiments with the IKO as a variable-directivity source [17,18].
The simulated sound source was placed near the corners of the room at a distance of and (IEM CUBE) and and (IEM Lecture Room). The listening position was chosen at a virtual distance of to the sound source. Additionally, for the IEM CUBE an increased source-listener distance of was tested.
The listener was facing the sound source simulated at height of above the floor with an angular offset of with regard to the sidewalls. Figure 3 shows the setup of the auralized room using the 24-channel loudspeaker ring and Table 2 lists rooms and source-listener distances tested in the experiment.
The signals fed into auralization were chosen to investigate the influence of speech versus noise, noise spectrum, and noise envelope to the effect: female speech (), a sequence of irregular artificial bursts (), and Gaussian white noise shaped to speech spectrum () as listed in Table 2. For , envelope fluctuations were slightly accentuated by multiplying the noise with its Hilbert envelope and by restriction to its original bandwidth, cf. [19]. By this procedure, and have similar spectra and kurtosis, which measures the envelope fluctuation, whereas is more transient with more energy at frequency above . All signals were normalized to their RMS value for level equalization.
The above signals are anechoic. To monitor potential influence of additional reverberation for some conditions, signals were reverberated before auralization. Two levels of reverberation were tested, of which level 1 corresponds to a room impulse response with a reverberation time of , level 2 to one of , and level 0 to the anechoic signal.
The listening experiment was carried out as a multi-stimulus test where listeners had to comparatively rate multiple conditions, denoted as sets. Their task was to indicate the distance of auditory objects on a graphical user interface displaying a continuous slider for each condition of a set along the ordinal scale very close (vc), close (c), moderate (m), distant (d), and very distant (vd). The listeners were allowed to repeat each condition at will, and audio files were played back in loop. Fifteen listeners participated in the experiment (three female, twelve male; age 23–54). All of them were experienced listeners in 3D audio and experienced participants in psychophysical studies of hearing; all reported normal hearing acuity.
Tested sets (set 1 to 12, see Table 3) comprise 7 conditions, each representing a beampattern, room, signal, and reverberation level. Under a varied beampattern design, e.g., , the influence of room (set 1, 10, 11), signal (set 1, 2, 3), and reverberation level (set 1, 12) was only examined separately, yielding responses for each subject. These separate multi-stimulus sets do not yet permit cross comparison due to the absence of a common reference. As a solution, maintaining a limited testing time, the additional 9-stimulus comparison sets (13...15) were tested with fewer beampatterns and instead involving cross-comparisons with regard to signal (13), room (14), and reverberation level (15). They yield cross-comparison responses that enable a comparison involving a fine-grained directivity variation in Figure 6, Figure 7 and Figure 8.
In these figures, responses and were re-mapped for each listener by linear scaling and shifting to match with , and with , respectively:
i.e., a complete response set per listener, signal, room, and reverberation level.
During the listening session, the listeners were requested to face loudspeaker 1 (, cf. Figure 3), which corresponds to the direction of the auralized sound source.
At the beginning of the experiment, each listener was given a short training to familiarize with the evaluation scale. The training set included expected extreme values with regard to the auditory distance. Listeners were asked to rate along the whole scale and use extremes as an internal reference for further evaluations.
After the training phase, multi-stimulus tasks were presented. Each time a multi-stimulus set was displayed, the arrangement of its stimuli was an individual random permutation. The listener could have the stimuli sorted by own ratings to facilitate comparative rating. The first part of the experiment consisted of the sets with 7 stimuli (set 1 to 12) in an individual random permutation, and the second part of the sets consisting of 9 conditions (set 13 to 15) in an individual random permutation.
None of the listeners reported that they perceived the auralization as unnatural or confusing; some emphasized the naturalness of the auralization.
2.2. Influence of Beampattern Design
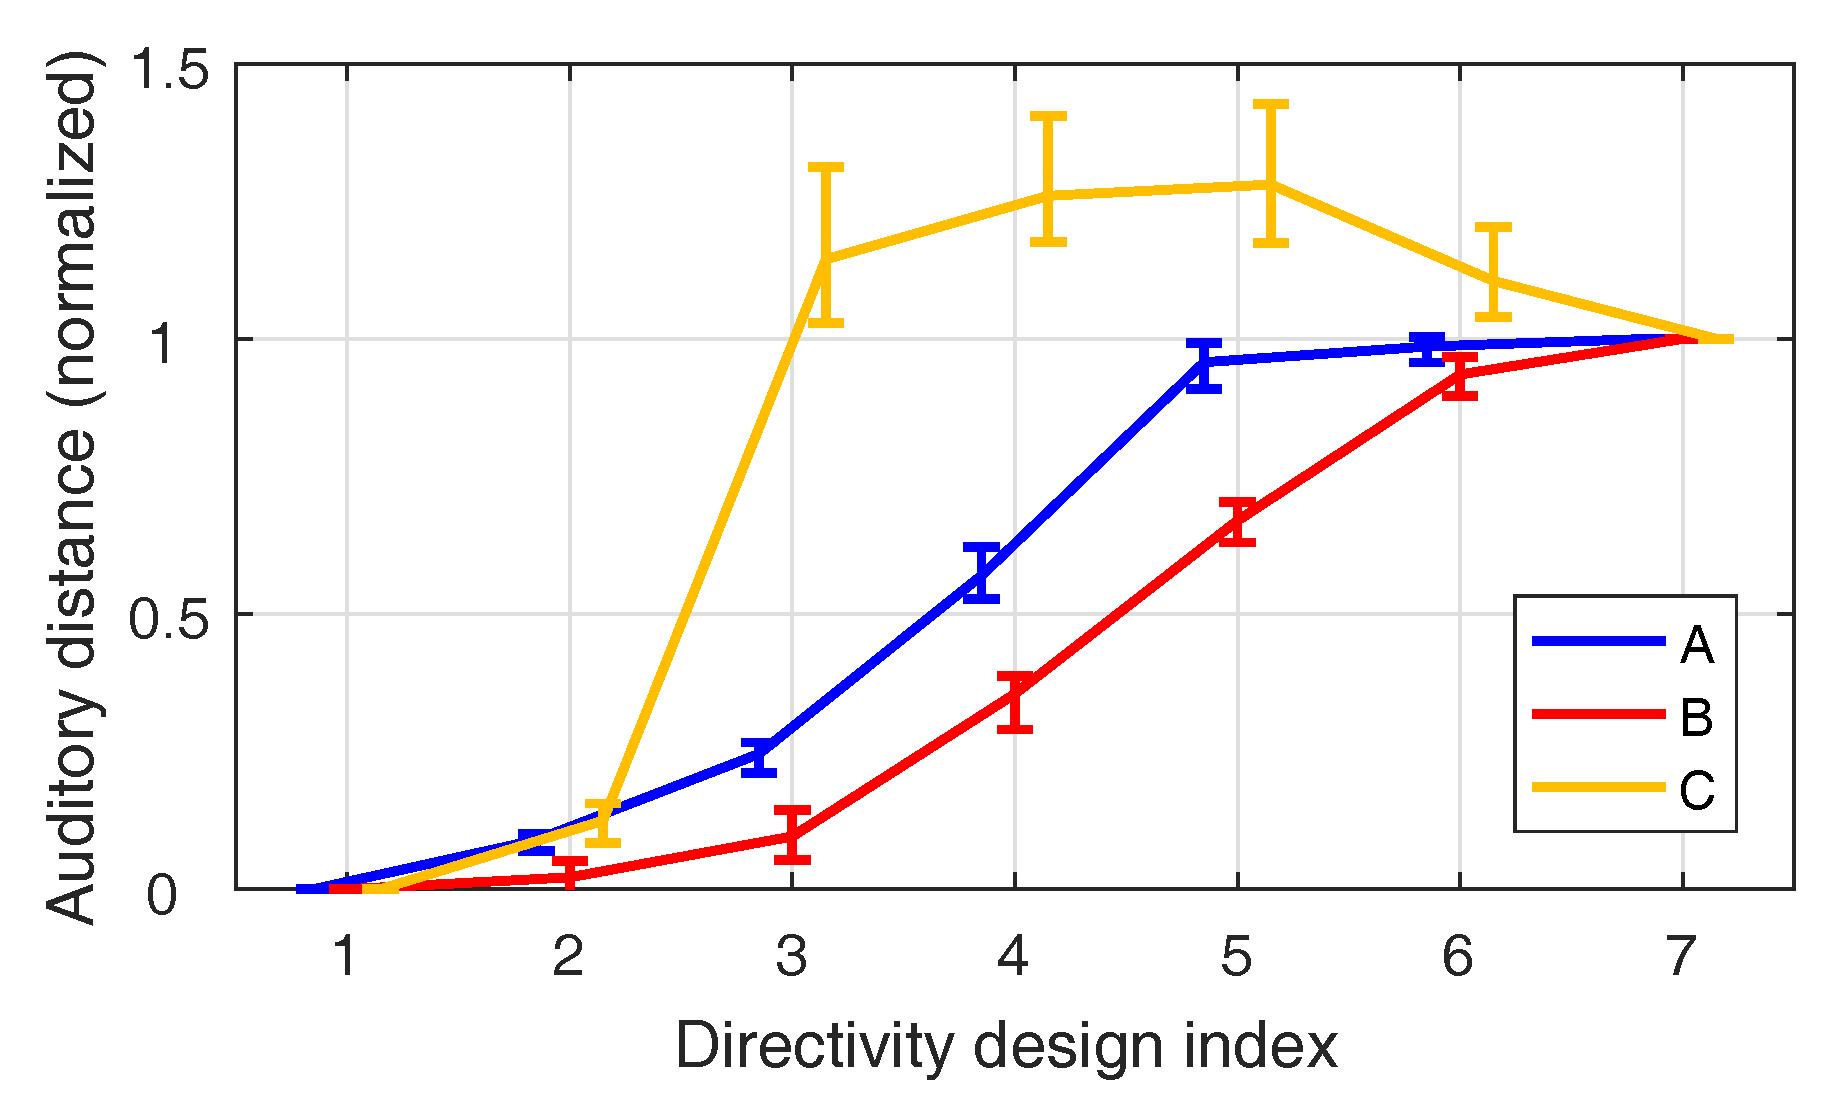
Figure 4 shows a detailed analysis of the auditory distance for the beampatterns , , and according to Table 1 and Figure 1, based on the responses to the sets , , and of Table 3, using all signals and the room . The direct comparability of all curves in Figure 4 is feasible as all designs were determined to include reference patterns corresponding to a 3rd-order beam facing to () and off () the listening position, respectively. This allowed to linearly re-map the responses gathered in the sets to fill out the entire interval for each listener. Figure 4 shows the medians and the corresponding 95% confidence intervals.
Both designs A and B yield monotonic curves. A pairwise analysis of variance (ANOVA) of the data pooled over all signals reveals the beampattern to be significant factor () for . For the design B, all directivities are (weakly) significant (, ).
A comparison of the curve obtained for to the results of Laitinen [8], reveals a similar linear mapping to auditory distance.
By contrast, the curve obtained for is not monotonic in the proposed sequence. If we compare strength and angle of direct sound and specular reflections arriving at the listener for directivities and , cf. Figure 5, we see more energy coming from lateral directions for . The more diffuse sound field explains the significantly greater auditory distance () for compared to .
For conditions with more energy coming from lateral directions, e.g., , major intersubjective differences are found affecting the size of respective 95% confidence intervals. Therefore we conclude that these conditions lead to an ambiguous distance percept.
2.3. Influence of the Signal
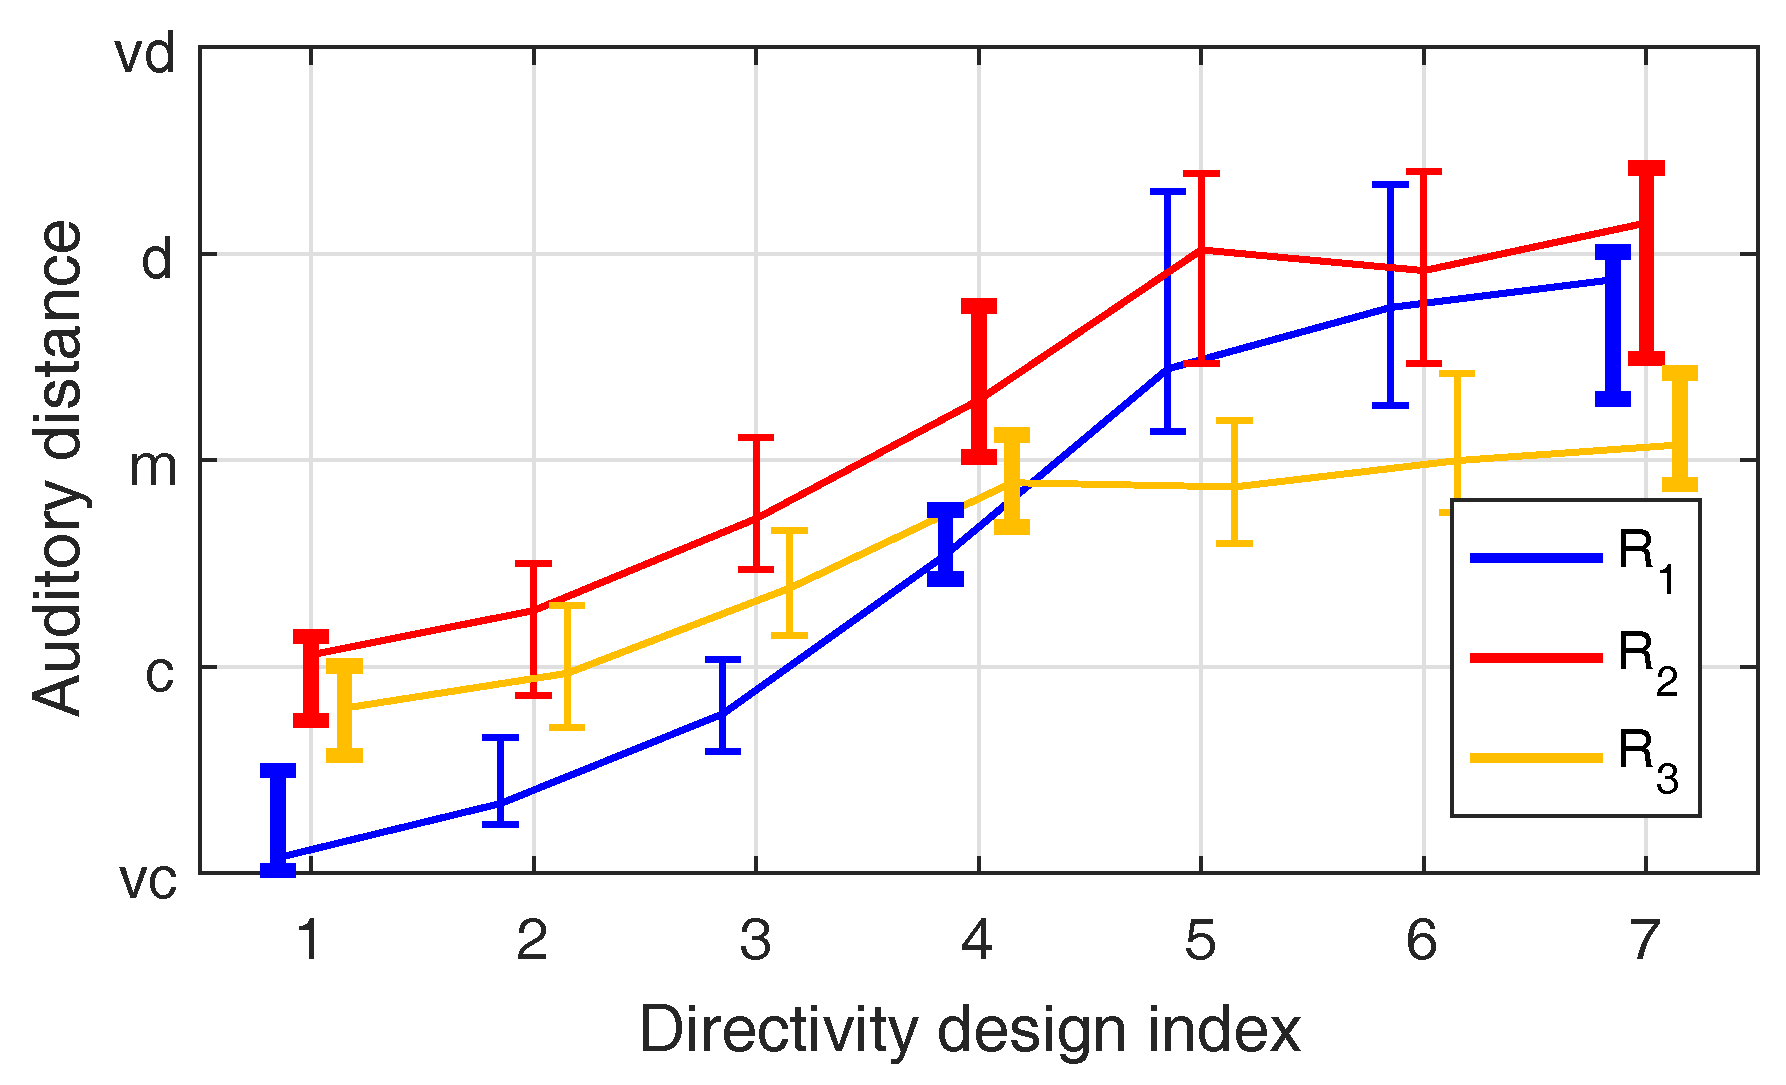
The influence of the signal on the auditory distance of the design A in is evaluated by supplementing responses of set 13 with re-mapped responses of set 1 to 3 using Equation (2).
Figure 6 shows the median values and corresponding 95% confidence intervals of the auditory distance for the room and beampattern design A. Along the indices, the distance impression exhibits a monotonic increase for all signals until . The ANOVA of neighboring values reveals beampatterns as a significant factor (). By contrast, beampatterns do not yield a significant change (), despite continuously reducing the D/R ratio. This seems to comply with a general tendency to auditorily underestimate the physical distance [2].
A signal-wise comparison of the obtained data reveals the significantly smaller auditory distance for than for or (, ). This seems to comply with the finding in [20,21] that the auditory distance of broadband signals decreases with the relative amount of high-frequency energy.
Figure 6.
Medians and 95% confidence intervals for tested signals in with beampattern design A.

2.4. Influence of the Room
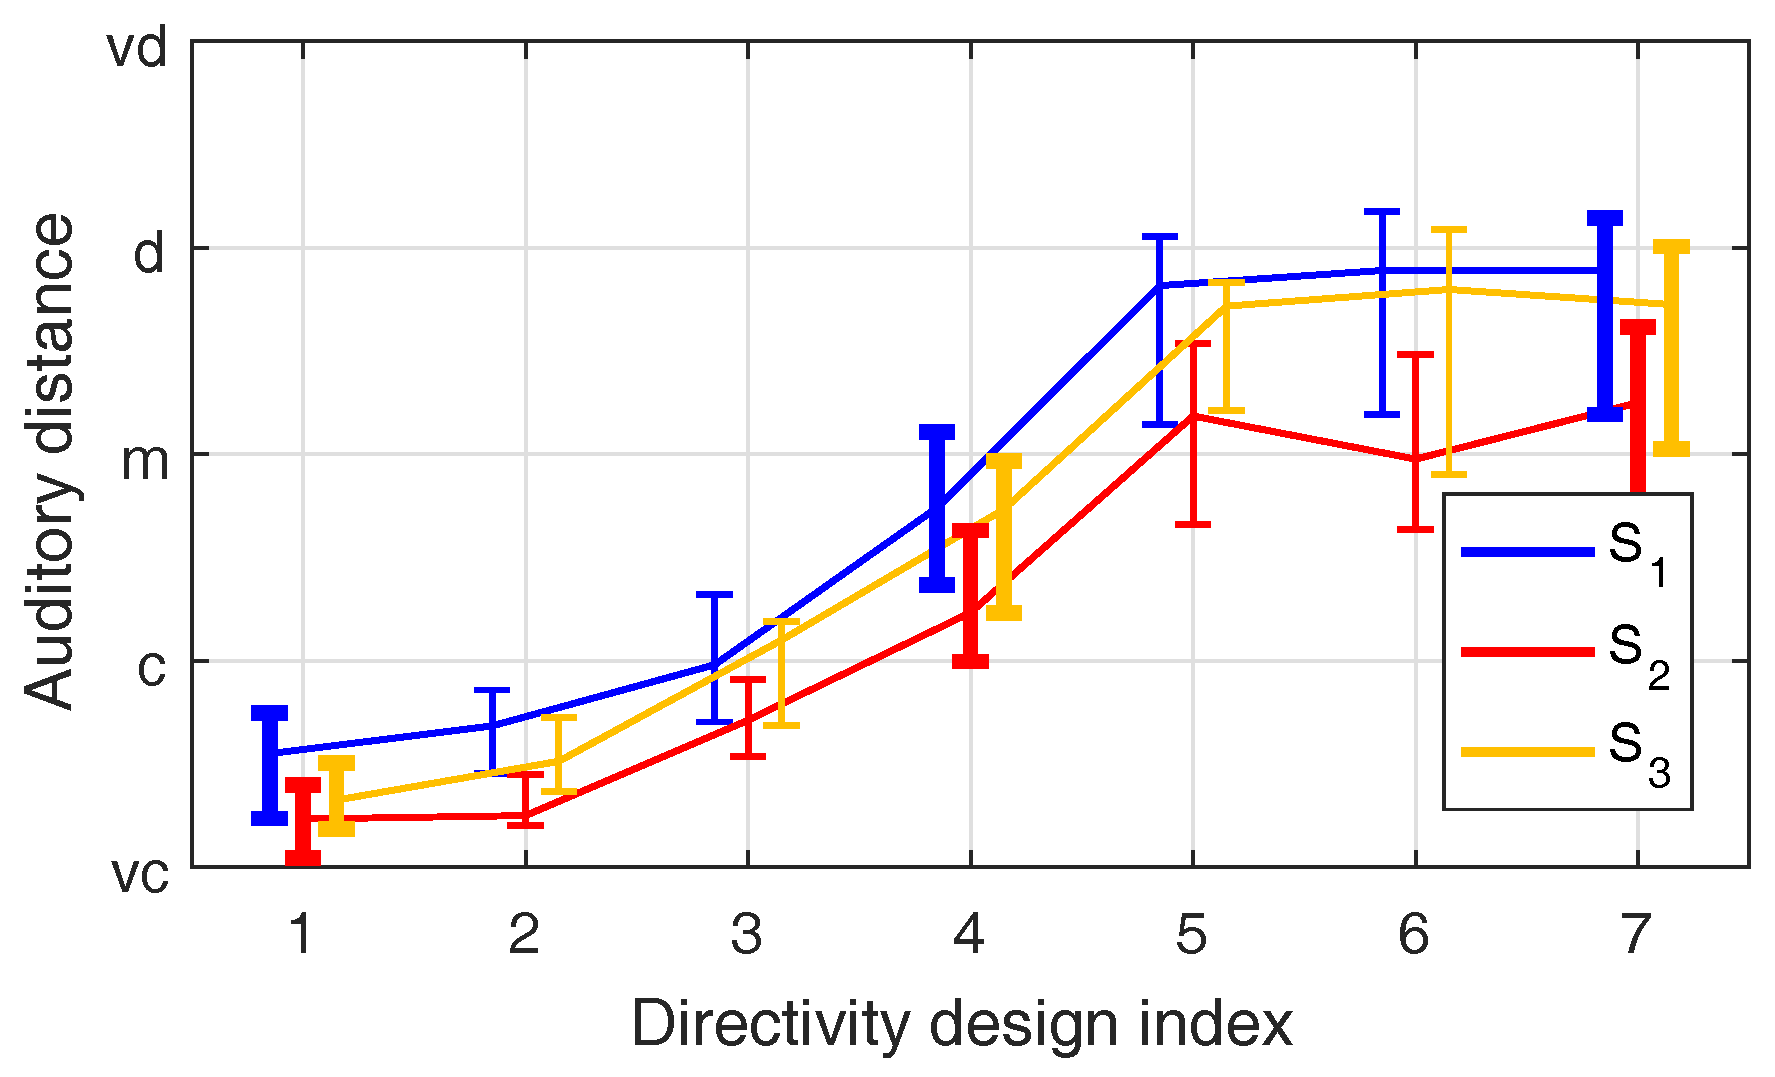
The influence of the room and the source-listener distance () is evaluated by the data of the set 14. Figure 7 shows the median values and corresponding 95% confidence intervals, regarding signal and beampattern design A, supplemented by the linearly and individually re-mapped responses of the sets 1, 10, and 11 using Equation (2).
A smaller room with shorter and sound source closer to adjacent walls but with the same source-listener distance () leads to a flatter curve. Similar flattening accompanied by an additional offset to bigger auditory distances is achieved by extending the source-listener distance (). Interestingly, for all tested rooms R the beampattern is a significant factor () in the range of . This significance is similar to the values obtained with pooled signals (, see Figure 6).
Figure 7.
Medians and corresponding 95% confidence intervals for tested rooms with beampattern design A and signal .
Figure 7.
Medians and corresponding 95% confidence intervals for tested rooms with beampattern design A and signal .

2.5. Influence of Single-Channel Reverberation
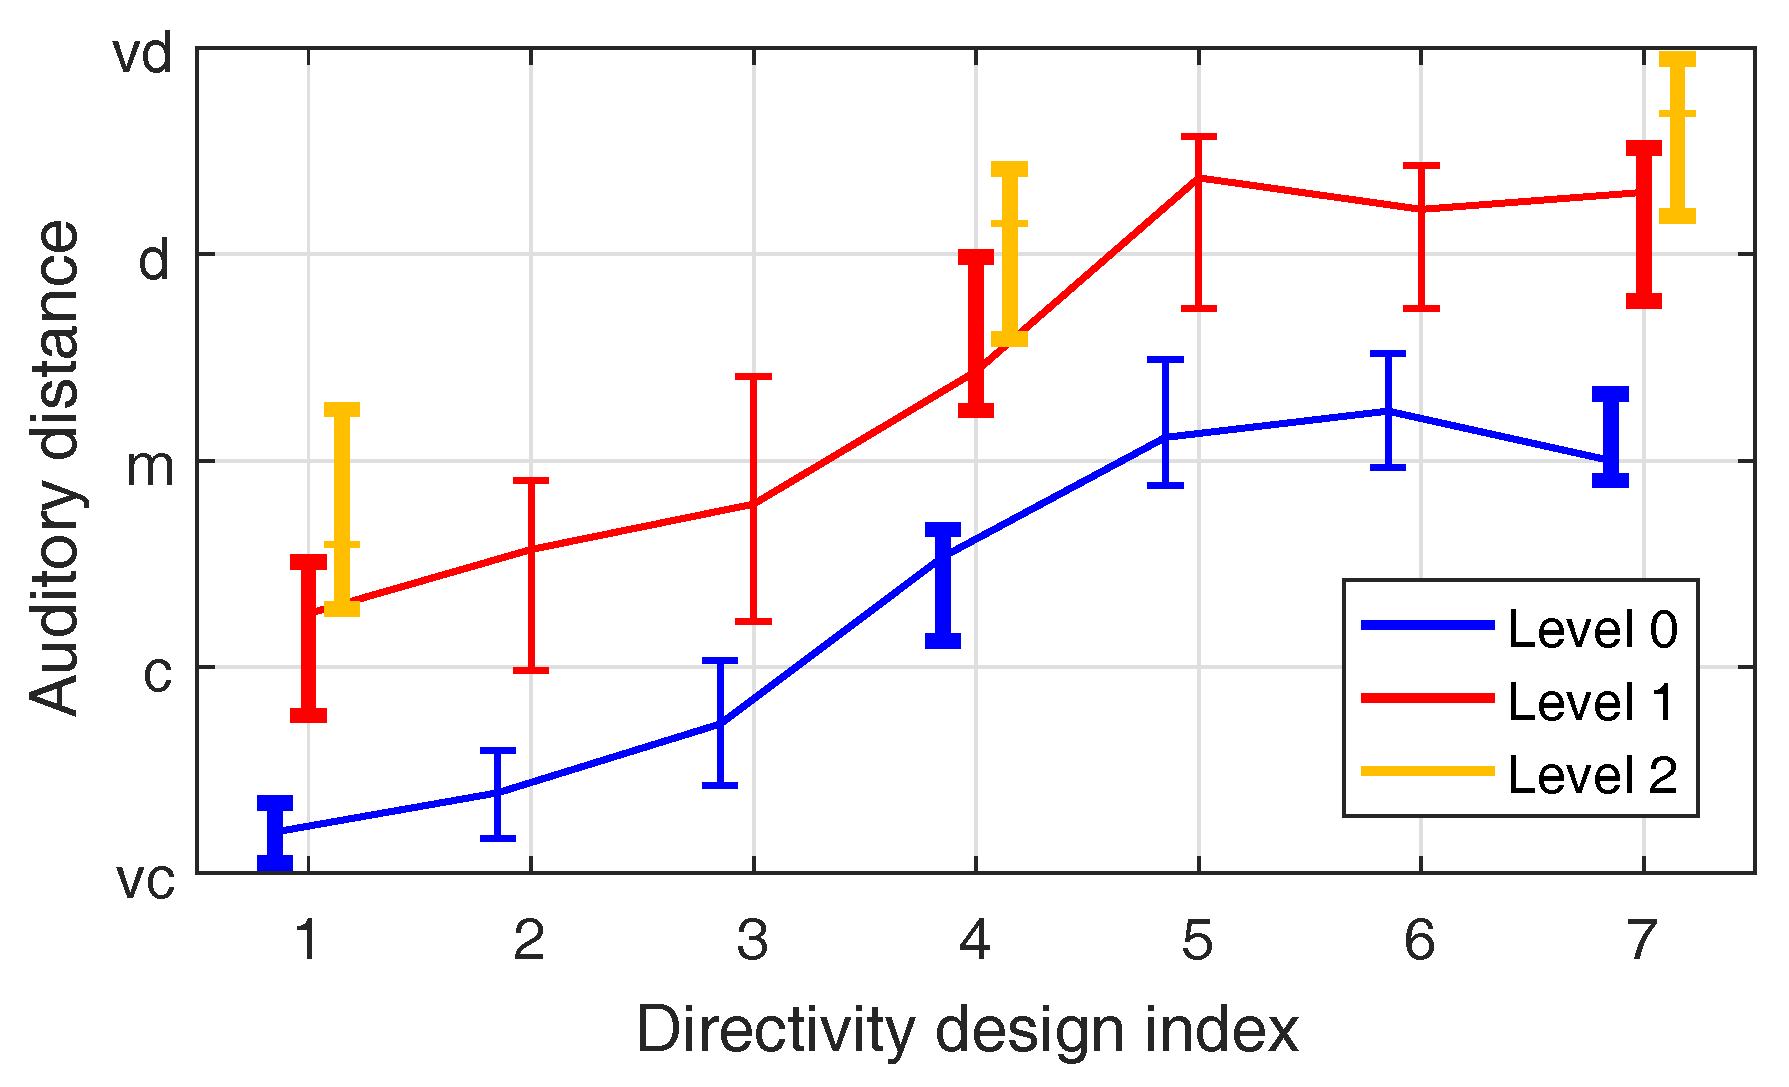
In audio playback reverberation effects are often used to control the auditory distance. To get an idea how this effect contributes to the proposed effect, artificial reverberation is added to signal and tested with beampattern patterns in room . Figure 8 shows respective median values together with corresponding 95% confidence intervals. According to the ANOVA, the influence of reverberation on the auditory distance is significant ().
Figure 8.
Medians and corresponding 95% confidence intervals for reverberation levels 0, 1, 2 in with and beampattern design A.
Figure 8.
Medians and corresponding 95% confidence intervals for reverberation levels 0, 1, 2 in with and beampattern design A.

Individually and linearly re-mapped responses from the sets 1 and 12 were used supplementing the responses from set 15 to provide a more detailed analysis for the reverberation levels in terms progression over the 7 design indices. Both reverberation levels yield a similar progression with the known saturation for . The beampattern is a (weakly) significant factor () for the dry signal (rev. level 0) in the range of , and by adding reverberation (rev. level 1), differences between the neighboring conditions and are no longer significant ().
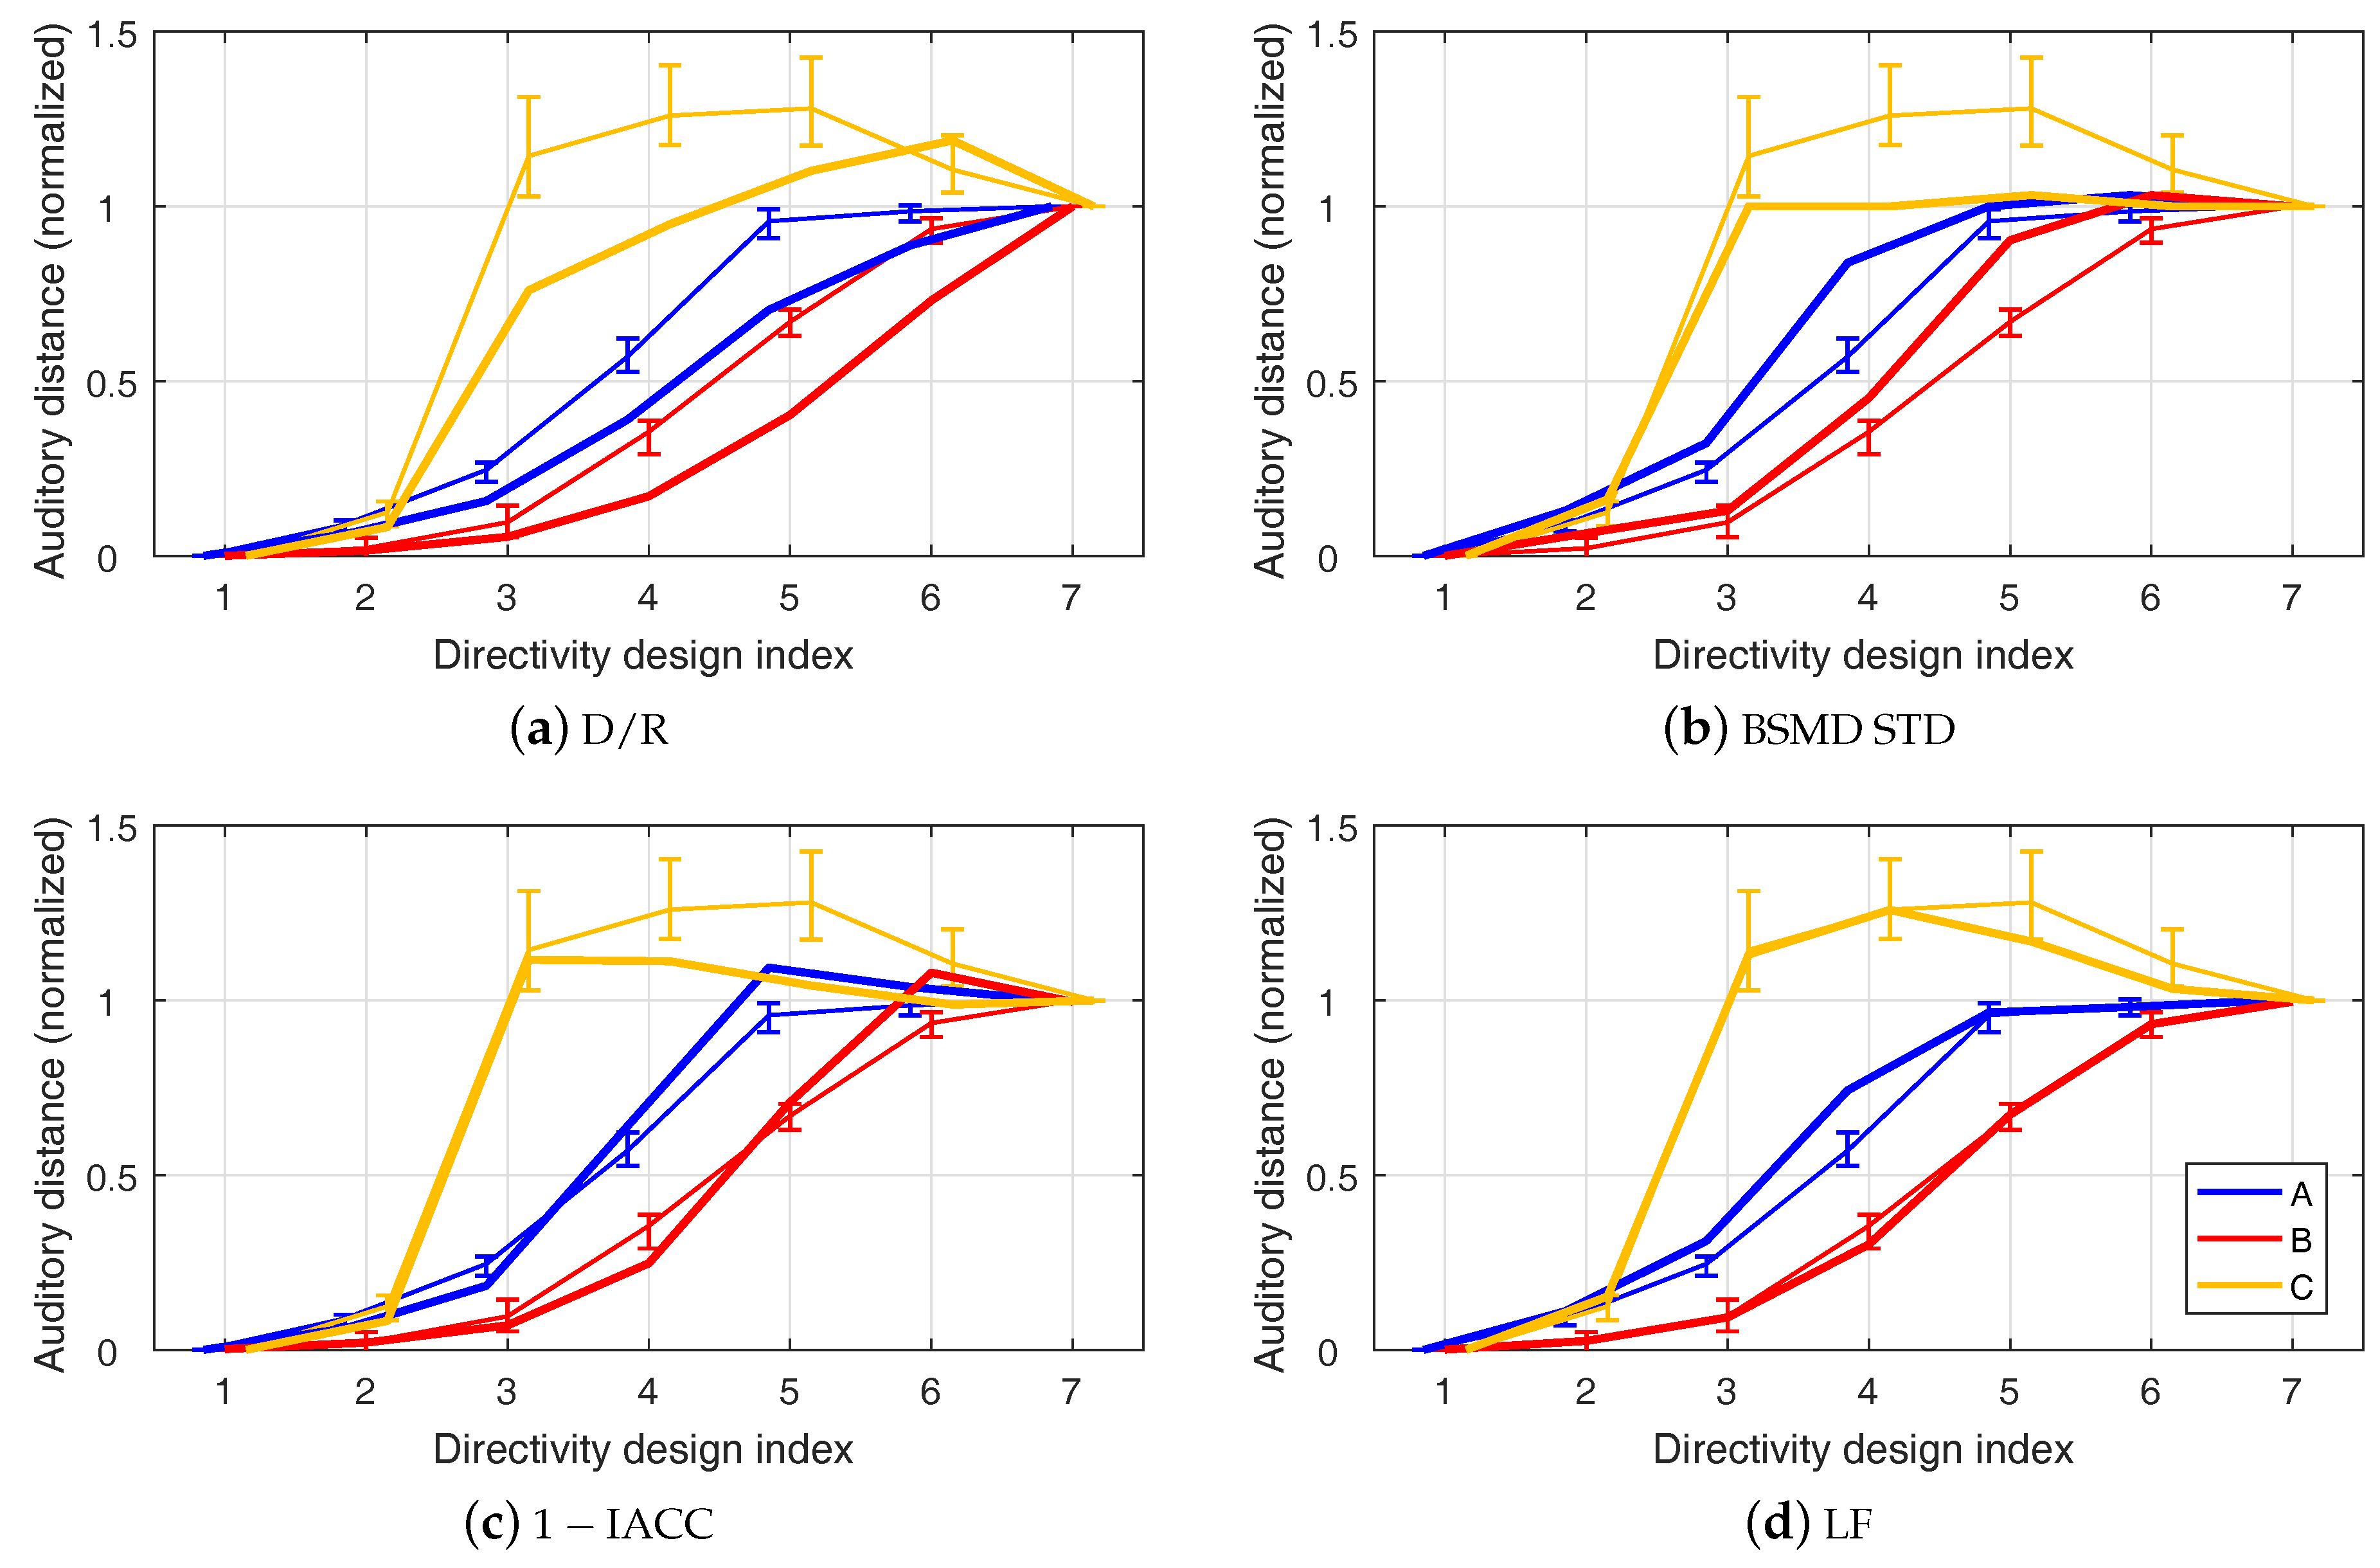
3. Modeling the Auditory Distance
This section discusses linear auditory distance models for the presented effect, based on characteristic metrics of the spatial sound field and their regression to the experimental data.
3.1. Direct-To-Reverberant Energy Ratio
The most obvious predictor in this context is the D/R ratio. It is widely accepted for prediction of auditory distance [2] and is defined as
By using , the D/R ratio can be calculated based on the loudspeaker impulse responses, with a time constant T regarding only direct sound.
Regression analysis fits a linear regression function depending on the D/R ratio to the normalized experimental data and yields and . Figure 9a shows the pooled data compared with . Although the D/R ratio and the median values of the pooled data are highly correlated () their progression along the beampattern indices tends to underestimate the distance.
3.2. Binaural Spectral Magnitude Difference Standard Deviation
In [22] a feature is introduced related to the standard deviation of the magnitude spectrum of the room transfer function. Similar to the D/R ratio, this feature, noted as BSMD STD, represents a distance-dependent behavior and is implemented to model the source-listener distance within the freely available Auditory Modeling Toolbox (http://amtoolbox.sourceforge.net/). For calculating the BSMD STD, any binaural signal is sufficient.
Binaural input signals are generated by firstly convolving the signal of each propagation path arriving at the listener with respective HRTF measurements of a KEMAR dummy-head microphone (freely accessible measurements of the MIT available at http://sound.media.mit.edu/resources/KEMAR.html) and then summing up obtained signals for each ear respectively. The linear regression yields the same correlation as the D/R ratio ( with and ), although their progression along the beampattern index is qualitatively different, cf. Figure 9b.
3.3. Inter-Aural Cross Correlation Coefficient
As reverberation caused by the room simulation introduces binaural cues by altering the sound attributes at the two ears differentially, the inter-aural cross correlation coefficient (IACC) is used as an additional measure for auditory distance. The IACC is based on the inter-aural cross correlation function (IACF):
with and .
The binaural impulse response corresponds to responses for left and right ear at . The IACC is defined as the maximum absolute value within :
The early IACC, considering a time window of to , is commonly used in room acoustics as an objective measure for apparent source width (ASW). It is widely accepted that a lower IACC value leads to a bigger ASW, and therefore IACC is positively correlated with the magnitude of perceived width. With the IACC binaurally measured in the experimental setup, linear regression yields to model the experimental data (, cf. Figure 9c).
3.4. Lateral Energy Fraction
The lateral energy fraction (LF) is another acoustic measure quantifying the spatial impression. Similaraly then the IACC, considering a time window up to , it has been accepted as a measure of the effect of source broadening [23,24]. Simply stated, the LF is the ratio of the sum of the early lateral energy to the sum of the early total energy:
with and as azimuthal angle of the l-th loudspeaker.
Linear regression yields , cf. Figure 9d. This LF-based linear model delivers the best matching results underlined by a sublime correlation of .
4. Experiment II: Directivity-Controlled Auditory Distance in a Real Room
The findings of the first experiment are evaluated with a real variable-directivity source in a room. Considering the good performance of models that were actually developed to predict the apparent source width (ASW), the second experiment evaluates the ASW in addition to the auditory distance. This enables us to examine the inter-relation of the two attributes.
4.1. Experimental Setup
In this experiment the effect is proven with a sound source able to vary its directivity namely the icosahedral loudspeaker (IKO, http://iko.sonible.com/). This 20-sided, 20-channel playback device employs spherical beamforming as developed in [25,26] and allows to steer beams up to third order into freely adjustable directions.
The directivity of the IKO was controlled using the freely available ambiX plug-in suite [27] with Reaper as DAW. Firstly, auralized signals were encoded using the ambiX encoder, then converted using ambiX converter, and lastly filtered according to [10] using mcfx convolver. This yields twenty-channel audio files used as conditions for the experiment. Audio playback was controlled by Pure Data on a standard PC with RME MADI audio interface to drive a Sonible d:24 power amplifier.
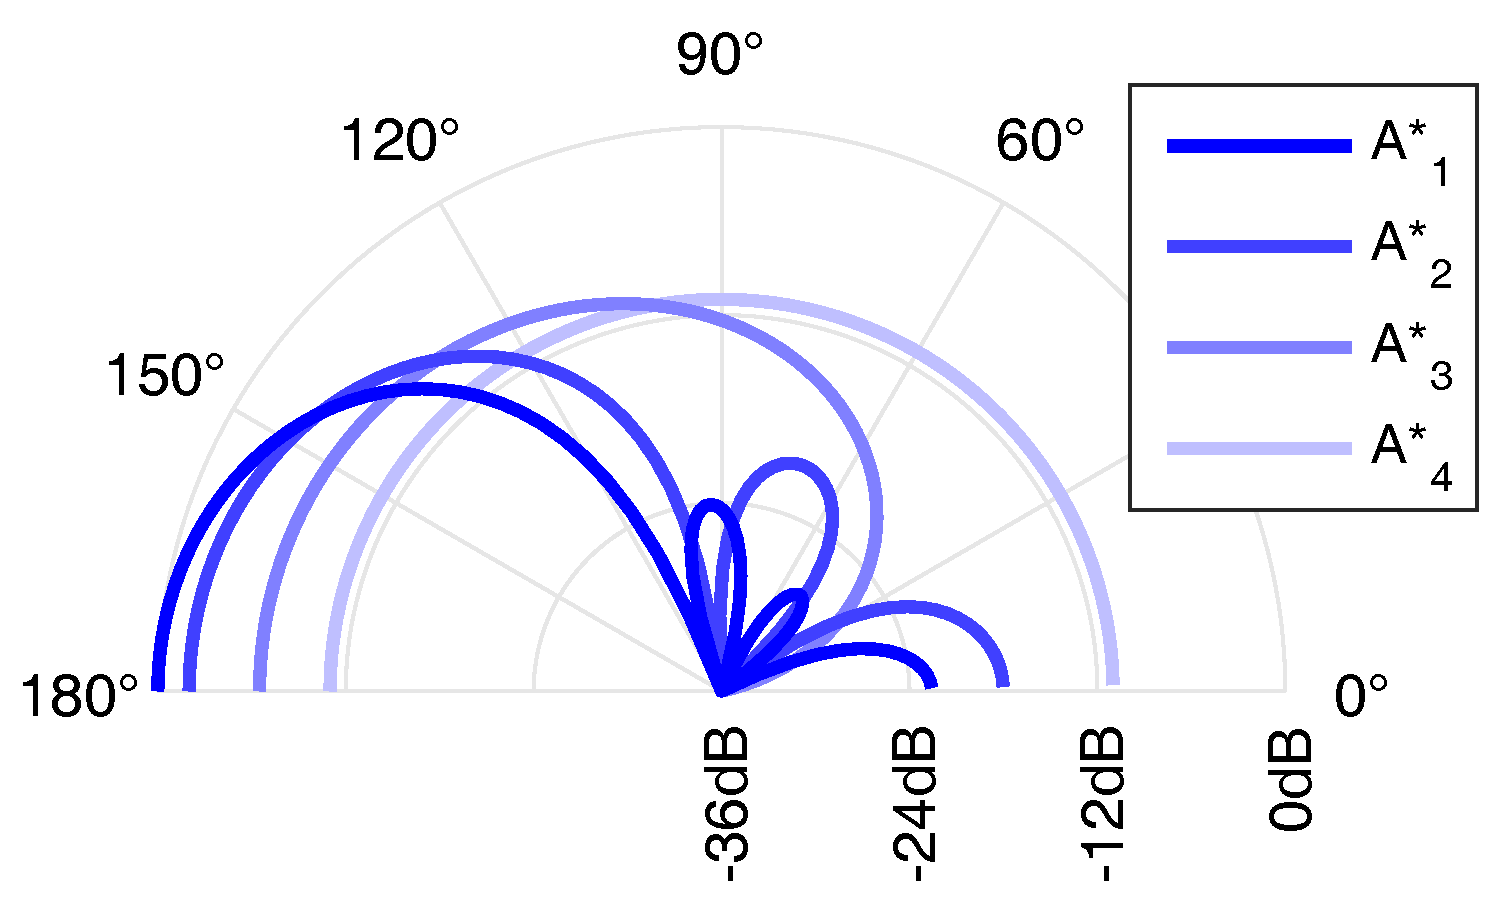
The size controller of the ambiX encoder allows to vary the beam width from third to zeroth order (size ). To create a beampattern design representing the design A of the first experiment, different settings of the size controller were used. By informal listening of the author, size values and orientations were determined, including a zeroth order beam and to opposed third order beams. Directivities are facing to the listener with values of size and conditions are rotated by with size . Thus, design can be seen as modified version of A, adjusted by the ear. Figure 10 shows calculated beampattern patterns normalized to constant energy.
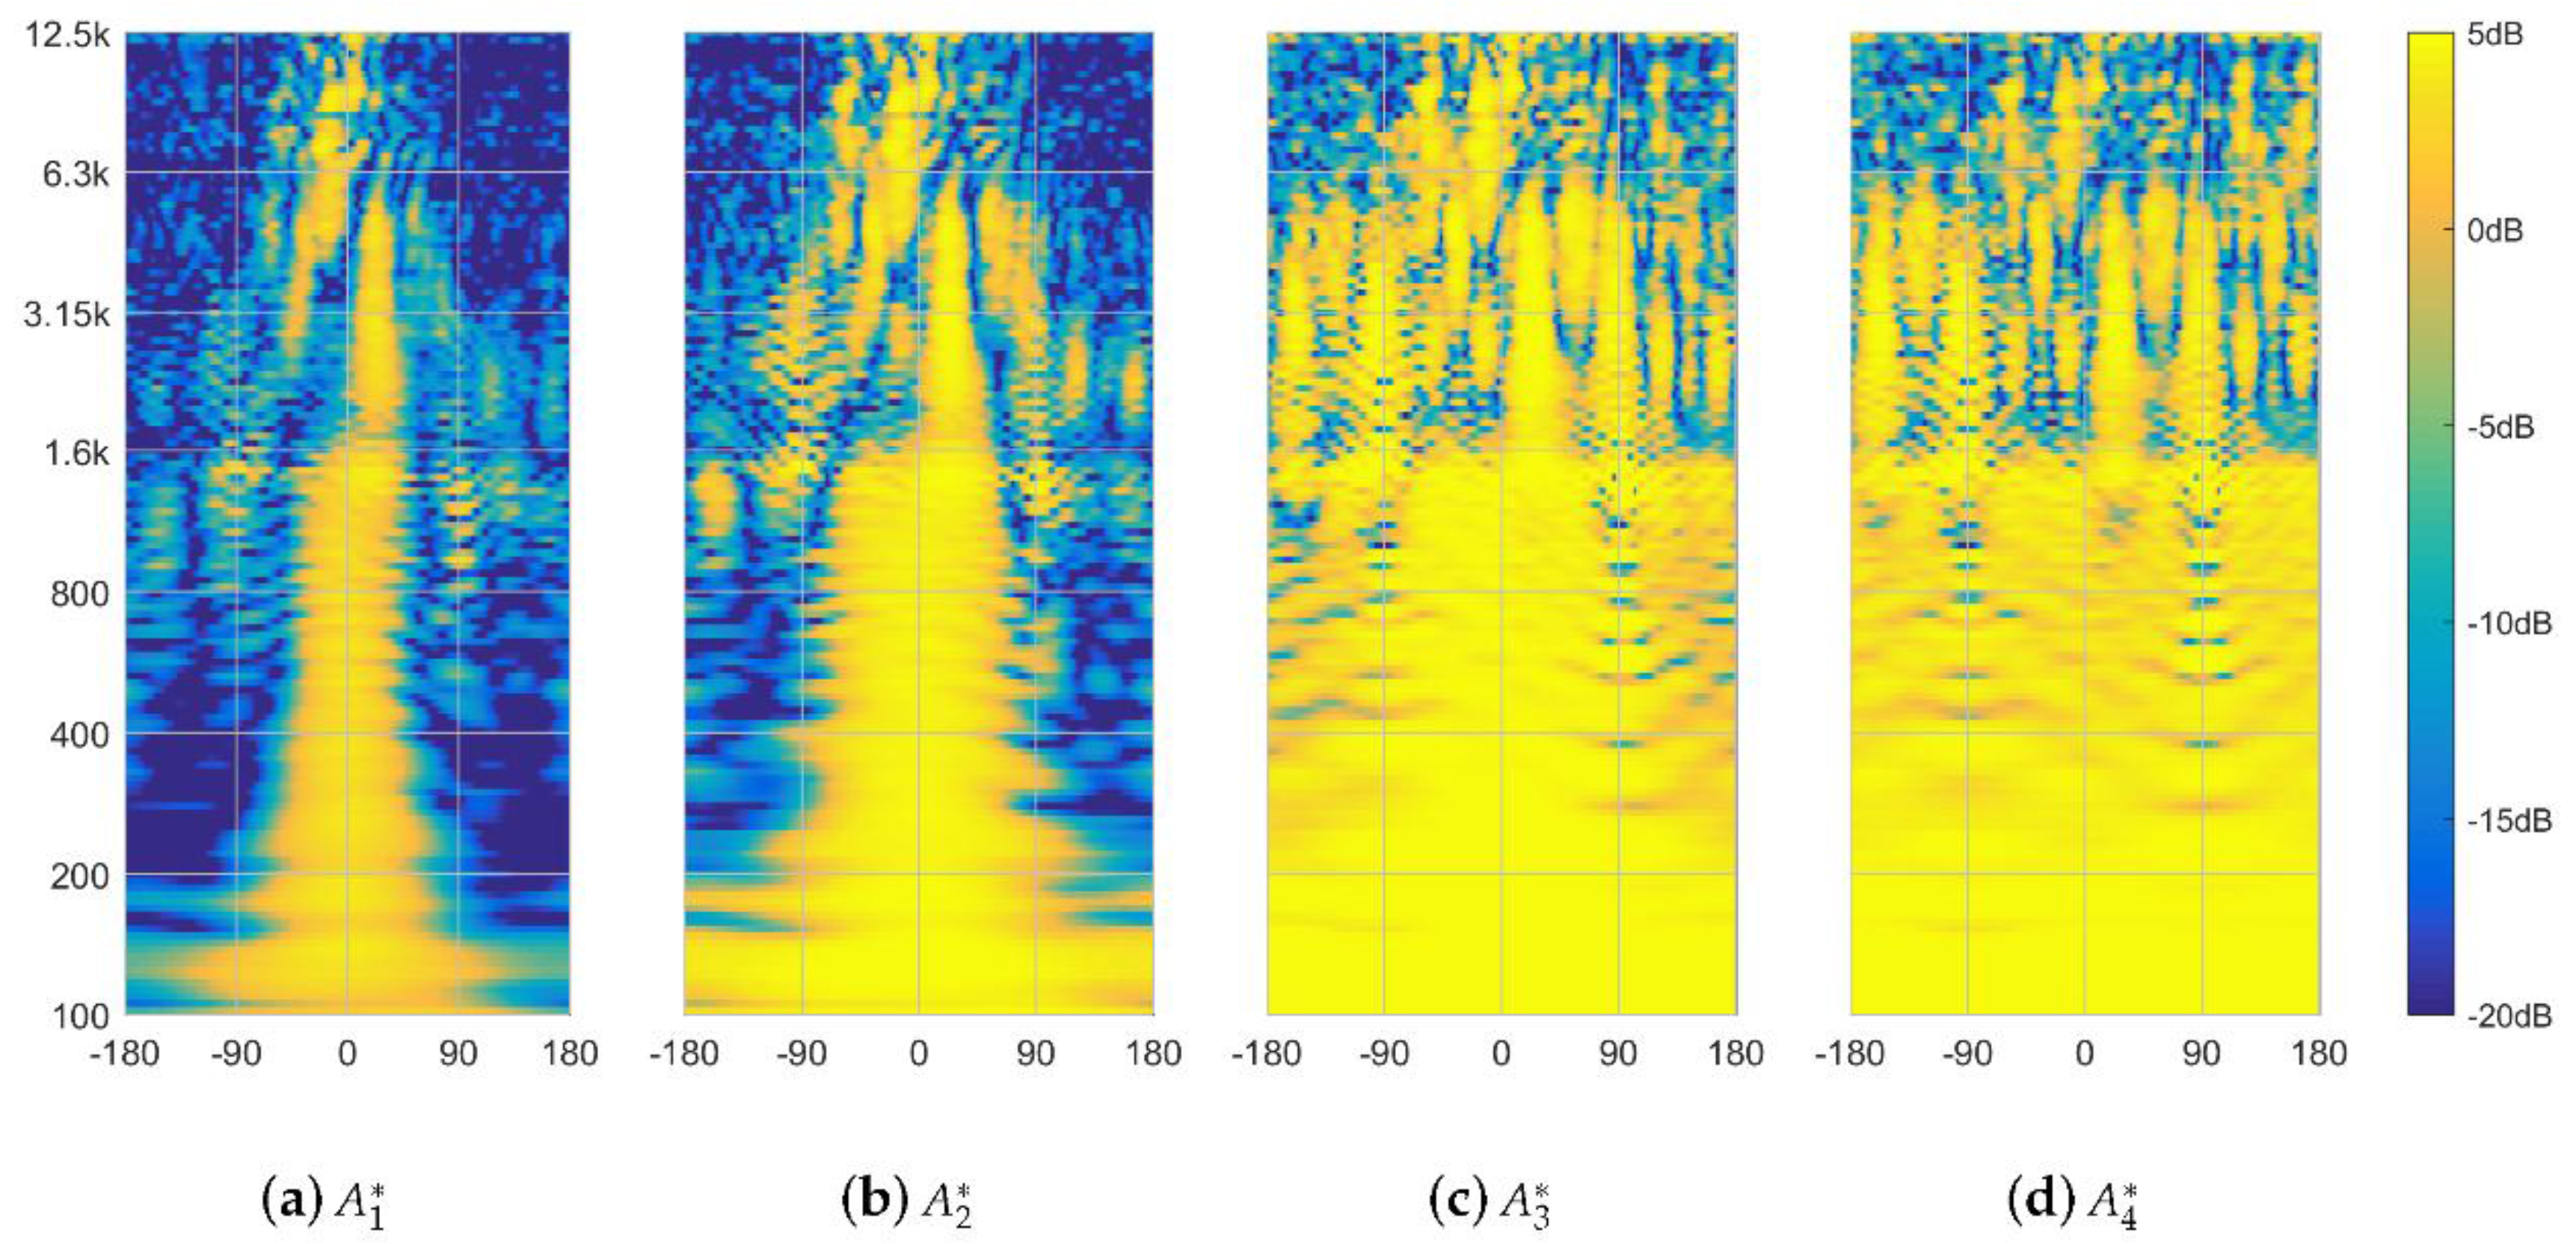
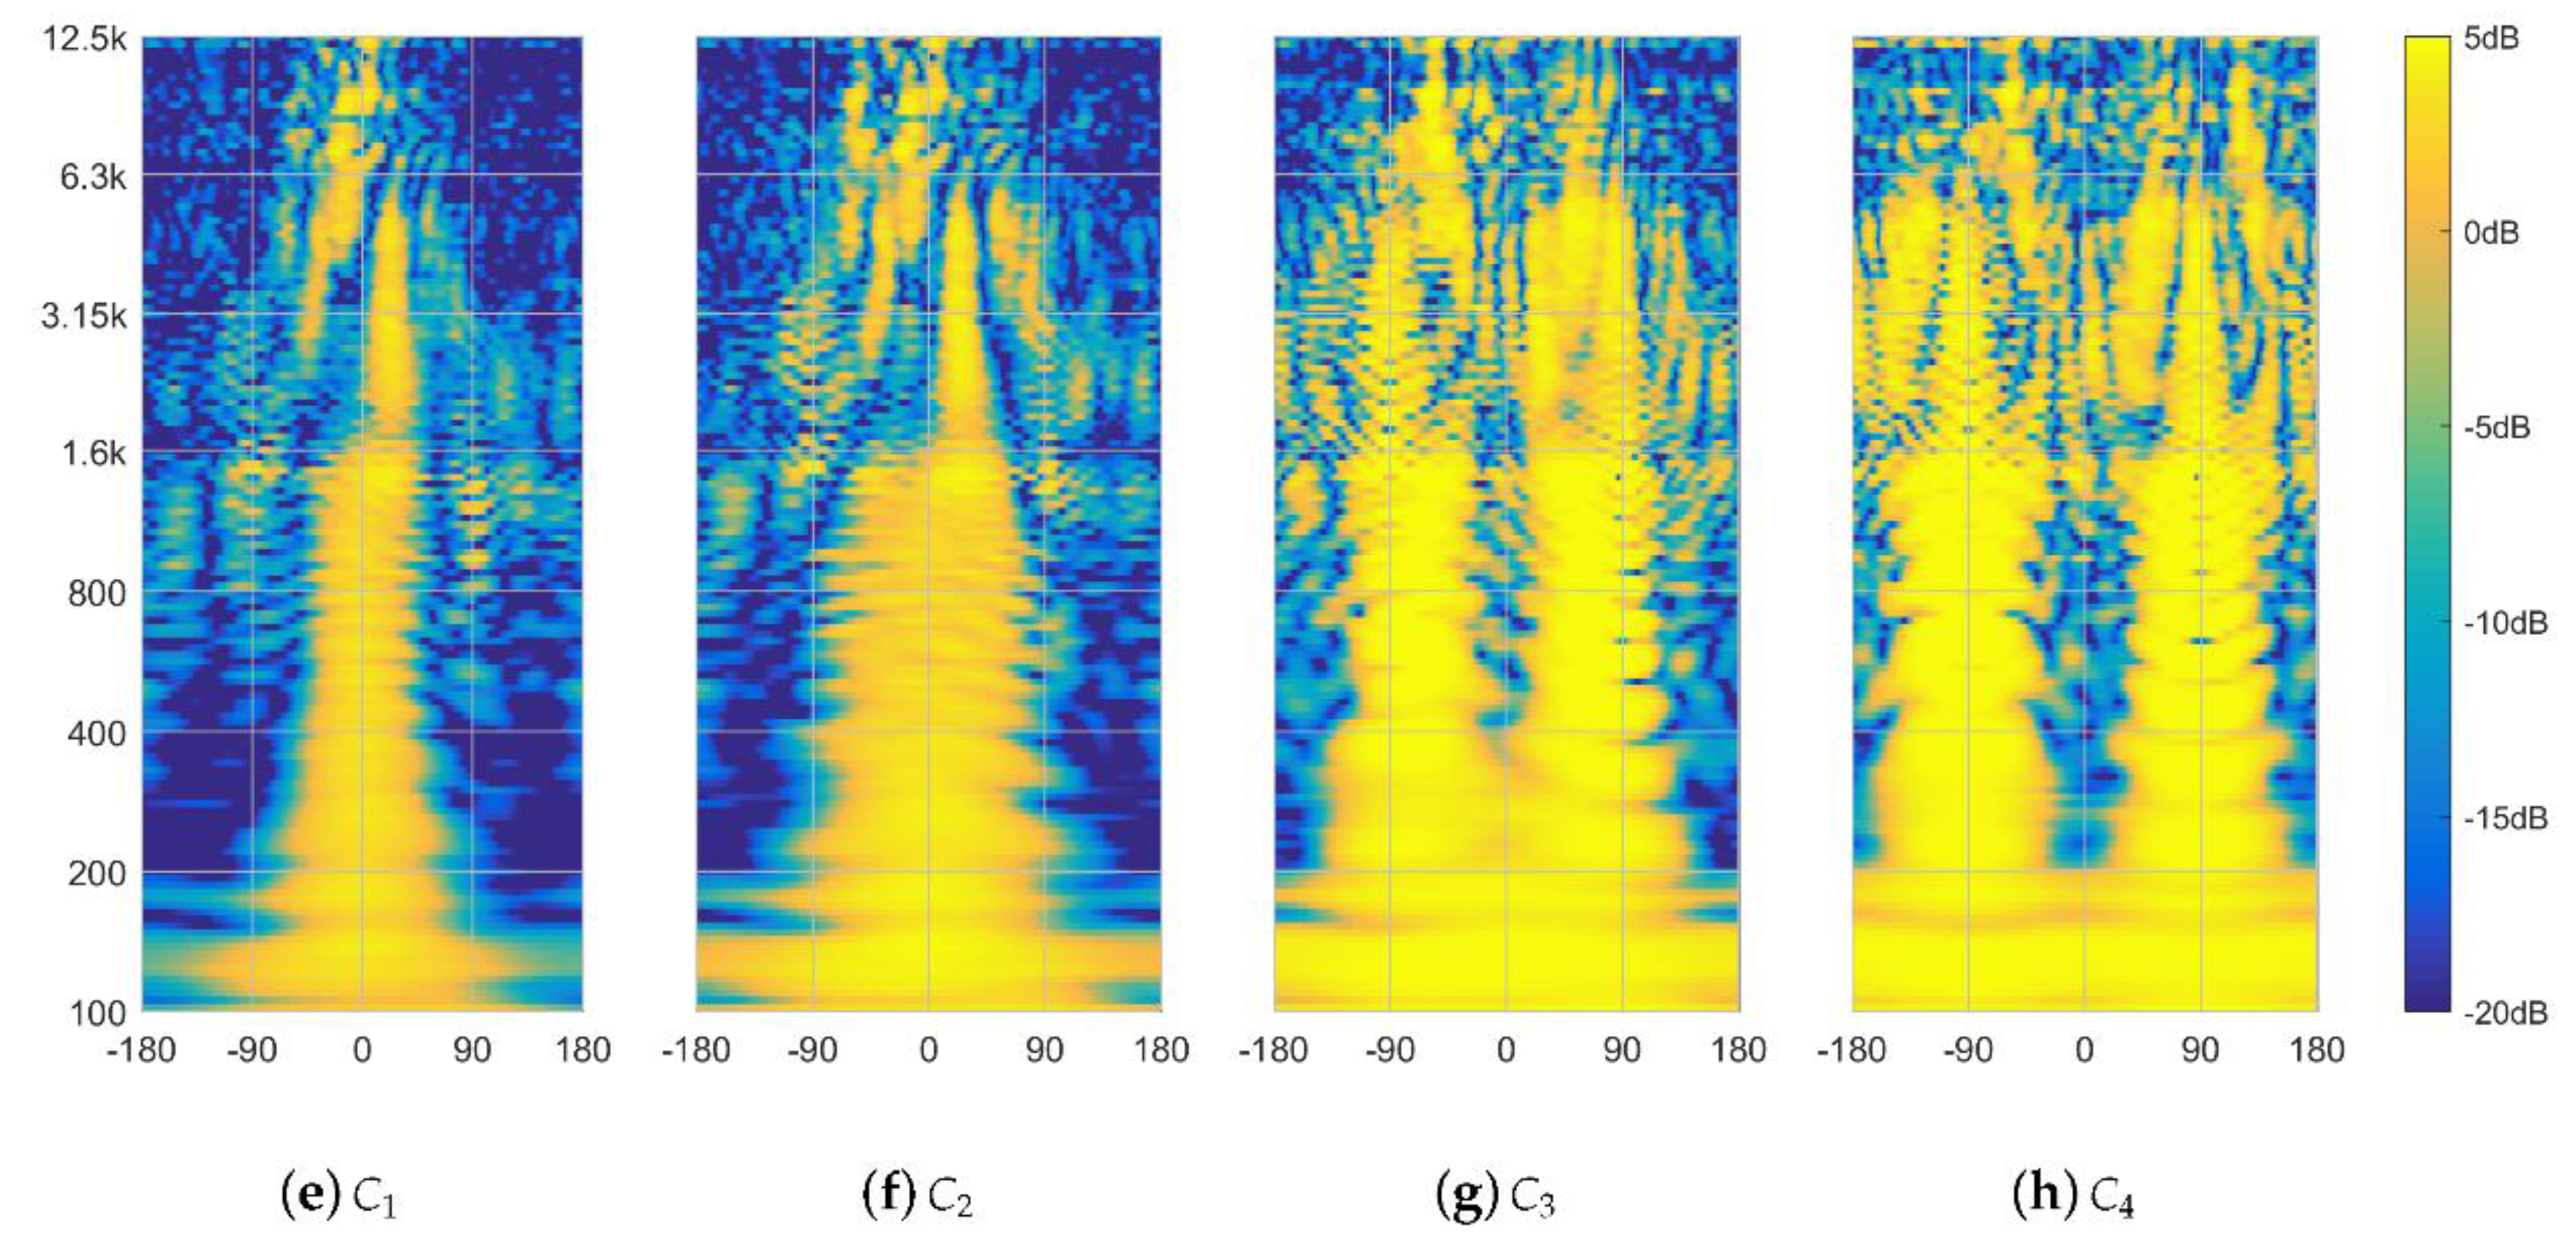
Other designs evaluated in the experiment are known from the first experiment. While design B and C are identical (see Figure 1), design D is composed of directivities and in order to achieve the most distinct effect. A horizontal cross-section through measured frequency-dependent beampatterns of the IKO is shown in Figure 11.
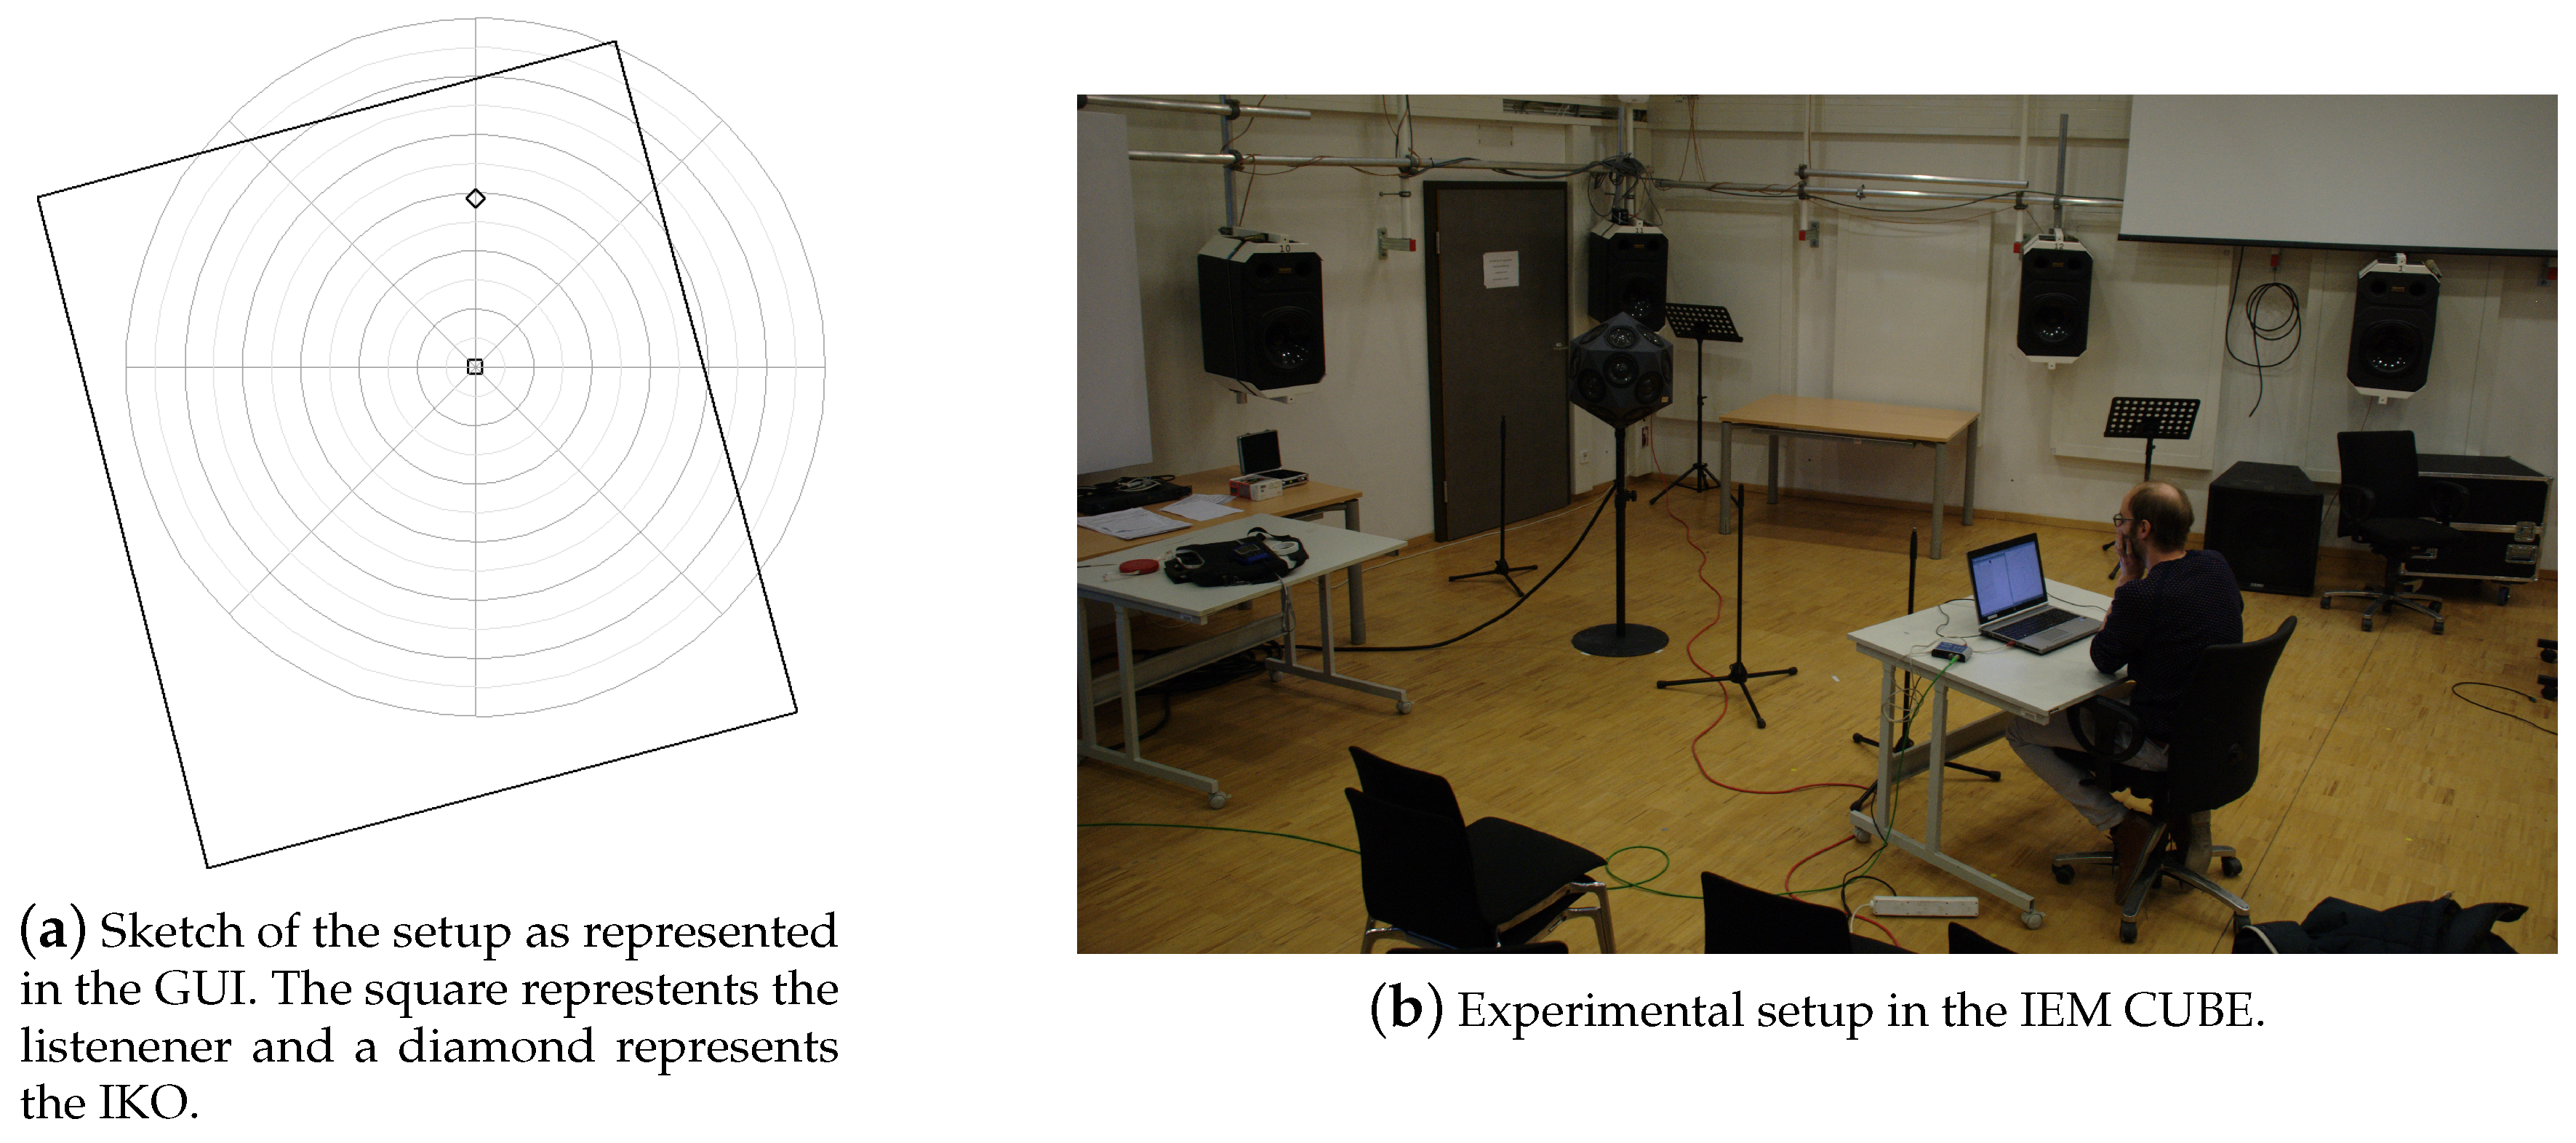
Room and positioning of the sound source corresponded to the condition , cf. Table 2. Similarly to the first experiment, listeners were asked to rate the distance of the auditory object on a graphical user interface. On a screen, the sketch of the setup was displayed and listeners had to adjust 7 randomly sorted markers to the auditory distance, where each marker represented a beampattern of the designs under test. Markers could either be moved directly (drag and drop) or, for fine adjustments, steered with a slider. Each condition could be repeated at will until listeners were satisfied with the match between marker placement and what they heard. To facilitate the task a fine grid indicating distances of was displayed on the screen, cf. Figure 12a. In the room microphone stands marked distances of , cf. Figure 12b.
Listeners were asked to provide an honest report of what they actually perceived. This instruction had to do with the fact that there was no time limit to provide answers. It aimed specifically at asking listeners to avoid developing theories about which condition they were presented, as some listeners were aware of results from the first experiment.
Additional to distance, the second experiment also examined the apparent source width (ASW) of auditory objects created by beampattern designs , and C in a separate task. The procedure was the same as in the first experiment, so that rating was done on a graphical user interface displaying a continuous slider for each condition of a set to permit comparative rating. Listeners were asked to rate using the whole scale very narrow (vn), narrow (n), moderate (m), broad (b), and very broad (vb).
The signal fed into auralization was female speech (, see Table 2). All conditions were normalized in loudness and were played back in loop at comfortable level of 70 dB(A).
During the listening session, listeners were sitting on a chair with ear height adjusted to the IKO () and while listening to conditions, they were requested to face the IKO. Both tasks were performed consecutively with a short break in between. Half of the listeners started with the distance rating task and the other half with the rating of the ASW. Ten listeners participated in this experiment (all male; age 28–54), nine of them performed already the first experiment.
4.2. Auditory Distance
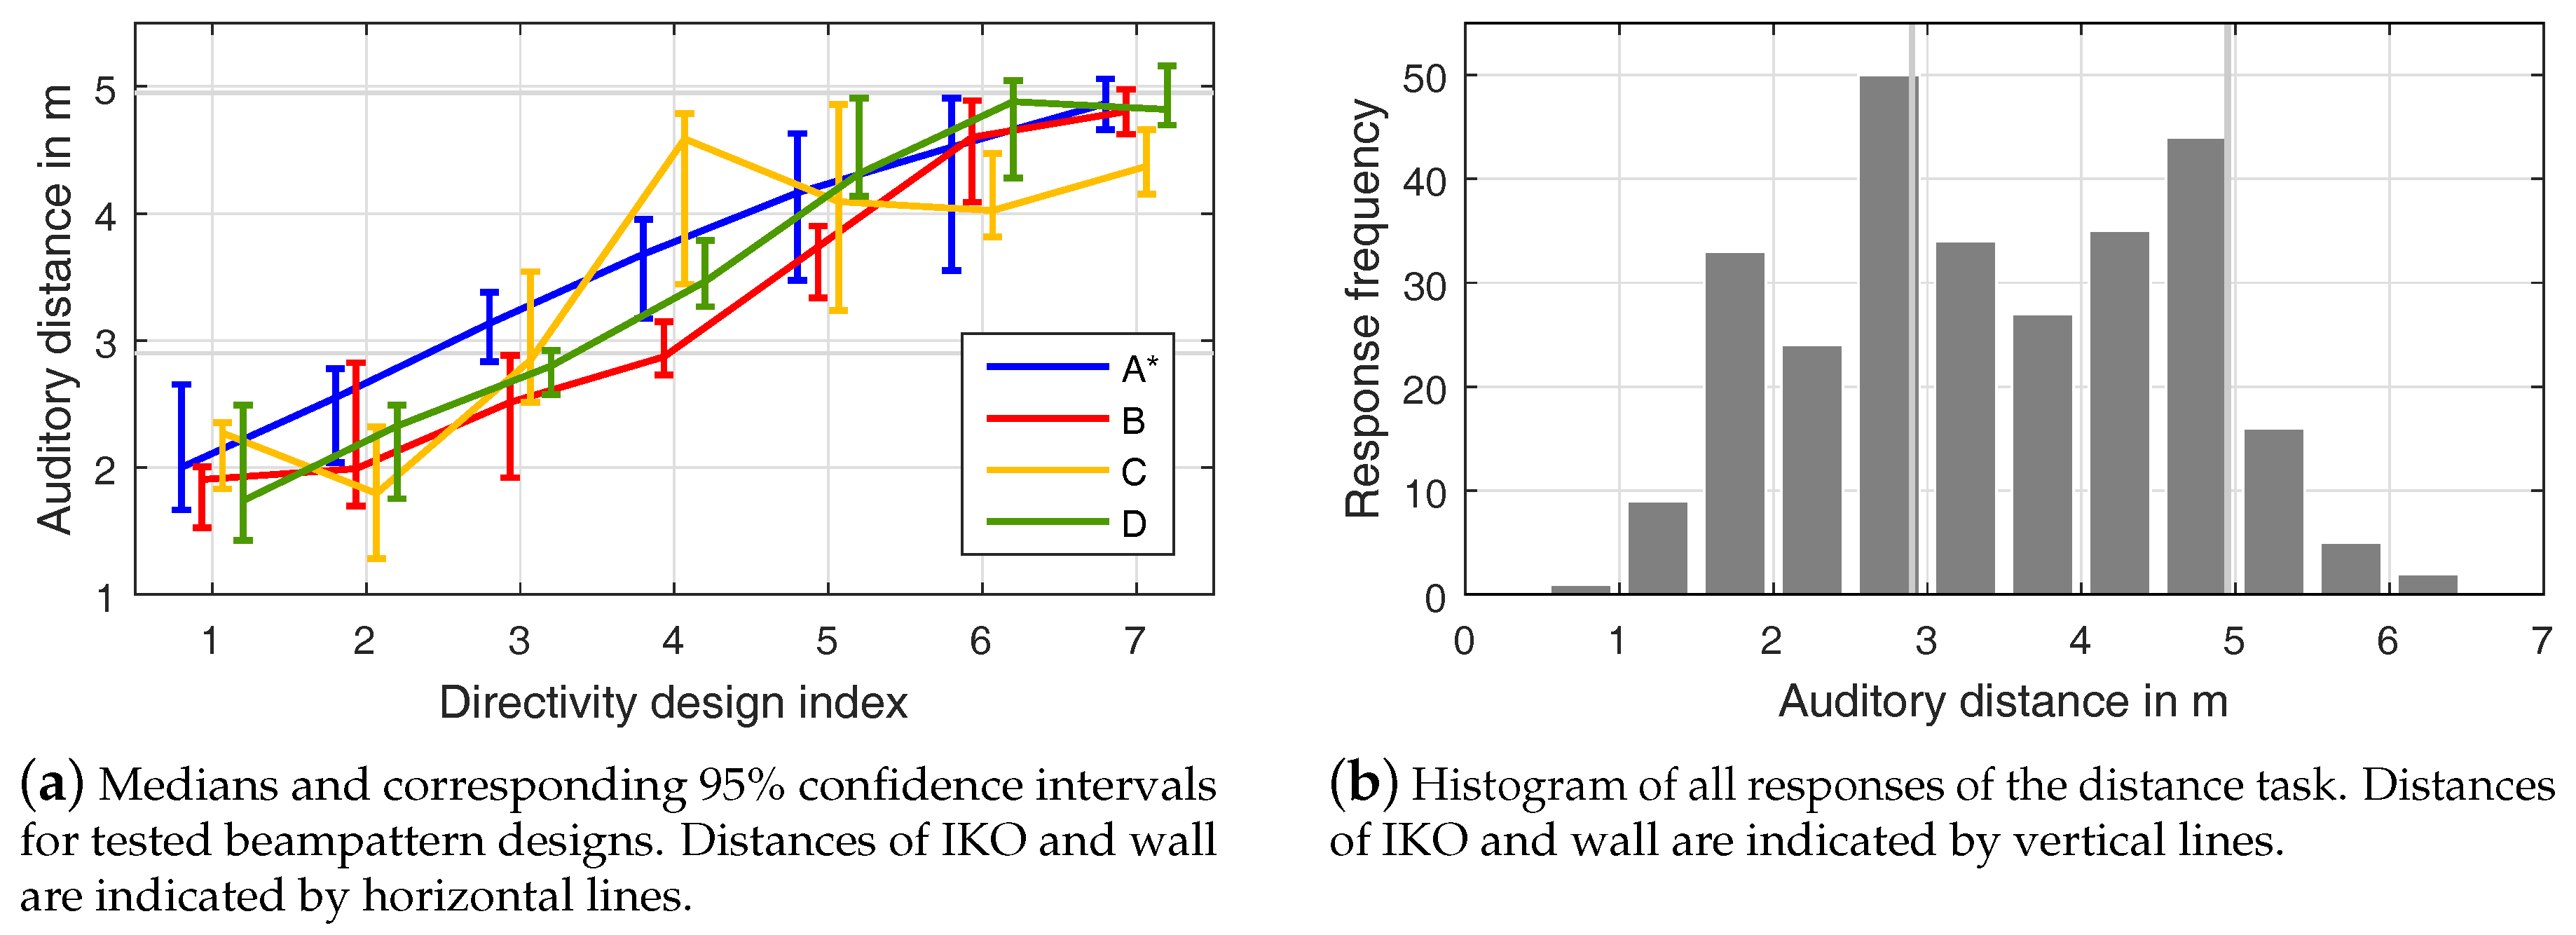
Figure 13 shows the results for the distance rating task of the second experiment.
A pairwise ANOVA of the data reveals the beampattern to be a significant factor for (). Although medians of the design form a linear curve, the significant range of the first experiment using the design A in room is not achieved, cf. Figure 7. For design B, significance is attained by directivities () and for design C by directivities ().
Although comparisons of these results with significances of the first experiment shown in Figure 4 should be interpreted with caution, indications are found that the IKO yields less pronounced distance impressions. Even with design D, corresponding to a combination of directivities that should yield the most pronounced effect, not more then 4 significantly different distances are obtained (, ).
Medians of design B remain sigmoid-shaped as they are in the first experiment, whereas medians obtained by design C show major differences. While simulated conditions of the first experiment created significantly different impressions that are localized more distant compared to , they are either localized closer to , e.g., , or are no longer significantly different (, ) when auralized with the IKO. Informal notes of listeners indicate that the spectral coloration of some conditions led to an impression as if the auditory object is right behind the IKO and the incoming sound is filtered due to acoustic shadowing. Similarly to the first experiment these conditions yield major intersubjective differences as indicated by the size of the 95% confidence intervals.
If we take a look at the measured beampattern in Figure 11h we find evidence that shifted results can be explained rather by the spectrum of the IKO into the listener’s direction as the image source behind the IKO () receives highly attenuated signals and the direct sound has a low-pass character ().
Visual cues could explain the less pronounced ratings for large distances, because responses of most listeners (7/10) are within the feasible space limited by the wall at approximately , leading to a high response frequency in the interval right in front of the wall, cf. Figure 13b.
The high frequency of responses within the interval of the IKO are due to another effect caused by visual cues. Studies could show that seeing only one possible sound source biases the perceived distance towards it, e.g., [28].
Interestingly, in the first experiment visual cues were available similarly, but no influence thereof was obtained. Therefore we conclude that in the laboratory environment, in which visual cues do not comply with auditory cues, the former play a minor role. This agrees with findings in [29,30] showing that sensory interactions, e.g., vision vs. audition, include a weighting process where the most reliable cue contributes the most to the multi-sensory percept.
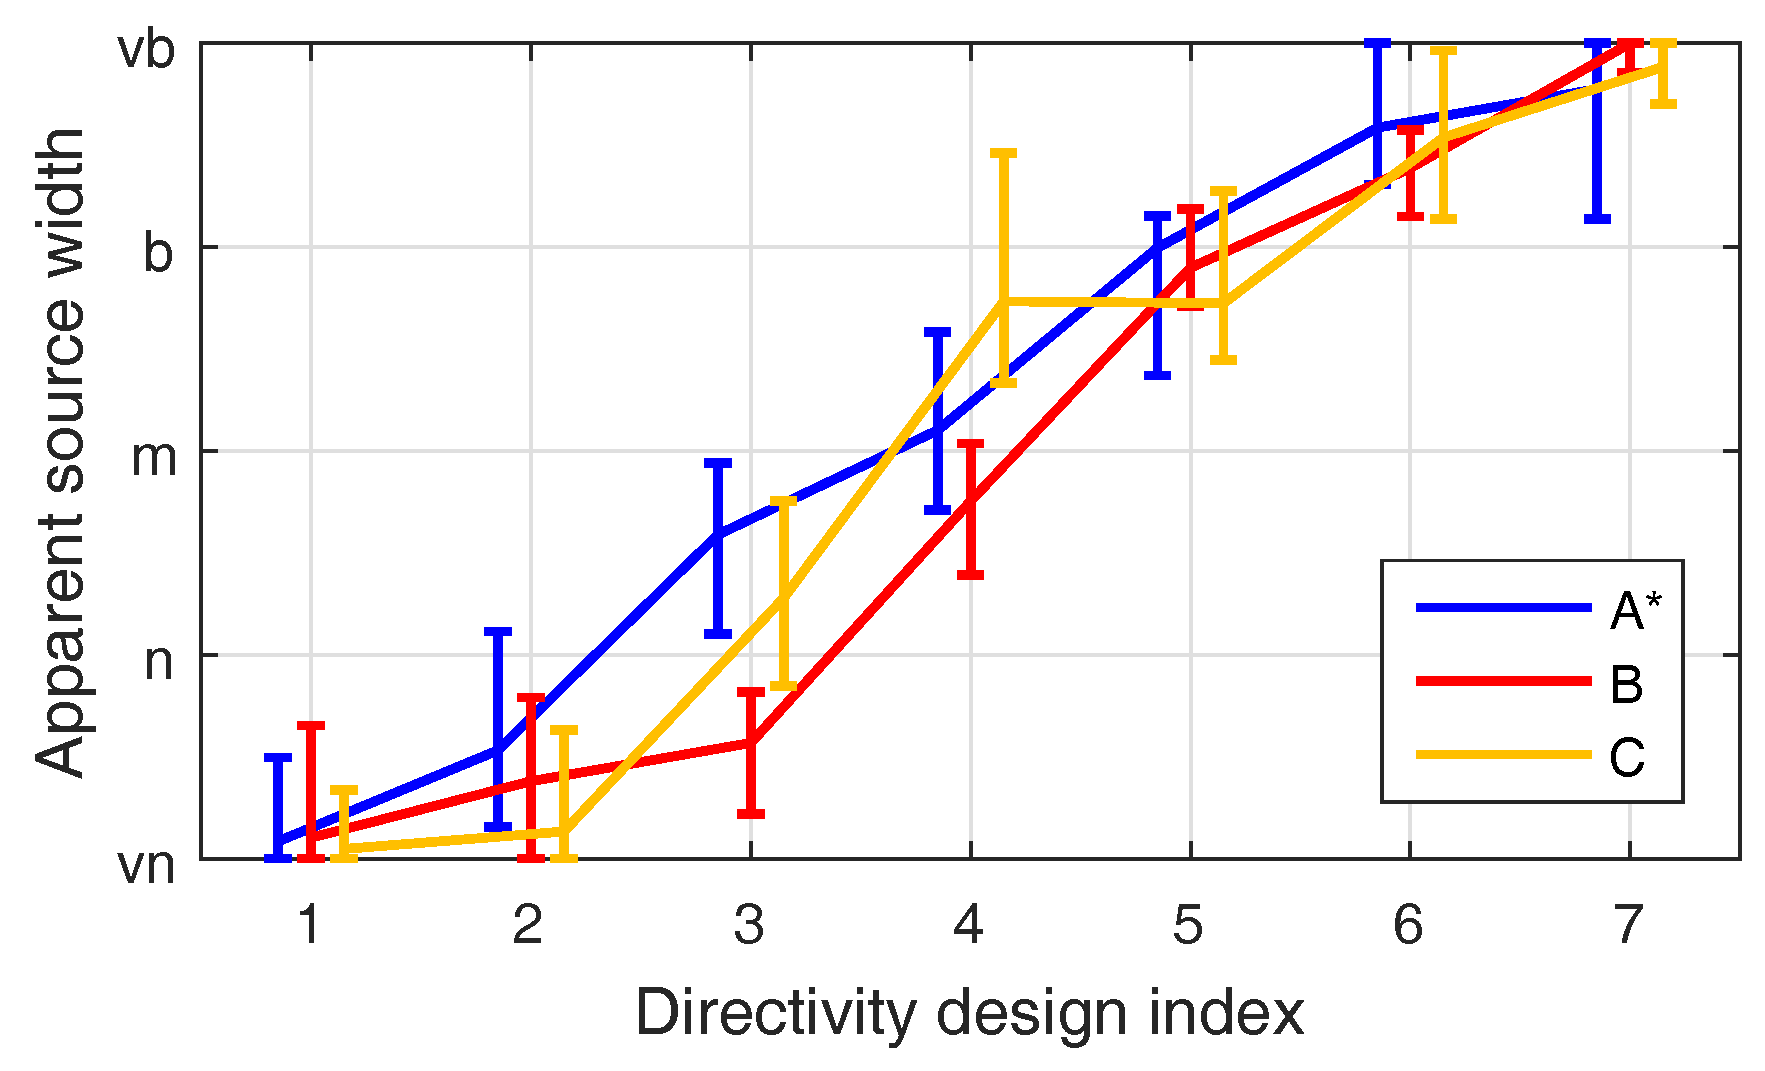
4.3. Apparent Source Width
Figure 14 shows the results for the ASW rating task of the second experiment. Assessed ASWs of all tested designs form monotone curves and resemble respective distance curves shown in Figure 13. The correlation of medians is high () and the significant range for width is the same as it is for distance, except for neighboring conditions whose differences were found to be significant for ASW.
The correlation of ASW to auditory distance is not surprising, if we consider the model predictions of the first experiment. Both best predicting models for distance, IACC and LF are measurements that are typically used in room acoustics to quantify the ASW. This is in contrast to the inverse relation between the physical source-listener distance and the ASW found in [31]. In contrast to our study, the ASW decreased almost linearly as the distance is doubled and IACC and LF predicted results opposing ASW. Thus, it seems that the ASW of auditory objects created by reflections is larger then for real loudspeakers facing the listener.
5. Conclusions
In this contribution, an investigation was carried out into the influence of various beampatterns on the auditory distance. Two-dimensional simulation of a variable-directivity sound source at a single point in the room was shown to provide control of the auditory distance. Different beampattern designs were proposed that cause pronounced and graduated distance impressions. Additionally, the influence of the auralized room, source-listener distance, signal, and single-channel reverberation was studied.
The mapping of beampatterns and to auditory distance curves is sigmoid-shaped. It resembles the compressive power functions described in [5], characterizing the relation between physical and auditory distance. Moreover, agreeing with [20,21], signals with an increased relative amount of high-frequency energy appeared to be closer in the study.
Both decreasing the auralized room and increasing the source-listener distance yield a more compressed curve, which is slightly offset in case of the increased source-listener distance. Despite this, the range of discriminability is persistent.
The use of single-channel reverberation is effective at increasing the auditory distance, however, it narrows the directivity-controllable range of distinguishable distance impressions.
Successful modeling of the experimental results was presented and all models yield curves that are highly correlated with the experimental data. Interestingly, spatial measures used to quantify the ASW provide very accurate predictions.
In addition to the findings obtained by loudspeaker-based auralization in the anechoic chamber, we could also present an evaluation of the designs synthesized by a variable-directivity sound source in a room. A listening experiment could show that in real environments the distance perception is biased due to visual cues leading to less pronounced distance impressions. In addition to the auditory distance the apparent source width was evaluated and we could show that in contrast to the natural environments of the study [31], the width highly correlates with distance impressions caused by the directivity of the sound source. This finding explains the performance of spatial measures in the first experiment and enhances the robustness of this new effect in real environments.
Possible directions of further research are to investigate whether and to which extend larger performance venues (e.g., Ligeti Hall) affect the mapping to perceived distance to answer the question if this effect is preserved for a larger audience.
Acknowledgments
The authors thank all listeners for their participation in the listening experiment. This work was funded by the Austrian Science Fund (FWF) project nr. AR 328-G21, Orchestrating Space by Icosahedral Loudspeaker. The paper is an extended version of [9].
Author Contributions
Florian Wendt, Franz Zotter, Matthias Frank, and Robert Höldrich conceived and designed the experiments; Florian Wendt performed the experiments; Florian Wendt, Franz Zotter, Matthias Frank, and Robert Höldrich analyzed the data; Florian Wendt wrote the paper with periodic contributions by the other authors.
Conflicts of Interest
The authors declare no conflict of interest.
References
- Mason, R. How Important Is Accurate Localization in Reproduced Sound? In Proceedings of the 142th Convention of the Audio Engineering Society, Berlin, Germany, 20–23 May 2017. [Google Scholar]
- Zahorik, P.; Brungart, D.S.; Bronkhorst, A.W. Auditory distance perception in humans: A summary of past and present research. Acta Acust. United Acust. 2005, 91, 409–420. [Google Scholar]
- Kolarik, A.J.; Moore, B.C.J.; Zahorik, P.; Cirstea, S.; Pardhan, S. Auditory distance perception in humans: A review of cues, development, neuronal bases, and effects of sensory loss. Atten. Percept. Psychophys. 2016, 78, 373–395. [Google Scholar] [CrossRef] [PubMed]
- Mershon, D.H.; King, L.E. Intensity and reverberation as factors in the auditory perception of egocentric distance. Percept. Psychophys. 1975, 18, 409–415. [Google Scholar] [CrossRef]
- Zahorik, P. Assessing auditory distance perception using virtual acoustics. J. Acoust. Soc. Am. 2002, 111, 1832–1846. [Google Scholar] [CrossRef] [PubMed]
- Larsen, E.; Iyer, N.; Lansing, C.R.; Feng, A.S. On the minimum audible difference in direct-to-reverberant energy ratio. J. Acoust. Soc. Am. 2008, 124, 450–461. [Google Scholar] [CrossRef] [PubMed]
- Kolarik, A.; Cirstea, S.; Pardhan, S. Discrimination of virtual auditory distance using level and direct-to-reverberant ratio cues. J. Acoust. Soc. Am. 2013, 134, 3395–3398. [Google Scholar] [CrossRef] [PubMed]
- Laitinen, M.V.; Politis, A.; Huhtakallio, I.; Pulkki, V. Controlling the perceived distance of an auditory object by manipulation of loudspeaker directivity. J. Acoust. Soc. Am. 2015, 137, EL462–EL468. [Google Scholar] [CrossRef] [PubMed]
- Wendt, F.; Frank, M.; Zotter, F.; Höldrich, R. Directivity patterns controlling the auditory source distance. In Proceedings of the 19th International Conference on Digital Audio Effects (DAFx-16), Brno, Czech Republic, 5–9 September 2016; pp. 295–300. [Google Scholar]
- Zotter, F.; Zaunschirm, M.; Frank, M.; Kronlachner, M. A Beamformer to Play with Wall Reflections: The Icosahedral Loudspeaker. Comput. Music J. (Accept. Publ.) 2017, 41. [Google Scholar]
- Daniel, J. Représentation de Champs Acoustiques, Application à la Transmission et à la Reproduction de Scènes Sonores Complexes Dans un Contexte Multimédia. Ph.D. Thesis, Université Paris 6, Paris, France, 2001. [Google Scholar]
- Zotter, F.; Frank, M. All-round ambisonic panning and decoding. AES J. Audio Eng. Soc. 2012, 60, 807–820. [Google Scholar]
- Allen, J.B.; Berkley, D.A. Image Method for Efficiently Simulating Small-room Acoustics. J. Acoust. Soc. Am. 1979, 65, 943–950. [Google Scholar] [CrossRef]
- Wabnitz, A.; Epain, N.; Jin, C.T.; Van Schaik, A. Room acoustics simulation for multichannel microphone arrays. In Proceedings of the International Symposium on Room Acoustics, Melbourne, Australia, 29–31 August 2010. [Google Scholar]
- Tervo, S.; Pätynen, J.; Kuusinen, A.; Lokki, T. Spatial decomposition method for room impulse responses. J. Audio Eng. Soc. 2013, 61, 17–28. [Google Scholar]
- Guski, R. Auditory localization: Effects of reflecting surfaces. Perception 1990, 19, 819–830. [Google Scholar] [CrossRef] [PubMed]
- Wendt, F.; Sharma, G.K.; Frank, M.; Zotter, F.; Höldrich, R. Perception of Spatial Sound Phenomena Created by the Icosahedral Loudspeaker. Comput. Music J. 2017, 41, 76–88. [Google Scholar] [CrossRef]
- Zaunschirm, M.; Frank, M.; Zotter, F. An Interactive Virtual Icosahedral Loudspeaker Array. Fortschritte der Akusitk 2016, 1331–1334. [Google Scholar]
- Kohlrausch, A.; Kortekaas, R.; van der Heijden, M.; van de Par, S.; Oxenham, A.J.; Püschel, D. Detection of Tones in Low-noise Noise: Further Evidence for the Role of Envelope Fluctuations. Acta Acust. United Acust. 1997, 83, 659–669. [Google Scholar]
- Coleman, P. Dual Role of Frequency Spectrum in Determination of Auditory Distance. J. Acoust. Soc. Am. 1968, 44, 631–632. [Google Scholar] [CrossRef] [PubMed]
- Little, A.D.; Mershon, D.H.; Cox, P.H. Spectral content as a cue to perceived auditory distance. Perception 1992, 21, 405–416. [Google Scholar] [CrossRef] [PubMed]
- Georganti, E.; May, T.; Van De Par, S.; Mourjopoulos, J. Sound source distance estimation in rooms based on statistical properties of binaural signals. IEEE Trans. Audio Speech Lang. Process. 2013, 21, 1727–1741. [Google Scholar] [CrossRef]
- Marshall, A.H. A note on the importance of room cross-section in concert halls. J. Sound Vib. 1967, 5, 100–112. [Google Scholar] [CrossRef]
- Barron, M.; Marshall, A.H. Spatial impression due to early lateral reflections in concert halls: The derivation of a physical measure. J. Sound Vib. 1981, 77, 211–232. [Google Scholar] [CrossRef]
- Lösler, S. MIMO-Rekursivfilter für Kugelarrays. Master’s Thesis, University of Music and Performing Arts Graz, Graz, Austria, 2014. [Google Scholar]
- Zotter, F. Analysis and Synthesis of Sound-Radiation with Spherical Arrays. Ph.D. Thesis, University of Music and Performing Arts Graz, Graz, Austria, 2009. [Google Scholar]
- Kronlachner, M. Plug-in Suite for Mastering the Production and Playback in Surround Sound and Ambisonics. In Proceedings of the 136th Convention of the Audio Engineering Society, Berlin, Germany, 26–29 April 2014. [Google Scholar]
- Anderson, P.W.; Zahorik, P. Auditory/visual distance estimation: Accuracy and variability. Front. Psychol. 2014, 5, 1–11. [Google Scholar] [CrossRef] [PubMed]
- Ernst, M.O.; Banks, M.S. Humans integrate visual and haptic information in a statistically optimal fashion. Nature 2002, 415, 429–433. [Google Scholar] [CrossRef] [PubMed]
- Mendonça, C.; Mandelli, P.; Pulkki, V. Modeling the Perception of Audiovisual Distance: Bayesian Causal Inference and Other Models. PLoS ONE 2016, 11, e0165391. [Google Scholar]
- Lee, H. Apparent Source Width and Listener Envelopment in Relation to Source-Listener Distance. In Proceedings of the 52nd Audio Engineering Society Conference, Guildford, UK, 2–4 September 2013. [Google Scholar]
Figure 1.
Beampattern designs A, B, C controlling the D/R ratio.

Figure 2.
Experimental setup in the anechoic laboratory.

Figure 3.
Room and source configuration for , , and together with loudspeaker ring used for auralization. and are based on the IEM CUBE differing in the source-listener distance and room is based on the IEM Lecture Room.
Figure 3.
Room and source configuration for , , and together with loudspeaker ring used for auralization. and are based on the IEM CUBE differing in the source-listener distance and room is based on the IEM Lecture Room.
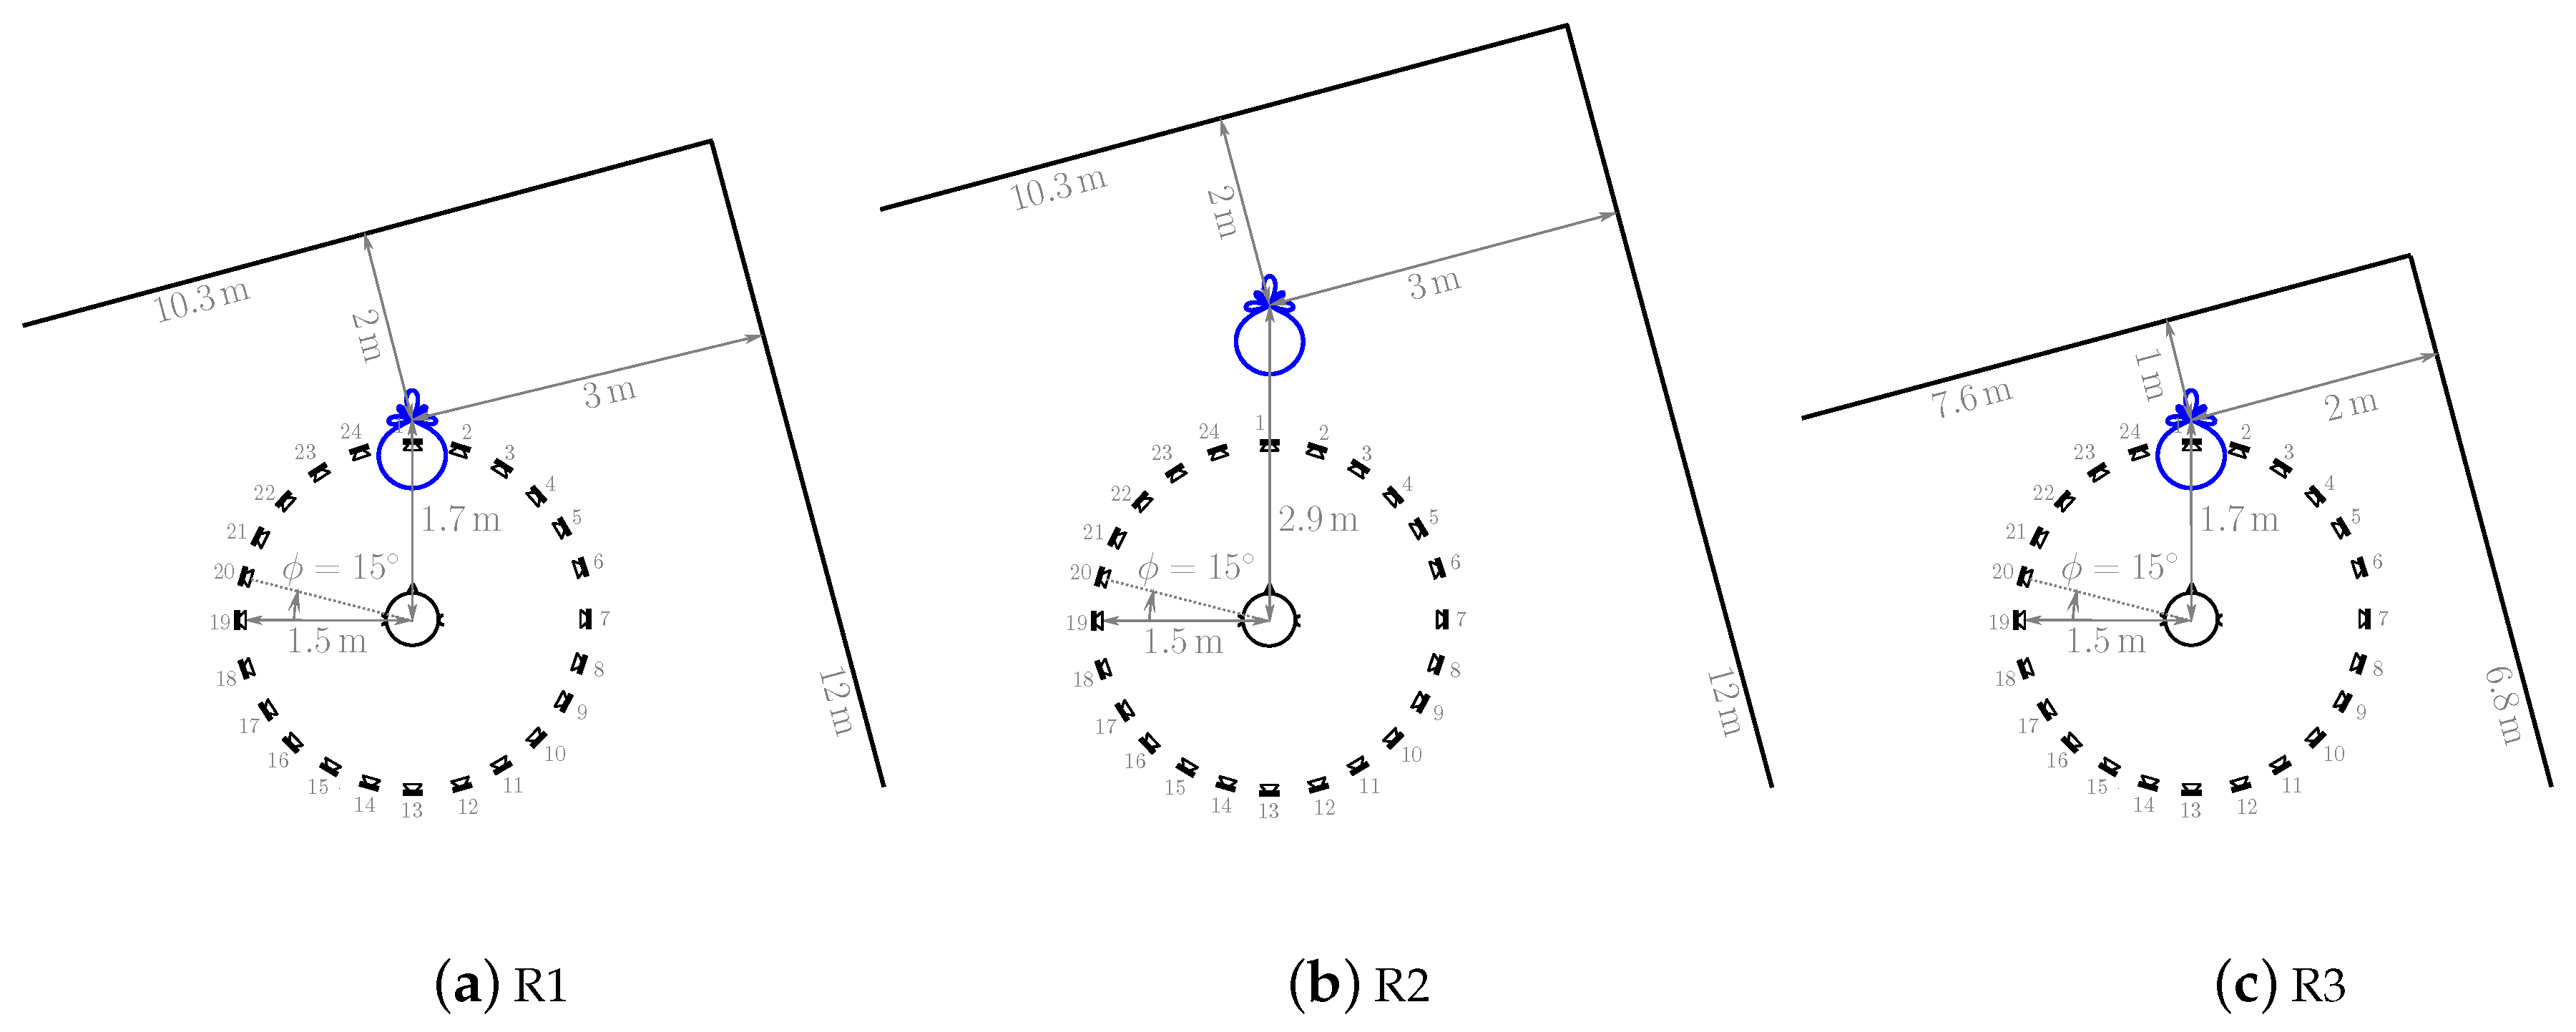
Figure 4.
Medians and corresponding 95% confidence intervals for all beampattern designs A, B, and C, pooled over all signals and normalized individually on directivities indicated by 1 and 7.
Figure 4.
Medians and corresponding 95% confidence intervals for all beampattern designs A, B, and C, pooled over all signals and normalized individually on directivities indicated by 1 and 7.

Figure 5.
Direct sound and specular reflections arriving at the listening position for and , normalized with respect to .
Figure 5.
Direct sound and specular reflections arriving at the listening position for and , normalized with respect to .
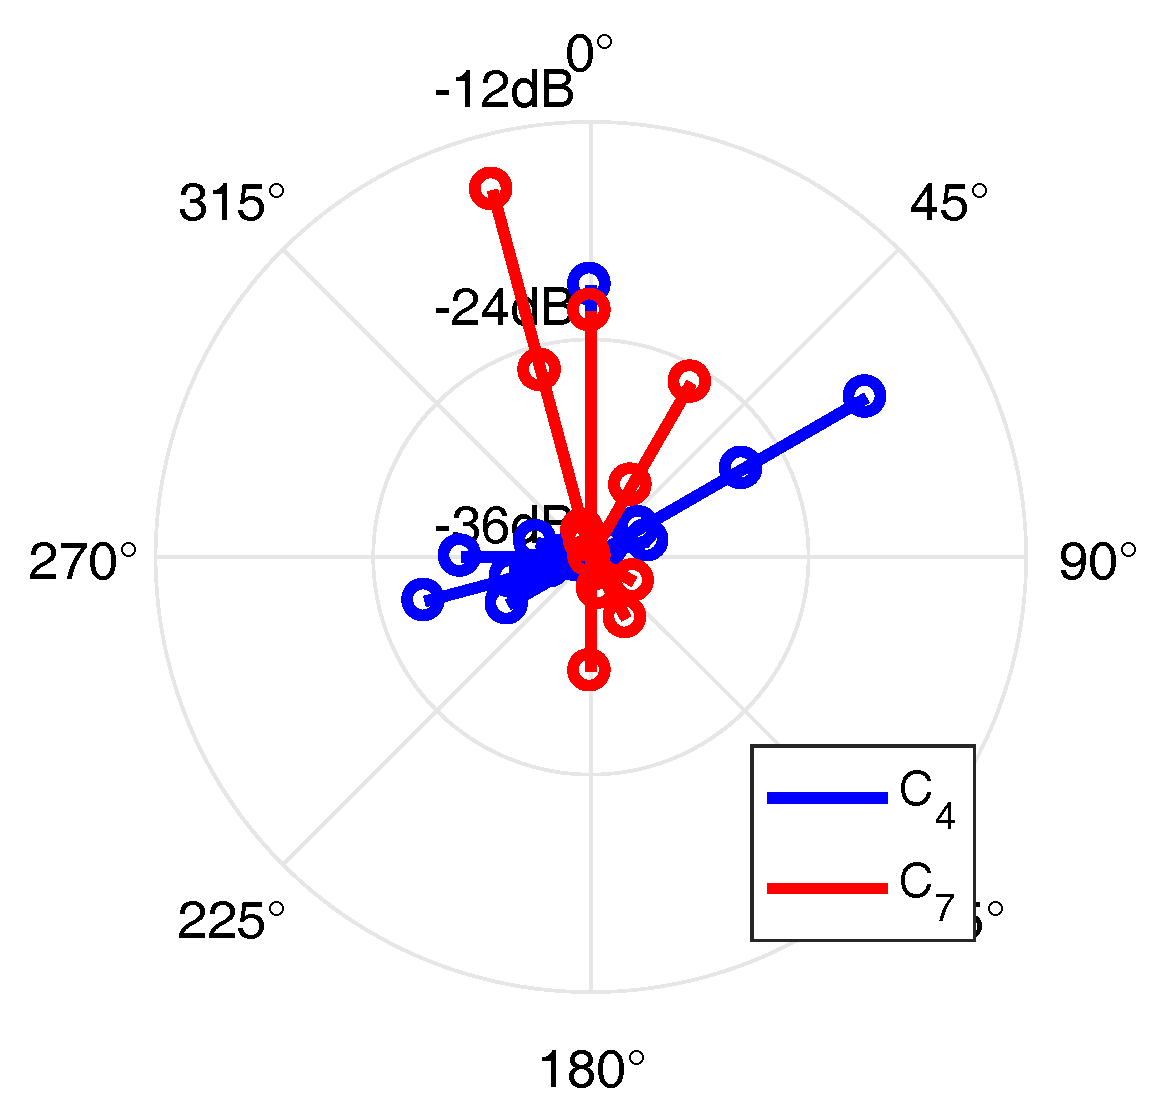
Figure 9.
Comparison of medians and 95% confidence intervals for all conditions (thin lines) with predictors (thick lines): D/R, BSMD STD, LF, and IACC.
Figure 9.
Comparison of medians and 95% confidence intervals for all conditions (thin lines) with predictors (thick lines): D/R, BSMD STD, LF, and IACC.

Figure 10.
Beampattern design .

Figure 11.
Horizontal cross-section through measured frequency-dependent beampatterns of the IKO normalized by the half-octave smoothed magnitude of the loudest direction in A*1=C1. Decibel values are color coded over frequency in Hertz and azimuth angle in degree.
Figure 11.
Horizontal cross-section through measured frequency-dependent beampatterns of the IKO normalized by the half-octave smoothed magnitude of the loudest direction in A*1=C1. Decibel values are color coded over frequency in Hertz and azimuth angle in degree.


Figure 12.
Conducting the listening experiment II.

Figure 13.
Experimental results of the distance task for signal and room with use of the IKO.

Figure 14.
Medians and corresponding 95% confidence intervals for beampattern designs of assessed width for signal with use of the IKO.
Figure 14.
Medians and corresponding 95% confidence intervals for beampattern designs of assessed width for signal with use of the IKO.


Table 1.
Properties of tested beampattern designs A, B, and C.
| A | 3rd-order max- beam to/off listener | |
| 2nd-order max- beam to/off listener | ||
| 1st-order max- beam to/off listener | ||
| omnidirectional beampattern | ||
| B | 3rd-order max- beams to and off listener linearly | |
| blended at dB | ||
| C | two 3rd-order max- beams horizontally arranged | |
| at with respect to the listener |
Table 2.
Properties of tested rooms R and signals S.
| room | IEM CUBE, | , | , | ||
| IEM CUBE, | , | , | |||
| IEM Lecture Room, | , | , | |||
| signal | female speech taken from Music for Archimedes, CD Bang and Olufsen 101 (1992) | ||||
| sequence of irregular artificial bursts | |||||
| speech-spectrum noise with increased kurtosis | |||||
Table 3.
Composition of tested sets, consisting of 7 and 9 samples.
| Set No. | Design | Index | Signal | Room | Reverb. Level |
|---|---|---|---|---|---|
| 1 | A | 0 | |||
| 2 | A | 0 | |||
| 3 | A | 0 | |||
| 4 | B | 0 | |||
| 5 | B | 0 | |||
| 6 | B | 0 | |||
| 7 | C | 0 | |||
| 8 | C | 0 | |||
| 9 | C | 0 | |||
| 10 | A | 0 | |||
| 11 | A | 0 | |||
| 12 | A | 1 | |||
| 13 | A | 0 | |||
| 14 | A | 0 | |||
| 15 | A |
© 2017 by the authors. Licensee MDPI, Basel, Switzerland. This article is an open access article distributed under the terms and conditions of the Creative Commons Attribution (CC BY) license (http://creativecommons.org/licenses/by/4.0/).
Share and Cite
MDPI and ACS Style
Wendt, F.; Zotter, F.; Frank, M.; Höldrich, R. Auditory Distance Control Using a Variable-Directivity Loudspeaker. Appl. Sci. 2017, 7, 666. https://doi.org/10.3390/app7070666
AMA Style
Wendt F, Zotter F, Frank M, Höldrich R. Auditory Distance Control Using a Variable-Directivity Loudspeaker. Applied Sciences. 2017; 7(7):666. https://doi.org/10.3390/app7070666
Chicago/Turabian StyleWendt, Florian, Franz Zotter, Matthias Frank, and Robert Höldrich. 2017. "Auditory Distance Control Using a Variable-Directivity Loudspeaker" Applied Sciences 7, no. 7: 666. https://doi.org/10.3390/app7070666
Note that from the first issue of 2016, this journal uses article numbers instead of page numbers. See further details here.