
Sampietrini Stone Pavements: Distress Analysis Using Pavement Condition Index Method


Department of Civil, Constructional and Environmental Engineering, Sapienza University of Rome, Via Eudossiana 18, 00184 Rome, Italy
*
Author to whom correspondence should be addressed.
Appl. Sci. 2017, 7(7), 669; https://doi.org/10.3390/app7070669
Submission received: 1 June 2017
/
Revised: 20 June 2017
/
Accepted: 27 June 2017
/
Published: 29 June 2017
Abstract
:In several Italian cities, it is possible to find historical pavements such as the Sampietrini pavements, which are mainly located in the center of the city of Rome. The Sampietrini pavement is a particular road surface paved in natural stone with irregular sharp elements that are assembled by hand with the evident not plan effect. Because of their peculiarities, they are not suitable for streets where high speed is allowed. In many cases, high vibration and noise levels due to road traffic traveling on Sampietrini pavements are caused by inadequate maintenance, which is also affected by the absence of specific evaluation criteria regarding surface conditions and performances of Sampietrini pavements. It is not possible, in fact, to adopt common approaches developed to be used for flexible and rigid pavements, because they present completely different features and distresses. In this paper, to overpass this problem, a new evaluation criterion based on Pavement Condition Index (PCI) method established for block pavements is proposed. Furthermore, to fully characterize this kind of pavements, other analyses, i.e., International Roughness Index (IRI) and comfort level evaluation based on ISO 2631 standard, were also carried out. The results showed a good correlation between PCI and IRI approaches (R2 = 0.82), also highlighting that new or reconstructed Sampietrini pavements present not negligible roughness level. This aspect was also confirmed estimating the comfort level perceived by users traveling at several speeds (≤50 km/h). Finally, speed related threshold values to be adopted for PCI and IRI methods are proposed. The proposed method can be implemented by pavement managers in a PMS ad hoc for stone block paving and thus, it can be integrated with other equivalents methods of visual inspection based on PCI.
1. Introduction
In order to guarantee the proper maintenance of a road network, it is very important to monitor the conditions of road pavements along their service life. In this sense, the development of an adequate Pavement Management System (PMS) is a very useful tool for road agencies, identifying appropriate intervention thresholds and maintenance strategies for the restoration of the optimal performances, in terms of grip, bearing and roughness levels. [1,2,3,4].
Most PMSs, actually adopted, are related to major roads and airport infrastructures [5] but, nowadays, considering the lack of budget available to administrations, a general attention to the applications of PMS to urban areas is paid [5,6,7,8]. Many PMSs include both visual and automatic surveys in their procedure, adopting several indices for the evaluation of road pavement performances. Among these, two of the most commonly used ones are the Pavement Condition Index (PCI) elaborated by Shahin [2] and the International Roughness Index (IRI), which was elaborated from a World Bank study in the 1980s [9]. The first one provides a global assessment of pavements condition surveying several distress categories. In particular, it was designed for the assessment of distress related to rigid and flexible pavements [10], which are the most common types that can be found in a generic road network. IRI, instead, is used worldwide as road roughness evaluation criterion and its calculation requires the measurement of road profiles using specific devices, also known as profilometers [11].
In recent studies [12,13], the correlation between IRI and PCI was investigated, with particular attention to urban roads. In addition, based on IRI and distresses relation, some IRI threshold values to be used in urban areas are proposed in [14].
In urban networks, however, different kinds of pavement can be found, such as block or modular pavements, which are defined as pavements composed of pre-formed modular pavers of brick and concrete, which, generally, have been successfully used worldwide for low volume roads and pedestrian areas [15,16]. Considering the peculiar characteristics of these types of pavements, it is not possible to extend to them distresses and evenness evaluation methods designed for rigid and flexible pavements. In particular, starting from the PCI method described in [2,10], some authors developed specific guidelines to survey and evaluate distresses affecting block pavements [17,18,19].
In several Italian cities, it is possible to find historical pavements such as the Sampietrini pavements [20], which share similar features with modular block pavements. This kind of pavement is especially present in the center of Rome and, because of its peculiar characteristics, it is not possible to apply consolidated survey methods or threshold values commonly adopted for flexible and rigid pavements.
For this reason, a specific case of study related to the Sampietrini block pavement was performed in this paper, modifying the PCI method related to block pavement in order to be suitable for this kind of pavement. Furthermore, for each section the sample surface evenness evaluation was carried out calculating the corresponding IRI value, investigating also possible correlations between the proposed PCI method and IRI. In addition, some considerations concerning users’ comfort perception traveling at different speeds (<50 km/h) along this type of pavement were performed using the frequency-weighted vertical acceleration (awz) approach described in [21,22,23].
2. Methodology and Data
2.1. Sampietrini Pavements
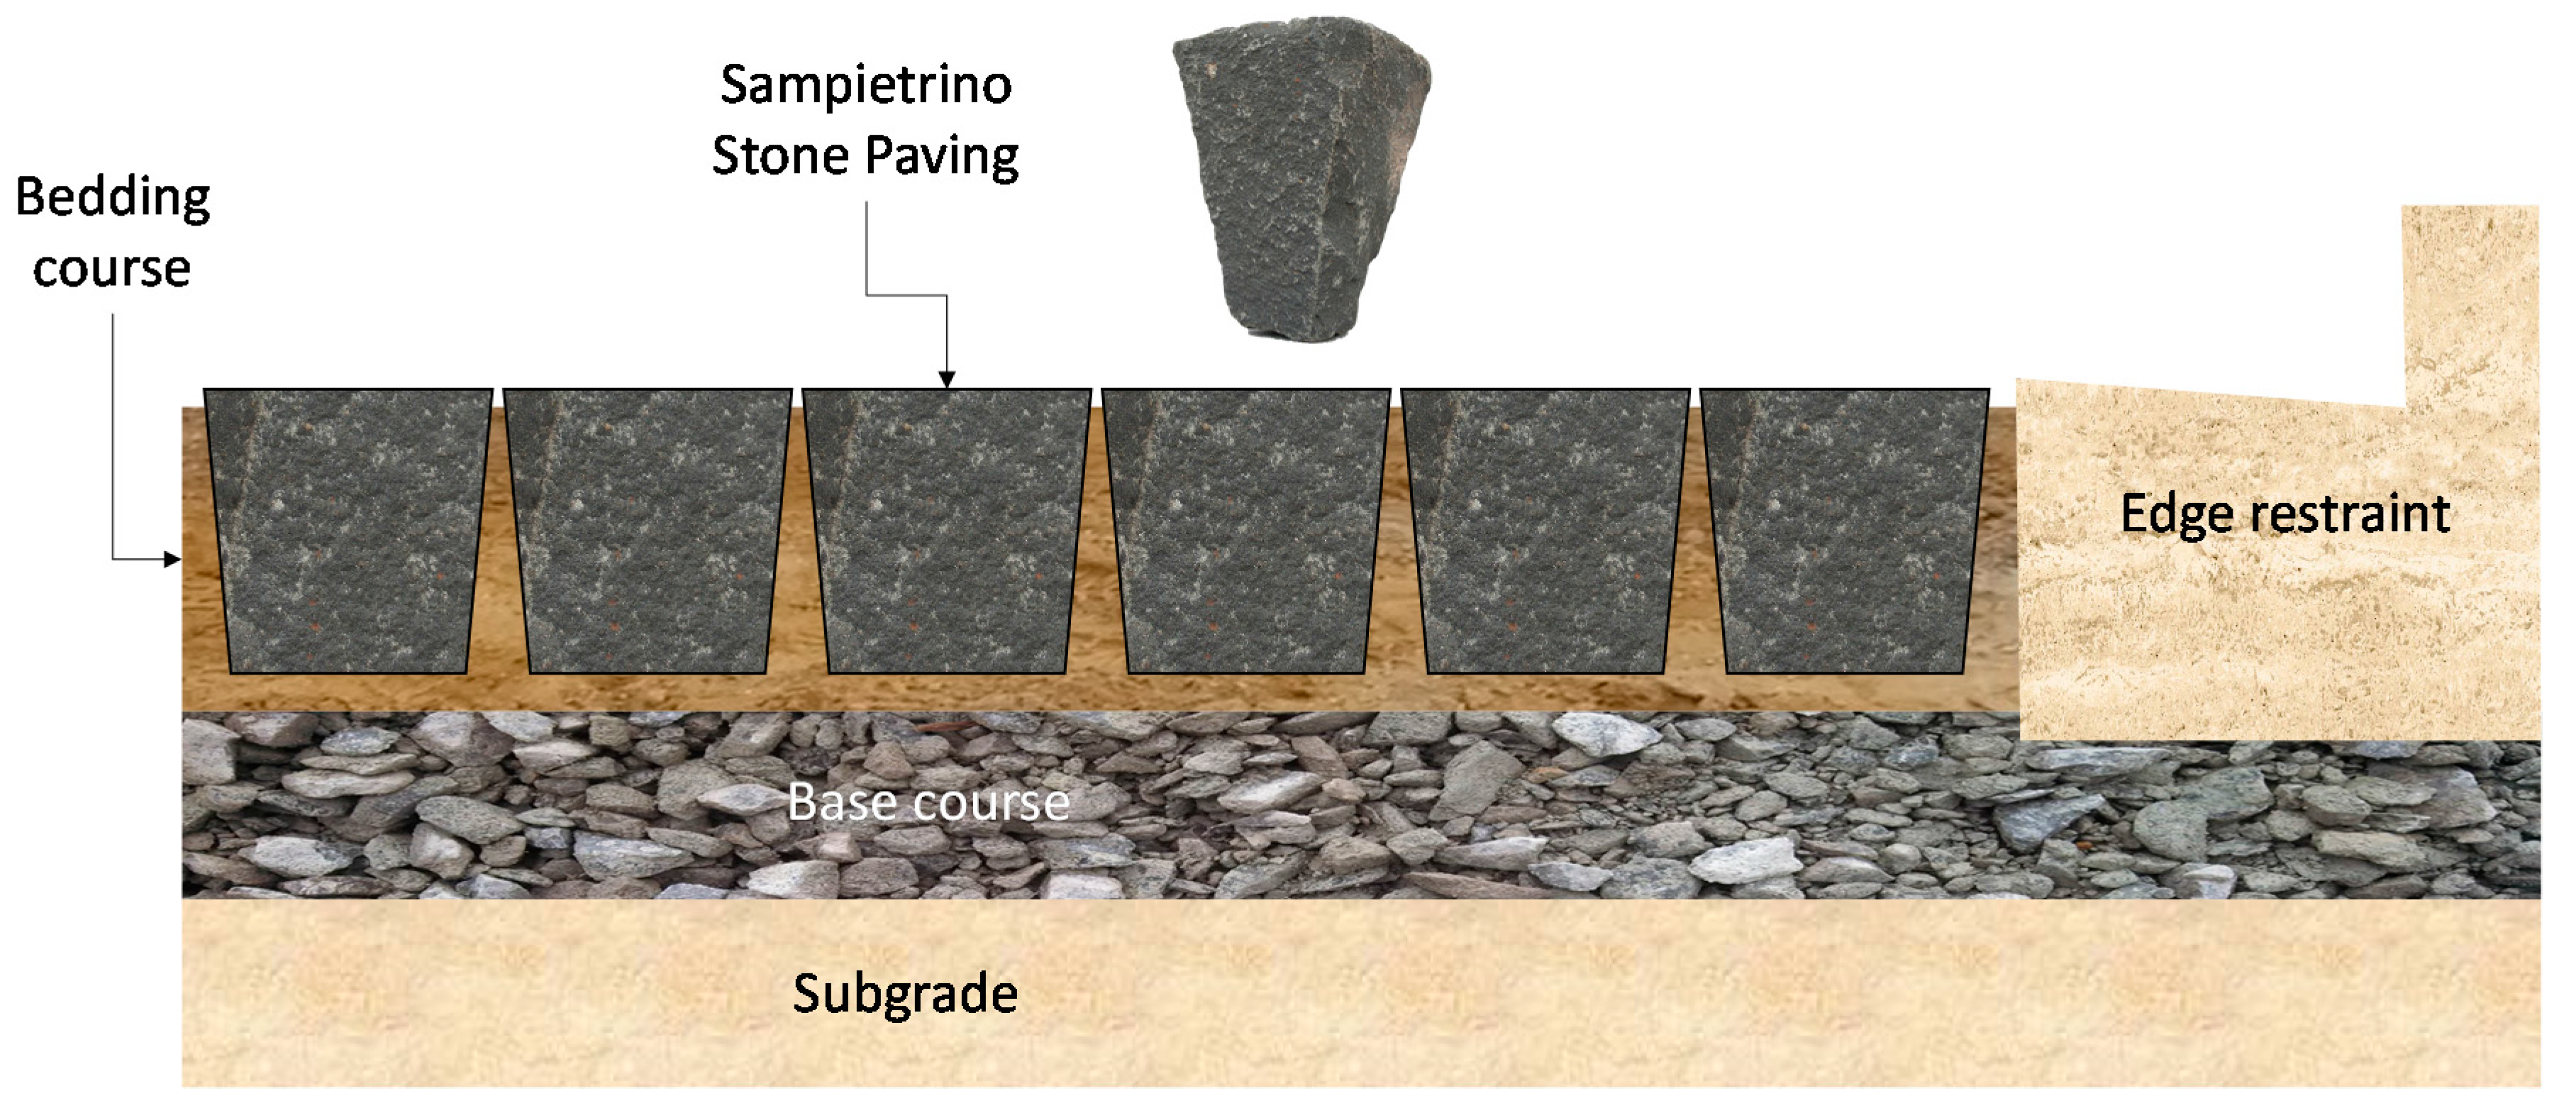
In several Italian cities, it is possible to find historical pavements such as the Sampietrini pavements, which are especially present in the center of the city of Rome. The first documented use of Sampietrini stones in Rome was during the reign of Pope Pius V (1566–1572). The name derives from their first use in St. Peter’s Square and later, over the next centuries, the stones were used to pave all the main streets of Rome, providing a smoother and stronger surface for carriages than bricks. This kind of pavement is made of beveled stones of black basalt, also simply called Sampietrini, placed one next to the other. The shape of each block (also called sampietrino) can be approximate by a cubic or a square-based truncated pyramid solid. Sampietrini blocks of different dimensions can be used. The largest ones are characterized by a square head of 12 cm × 12 cm and height of approximately 18 cm; however, the common height is equal to 6 cm. The smallest and rare ones, which are located in specific areas of Rome such as Navona Square, present a square head of 6 cm × 6 cm. In Figure 1, a typical cross section of this type of pavements is represented, while Figure 2 presents the two main geometric patterns which can generally be realized using Sampietrini blocks. The mechanical properties of Sampietrini material are reported in Table 1 and, as shown by some studies performed by Penta in the 1950s, the performance of the Sampietrini pavements depends on the resistance of each block but also on the tile pattern realized, which meaningfully affects the global behavior of this kind of pavement [20].
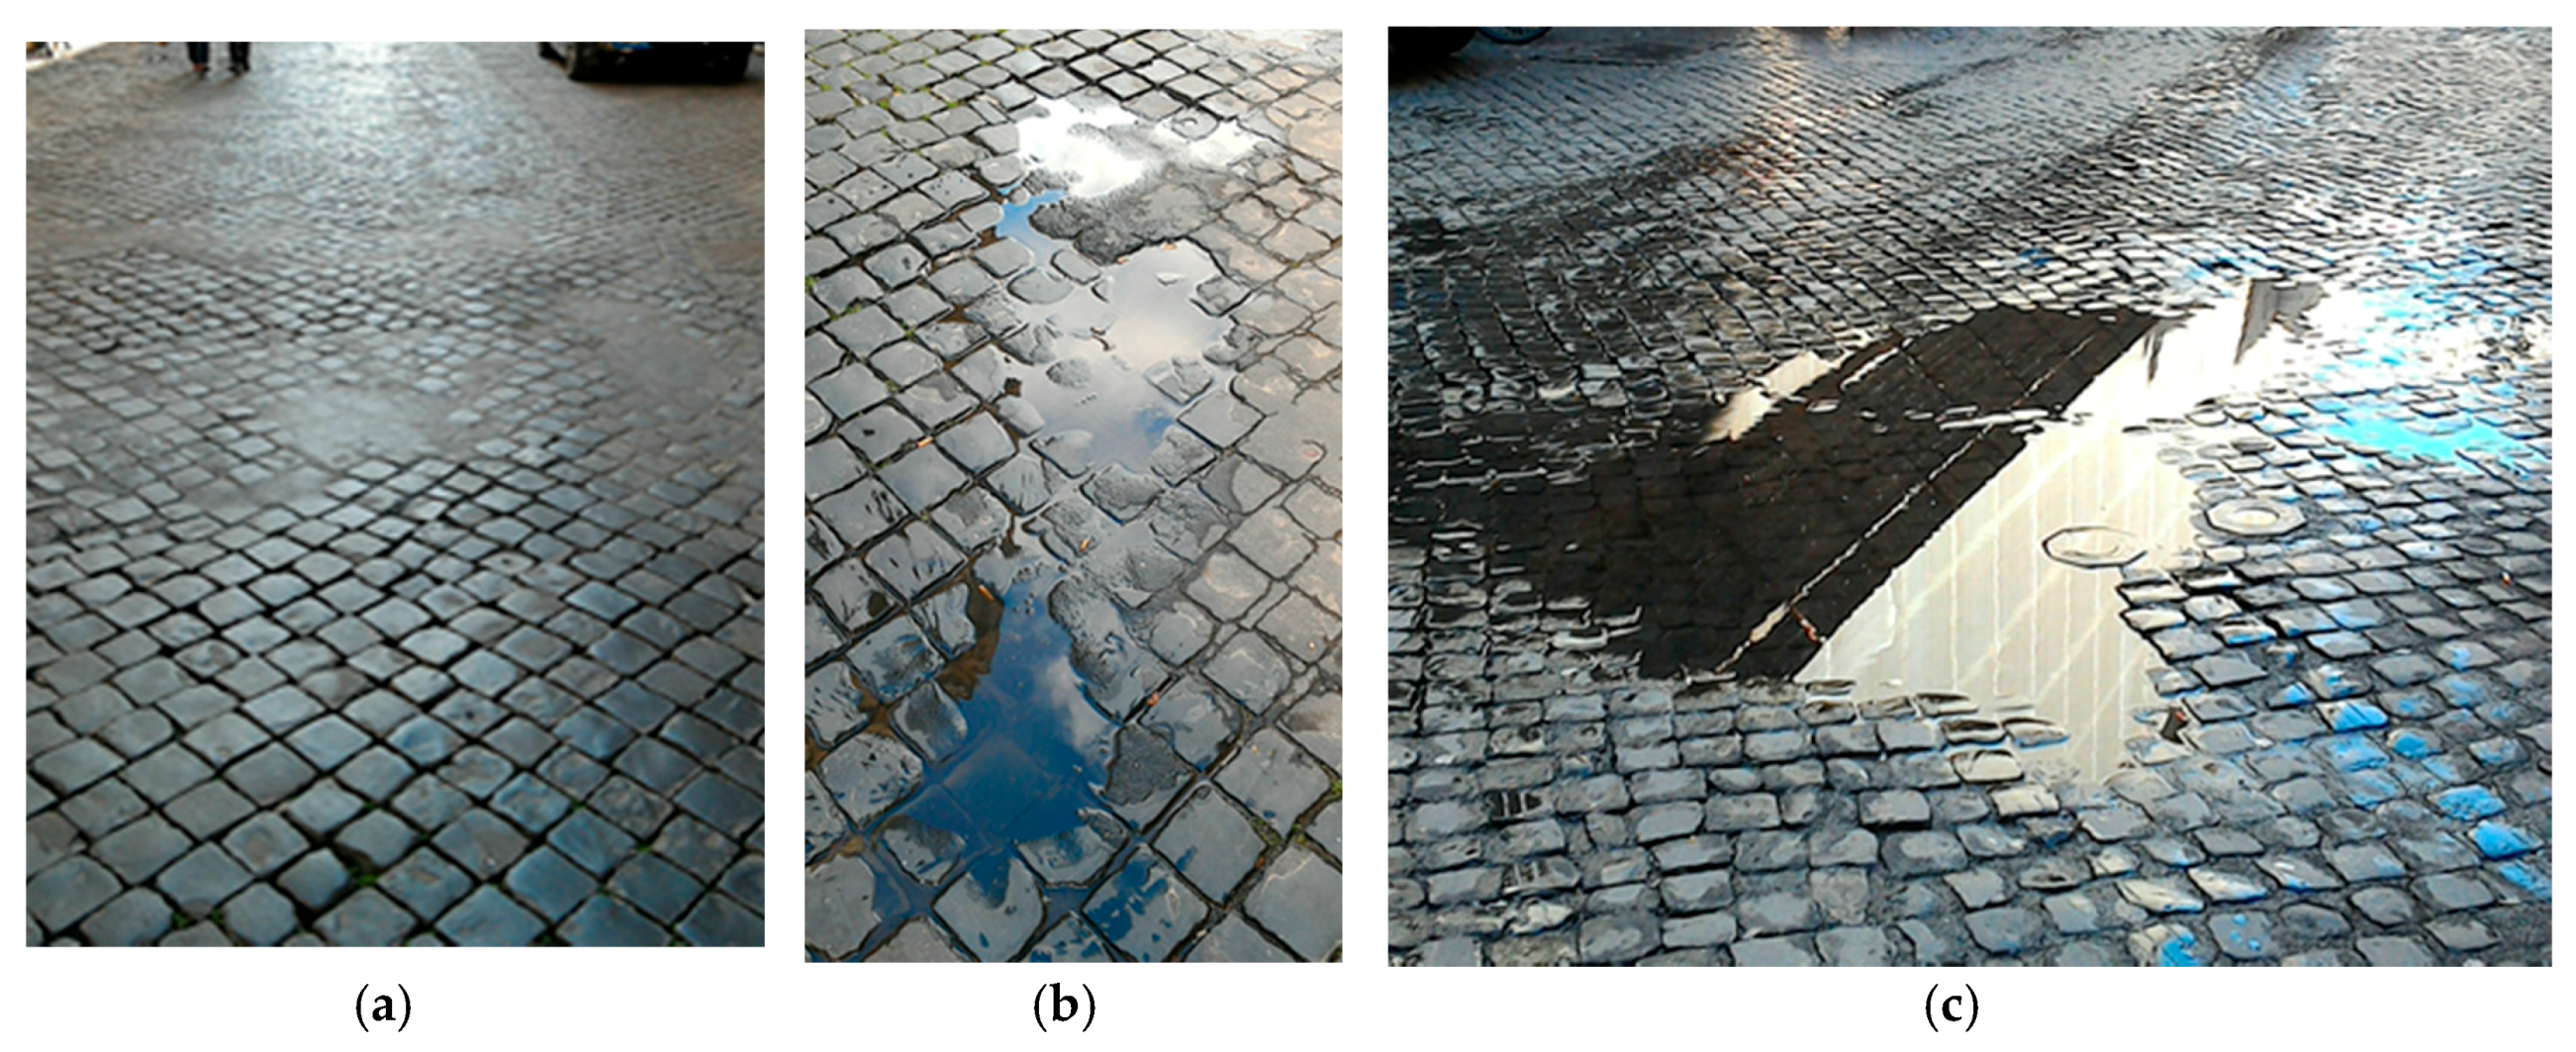
Sampietrini pavement presents some advantages; in fact, it does not completely cover the ground, leaving small spaces for the water to pass through and can easily adapt to the irregularities of the ground. Furthermore, being of volcanic basalt, Sampietrini are very strong and resistant.
The main problem associated with Sampietrini blocks concerns that they get very slippery when they are wet, being a hazard above all for two-wheeled vehicles moving in the city. In addition, due to their irregular shape, traveling on this kind of pavement is very uncomfortable and noisy; moreover, heavy vehicles passing on it may cause wide vibrations that can damage the surrounding buildings, with particular attention to historical ones.
Because of their peculiarities, Sampietrini pavements are not suitable for streets where high speed is allowed, thus, nowadays, Sampietrini were replaced in many roads of Rome but they are still used in slow traffic areas (speed ≤ 50 km/h), such as the center of Rome such as Trastevere (Figure 3).
Although the percentage of the urban road network characterized by Sampietrini pavement is pretty low (about 2%), it presents a whole extension equal to about 100 km, which cannot be neglected in an appropriate and optimized PMS. Furthermore, the aforementioned pavements not only constitute an important historic heritage of the city of Rome, but they are also located in the most visited and prestigious areas of Rome, as can be seen in Figure 3.
In addition to the urban road network of 100 km, several other roads in Sampietrini are located within the Lazio region and in other towns in Italy, whose extension and the accurate location is difficult to know with sufficient precision.
The construction of this kind of pavement is very complex (Figure 4) and it requires very skilled and specialized workers, which are very rare nowadays. In the past, in fact, the knowledge and the know-how were handed down from father to son.
For this reason, the costs to construct Sampietrini pavements are significantly greater than the costs required for asphalt concrete pavements. The estimated costs provided by the city of Rome [24], in fact, indicate a cost equal to about 200 €/m2 for Sampietrini pavement and about 50 €/m2 for asphalt concrete ones. This meaningful gap (ratio of 4:1) further motivates the need to pay particular attention to identifying distresses’ type and location and selecting the appropriate maintenance actions to fix them.
Sampietrini pavements need a lot of maintenance since the blocks are not fixed into the ground with cement or any other bonding agent, but are simply hammered into the sandbed.
In many cases, high vibration and noise levels due to road traffic traveling on Sampietrini pavements are caused by inadequate maintenance [25], which is also affected by the absence of specific evaluation criteria regarding surface conditions and performances of Sampietrini pavements. It is not possible, in fact, to adopt common approaches developed to be used for flexible and rigid pavements, because they present completely different features and distresses.
In this paper, in order to overpass this problem, a new evaluation criterion based on PCI method established for block pavements is proposed. In particular, 14 sections belonging to different low volume roads and located in the center of the city of Rome, were analyzed according to three different approaches: PCI, IRI and awz. In Figure 5 and Figure 6, two examples of the examined road sections are depicted.
For all sections, having a length of 80 m and width equal to 3 m (for a total pavement area of 240 m2), the two alignments (right and left) were measured using a contact profilometer (i.e., Dipstick).
2.2. Performed Analyses
In order to fully characterized Sampietrini stones pavements, three different approaches were considered: PCI for global distresses assessment, IRI for evenness evaluation and awz for ride quality estimation. The aim of the analyses performed using the two latter indices, is trying to define (or to estimate) the roughness level and the ride comfort related to new or reconstructed Sampietrini pavements. In the following sections, a brief description of each road evaluation method applied to the Sampietrini pavements is provided.
2.2.1. Pavement Condition Index (PCI)
The PCI is a numerical indicator, based on the inspection of different distress types affecting road pavement surface. For each distress, the corresponding severity and quantity are identified and recorded on specific survey data sheet reported in [10]. PCI rating scale (Table 2) varies from 0 (failed pavement) to 100 (perfect condition).
As already stated, this method was developed to be used for rigid and flexible pavements [2,10], even though some authors have proposed guidelines in order to apply PCI approach to concrete block pavements [18,19].
Considering the similarities between Sampietrini and concrete block pavements (i.e., they are both modular pavement, and each block presents homogeneous mechanical characteristics), a specific distresses catalogue for Sampietrini pavements was established starting from the one reported in [18]. In particular, threshold values related to the three severities (low, medium and high) were modified, taking into account the specific shape size of a single block of Sampietrini pavements.
Therefore, the distress catalogue proposed for Sampietrini pavements includes all the distresses (Table 3) described in Appendix A, whose descriptions are mostly taken from [18]. Compared to distress catalogue presented in [18], horizontal creep distress (distress identified by 107) can be considered negligible for Sampietrini pavements.
2.2.2. International Roughness Index (IRI)
The International Roughness Index (IRI) is the worldwide used road roughness evaluation indicator, elaborated from a World Bank study in the 1980s. It is based on a mathematical model called quarter-car and developed in order to assess the ride quality on road pavements. The assessment is performed by a simulation model, calculating the suspension motion on a single profile and dividing the sum by the distance traveled according to Equation (1):
where l is the length of the profile in km, v is the simulated speed equal to 80 km/h, is the time derivative of vertical displacement of the sprung mass in meters and is the time derivative of vertical displacement of the unsprung mass in meters. The result is the IRI value and it is expressed in slope units (e.g., m/km or mm/m).
In the present work, the IRI calculation was performed by means of a Matlab© code, where the algorithm provided by ASTM E1926 [26] standard is implemented. For each analyzed section, two alignments (right and left) were measured, calculating the corresponding IRI value for both of them. Finally, the mean value characterizing the whole section was obtained using Equation (2):
2.2.3. Frequency-Weighted Vertical Acceleration (awz)
In addition to IRI and PCI methods, a further analysis performed to fully characterize Sampietrini pavements was the ride quality evaluation carried out adopting the frequency-weighted vertical acceleration (awz) parameter, described in [27]. To determine the frequency-weighted vertical acceleration on users due to road roughness [28], several simulations at different speeds (10–50 km/h) were performed using the eight degrees of freedom (d.o.f.) full car model developed by Cantisani and Loprencipe [21] and calibrated in order to represent the behavior of a common passengers’ car.
Starting from the vertical accelerations calculated by this model traveling along the road profiles, it is possible to determine the root mean square (RMS) accelerations through the evaluation of the power spectral density (PSD). Acceleration PSD is then calculated in correspondence of the 23 one-third octaves bands, representative of the frequency range of interest for the human response to vibrations (0.5–80 Hz), as specified by ISO 2631 standard. The final value for awz index is then obtained using the following Equation (3):
where Wk,i are the frequency weightings in one-third octaves bands for seated position, provided by the standard, and aiz is the vertical root mean square (RMS) acceleration for the i-th one-third octave band.
Then, awz values can be compared with the threshold values proposed by ISO 2631 for public transport (Table 4) to estimate the corresponding comfort level perceived by users traveling along the examined road sections.
By means of this analysis, it is possible to estimate the maximum speed at which drivers can transit on new or reconstructed Sampietrini pavements that cannot present a perfectly smoothed surface. In this way, the chance of using this type of pavement for certain road categories in the urban network is also assessed.
3. Results and Discussions
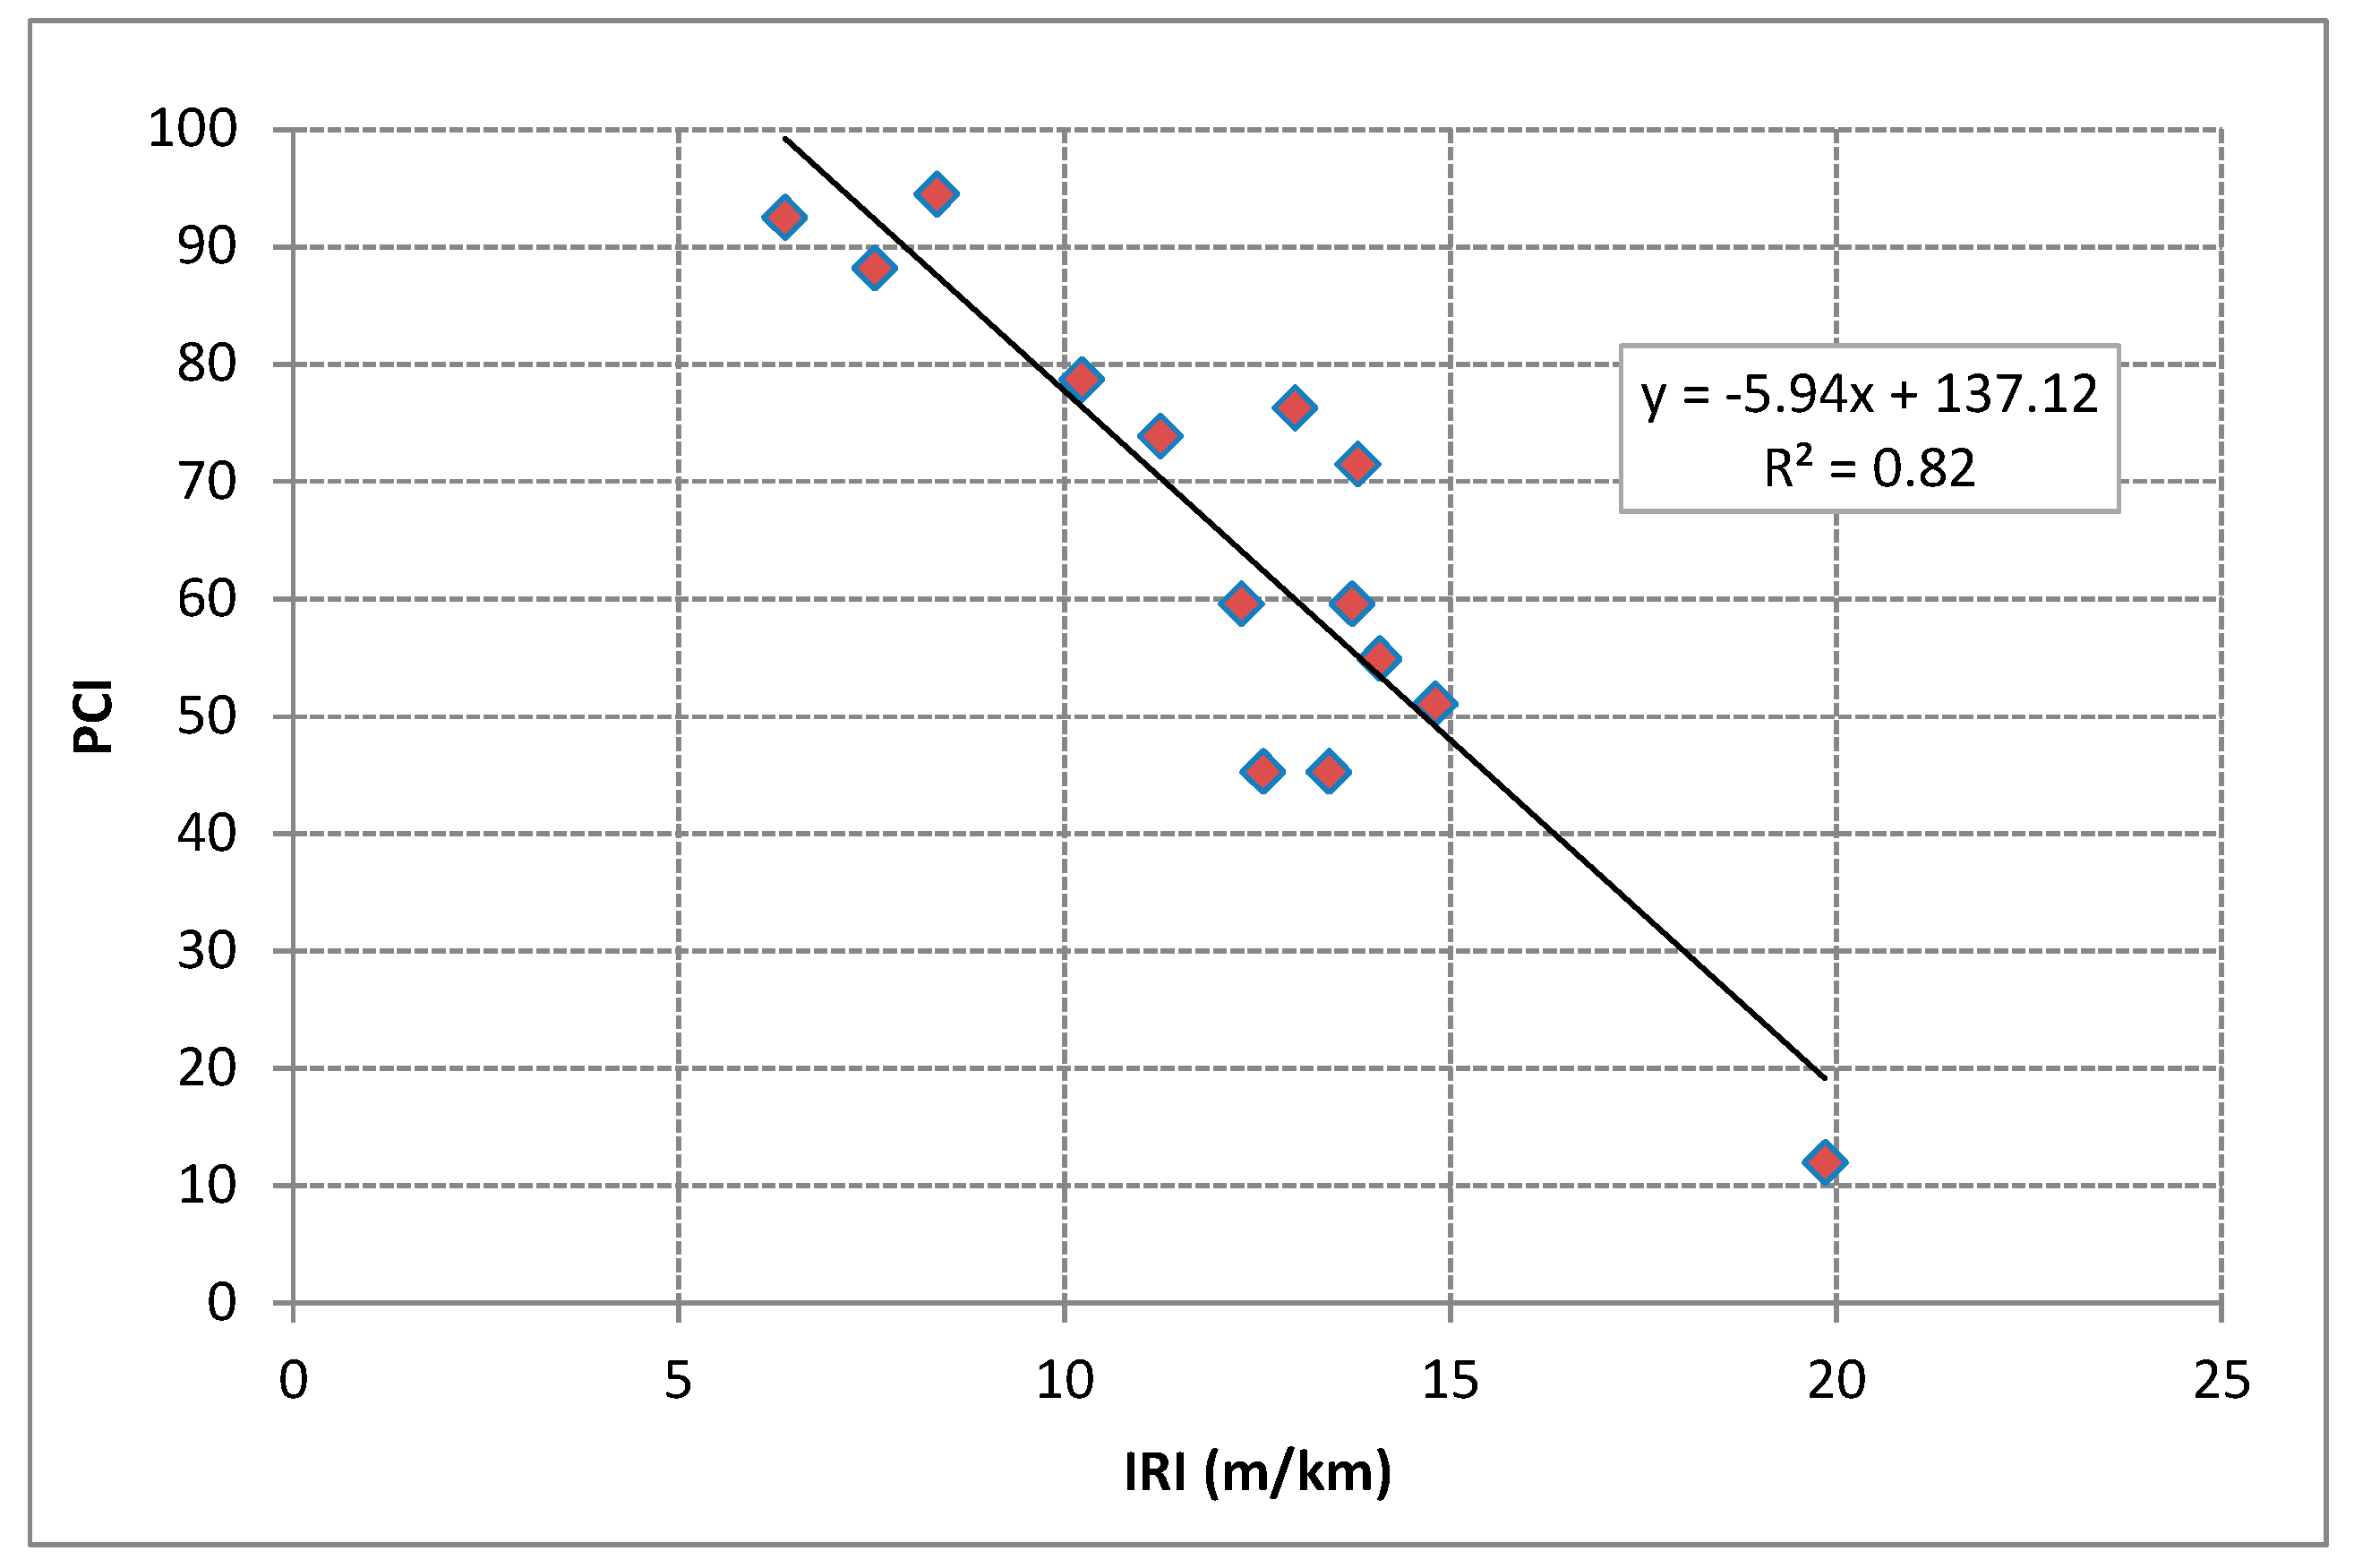
PCI values calculated for the sections examined in this paper, present a good variability going from 12 to 94, although just one section has PCI <40, corresponding to very poor pavement condition or worst. More details about the distresses presented in each inspected section are reported in Appendix B. As can be seen in Figure 7, a good correlation between PCI and IRI was found (R2 = 0.82). In particular, it can be noted that for good Sampietrini pavements (PCI > 86), IRI value varies between 6 and 8. These values, in case of rigid or flexible pavements, might be commonly associated to damaged pavement [11].
The peculiarity of IRI range values found for Sampietrini pavements is better underlined looking at Figure 8, where the relation between PCI and IRI for different types of pavement is depicted.
In particular, it can be seen that, according to the relations found by Arhin et al. [12], regardless of the type of pavements, IRI values are always lower than 10 m/km, even for PCI close to 0. Considering the relation found by Park et al. [29] for asphalt pavements, instead, for PCI values lower than 40 (corresponding to pavements condition from very poor to failed, see Table 2) very high values of IRI are found.
In any case, it is clear that different IRI values must be associated to new or reconstructed Sampietrini pavements, compared to the most common types of pavement (flexible and rigid).
Starting from this result, it was decided to evaluate the ride quality perceived by road users traveling along Sampietrini pavements at different speeds. As already stated, taking into account that this type of pavement is present just in urban areas, velocity range between 10 and 50 km/h was considered. As can be seen in Figure 9, very weak correlations (R2 = 0.44–0.70) were found between IRI and awz values at different speeds.
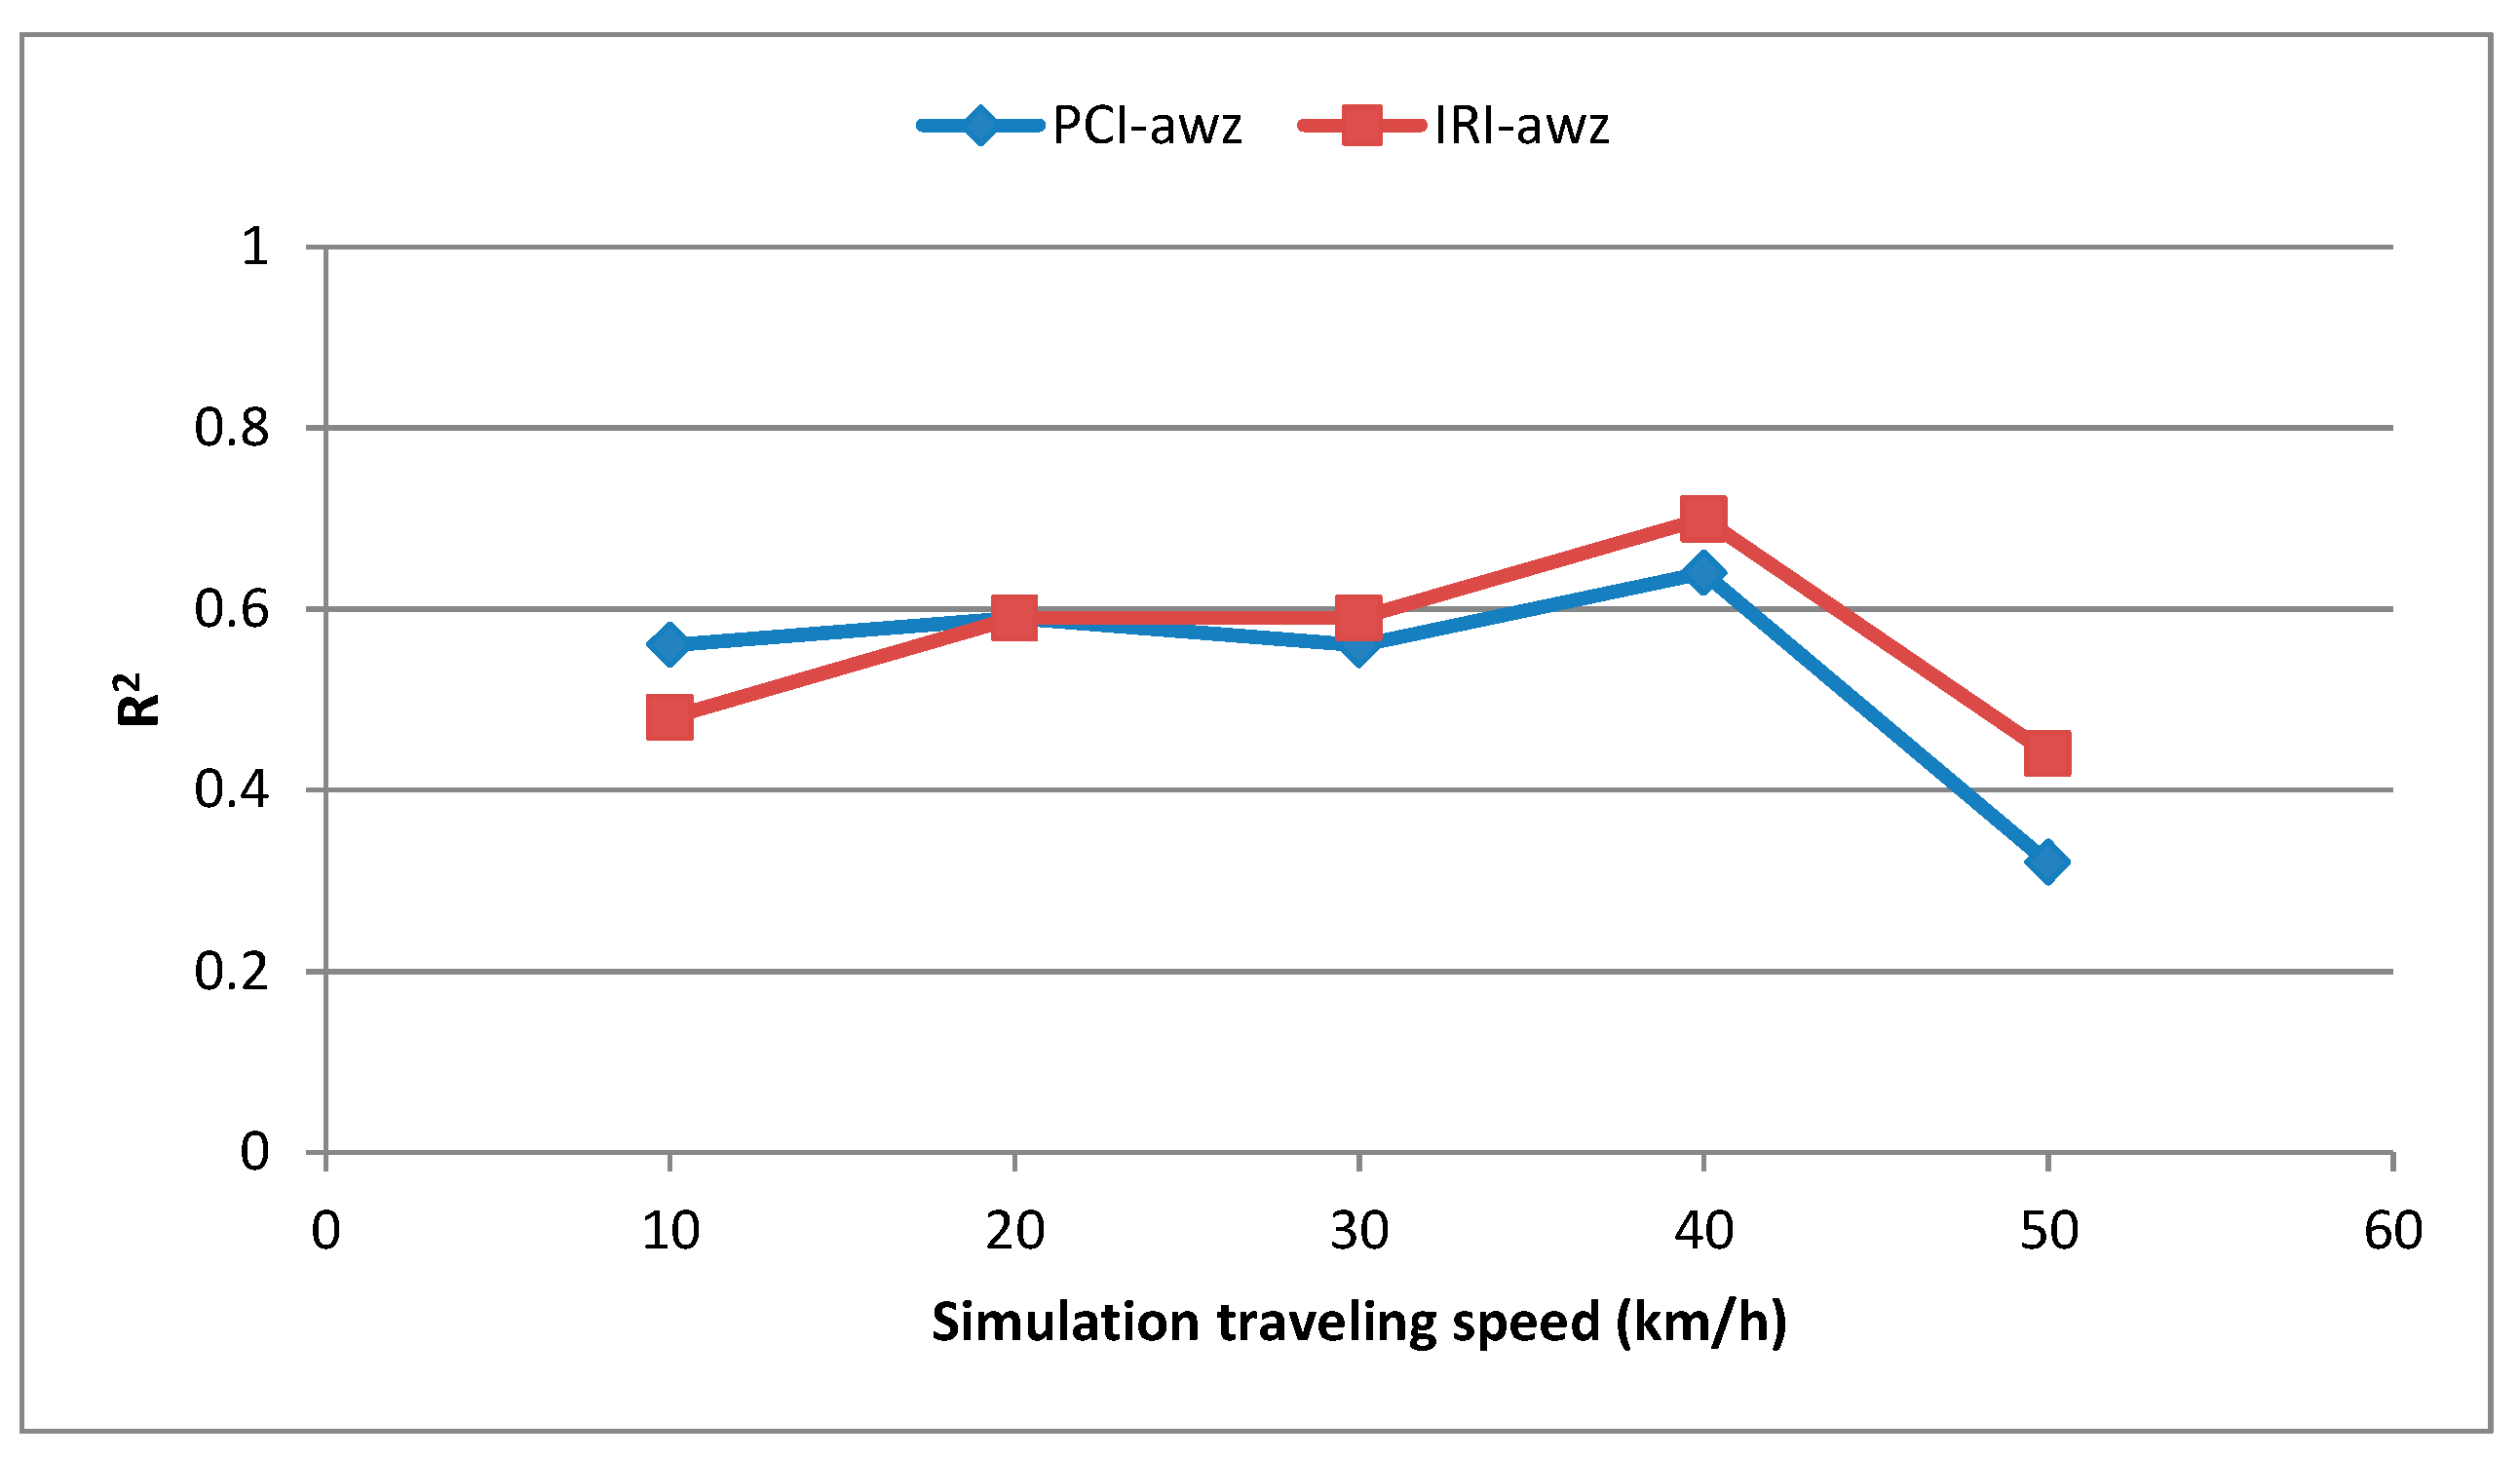
Similar results, in terms of correlation coefficient R2, were obtained comparing PCI and awz approaches (Figure 10). In fact, as depicted in Figure 11, R2 values at different speeds for IRI-awz and PCI-awz correlations are very close to each other.
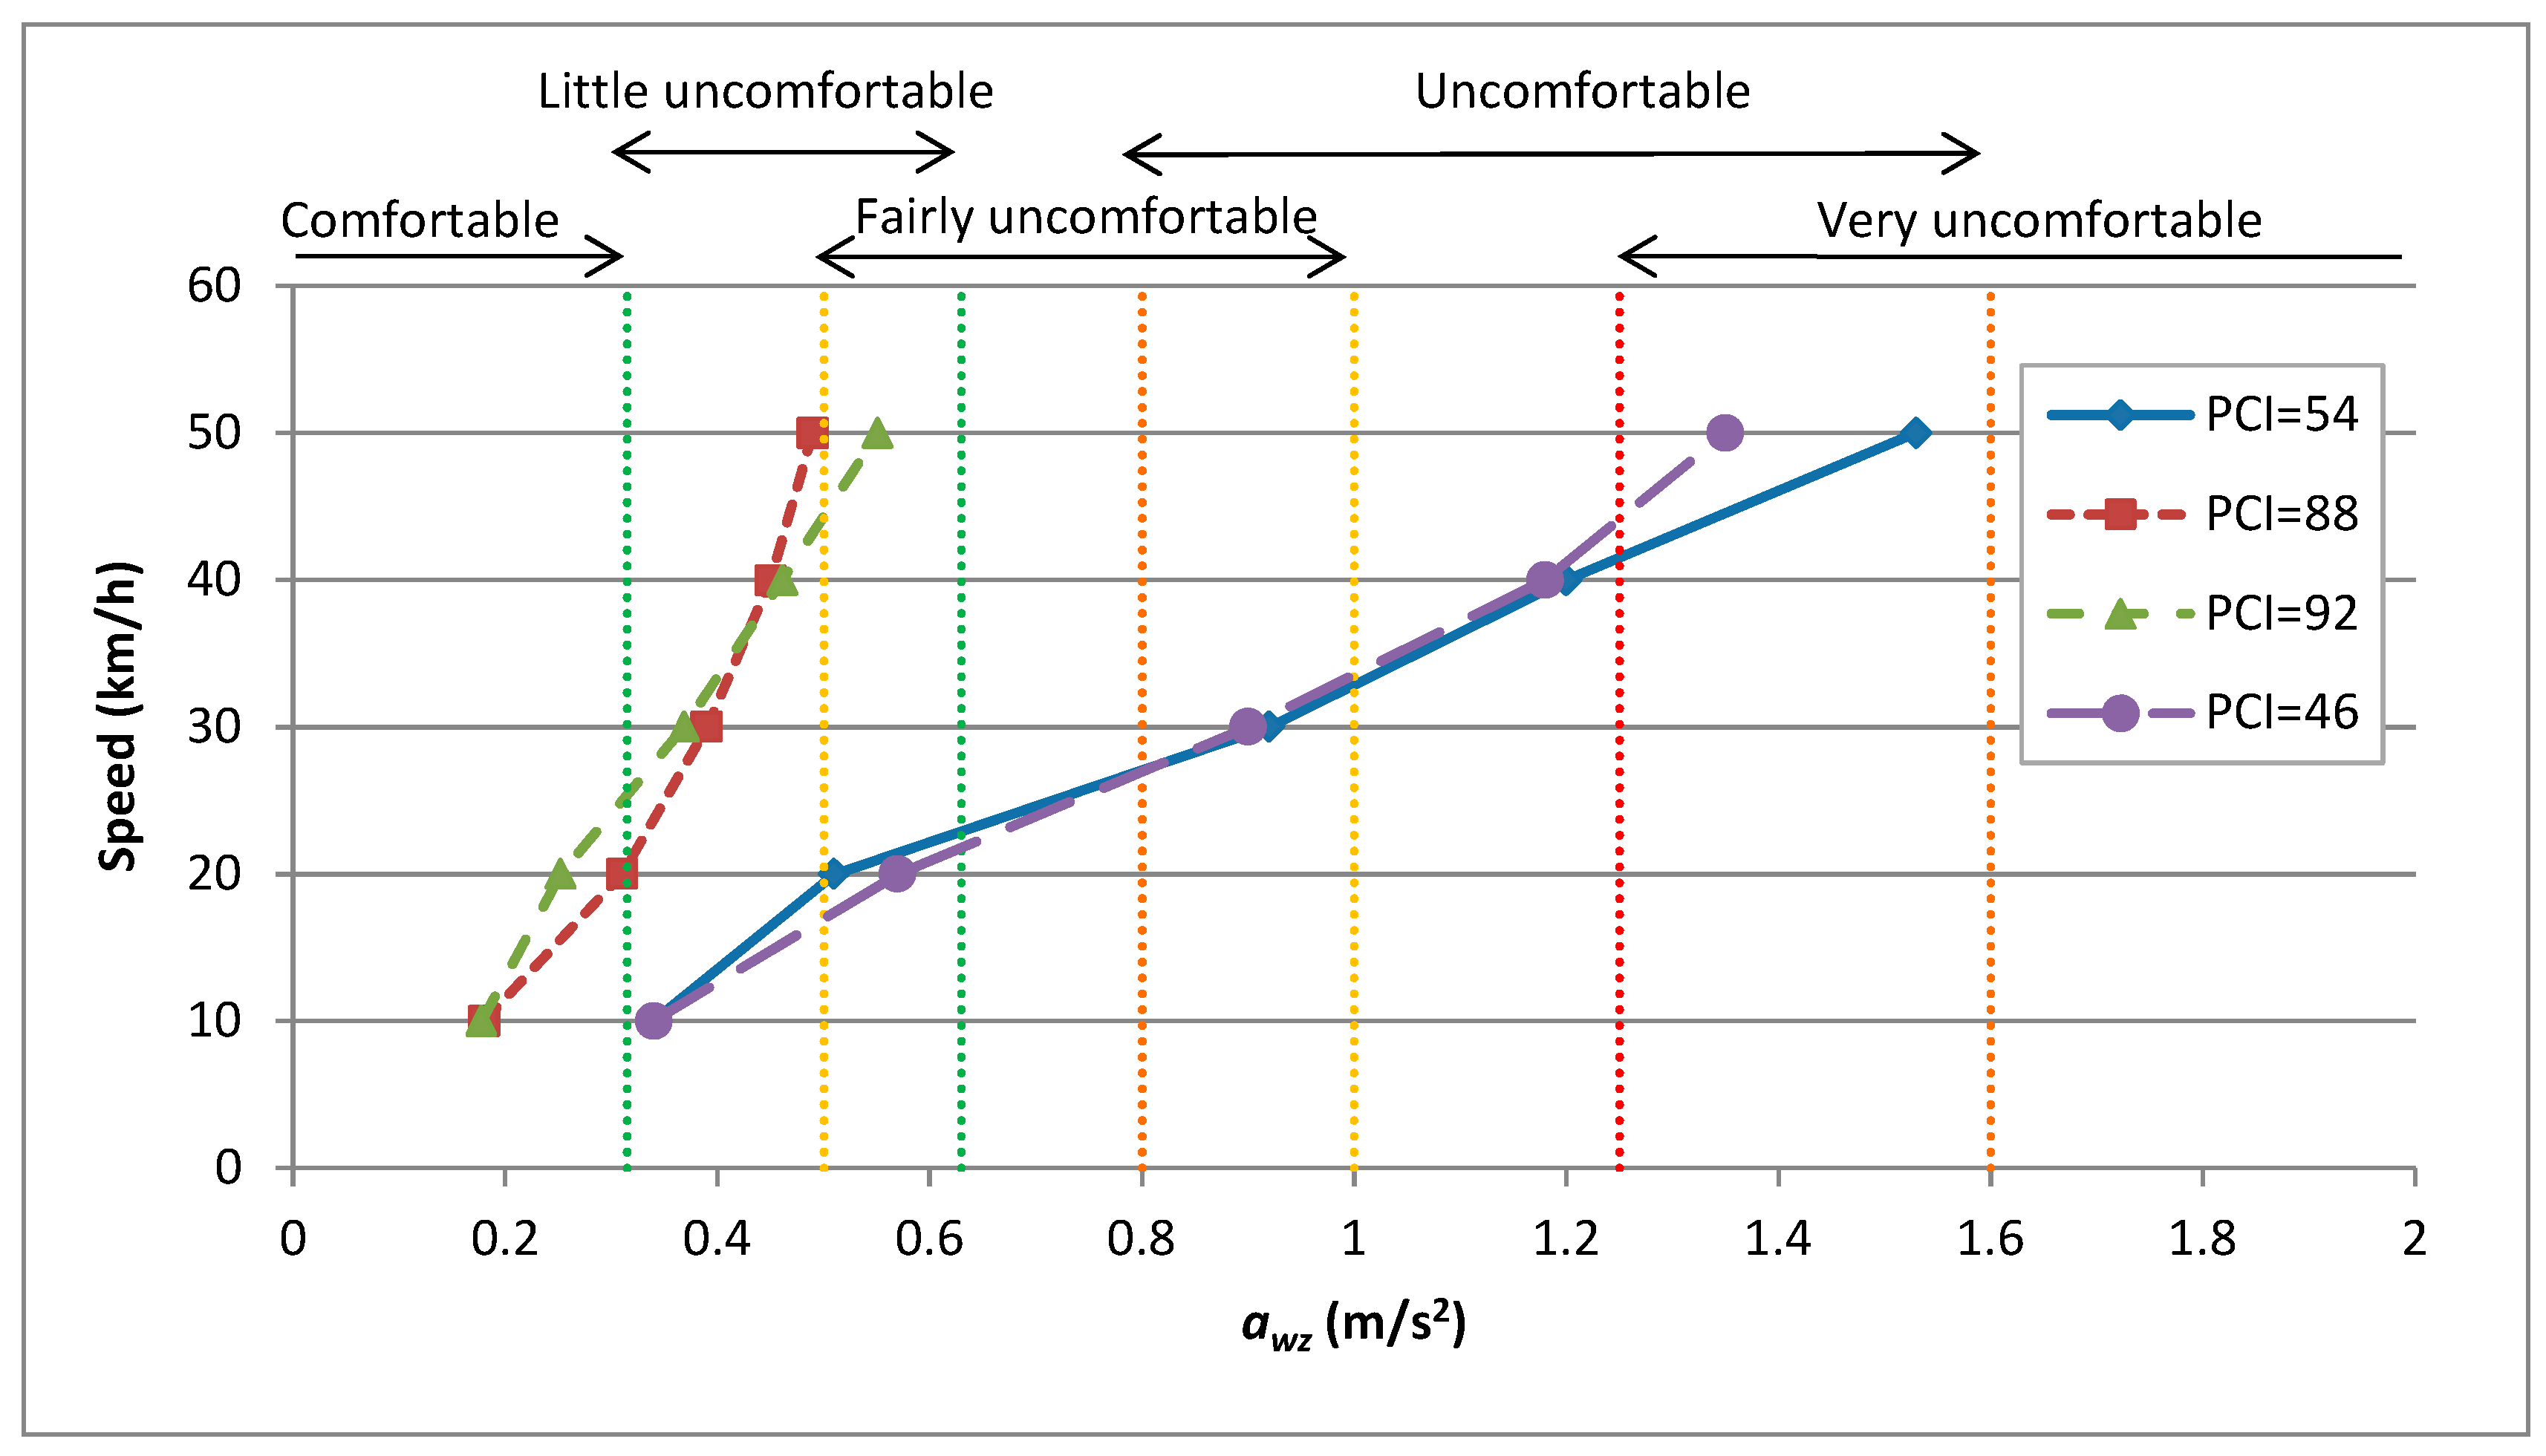
Considering for example two sections having PCI >85 (corresponding to a pavement in good condition), it is possible to evaluate the comfort level induced on road users traveling at different velocities on new or reconstructed Sampietrini pavements. As can be seen in Figure 12, also moving at 50 km/h (maximum legal speed allowed on Italian urban roads) the worst comfort level perceived by drivers is equal to “fairly uncomfortable”. In the same figure, two sections characterized by PCI values between 41 and 55 (corresponding to poor pavement condition) are also reported. In this case, at the maximum allowable speed (i.e., 50 km/h), the comfort level was found to be very uncomfortable. Furthermore, levels equal to fairly uncomfortable/uncomfortable are already reached at 30 km/h.
The aforementioned results show the chance of using Sampietrini pavements on the urban road network, allowing a little level of discomfort on users. In order to prevent an excessive decay of level of service (in terms of comfort), it would be appropriate to adopt comfort and speed related threshold values for IRI and PCI approaches, as also proposed in [30].
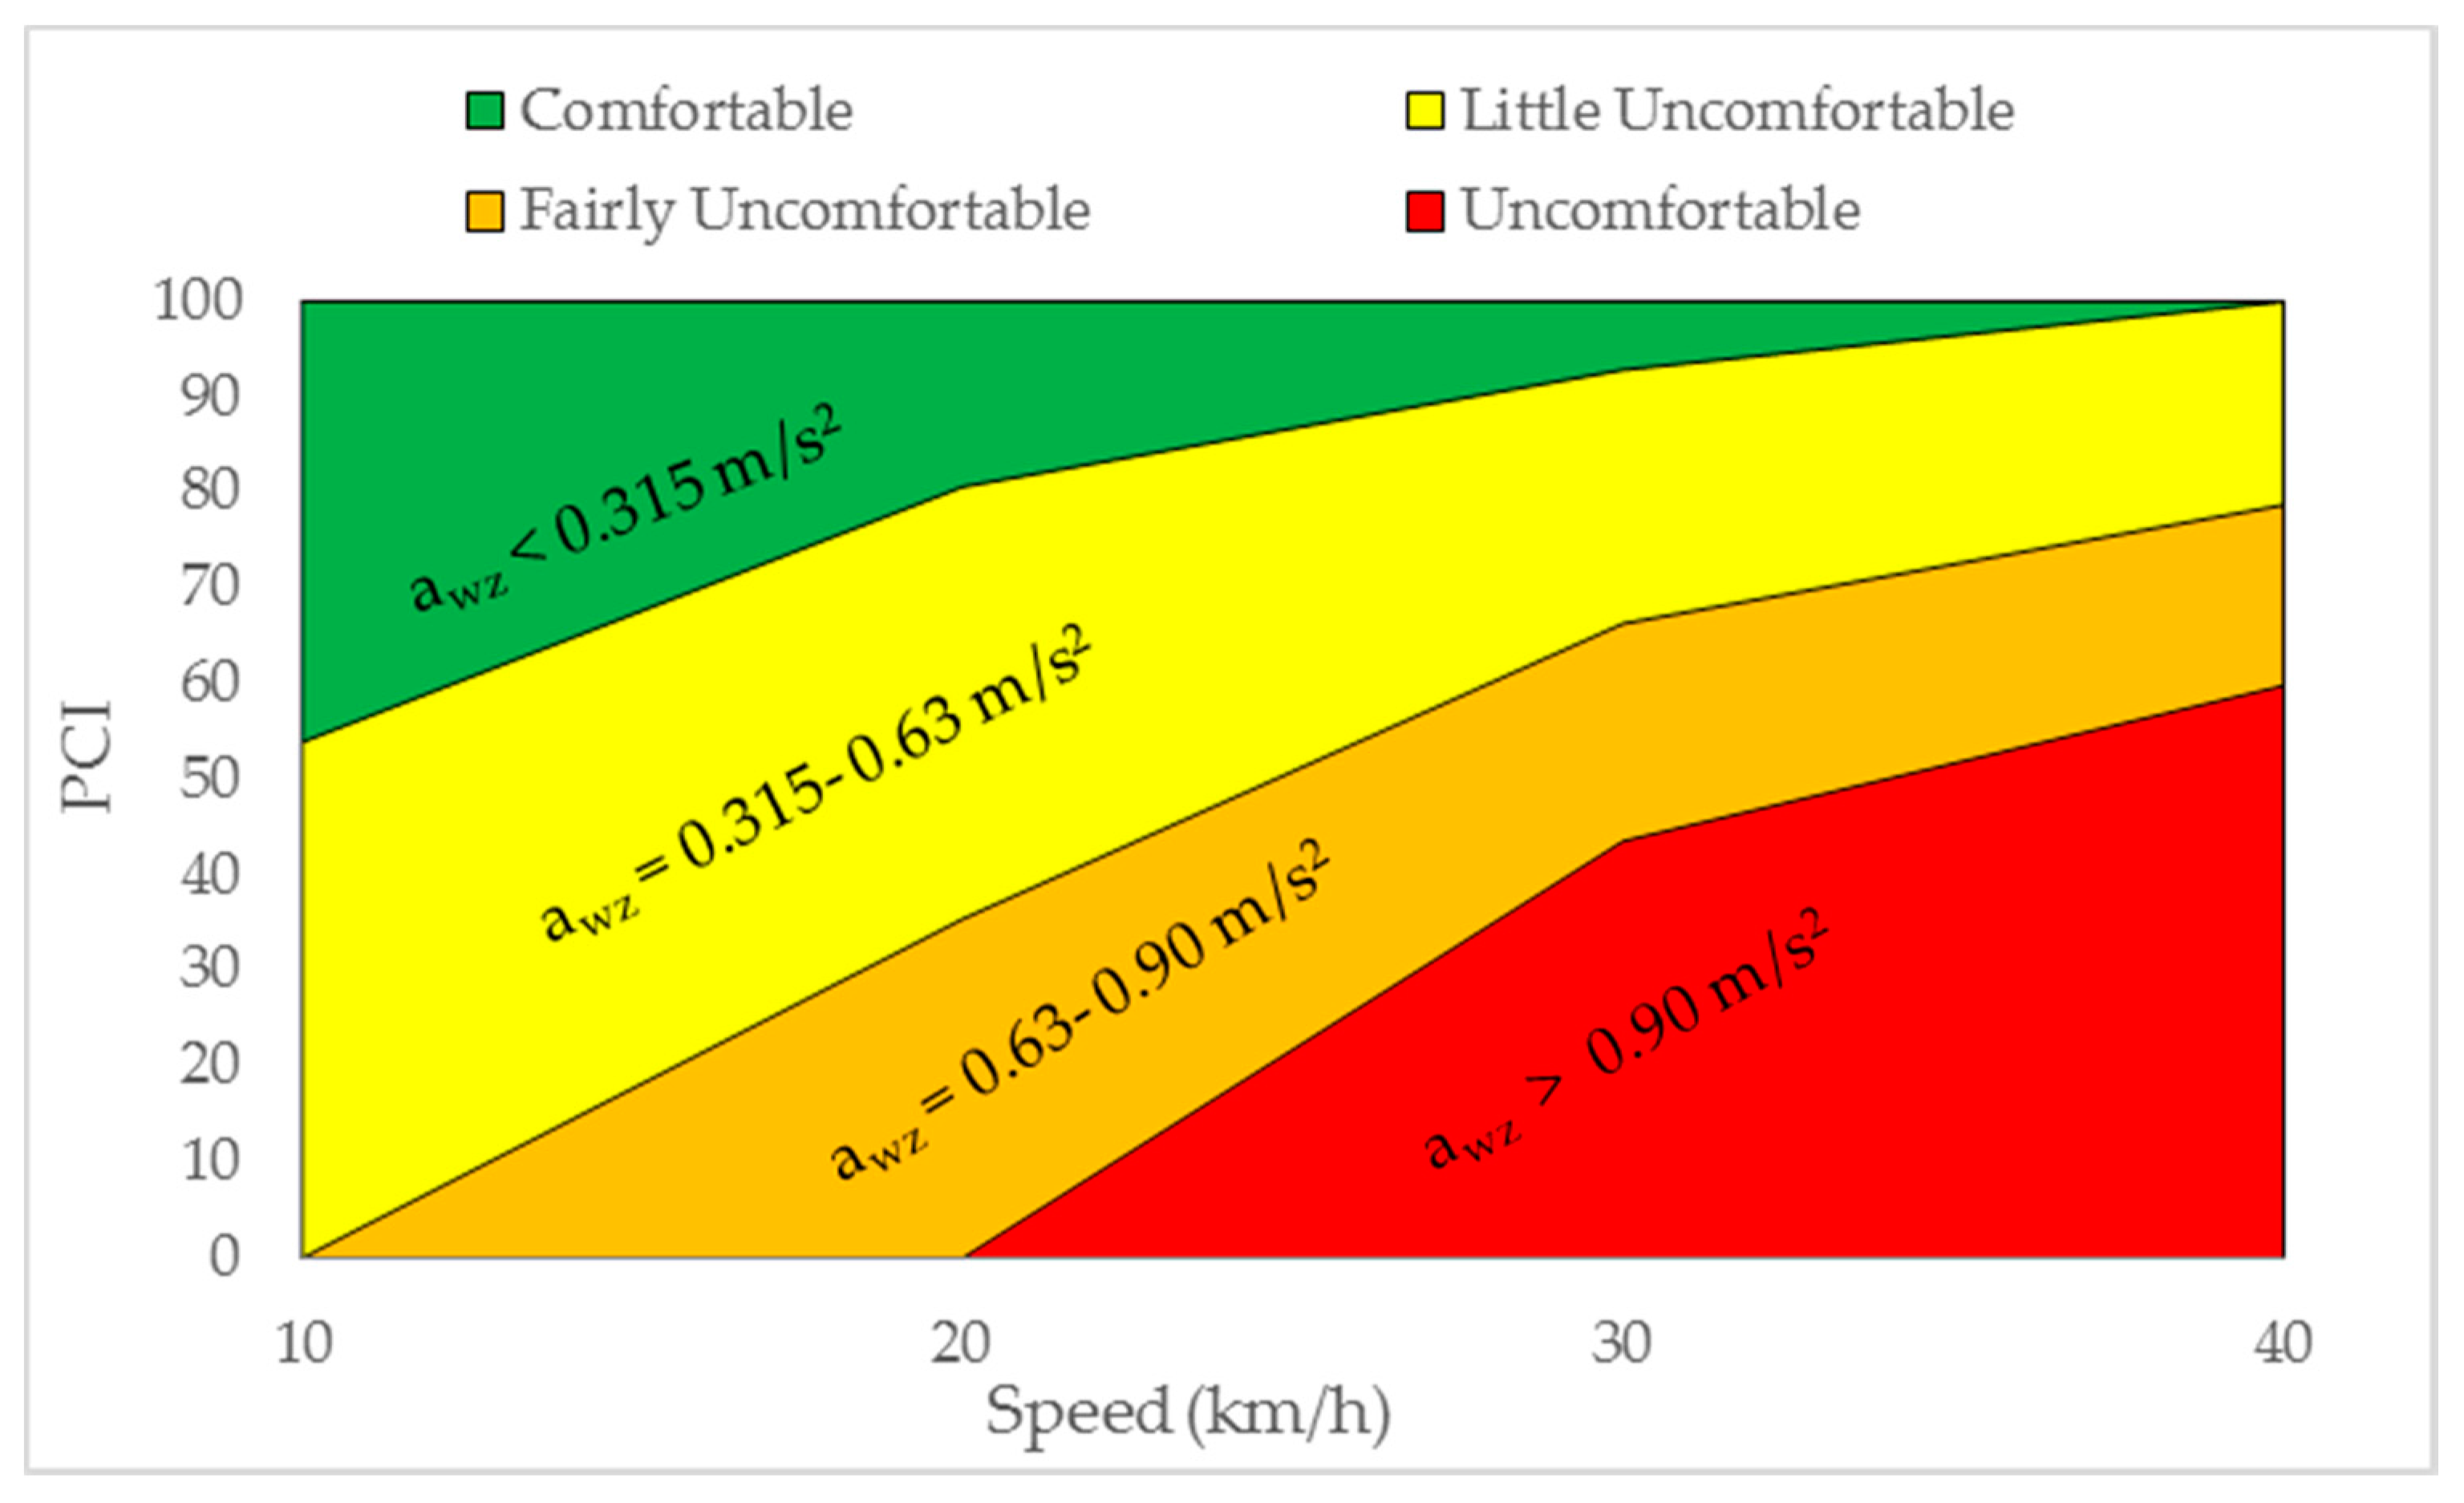
Using the correlations previously found, for example, it is possible to determine IRI and PCI limits, respectively, depicted in Figure 13 and Figure 14.
As already stated, weak correlations were found between the two aforementioned indices and awz. For this reason, it would be necessary to increase the sample size to better investigate these correlations, eventually improving them.
4. Conclusions
In this paper, several road pavement evaluation methods were applied to 14 sections of historical Sampietrini pavements: PCI, IRI, and awz. In particular, starting from the PCI method established for block pavements, specific severity threshold values for all possible distress types characterizing Sampietrini pavements were proposed.
A good correlation factor (R2 = 0.82) was found between PCI and IRI values calculated for the aforementioned sections. In addition, considering that PCI values greater than 85 correspond to pavements in excellent conditions, it was confirmed that new or reconstructed Sampietrini pavements are characterized by not negligible roughness level (IRI = 6–8 m/km). In fact, they cannot be used for high-speed roads (>50 km/h).
For a Sampietrini pavement in good condition (PCI = 88–92, good), the values of awz calculated at velocities within the range from 10 to 50 km/h showed that, for speed equal to 40 and 50 km/h, ride quality might be little or fairly uncomfortable. When the pavement conditions get worse (PCI = 46–54, poor), ride comfort also decreases, arriving at a very uncomfortable level at 50 km/h.
Although weak correlations were found between PCI-awz and IRI-awz, to develop an appropriate Sampietrini management system based on the ride quality perceived by road users, speed related PCI and IRI thresholds are also proposed.
In this sense, wider and extensive in situ measurements should be performed to improve the accuracy and the efficiency of the proposed approach for the surface conditions assessment of Sampietrini pavements.
Acknowledgments
All sources of funding of the study should be disclosed. Please clearly indicate grants that you have received in support of your research work. Clearly state if you received funds for covering the costs to publish in open access.
Author Contributions
Giuseppe Loprencipe had the original idea. Andrea Galoni performed the pavement inspection data of Sampietrini pavements in Rome. Giuseppe Loprencipe and Pablo Zoccali carried out the data and results analyses of the work. Pablo Zoccali wrote the manuscript and was in charge of the overall outline and editing of the manuscript. Andrea Galoni was involved in the revision and completion of the work. Giuseppe Loprencipe contributed to the outline as well as to the revision, completion, and editing of the manuscript.
Conflicts of Interest
The authors declare no conflict of interest.
Abbreviations
The following abbreviations are used in this manuscript:
| awz | Frequency-weighted vertical acceleration |
| ASTM | American Society of Texting and Materials |
| CDV | Corrected Deduct Value |
| DV | Deduct Value |
| IRI | International Roughness Index |
| ISO | International Organization for Standardization |
| PCI | Pavement Condition Index |
| PMS | Pavement Management System |
| PSD | Power Spectral Density |
| RMS | Root Mean Square |
Appendix A. Distress Identification Catalogue for Sampietrini Pavements
This appendix includes a list of the distresses defined in the proposed distress Identification Catalogue for Sampietrini pavements. Besides, it includes guidelines for distress identification and security level assessment and provides recommendations to conduct the pavement survey.
The Deduct Curves for each distress and the Total Deduct Value/Corrected Deduct Value diagram used in the PCI calculus are the same as reported in Interlocking Concrete Pavement Distress Manual [18] and, for this reason, they are not reported in this paper.
In this study, new definitions of the severity levels (low, medium and high) were proposed for Sampietrini pavement; these new definitions for each distress type are reported in the following sections.
Appendix A.1. Damaged Sampietrini
Damaged Sampietrini describes the condition of the paver blocks. Block damage would include paver distresses such as a chip, crack, or spalls. This kind of distress would be indicative of load related damage, such as inadequate support causing shear breakage, etc.
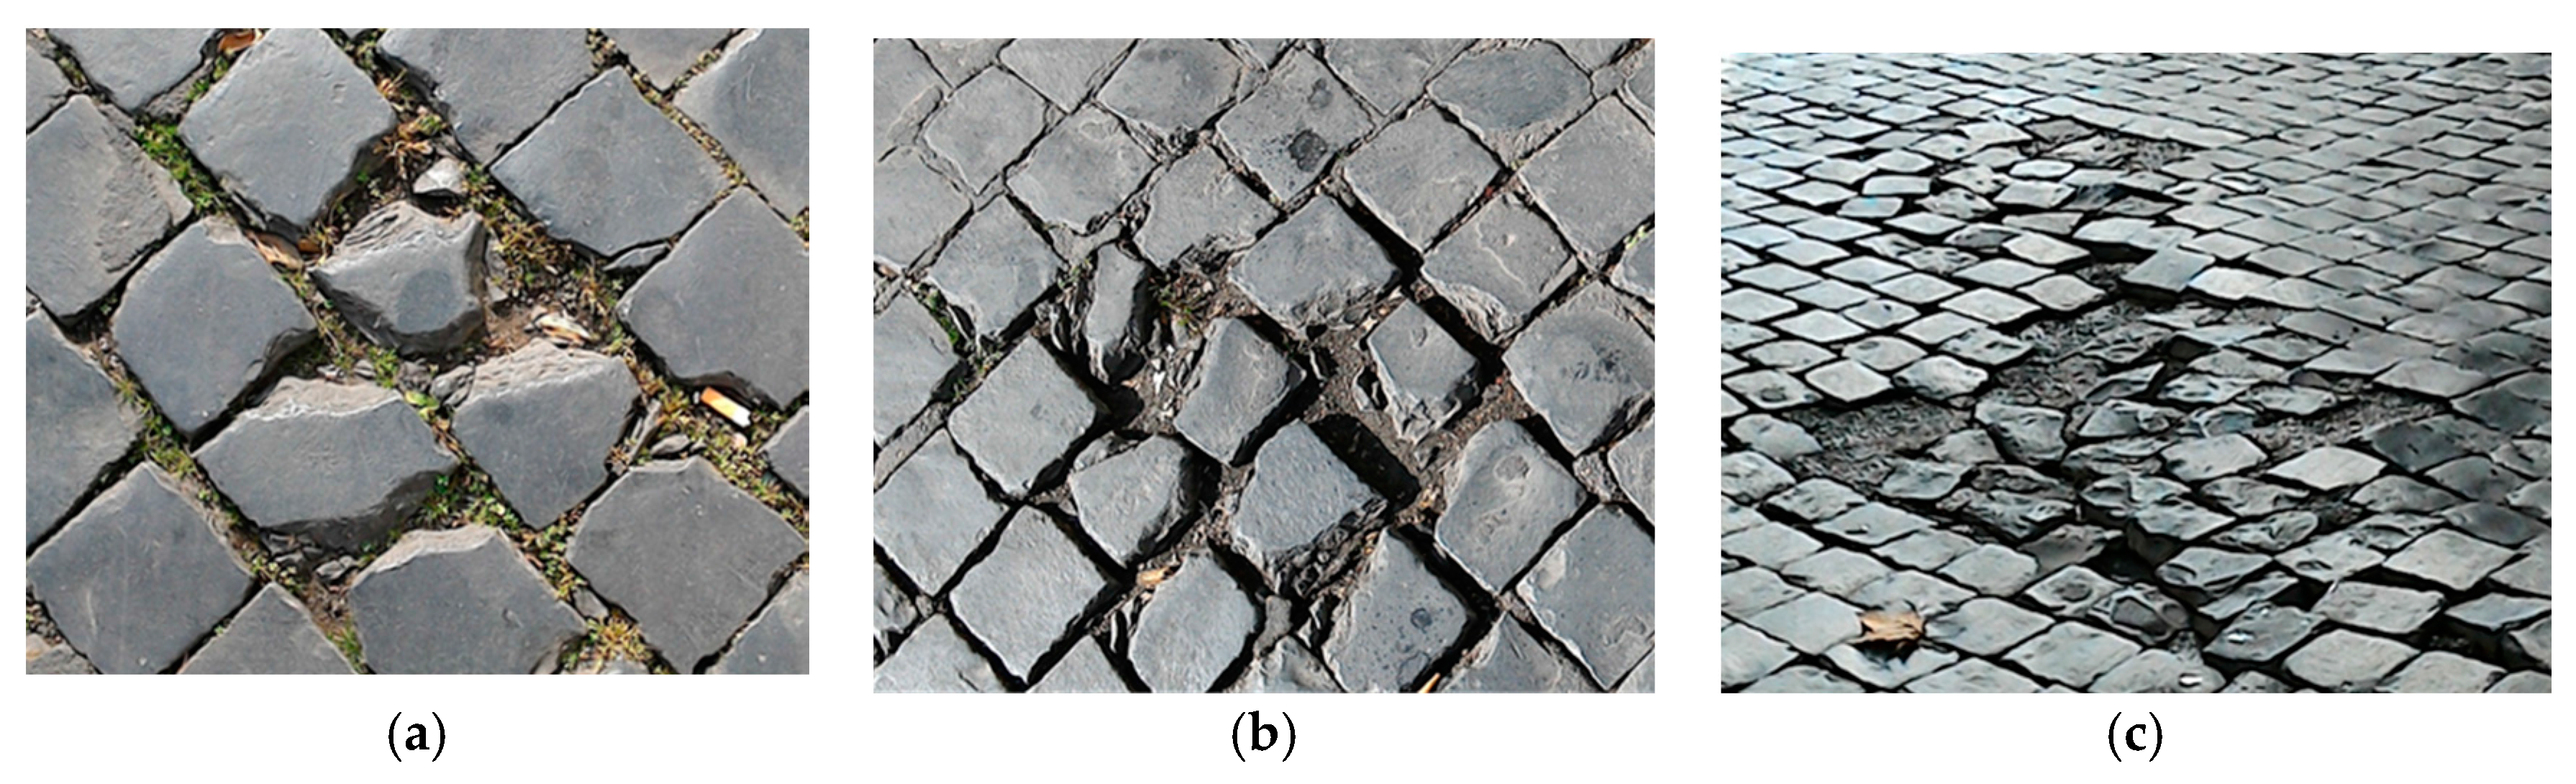
Damaged pavers are measured in square meters of surface area. Random individual cracked pavers are not counted. The severity is evaluated by level of distress (Figure A1), according to indications reported in Table A1.
Figure A1.
Damaged Sampietrini severity: (a) low; (b) medium; (c) high.

Table A1.
Severity level of damaged Sampietrini distress.
| Severity Level | Item |
|---|---|
| Low | Individual cracks, separations or alterations |
| Medium | Advanced cracking, separations or alterations |
| High | Blocks are in multiple pieces or are disintegrated |
Appendix A.2. Depressions
Depressions are areas of the pavement surface that present lower elevations than the surrounding areas. Depressions are caused by settlement of the underlying subgrade or granular base. The settlement is common over utility cuts and adjacent to road hardware. Depressions can cause roughness in the pavement, and, when filled with water, can cause hydroplaning of vehicles. Depressions are measured in square meters of surface area and the maximum depth of depression defines the severity (Figure A2), according to the values reported in Table A2.
Figure A2.
Depressions severity: (a) low; (b) medium; (c) high.

Table A2.
Severity level of depressions.
| Severity Level | Maximum Depth of Depression |
|---|---|
| Low | 15–30 mm |
| Medium | 30–50 mm |
| High | >50 mm |
Appendix A.3. Edge Restraint
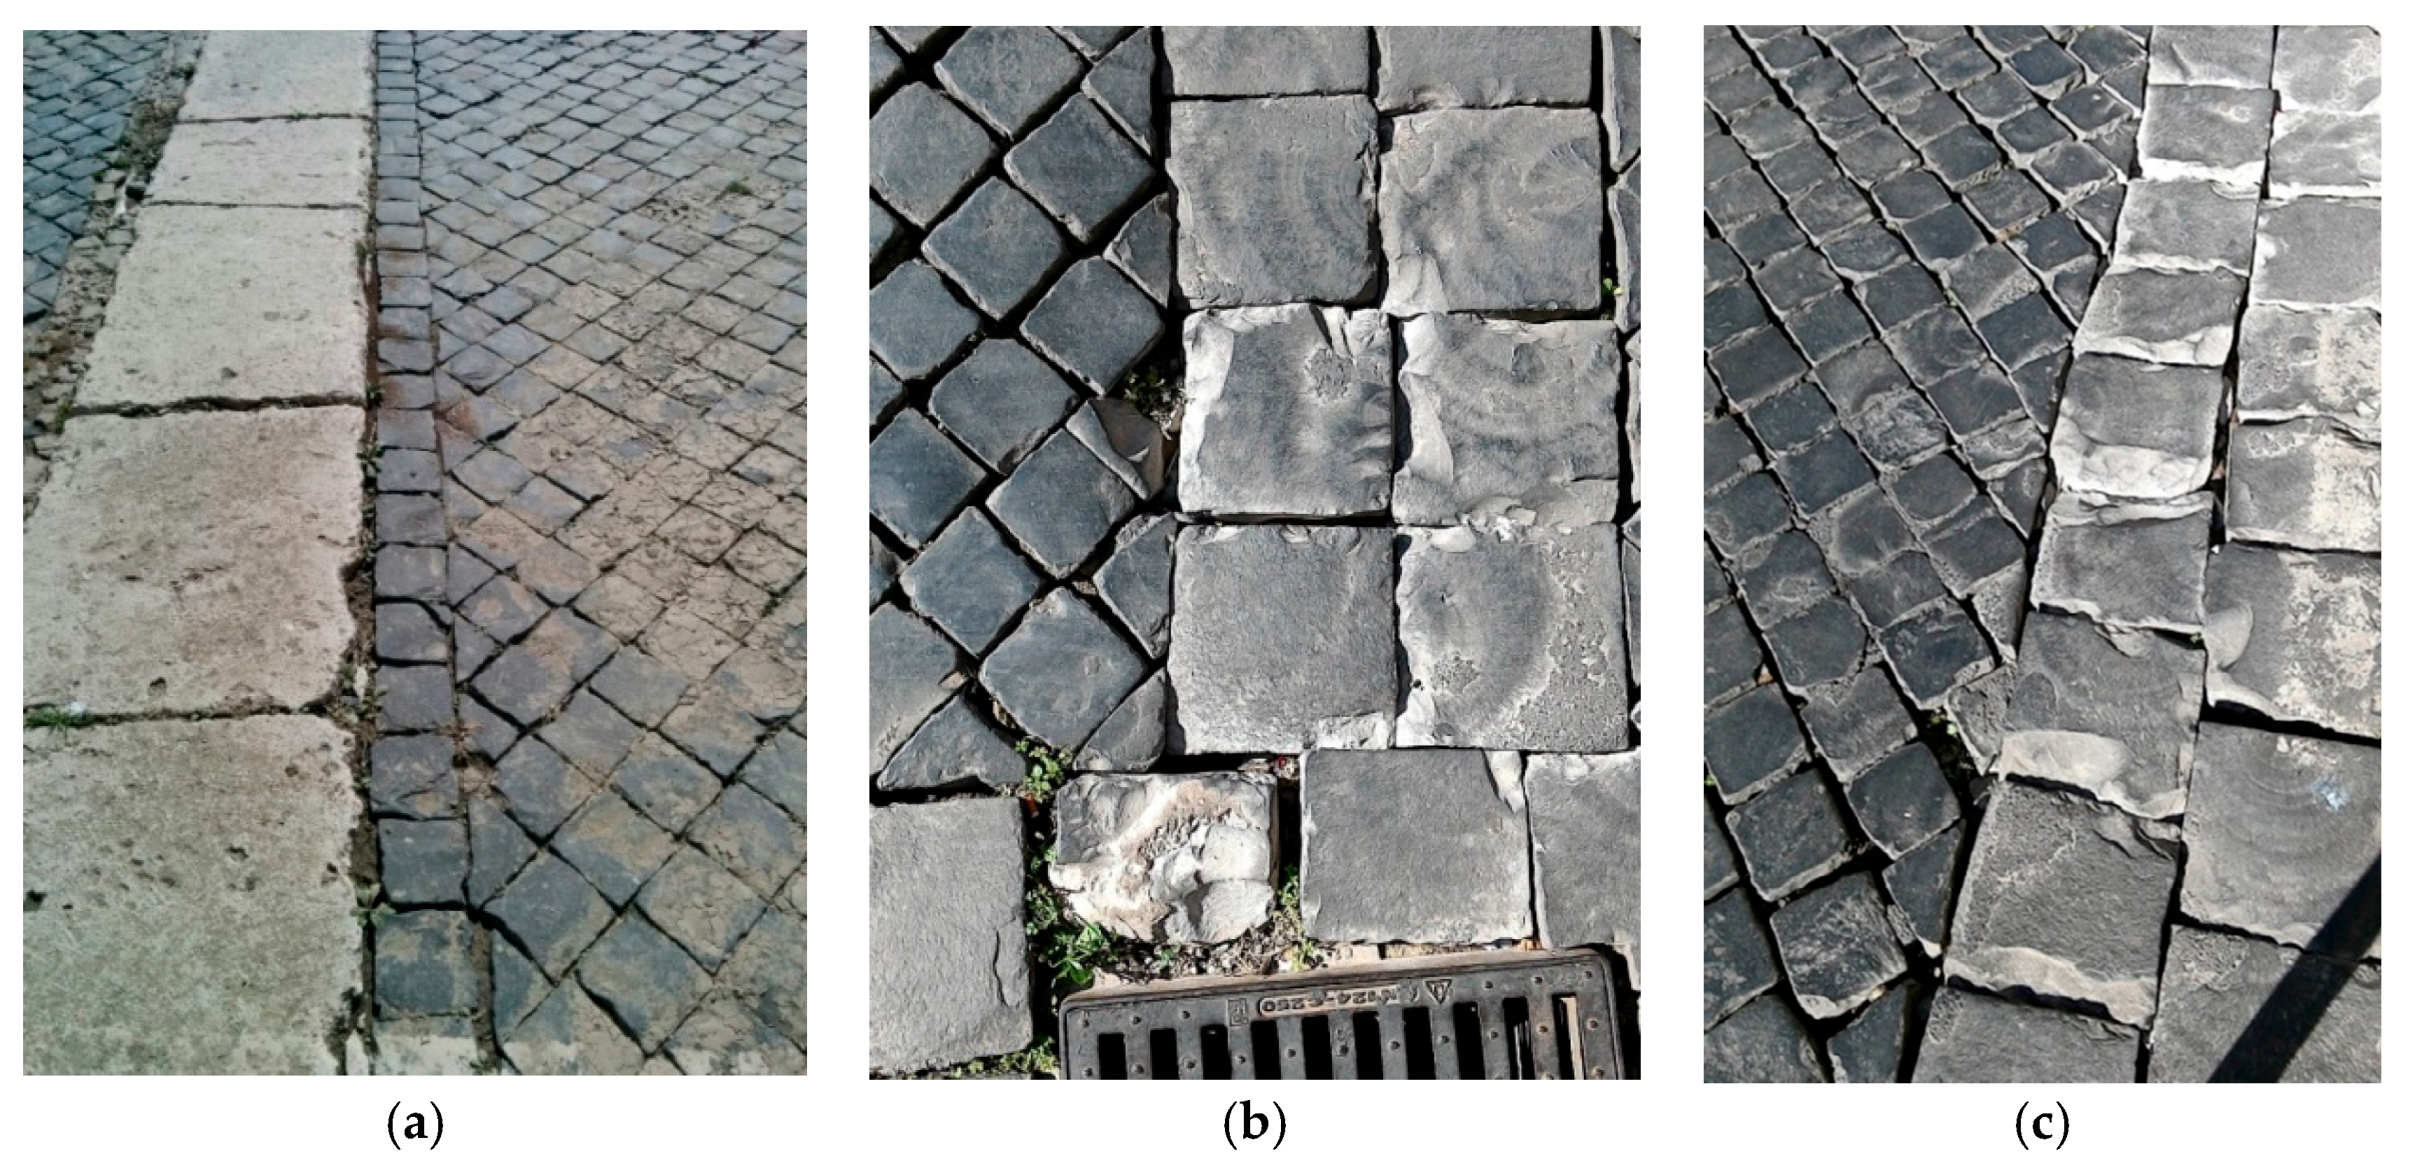
Edge strips and curbing are forms of restraints that provide lateral support for paver pavements. Lateral restraint is considered essential to resist lateral movement, minimize loss of joint and bedding sand, and prevent block rotation. Edge strips/curbs can comprise prefabricated angle supports, concrete curbs, etc. This distress is accelerated by traffic loading. Loss of edge restraint is measured in linear meters of pavement edge (measure the movement of the edge restraint). The corresponding level of severity (Figure A3) is defined according to Table A3.
Figure A3.
Edge restraint severity: (a) low; (b) medium; (c) high.

Table A3.
Severity level of edge restraint.
| Severity Level | Description |
|---|---|
| Low | Evidence of increased joint width; (11–15 mm) to no evidence of paver/curb rotation |
| Medium | Increased joint width (16–30 mm), with evidence of paver/curb rotation |
| High | Increased joint width (>30 mm), with noticeable of paver/curb rotation and local settlement |
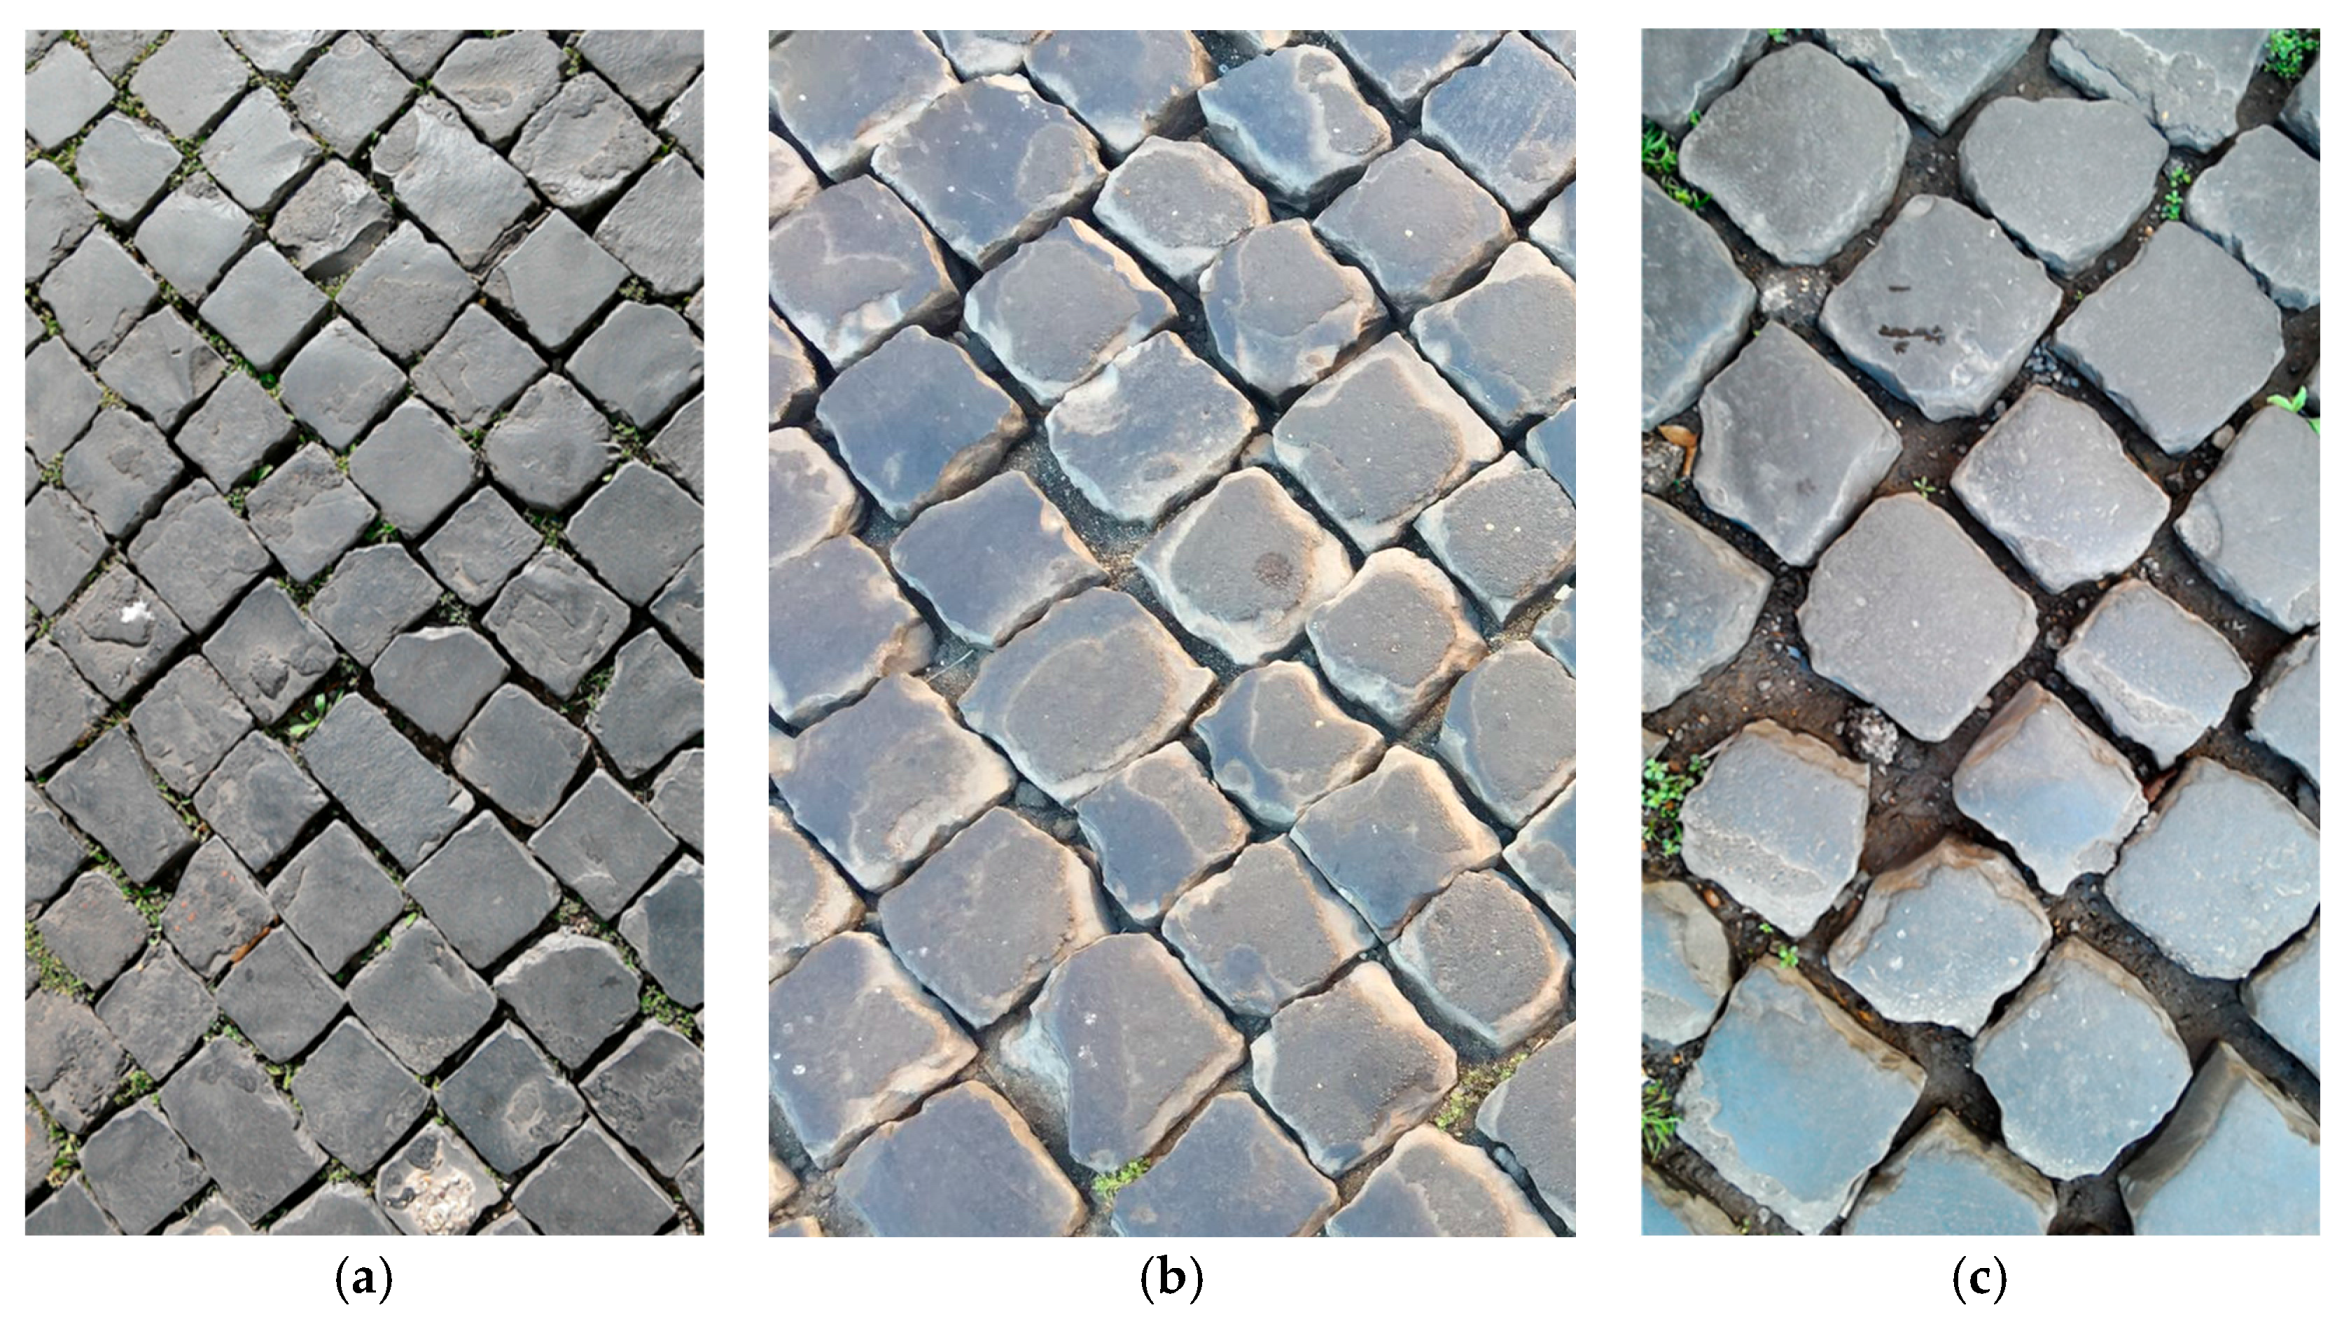
Appendix A.4. Excessive Joint Width
Excessive joint width is a surface distress feature in which the joints between blocks have widened. Excessive joint width can occur from a number of factors, including poor initial construction, lack of joint sand, poor edge restraint, adjacent settlement/heave, etc. As joints get wider, the block layer becomes less stiff and can lead to overstressing the substructure layers. Excessive joint width is measured in square meters of surface area and the average joint widening defines the severity (Figure A4), according to the reference values reported in Table A4.
Figure A4.
Excessive joint width severity: (a) low; (b) medium; (c) high.

Table A4.
Severity level of excessive joint width.
| Severity Level | Average Joint Width |
|---|---|
| Low | 11–15 mm |
| Medium | 16–45 mm |
| High | >45 mm |
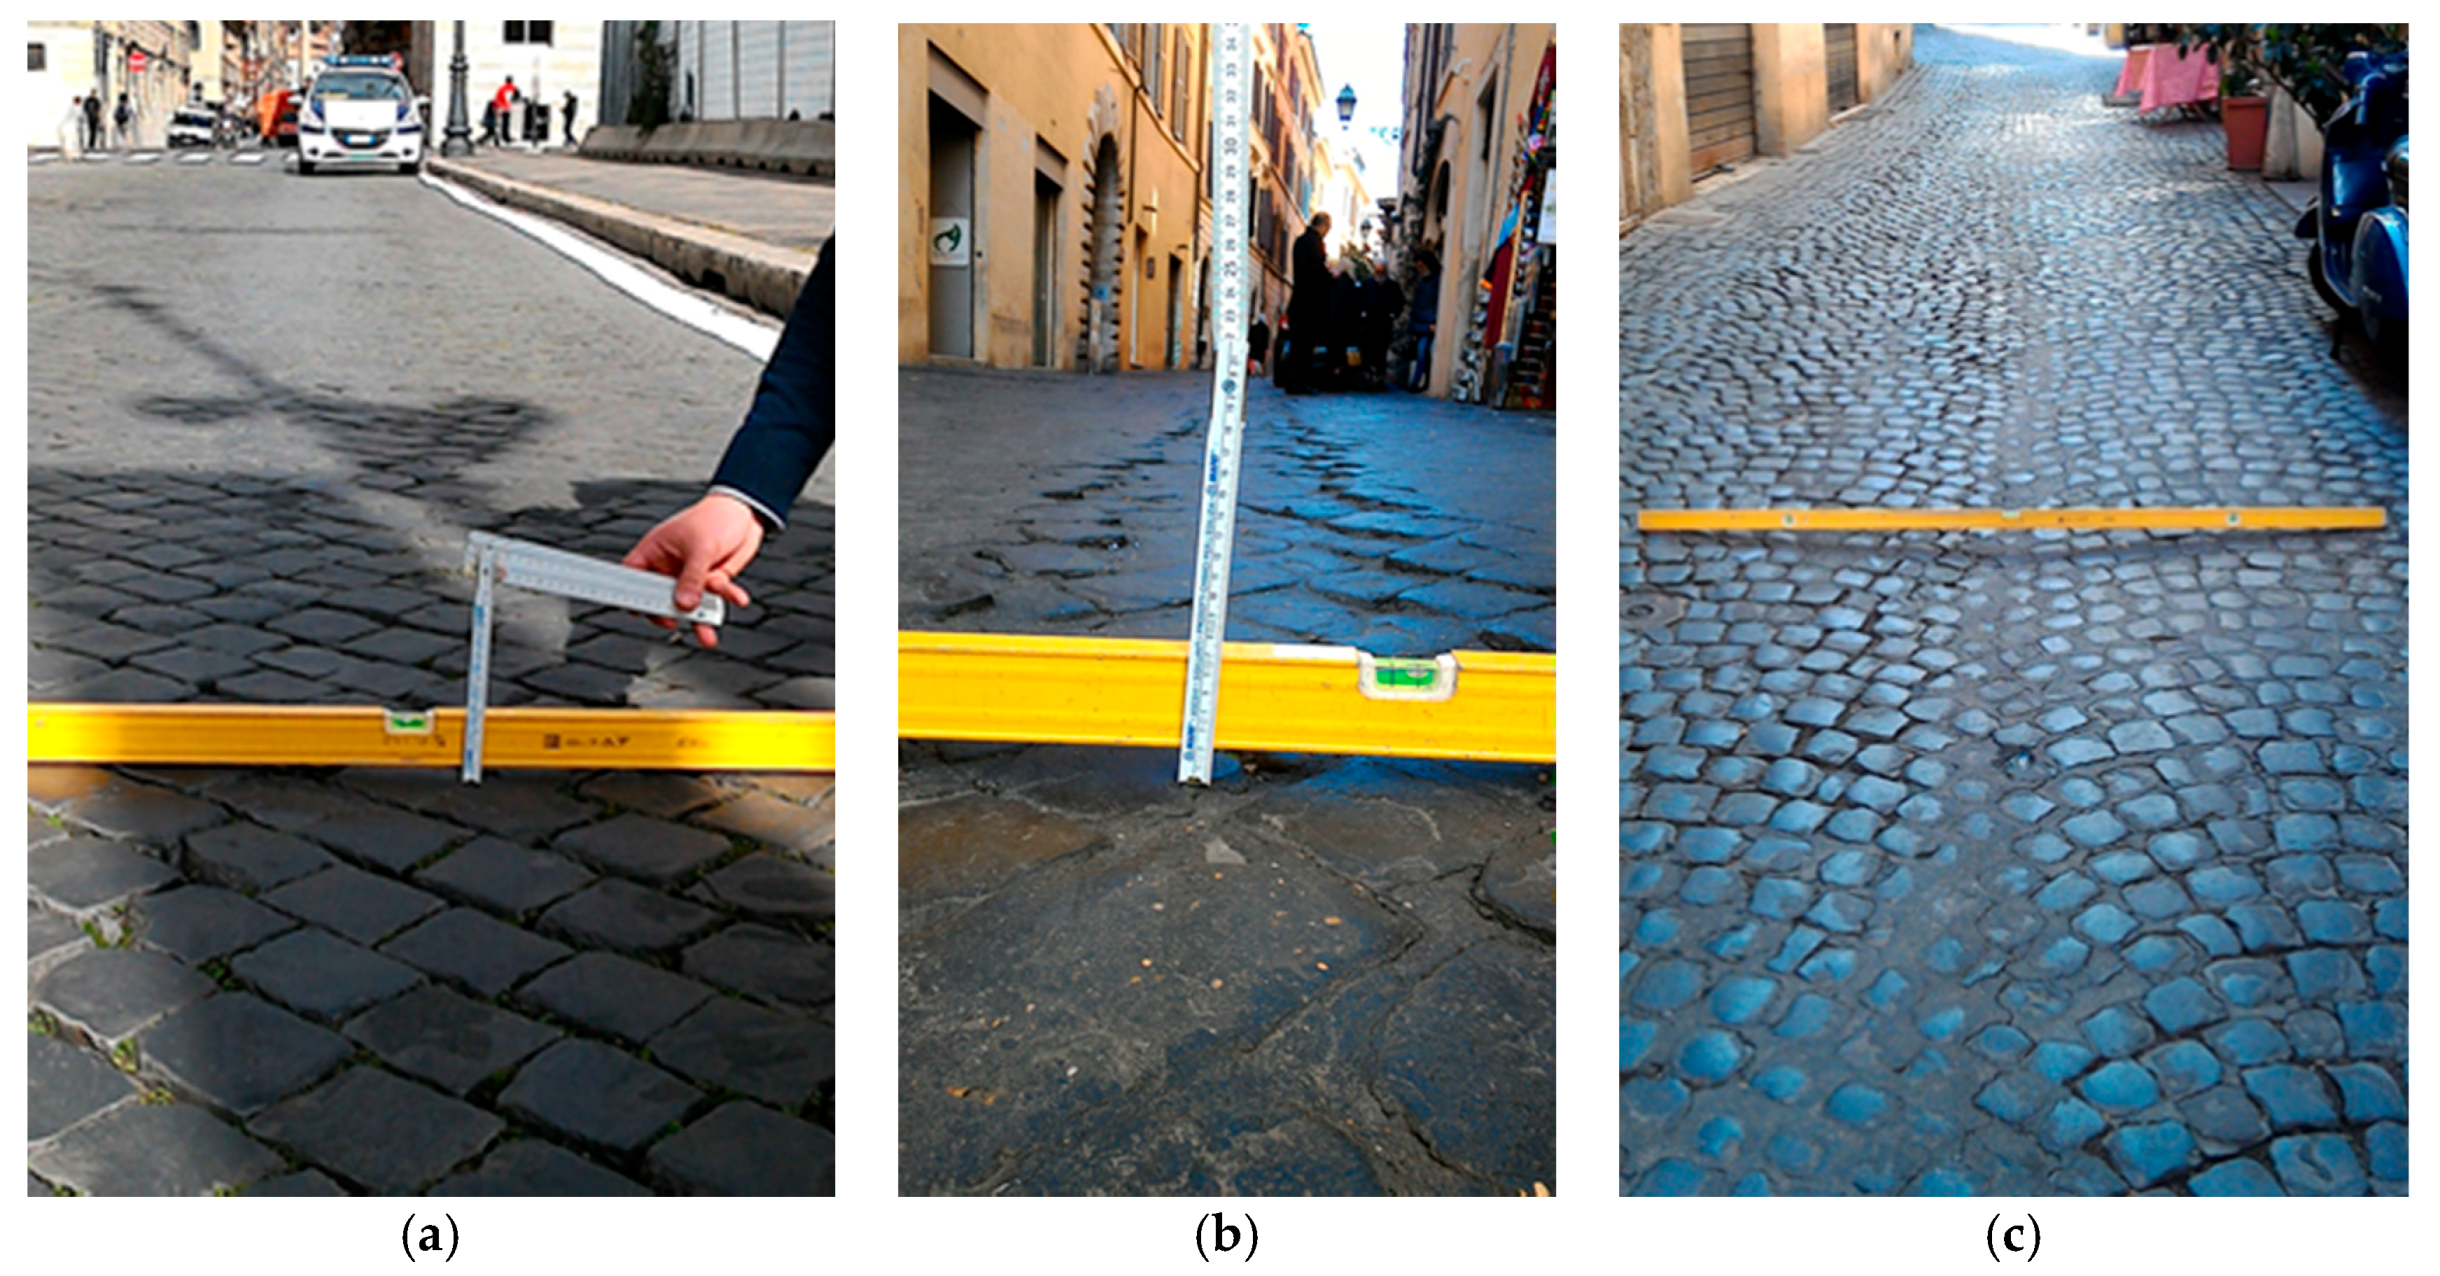
Appendix A.5. Faulting
Faulting are areas of the pavement surface where the elevation of adjacent blocks differ or have rotated. Faulting can be caused by surficial settlement of the bedding sand, poor installation, pumping of the joint or bedding sand. Local roughness can reduce the ride quality. Faulting can pose a safety hazard for pedestrians. Faulting can be corrected by resetting the blocks. Faulting is measured in square meters of surface area. The maximum elevation difference defines the severity (Figure A5), based on threshold values reported in Table A5.
Figure A5.
Faulting severity: (a) low; (b) medium; (c) high.
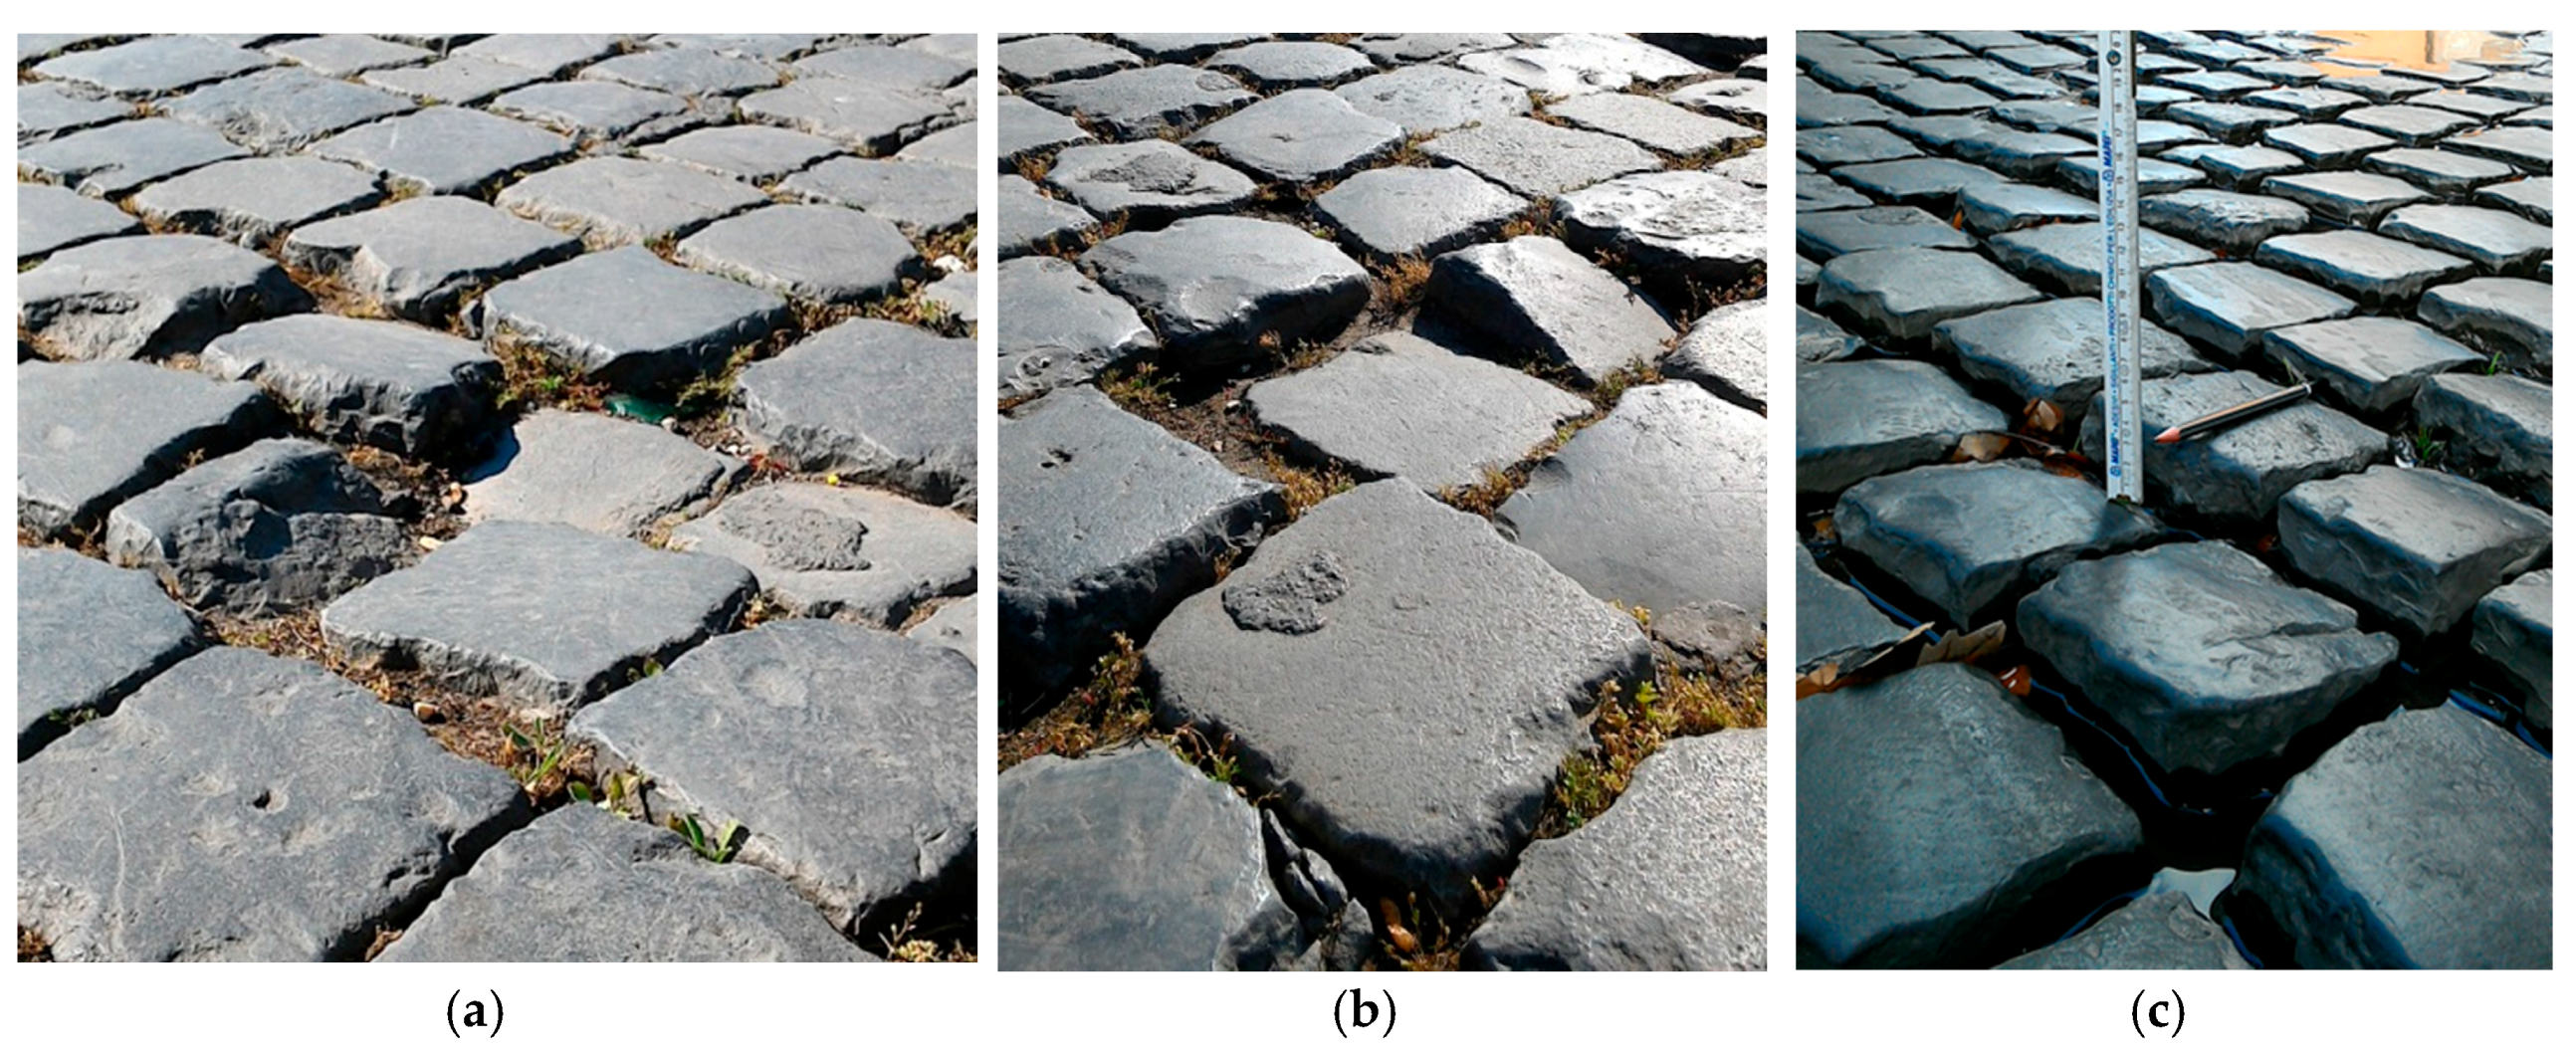
Table A5.
Severity level of faulting.
| Severity Level | Elevation Difference |
|---|---|
| Low | 6–10 mm |
| Medium | 11–20 mm |
| High | >20 mm |
Appendix A.6. Heave
Heaves are areas of the pavement surface that have elevations that are higher than the surrounding areas. Heaves are typically caused by differential frost heave of the underlying soils. Heaves can also occur as a result of subgrade instability and can also occur in conjunction with settlement/rutting. The most frequent cause of heave is a consequence of the presence of manhole covers on the pavement. Heaves are measured in square meters of surface area. The maximum height of heave defines the severity (Figure A6) according to the limits in Table A6.
Figure A6.
Heave severity: (a) low; (b) medium; (c) high.
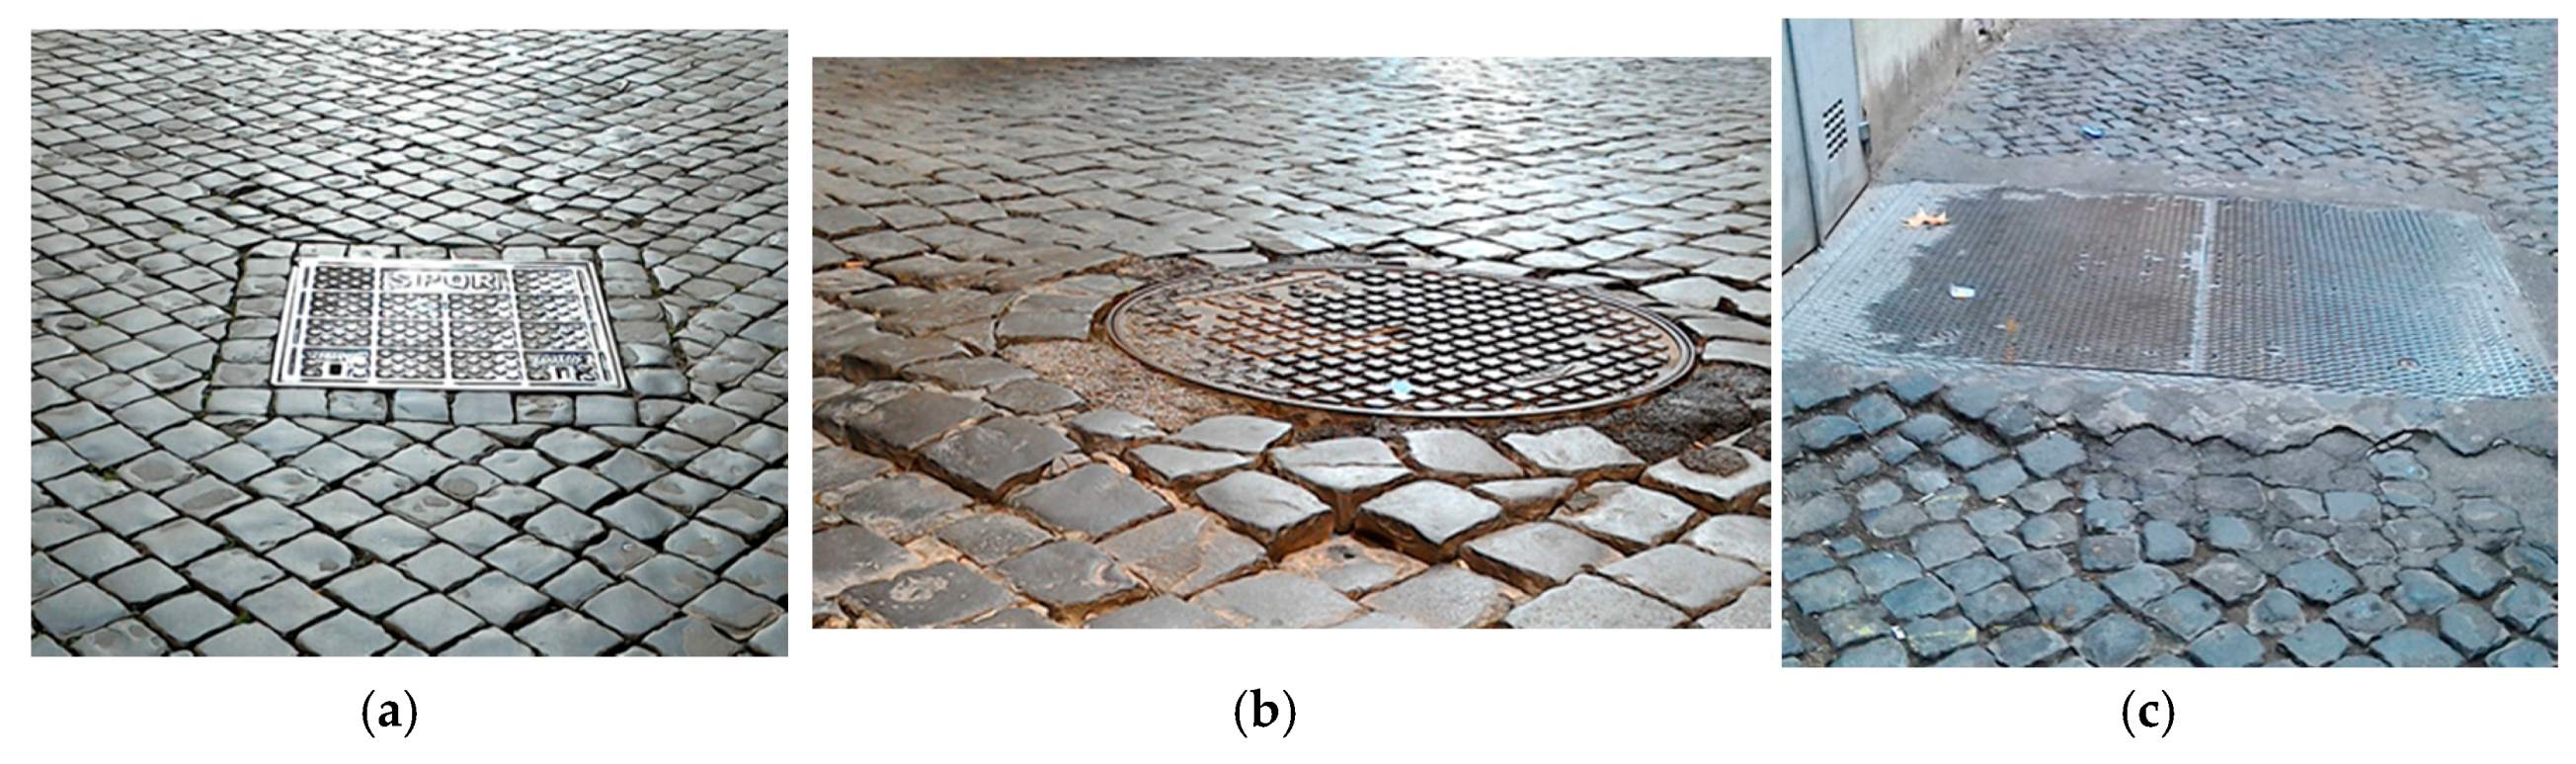
Table A6.
Severity level of heave.
| Severity Level | Maximum Height of Heave |
|---|---|
| Low | 15–30 mm |
| Medium | 31–50 mm |
| High | >50 mm |
Appendix A.7. Joint Sand Loss/Pumping
Joint sand loss/pumping is a distress feature in which the joint has been removed. Joint sand loss can occur from a number of factors, including heavy rain, sweeping, pressure washing, pumping under traffic loading, etc. Joint sand is considered essential to provide interlock and stiffness of the paver course. The corresponding severity is defined by what reported in Table A7. Some examples of this kind of distress are depicted in Figure A7.
Figure A7.
Joint Sand Loss/Pumping severity: (a) low; (b) medium; (c) high.
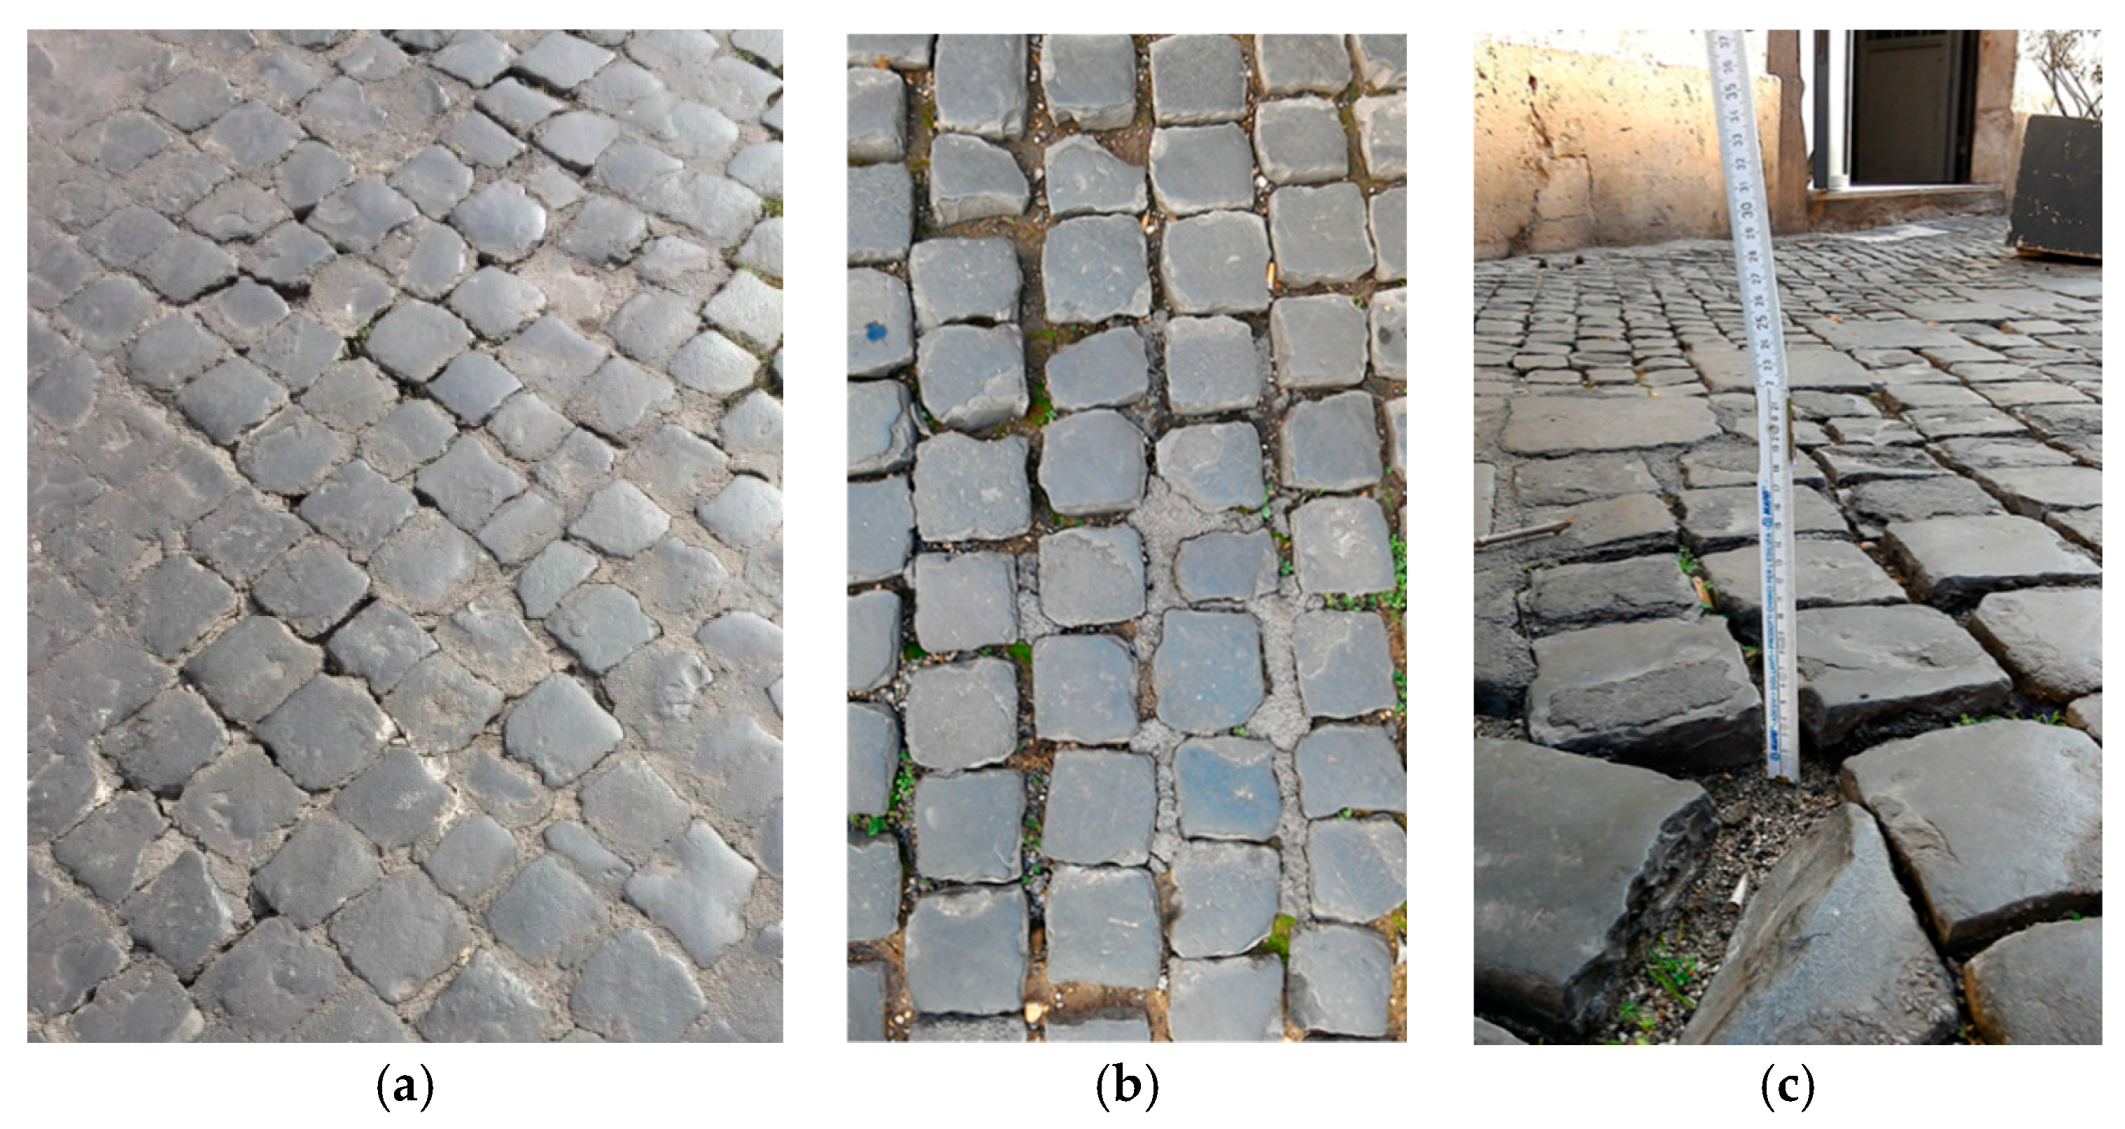
Table A7.
Severity level of Joint Sand Loss/Pumping.
| Severity Level | Depth of Sand Loss |
|---|---|
| Low | 10–25 mm |
| Medium | 26–45 mm |
| High | >45 mm |
Appendix A.8. Missing Sampietrini
Missing Sampietrini, as the name implies, refers to sections of pavement that are missing Sampietrini, which may have resulted from removal or disintegration/damage. Missing Sampietrini can compromise the integrity of the pavement structure and promote surface roughness similar to potholes in flexible pavements. Missing of Sampietrini is measured in square meters of surface area. The severity is evaluated by level of distress (Figure A8), according to indications in Table A8. Random individual paver damage would not be counted.
Figure A8.
Missing Sampietrini severity: (a) low; (b) medium; (c) high.
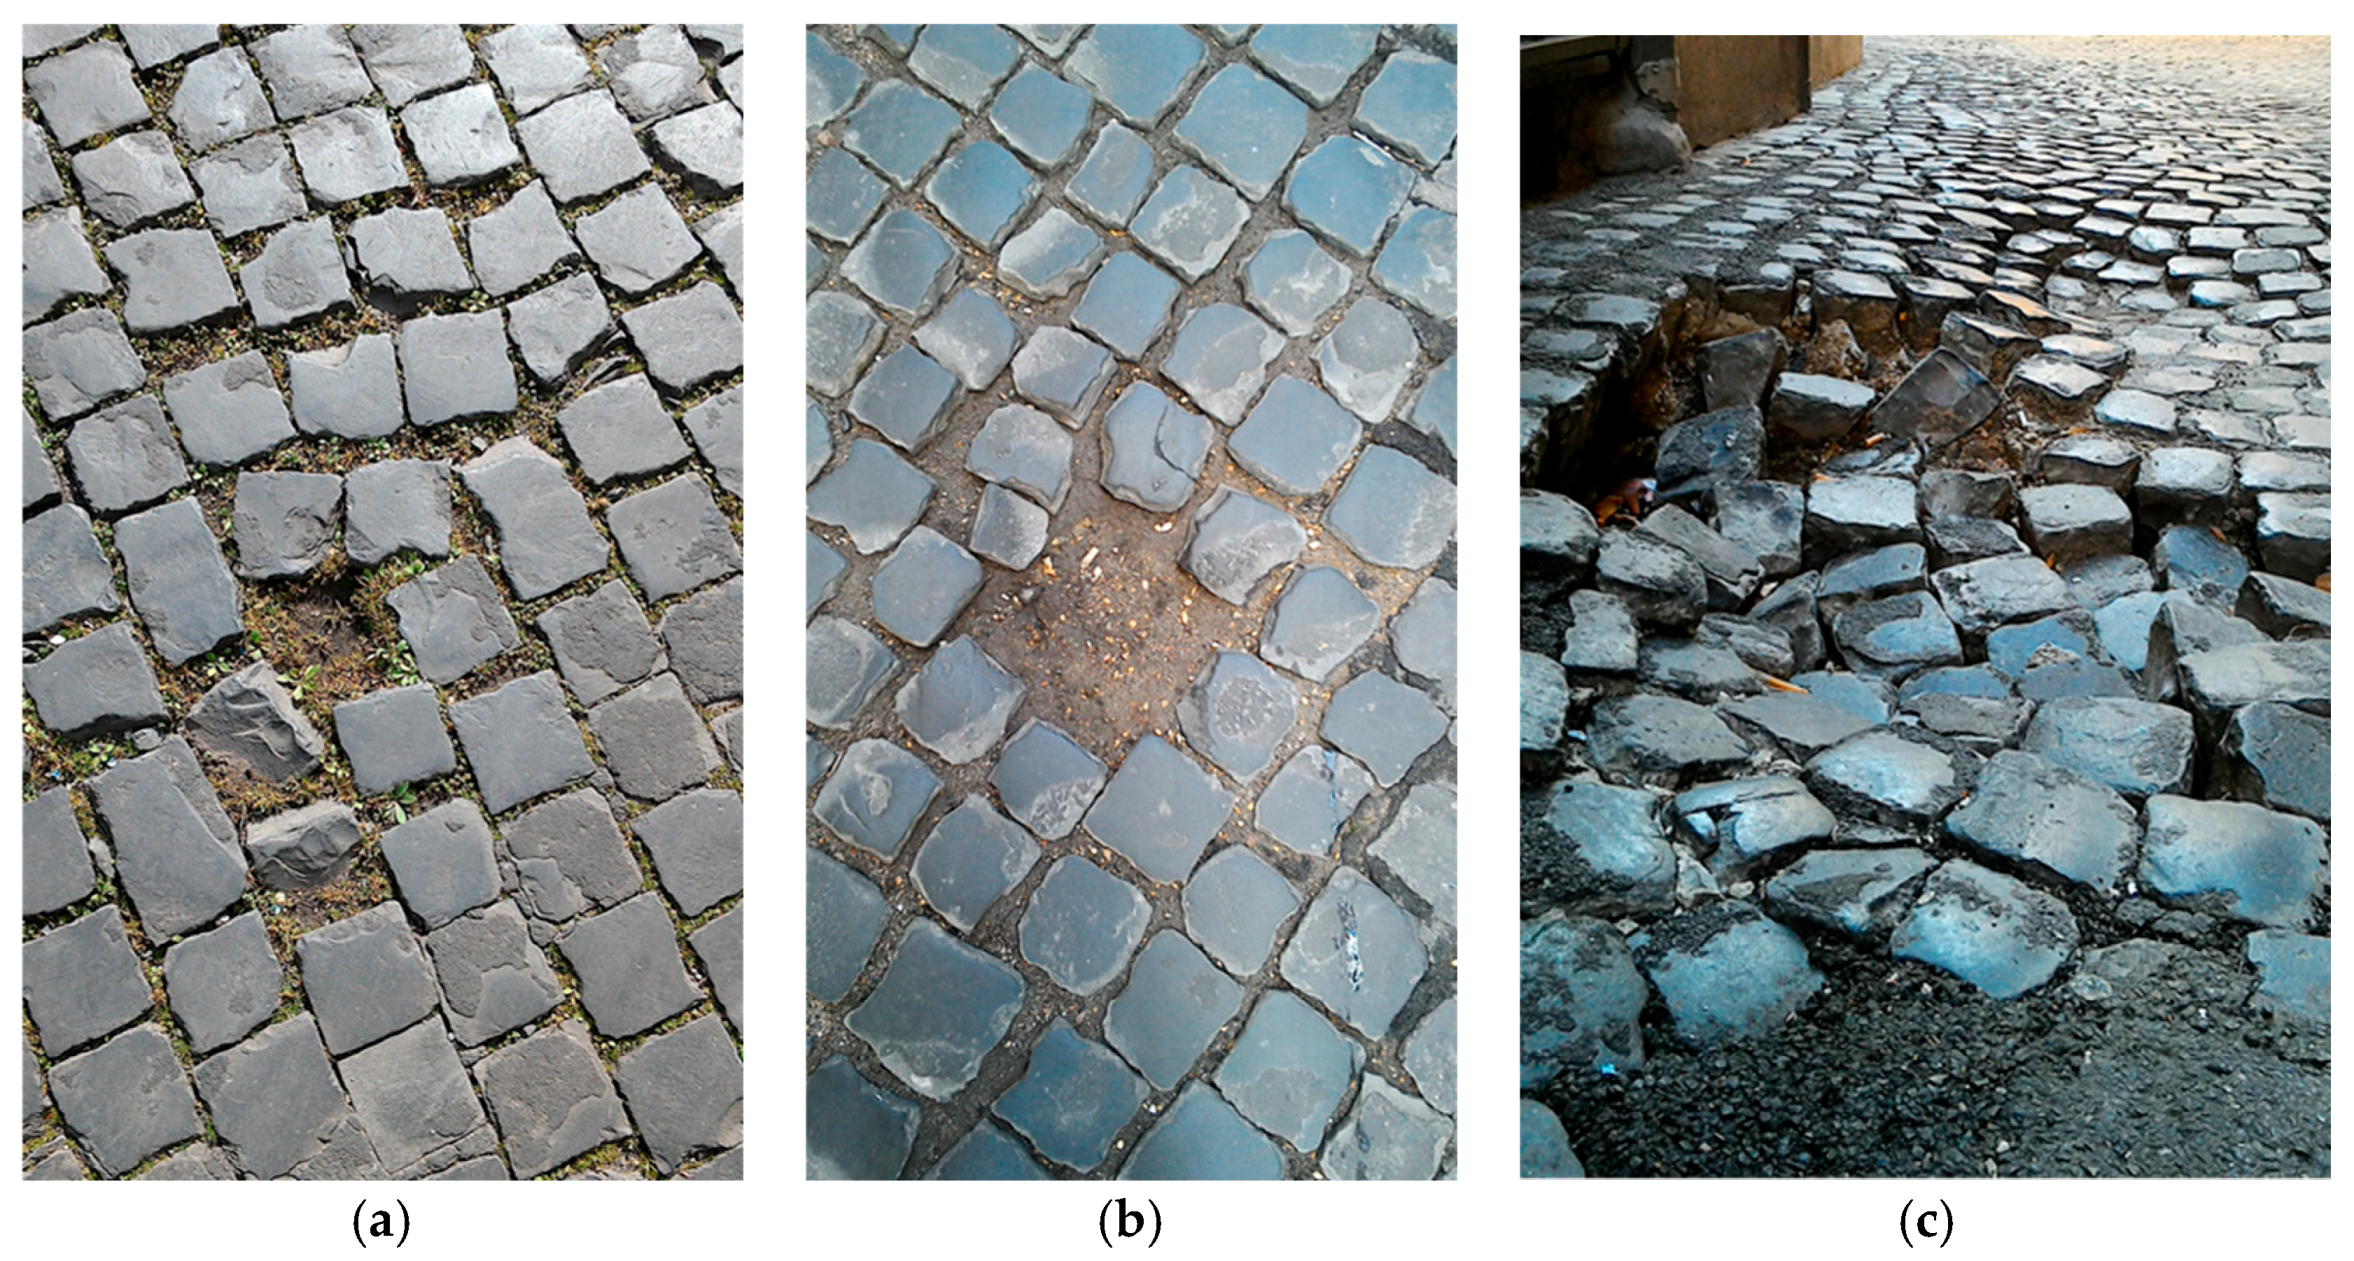
Table A8.
Severity level of missing Sampietrini.
| Severity Level | Description |
|---|---|
| Low | Random individual missing Sampietrini |
| Medium | Missing 2 or more Sampietrini in one area and ride quality unaffected |
| High | Missing 2 or more Sampietrini in one area and ride quality affected |
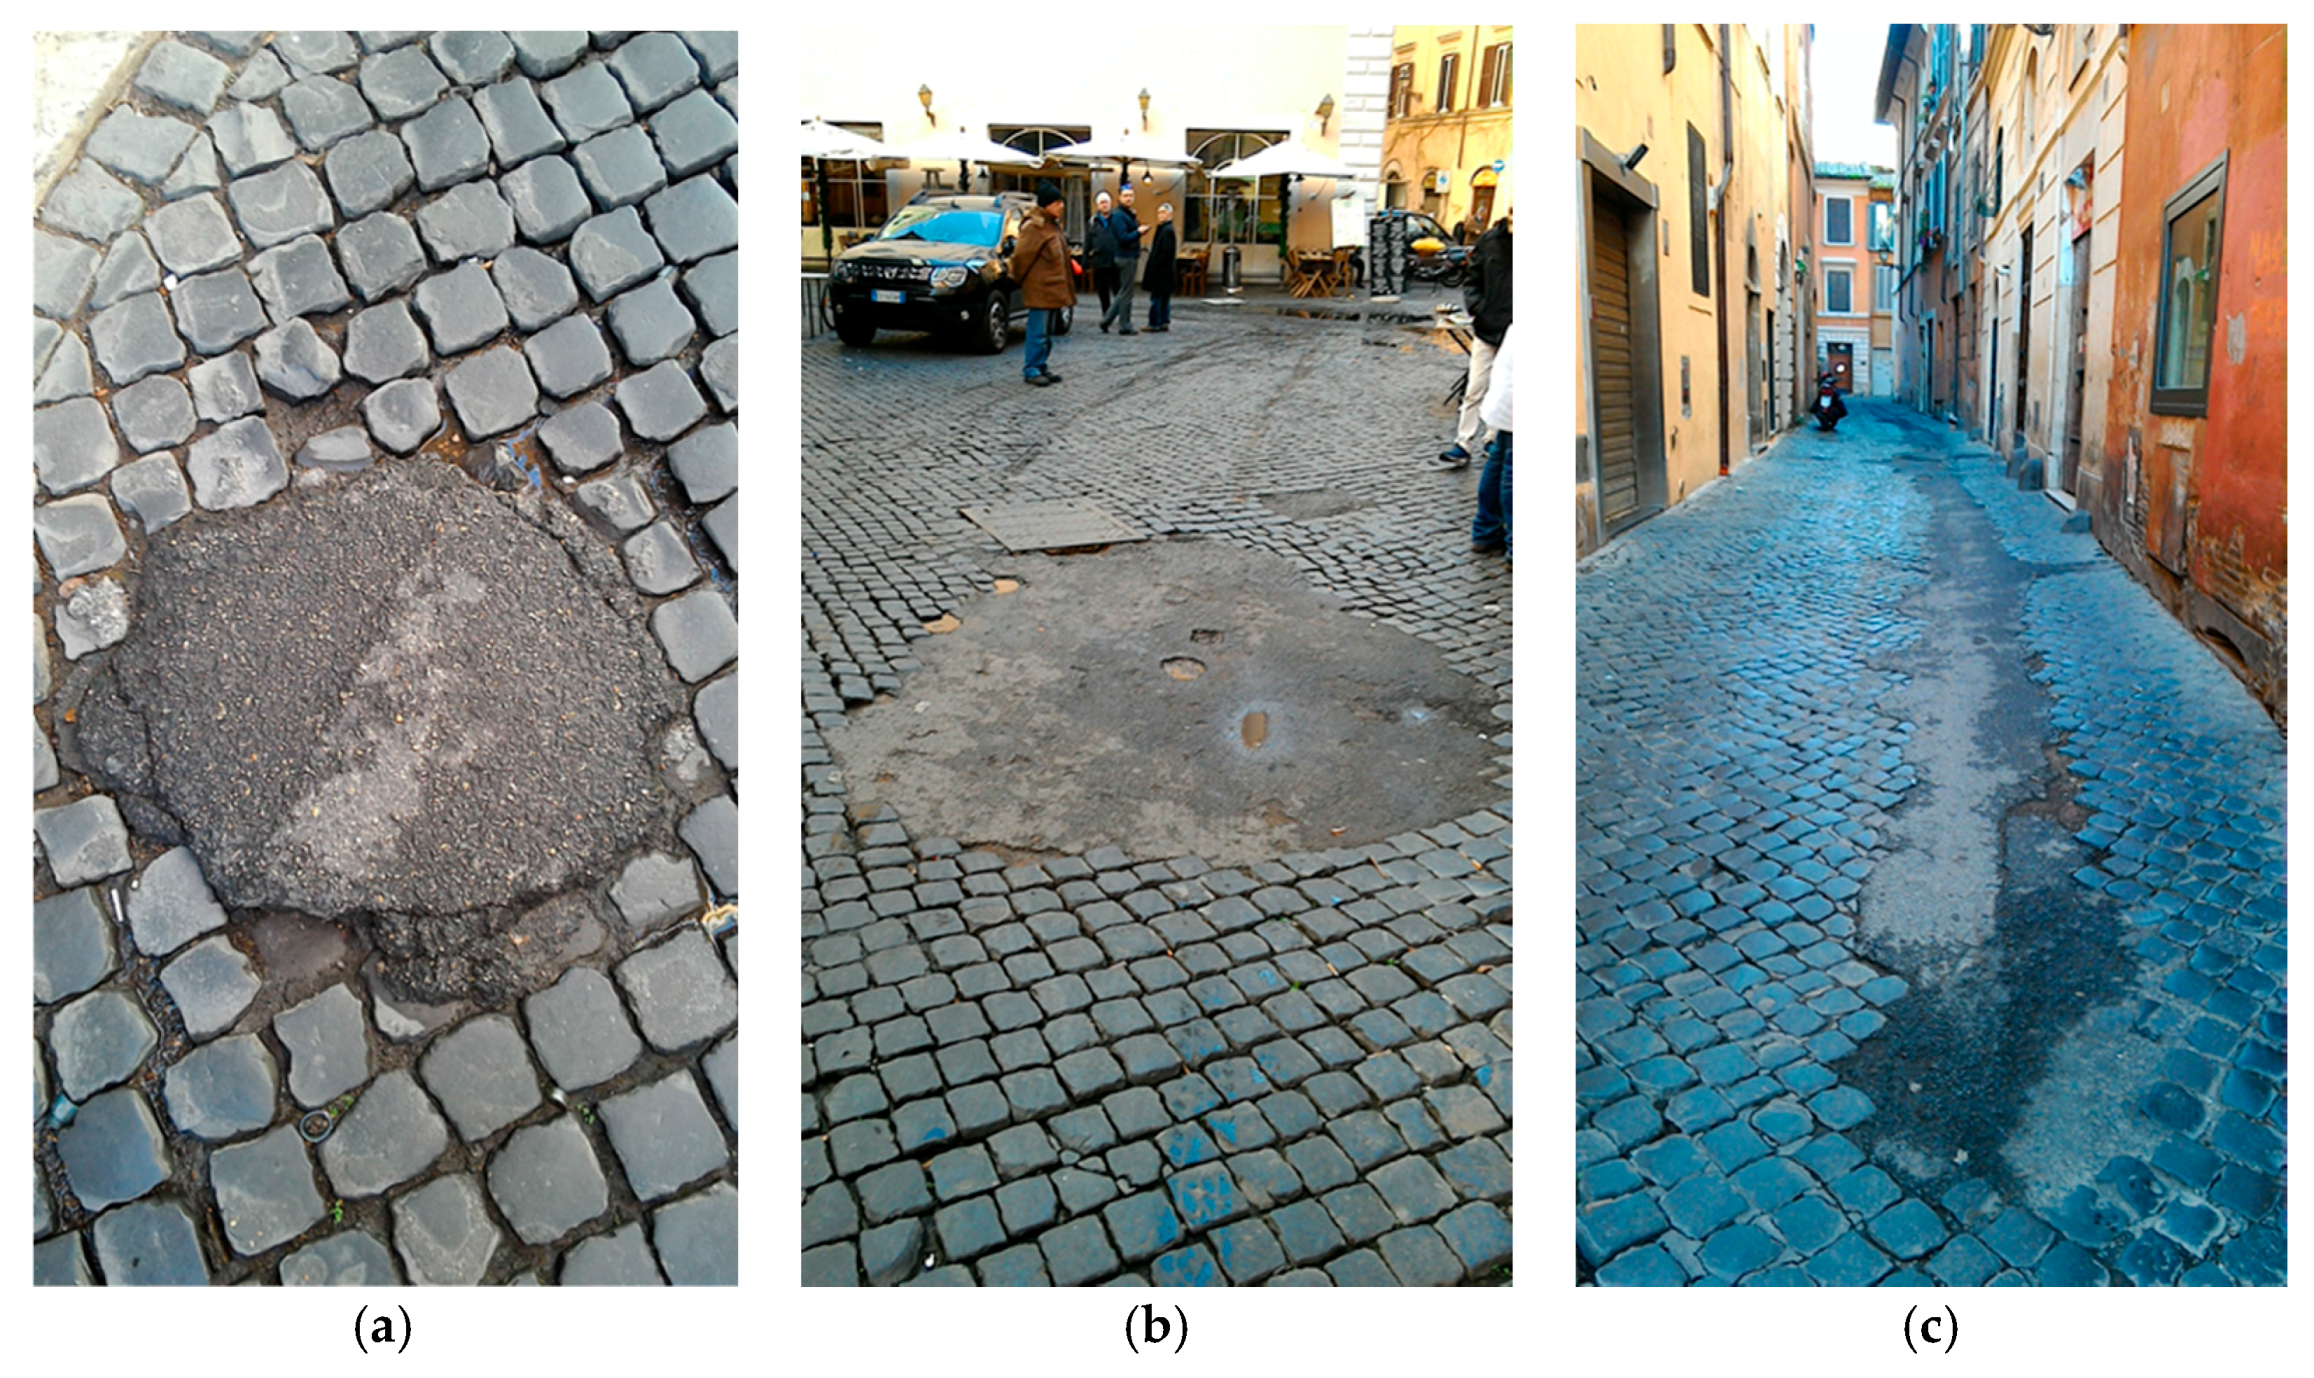
Appendix A.9. Patching
Patching refers to sections of pavement that are missing pavers and have been reinstated with a dissimilar material. Patch quality can compromise the integrity of the pavement structure and promote surface roughness similar to potholes in flexible pavements. Patches are measured in square meters of surface area. The severity is evaluated by the quality of the patch (Figure A9), according to indications in Table A9.
Figure A9.
Patching severity: (a) low; (b) medium; (c) high.

Table A9.
Severity level of patching.
| Severity Level | Description |
|---|---|
| Low | Patch is in good condition and ride quality is unaffected |
| Medium | Patch is in good to fair condition and ride quality is starting to deteriorate |
| High | Patch is in poor condition and ride quality is affected |
Appendix A.10. Rutting
Rutting is a surface depression in the wheel path. Depressions are areas of the pavement surface that have elevations that are lower than the surrounding areas. Rutting is typically caused by settlement of the underlying subgrade or granular base under vehicle loading. Depressions can cause roughness in the pavement and, when filled with water, can cause hydroplaning of vehicles. Rutting is measured in square meters of surface area. The maximum rut depth defines the severity (Figure A10). To determine the rut depth, a straight edge should be placed across the rut and the depth measured in millimeters (Table A10). Rut depth measurements should be taken along the length of the rut. Varying severities of rutting along the length of the rut should be measured individually.
Figure A10.
Rutting severity: (a) low; (b) medium; (c) high.

Table A10.
Severity level of rutting.
| Severity Level | Maximum Depth of Rut |
|---|---|
| Low | 5–15 mm |
| Medium | 15–30 mm |
| High | >30 mm |
Appendix B. Distress Identification for All the Inspected Sections
This appendix reports the list of the distresses present in each surveyed section. For each distress, the severity level, total quantity, density (ratio between total quantity and section area) and the corresponding Deduct Value (DV) were calculated (Table A11, Table A12 and Table A13). In particular, DVs are calculated from Deduct Curves of each distress type report in [18], as already stated in Appendix A. All sections areas were equal to 240 m2.
Once DV is calculated for each distress type and severity level combination, it is necessary to combine all the DVs for each section, as reported in [10,18], to determine the correspondent maximum Corrected Deduct Value (CDV). Finally, the PCI is calculated according to Equation (A1):
Table A11.
Surveyed distresses for Sections 01 to 04.
| Section ID | Distress ID | Severity | Quantity | Density | Deduct Value | PCI |
|---|---|---|---|---|---|---|
| Section 01 | 101 | L | 7.3 | 3.0% | 1.4 | 94 |
| 105 | L | 22.1 | 9.2% | 1.4 | ||
| 105 | M | 5.7 | 2.4% | 2.8 | ||
| 106 | M | 1.3 | 0.5% | 0.0 | ||
| 110 | L | 2.5 | 1.1% | 0.0 | ||
| Section 02 | 101 | L | 5.8 | 2.4% | 1.4 | 74 |
| 102 | L | 2.9 | 1.2% | 4.3 | ||
| 102 | M | 5.4 | 2.2% | 14.5 | ||
| 105 | L | 7.6 | 3.2% | 0.4 | ||
| 106 | L | 5.0 | 2.1% | 4.2 | ||
| 108 | L | 6.0 | 2.5% | 0.4 | ||
| 108 | M | 6.0 | 2.5% | 1.4 | ||
| Section 03 | 101 | L | 8.4 | 3.5% | 1.4 | 12 |
| 101 | M | 1.8 | 0.8% | 1.4 | ||
| 102 | L | 2.0 | 0.8% | 4.3 | ||
| 102 | H | 7.0 | 2.9% | 33.3 | ||
| 104 | L | 10.8 | 4.5% | 6.9 | ||
| 104 | M | 14.8 | 6.2% | 27.8 | ||
| 105 | L | 4.1 | 1.7% | 0.1 | ||
| 105 | M | 2.2 | 0.9% | 1.4 | ||
| 106 | L | 4.0 | 1.7% | 4.2 | ||
| 106 | M | 10.9 | 4.5% | 26.4 | ||
| 106 | H | 10.2 | 4.3% | 44.4 | ||
| 109 | H | 0.5 | 0.2% | 36.6 | ||
| 110 | L | 3.2 | 1.3% | 0.3 | ||
| 110 | M | 6.3 | 2.6% | 0.6 | ||
| 110 | H | 1.0 | 0.4% | 0.4 | ||
| Section 04 | 102 | L | 3.1 | 1.3% | 4.3 | 76 |
| 102 | M | 4.7 | 2.0% | 14.5 | ||
| 103 | L | 1.9 | 0.8% | 2.7 | ||
| 103 | M | 2.8 | 1.2% | 9.5 | ||
| 108 | L | 26.9 | 11.2% | 1.4 | ||
| 110 | L | 1.2 | 0.5% | 0.1 |
If none or only one individual deduct value is greater than 2, the sum of DVs is used in place of the maximum CDV in determining the PCI; otherwise, to determine maximum CDV the following procedure must be used.
Individual DVs are listed in descending order and then, the allowable number of deducts (m) is calculated using Equation (A2):
where HDV is the highest individual deduct value. The number of individual deduct values is reduced to the m largest deduct values, including the fractional part. If DVs available are less than m, all the DVs are used.
The maximum CDV is then calculated iteratively, following the steps described in [10,18]: “Determine total deduct value by summing individual deduct values. The total deduct value is obtained by adding the individual deduct values. Determine q as the number of deducts with a value greater than 2.0. Determine the CDV from total deduct value and q by looking up the appropriate correction curve. Reduce the smallest individual deduct value greater than 2.0 to 2.0 and repeat until q = 1. The maximum CDV is the largest of the CDVs”.
Table A12.
Surveyed distresses for Sections 05 to 10.
| Section ID | Distress ID | Severity | Quantity | Density | Deduct Value | PCI |
|---|---|---|---|---|---|---|
| Section 05 | 101 | L | 1.9 | 0.8% | 0.4 | 51 |
| 102 | L | 1.5 | 0.6% | 4.3 | ||
| 102 | M | 4.5 | 1.9% | 13.0 | ||
| 104 | L | 1.8 | 0.8% | 1.4 | ||
| 104 | M | 3.0 | 1.3% | 8.3 | ||
| 108 | L | 6.2 | 2.6% | 0.3 | ||
| 108 | M | 13.3 | 5.5% | 2.8 | ||
| 108 | H | 3.2 | 1.4% | 1.4 | ||
| 111 | L | 8.0 | 3.3% | 16.9 | ||
| 111 | H | 4.8 | 2.0% | 34.0 | ||
| Section 06 | 102 | L | 1.9 | 0.8% | 4.3 | 88 |
| 102 | M | 1.7 | 0.7% | 10.1 | ||
| 105 | M | 0.2 | 0.1% | 0.0 | ||
| Section 07 | 102 | L | 6.7 | 2.8% | 7.2 | 92 |
| 105 | M | 0.8 | 0.3% | 0.3 | ||
| 108 | L | 0.8 | 0.4% | 0.1 | ||
| Section 08 | 102 | M | 7.0 | 2.9% | 8.0 | 60 |
| 102 | H | 5.0 | 2.1% | 30.4 | ||
| 104 | L | 4.8 | 2.0% | 4.2 | ||
| 108 | M | 4.0 | 1.7% | 1.4 | ||
| 108 | H | 2.0 | 0.9% | 1.4 | ||
| 110 | L | 4.0 | 1.7% | 0.3 | ||
| Section 09 | 102 | L | 1.0 | 0.4% | 2.9 | 60 |
| 102 | M | 3.9 | 1.6% | 13.0 | ||
| 102 | H | 4.5 | 1.9% | 29.0 | ||
| 105 | M | 0.6 | 0.3% | 0.4 | ||
| 106 | M | 1.6 | 0.7% | 11.1 | ||
| 108 | L | 1.0 | 0.4% | 0.1 | ||
| 108 | M | 3.0 | 1.3% | 1.1 | ||
| 111 | L | 2.4 | 1.0% | 7.0 | ||
| Section 10 | 102 | L | 13.5 | 5.6% | 11.6 | 55 |
| 102 | M | 11.0 | 4.6% | 20.3 | ||
| 104 | M | 6.0 | 2.5% | 15.3 | ||
| 105 | M | 4.0 | 1.7% | 1.4 | ||
| 109 | L | 2.0 | 0.8% | 18.3 | ||
| 110 | L | 8.4 | 3.5% | 0.4 | ||
| 111 | L | 3.3 | 1.4% | 9.9 |
Table A13.
Surveyed distresses for Sections 11 to 14.
| Section ID | Distress ID | Severity | Quantity | Density | Deduct Value | PCI |
|---|---|---|---|---|---|---|
| Section 11 | 102 | L | 6.5 | 2.7% | 7.2 | 45 |
| 102 | H | 6.0 | 2.5% | 31.9 | ||
| 104 | M | 5.0 | 2.1% | 12.5 | ||
| 104 | H | 4.5 | 1.9% | 22.2 | ||
| 105 | L | 1.5 | 0.6% | 0.1 | ||
| 105 | M | 10.5 | 4.4% | 2.8 | ||
| 110 | L | 10.7 | 4.5% | 0.4 | ||
| 110 | M | 0.3 | 0.1% | 0.0 | ||
| 111 | L | 6.6 | 2.8% | 15.5 | ||
| Section 12 | 102 | L | 1.0 | 0.4% | 2.9 | 45 |
| 104 | L | 7.5 | 3.1% | 5.6 | ||
| 104 | M | 1.0 | 0.4% | 2.8 | ||
| 105 | L | 0.5 | 0.2% | 0.1 | ||
| 106 | L | 2.0 | 0.8% | 2.8 | ||
| 110 | L | 8.0 | 3.3% | 0.4 | ||
| 110 | H | 3.1 | 1.3% | 1.4 | ||
| 111 | L | 10.0 | 4.2% | 46.5 | ||
| Section 13 | 102 | L | 9.0 | 3.8% | 8.7 | 71 |
| 104 | M | 3.9 | 1.6% | 9.7 | ||
| 106 | L | 2.4 | 1.0% | 2.8 | ||
| 106 | M | 9.0 | 3.8% | 23.6 | ||
| Section 14 | 101 | L | 0.8 | 0.3% | 0.4 | 79 |
| 102 | L | 14.4 | 6.0% | 11.6 | ||
| 102 | M | 1.5 | 0.6% | 10.1 | ||
| 104 | L | 9.1 | 3.8% | 5.6 | ||
| 105 | L | 6.8 | 2.8% | 0.3 | ||
| 105 | M | 4.1 | 1.7% | 1.4 | ||
| 106 | L | 9.0 | 3.8% | 5.6 | ||
| 109 | L | 0.4 | 0.2% | 1.4 | ||
| 110 | L | 0.2 | 0.1% | 0.0 |
References
- Han, D.; Kobayashi, K. Criteria for the development and improvement of PMS models. KSCE J. Civ. Eng. 2013, 17, 1302–1316. [Google Scholar] [CrossRef]
- Shahin, M.Y. Pavement Management for Airports, Roads, and Parking Lots; Springer: New York, NY, USA, 2005; p. 572. [Google Scholar]
- Bonin, G.; Folino, N.; Loprencipe, G.; Oliverio Rossi, G.; Polizzotti, S.; Teltayev, B. Development of a Road Asset Management System in Kazakhstan. In Proceedings of the TIS 2017 International Congress on Transport Infrastructure and Systems, Rome, Italy, 10–12 April 2017; pp. 10–12. [Google Scholar]
- Loprencipe, G.; Cantisani, G.; Di Mascio, P. Global assessment method of road distresses. Proceedings of 4th International Symposium on Life-Cycle Civil Engineering, Tokyo, Japan, 16 November 2014; CRC Press/Balkema: Leiden, The Netherlands, 2015; pp. 1113–1120. Available online: https://www.crcpress.com/Life-Cycle-of-Structural-Systems-Design-Assessment-Maintenance-and-Management/Furuta-Frangopol-Akiyama/p/book/9781138001206 (accessed on 2 January 2017).
- Loprencipe, G.; Pantuso, A.; Di Mascio, P. Sustainable Pavement Management System in Urban Areas Considering the Vehicle Operating Costs. Sustainability, 2017, 9, 453. [Google Scholar] [CrossRef]
- Cottrell, W.D.; Bryan, S.; Chilukuri, B.R.; Kalyani, V.; Stevanovic, A.; Wu, J. Transportation Infrastructure Maintenance Management: Case Study of a Small Urban City. J. Infrastruct. Syst. 2009, 15, 120–132. [Google Scholar] [CrossRef]
- Corazza, M.V.; Di Mascio, P.; Moretti, L. Managing sidewalk pavement maintenance: A case study to increase pedestrian safety. JTTE 2016, 3, 203–214. [Google Scholar] [CrossRef]
- Loprencipe, G.; Pantuso, A. A Specified Procedure for Distress Identification and Assessment for Urban Road Surfaces based on PCI. Coatings 2017, 7, 65. [Google Scholar] [CrossRef]
- Sayers, M.W. On the calculation of international roughness index from longitudinal road profile. Transp. Res. Rec. 1995, 1501, 1–12. [Google Scholar]
- American Society of Texting and Materials D6433-16. Standard Practice for Roads and Parking Lots Pavement Condition Index Surveys; ASTM International: West Conshohocken, PA, USA, 2016; Available online: www.astm.org (accessed on 20 January 2017).
- Sayers, M.W.; Karamihas, S.M. The Little Book of Profiling; The Regent of the University of Michigan: Ann Arbor, MI, USA, 1998. [Google Scholar]
- Arhin, S.A.; Williams, L.N.; Ribbiso, A.; Anderson, M.F. Predicting pavement condition index using international roughness index in a dense urban area. J. Civ. Eng. Res. 2015, 5, 10–17. [Google Scholar]
- Lin, J.D.; Yau, J.T.; Hsiao, L.H. Correlation analysis between international roughness index (IRI) and pavement distress by neural network. In Proceedings of the 82nd Annual Meeting of the Transportation Research Board, Washington, DC, USA, 12–16 January 2003. [Google Scholar]
- Rens, K.L.; Staley, B. Rating City and County of Denver Urban Pavement Constructability Using a Profiler. Pract. Period. Struct. Des. Construct. 2009, 15, 44–49. [Google Scholar] [CrossRef]
- Beuving, E.; Michaut, J.P. Pavement Surface Materials Used in Urban Areas. In Proceedings of the PIARC Committee C 4.3 Seminar, Urban Pavements, Cracow, Poland, 21–22 September 2005. [Google Scholar]
- National Highway Sector Schemes. National Highways Sector Scheme 30 for Modular Paving; Interlay: Glenfield, UK, 2013; Available online: http://www.pavingexpert.com/pdf/NHSS%20UNIT%201%20BLOCKS%20FLAGS%20AND%20SETTS%20-%20RIGID%20MODULAR.pdf (accessed on 25 January 2017).
- Geller, R. Concrete Block Paving Condition Survey and Rating Procedures. In Proceedings of the 5th international Conference on CBP, Tel Aviv, Israel, 23–27 June 1996; pp. 405–412. [Google Scholar]
- Applied Research Associates, Inc. Interlocking Concrete Block Pavement Distress Guide; Interlocking Concrete Pavement Institute (ICPI), 2007. Available online: https://www.icpi.org/sites/default/files/ctools/Distress_Manual_Final_2008.pdf (accessed on 9 February 2017).
- Hein, D.; Burak, R. Development of A Pavement Condition Rating Procedure for Interlocking Concrete Pavements. In Proceedings of the Cost-Effective Assessment/Rehabilitation of the Condition of Materials for the Transportation Association of Canada Fall 2007 Meeting, Saskatoon, SK, Canada, 14–17 October 2007. [Google Scholar]
- Cibin, L. Selciato Romano: Il Sampietrino; Gangemi: Rome, Italy, 2003. [Google Scholar]
- Cantisani, G.; Loprencipe, G. Road roughness and whole-body vibration: Evaluation tools and comfort limits. J. Transp. Eng. 2010, 136, 818–826. [Google Scholar] [CrossRef]
- Ahlin, K.; Granlund, N.O.J. Relating road roughness and vehicle speeds to human whole-body vibration and exposure limits. Int. J. Pavement Eng. 2002, 3, 207–216. [Google Scholar] [CrossRef]
- Loprencipe, G.; Zoccali, P. Use of generated artificial road profiles in road roughness evaluation. JMT 2017, 25, 24–33. [Google Scholar] [CrossRef]
- City of Rome. Tariffa 2012 Parte B Opere Stradali e Infrastrutture a Rete. 2012. Available online: https://www.comune.roma.it/PCR/resources/cms/documents/3_TARIFFA2012BSTRADE.pdf (accessed on 10 March 2017).
- Cantisani, G.; Fascinelli, G.; Loprencipe, G. Urban Road Noise: The Contribution of Pavement Discontinuities. In Proceedings of the 2012 International Conference on Sustainable Design and Construction, Fort Worth, TX, USA, 7–9 November 2012; American Society of Civil Engineers: Reston, VA, USA; pp. 327–334. Available online: http://dx.doi.org/10.1061/9780784412688 (accessed on 28 February 2017).
- American Society of Texting and Materials E1926-08. Standard Practice for Computing International Roughness Index of Roads from Longitudinal Profile Measurements; ASTM International: West Conshohocken, PA, USA, 2008; Available online: www.astm.org (accessed on 20 September 2016).
- International Organization for Standardization. ISO2631-1: Mechanical Vibration and Shock-Evaluation of Human Exposure to Whole-Body Vibration—Part 1: General Requirements ISO/TC108/SC4; ISO: Geneva, Switzerland, 1997. [Google Scholar]
- Loprencipe, G.; Cantisani, G. Unified analysis of road pavement profiles for evaluation of surface characteristics. Mod. Appl. Sci. 2013, 7, 1–14. [Google Scholar] [CrossRef]
- Park, K.; Thomas, N.E.; Wayne Lee, K. Applicability of the international roughness index as a predictor of asphalt pavement condition. J. Transport. Eng. 2007, 133, 706–709. [Google Scholar] [CrossRef]
- Kirbaş, U.; Karaşahin, M. Investigation of ride comfort limits on urban asphalt concrete pavements. Int. J. Pavement Eng. 2016, 1–7. [Google Scholar] [CrossRef]
Figure 1.
Typical cross section of a block pavement structure.

Figure 2.
Geometric patterns: (a) herringbone at 45°; (b) arc.

Figure 3.
Extension of Sampietrini pavements (in red) within the urban road network of Rome.
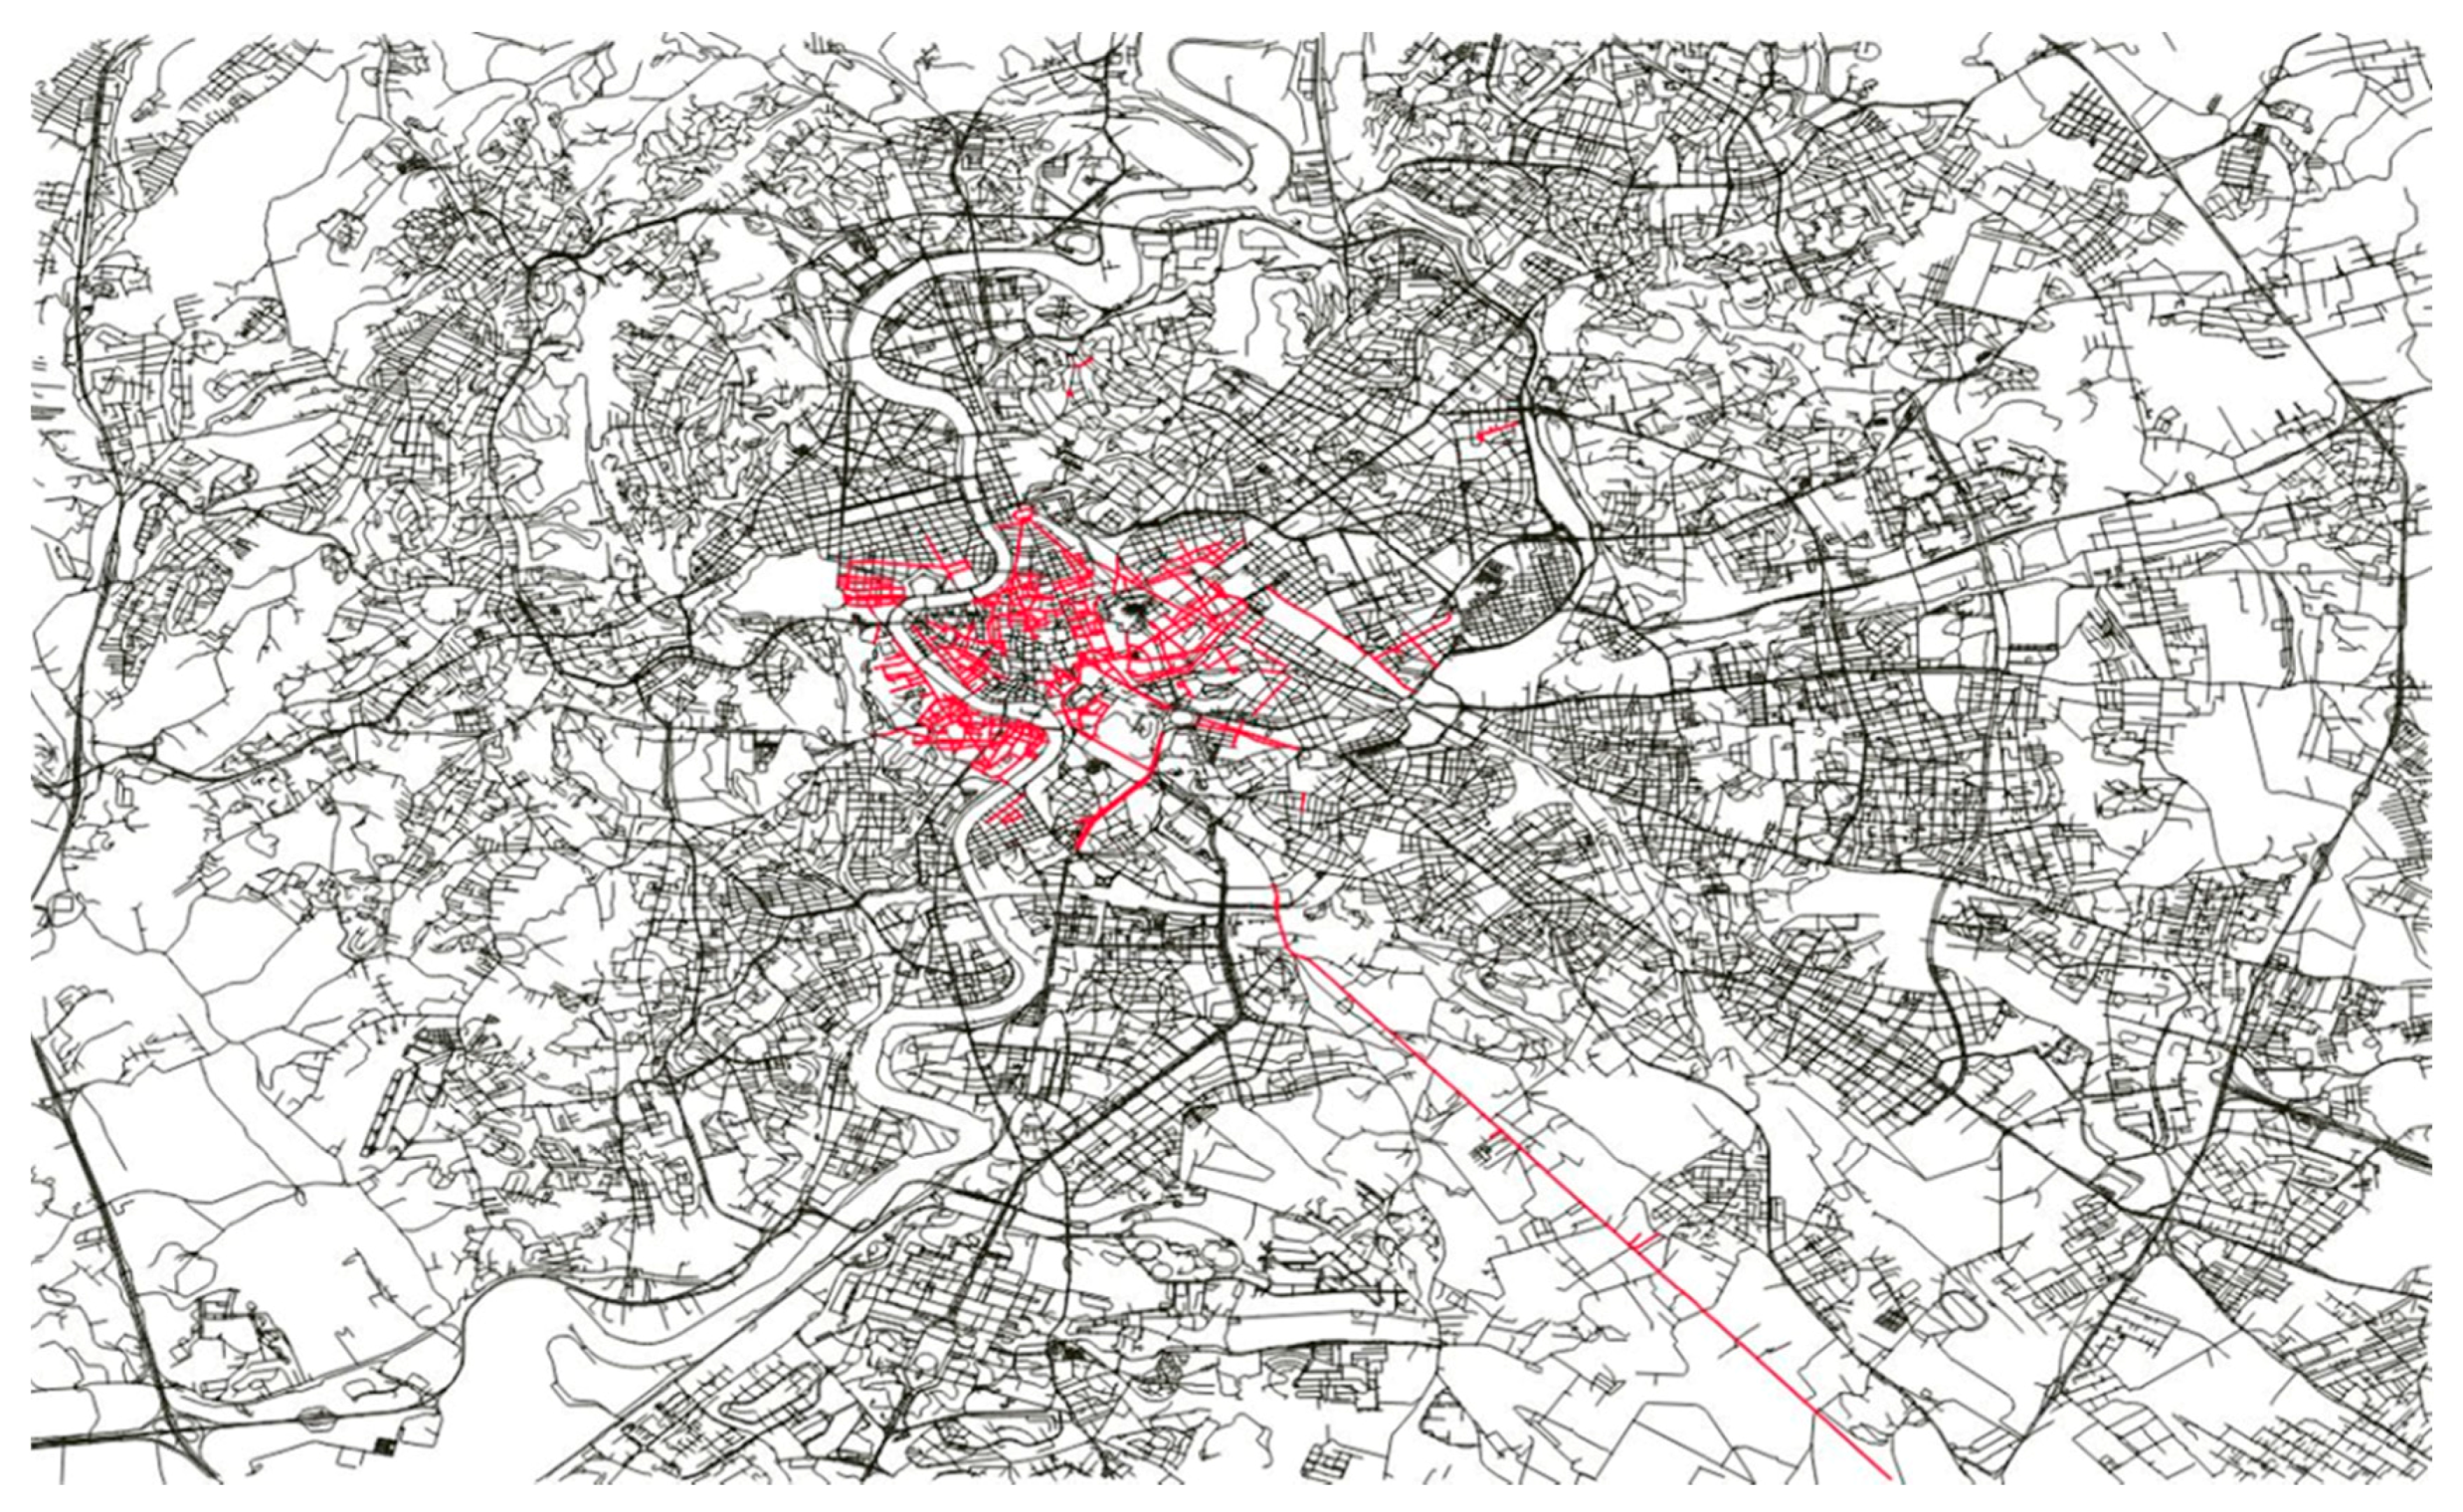
Figure 4.
The construction phase of a block pavement structure.
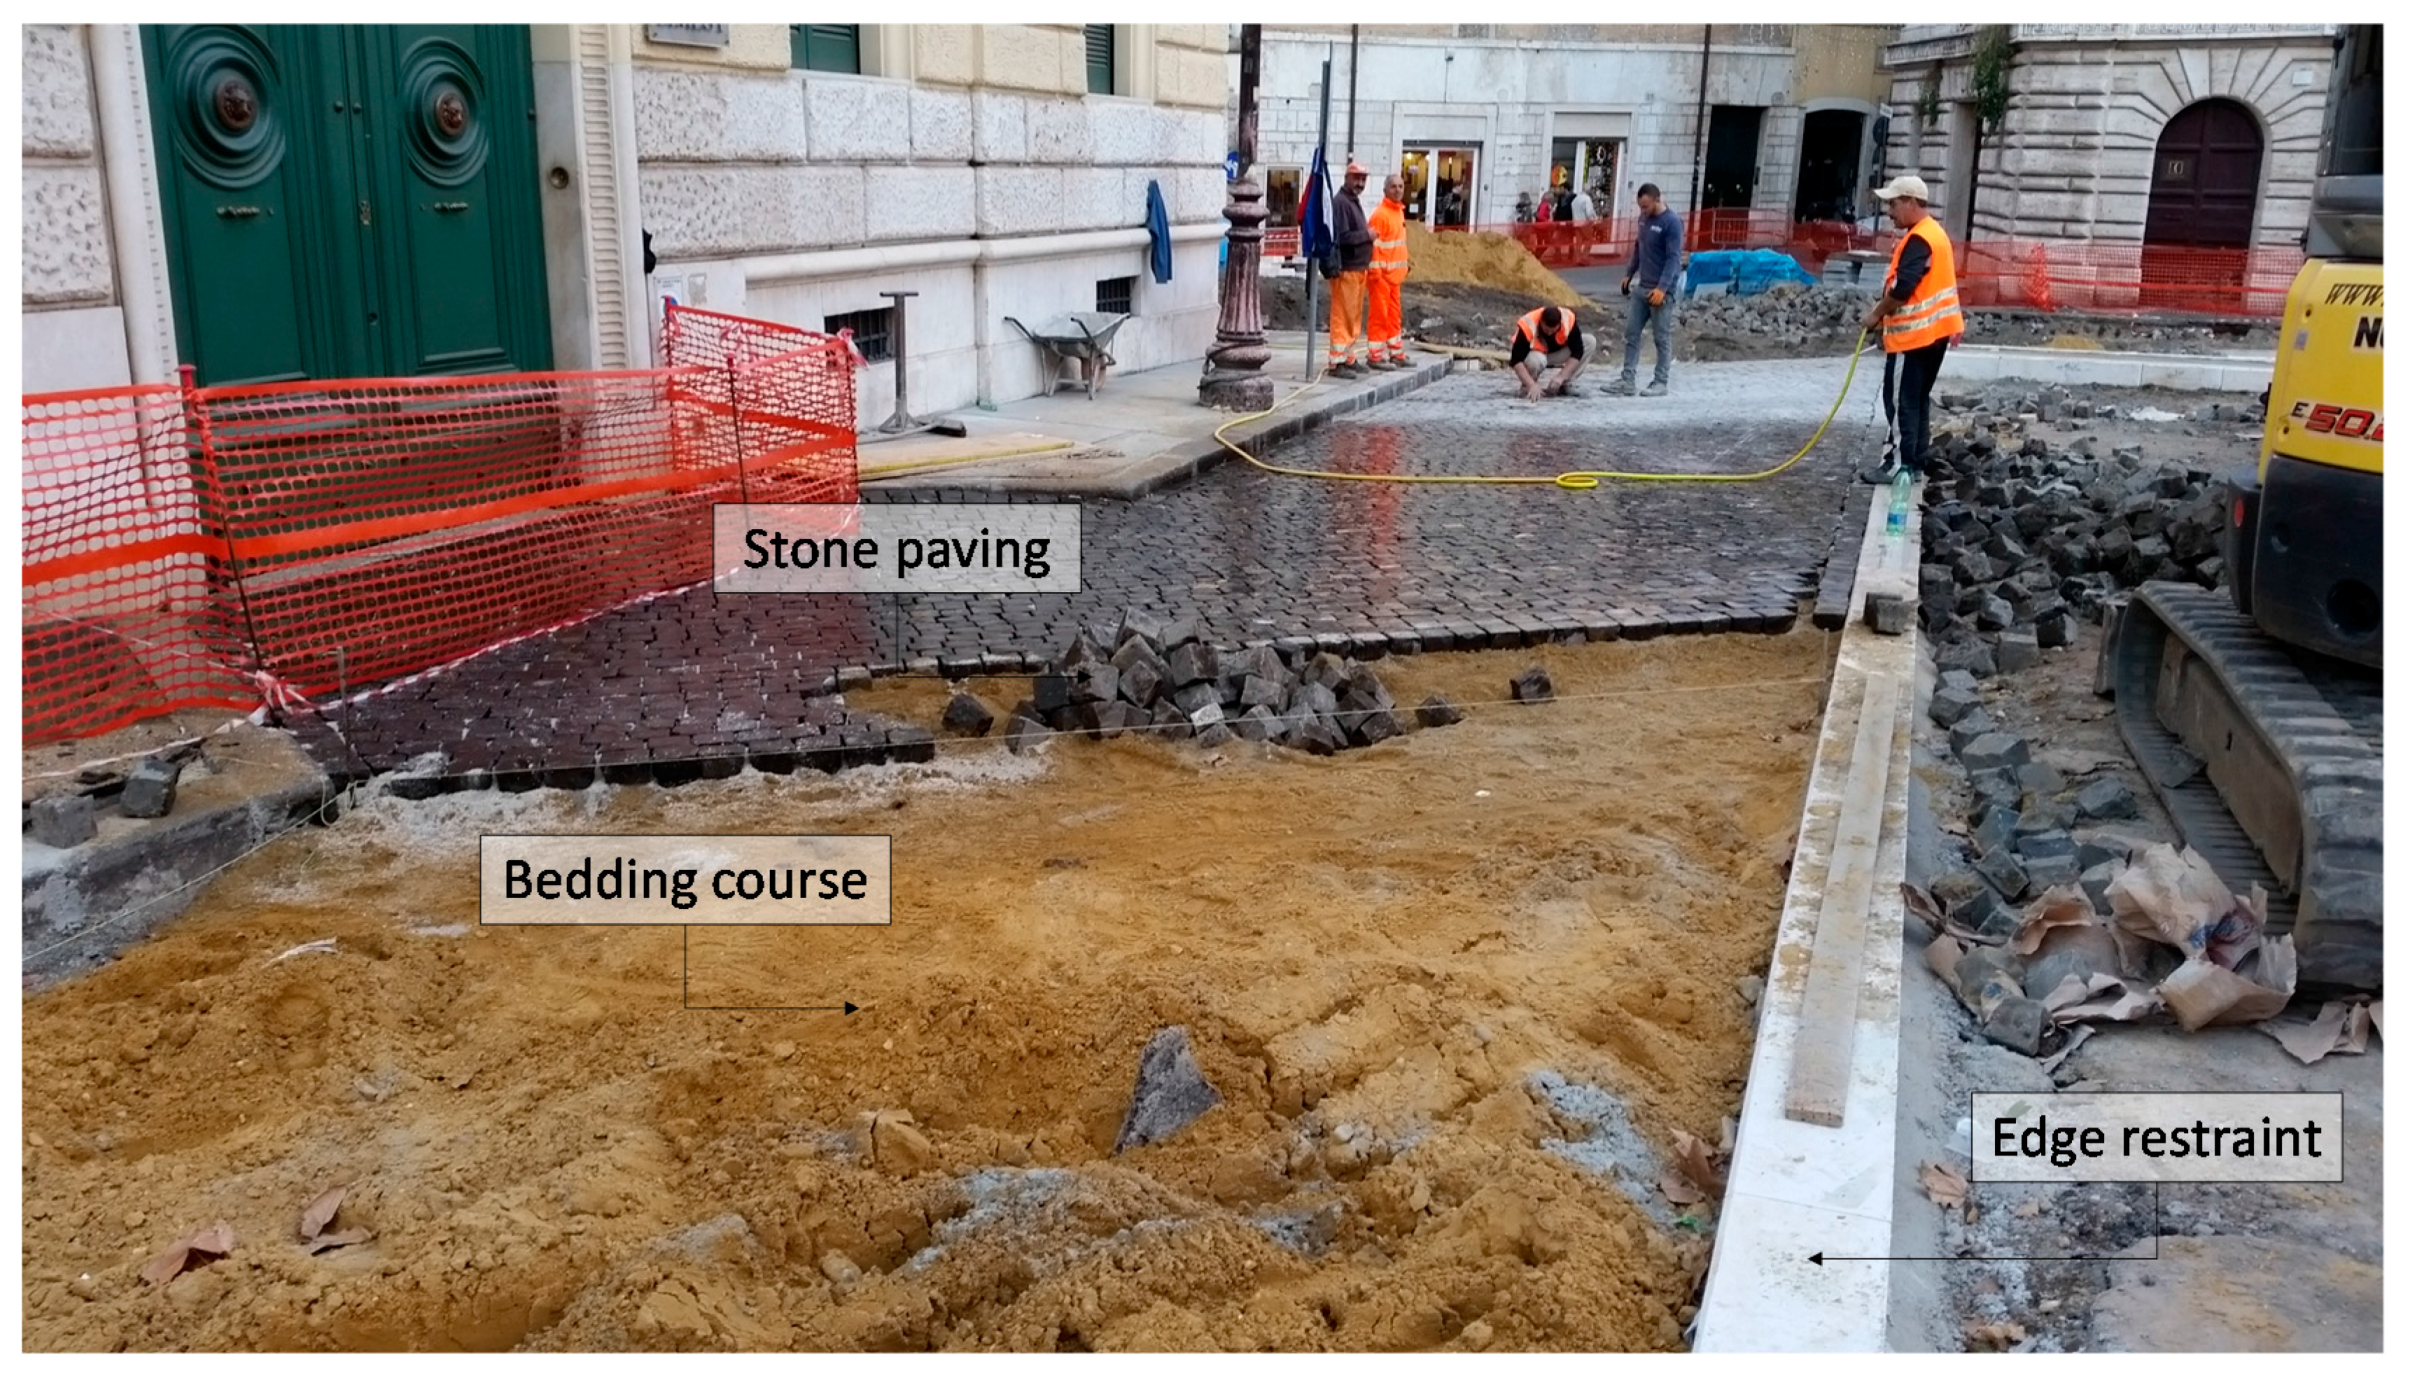
Figure 5.
Sampietrini pavement Section 01: (a) top-down; (b) street views.
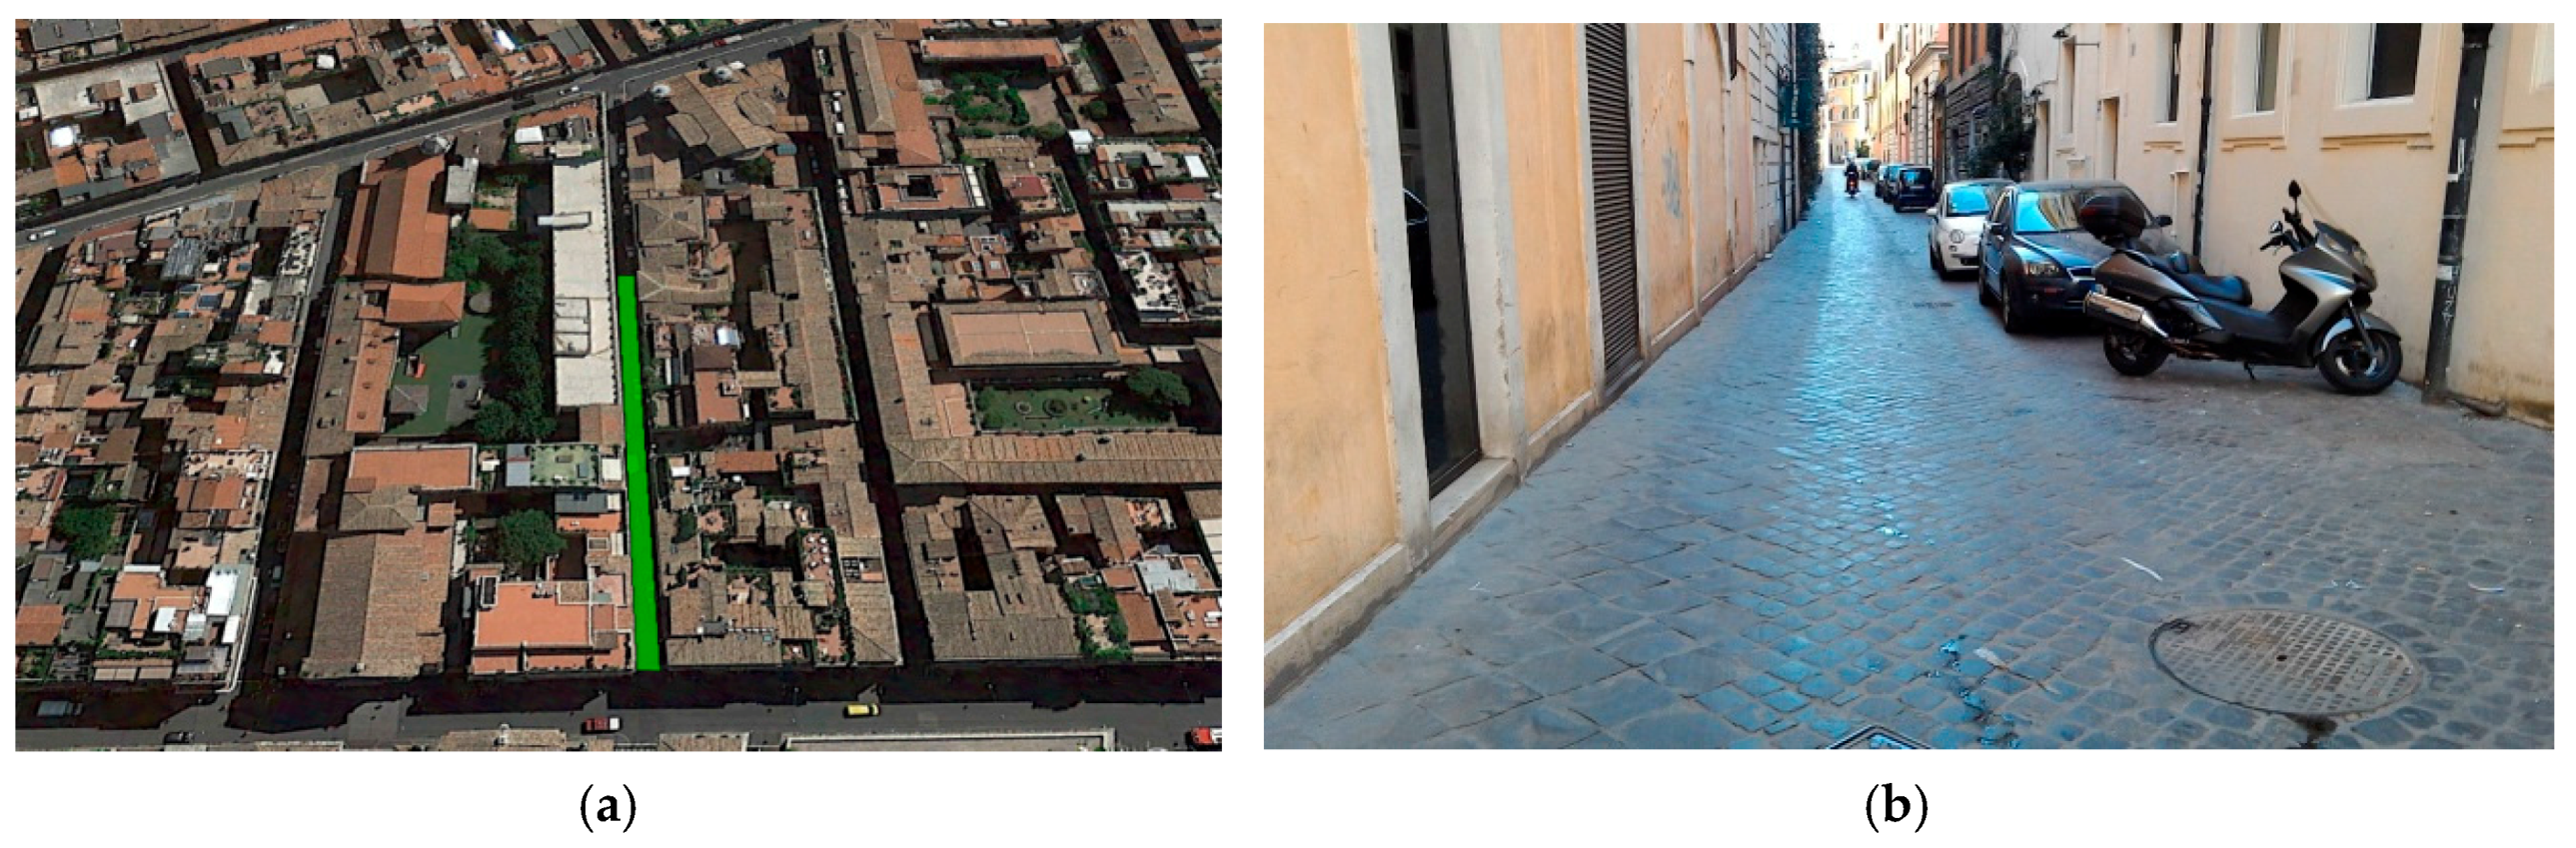
Figure 6.
Sampietrini pavement Section 06: (a) top-down; (b) street views.
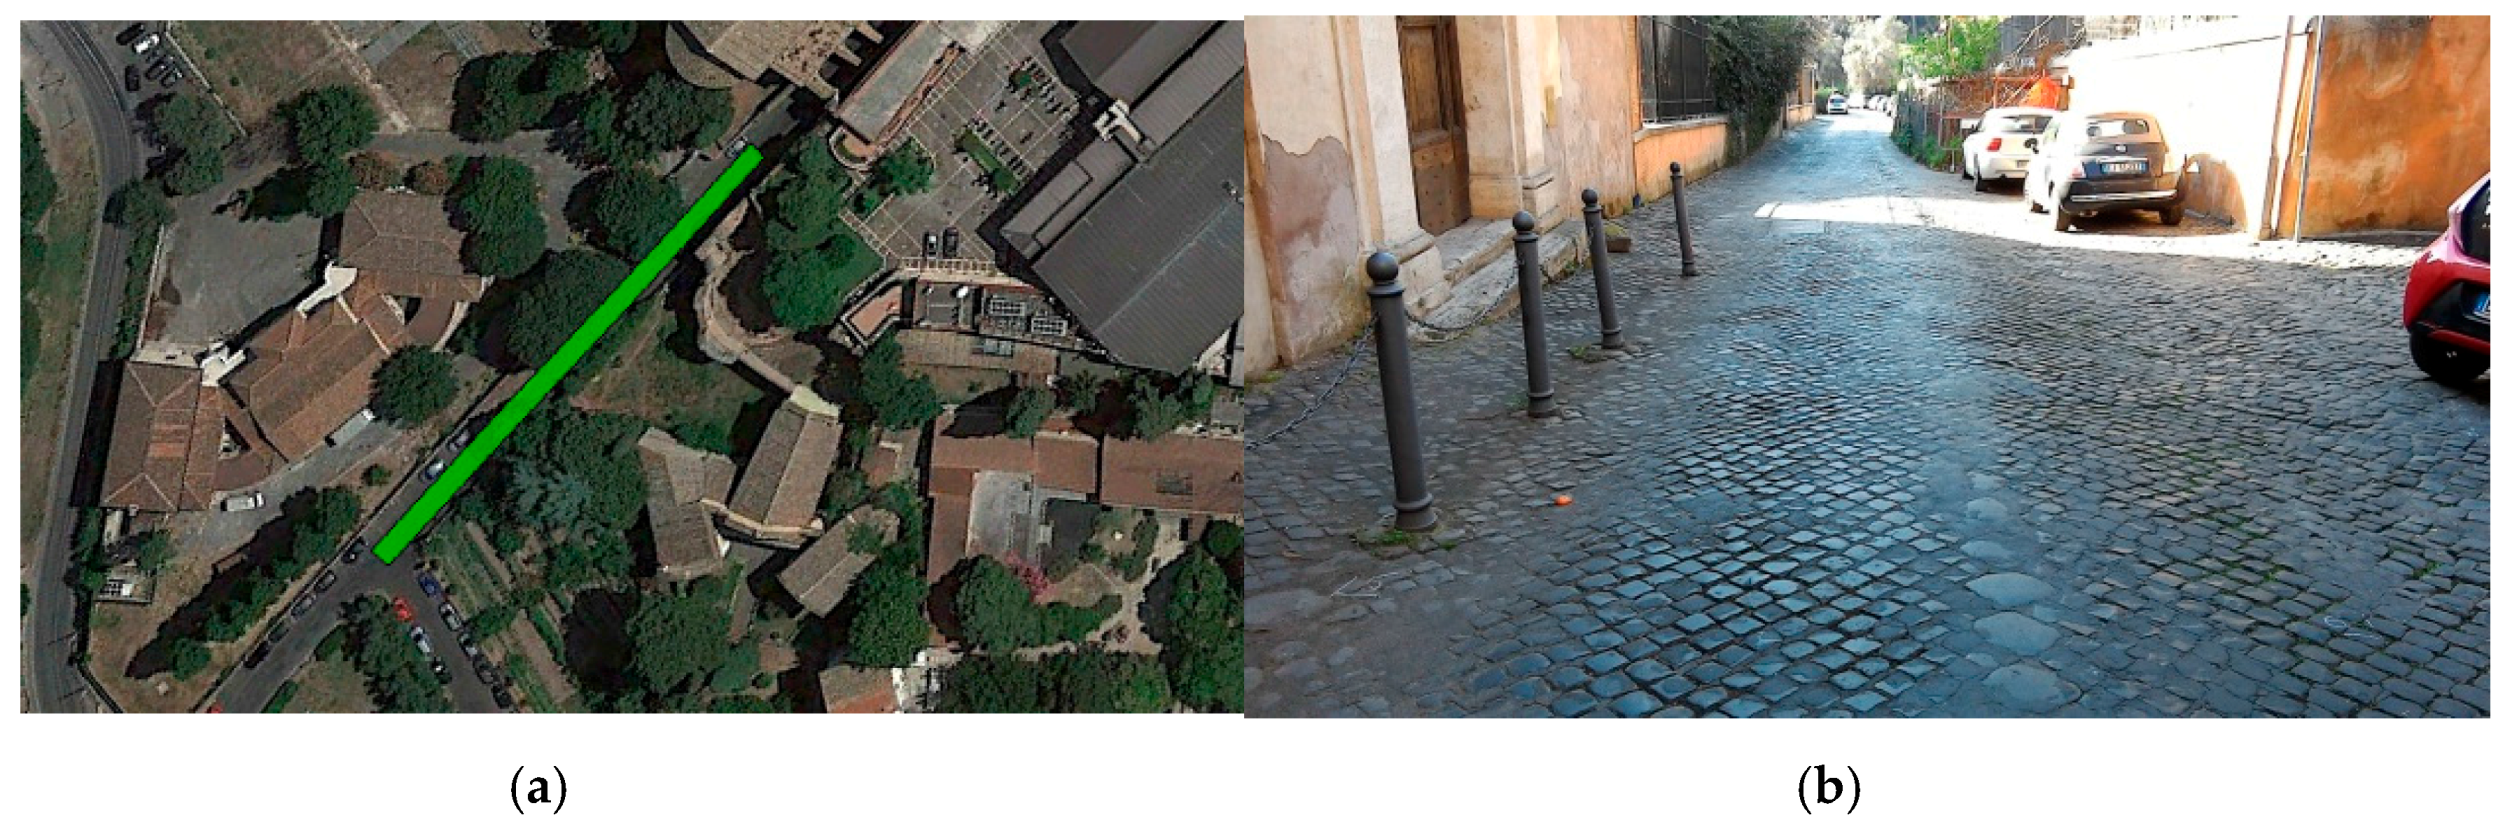
Figure 7.
Correlation between Pavement Condition Index (PCI) and International Roughness Index (IRI) for Sampietrini pavements.
Figure 7.
Correlation between Pavement Condition Index (PCI) and International Roughness Index (IRI) for Sampietrini pavements.

Figure 8.
Correlation between PCI and IRI for a different type of pavements.
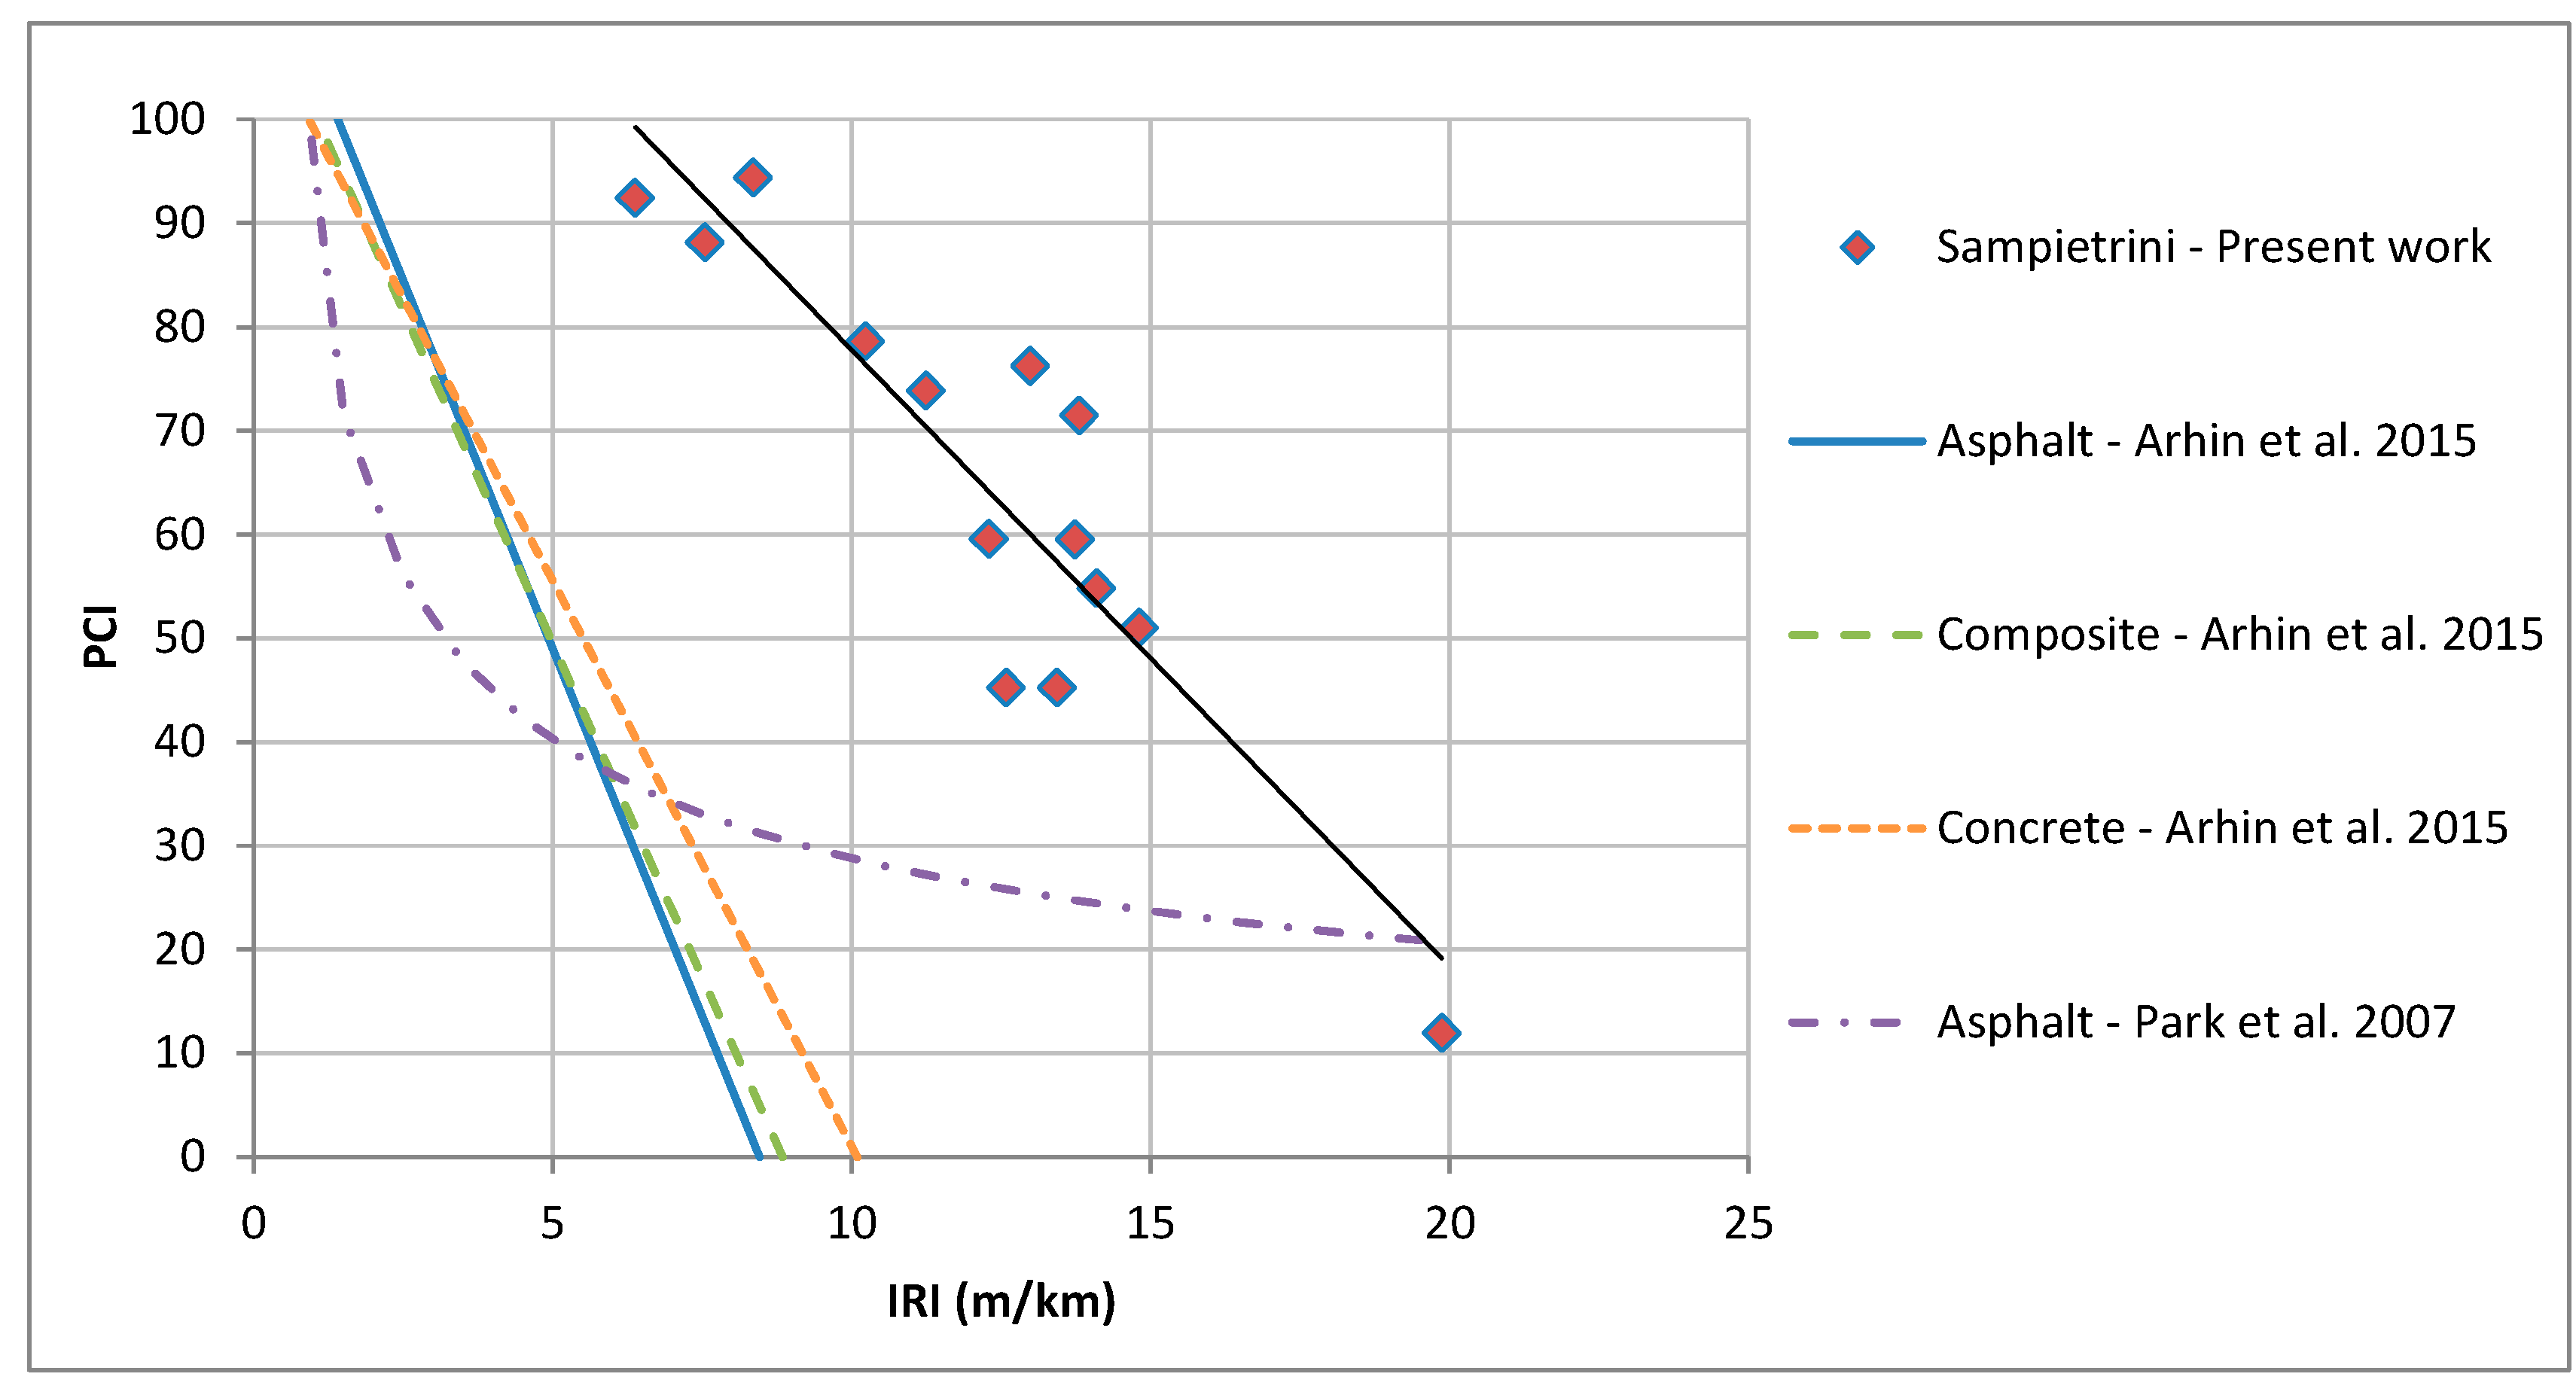
Figure 9.
Correlation between IRI and awz at different speeds.
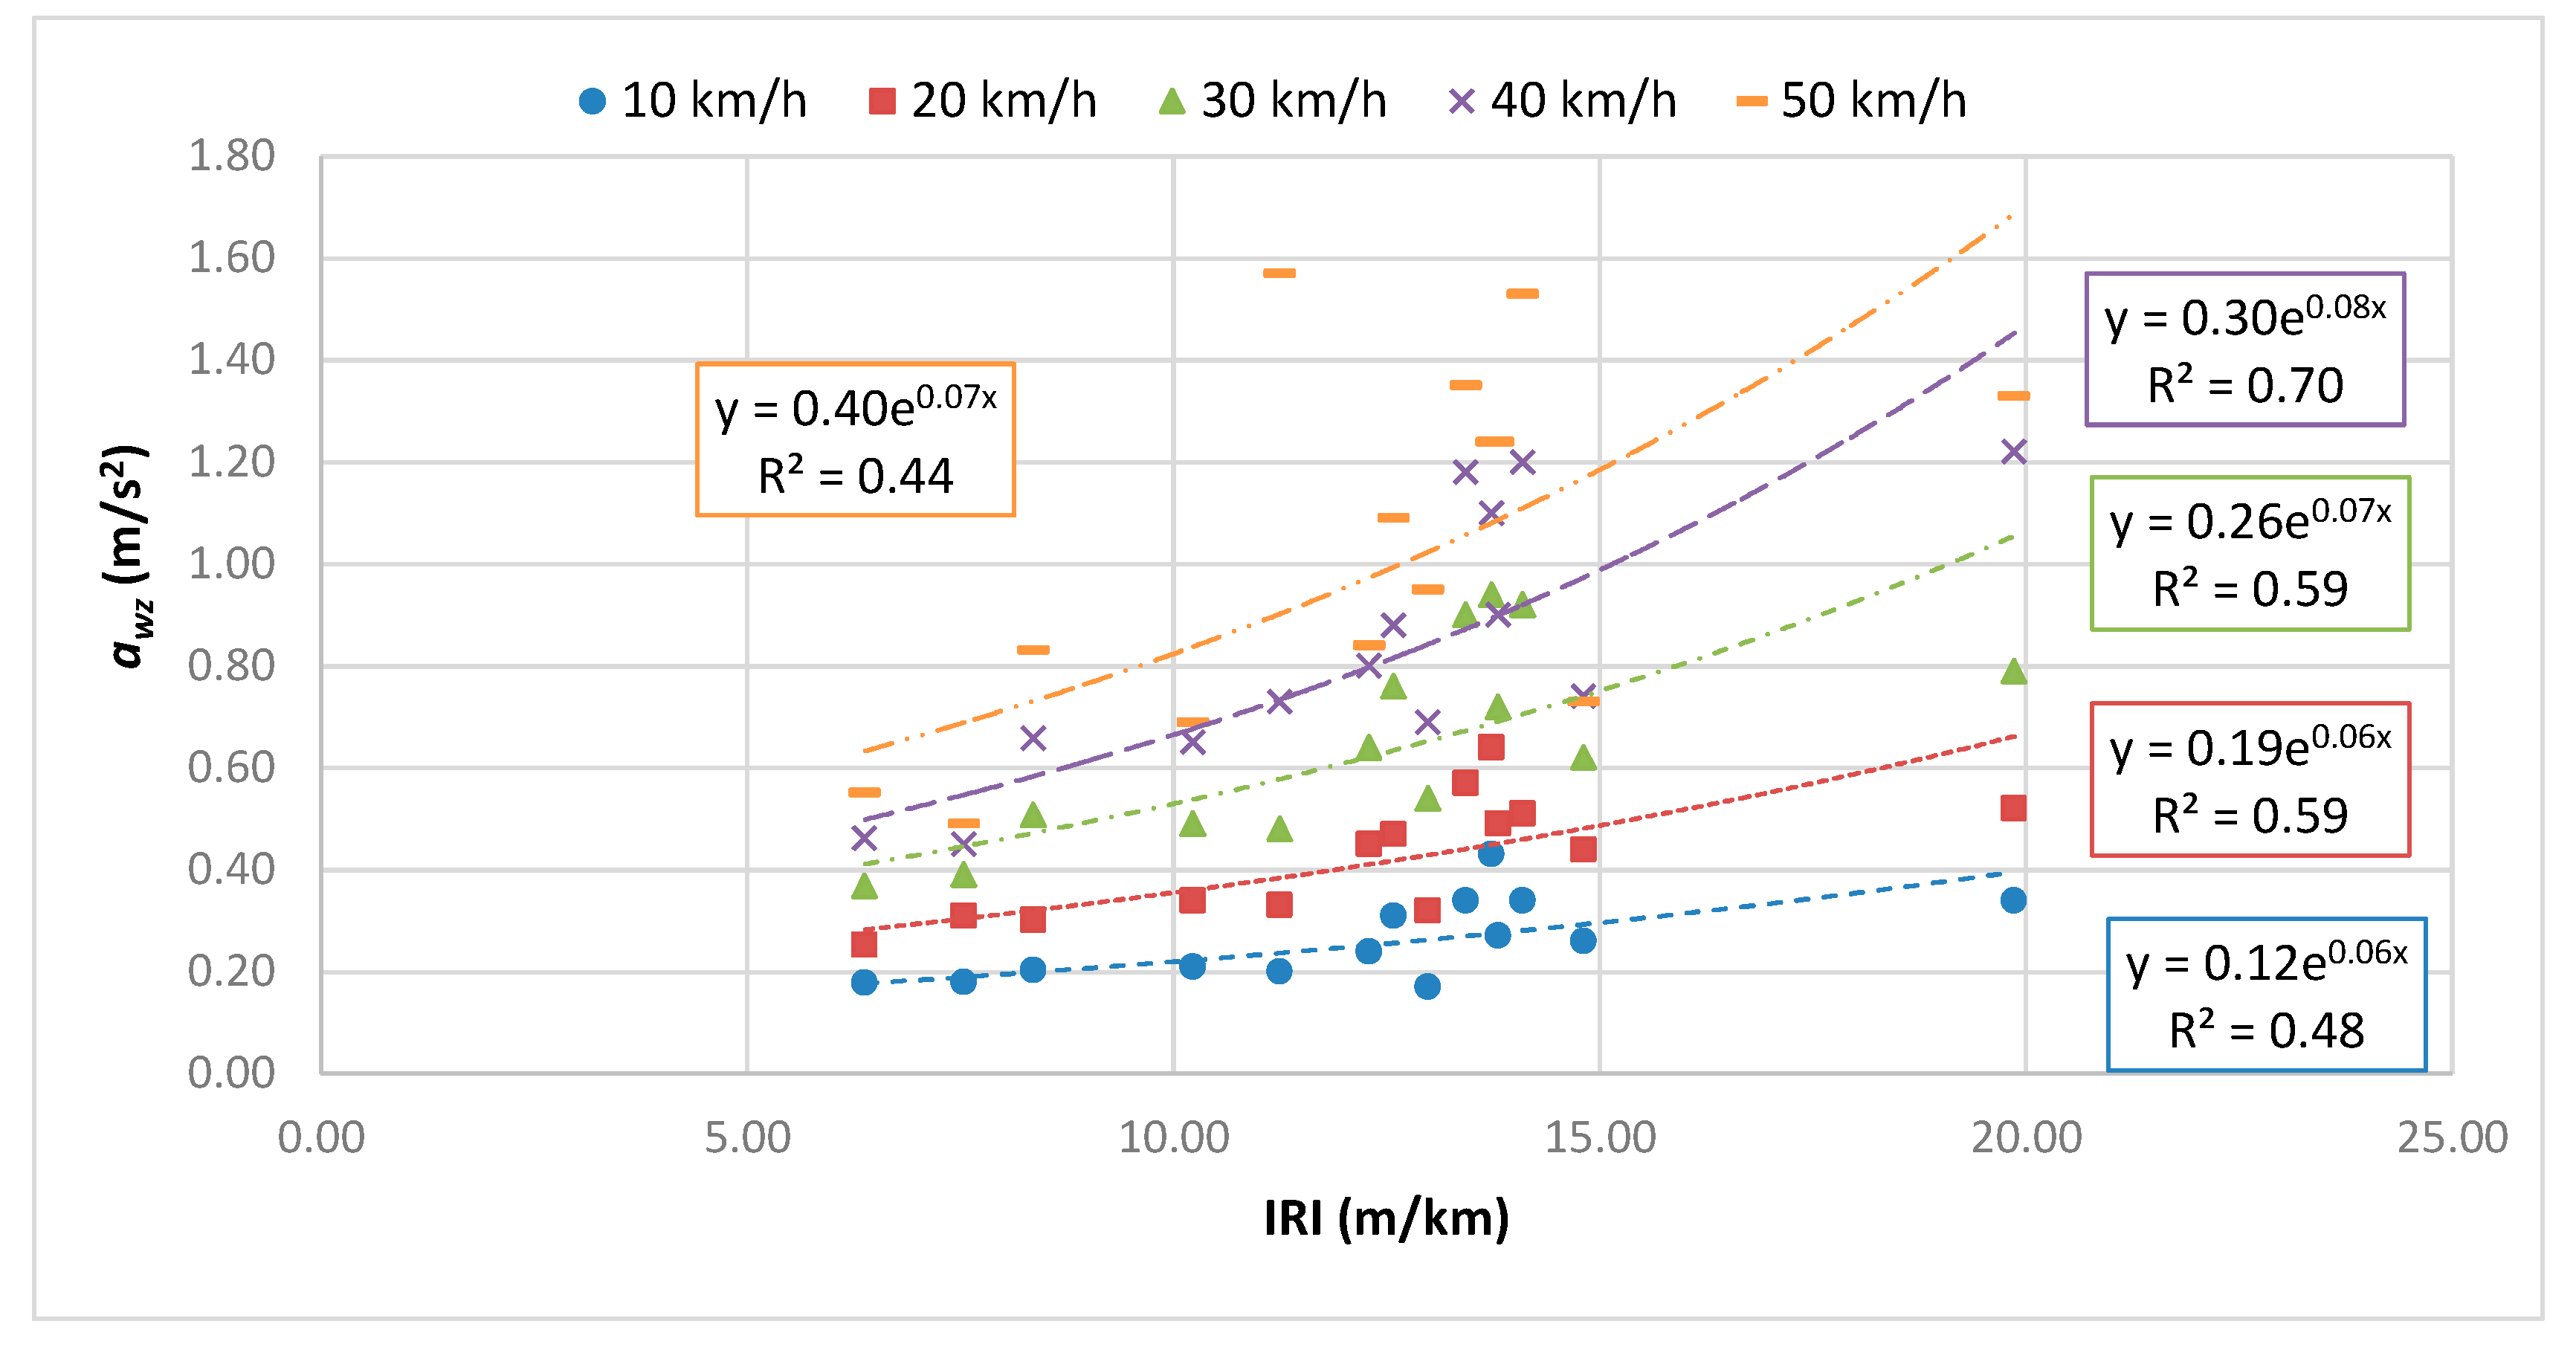
Figure 10.
Correlation between PCI and awz at different speeds.
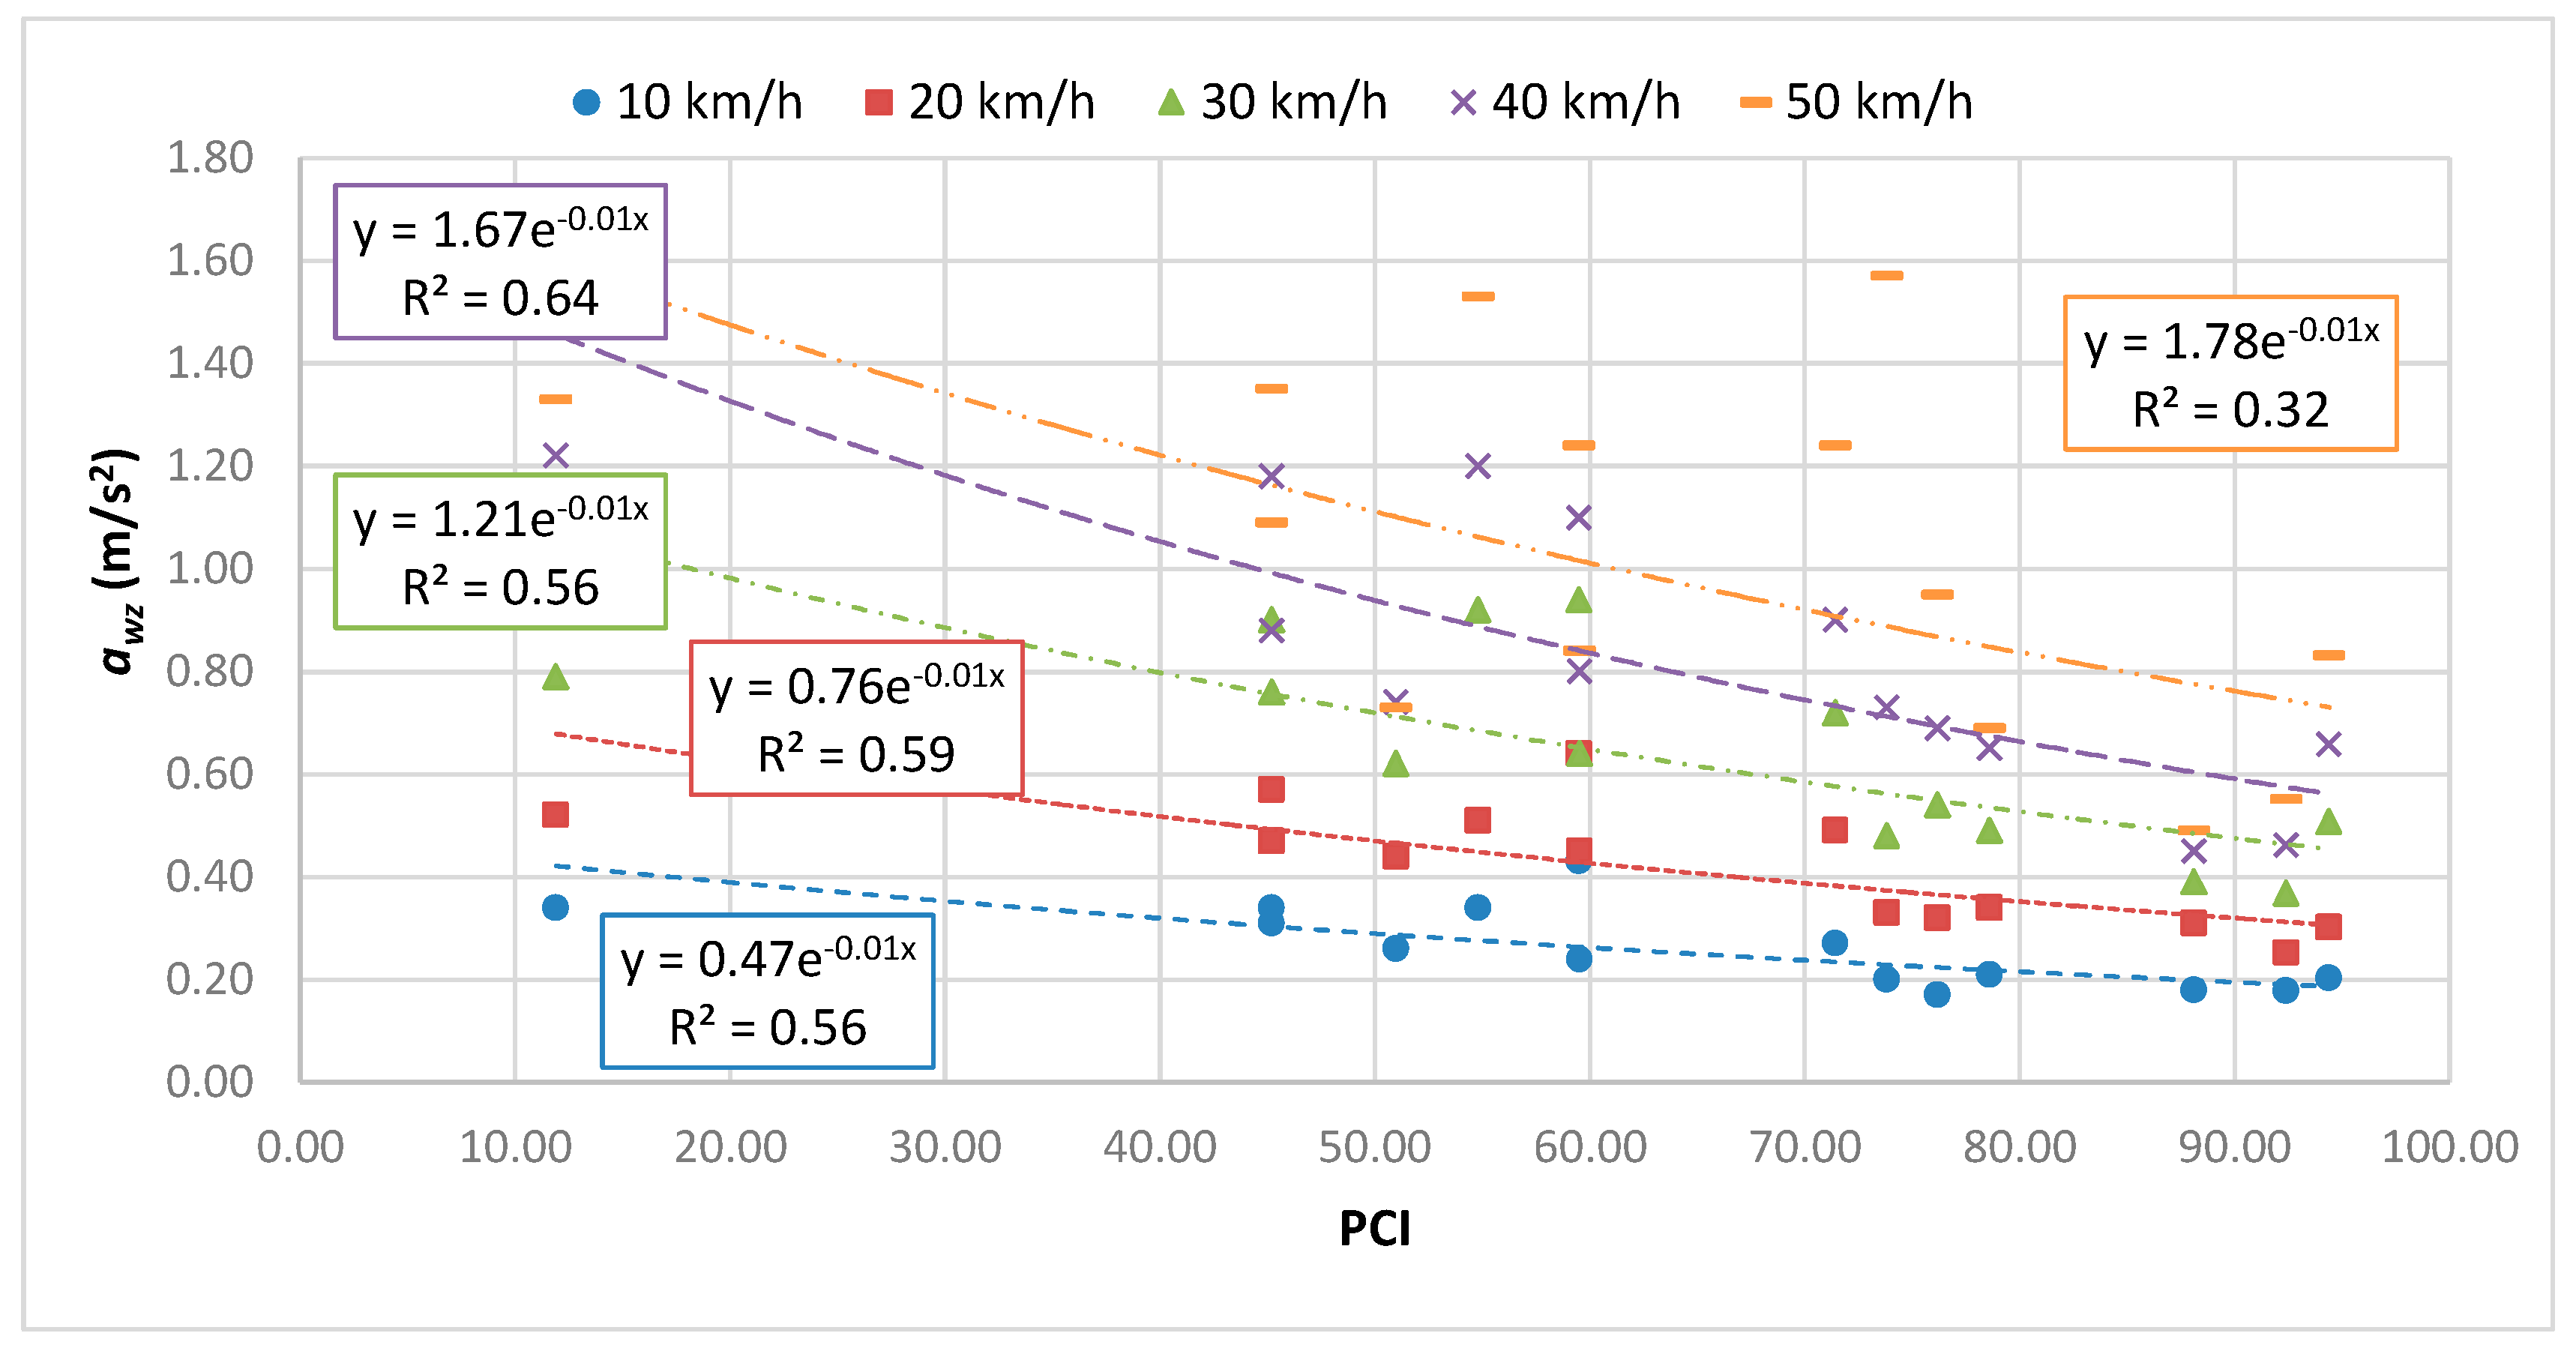
Figure 11.
Correlation coefficient R2 as function of traveling speed used for awz calculation.

Figure 12.
Estimation of ride quality on new or reconstructed Sampietrini pavements (PCI > 85).

Figure 13.
Speed related IRI thresholds.
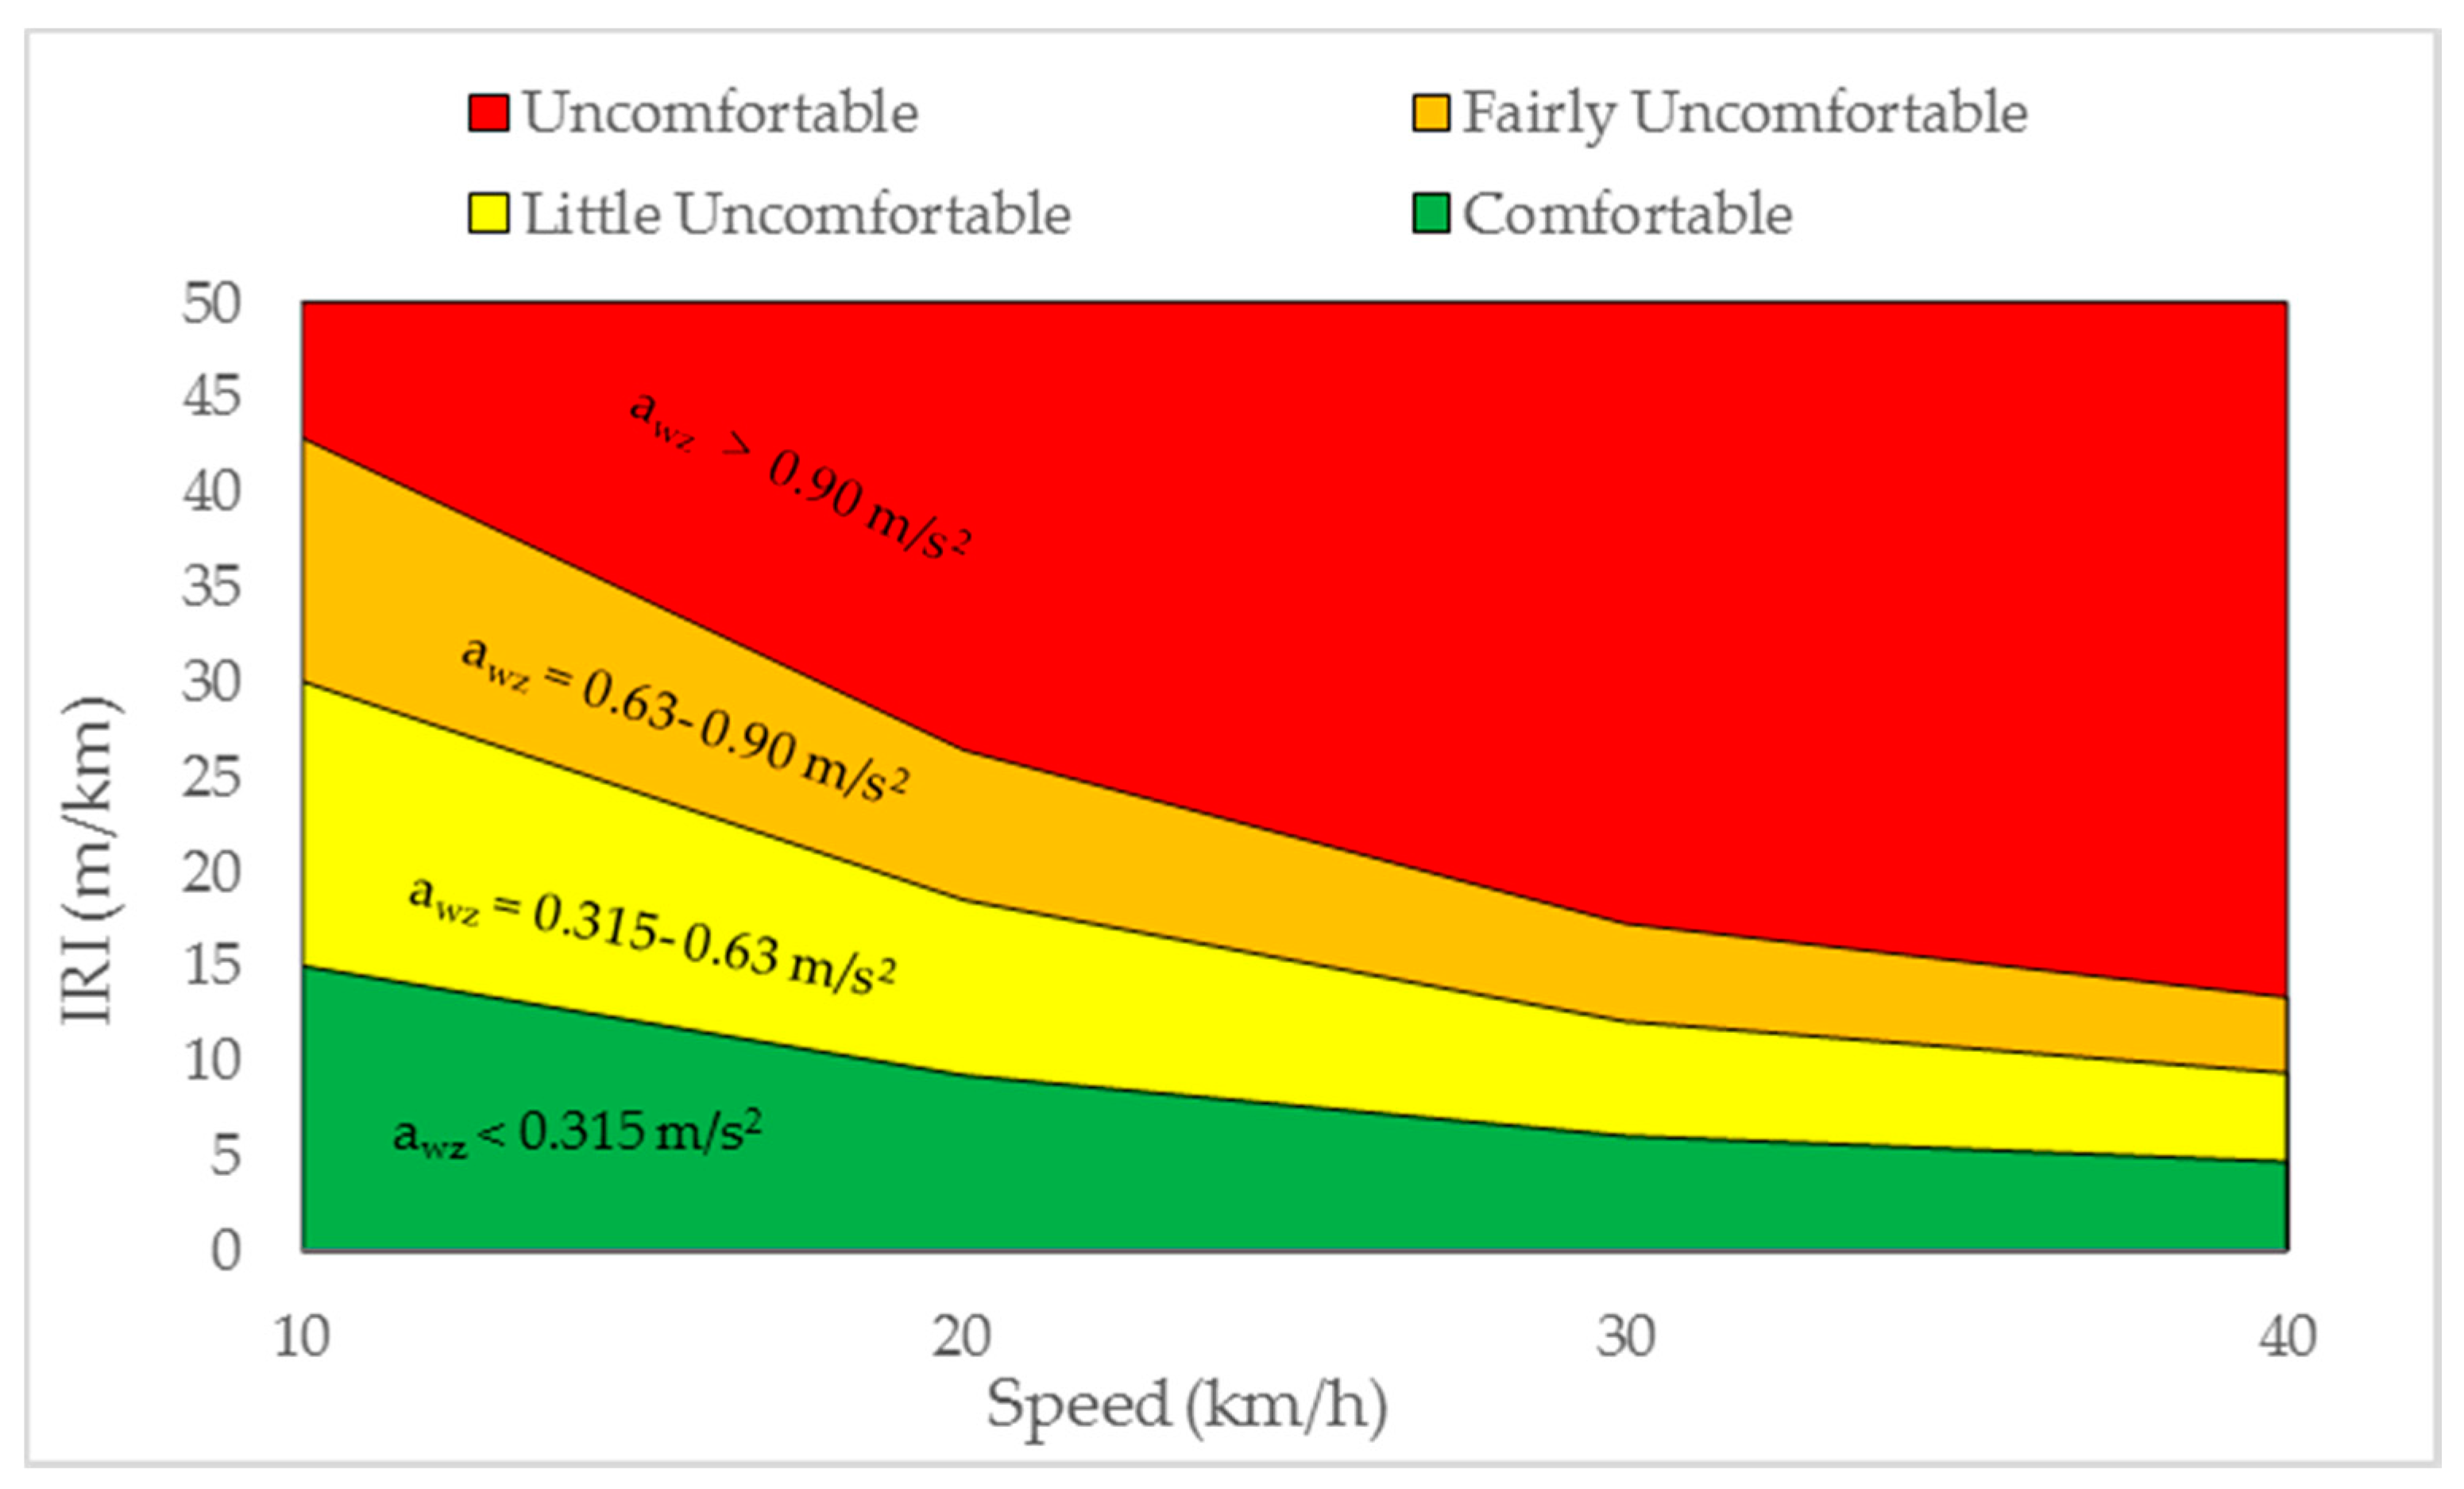
Figure 14.
Speed related PCI thresholds.

Table 1.
Mechanical properties of basalt used for Sampietrini.
| Material Property | Value |
|---|---|
| Young’s modulus (GPa) | 37–60 |
| Poisson ratio (-) | 0.15–0.38 |
| Compressive resistance (MPa) | 241–320 |
| Flexural resistance (MPa) | 32–75 |
| Tensile resistance (MPa) | 18–20 |
Table 2.
Standard PCI rating scale.
| PCI | Verbal Rating |
|---|---|
| 86–100 | Good |
| 71–85 | Satisfactory |
| 56–70 | Fair |
| 41–55 | Poor |
| 26–40 | Very Poor |
| 11–25 | Serious |
| 0–10 | Failed |
Table 3.
List of distresses proposed for Sampietrini pavements.
| Distress ID. | Description |
|---|---|
| 101 | Damaged Sampietrini |
| 102 | Depressions |
| 103 | Edge restraint |
| 104 | Excessive joint width |
| 105 | Faulting |
| 106 | Heave |
| 108 | Joint sand loss/pumping |
| 109 | Missing Sampietrini |
| 110 | Patching |
| 111 | Rutting |
Table 4.
Comfort levels related to awz threshold values proposed by ISO 2631 for public transport.
| awz Values (m/s2) | Comfort Level |
|---|---|
| <0.315 | Not uncomfortable |
| 0.315–0.63 | A little uncomfortable |
| 0.5–1 | Fairly uncomfortable |
| 0.8–1.6 | Uncomfortable |
| 1.25–2.5 | Very uncomfortable |
| >2 | Extremely uncomfortable |
© 2017 by the authors. Licensee MDPI, Basel, Switzerland. This article is an open access article distributed under the terms and conditions of the Creative Commons Attribution (CC BY) license (http://creativecommons.org/licenses/by/4.0/).
Share and Cite
MDPI and ACS Style
Zoccali, P.; Loprencipe, G.; Galoni, A. Sampietrini Stone Pavements: Distress Analysis Using Pavement Condition Index Method. Appl. Sci. 2017, 7, 669. https://doi.org/10.3390/app7070669
AMA Style
Zoccali P, Loprencipe G, Galoni A. Sampietrini Stone Pavements: Distress Analysis Using Pavement Condition Index Method. Applied Sciences. 2017; 7(7):669. https://doi.org/10.3390/app7070669
Chicago/Turabian StyleZoccali, Pablo, Giuseppe Loprencipe, and Andrea Galoni. 2017. "Sampietrini Stone Pavements: Distress Analysis Using Pavement Condition Index Method" Applied Sciences 7, no. 7: 669. https://doi.org/10.3390/app7070669
Note that from the first issue of 2016, this journal uses article numbers instead of page numbers. See further details here.