
Numerical Investigation of Heat-Insulating Layers in a Cold Region Tunnel, Taking into Account Airflow and Heat Transfer


1
MOE Key Laboratory of Transportation Tunnel Engineering, Southwest Jiaotong University, Chengdu 610031, China
2
Department of Civil Engineering, Southwest Jiaotong University, Emei 614202, China
*
Author to whom correspondence should be addressed.
Appl. Sci. 2017, 7(7), 679; https://doi.org/10.3390/app7070679
Submission received: 30 March 2017
/
Revised: 29 May 2017
/
Accepted: 15 June 2017
/
Published: 1 July 2017
(This article belongs to the Special Issue Advances in Thermal System Analysis and Optimization)
Abstract
:In cold regions, heat-insulating layers play a crucial role in frost prevention in tunnels. This paper presents a numerical study on the anti-freezing behavior of a cold region tunnel (the Dege tunnel) with heat-insulating layers. A numerical model based on the temperature field coupling theory is firstly proposed and validated using field test data of the Dege tunnel. Subsequently, a comprehensive parametric study is carried out to investigate the influences of heat-insulating layers on the temperature characteristics of airflows inside the tunnel, the surrounding rock, and the tunnel lining. Furthermore, a numerical investigation based on the proposed numerical model is carried out to propose reasonable design parameters of heat-insulating layers for different velocities of mechanical ventilation, and different heat-insulating materials for cold region tunnels. The numerical results show that using the heat-insulating layer can effectively reduce the heat transfer between the surrounding rock and the airflow inside the tunnel. It is also found that the design parameters for the heat-insulating layer are greatly affected by the tunnel ventilation conditions and heat-insulating materials.
1. Introduction
In cold region tunnels, damages from frost may easily cause cracking, peeling-off and ice-covering of lining systems, which may even lead to more serious consequences, such as tunnel discard. The damages from frost not only cause safety issues for public transportation, but also increase maintenance costs of tunnels during operation. At present, applying heat-insulating layers to tunnel lining surfaces is one of the main methods to prevent damages from frost in tunnels in China, e.g., the Zhegu mountain tunnel, the Daban mountain tunnel, and the Kunlun mountain tunnel. Past studies [1,2] have shown that damages from frost in tunnels are usually observed near tunnel ends, while rarely being found in the middle of tunnels. Using heat-insulating layers can effectively reduce the influence of cold air on the temperature of surrounding rocks and tunnel linings [3,4]. It is also found that using heat-insulating layers is able to ensure the temperature of tunnel linings remain above 0 °C to prevent damages from frost. Thus, applying heat-insulating layers near tunnel ends at certain distances is highly recommended for long tunnels in the cold region.
A large number of studies on heat-insulating technologies for cold region tunnels had been carried out in terms of theoretical developments and engineering applications worldwide. Prior to 1990s, Comini et al. [5] proposed a two-zone model (frozen zone and unfrozen zone) for porous mediums (e.g., soils and rocks) taking into account ice-water phase change. Later in 1991, Lee [6] carried out both theoretical and experimental studies on heat transfer in porous mediums. Based on Lee’s research, Bronfenbrener et al. [7] and Mottaghy et al. [8] proposed a three-zone (frozen zone, freezing zone, and unfrozen zone) model to simulate the freezing process in fine-grained loamy soils. The above-mentioned research results laid a solid foundation for the numerical simulation of the temperature fields in rock mass, taking into account phase change. In recent years, Lai et al. [9] carried out a large number of studies on cold region tunnels used in the Qinghai-Tibet Railway, and proposed a temperature-stress-seepage coupling model, which was later used to analyze the temperature fields of cold region tunnels. In 2002, Zhang et al. [10] investigated the influences of different construction seasons, initial temperatures and heat-insulating materials on the freeze-thaw action of tunnel surrounding rocks. Based on the research results, Zhang et al. [11] subsequently performed a forecast analysis for the refreezing of the thawed permafrost caused by construction reasons in the Fenghuo Mountain tunnel. In 2008, Kawamura et al. [1] established a theoretical formula to predict the temperature distributions inside tunnels, which was used as a theoretical basis for designing the length of heat-insulating layers. Tan et al. [12] improved the three-zone model and established a new temperature-seepage coupling model, which was employed in analyzing the temperature fields in the Galongla mountain tunnel [13]. However, it was found that all the above-mentioned studies mainly focused on 2D numerical models of tunnels without taking into account the influence of airflows.
Studies on the distribution characteristics of airflow temperature fields in tunnels had been carried out by several researchers in recent years. In 1998, Mai et al. [14] studied the influences of ventilation velocity and external air temperatures on airflow temperatures in the Qinling mountain tunnel based on the heat transfer theory. Two years later, He et al. [15] proposed a mathematical model for the heat convection between airflows and surrounding rocks based on turbulence equations, which was used to investigate the temperature distributions of airflows in the Qilian mountain tunnel. They also carefully examined the differences between using turbulence equations and laminar equations. However, all the above studies were focused on the characteristics of airflow temperature fields in tunnels, without considering temperature changes in tunnel linings and surrounding rocks.
As tunnel ventilation is crucial to tunnel operation safety, ventilation systems should satisfy the design requirements for tunnels with different types and different functions. Tunnel ventilation systems are more important for long tunnels, where mechanical ventilation systems are usually required to be applied. Barrow et al. [16] proposed a numerical method to predict the thermal conductivity between trains and tunnel lining surfaces. Barrow et al. [17] also investigated the influences of the air temperature field inside tunnels on the temperature field of surrounding rocks, in which the air temperature was assumed to change following the sine function. Liu et al. [18] performed a study on the temperature fields of the Fenghuo mountain tunnel based on two airflow models (a laminar model and a turbulence model), before verifying numerical results with experimental results. Zhou et al. [19] carried out a numerical study on the heat transfer between surrounding rocks and airflows under the effect of the piston action of trains based on the finite difference method. From the practical point of view, cold air from outside is usually carried by mechanical ventilation systems into tunnels in cold regions, which usually takes away the heat from surrounding rocks and tunnel linings. When an airflow moves from outside to the middle of a tunnel, the airflow temperature increases by absorbing the heat from the surrounding rock and the lining of the tunnel. Particularly, the air temperatures outside tunnels in cold regions are usually very low, which may easily cause damages from frost in tunnel linings near tunnel ends for long tunnels. Therefore, the characteristics of heat transfer between airflows outside tunnels and surrounding rocks should be carefully examined.
This research is based on a real cold region tunnel (the Dege tunnel in Sichuan province), where one-year field test was carried out to investigate the temperature fields of the tunnel lining and the surrounding rock. In the test, temperatures of different measuring points in ten test sections in the tunnel were recorded. In the numerical analysis, a three-dimensional (3D) model was proposed based on the temperature field coupling theory (airflow-lining/heat-insulating layer-surrounding rock). By using the field test data from the Dege tunnel, the accuracy of the proposed numerical model is validated and calibrated. The present study has following highlights: (1) the research involves multi-physical domains, including a solid domain (the tunnel lining and the surrounding rock) and a fluid domain (the airflow); (2) the coupling characteristics of heat transfer between the fluid domain (airflow) and the solid domain (tunnel lining and surrounding rock) are considered carefully in the research; (3) the influences of different mechanical ventilation velocities and different heat-insulating materials on the design parameters for different heat-insulating layers are carefully examined and compared.
2. Temperature Field Coupling Theory (Airflow to Lining/Heat-Insulating Layer to Surrounding Rock)
The calculation domains used for analyzing the temperature fields of a cold region tunnel under ventilation conditions usually involve two physical domains. One domain is a fluid domain formed by the airflow in the tunnel, while the other one is a solid domain formed by the tunnel lining (heat-insulating layer) and the surrounding rock. In the fluid domain, the governing differential equations used to analyze the motion fields and the temperature fields should consist of the energy conservation Equation (1), the mass conservation Equation (2), and the turbulence Equation (3). In the solid domain, the governing differential equation used to analyze the temperature fields is the energy conservation equation. The heat transfer between different physical domains is realized by means of convection through adjacent domain interfaces.
2.1. Theory of Airflow Temperature Field in Tunnel Based on Turbulence Equation
The energy conservation equation employed in analyzing the temperature fields of airflows in a tunnel is expressed by:
where ρ is the air density; Cp is the specific constant pressure heat of air; T is the air temperature; t is the time; Sh is the internal heat; is the thermal conductivity of air; and u is the airflow velocity.
The mass conservation equation used to analyze the temperature fields of airflows inside a tunnel is given by:
In general, the airflow inside a tunnel is usually considered as a three-dimensional unsteady turbulent flow. Theoretically, the distribution of the turbulent airflow field can be obtained straightforwardly by solving the Navier-Stokes equations. However, the computational costs for large-scale numerical problems would be unacceptable. Therefore, the turbulent flow in this study is simulated using a simplified numerical model based on k–ε equations, which are given by:
where μt is given by:
where k is the turbulent kinetic energy; Gk is the turbulent kinetic energy generated by the mean velocity gradient; Gb is the turbulent kinetic energy generated by buoyancy; YM is the contribution of the fluctuating dilatation in compressible turbulence to the overall dissipation rate; Sk and Sε, are user-defined sources; ε is the dissipation rate of turbulent kinetic energy; μ is the dynamic viscosity of air; μt is the turbulent (or eddy) viscosity; and Cε1, Cε2, Cε3, Cμ, σk, and σε are constants.
The convective heat transfer coefficient between the fluid domain and the solid domain can be obtained by using the field measurement method, the empirical method, or the temperature wall function method. The field measurement method is the most straightforward in the three methods, but it highly depends on field conditions, the accuracy of measurement instrumentations, and measurement techniques. Due to this reason, the measurement of the convective heat transfer coefficient may not be accurate and may not always be reliable. Regarding the empirical method, so far, it is very difficult to find a proper mathematical model, which is recognized as the most reliable one by all researchers, although there are many existing mathematical models. For the wall function method, the convective heat transfer coefficient between the fluid domain and the solid domain can be determined based on the turbulent flow model. This means that once the parameters of the turbulent flow model are confirmed, the heat transfer coefficient can be calculated accordingly. It was found that the mesh resolution of the numerical model may affect the accuracy of the convective heat transfer coefficient, but this influence can be largely reduced after using a finer meshing scheme and doing the re-mesh procedure. Therefore, it is believed that adopting the wall function method would provide a reliable and reasonable prediction for the convective heat transfer coefficient, which is also used by other researchers [2,20]. The convective heat transfer coefficient between the fluid domain and the solid domain inside the tunnel can be calculated by the temperature wall function formulations [21], which are given by:
where T* is the dimensionless temperature; Tp is the temperature at the first near-wall node; Tw is the temperature of the wall surface; kp is turbulent kinetic energy at the first near-wall node; yp+ is the normalized distance from the first point of fluid domain to the wall surface; yTp+ is the non-dimensional thermal sub-layer thickness; Pr is the Prandtl number; Prt is the turbulent Prandtl number; up is the mean velocity of the fluid at the near-wall node; uc is the mean velocity magnitude at yp+ = yTp+; E = 9.793 is an empirical constant; and κ = 0.4187 is von Kármán constant.
2.2. Analytical Theory for Temperature Fields of Tunnel Lining and Surrounding Rock
The governing differential equation for the temperature fields of the solid domain (tunnel lining/heat-insulating layer and surrounding rock) is expressed as:
where Ceq, Ts, λeq and Q are the equivalent heat capacity, temperature, equivalent thermal conductivity and internal heat source for the tunnel lining/heat-insulating layer or the surrounding rock, respectively.
At present, the enthalpy method and the apparent heat capacity method are widely used in finite element analyses of phase change problems in rocks and soil. Both of these two methods are able to provide an accurate prediction for the phase change process. In the enthalpy method, it is usually required to carry out an experiment to obtain an accurate enthalpy function. In the current research, the experiment was not carried out, which means that the accurate enthalpy function is not available. Thus, it is more convenient to use the apparent heat capacity method instead of the enthalpy method. Besides, the accuracy of the apparent heat capacity method in analyzing phase change problems in surrounding rocks and soil has been verified by past studies [9,10,19]. However, it should be noted that the equivalent heat capacity increases rapidly in the apparent heat capacity method, which may lead to difficulties and errors in the finite element analysis of phase change problems, especially when the phase transition range is small. The apparent molar heat capacity method proposed by Bonacina et al. [22] was employed to simulate phase change in the solid domain (tunnel lining/heat-insulating layer and surrounding rock) in a tunnel. Furthermore, the heat capacity of frozen zone (Cf), the heat capacity of unfrozen zone (Cu), the thermal conductivity in frozen zone (λf), and the thermal conductivity in unfrozen zone (λu) are assumed to not depend on the temperature of different domains (T), while the phase change process is usually assumed to occur within a certain temperature range, (Tm ± ΔT). The expressions of the equivalent heat capacity and the equivalent thermal conductivity for tunnel linings/heat-insulating layers and surrounding rocks are given as:
where Cu and Cf are the respective heat capacities of the frozen and unfrozen zone; λf and λu are the respective thermal conductivities of the frozen and unfrozen zone, and L is the latent heat of phase change of the water-bearing surrounding rock.
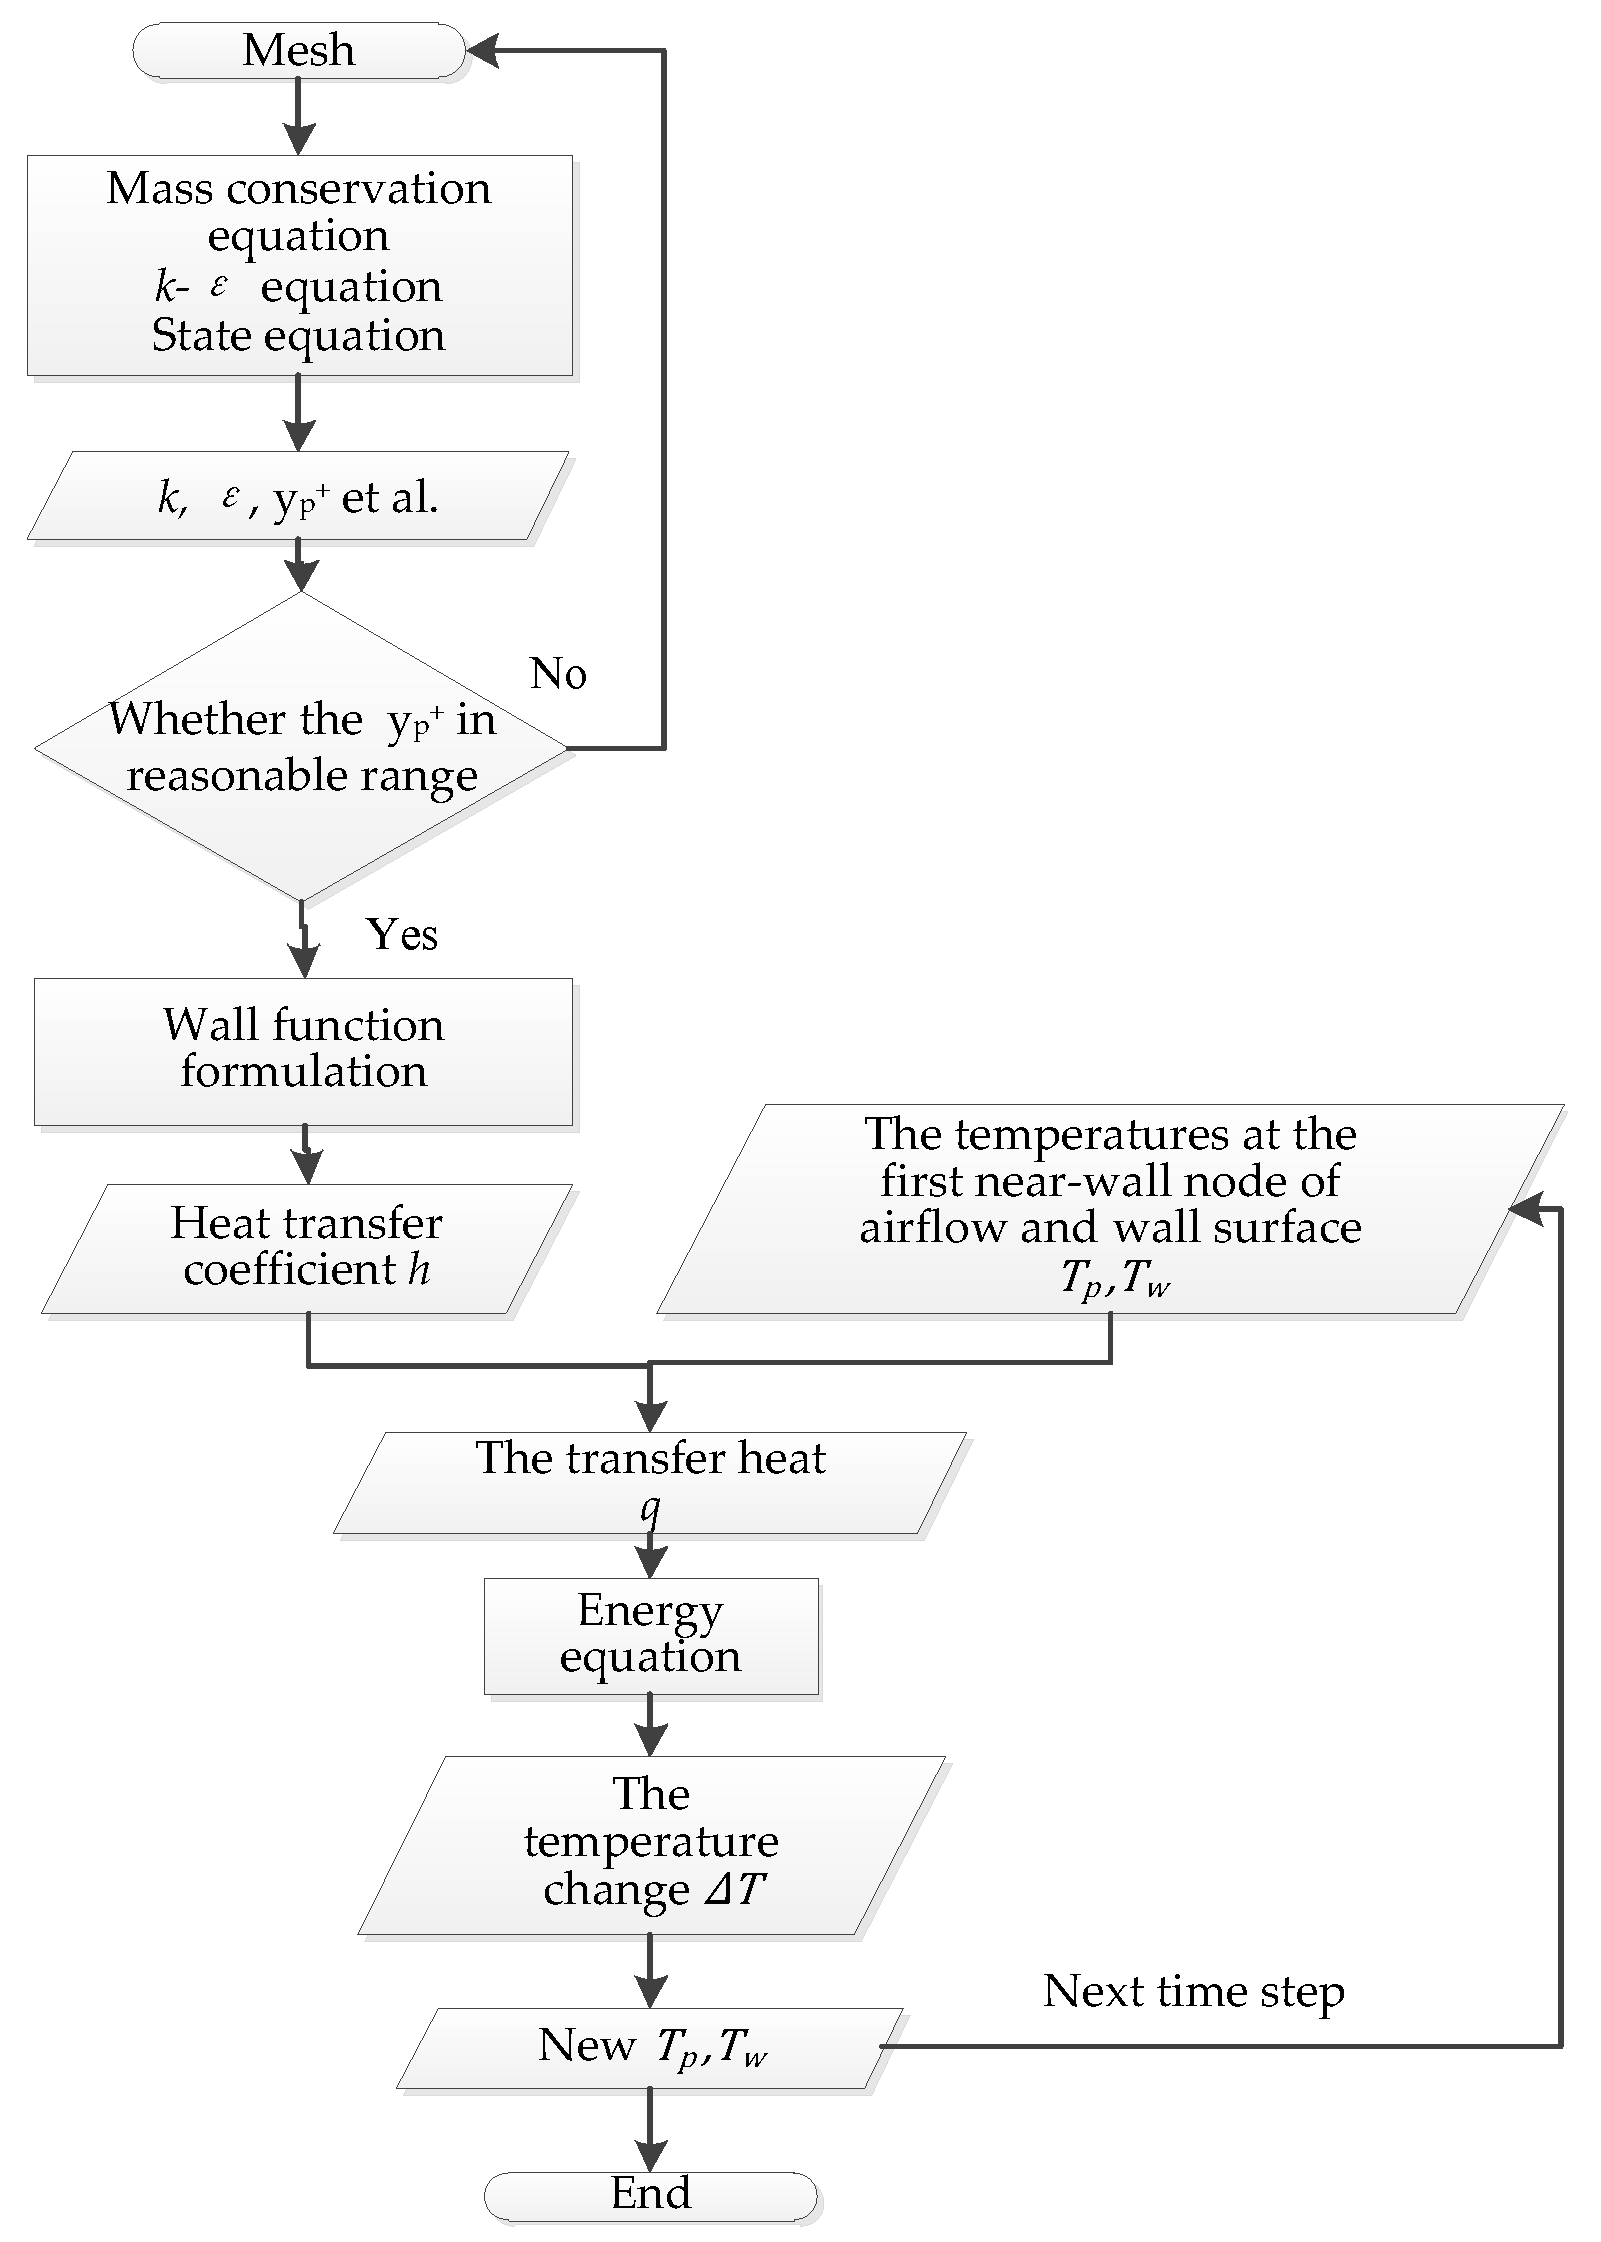
Based on the above discussions, it is found that the convective heat transfer coefficient is the key factor to analyze the coupling heat transfer between different physical domains. It should be known that the computed convective heat transfer coefficient is not only related to flow parameters, but also affected by mesh resolutions. Thus, the employed numerical model requires a proper meshing scheme to ensure an appropriate grid size in the near-wall regions. Firstly, the heat transfer coefficient (h) is calculated based on the turbulent kinetic energy (k), the dimensionless temperature (T*), and the normalized distance from the first point of the fluid domain to the wall surface (yp+). Subsequently, the convective heat (q) can be calculated according to the air temperature near the tunnel lining surface (Tp), the temperature of the lining surface (Tw). And then the change of temperature (ΔT) can be obtained. After that, a new time step is carried out based on the new airflow temperature near the tunnel lining (Tp) and the new temperature of the tunnel lining surface (Tw). The flowchart of the coupling heat transfer calculation is shown in Figure 1.
3. Field Test of the Dege Tunnel
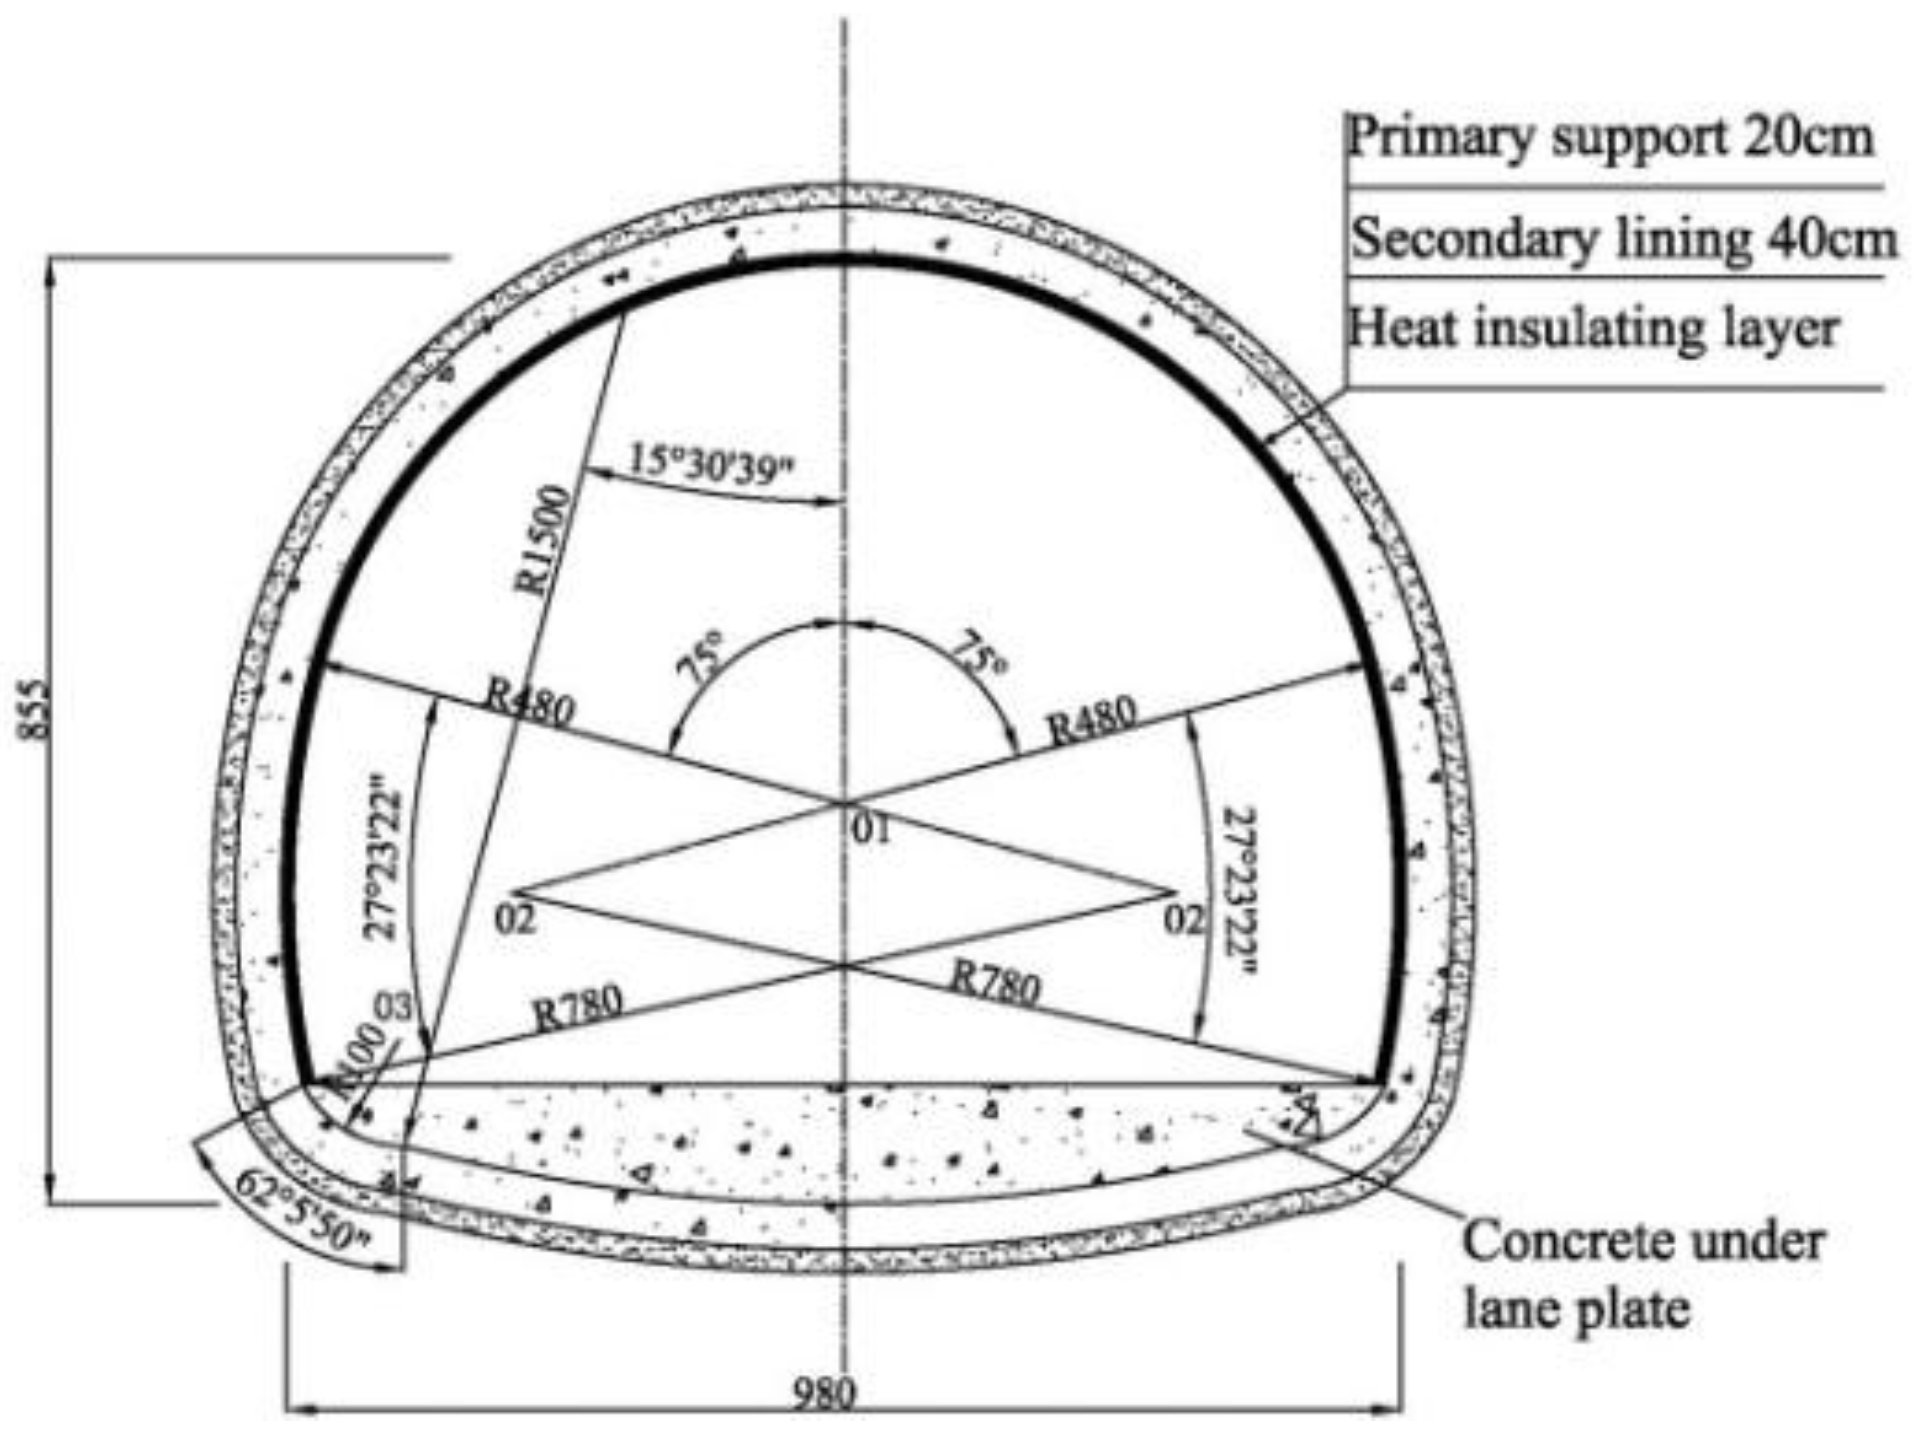
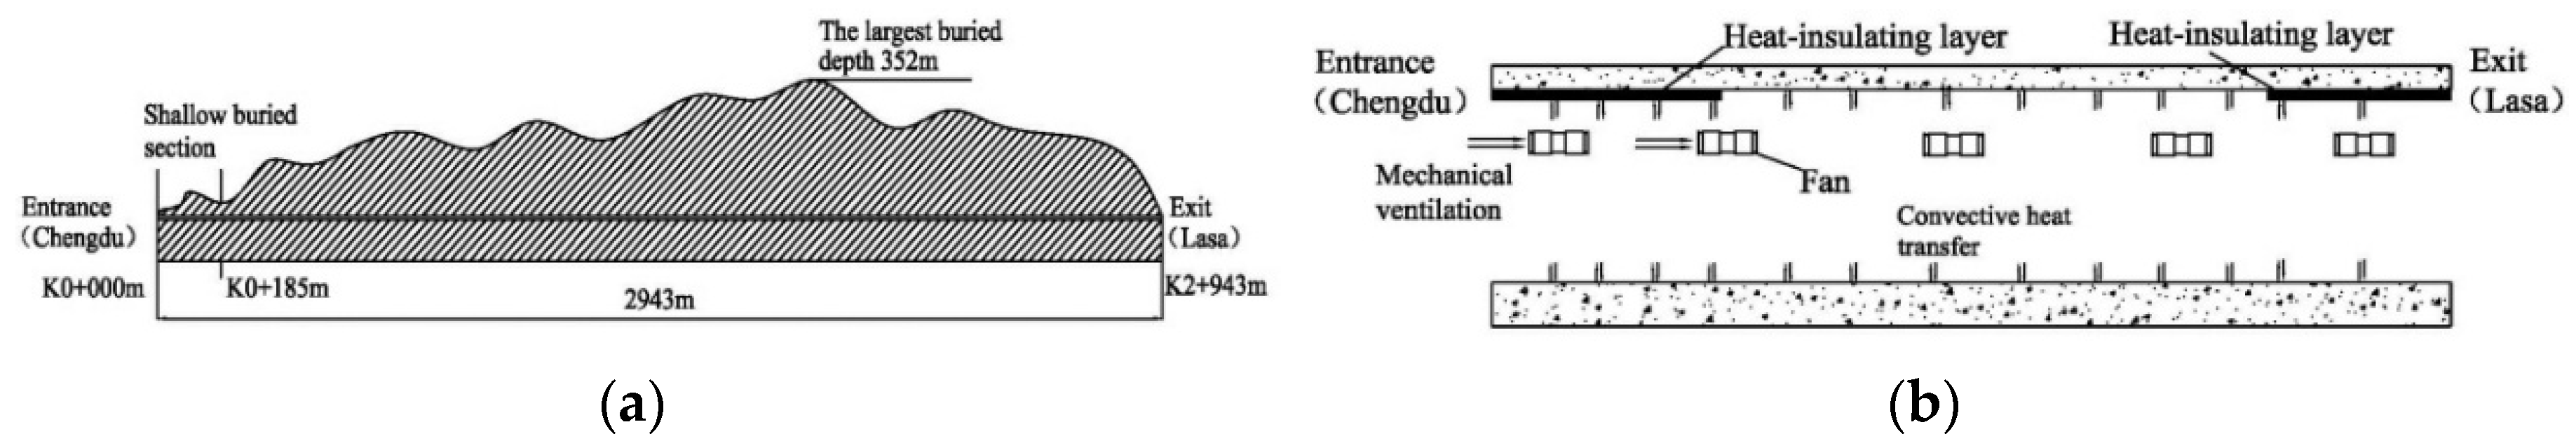
The Dege tunnel is located in a high-altitude area in the west of Sichuan province in China. This tunnel was constructed with a length of 2943 m, while the surrounding rock of the tunnel is quartz rock. Detailed descriptions of the Dege tunnel are shown in its cross-section in Figure 2. The thickness of the secondary lining and the primary support are 40 cm and 20 cm, respectively. Detailed descriptions of the longitudinal section of the tunnel and the air-lining heat transfer coupling model are shown in Figure 3. The mileage at the tunnel entrance (near Chengdu) is set as zero, and the entrance is set as zero point, which is given the name of K0 + 000 m. In the Dege tunnel, from K0 + 000 m to K0 + 185 m is a shallow-buried section with an average buried depth of 35 m, while from K0 + 185 m to K2 + 943 m is a deep-buried section with an average buried depth of 250 m. The tunnel altitude is 3282 m, and the average annual temperatures measured at the entrance and the exit are −0.85 °C and −0.45 °C, respectively. As the tunnel is a single-arch tunnel with two traffic lanes, a mechanical ventilation system is operated from 07:00 to 19:00, with a ventilation velocity of 5 m/s according to the safety guidelines, while the natural ventilation starts from 19:00 to 07:00.
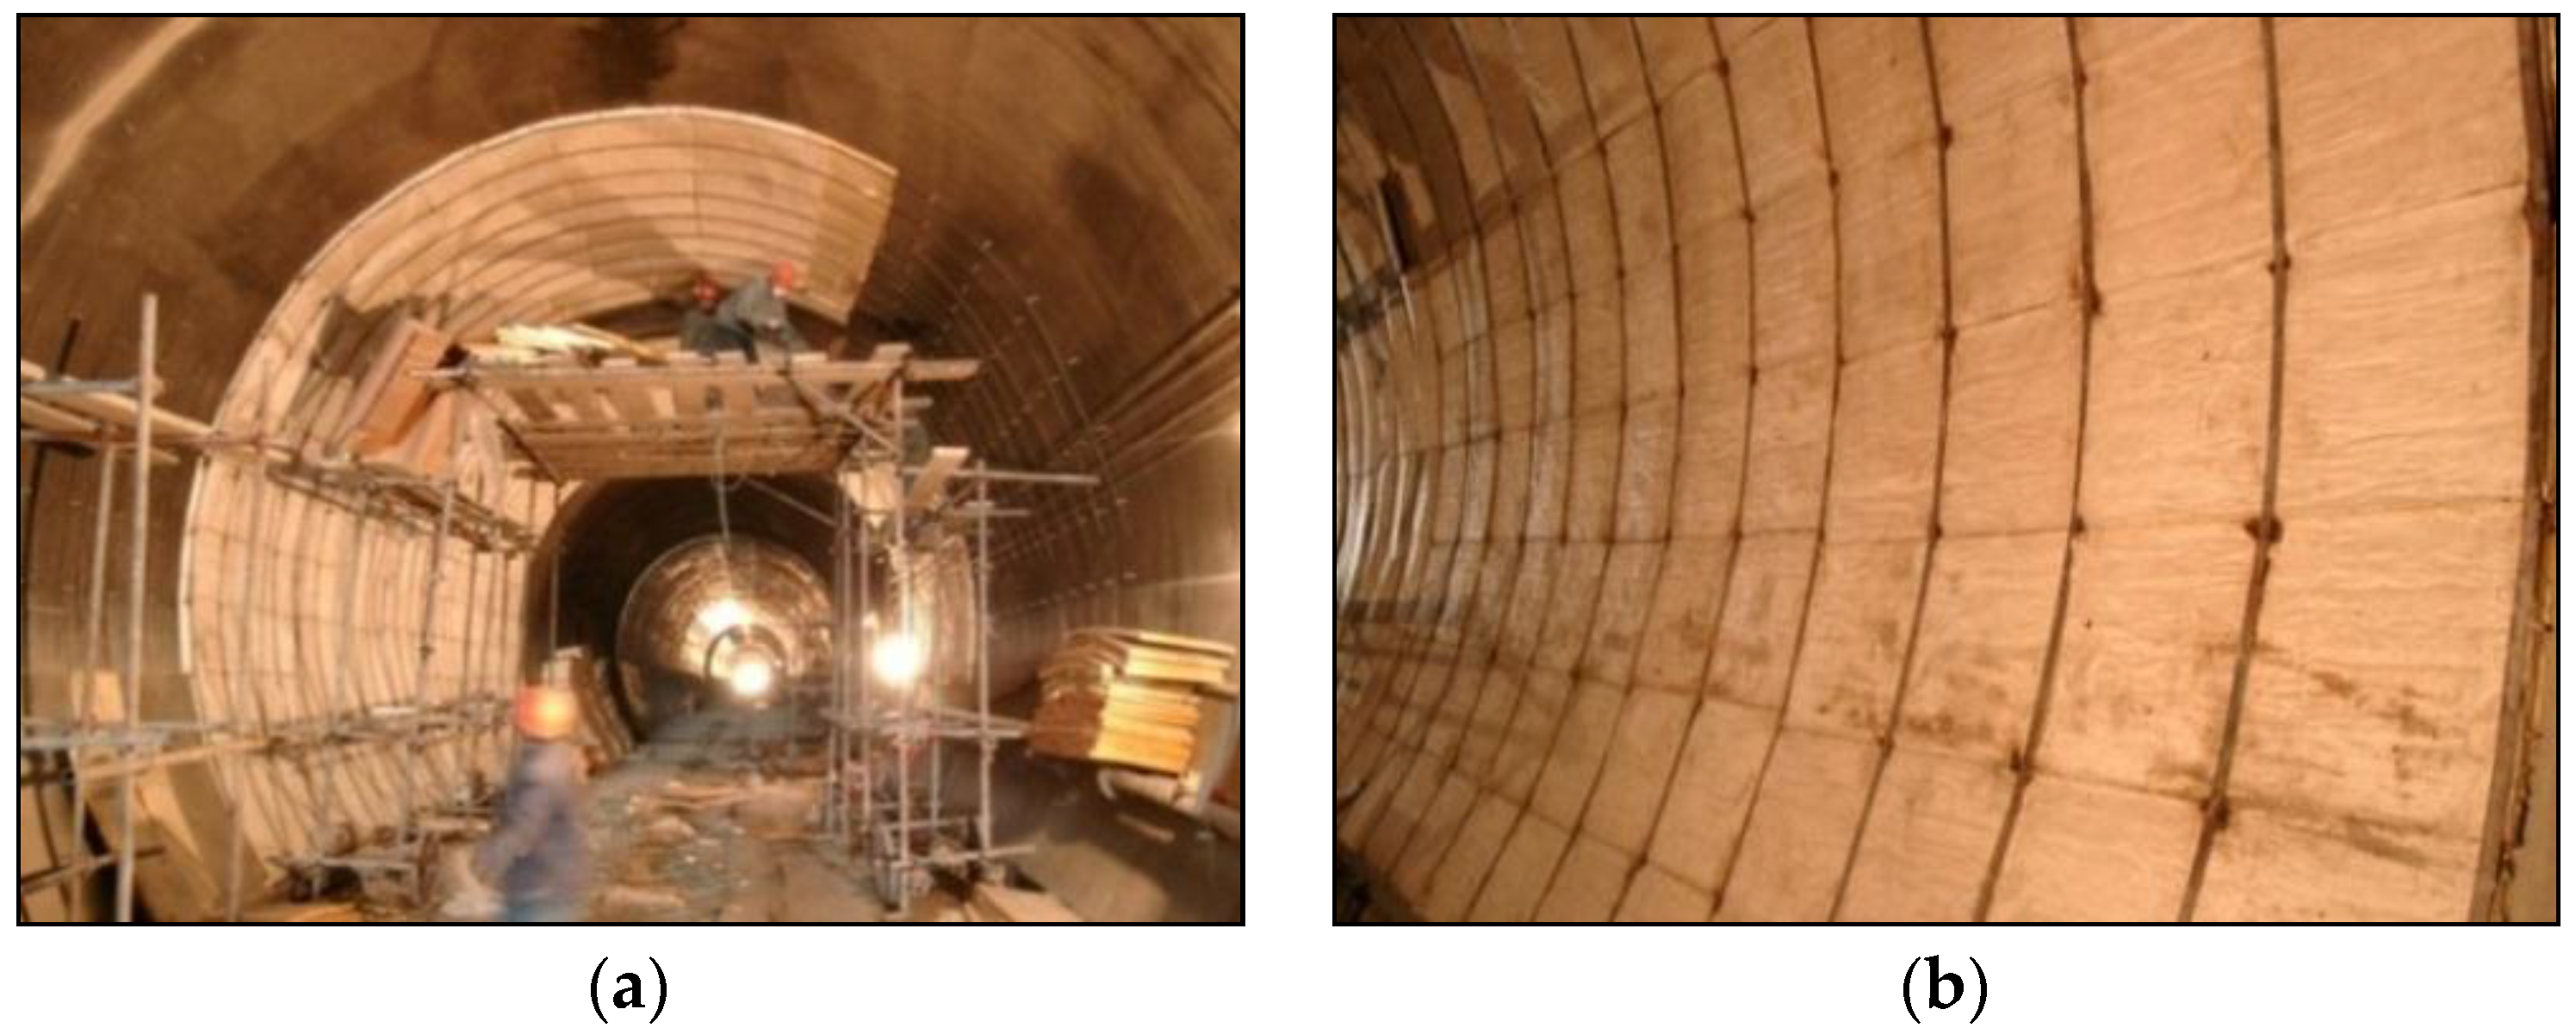
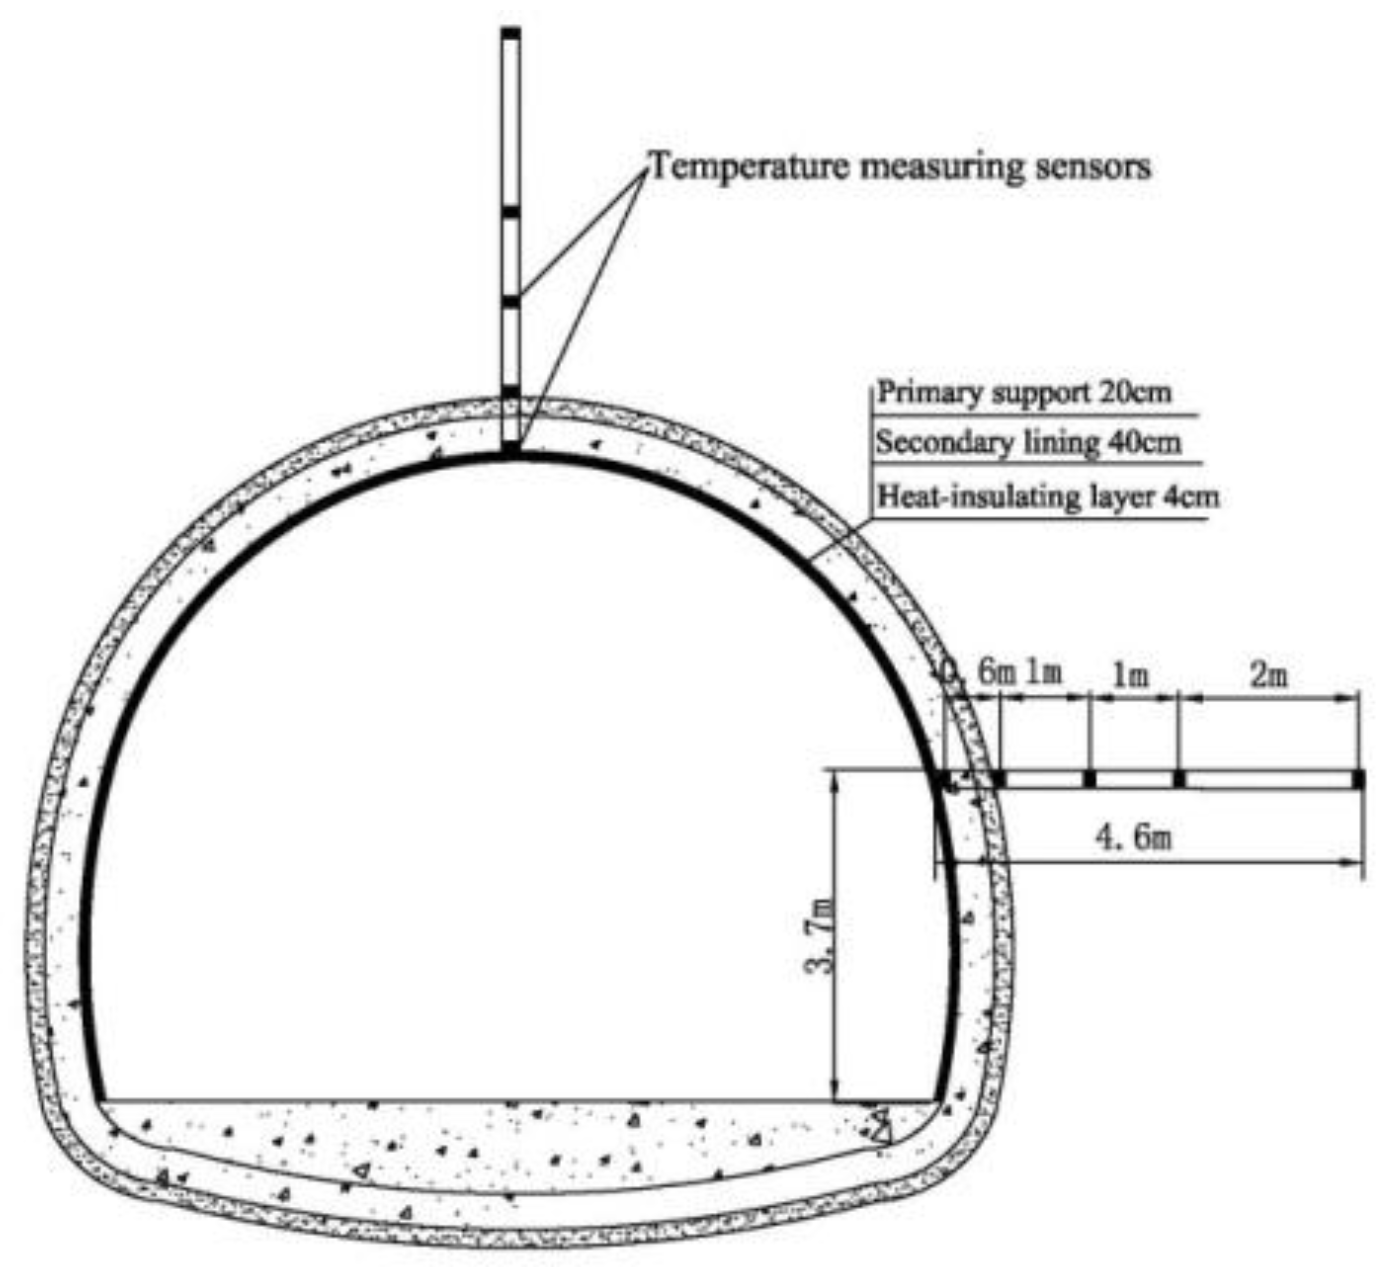
In the Dege tunnel construction, a 4 cm heat-insulating layer made of FLOLIC material (an organic composite material made by Si Chuan Fookloong Insulation Supplies Co. Ltd, China) was applied at the entrance and the exit, with a 700 m length and a 600 m length, respectively. Figure 4 shows the installation process of the heat-insulating layer in the Dege tunnel. A one-year field test (from January 2016 to December 2016) was carried out to investigate the anti-freezing effectiveness of the heat-insulating layer in the tunnel. In total, there were ten test sections locating at 15 m, 115 m, 215 m, 415 m and 715 m from the opening at the entrance and the exit of the tunnel. In order to measure temperatures of the tunnel lining and the surrounding rock, there were two measuring holes for each test section in the vault and the spandrel respectively. The temperature sensor used in the field test was resistance wire temperature sensor, which was customized with high sensitivity. Temperatures of different positions in the tunnel were obtained by measuring the resistance of the temperature sensors with multi-meters. The temperature sensors and the measuring holes used in the field test are shown in Figure 5. In each test hole, there were five temperature sensors. The first one was placed on the surface of the secondary lining, while the last one was placed in the surrounding rock with buried depth of 4 m (taking the back surface of the tunnel lining as 0 m buried depth). The layout of the measuring holes and the temperature sensors is shown in Figure 6. The field test was carried out four times per day and the measurements were calculated as the average temperatures per half month. Detailed field test data is presented in the test-numerical comparisons, as shown in Section 4.2.
4. Numerical Analysis of Dege Tunnel
4.1. Model Description
A three-dimensional coupling heat transfer model of the Dege tunnel is proposed to offer a more thorough understanding of the anti-freezing behavior of the heat-insulating layer employed in the tunnel. It was found in the field test that there was no main flow direction under the natural ventilation condition, and the velocity of the natural ventilation changed significantly even within the same day. In order to save computational costs in the numerical analysis, the changes of the natural ventilation velocity are ignored in the proposed numerical model. The velocity of the natural ventilation is considered as a constant value of 2.5 m/s, which is the average velocity calculated in the field test. Besides, the natural ventilation direction in the proposed model is assumed to change every other day. This assumption was made because no dominant natural ventilation direction was found in the field test, and the two flow directions (from the entrance to exit and from the exit to entrance) each accounted for about half time in the tunnel operation. The numerical model is established by using the fluid dynamic software FLUENT (ANSYS Inc., Canonsburg, PA, US). Establishing a three-dimensional numerical model according to the actual buried depth of the Dege tunnel is very difficult because the computational cost is significant. Thus, it is necessary to propose an appropriate numerical model to ensure the numerical accuracy with reasonable simplifications. The three-dimensional temperature field coupling model for the Dege tunnel is proposed based on the measured ground temperature and the ground temperature gradient. The numerical model is divided into a shallow-buried section and a deep-buried section, which is the same as the actual tunnel. According to field measurements, the ground temperature in the tunnel is 11.5 °C, and the ground temperature gradient is 6% for the shallow-buried section. For the deep-buried section, the ground temperature and ground temperature gradient are 15 °C and 2%, respectively.
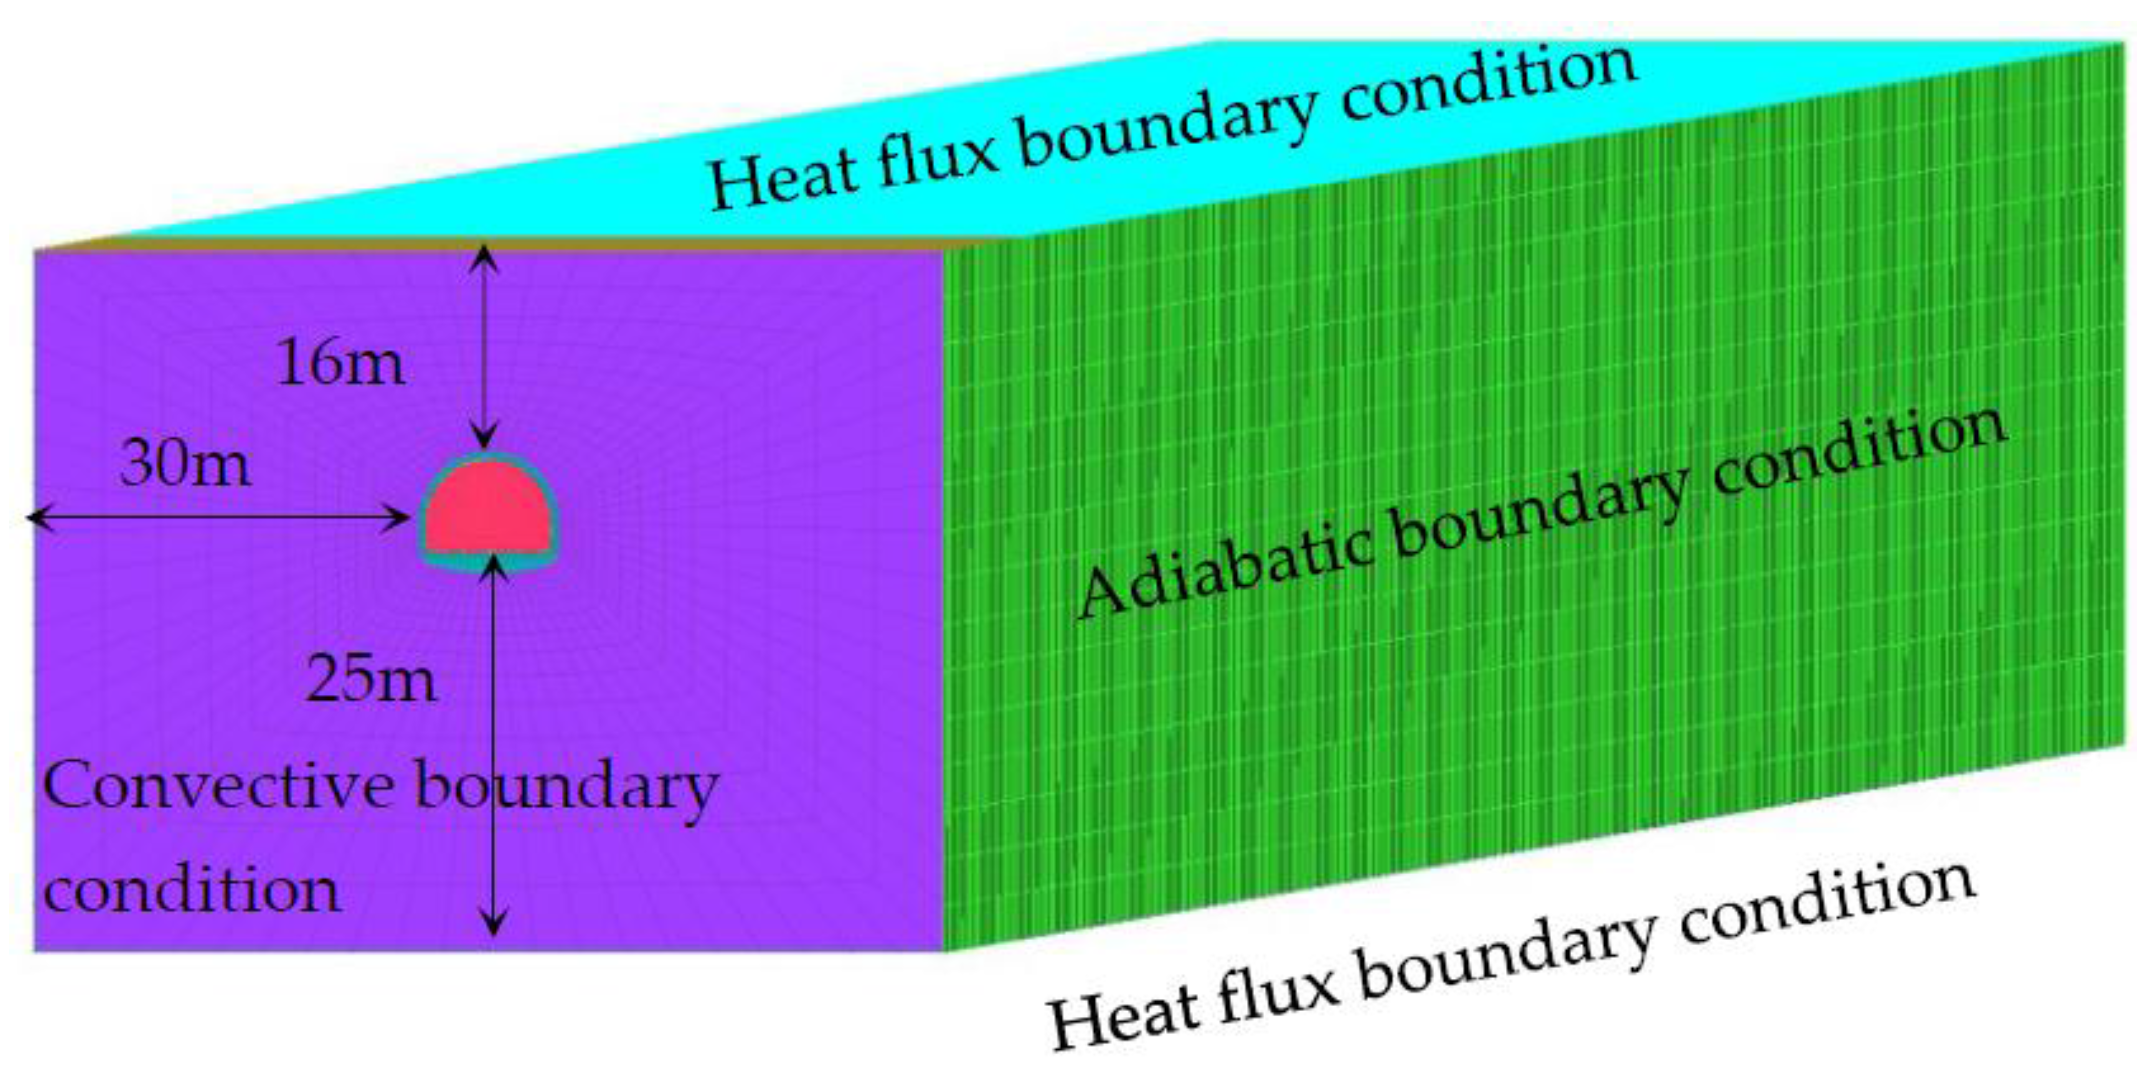
The length, width and height of the proposed model are 2943 m, 70 m and 53 m, respectively, as shown in Figure 7. The left and right boundaries of the model are far enough from the tunnel, and the heat fluxes on the boundaries have only a minor effect on the tunnel temperature fields. Thus, the left and right boundary conditions of the model are assumed as adiabatic [11], while the upper and lower boundaries are assumed as heat flux boundaries. The heat flux is calculated according to the thermal conductivity of surrounding rock and the geothermal gradient. The heat flux of the lower boundary is 0.114 w/m2 for the shallow-buried section, while 0.038 w/m2 for the deep-buried section. On the other hand, the heat flux of the upper boundary is −0.114 w/m2 for the shallow-buried section while −0.038 w/m2 for the deep-buried section. The front and back boundaries are assumed as convective boundaries with the convection coefficient of 15 w/m2∙k [23].
In the proposed model, 340,676 hexahedral elements are used to represent the air in the tunnel, the surrounding rock and the tunnel lining. The k-ε equations are applied to the turbulence model, where the constants Cε1, Cε2, Cμ, σk and σε are taken as 1.44, 1.92, 0.09, 1.0 and 1.3, respectively. The air is assumed to be incompressible, and its density is obtained based on the altitude and the average annual temperature of the tunnel region with a value of 0.86 kg/m3 [24]. The specific heat capacity, thermal conductivity and the viscosity of the air are taken as 1005 J/kg∙°C, 0.02 w/m∙°C, and 1.72 × 10⁻⁵ kg/m∙s, respectively. According to the experimental measurements and mathematical calculations, the thermal physical parameters of the surrounding rock, the concrete material and the heat-insulating material (FLOLIC) are employed in the numerical study as listed in Table 1.
According to the meteorological data of the Dege tunnel, the daily temperature variation at the tunnel entrance (near Chengdu) can be fitted to:
where is the daily mean temperature (°C) and t is time (hour).
The daily temperature variation at the tunnel exit (near Lasa) can be fitted to:
The daily mean temperature variation at the tunnel entrance (near Chengdu) in one year can be fitted to:
The daily mean temperature variation at the tunnel exit (near Lasa) in one year can be fitted to:
4.2. Model Validation
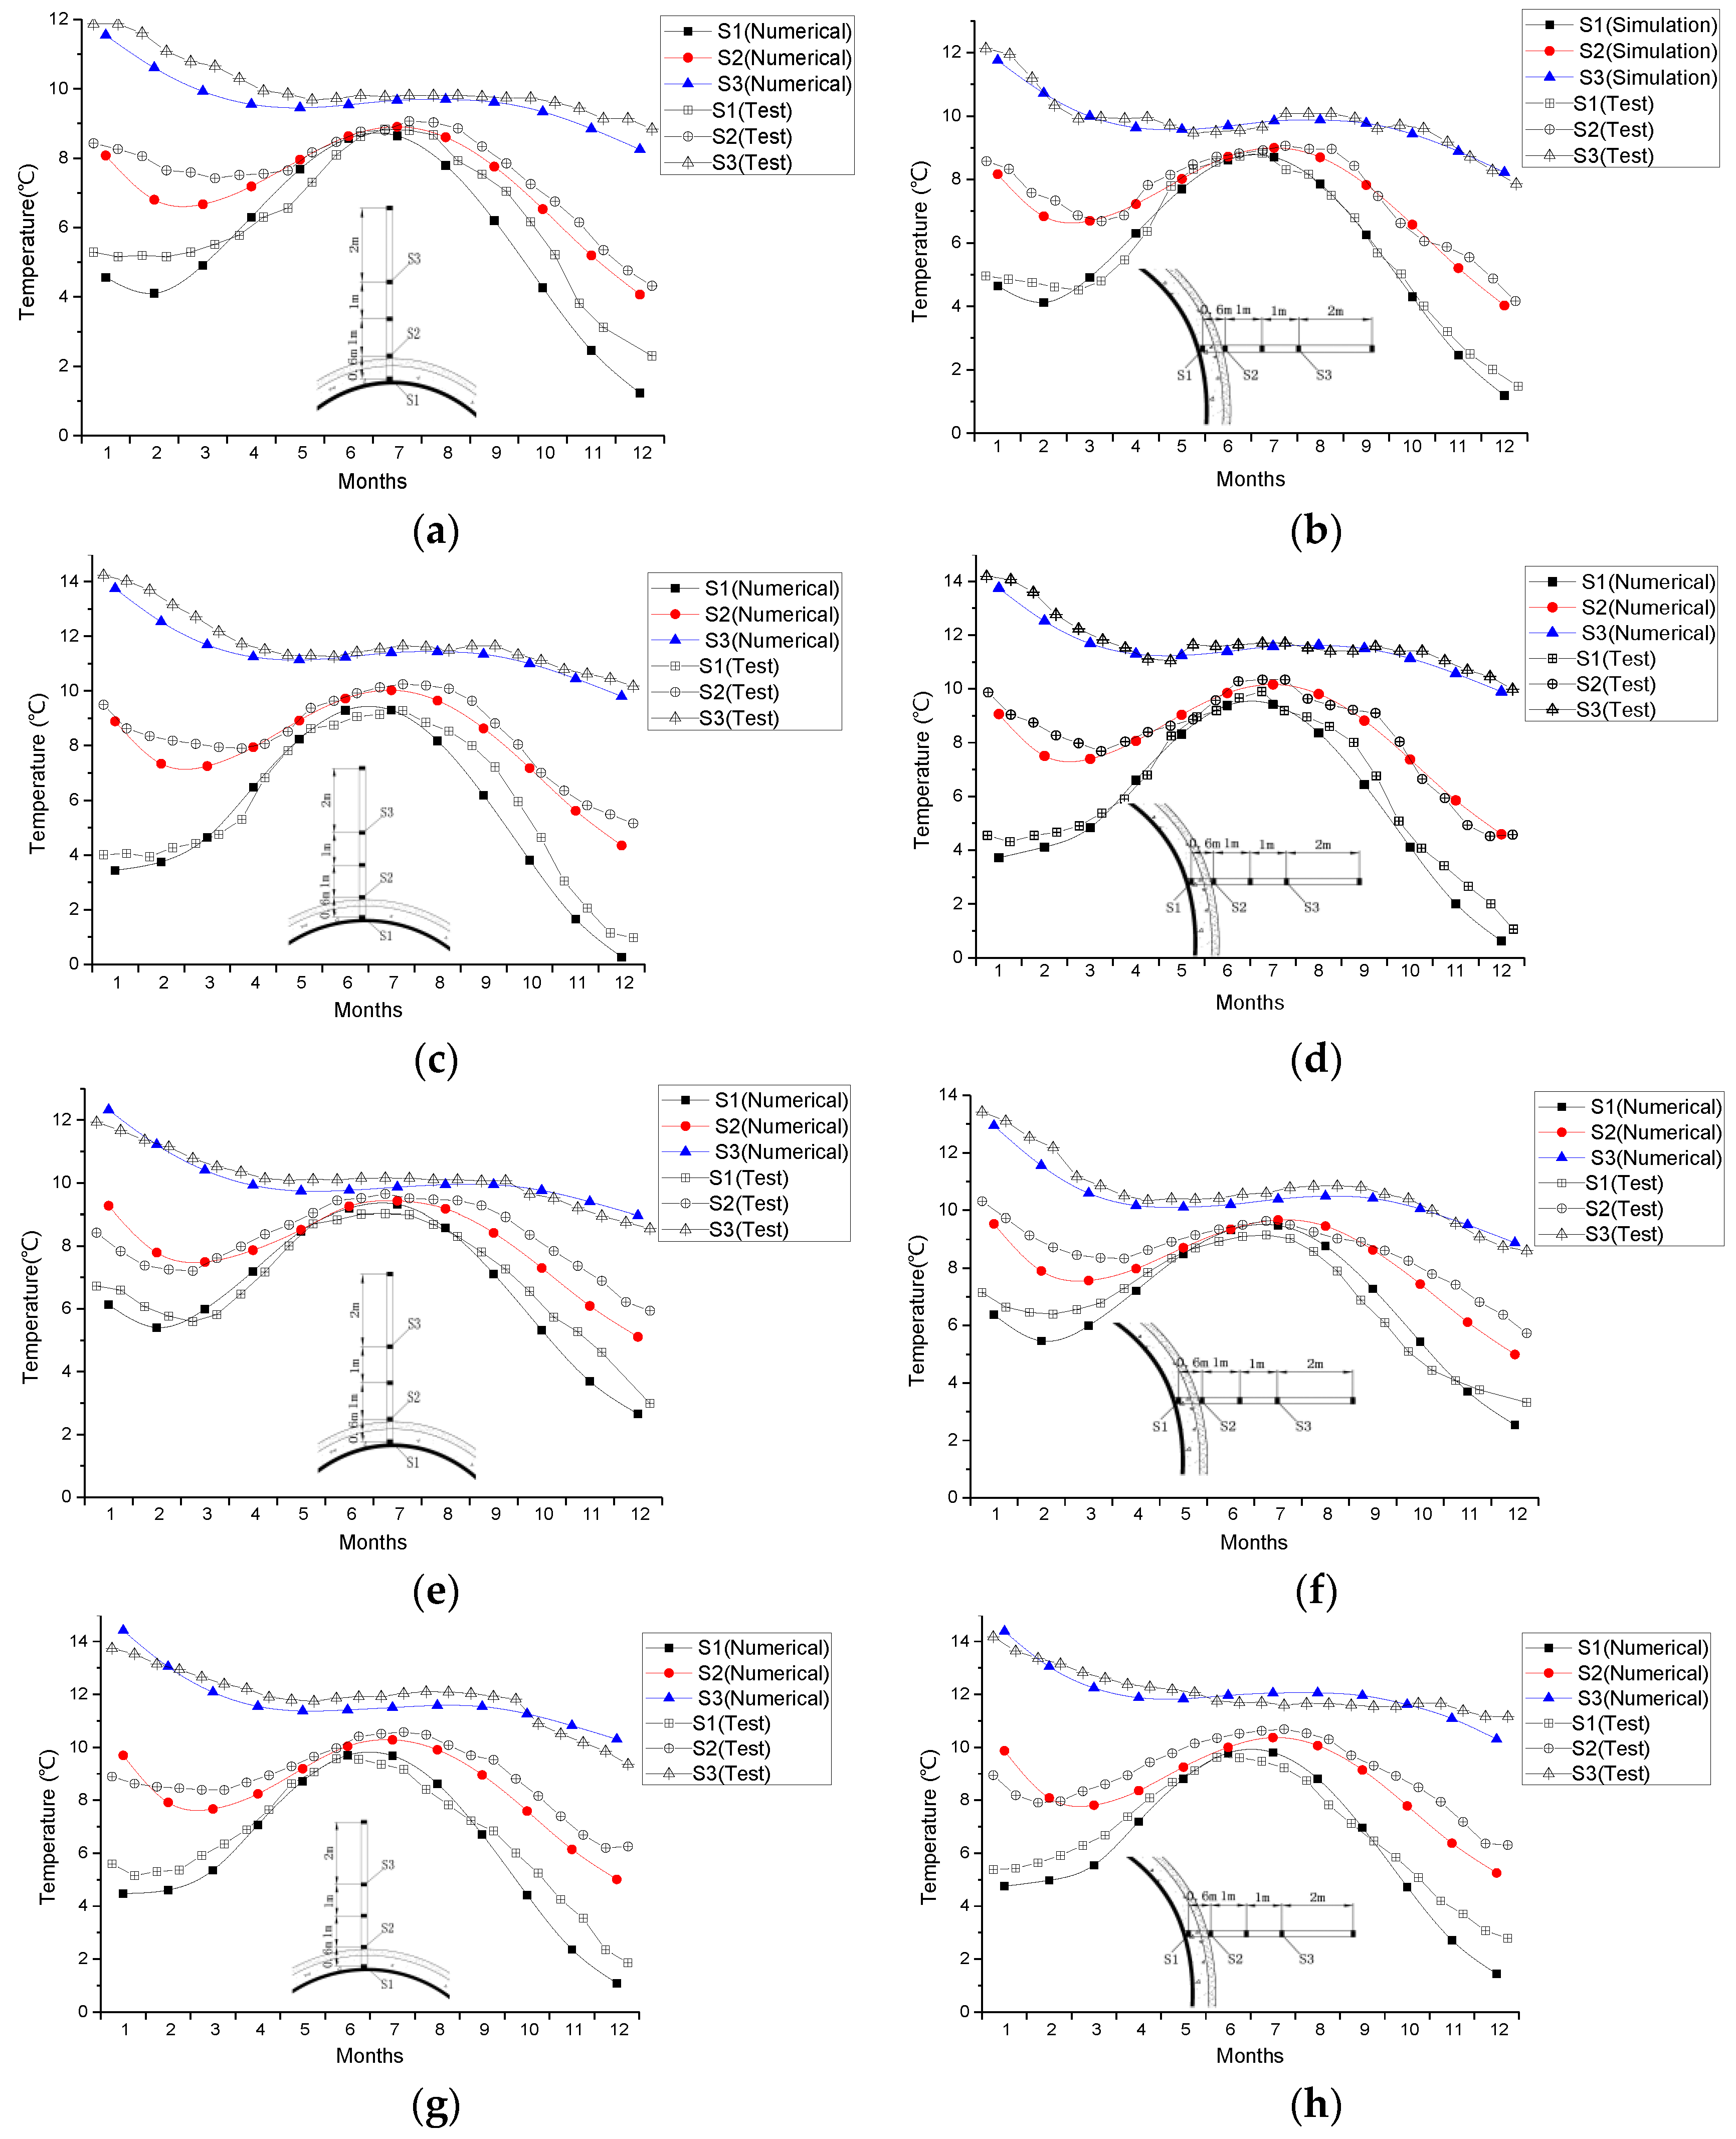
In order to verify the accuracy of the proposed numerical model, test-numerical comparisons are carried out in this section. As shown in Figure 8, the field test results and the numerical results of three different test points (S1–S3) at the tunnel vault and the tunnel spandrel in four different cross-sections (C1–C4) are compared. Section C1 and section C2 represent the cross-sections at 15 m and 715 m from the tunnel entrance (near Chengdu), while section C3 and section C4 represent the cross-sections at 15 m and 715 m from the tunnel exit (near Lasa). It should be noted that only C1 and C3 sections are covered by FLOLIC heat-insulating layer. S1 represents the point at the surface of the secondary lining, S2 represents the point at the back of lining (0.6 m from the surface of the secondary lining), and S3 represents the point in the soil domain with a buried depth of 2 m. It should be noted that the numerical results obtained at the test points are the average temperatures for each month, while the test results are the average temperatures for each half month. As shown in Figure 8, the average temperatures of the secondary lining surface are always above 0 °C during the whole year at section C1 and section C3. It indicates that the heat-insulating layer applied on the tunnel entrance and the exit is able to protect the secondary lining from frozen damage. It is also found that the average temperatures measured near the exit are higher than the average temperatures measured near the entrance at the same distance. In general, the test measurements are in reasonable agreement with the numerical predictions in terms of the curve trend and the magnitude of the temperature. It is also found that there are relatively larger differences between the test measurements and the numerical results in cold months (from January to March and from October to December), compared to hot months (from April to September). The deviations between the numerical model and test data are probably due to instrumental/measuring errors. The deviations may be also because the simplifications used in the proposed numerical model, such as ignoring the heat dissipation provided by the transportation vehicles in the tunnel, and the drainage of the tunnel through pipes behind the tunnel lining. As the Dege tunnel is still in trail operation and the traffic flow in the tunnel changes significantly during the service time, it is very difficult to measure the actual heat dissipation from the transportation vehicles in the tunnel. The investigation on the influence of the heat dissipation from the vehicles would be carried out in the future study. There are smaller differences between the test data and the numerical results in the deep surrounding rock compared to those on the surface of the secondary lining.
To further investigate the influence of the heat-insulating layer on temperature fields of cold region tunnels, a parametric study is presented in the following section.
5. Parametric Study
A parametric study is carried out to investigate the influence of the heat-insulating layer on the temperature characteristics of the airflows inside the tunnel, the tunnel lining, and the surrounding rock. The numerical model employed in the parametric study is based on the model validated by the Dege tunnel field test results. Two tunnel models are considered in this section, one is applied with the heat-insulating layer, while the other one is not applied with the heat-insulating layer. For simplicity, the model without the heat-insulating layer is named as Case I, while the model with applying the FLOLIC heat-insulating layer in the similar way as the Dege tunnel is named as Case II. It should be noted that the influence of vehicle driving and exhaust emission are not considered in the following analyses. Furthermore, a 5 m/s mechanical ventilation condition and a 2.5 m/s natural ventilation condition are considered in the following analyses.
5.1. Temperature Characteristics of Airflow inside Tunnel under Ventilation Condition
In order to ensure clear presentation, the airflow temperature fields at the tunnel entrance and the exit with a length of 1000 m are analyzed here instead of the whole length. The average airflow temperature contours in December at the tunnel entrance and the exit for Case I and Case II are shown in Figure 9. In both of the two cases, the airflow temperature increases by increasing the mileage at the tunnel entrance (see Figure 9a,b), while it decreases by increasing the mileage at the tunnel exit (see Figure 9c,d). This is due to the natural ventilation direction from the exit to the entrance in some nights. By comparing Figure 9a,b with Figure 9c,d, it is found that the average airflow temperature in December which is measured at a certain distance from the tunnel entrance is lower than the temperature which is measured at the same distance from the tunnel exit. For example, the airflow temperature at K0 + 600 is mostly below −2 °C (see Figure 9a), while the airflow temperature at K2 + 343 is mostly below −1 °C (see Figure 9c). This is because the cooling effect from the mechanical ventilation system during the daytime is larger on the entrance section (K0 + 000–K1 + 000) than on the exit section (K1 + 943–K2 + 943). Furthermore, the annual average air temperature outside the entrance (K0 + 000) is lower than that outside the exit (K2 + 943). As shown in Figure 9, the December isotherms of the airflow inside the tunnel are parabolic curves. These curves are dense in the near-wall regions, while sparse in the tunnel center. Furthermore, it is found that the airflow temperature is higher and changes more significantly in the near-wall regions than other regions. In contrast, the airflow temperature is lower and changes more slightly near the tunnel center than other regions.
By comparing the airflow temperature contours in the entrance section (see Figure 9a,b), and in the exit section (see Figure 9c,d), it can be found that the heat-insulating layer significantly affects the distribution of the monthly average airflow temperature inside the tunnel. After applying the heat-insulating layer, the monthly average airflow temperature grows more slowly by increasing the mileage in the entrance section. On the other hand, it decreases more slowly in the exit section when compared with the case without the heat-insulating layer. For example, the monthly average airflow temperature at the tunnel center at K0 + 820 is observed as 0 °C in Case I (see Figure 9a), with the temperature at the same position being obtained as equal to −1 °C in Case II (see Figure 9b). This is due to the fact that the heat-insulating layer significantly reduces the heat transfer between the surrounding rock and the airflow inside the tunnel. The heat-insulating layer maintains the original heat of the surrounding rock and the tunnel lining by taking the advantage of low heat conductivity. Moreover, it prevents the tunnel lining from damages from frost caused by heat loss through the airflow.
Figure 10 shows the monthly average temperature curves of airflow near the tunnel vault surface in the entrance section at different mileages (K0 + 000, K0 + 500, K1 + 000 and K1 + 500) under two different heat-insulating conditions (Case I and II). It should be noted that the surface of the tunnel vault along the whole tunnel length consists of three different parts in Case II. In contrast, there is only one surface type in Case I, which is the concrete surface of the secondary lining on the tunnel vault. In Case II, the first and third parts are the surfaces made of the heat-insulating material, which is applied on the tunnel lining in the entrance section (K0 + 000–K0 + 700) and exit section (K2 + 343–K2 + 943) respectively. The second part is the concrete surface of the secondary lining on the tunnel vault.
In Case I (see Figure 10a), the monthly average temperature of airflow near the surface of the tunnel vault at K0 + 000 starts to increase from −8.5 °C in January, reaches the highest temperature of 8.2 °C in June and drops to –9.5 °C (the lowest temperature) in December. It is found that negative temperatures are observed from January to March and from September to December. The temperature stays above 0 °C from March to September. At the other three mileages, the temperature drops first in February, increases to the highest temperature in July and drops to the lowest temperature in December. Apparently, the appearance of peak temperature at the entrance (K0 + 000) is one month earlier than inside the tunnel along the longitudinal direction (from K0 + 500 to K1 + 500). Furthermore, it is observed that the monthly average airflow temperature increases with an increase in the mileage, but the increment between different mileages decreases by increasing the mileage. The increment is more significant in cold months (from January to March and from October to December) than in hot months (from April to September). In Case II (see Figure 10b), the temperature variations are similar with Case I. However, the monthly average airflow temperature is much lower than that in Case I in cold months (from January to March and from October to December), while the difference is not that significant in hot months (from April to September).
Based on the above discussions, it is found that the heat-insulating layer performs different functions (i.e., heat preservation and heat insulation) in different months with the temperature change outside. For example, the monthly average airflow temperature at K0 + 500 is lower in Case II than that in Case I in cold months (from January to March and from October to December). This indicates that the heat-insulating layer prevents the heat transferring from the surrounding rock to the airflow and performs the function of heat preservation in cold months. On the contrary, the monthly average airflow temperature at K0 + 500 is higher in Case II than that in Case I in hot months (from April to September). This means that the heat-insulating layer prevents the heat transferring from airflow to the surrounding rock and performs the function of heat insulation in hot months. According to the calculations, the largest drop in the monthly average airflow temperature at K0 + 500 in Case II compared with the Case I appears in January with a reduction of 3.07 °C, while the largest rise compared with the Case I appears in June with an increment of 0.48 °C. Clearly, the effect of heat preservation of the heat-insulating layer is much more significant than its effect of heat insulation.
5.2. Temperature Characteristics of Tunnel Lining and Lane Plate under Ventilation Conditions
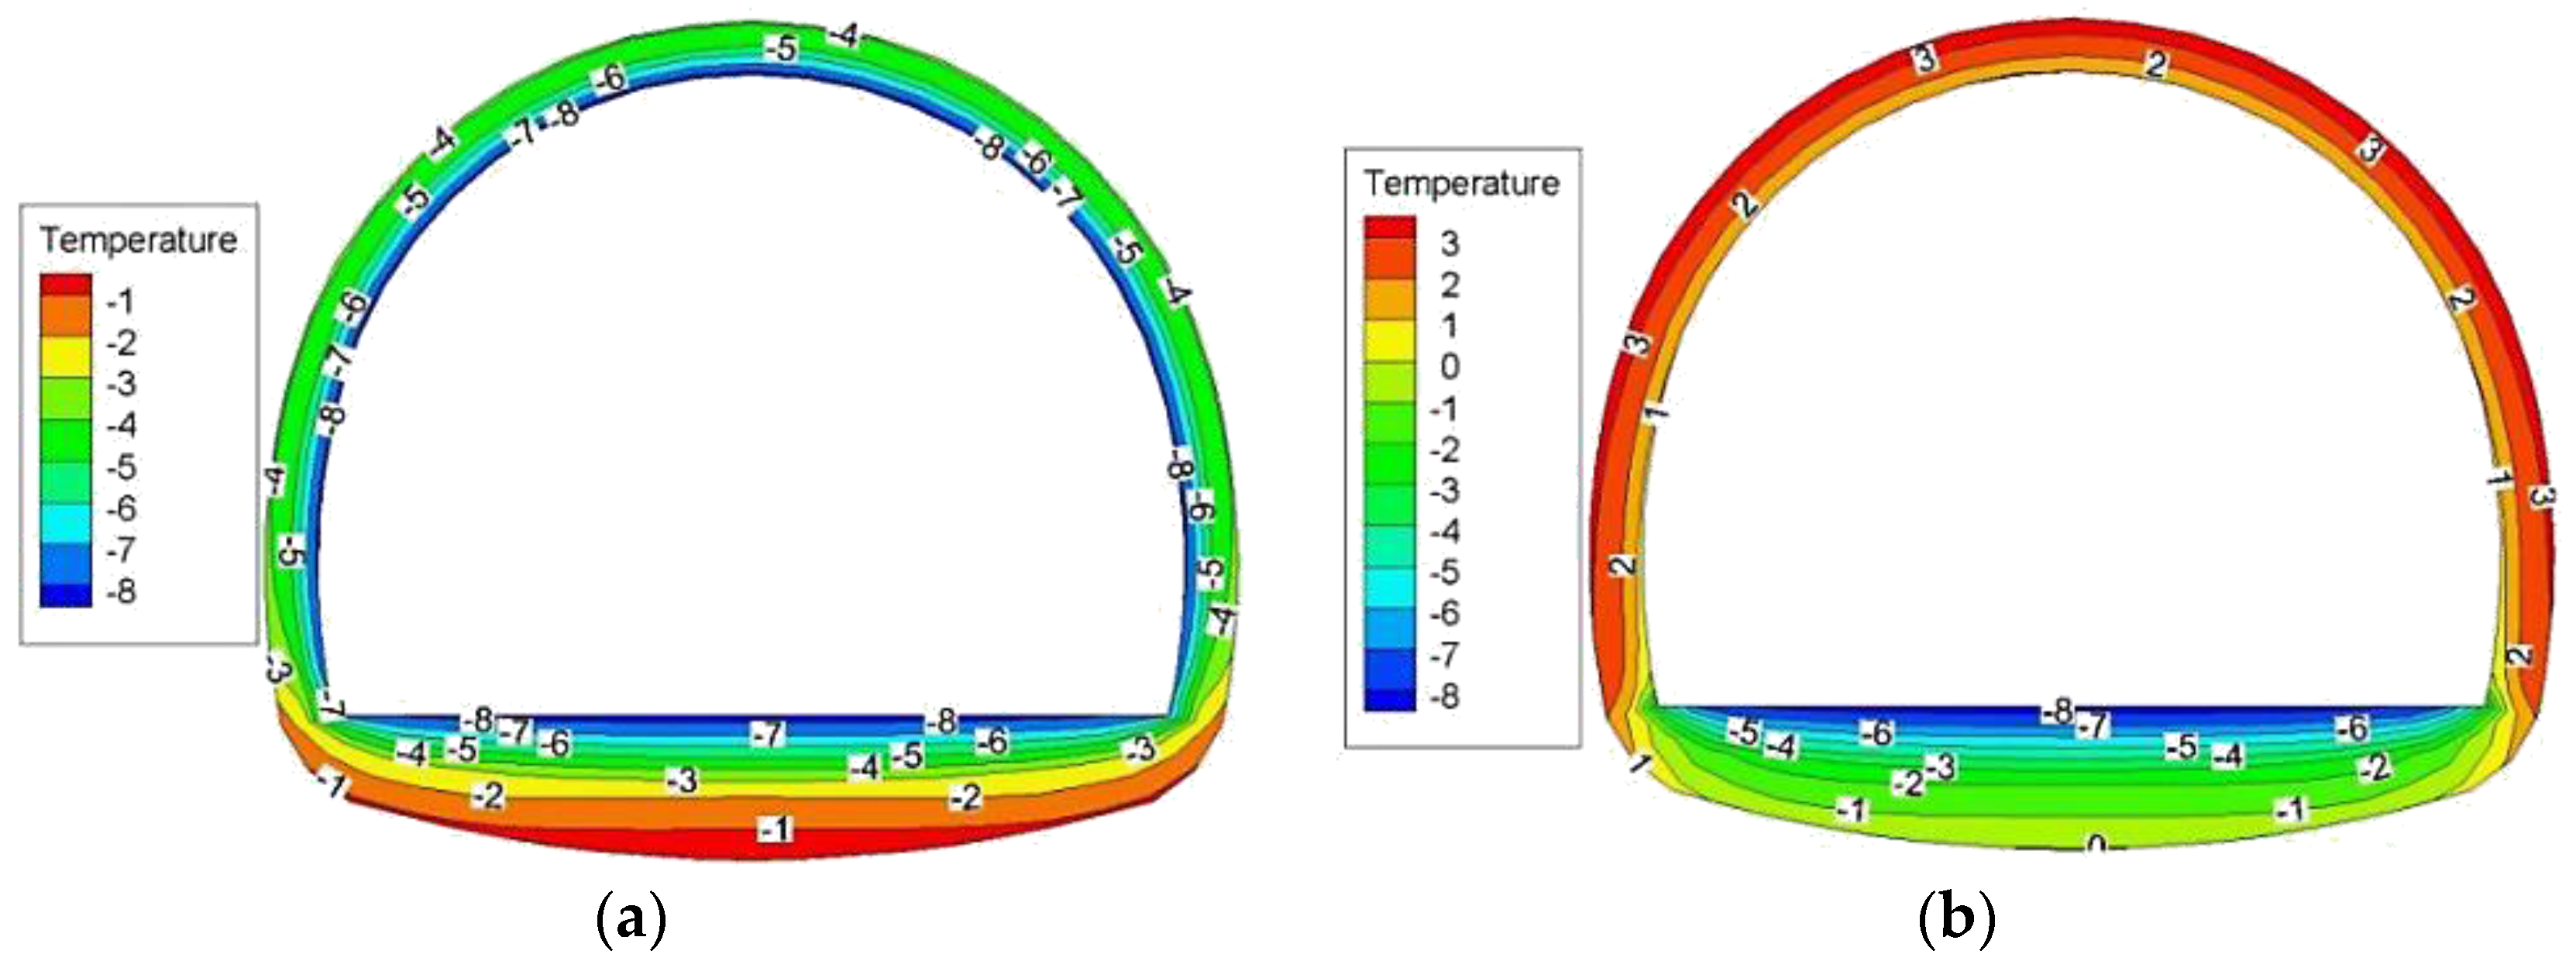
Figure 11 shows the average temperature contours of the tunnel lining (primary support and secondary lining) and the lane plate in December at K0 + 015 cross-section with and without the FLOLIC heat-insulating layer (Case I and Case II). In Figure 11a, it can be found that the tunnel lining and lane plate stay in a negative temperature state in December and the isotherms distribute densely without the heat-insulating layer. It is also found that the temperature gradient of the tunnel lining and lane plate is relatively significant, while the temperature difference between the inner and outer surface of the tunnel lining is 4–5 °C in Case I. After applying the heat-insulating layer, the tunnel lining covered by the heat-insulating layer stays in a positive temperature state, with the distribution of the isotherms being sparser and more uniform. It is found that the temperature gradient becomes smaller, while the temperature difference between the inner and outer surface of the tunnel lining is 2–3 °C in Case II. However, the lane plate and tunnel springing are still in a negative temperature state, as the heat-insulating layer is applied only on the secondary lining above the lane plate. This may lead to damages from frost in the bottom of the tunnel. Thus, it is necessary to take some anti-freezing measures to these positions.
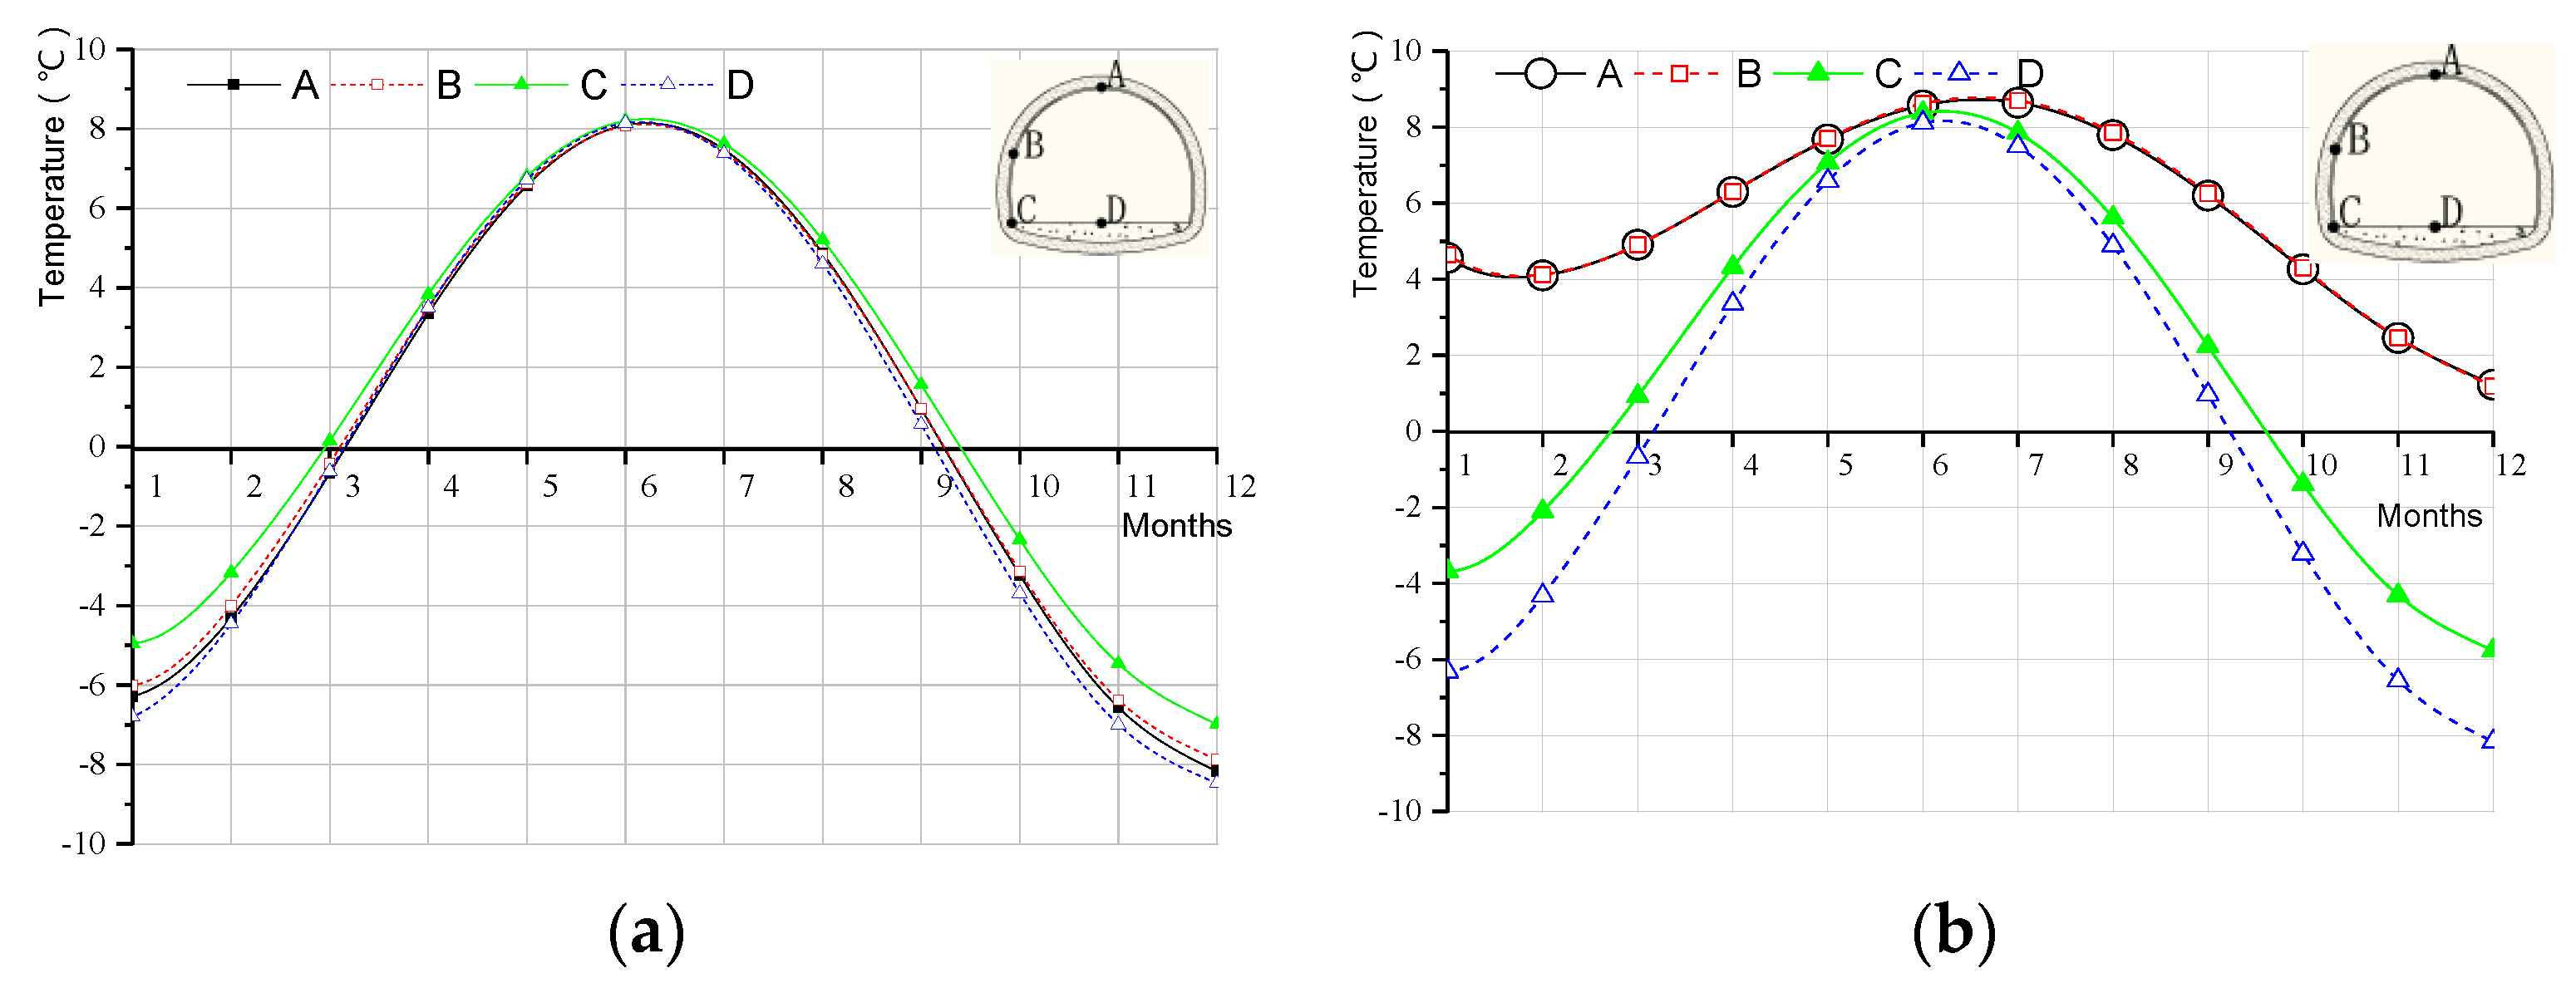
In order to investigate the temperature characteristics of the tunnel lining surface under different heat-insulating conditions (Case I and Case II), monthly average temperatures are measured at four different points on the lining surface, namely A, B, C and D. Points A, B, C and D are on the tunnel vault, tunnel spandrel, tunnel springing and lane plate, respectively (see Figure 12). It should be noted that points A, B and C are on the surface of the secondary lining, while point D is on the lane plate of the tunnel. Figure 12a shows that the monthly average temperature varies at different locations in Case I. This is due to the fact that the ground temperature increases by increasing the depth, while the airflow temperature inside the tunnel distributes non-uniformly at the cross-section of the tunnel. It is also found that the temperature differences at different locations stay within the range of 1–3 °C in cold months (from January to March and from October to December), while the temperature differences in hot months (from April to September) are within the range of 0–0.6 °C. Obviously, the temperature differences in cold months are more significant than those in hot months. It is also found that temperatures at different locations in the same tunnel cross-section from the lowest to highest points are at the center of lane plate (point D), the tunnel vault (point A), the tunnel spandrel (point B) and the tunnel springing (point C), respectively. Figure 12b shows that the monthly average temperature curves in Case II are significantly different with the curves in Case I. Firstly, it is observed that the monthly average temperatures at points A and B, which are exactly the same, are significantly higher than the temperatures at points C and D. As a result, the points A and B are on the secondary lining surface behind the heat-insulating layer. Furthermore, the monthly average temperatures at points A and B (covered by the heat-insulating layer) in Case II stay in positive range during the whole year, while the temperatures at the two points in Case I are negative in cold months and positive in hot months. This indicates that the heat-insulating layer could help to maintain the temperature on the inner surface of the tunnel lining above 0 °C even in cold months.
5.3. Temperature Characteristics of Surrounding Rock under Different Ventilation Conditions
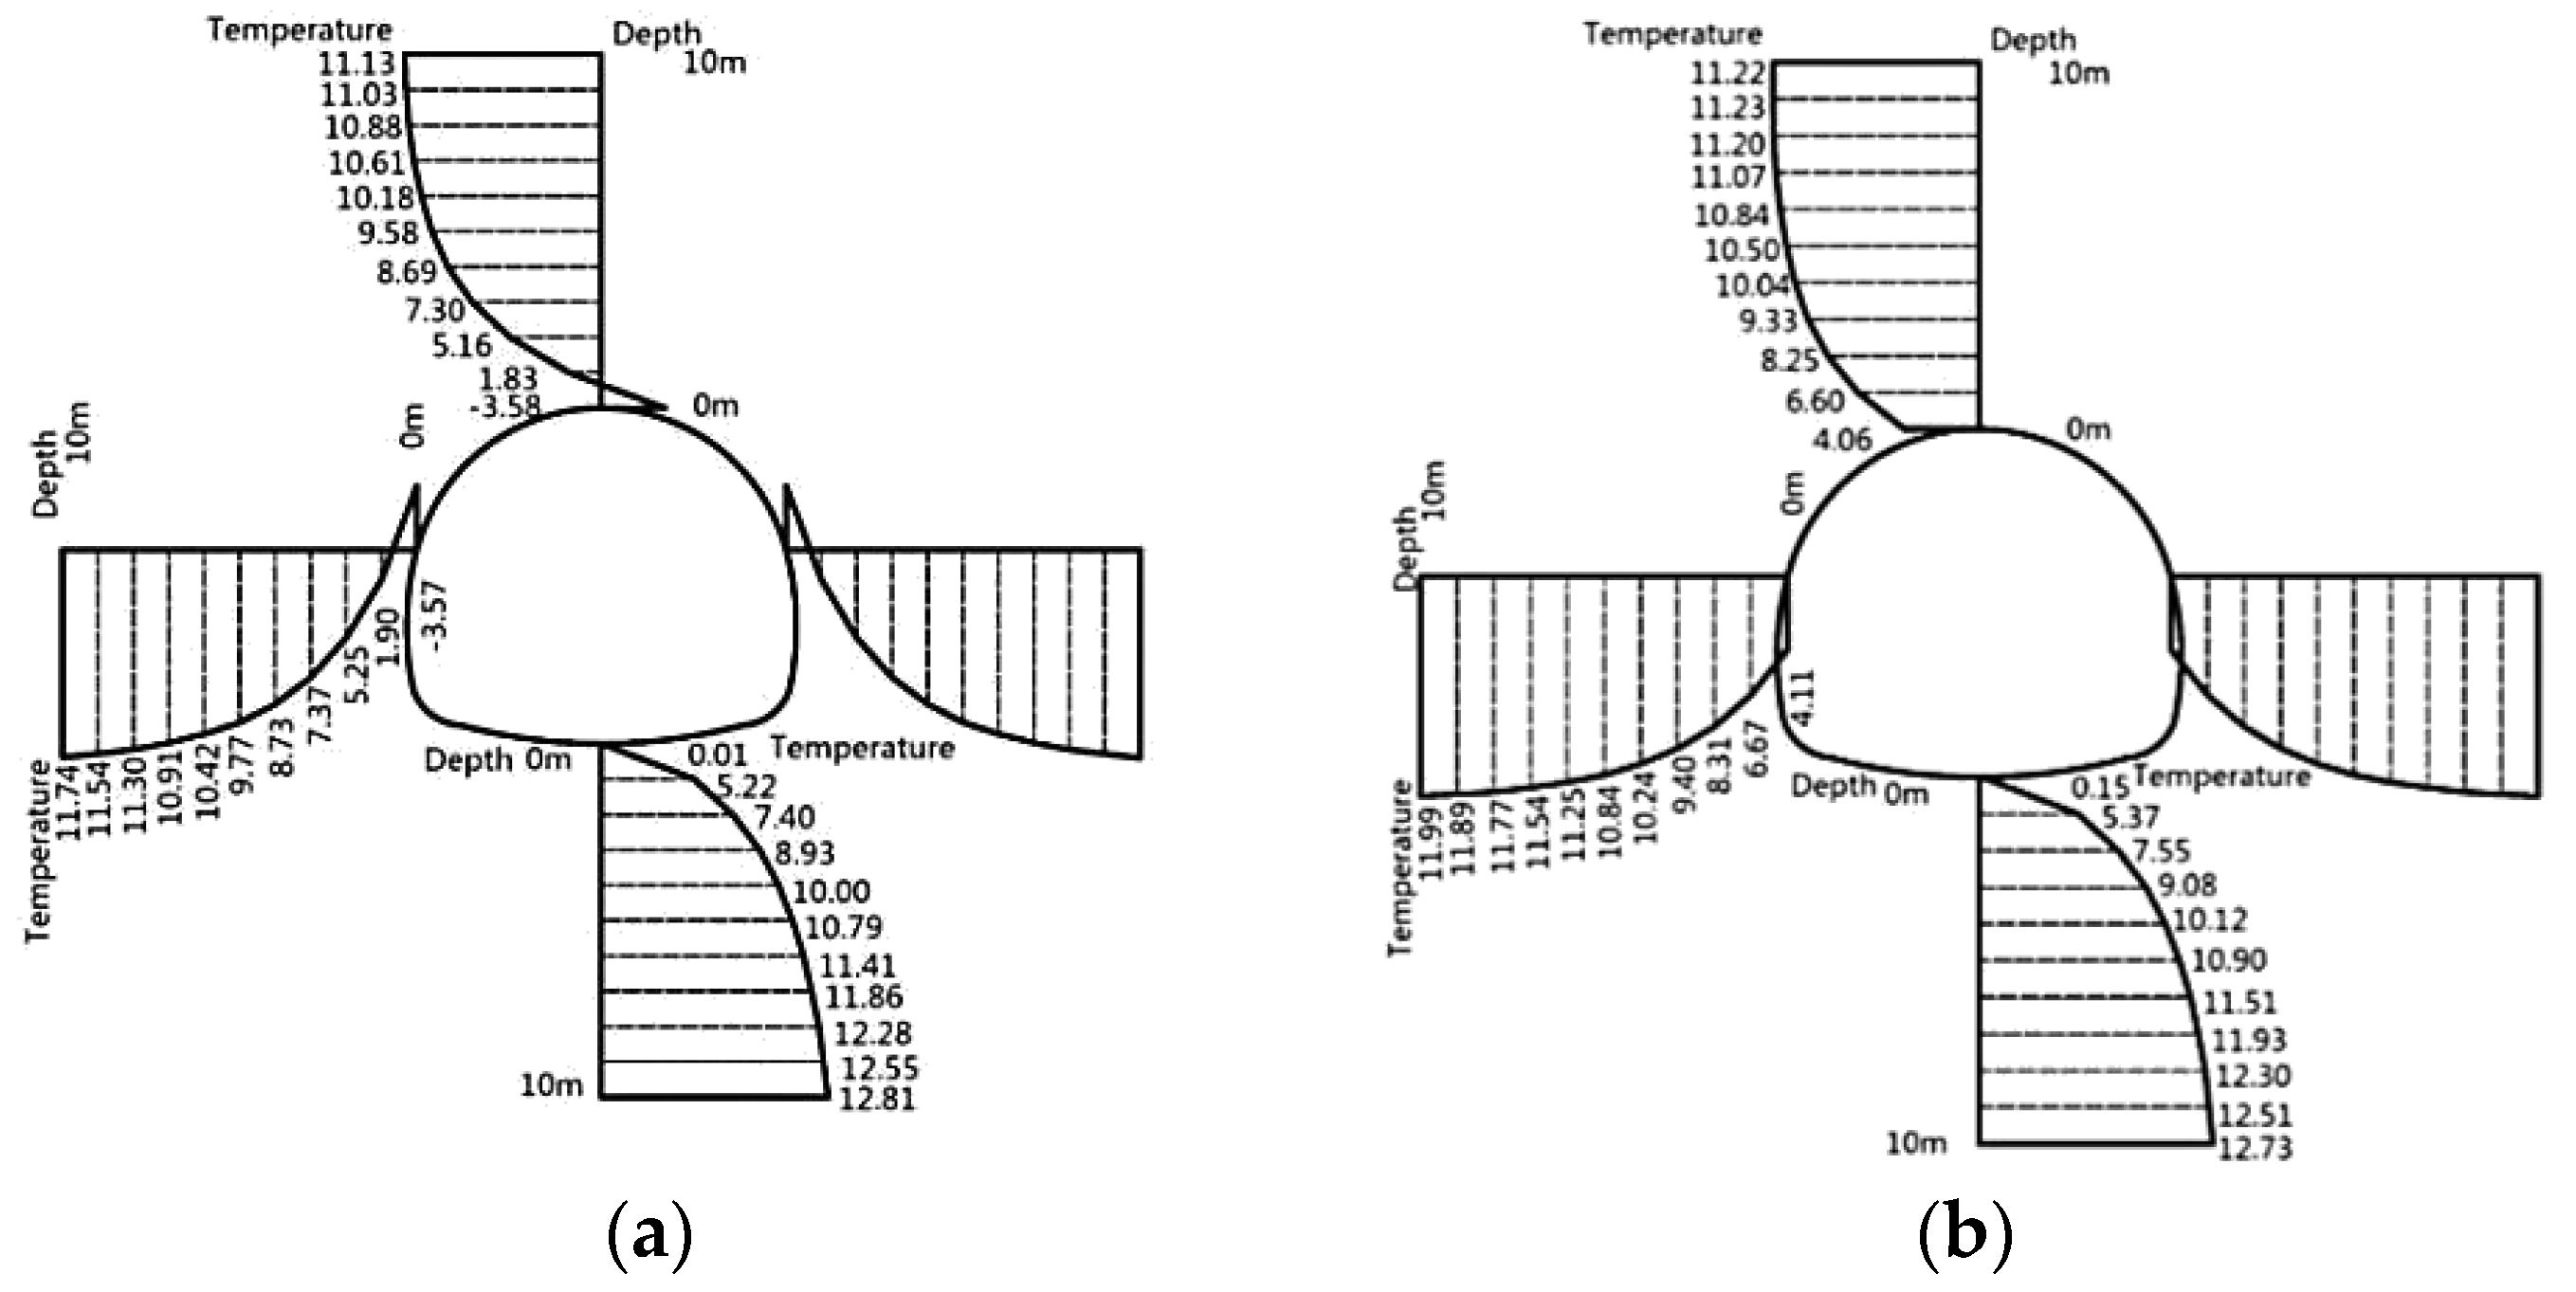
The average temperature variation in December along the depth of the surrounding rock at the cross-section K0 + 015 with and without the heat-insulating layer (Case I and Case II) are shown in Figure 13. In the figure, temperatures at the tunnel vault, tunnel bottom and two tunnel spandrels are measured from 0 m (the surface between the surrounding rock and the tunnel lining) until reaching 10 m in the surrounding rock. As the temperature distribution of the left and right tunnel spandrels are symmetry, only the temperature distribution at the left tunnel spandrel is shown in Figure 13. It can be found that in Case I, temperatures at different locations increase gradually by increasing the depth from the surface towards the surrounding rock, while the increase gradient becomes slower after reaching 7 m (see Figure 13a). In Case II, temperatures at different locations also increase gradually by increasing the depth from the surface towards the surrounding rock. However, the temperatures almost no longer change after reaching 7 m (see Figure 13b). By comparing Figure 13a,b, it is found that the temperatures of the surrounding rock at the vault and the spandrels in Case II are generally higher than the temperatures in Case I. There are smaller temperature differences of the surrounding rock at the tunnel bottom between Case I and Case II, compared with the differences in other locations. Besides, it is found that the depth of the surrounding rock at the tunnel vault and the spandrel in a negative temperature state decreases from 0.6 m in Case I to 0 m in Case II. This indicates that the heat-insulating layer can effectively maintain the temperature of the surrounding rock above 0 °C and prevent the surrounding rock from the damages from frost.
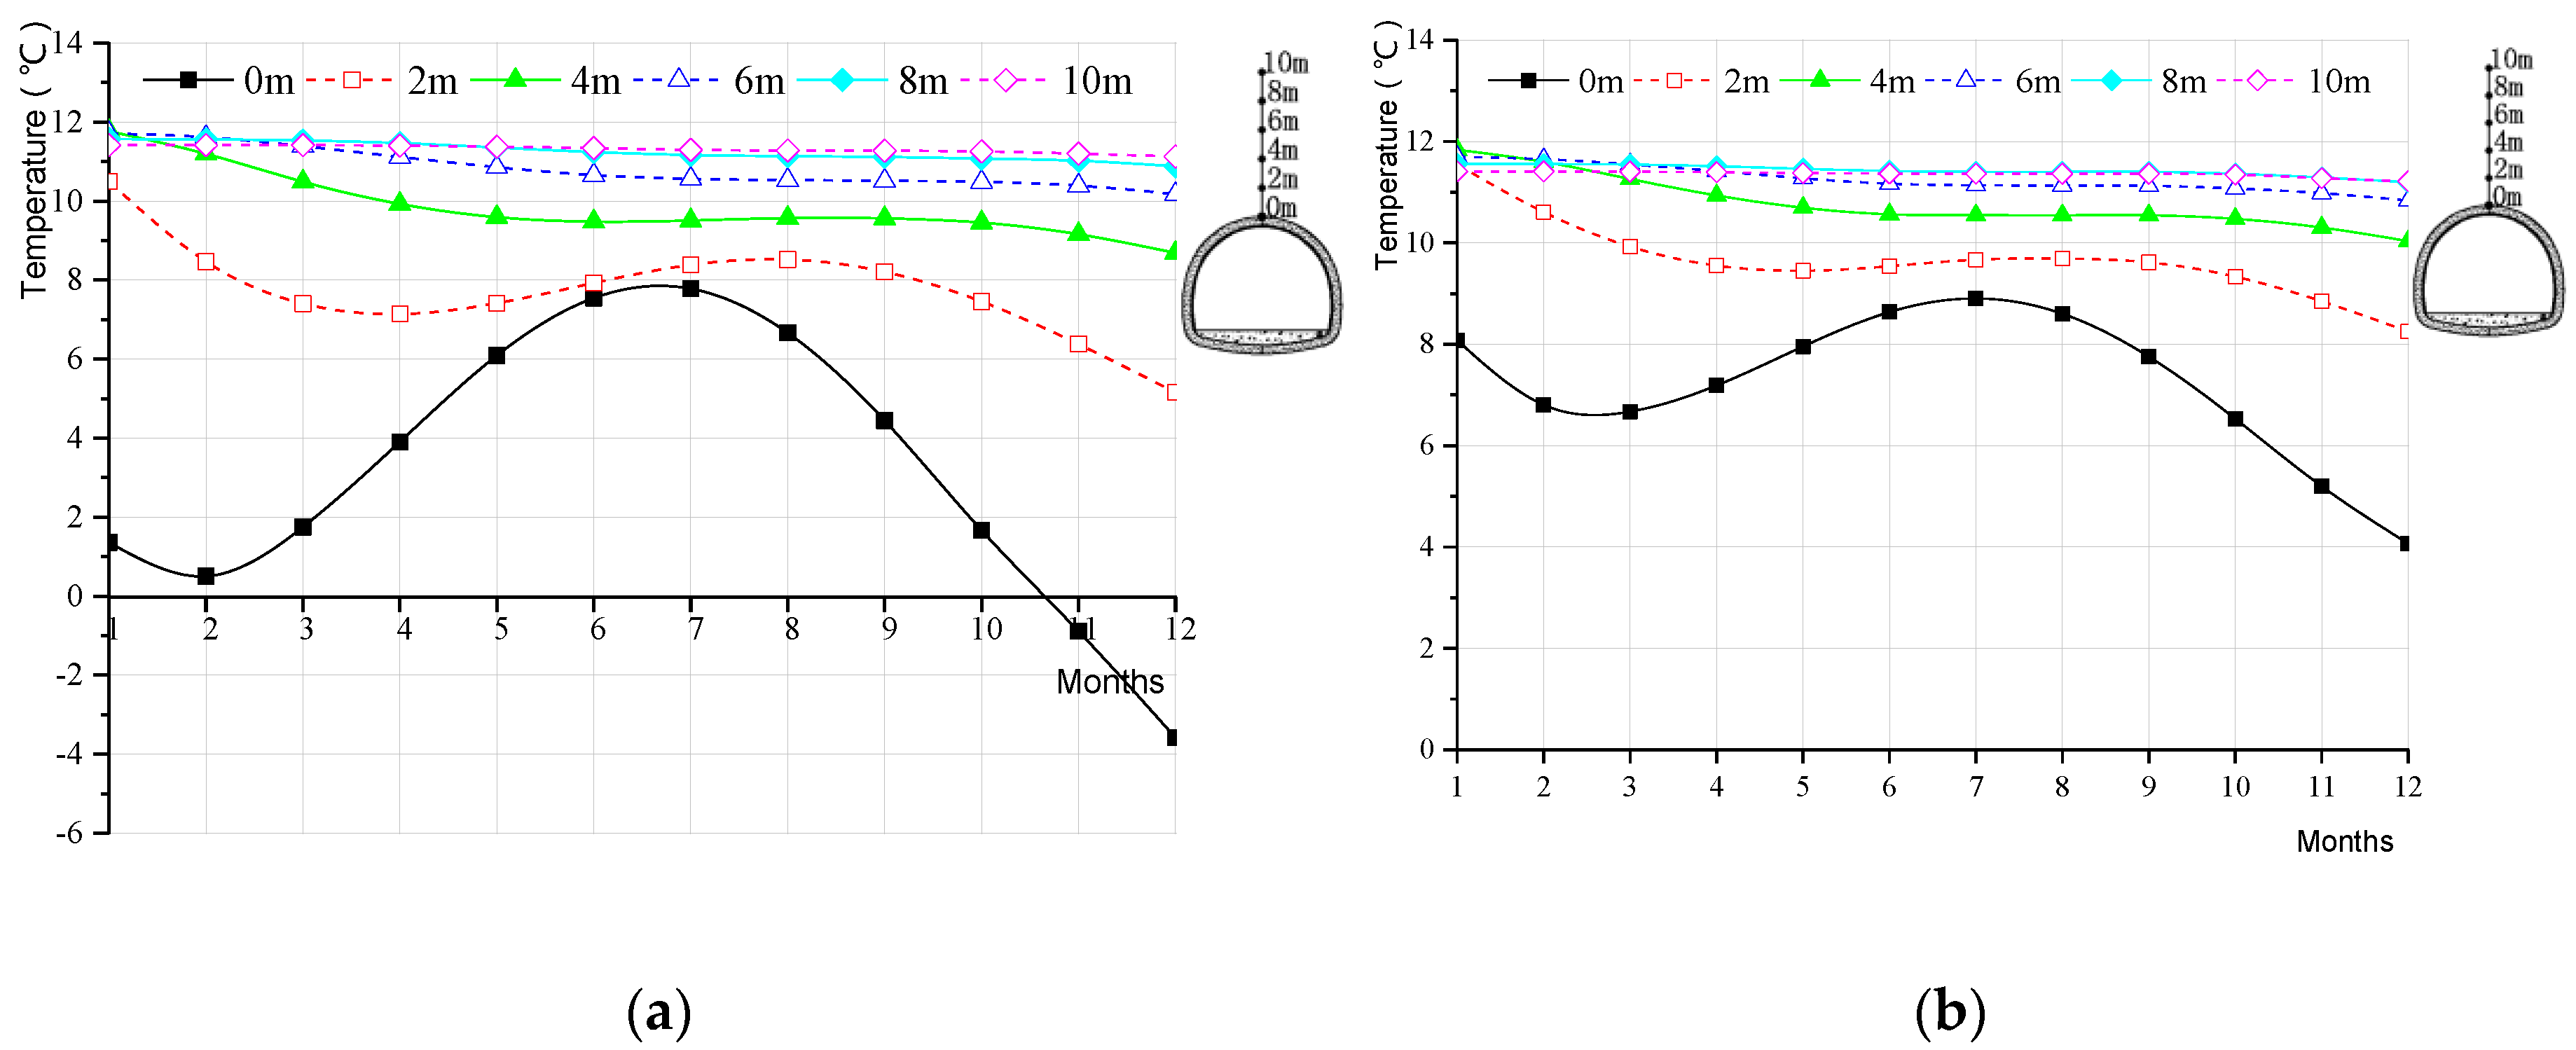
Figure 14 shows the monthly average temperature curves of the surrounding rock during the whole year at different depths at the tunnel vault in the cross-section K0 + 015. In total, six depths are investigated in the analysis, which are 0 m, 2 m, 4 m, 6 m, 8 m and 10 m. Here, 0 m also represents the surface between the tunnel lining and the surrounding rock. As shown in the figure, temperature of the surrounding rock increases by increasing the depth from 0 m towards the surrounding rock. On the contrary, the amplitudes of the temperature curves decrease by increasing the depth from 0 m towards the surrounding rock. The time lag of temperature becomes greater by increasing the depth. It is also found that the amplitudes of the temperature curves in Case II are generally smaller than the curve amplitudes in Case I. Besides, there is only a slight change in the monthly average temperature of the surrounding rock after reaching 8 m in Case I (see Figure 14a), while the same phenomenon occurs after reaching 6 m in Case II (see Figure 14b). Moreover, the November and December average temperatures of the surrounding rock at 0 m are observed below 0 °C in Figure 14a, which means that the damages from frost are more likely to happen in the surrounding rock in theses two months in Case I. On the other hand, the monthly average temperature of surrounding rock at 0 m stays above 0 °C during the whole year in Case II. This indicates that the surrounding rock is protected by the heat-insulating layer from damages from frost.
6. Heat-Insulating Layer Design Considerations
In order to protect the tunnel from damages from frost during operation, the temperature of the secondary lining is required to stay above 0 °C after applying the heat-insulating layer. This requirement is employed as the basis to determine design parameters of the heat-insulating layer in a practical sense. It is found that the thickness of the heat-insulating layer has an influence on the effect of heat exchange and the airflow temperature distribution in the longitudinal direction of the tunnel. Moreover, the thickness has an influence on the determination of the design length of the heat-insulating layer. Therefore, the design thickness of the heat-insulating layer should be determined in the first step, so that the design length could be determined based on the specific thickness. In the followings, design parameters of the heat-insulating layer under different mechanical ventilation conditions and using different materials are carefully investigated. Then, design recommendations are provided based on the anti-freezing requirements of the Dege tunnel.
6.1. Mechanical Ventilation Velocities (Using FLOLIC Material)
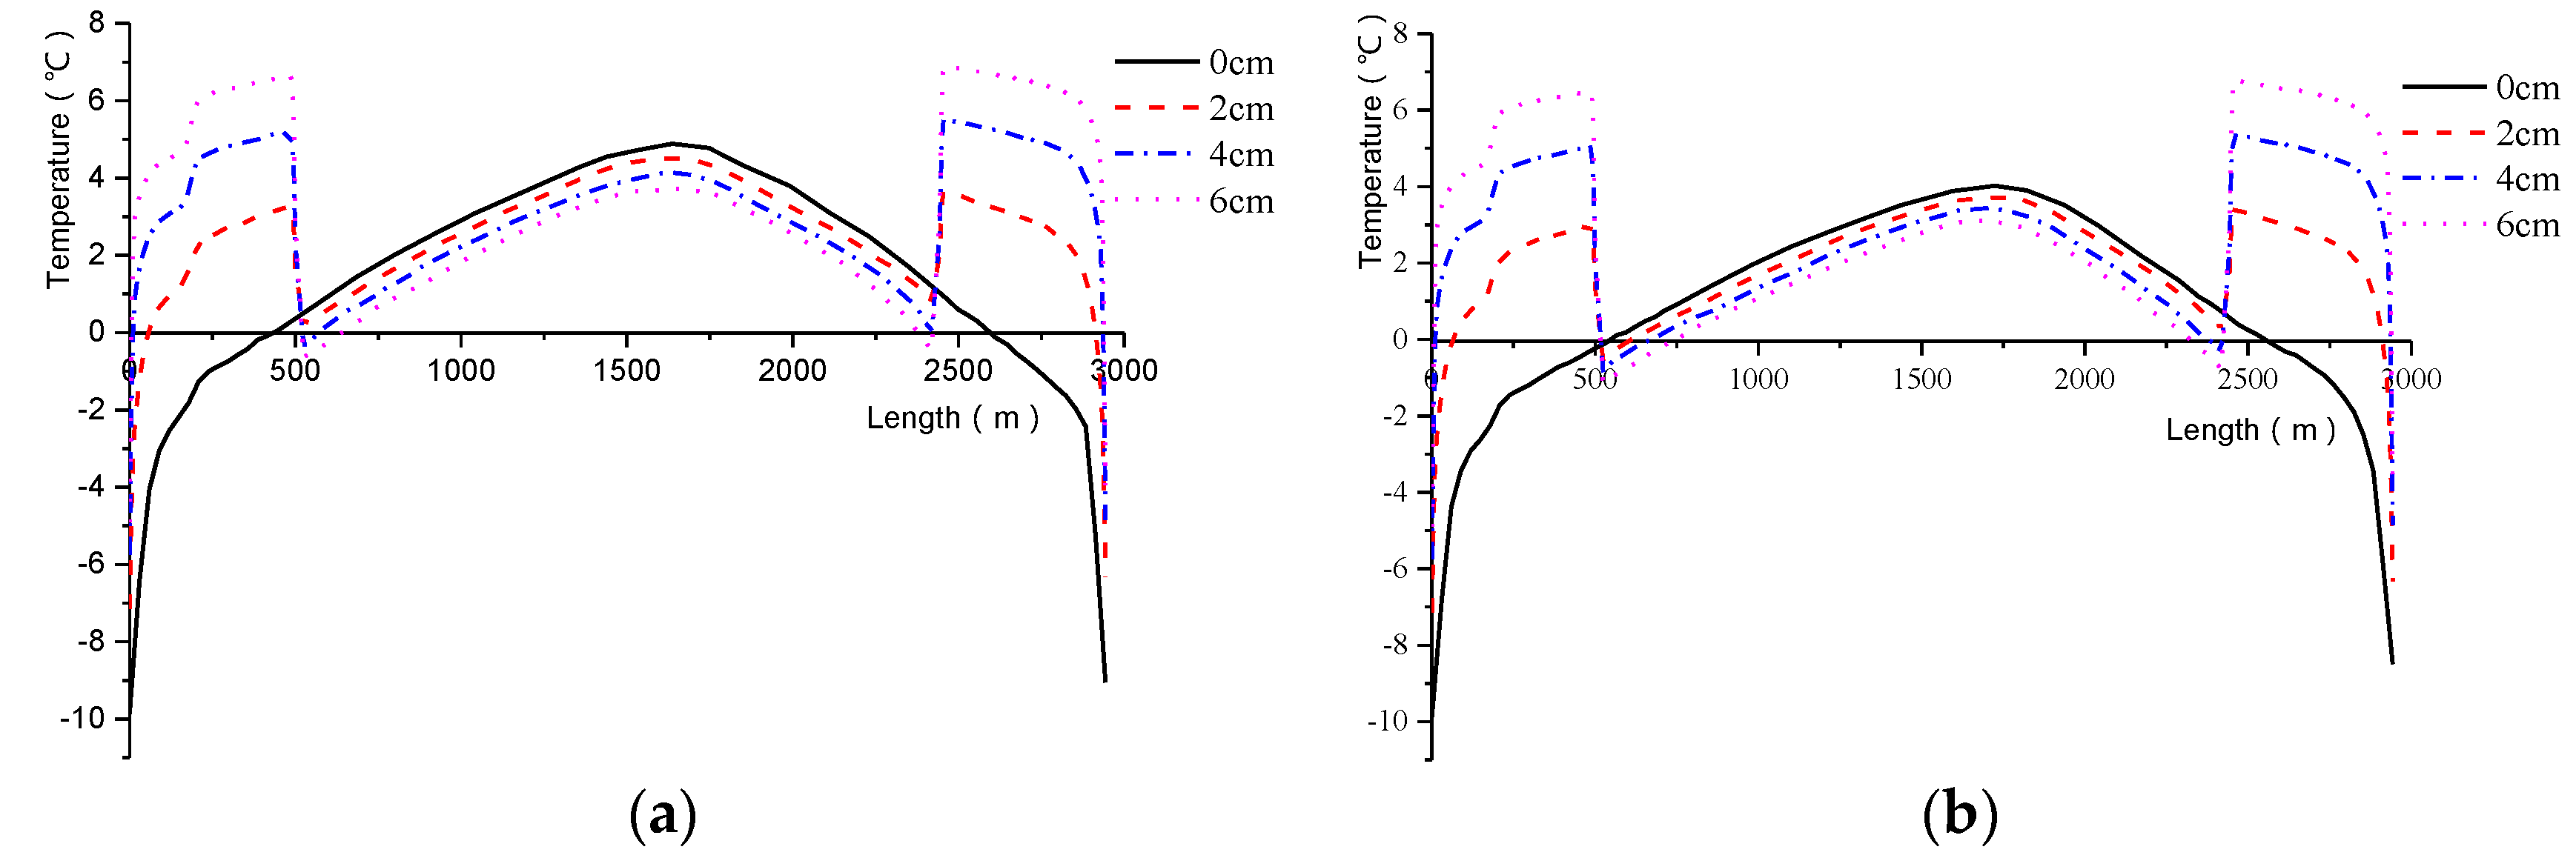
The heat-insulating material employed in the following analysis is the FLOLIC material and its thermal physical parameters can be found in Table 1. The temperature of the secondary lining surface at the tunnel vault is employed to represent the temperature of the secondary lining surface. Figure 15 shows the average temperatures in December of the secondary lining in the longitudinal direction with different thicknesses (0 cm, 2 cm, 4 cm and 6 cm) of the heat-insulating layer. In the analysis, natural ventilation is considered with a constant velocity of 2.5 m/s, while mechanical ventilation is considered with two different velocities (5 m/s and 6 m/s) to check the influence of mechanical ventilation velocity. The heat-insulating layer is considered with a length of 500 m in the entrance section and the exit section, respectively. It should be noted a 0 cm thick heat-insulating layer means that no heat-insulating layer is applied on the tunnel lining. As shown in the figure, when the mechanical ventilation velocity increases from 5 m/s to 6 m/s, the temperature of the secondary lining surface at the same position decreases. It is also found that the change of the temperature is regardless of the thickness of the heat-insulating layer. Besides, the mechanical ventilation results in asymmetrical temperature distributions in the entrance section and the exit section. Regardless of the mechanical ventilation velocity, the temperature of the secondary lining surface increases rapidly in the entrance section, and drops rapidly in the exit section, while the change of the temperature is relatively slower in the middle of the tunnel without the heat-insulating layer. Moreover, it is found that the temperature of the secondary lining surface in the entrance section and the exit section that is covered by the heat-insulating layer is significantly higher than the temperature in the same section without the heat-insulating layer. The temperature of the secondary lining surface in the entrance section and the exit section that is covered by the heat-insulating layer rises by increasing the thickness of the heat-insulating layer. On the contrary, the temperature of the secondary lining surface in the middle section that is not covered by the heat-insulating layer is slightly lower than the temperature without the heat-insulating layer, and the temperature of the secondary lining surface in the middle section that is not covered by the heat-insulating layer decreases by increasing the thickness of the heat-insulating layer.
In the cases with applying 2 cm, 4 cm and 6 cm heat-insulating layer, sudden drops of the temperatures are observed at 500 m length and 2443 m length, respectively. The reduction of the temperature increases by increasing the thickness of the heat-insulating layer. As a result, the length of the negative temperature region expands by increasing the thickness of the heat-insulating layer. Thus, having a thicker heat-insulating layer is not necessarily better. However, the length of the negative temperature region at the tunnel entrance and the exit will be relatively long if the heat-insulating layer is too thin. For example, the length of the negative temperature region is 55 m and 31 m in the entrance section and exit section, respectively, after applying a 2 cm thick heat-insulating layer. When the mechanical ventilation velocity is 5 m/s, 4 cm is the reasonable design thickness for the heat-insulating layer (see Figure 5a) for the example tunnel. In Figure 15b, the reasonable design thickness of the heat-insulating layer is still 4 cm after increasing the mechanical ventilation velocity to 6 m/s. This indicates that the influence of the mechanical ventilation velocity on the design thickness of the heat-insulating layer is not significant.
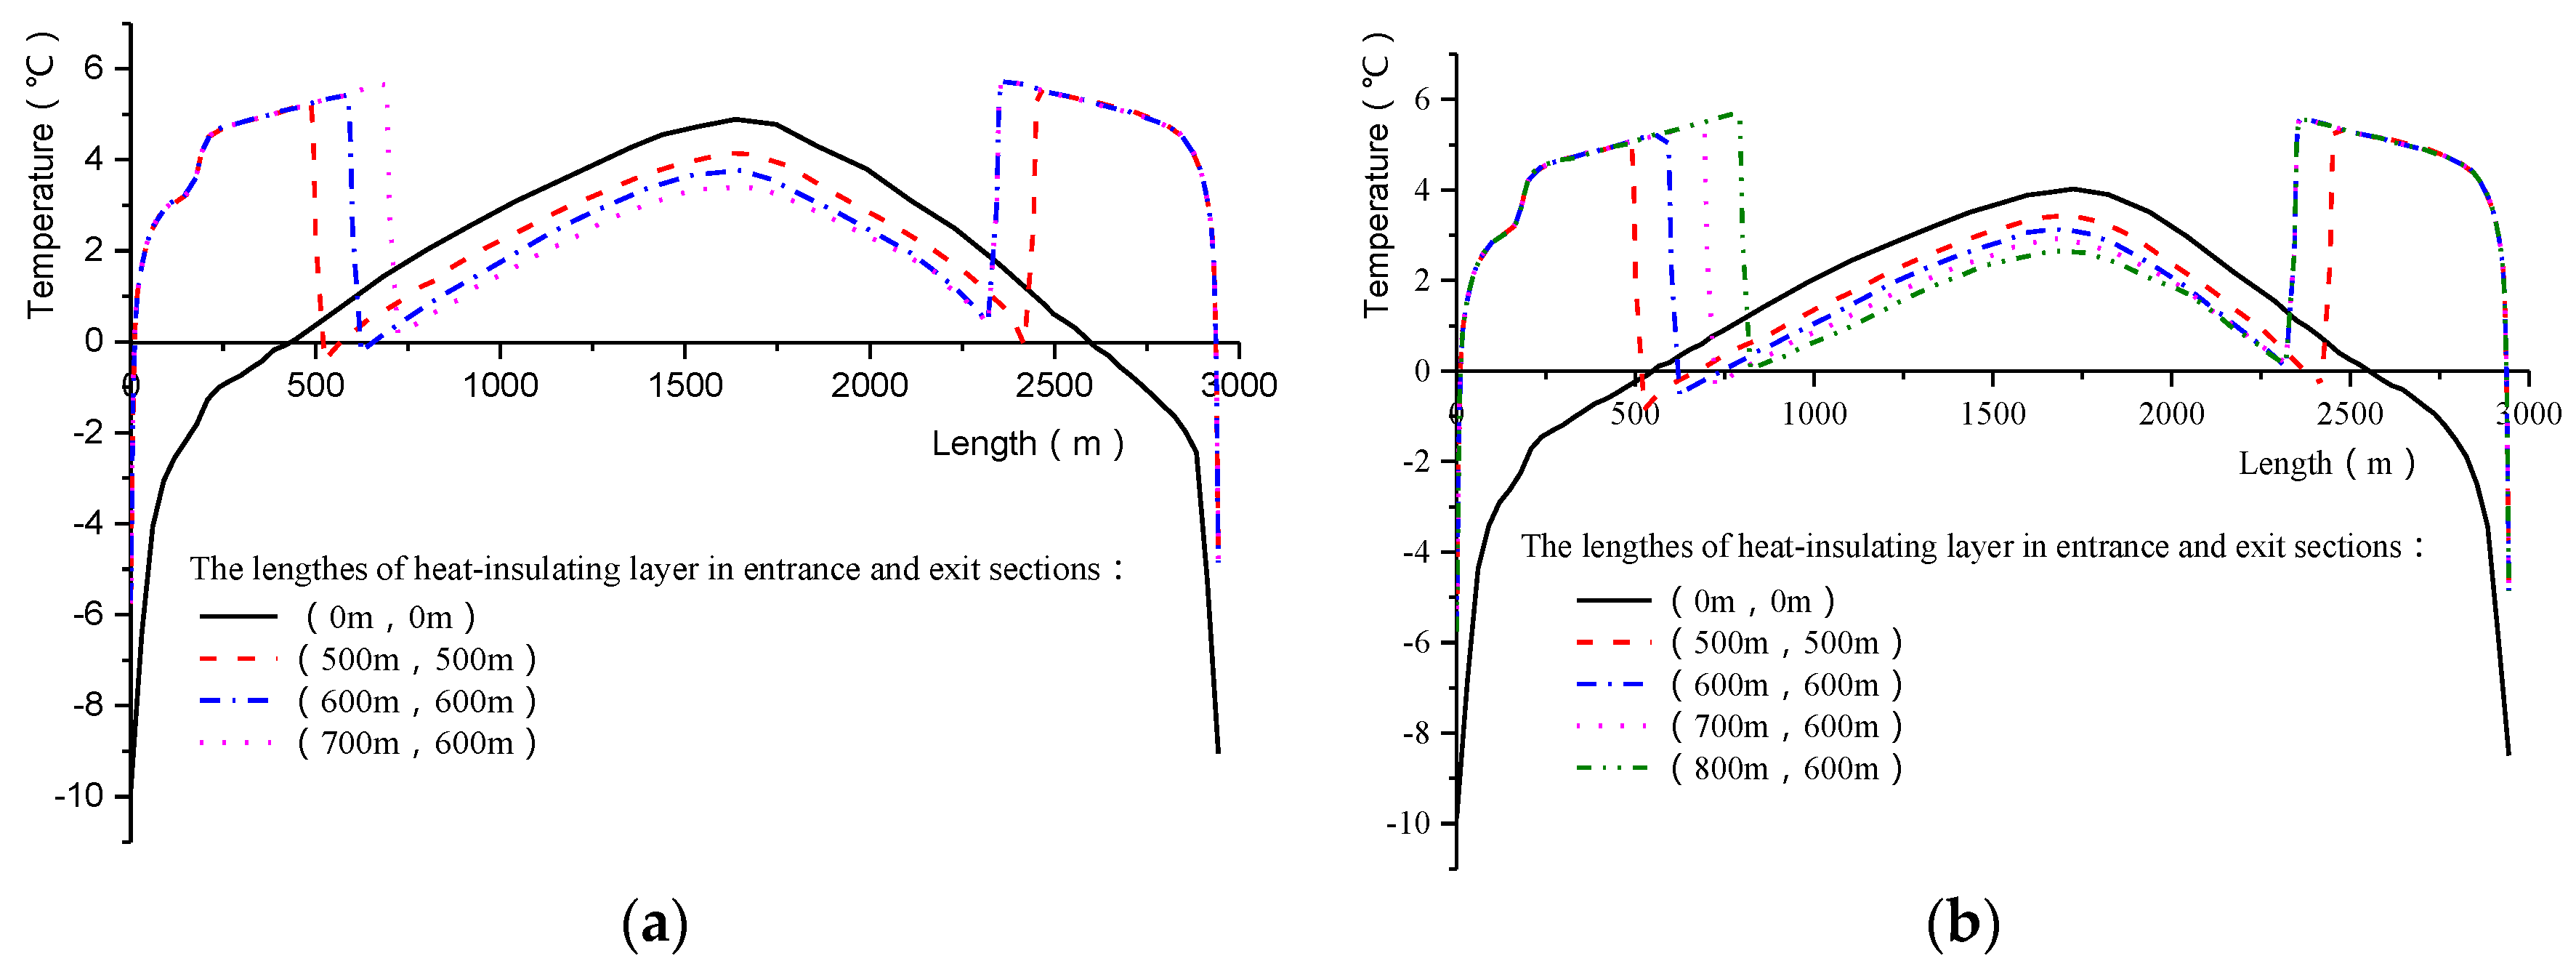
Figure 16 shows that the average temperature in December of the tunnel secondary lining in the longitudinal direction after applying a 4 cm heat-insulating layer under the same ventilation conditions as in Figure 15. In the figure, the heat-insulating layer is considered with five different lengths (0 m, 500 m, 600 m, 700 m and 800 m). It can be found that the temperatures of the secondary lining surface without covering by the heat-insulating layer decrease by increasing the length of the heat-insulating layer in the entrance section and the exit section. It is found that the end of the heat-insulating layer for each length creates a new negative temperature region. This is because of the heat-insulating performance. From the practical point of view, the length of the heat-insulating layer should be gradually increased until the negative temperature region is eliminated. Thus, an extension of the heat-insulating layer in the entrance section and the exit section should be considered carefully according to the ventilation conditions in practical design procedures.
Figure 16a shows that the length of the negative temperature region is different when applying the heat-insulating layer with varying lengths under the same ventilation conditions (mechanical ventilation velocity of 5 m/s). In order to eliminate the negative temperature region, the appropriate design length of the heat-insulating layer under 5 m/s mechanical ventilation condition is considered to be 700 m/600 m in the entrance/exit section. When the heat-insulating layer is not applied on the tunnel lining surface, the length of the negative temperature region in the entrance/exit section is 450 m/327 m. Accordingly, the design length of the heat-insulating layer in the entrance/exit section is 1.56/1.83 times longer than the length of the negative temperature region when the heat-insulating layer is not applied on the tunnel lining. In Figure 16b, it is found that the mechanical ventilation velocity has a great influence on the design length of the heat-insulating layer, especially in the entrance section. The design length in the entrance section is increased from 700 m to 800 m when the mechanical ventilation velocity is increased from 5 m/s to 6 m/s. On the other hand, the design length in the exit section is not significantly influenced by an increase in the velocity of mechanical ventilation. This is due to the fact that the temperature of exit section is mainly affected by the natural ventilation instead of mechanical ventilation.
6.2. Heat-Insulating Materials (with Mechanical Ventilation Velocity of 5 m/s)
Three different heat-insulating materials that are frequently used in anti-freezing designs and constructions of cold region tunnels are employed in the present analysis to investigate the influence of different materials on design parameters of heat-insulating layers. The thermal physical parameters for the FLOLIC material can be found in Table 1, while the thermal physical parameters for the other two materials (the polyurethane material and the stem method aluminosilicate sheet) are listed in Table 2. As shown in Table 1 and Table 2, the FLOLIC material shows the best performance with regards to heat insulation (0.024 w/m∙°C), while the heat-insulating performance of the stem method aluminosilicate sheet is the worst (0.038 w/m∙°C) out of the three materials. The design thickness and length for the three materials are calculated under the same mechanical ventilation condition with a velocity of 5 m/s, and using the same computation procedure in Section 6.1. The numerical results for the three materials with different thickness and different length are shown in Table 3 and Table 4, respectively.
As the FLOLIC material has the best heat-insulating performance, the design thickness is proposed as 4 cm, which is the thinnest out of the three materials. Furthermore, the design length in the entrance/exit section and is chosen as 700 m/600 m, according to the calculation method provided in Section 6.1. For the polyurethane material with slightly worse heat-insulating performance, the design thickness is proposed as 6 cm (thicker than the FLOLIC material). As a thicker insulating layer could lead inadequate heat exchange as well as potentially preventing rapid heating of airflows inside tunnels, the design length for polyurethane material is 800 m/700 m for the entrance/exit section. Although the heat-insulating performance of the stem method aluminosilicate sheet is the worst out of the three materials, a thickness of 6 cm is able to satisfy the requirements of heat preservation for the entrance and exit sections (see Table 3). As the thermal conductivity of the stem method aluminosilicate sheet is relatively high, there is no need to increase the design length, which remains the same with the design length of the FLOLIC material (700 m/600 m for the entrance/exit section). By comparing the design parameters between the polyurethane material and the stem method aluminosilicate sheet, it can be found that the material with better heat-insulating performance requires a longer design length when the design thickness of the two materials is the same. Therefore, with the satisfaction of the anti-freezing requirement, applying a heat-insulating layer with relatively poor insulating performance could reduce time costs and engineering consumptions for a tunnel construction.
7. Conclusions
Based on the proposed three-dimensional numerical model, a comprehensive parametric study is carried out to examine the heat preservation and anti-freezing effectiveness of the heat-insulating layer in tunnel, taking into account the influence of tunnel ventilation conditions. Furthermore, the influence of different mechanical ventilation velocities as well as different heat-insulating materials on the design parameters of heat-insulating layer is carefully discussed. Conclusions are surmised as follows:
- (1)
- According to the field test results, the proposed design parameters of the heat-insulating layer for the Dege tunnel can meet the anti-freezing requirement. And the accuracy of the proposed numerical model is verified by using the field test data, with the numerical results showing consistency with the field test results in terms of the curve trend and the data magnitude.
- (2)
- The monthly average temperature contours of the airflow in the tunnel are parabolic curves, with the temperature gradient being larger in the near-wall regions while smaller in the tunnel center. The airflow outside the tunnel requires a longer time to reach the same airflow temperature after applying the heat-insulating layer, when compared with the case having no heat-insulating layer. Furthermore, the heat-insulating layer prevents the heat transferring from the surrounding rock to the airflow in cold months (from January to March and from October to December), which plays a role of heat preservation. On the other hand, the heat-insulating layer prevents the heat transfer from the airflow to the surrounding rock in warm months (from April to September), which plays a role of thermal insulating.
- (3)
- After applying the insulating layer made of the FLOLIC material, the monthly average temperatures above the lane plate are always positive even in the coldest month, and the temperature gradient becomes smaller. Attaching the insulating layer to the lining wall would not protect the lane plate and the tunnel springing from damages from frost. The surface temperatures at different locations in the same tunnel cross-section from the lowest to highest points are at the center of lane plate, the tunnel vault, the tunnel spandrel and the tunnel springing, respectively.
- (4)
- The monthly average temperature of the surrounding rock increases by increasing the depth towards into the surrounding rock, while the temperature gradient decreases by increasing the depth towards into the surrounding rock. The variation phase is delayed and the variation amplitude is reduced. After reaching a certain depth, there only appears to be a very small change in the temperature of the surrounding rock. The size of the negative temperature region and the range of the temperature variation in the surrounding rock were both reduced after applying the heat-insulating layer.
- (5)
- By increasing the thickness of the heat-insulating layer, the temperature at the end of the heat-insulating layer on the secondary lining surface drops more significantly which usually increases the length of the lining section of negative temperature region. However, the lining section with a negative temperature at the tunnel ends becomes longer when a thinner heat-insulating layer is applied. Thus, the design thickness of the heat-insulating layer needs to take into account the influence of tunnel ventilation. The temperature of the secondary lining surface drops slightly by increasing the mechanical ventilation velocity, but the design thickness is not affected with the mechanical ventilation condition.
- (6)
- After applying the heat-insulating layer, lining sections with a negative temperature are observed near the two ends of the heat-insulating layer. It means that the heat-insulating layer should be extended at the tunnel entrance and the exit. When considering tunnel ventilation, the design length of the heat-insulating layer should be more than 1.5 times longer than the length with negative temperature at the entrance/exit. When the velocity of mechanical ventilation is increased, the design length of heat-insulating layer should be increased accordingly.
- (7)
- The design thickness and length vary when using different heat-insulating materials. In the case with the same thickness, the material with better heat-insulating performance has to be of a longer length compared to the normal material. Thus, using a material with relatively poor thermal insulating performance to satisfy the anti-freezing requirement would be helpful to reduce construction budgets and receive better economic benefits.
Acknowledgments
This work was supported by the National Natural Science Foundation of China (No. 51678500).
Author Contributions
Qixiang Yan proposed the idea of research work; Binjia Li and Yanyang Zhang established the model and performed the computation; Jian Yan performed the calculation of material parameters from experiments and recorded the test data from field tests; Yanyang Zhang and Chuan Zhang wrote the paper.
Conflicts of Interest
The authors declare no conflict of interest.
References
- Kawamura, T.; Mikami, T.; Fukumoto, K. An estimation of inner temperatures at cold region tunnel for heat insulator design. Struct. Eng. Symp. 2008, 54, 32–38. [Google Scholar]
- Tan, X.; Chen, W.; Yang, D.; Dai, Y.; Wu, G.; Yang, J. Study on the influence of airflow on the temperature of the surrounding rock in a cold region tunnel and its application to insulation layer design. Appl. Therm. Eng. 2014, 67 (Suppl. 1–2), 320–334. [Google Scholar] [CrossRef]
- Song, H.; Ye, C.L.; Mi, J.F. Numerical analysis of optimization design for insulation layer in cold regions tunnel. Adv. Mater. Res. 2014, 1065–1069, 368–372. [Google Scholar] [CrossRef]
- Qi, P.; Zhang, J.; Mei, Z.R.; Wu, Y.X. Study on the range of freeze-thaw of surrounding rock from a cold-region tunnel and the effects of insulation material. Adv. Mater. Res. 2011, 399–401, 2222–2225. [Google Scholar] [CrossRef]
- Comini, G.; Del Guidice, S.; Lewis, R.W.; Zienkiewicz, O.C. Finite element solution of non-linear heat conduction problems with special reference to phase change. Int. J. Numer. Methods Eng. 1974, 8, 613–624. [Google Scholar] [CrossRef]
- Lee, K.B.; Howell, J.R. Theoretical and experimental heat and mass transfer in highly porous media. Int. J. Heat Mass Transf. 1991, 34, 2123–2132. [Google Scholar]
- Bronfenbrener, L.; Korin, E. Kinetic model for crystallization in porous media. Int. J. Heat Mass Transf. 1997, 40, 1053–1059. [Google Scholar] [CrossRef]
- Mottaghy, D.; Rath, V. Latent heat effects in subsurface heat transport modelling and their impact on palaeotemperature reconstructions. Geophys. J. Int. 2006, 164, 236–245. [Google Scholar] [CrossRef]
- Lai, Y.M.; Wu, Z.W.; Zhu, Y.L.; Zhu, L.N. Nonlinear analysis for the coupled problem of temperature, seepage and stress fields in cold-region tunnels. Tunn. Undergr. Space Technol. 1998, 13, 435–440. [Google Scholar] [CrossRef]
- Zhang, X.F.; Lai, Y.M.; Yu, W.; Zhang, S. Non-linear analysis for the freezing—Thawing situation of the rock surrounding the tunnel in cold regions under the conditions of different construction seasons, initial temperatures and insulatings. Tunn. Undergr. Space Technol. 2002, 17, 315–325. [Google Scholar] [CrossRef]
- Zhang, X.F.; Lai, Y.M.; Yu, W.; Wu, Y. Forecast analysis for the re-frozen of Feng Huoshan permafrost tunnel on Qing-Zang railway. Tunn. Undergr. Space Technol. 2004, 19, 45–56. [Google Scholar] [CrossRef]
- Tan, X.; Chen, W.; Tian, H.; Cao, J. Water flow and heat transport including ice/water phase change in porous media: Numerical simulation and application. Cold Reg. Sci. Technol. 2011, 68, 74–84. [Google Scholar] [CrossRef]
- Tan, X.; Chen, W.; Wu, G.; Yang, J. Numerical simulations of heat transfer with ice-water phase change occurring in porous media and application to a cold-region tunnel. Tunn. Undergr. Space Technol. 2013, 38, 170–179. [Google Scholar] [CrossRef]
- Mai, J.T.; Chen, C.G. Influence of atmospheric temperature and airflow speed on temperature in Qinling tunnel. J. Shijiazhuang Railw. Inst. 1998, 11, 6–10. (In Chinese) [Google Scholar]
- He, C.X.; Wu, Z.W.; Zhu, L.N. Analysis of freeze- thaw condition in the surrounding rock wall of the Dabanshan tunnel in the Qilian mountains. J. Glaciol. Geocryol. 2000, 22, 113–120. (In Chinese) [Google Scholar]
- Barrow, H.; Pope, C.W. A simple analysis of flow and heat transfer in railway tunnels. Int. J. Heat Fluid Flow 1987, 8, 119–123. [Google Scholar] [CrossRef]
- Barrow, H.; Pope, C.W. Theoretical global energy analysis for a railway tunnel and its environment with special reference to periodic temperature change. In Proceedings of the 7th International Symposium on the Aerodynamics and Ventilation of Vehicle Tunnels, Brighton, UK, 27–29 November 1991; pp. 267–280. [Google Scholar]
- Liu, J.X.; Zhang, X.F.; Li, G.H.; Ma, X.C.; Fu, G.Y. Study on the Effects of Air Temperature Distribution by Flow State inside Cold Region Tunnel. Appl. Mech. Mater. 2012, 170, 1455–1462. [Google Scholar] [CrossRef]
- Zhou, X.; Zeng, Y.; Fan, L. Temperature field analysis of a cold-region railway tunnel considering mechanical and train-induced ventilation effects. Appl. Therm. Eng. 2016, 100, 114–124. [Google Scholar] [CrossRef]
- Tan, X.; Chen, W.; Wu, G.; Yang, J. Study of airflow in a cold-region tunnel using a standard k-ε turbulence model and air-rock heat transfer characteristics: Validation of the CFD results. Heat Mass Transf. 2013, 49, 327–336. [Google Scholar] [CrossRef]
- Lacasse, D.; Turgeon, E.; Pelletier, D. On the judicious use of the k – ε model, wall functions and adaptivity. Int. J. Therm. Sci. 2004, 43, 925–938. [Google Scholar] [CrossRef]
- Bonacina, C.; Comini, G.; Fasano, A.; Primicerio, M. Numerical solution of phase-change problems. Int. J. Heat Mass Transf. 1973, 16, 1825–1832. [Google Scholar] [CrossRef]
- Zhang, Z.R. Heat Transfer; Higher Educational Press: Beijing, China, 1989; pp. 133–134. [Google Scholar]
- Lai, Y.M.; Zhang, X.F.; Yu, W.B.; Zhang, S.J.; Liu, Z.Q.; Xiao, J.Z. Three-dimensional nonlinear analysis for the coupled problem of the heat transfer of the surrounding rock and the heat convection between the air and the surrounding rock in cold-region tunnel. Tunn. Undergr. Space Technol. 2005, 20, 323–332. [Google Scholar]
Figure 1.
Flowchart of the coupling heat transfer calculation.

Figure 2.
Cross-section of Dege tunnel (in cm).

Figure 3.
Longitudinal section and the air-lining heat transfer model of the Dege tunnel. (a) Longitudinal section of Dege tunnel (K0 + 000 m–K2 + 943 m) and (b) The air-lining heat transfer model of Dege tunnel (mechanical ventilation in the longitudinal direction).
Figure 3.
Longitudinal section and the air-lining heat transfer model of the Dege tunnel. (a) Longitudinal section of Dege tunnel (K0 + 000 m–K2 + 943 m) and (b) The air-lining heat transfer model of Dege tunnel (mechanical ventilation in the longitudinal direction).

Figure 4.
Installation process of the heat-insulating layer in Dege tunnel: (a) during installation and (b) after installation.
Figure 4.
Installation process of the heat-insulating layer in Dege tunnel: (a) during installation and (b) after installation.

Figure 5.
Instrumentations of the field test: (a) temperature sensors and (b) measuring hole.
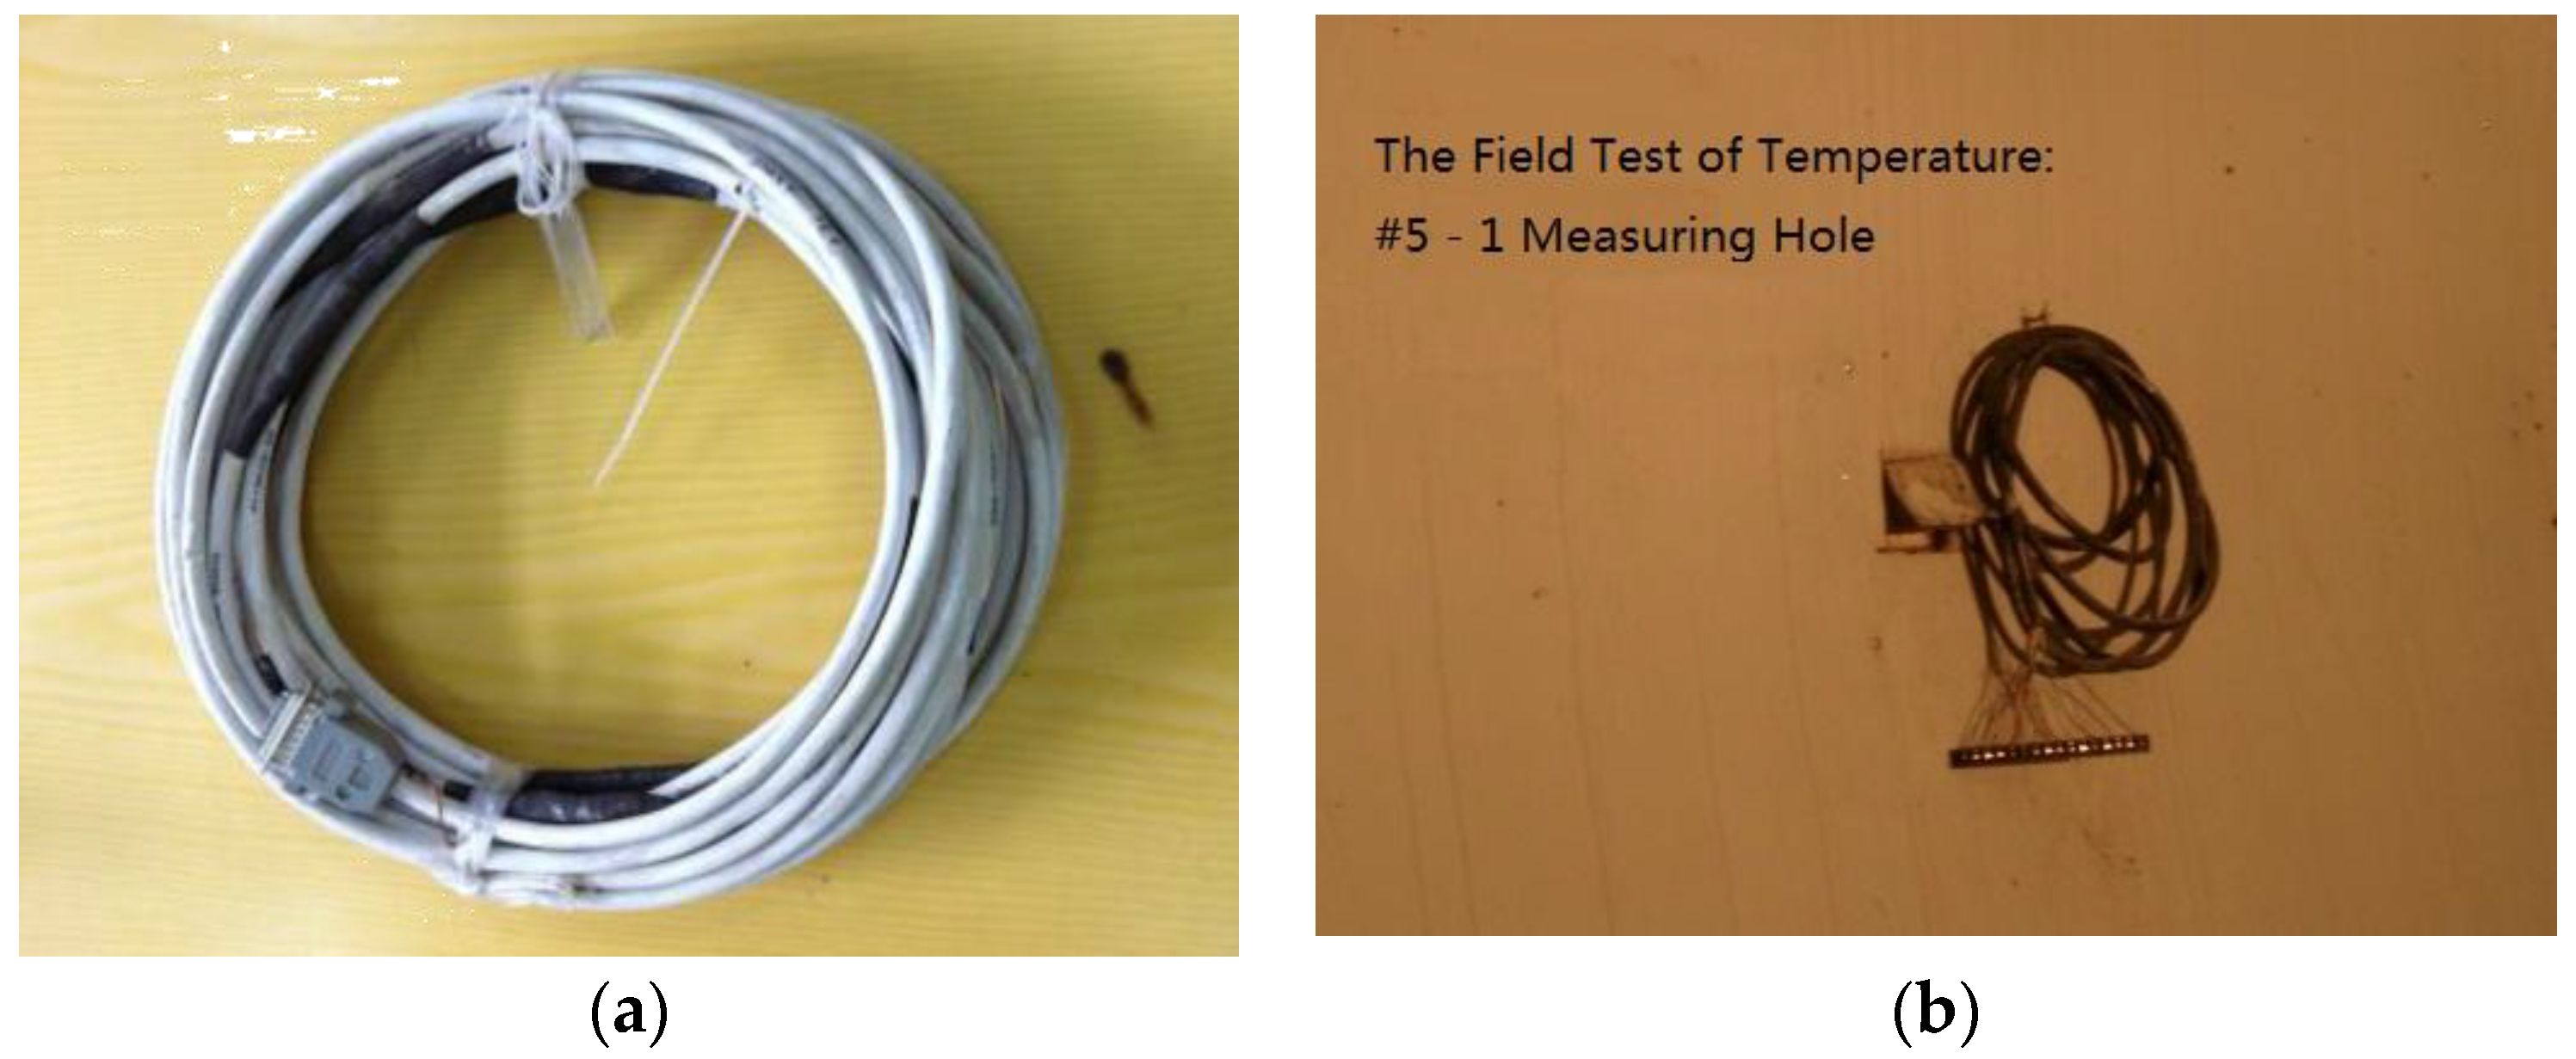
Figure 6.
Layout of measuring holes and temperature sensors in the field test of the Dege tunnel.

Figure 7.
Employed three-dimensional model for the Dege tunnel.

Figure 8.
Test-numerical comparisons for: (a) tunnel vault at section C1, (b) spandrel of tunnel at section C1, (c) vault of tunnel at section C2, (d) spandrel of tunnel at section C2, (e) vault of tunnel at section C3, (f) spandrel of tunnel at section C3, (g) vault of tunnel at section C4 and (h) spandrel of tunnel at section C4.

Figure 9.
Average airflow temperature contours in December in the tunnel entrance and exit sections. (a) Tunnel entrance section without heat-insulating layer; (b) Tunnel entrance section with heat-insulating layer covering K0 + 000–K0 + 700; (c) Tunnel exit section without heat-insulating layer; and (d) Tunnel exit section with heat-insulating layer covering K2 + 343–K2 + 943.
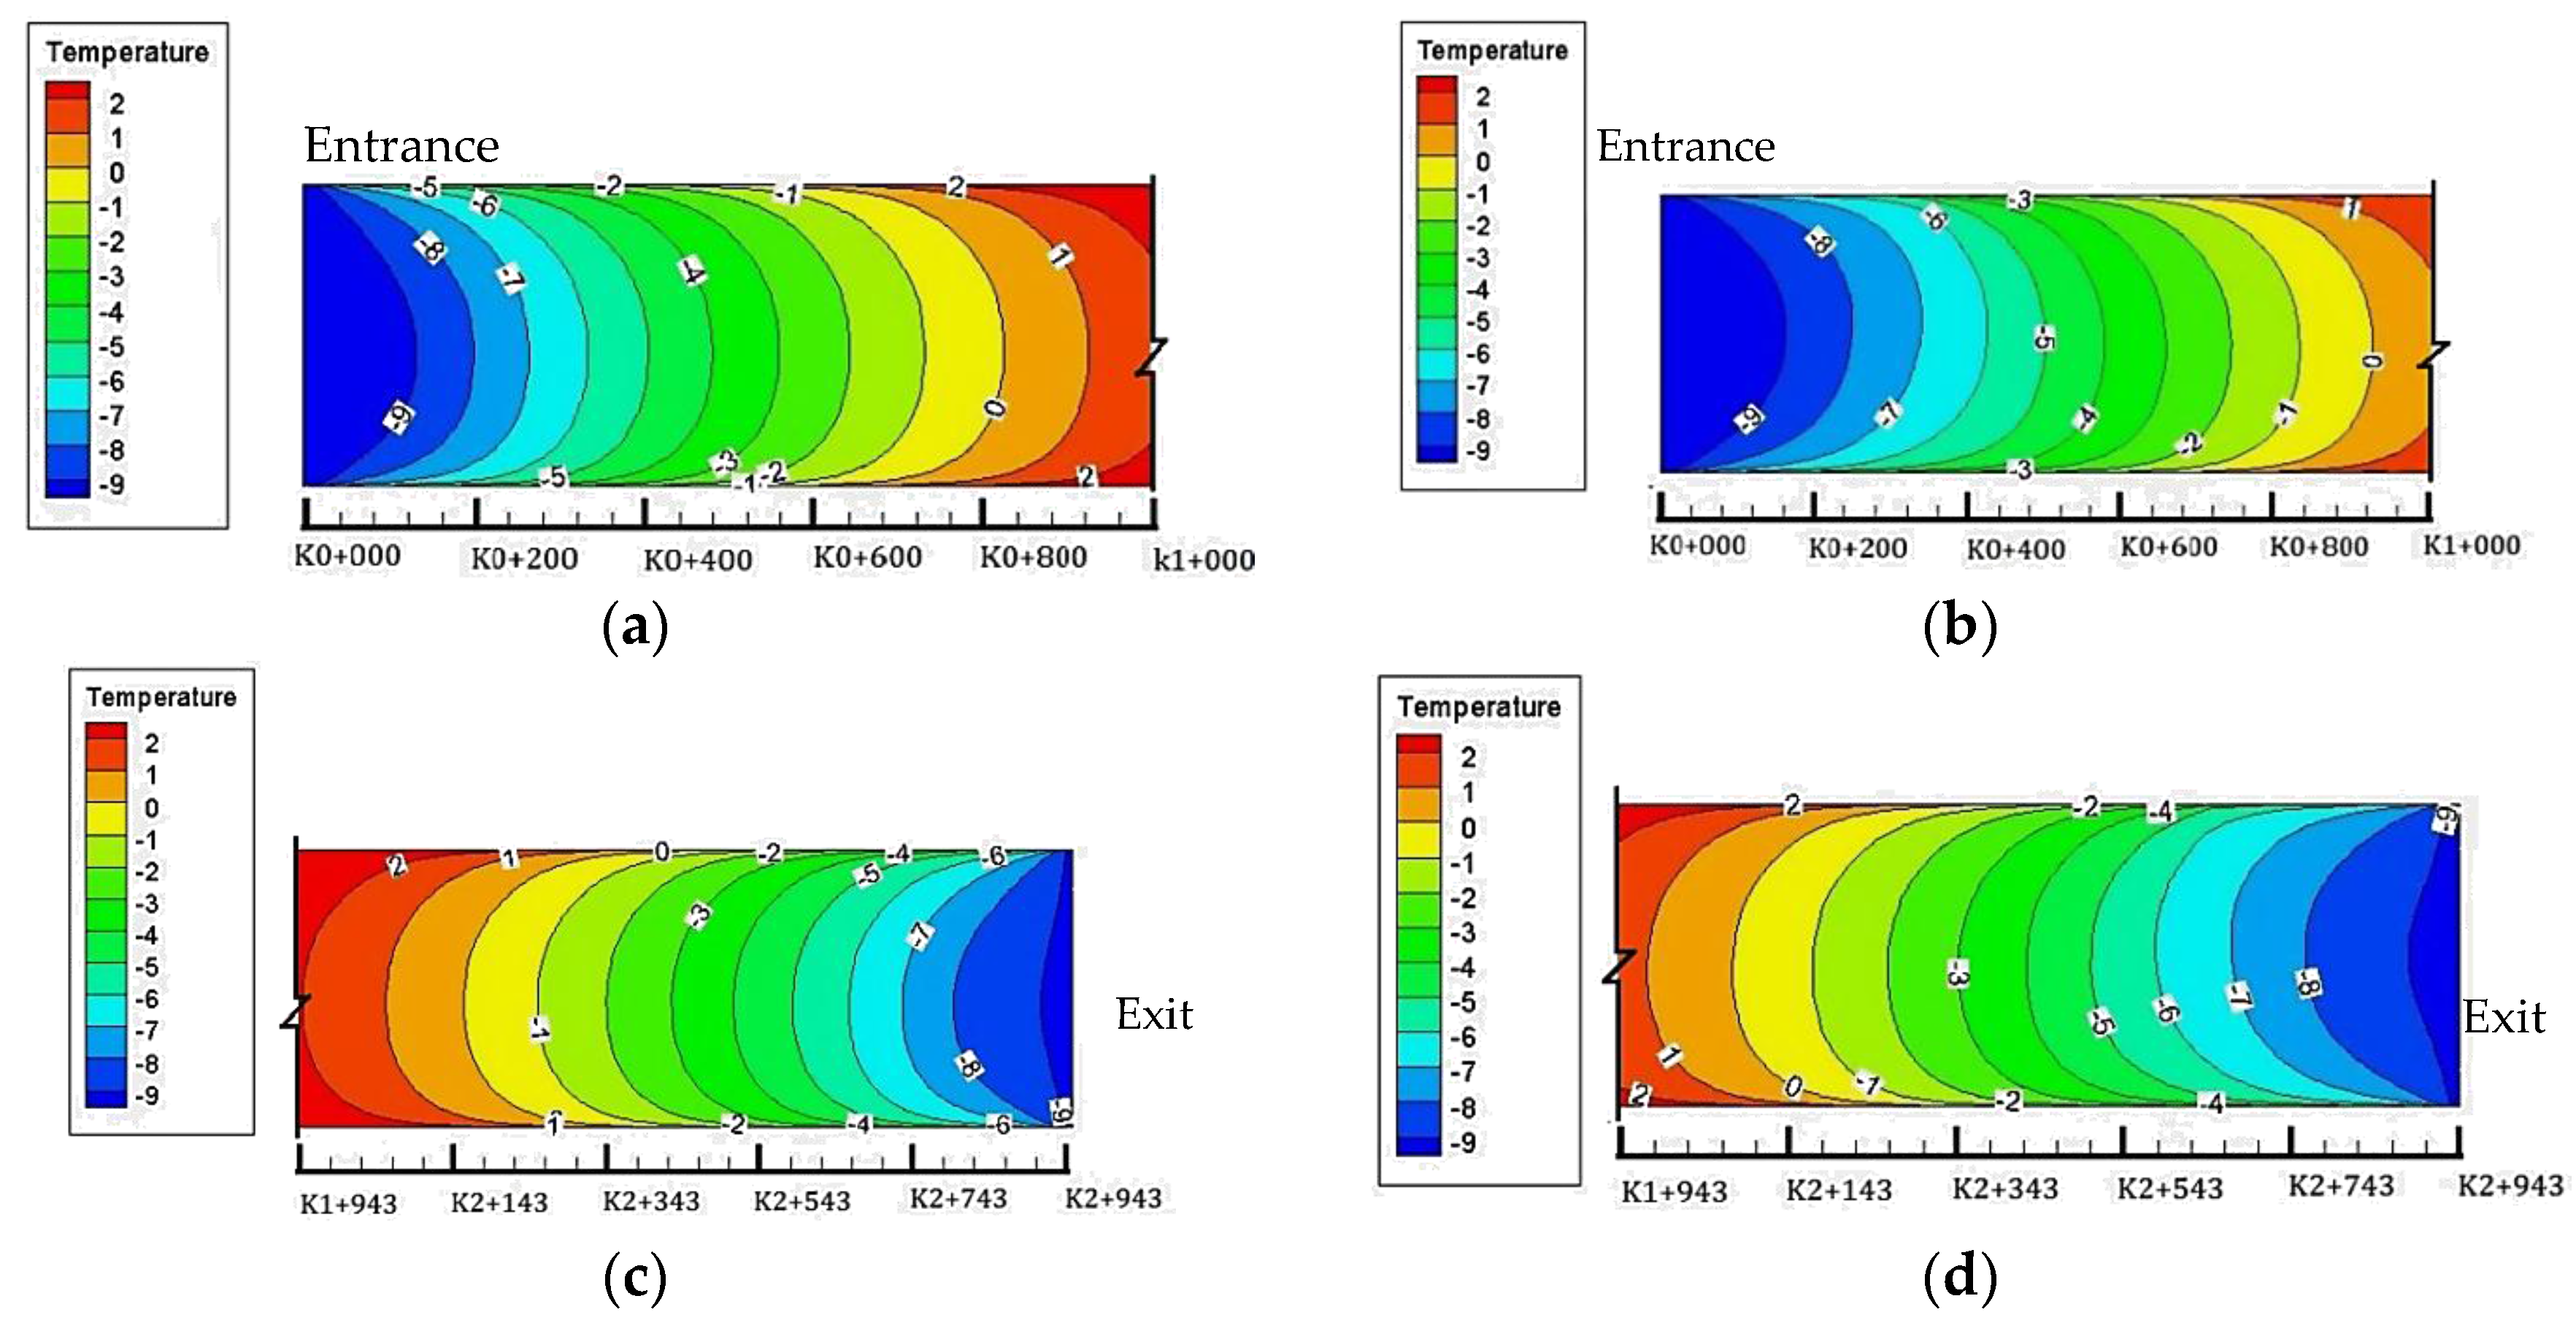
Figure 10.
Monthly average airflow temperature curves on the tunnel vault surface in the entrance section: (a) without heat-insulating layer and (b) with heat-insulating layer.
Figure 10.
Monthly average airflow temperature curves on the tunnel vault surface in the entrance section: (a) without heat-insulating layer and (b) with heat-insulating layer.
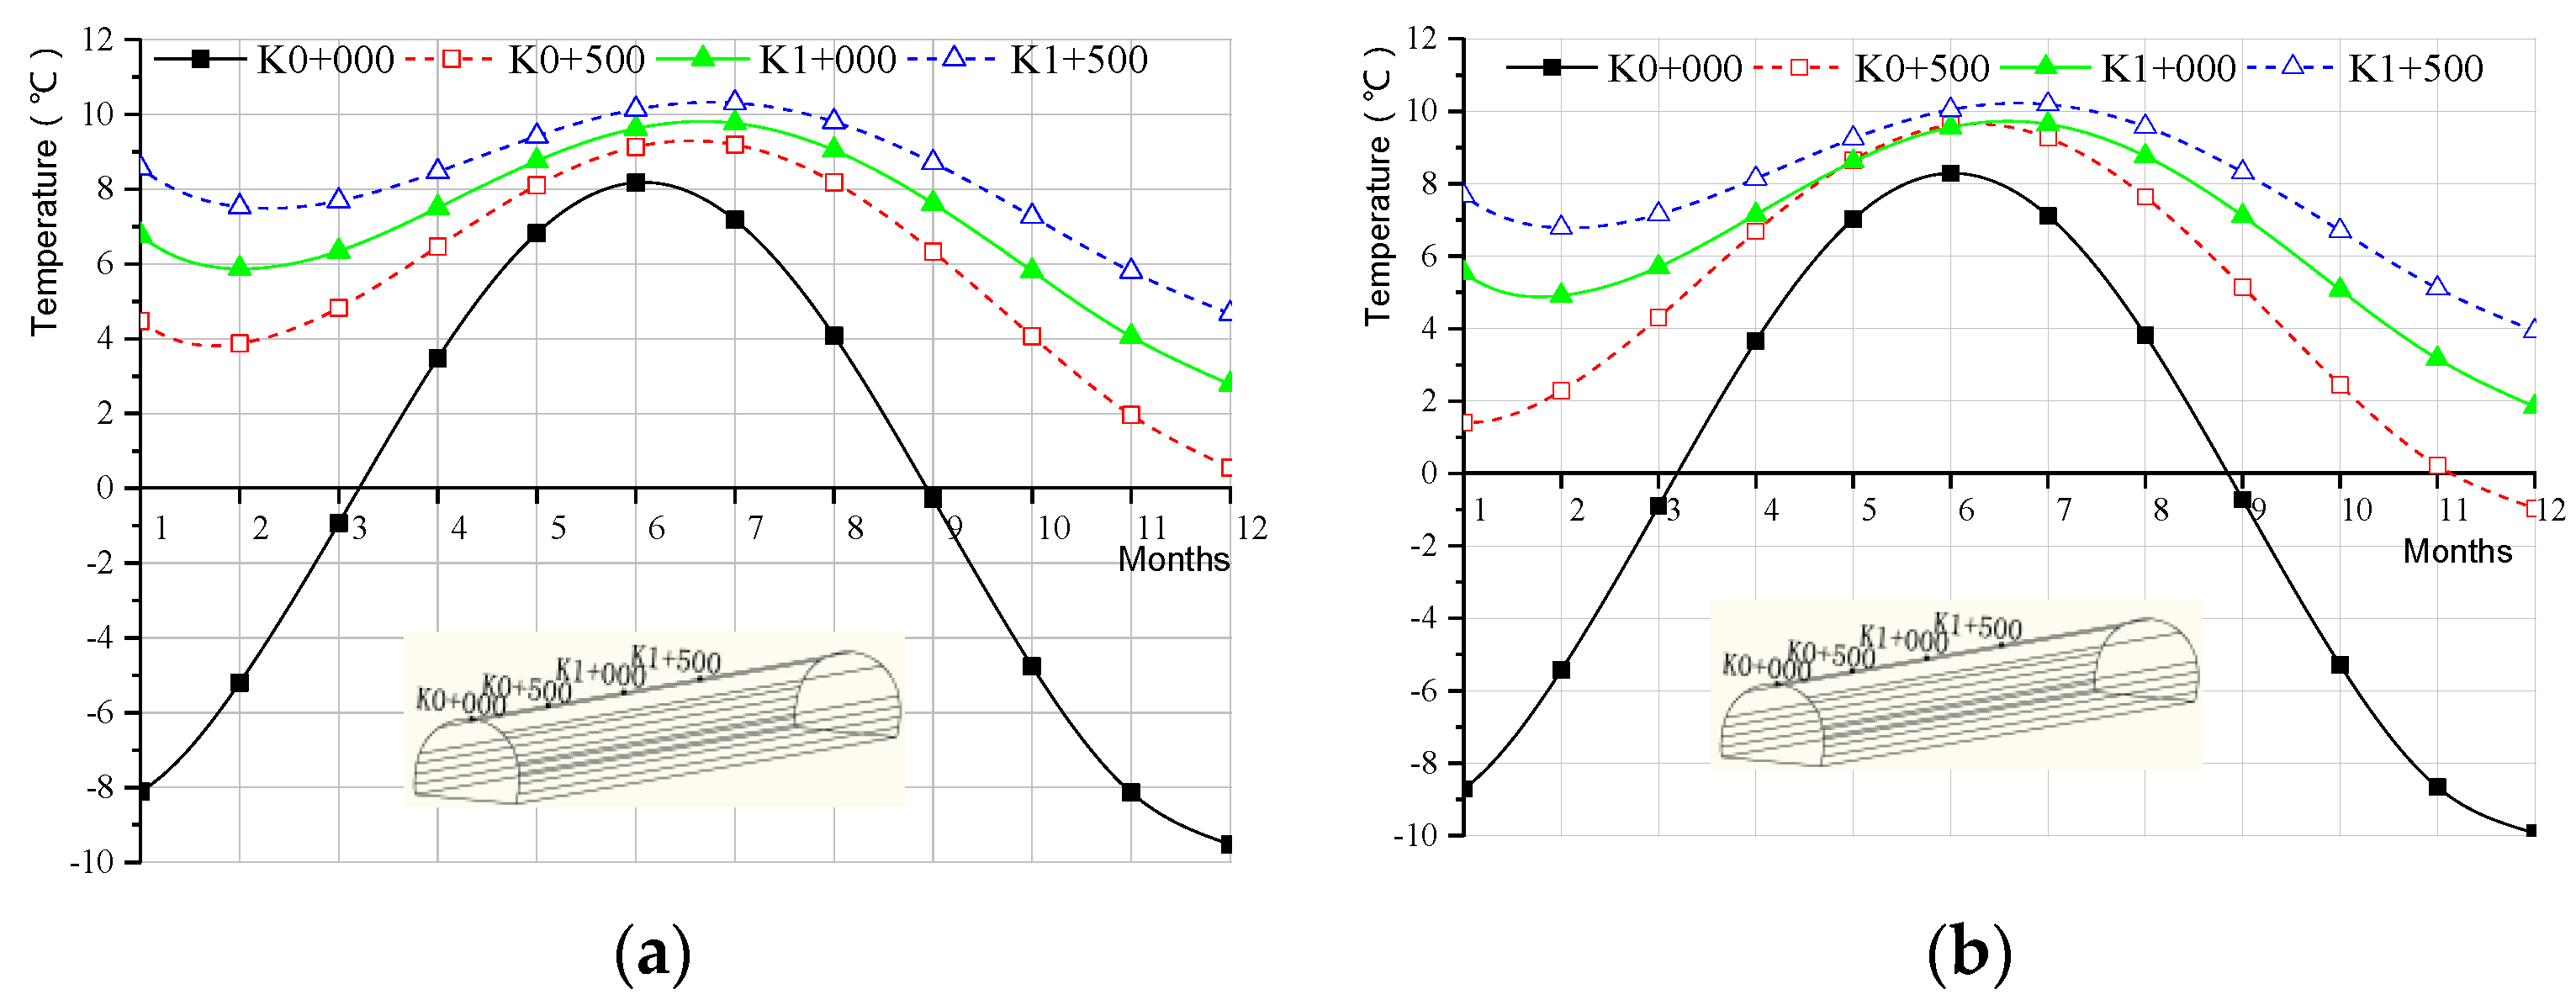
Figure 11.
Average temperature contours in December of the secondary lining and lane plate: (a) without heat-insulating layer and (b) with heat-insulating layer (cross-section K0 + 015).
Figure 11.
Average temperature contours in December of the secondary lining and lane plate: (a) without heat-insulating layer and (b) with heat-insulating layer (cross-section K0 + 015).

Figure 12.
Monthly average temperature curves at different locations on the surface of secondary lining and lane plate: (a) without heat-insulating layer and (b) with heat-insulating layer (cross-section K0 + 015).
Figure 12.
Monthly average temperature curves at different locations on the surface of secondary lining and lane plate: (a) without heat-insulating layer and (b) with heat-insulating layer (cross-section K0 + 015).

Figure 13.
Average temperature of surrounding rock in December: (a) without heat-insulating layer (°C) and (b) with heat-insulating layer (°C) (cross-section K0 + 015).
Figure 13.
Average temperature of surrounding rock in December: (a) without heat-insulating layer (°C) and (b) with heat-insulating layer (°C) (cross-section K0 + 015).

Figure 14.
Monthly average temperature curves of surrounding rock at tunnel vault: (a) without heat-insulating layer and (b) with heat-insulating layer (K0 + 015 cross-section).
Figure 14.
Monthly average temperature curves of surrounding rock at tunnel vault: (a) without heat-insulating layer and (b) with heat-insulating layer (K0 + 015 cross-section).

Figure 15.
Average temperature in December of the surface of the tunnel secondary lining in the longitudinal direction (with different thicknesses of the heat-insulating layer): (a) under 5 m/s mechanical ventilation condition and (b) under 6 m/s mechanical ventilation condition.
Figure 15.
Average temperature in December of the surface of the tunnel secondary lining in the longitudinal direction (with different thicknesses of the heat-insulating layer): (a) under 5 m/s mechanical ventilation condition and (b) under 6 m/s mechanical ventilation condition.

Figure 16.
Average temperature in December of the surface of the tunnel secondary lining in the longitudinal direction (with different lengths of the heat-insulating layer): (a) under 5 m/s mechanical ventilation condition and (b) under mechanical 6 m/s ventilation condition.
Figure 16.
Average temperature in December of the surface of the tunnel secondary lining in the longitudinal direction (with different lengths of the heat-insulating layer): (a) under 5 m/s mechanical ventilation condition and (b) under mechanical 6 m/s ventilation condition.


Table 1.
Thermal physical parameters.
| Material | Density (kg/m3) | Heat Capacity (Unfrozen Zone) (J/kg∙°C) | Heat Capacity (Frozen Zone) (J/kg∙°C) | Thermal Conductivity (Unfrozen Zone) (w/m∙°C) | Thermal Conductivity (Frozen Zone) (w/m∙°C) |
|---|---|---|---|---|---|
| Surrounding rock | 2450 | 1178 | 896 | 1.91 | 2.77 |
| Concrete material | 2385 | 970 | 970 | 1 | 1 |
| FLOLIC | 60 | 230 | 230 | 0.024 | 0.024 |
Table 2.
Thermal physical parameters for different heat-insulating materials.
| Material Type | Density (kg/m3) | Heat Capacity (Unfrozen Zone) (J/kg∙°C) | Heat Capacity (Frozen Zone) (J/kg∙°C) | Conductivity (Unfrozen Zone) (w/m∙°C) | Conductivity (Frozen Zone) (w/m∙°C) |
|---|---|---|---|---|---|
| Polyurethane | 45 | 185 | 185 | 0.027 | 0.027 |
| Stem method aluminosilicate sheet | 188 | 320 | 320 | 0.038 | 0.038 |
Table 3.
Optimization of design thickness for different heat-insulating materials.
| Material Type | Covering Section | Different Thickness for Insulating Layer (cm) | Lining Length in Negative Temperature at Tunnel Ends (m) | Reasonable Thicknesses (cm) |
|---|---|---|---|---|
| FLOLIC | Entrance | 2 | 55 | 4 |
| 4 | 0 | |||
| 6 | 0 | |||
| Exit | 2 | 31 | 4 | |
| 4 | 0 | |||
| 6 | 0 | |||
| Polyurethane | Entrance | 2 | 78 | 6 |
| 4 | 21 | |||
| 6 | 0 | |||
| Exit | 2 | 49 | 6 | |
| 4 | 18 | |||
| 6 | 0 | |||
| Stem method aluminosilicate sheet | Entrance | 2 | 94 | 6 |
| 4 | 47 | |||
| 6 | 0 | |||
| Exit | 2 | 52 | 6 | |
| 4 | 29 | |||
| 6 | 0 |
Table 4.
Optimization of design length for different heat-insulating materials.
| Material Type | Covering Section | Different Lengths (m) for Insulating Layer with Certain Thickness | Lining Length in Negative Temperature at the End of Insulating Layer (m) | Reasonable Lengths (m) |
|---|---|---|---|---|
| FLOLIC | Entrance | 500 (4 cm thickness) | 74 | 700 |
| 600 (4 cm thickness) | 25 | |||
| 700 (4 cm thickness) | 0 | |||
| Exit | 500 (4 cm thickness) | 52 | 600 | |
| 600 (4 cm thickness) | 0 | |||
| 700 (4 cm thickness) | 0 | |||
| Polyurethane | Entrance | 600 (6 cm thickness) | 85 | 800 |
| 700 (6 cm thickness) | 37 | |||
| 800 (6 cm thickness) | 0 | |||
| Exit | 600 (6 cm thickness) | 48 | 700 | |
| 700 (6 cm thickness) | 0 | |||
| 800 (6 cm thickness) | 0 | |||
| Stem method aluminosilicate sheet | Entrance | 600 (6 cm thickness) | 33 | 700 |
| 700 (6 cm thickness) | 0 | |||
| 800 (6 cm thickness) | 0 | |||
| Exit | 600 (6 cm thickness) | 17 | 600 | |
| 700 (6 cm thickness) | 0 | |||
| 800 (6 cm thickness) | 0 |
© 2017 by the authors. Licensee MDPI, Basel, Switzerland. This article is an open access article distributed under the terms and conditions of the Creative Commons Attribution (CC BY) license (http://creativecommons.org/licenses/by/4.0/).
Share and Cite
MDPI and ACS Style
Yan, Q.; Li, B.; Zhang, Y.; Yan, J.; Zhang, C. Numerical Investigation of Heat-Insulating Layers in a Cold Region Tunnel, Taking into Account Airflow and Heat Transfer. Appl. Sci. 2017, 7, 679. https://doi.org/10.3390/app7070679
AMA Style
Yan Q, Li B, Zhang Y, Yan J, Zhang C. Numerical Investigation of Heat-Insulating Layers in a Cold Region Tunnel, Taking into Account Airflow and Heat Transfer. Applied Sciences. 2017; 7(7):679. https://doi.org/10.3390/app7070679
Chicago/Turabian StyleYan, Qixiang, Binjia Li, Yanyang Zhang, Jian Yan, and Chuan Zhang. 2017. "Numerical Investigation of Heat-Insulating Layers in a Cold Region Tunnel, Taking into Account Airflow and Heat Transfer" Applied Sciences 7, no. 7: 679. https://doi.org/10.3390/app7070679
Note that from the first issue of 2016, this journal uses article numbers instead of page numbers. See further details here.