Article

Computer Color Matching and Levelness of PEG-Based Reverse Micellar Decamethyl cyclopentasiloxane (D5) Solvent-Assisted Reactive Dyeing on Cotton Fiber

1
Institute of Textiles and Clothing, The Hong Kong Polytechnic University, Hung Hom, Kowloon, Hong Kong, China
2
Department of Applied Biology and Chemical Technology, The Hong Kong Polytechnic University, Hung Hom, Kowloon, Hong Kong, China
*
Author to whom correspondence should be addressed.
Appl. Sci. 2017, 7(7), 682; https://doi.org/10.3390/app7070682
Submission received: 7 June 2017 / Revised: 26 June 2017 / Accepted: 28 June 2017 / Published: 2 July 2017

Abstract

:
The color matching and levelness of cotton fabrics dyed with reactive dye, in a non-aqueous environmentally-friendly medium of decamethylcyclopentasiloxane (D5), was investigated using the non-ionic surfactant reverse-micellar approach comprised of poly(ethylene glycol)-based surfactant. The calibration dyeing databases for both conventional water-based dyeing and D5-assisted reverse micellar dyeing were established, along with the dyeing of standard samples with predetermined concentrations. Computer color matching (CCM) was conducted by using different color difference formulae for both dyeing methods. Experimental results reveal that the measured concentrations were nearly the same as the expected concentrations for both methods. This indicates that the D5-assisted non-ionic reverse micellar dyeing approach can achieve color matching as good as the conventional dyeing system. The levelness of the dyed samples was measured according to the relative unlevelness indices (RUI), and the results reveal that the samples dyed by the D5 reverse micellar dyeing system can achieve good to excellent levelness comparable to that of the conventional dyeing system.

1. Introduction

Textile wet processing has long been considered to be a significant consumer of water and producer of effluents [1,2]. In the conventional water-based reactive dyeing process, large amounts of salt were required to eliminate the repulsion force between dye molecules and the fiber surface, in order to enhance dye affinity and accelerate dye absorption [3]. To reduce effluent discharges and save environmental cost, alternatives such as low-salt or salt-free dyeing [4,5,6], dyeing using natural mordants [7,8,9], reusing wastewater for dyeing [10] and supercritical carbon dioxide dyeing [11,12,13] have been tried and are being used.
For reasons related to the need for ecological friendliness, energy saving and safety of the working environment, the use of reverse micelles has also been considered as one of the mediums for non-aqueous dyeing [14,15]. The reverse micelles are nanoscale spherical aggregates, which are self-assembled by certain surfactants in non-polar media [16,17]. Their ability to solubilize a small amount of water in the interior region can provide a stable aqueous micro-environment (water-pool) in non-aqueous media. Attempts have been made to dye cotton with non-ionic reverse micelles in non-aqueous media [18,19,20]. A previous study has also investigated the feasibility of dyeing cotton in heptane and octane solvent using polyethylene glycol (PEG)-based nonionic reverse micelles [15]. In our previous study [15], we found that good dyeing results could be achieved in the case of dyeing cotton with reactive dyes without the use of salt as an exhausting agent. In conventional water-based dyeing of cotton with reactive dyes, large amounts of salt are required to promote dye exhaustion. The residual amount of salt in the effluent causes high loading in the subsequent wastewater treatment [21].
Since different colors are produced based on the primary colors (red, yellow and blue) and the appearance of the textile products is mostly a mixture of colors, color matching is of great importance in industrial applications. Computer color matching (CCM) is one of the modern advanced technologies combining the use of computer and colorimetry knowledge for the realization of color measure and recipe prediction [22]. It is a system involving the use of Kubelka-Munk theory and color difference formulae for colorant formulation. Computer color matching continues to be studied and applied in textile dyeing and printing [23,24,25,26]. However, the feasibility of applying the computer color matching system on decamethylcyclopentasiloxane (D5) non-aqueous dyeing of cotton has not yet been studied.
Color difference formulae are widely used for quality control, computer color matching, shade sorting and colorfastness evaluation. There are mainly two different usages of color difference formulae in computer color matching: (a) to determine the colorimetric closeness of the computed formula to the target; and (b) to calculate the metameric indices. In 1976, The International Commission on Illumination (CIE) recommended the use of two color difference formulae: CIELAB and CIELUV [27]. More advanced color difference formulae, such as CMC, BFD, CIE94 and LCD, were developed later, and finally, all datasets were used to develop the CIEDE2000 formula [28]. Several color difference formulae were still widely used in industrial applications, such as CIELAB, Hunter Lab, FMC-2, CMC and CIELUV [29]. With the use of such a system, the most accurate recipe, which is of good quality and is inexpensive, can be generated from the established database.
The aesthetic appeal of the color of a textile product is often regarded as the first factor that arouses the interest of the customers. Therefore, the color performance during use is of great importance in terms of the expectations of the customers [30]. Color levelness is a description of the uniformity of the color shade in different places of the fabric [31,32]. The appearance of color uniformity, in terms of levelness parameters in dyed fabrics and/or a union shade in dyed fabrics of more than one fiber type, is one of the main concerns in textile manufacturing industries [33]. In order to measure the color levelness of dyed materials, an objective method, named the relative unlevelness index (RUI), which takes into account the coefficients of variation of reflectance measured over the visible spectrum with appropriate consideration of human vision sensitivity, was developed [34].
Decamethylcyclopentasiloxane (D5) is a clear, odorless, colorless and non-oily cyclic siloxane solvent (C10H30O5Si5), commonly used in consumer and industrial applications [35,36]. It has been widely used as a medium in dry cleaning applications, and it has also shown the potential to be used as a medium in home laundering. The impact of D5-washing on fabric performance has been investigated [37]. Recently, attempts have been made for the preparation of D5 reverse micelles and the evaluation of water solubilization performance in the dyeing system [35]. Further experiments were conducted to develop a dye/D5 suspension dyeing system using a selected surfactant [36,38,39]. The hydrolysis kinetics of this system was also studied [40]. However, the feasibility of applying the computer color matching system on decamethylcyclopentasiloxane (D5) non-aqueous dyeing of cotton is still unknown.
This study has several objectives: (a) establishing the calibration of the dyeing database for both conventional water-based dyeing and D5 solvent-assisted reverse micellar dyeing; (b) dyeing of standard samples with predetermined concentrations of reactive dyes using the conventional water-based dyeing method and the D5 solvent-assisted reverse micellar dyeing method; (c) conducting computer color matching to generate the dyeing recipe by using different color difference formulae to ensure that concentrations of the dyed standard samples match the concentrations of the batch samples; (d) measuring the color levelness of dyed samples; and (e) comparing the differences between conventional water-based dyeing and D5 solvent-assisted dyeing.

2. Experimental Section

2.1. Materials and Reagents

Commercially ready-for-dyeing pure cotton interlock knitted fabrics, 40 wales per inch (wpi) and 40 course per inch (cpi), were first cleaned with a solution containing 2 g/L soda ash and 2 g/L soap with a thermal-control shaker at a temperature of 90 °C for 30 min, thoroughly rinsed with cold water and dried at room temperature. After that, the cleaned fabrics were conditioned at relative humidity (RH) of 65% ± 2% and 20 ± 2 °C for at least 24 h before further experiment. Nonionic surfactant poly(ethylene glycol) (12) tridecyl ether (C13H27(OCH2CH2)nOH) (Sigma-Aldrich, St. Louis, MO, USA) (n=12) was used. Decamethylcyclopentasiloxane (D5) (Green Earth Cleaning, Kansas City, MO, USA) was used as the organic solvent, and n-octanol (Alfa Aesar, Heysham, UK) was used as the co-surfactant in the dyeing process. Sodium chloride (NaCl) (VWR Chemicals, Leuven, Belgium), i.e., salt, was used as the exhausting agent, in conventional dyeing. Soda ash (Na2CO3) (Sigma-Aldrich, St. Louis, MO, USA) was used as the color fixing agent. Both surfactant, solvent, co-surfactant, sodium chloride and soda ash were of reagent grade. Three reactive dyes (types of Levafix Yellow CA, Levafix Red CA and Levafix Blue CA dye) (Dystar, Shanghai, China) were directly used without further purification.

2.2. Cotton Dyeing in Water

2.2.1. Preparation of Calibration Curves

Cotton interlock knitted fabrics were used. Calibration dyeing was conducted at a liquor-to-goods ratio of 50:1. The dyeing recipe was as shown in Table 1. The dyed sample used for preparing the calibration curves is termed as the “batch sample”.

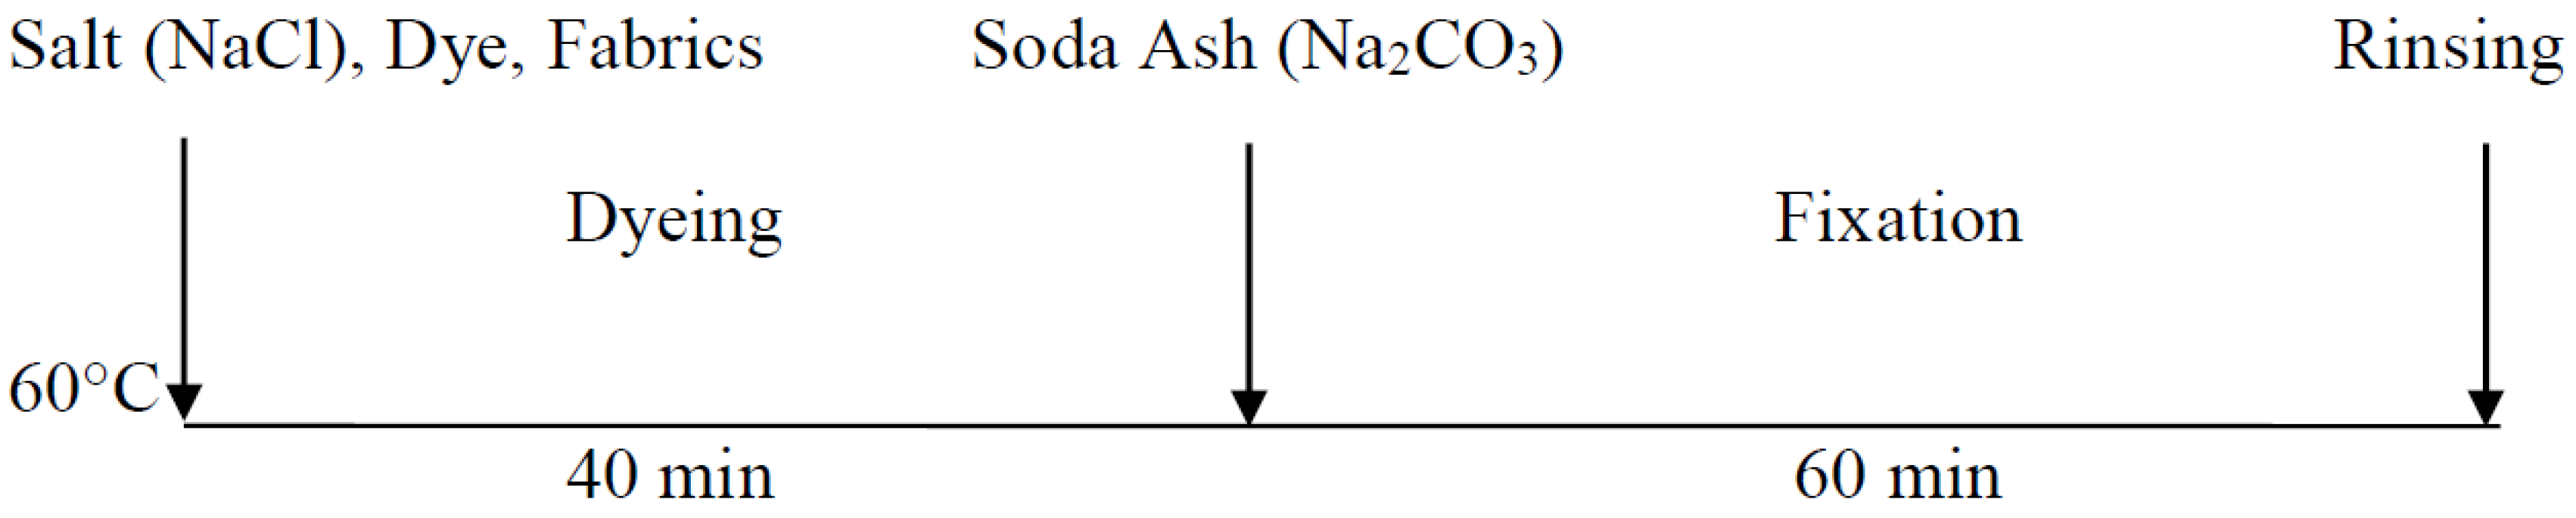
2.2.2. Conventional Dyeing Process

The amount of NaCl added was based on the concentration of reactive dye used (percentage on weight of fabric, % owf) (Table 1). Figure 1 depicts the dyeing profile of conventional water-based dyeing. The cotton fabric was first immersed in the dye liquor, and the prepared dye liquor was then poured into a shaking water bath. The dyeing process was conducted at 60 °C with 165 shakes/min for 40 min. After that, the corresponding amount of Na2CO3 (based on Table 1) was added into the dye liquor for color fixation. The fixation process was then conducted at 60 °C with 165 shakes/min for 60 min. In order to remove the unfixed dye and residues on the fabrics, soaping was conducted after the fixation process by immersing the dyed cotton fabric in soap solution (2 g/L) and rinsing for 15 min at 60 °C with a shaking speed of 165 shakes/min. The cotton fabric was then rinsed with water, air-dried and conditioned at relative humidity of 65% ± 2% and 20 ± 2 °C for at least 24 h before further experiment.

2.3. Cotton Dyeing in the Solvent Reverse Micellar System

2.3.1. Preparation of PEG-Based Reverse Micelle Dye Liquors

Series of PEG-based reverse micelles were prepared by a simple injection method at room temperature. The non-ionic surfactant (PEG) and co-surfactant (n-octanol) were first premixed (with agitation). The surfactant to co-surfactant ratio was 1:8, and the molar ratio was 1:1.49 (in weight ratio). The surfactant/co-surfactant mixture was then dissolved in D5 solvent to obtain the organic surfactant solution for facilitating the self-assembly of PEG-based reverse micelles. The solvent volume to cotton weight ratio was 8:1. A controlled amount of reactive dye aqueous solution was then added into the reverse micellar system dropwise. After the injection of the dye solution, the mixture was vigorously stirred for 2 min until a well-dispersed solution with reverse micelle encapsulated reactive dye was obtained.

2.3.2. Preparation of Calibration Curves

Cotton interlock knitted fabrics were used. Calibration dyeing (with dye concentrations of 0.5%, 1.5%, 2.5%, 3.5% and 6.0% owf) was conducted at surfactant to water ratio of 1:30, in molar ratio (0.033:1 in mole ratio or 1:0.778 in weight ratio). The dyed sample used for preparing the calibration curves is termed as the “batch sample”.

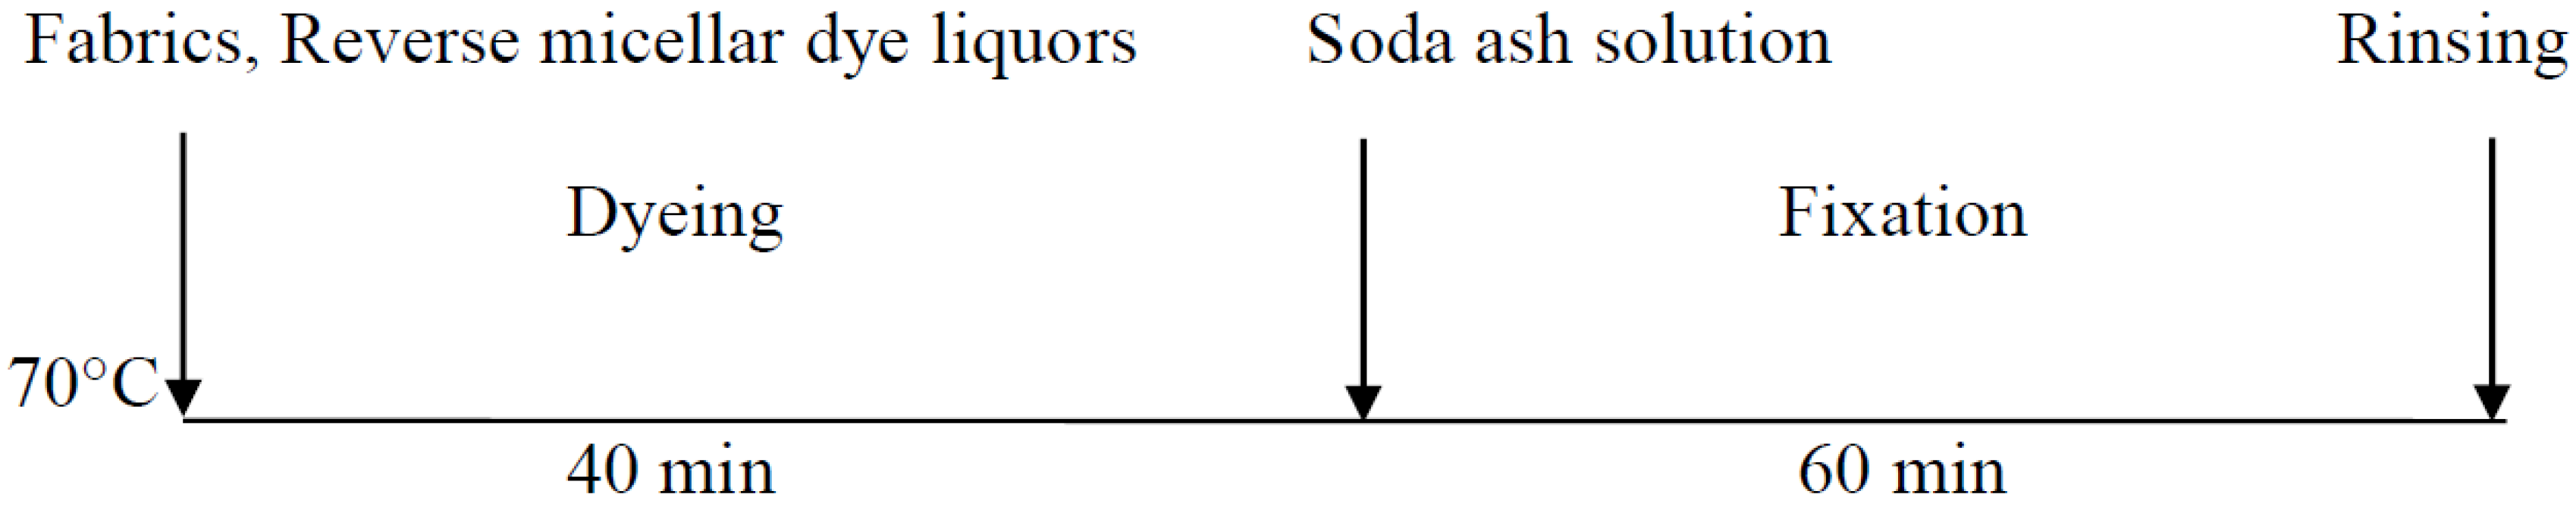
2.3.3. Reverse Micellar Dyeing Process

The reverse micellar dye liquor was prepared by adding the corresponding amount of surfactant, co-surfactant, dye solutions, D5 solvent and deionized water without adding salt. The dyeing profile of reverse micellar D5 solvent dyeing is as shown in Figure 2. The cotton fabric was first immersed in the reverse micellar dye liquor, and the prepared dye liquor was poured into a shaking water bath. The dyeing process was conducted at 70 °C with 165 shakes/min for 40 min. After that, the corresponding amount of soda ash (Table 2) was added into the dye liquor for dye fixation. The fixation process was conducted at 70 °C with 165 shakes/min for 60 min. Soaping was conducted after the fixation process by immersing the dyed cotton fabric in soap solution (2 g/L) and rinsing for 15 min at 60 °C with the shaking speed of 165 shakes/min. The rinsed cotton fabric was then further rinsed with water, air-dried and conditioned at relative humidity of 65% ± 2% and 20 ± 2° C for at least 24 h prior to further experiment.

2.3.4. Simulated Dyeing with Known Concentration of Dye

Simulated dyeing with a known concentration of dye was conducted to predict the dye concentration of the calibration dyeing of both conventional water-based and reverse micellar methods. Cotton interlock knitted fabrics were used. The dyed fabrics were regarded as the standard samples used for color matching. The concentration of dye of the standard sample for preparing the mixture of color was as shown in Table 3.

2.3.5. Establishment of Calibration Curves

Color yield of the dyed fabrics was measured by Color Eye 7000A Spectrophotometer (X-Rite, Grand Rapids, MI, USA). The reflectance and K/S values were measured. The K/S sum value was obtained by the summation of the K/S values measured from a 400–700 nm wavelength. The face of the dyed fabrics was measured. The condition of measurement was set under specular reflection with a large aperture diameter (30 mm). The opacity of the fabric was assured by folding the fabric two times. The calibration curves were prepared in graphic form by a plot of the K/S sum value versus the concentration of dye (%). Illuminant D65 and a standard observer of 10° were used.
The color yield, expressed as the K/S value, was calculated by Equation (1) at wavelengths of 400–700 nm with 10-nm intervals within the visible spectrum. The higher the K/S value, the more is the dye uptake and the better is the color yield.
K/S = (1 − R)2/2R,
where K is the absorption coefficient, depending on the concentration of the colorant, S is the scattering coefficient, caused by the dyed substrate, and R is the reflectance of the colored sample [41].

2.3.6. Prediction of the Dye Recipe with Different Color Difference Equations

Nine color difference equations were used for predicting the dye recipe, including CIE L*a*b*, CIE L*u*v*, ANLAB, Hunter lab, FMC2, JPC 79, CMC 1.0, BFD 1.0 and CIE94 1.0. Color yields of samples dyed with different concentrations of dye were measured by the Color Eye 7000A Spectrophotometer (X-Rite, Grand Rapids, MI, USA) using illuminant D65 under specular reflection and a standard observer of 10° with a large aperture diameter (30 mm). The color yield, expressed as the K/S value, was calculated by Equation (2).
K/Smixture = (K/S)1 + … + (K/S)n = K1/Ssub + … + Kn/Ssub + Ksub/Ssub,
where K1 to Kn are coefficients of the absorption of the dyes, Ksub and Ssub are the coefficients of absorption and scattering of the substrate, respectively [41].

2.3.7. Levelness Measurement

The relative unlevelness indices (RUI) are obtained by using the reflectance values of the three randomly-selected spots on standard and batch-dyed samples over the visible spectrum (λ = 400–700 nm) at intervals of 10 nm. The measurement was conducted by Color Eye 7000A Spectrophotometer (X-Rite, Grand Rapids, MI, USA) using illuminant D65 under specular reflection and a standard observer of 10° with a large aperture (30 mm).
The RUI mainly consisted of four equations: (a) the standard deviation (sλ) of reflectance values measured at a specific wavelength (Equation (3)); (b) the uncorrected relative unlevelness index (RUIu)
corrected relative unlevelness index (RUIc) obtained by the summation of the coefficients of variation of the reflectance values (Equation (5)); and (d) the relative unlevelness index (RUI) obtained by multiplying the coefficients of variation of reflectance by the photopic relative luminous efficiency function (Vλ) (Equation (6)) [34]. The suggested interpretation of the RUI values is as listed in Table 4.
s λ = i = 1 n ( R i R ¯ ) 2 n 1 ,
( R U I u ) = λ = 400 700 s λ ,
( R U I c ) = λ = 400 700 s λ / R ¯ ,
R U I = λ = 400 700 ( s λ / R ¯ )   V λ ,

3. Results and Discussion

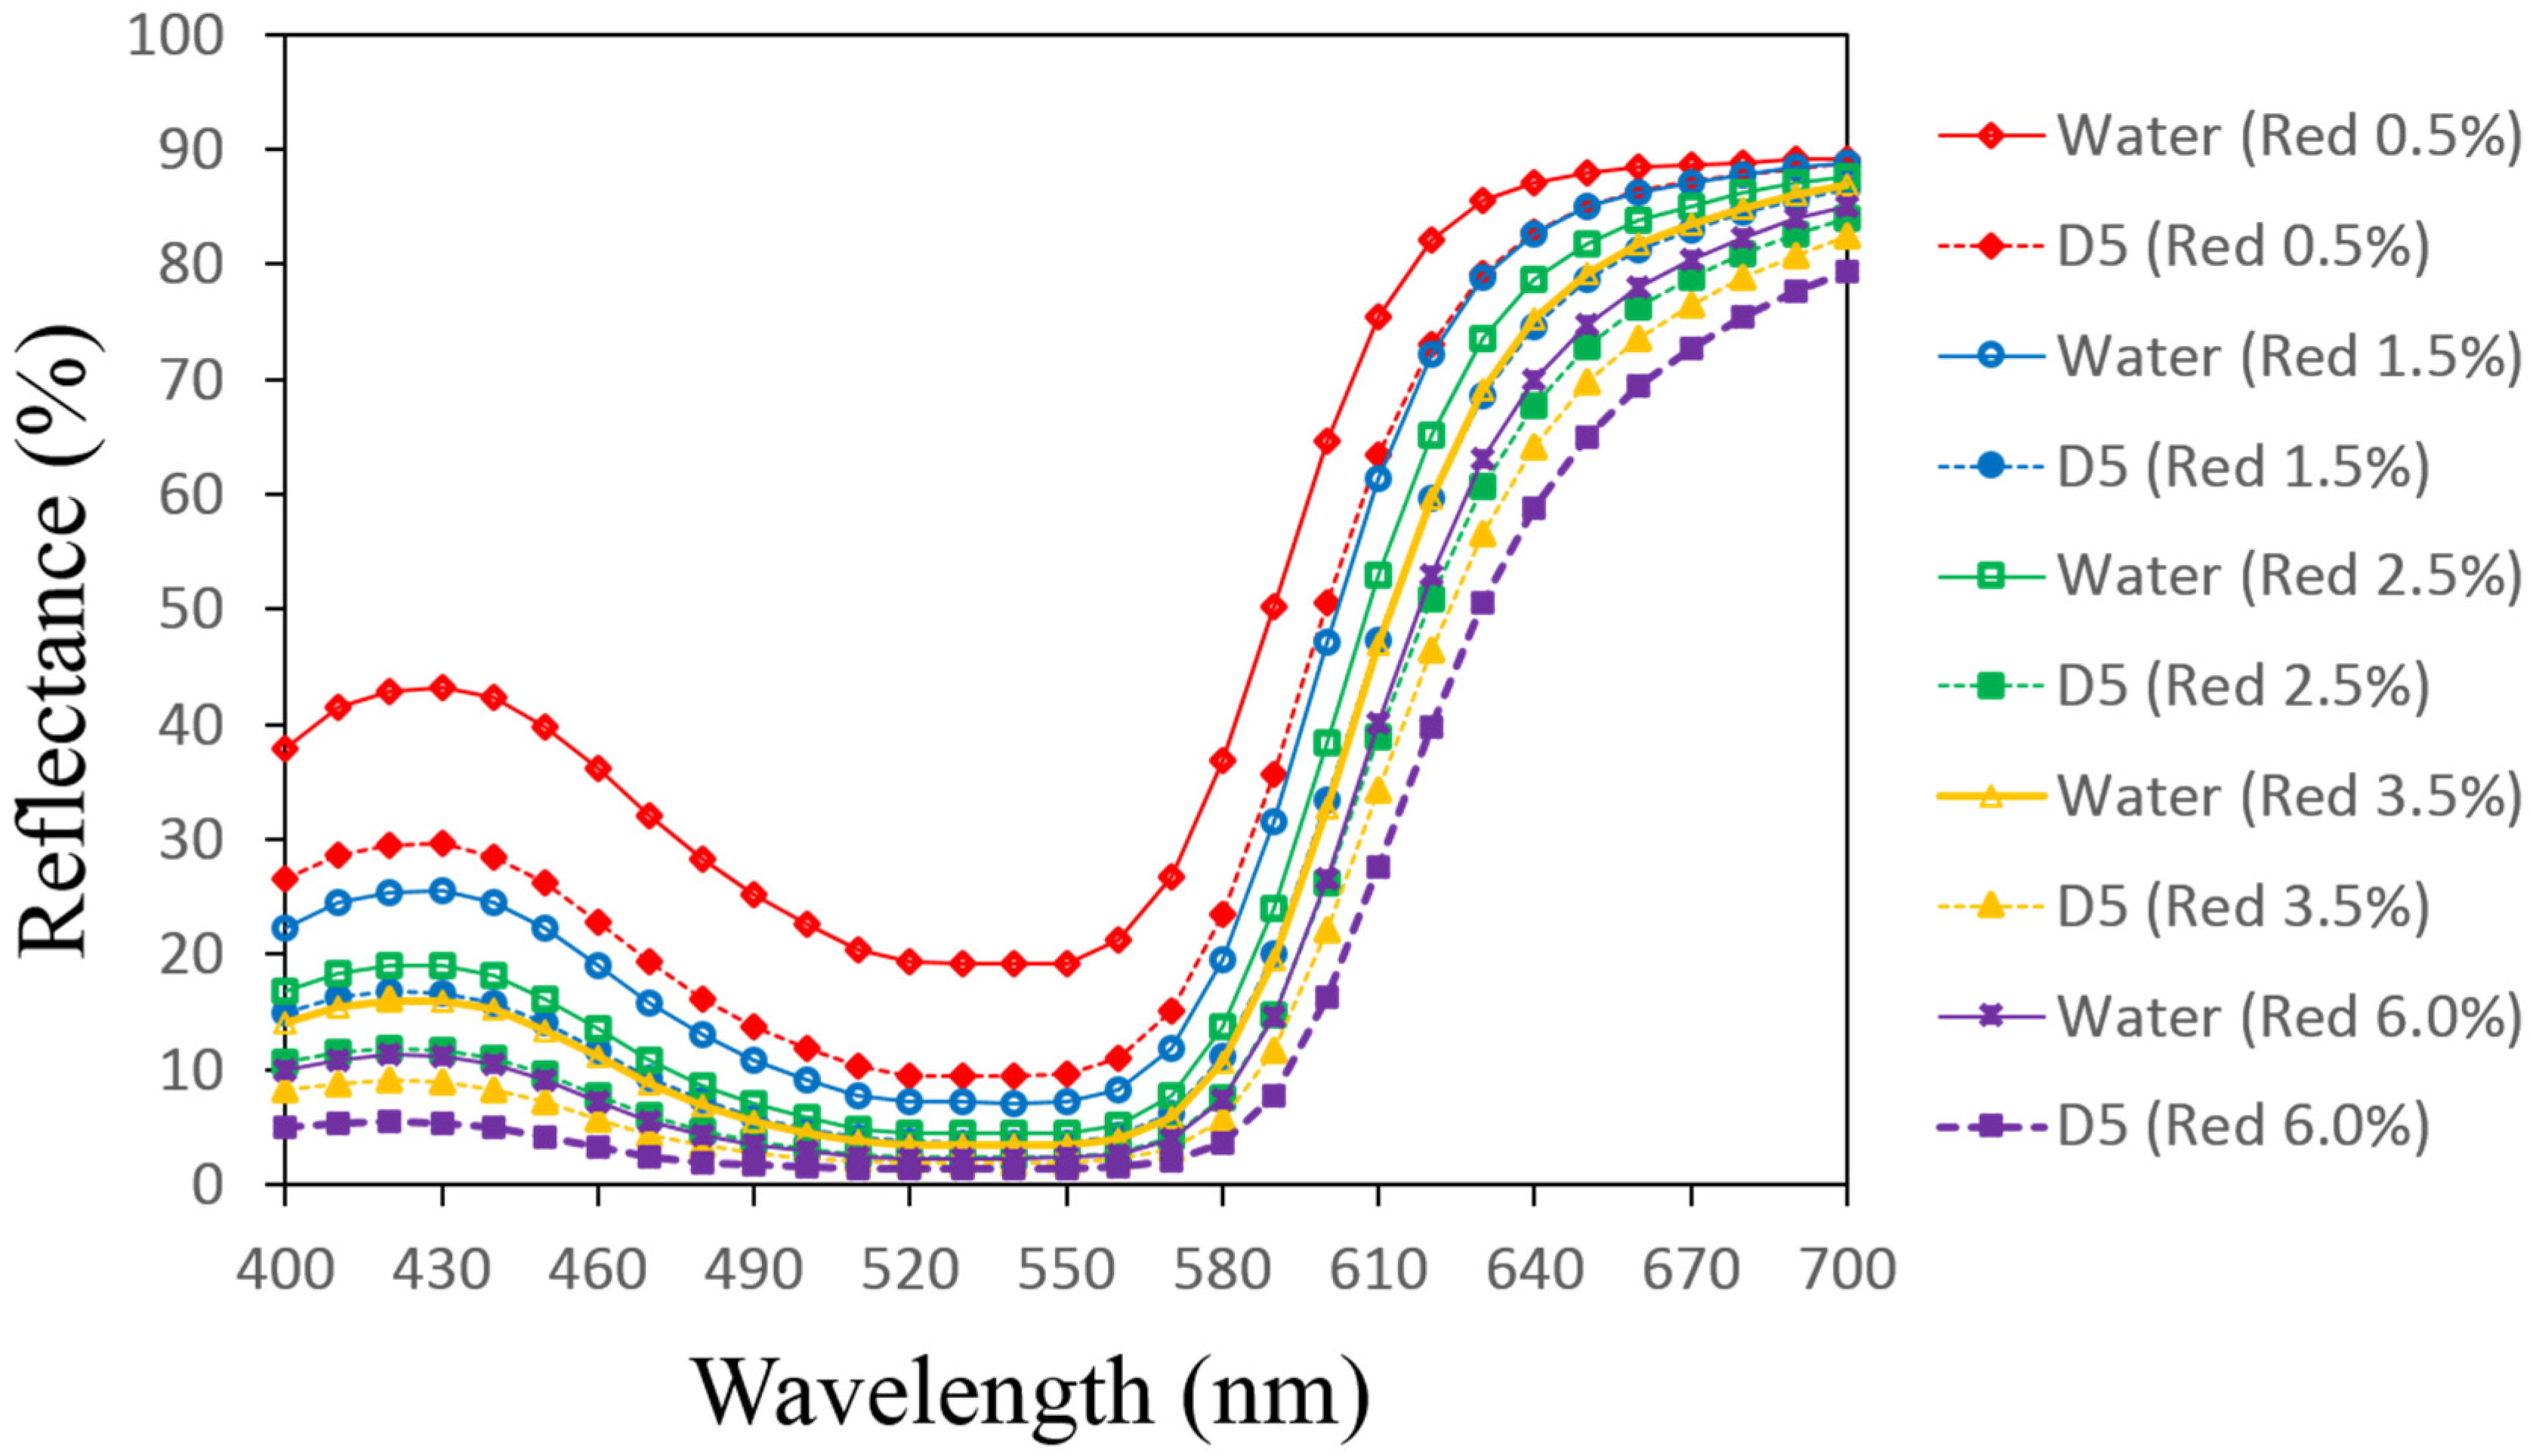
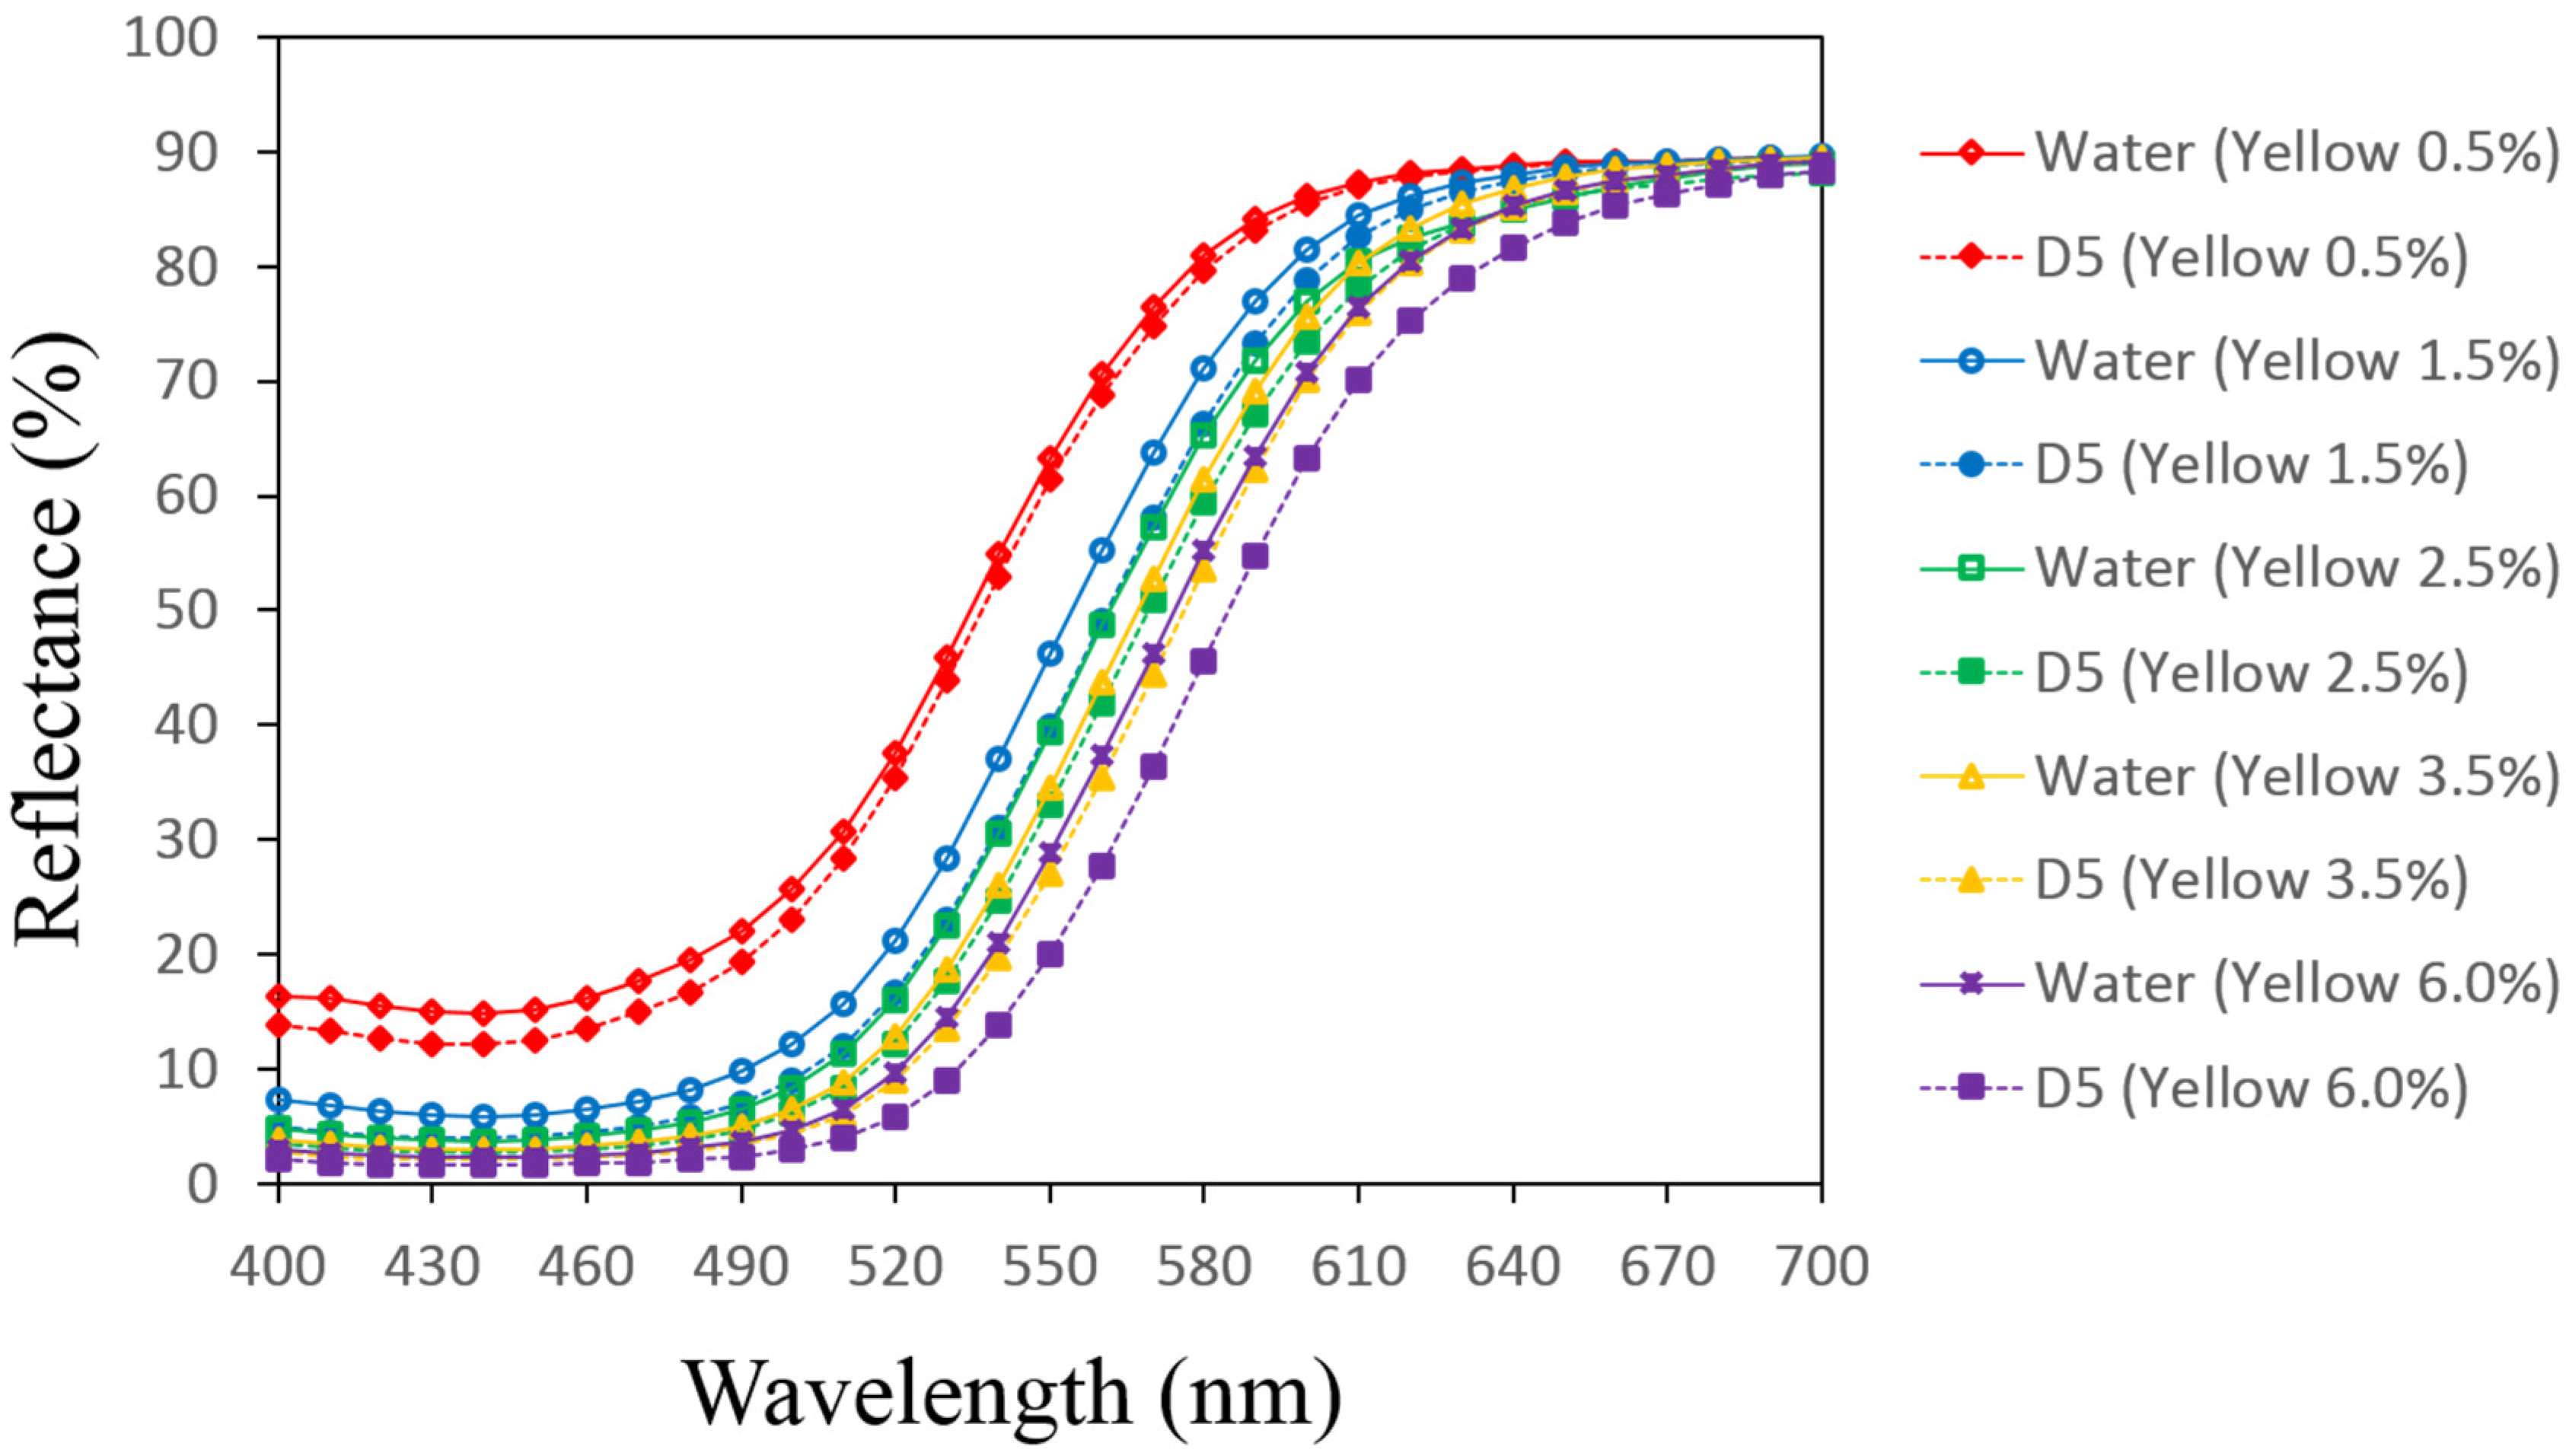
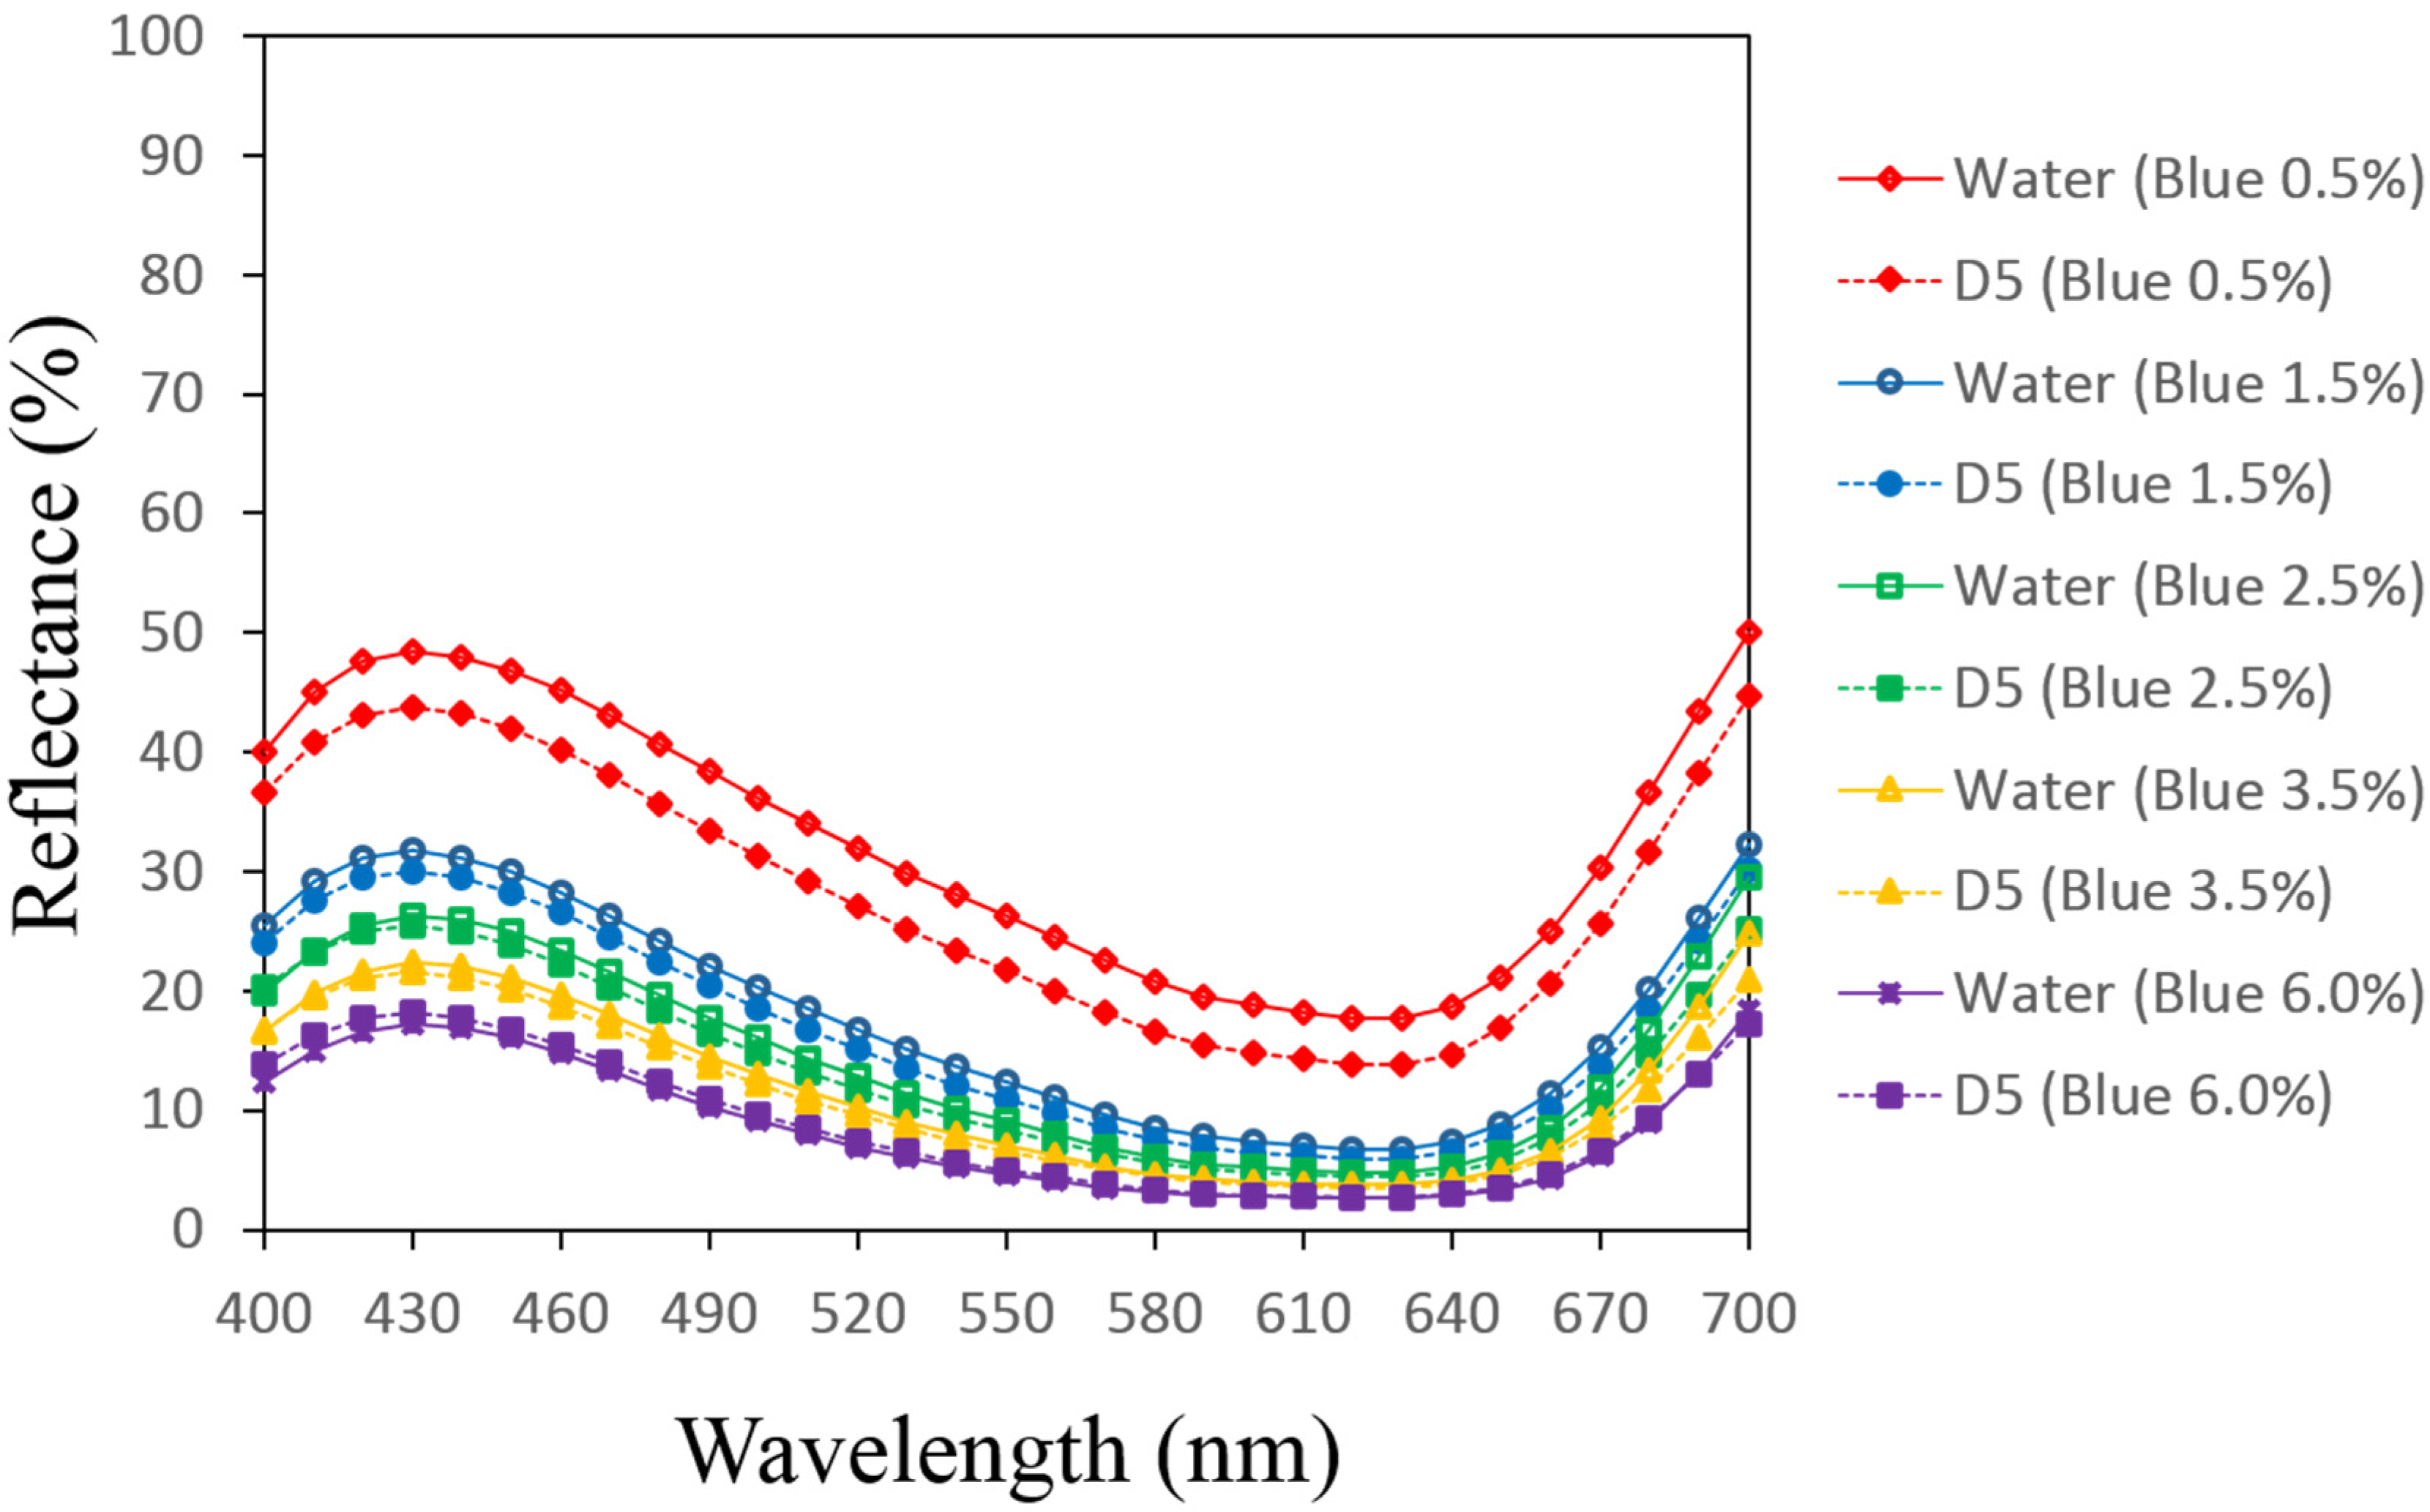
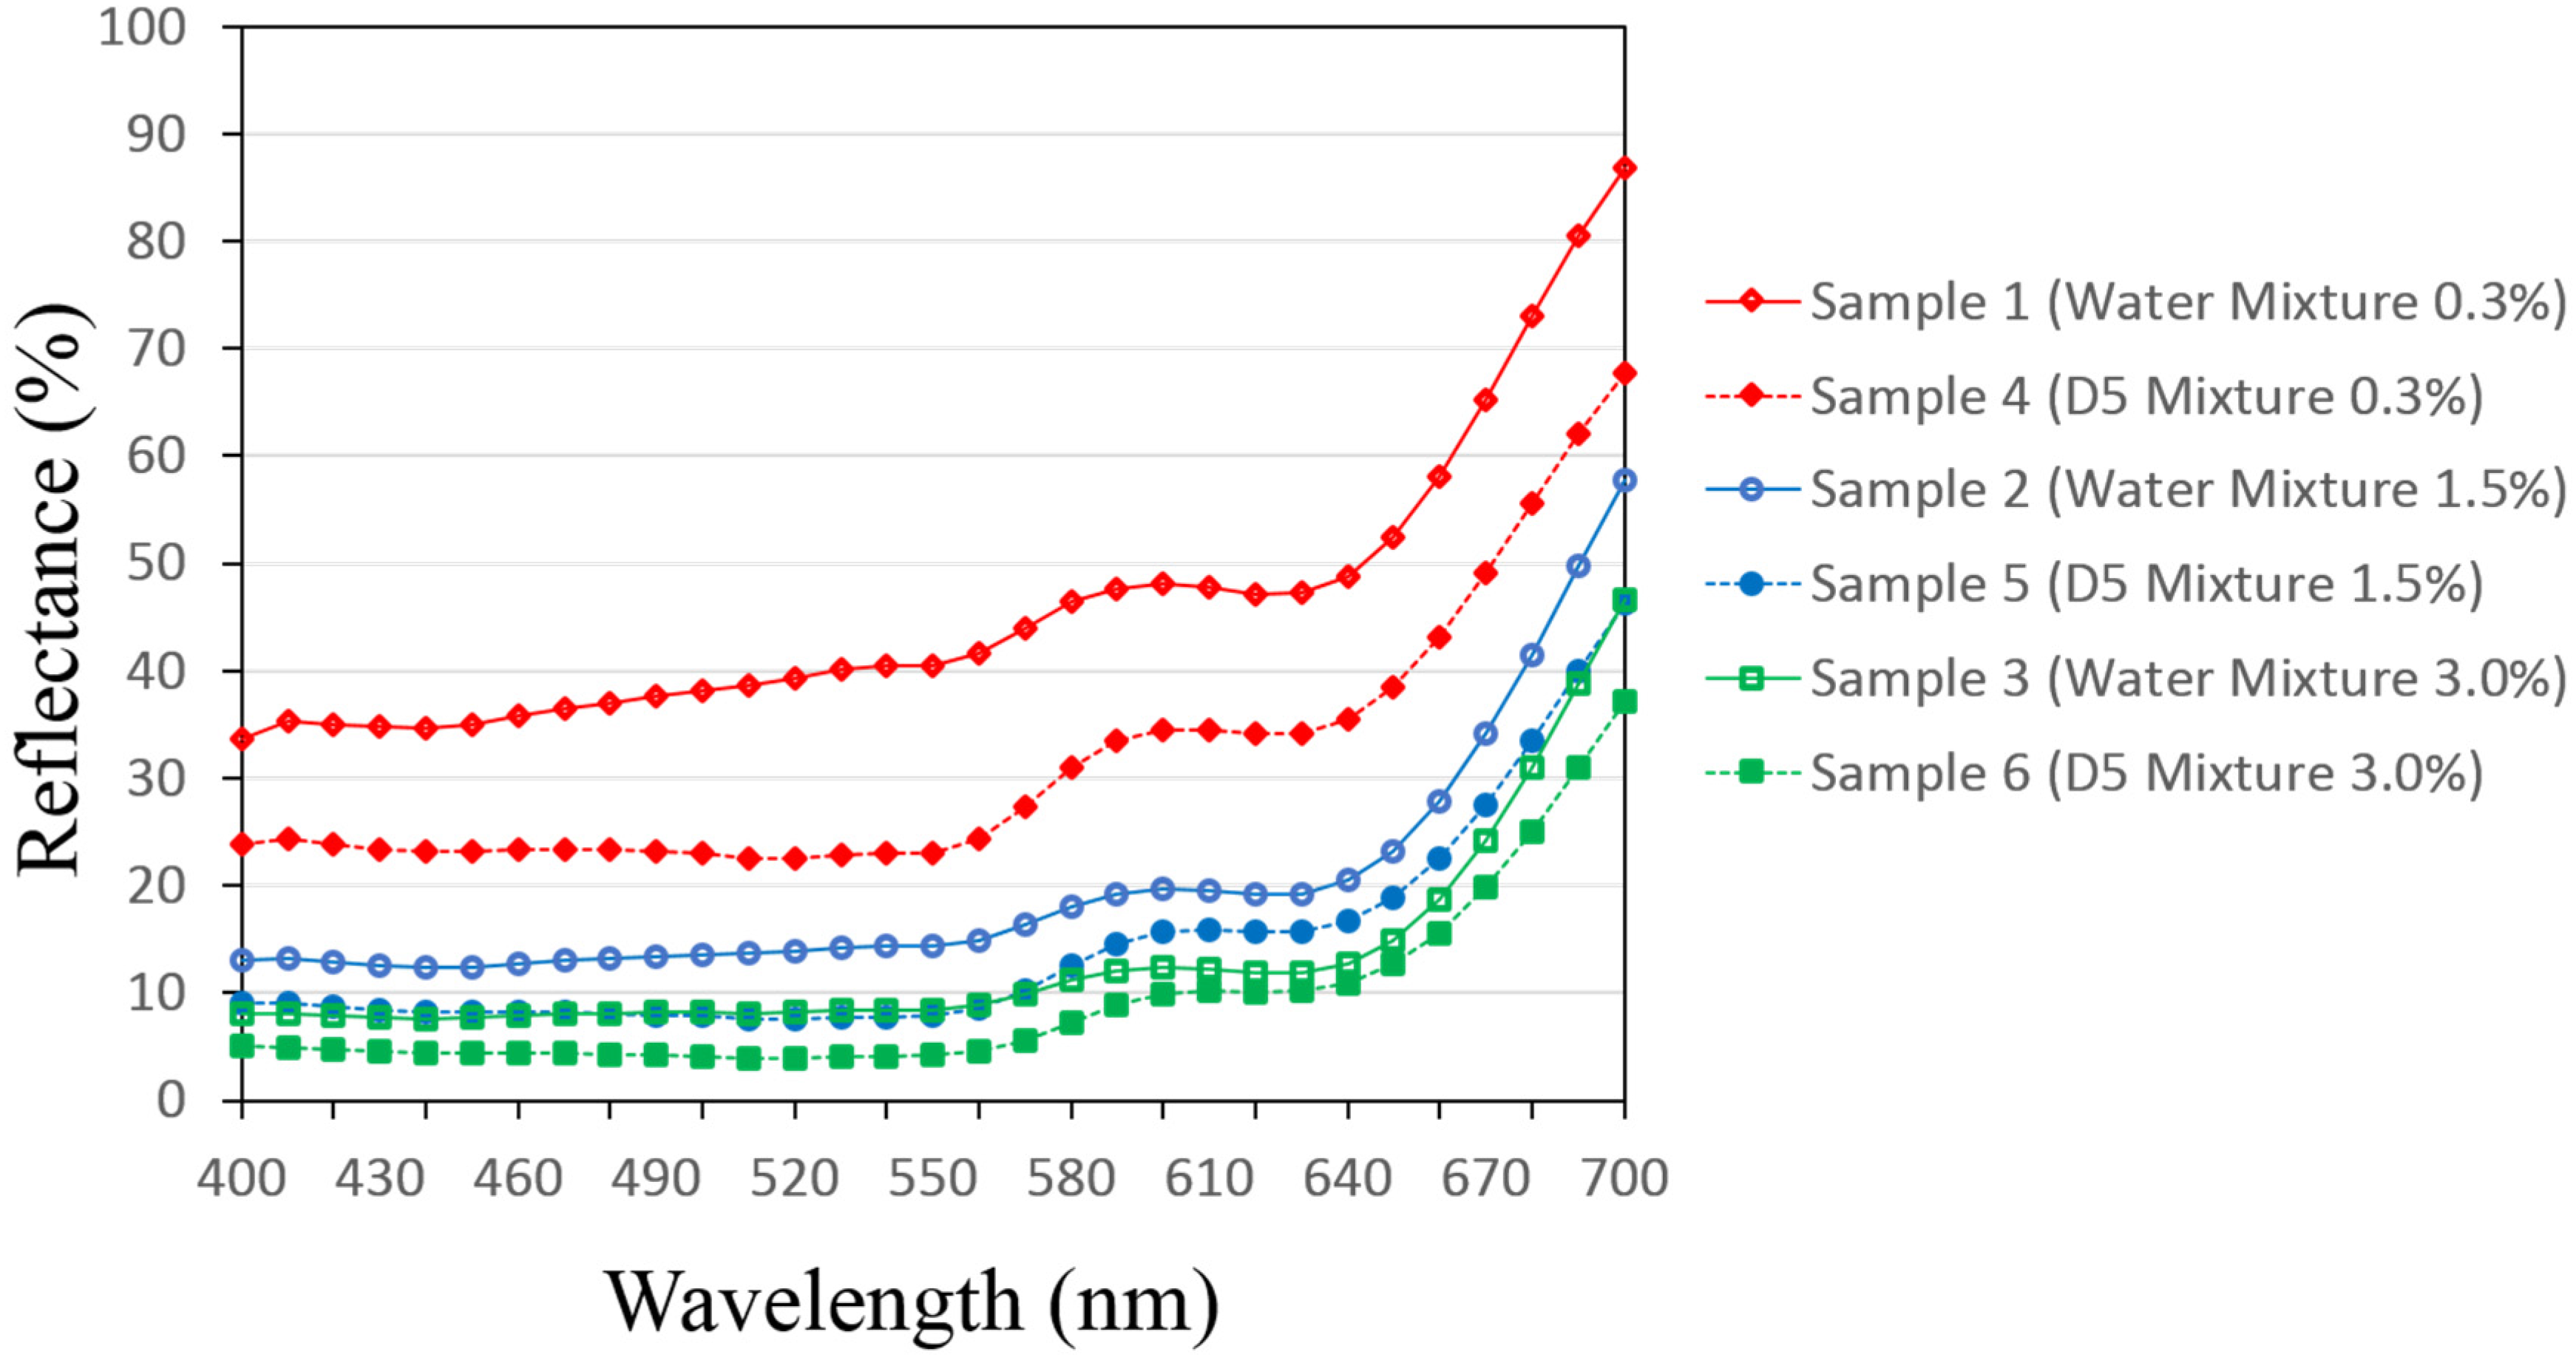
3.1. Reflectance Values of the Dyed Samples

Figure 3, Figure 4 and Figure 5 depict reflectance curves of red, yellow and blue color, respectively, of the batch-dyed samples, while Figure 6 presents reflectance curves of the color mixture of dyed standard samples. With regards to Figure 3, Figure 4 and Figure 5, the results show that reflectance curves of red, yellow and blue color of the samples batch dyed by using the conventional water-based method and the reverse micellar D5-assisted method do not overlap at dye concentrations from 0.5% to 6.0%. Reflectance values of the sample batch dyed in water from 0.5% to 6.0% are higher than those of the sample dyed in D5. This indicates that color yield of the sample batch dyed in water was lower with lower dye absorption in the fiber, and the shade thus appeared to be lighter when compared with the batch sample dyed in D5.
Figure 6 shows that reflectance values of the standard samples dyed in water with 0.3–3.0% dye concentrations are higher than standard samples dyed in D5, and no overlap of the reflectance curves was found. This indicates that the color yield of the standard samples dyed in water from 0.3 to 3.0% dye concentrations was lower with lower dye absorption in the fiber, and the shade thus appeared to be lighter when compared with the standard samples dyed in D5.
As presented in Figure 3, Figure 4, Figure 5 and Figure 6, although the reflectance values of batch and standard dyed samples are not similar, the shapes of the reflectance curves of the batch and standard samples dyed by conventional and reverse micellar D5-assisted methods are similar to each other, without any peak shifting of the curves found. This indicates that the use of D5 for the preparation of PEG-based reverse micelles and as the medium for solvent-assisted dyeing can be one of the alternative methods to achieve electrolyte-free and water-saving dyeing of cotton fiber and for computer color matching (CCM) without chromatic shift. The possible reason was the use of the PEG-based reverse micellar system, which could strongly reduce the ionization effect between reactive dye molecules and the cotton fiber and improve the swelling of cotton fiber [15,18].

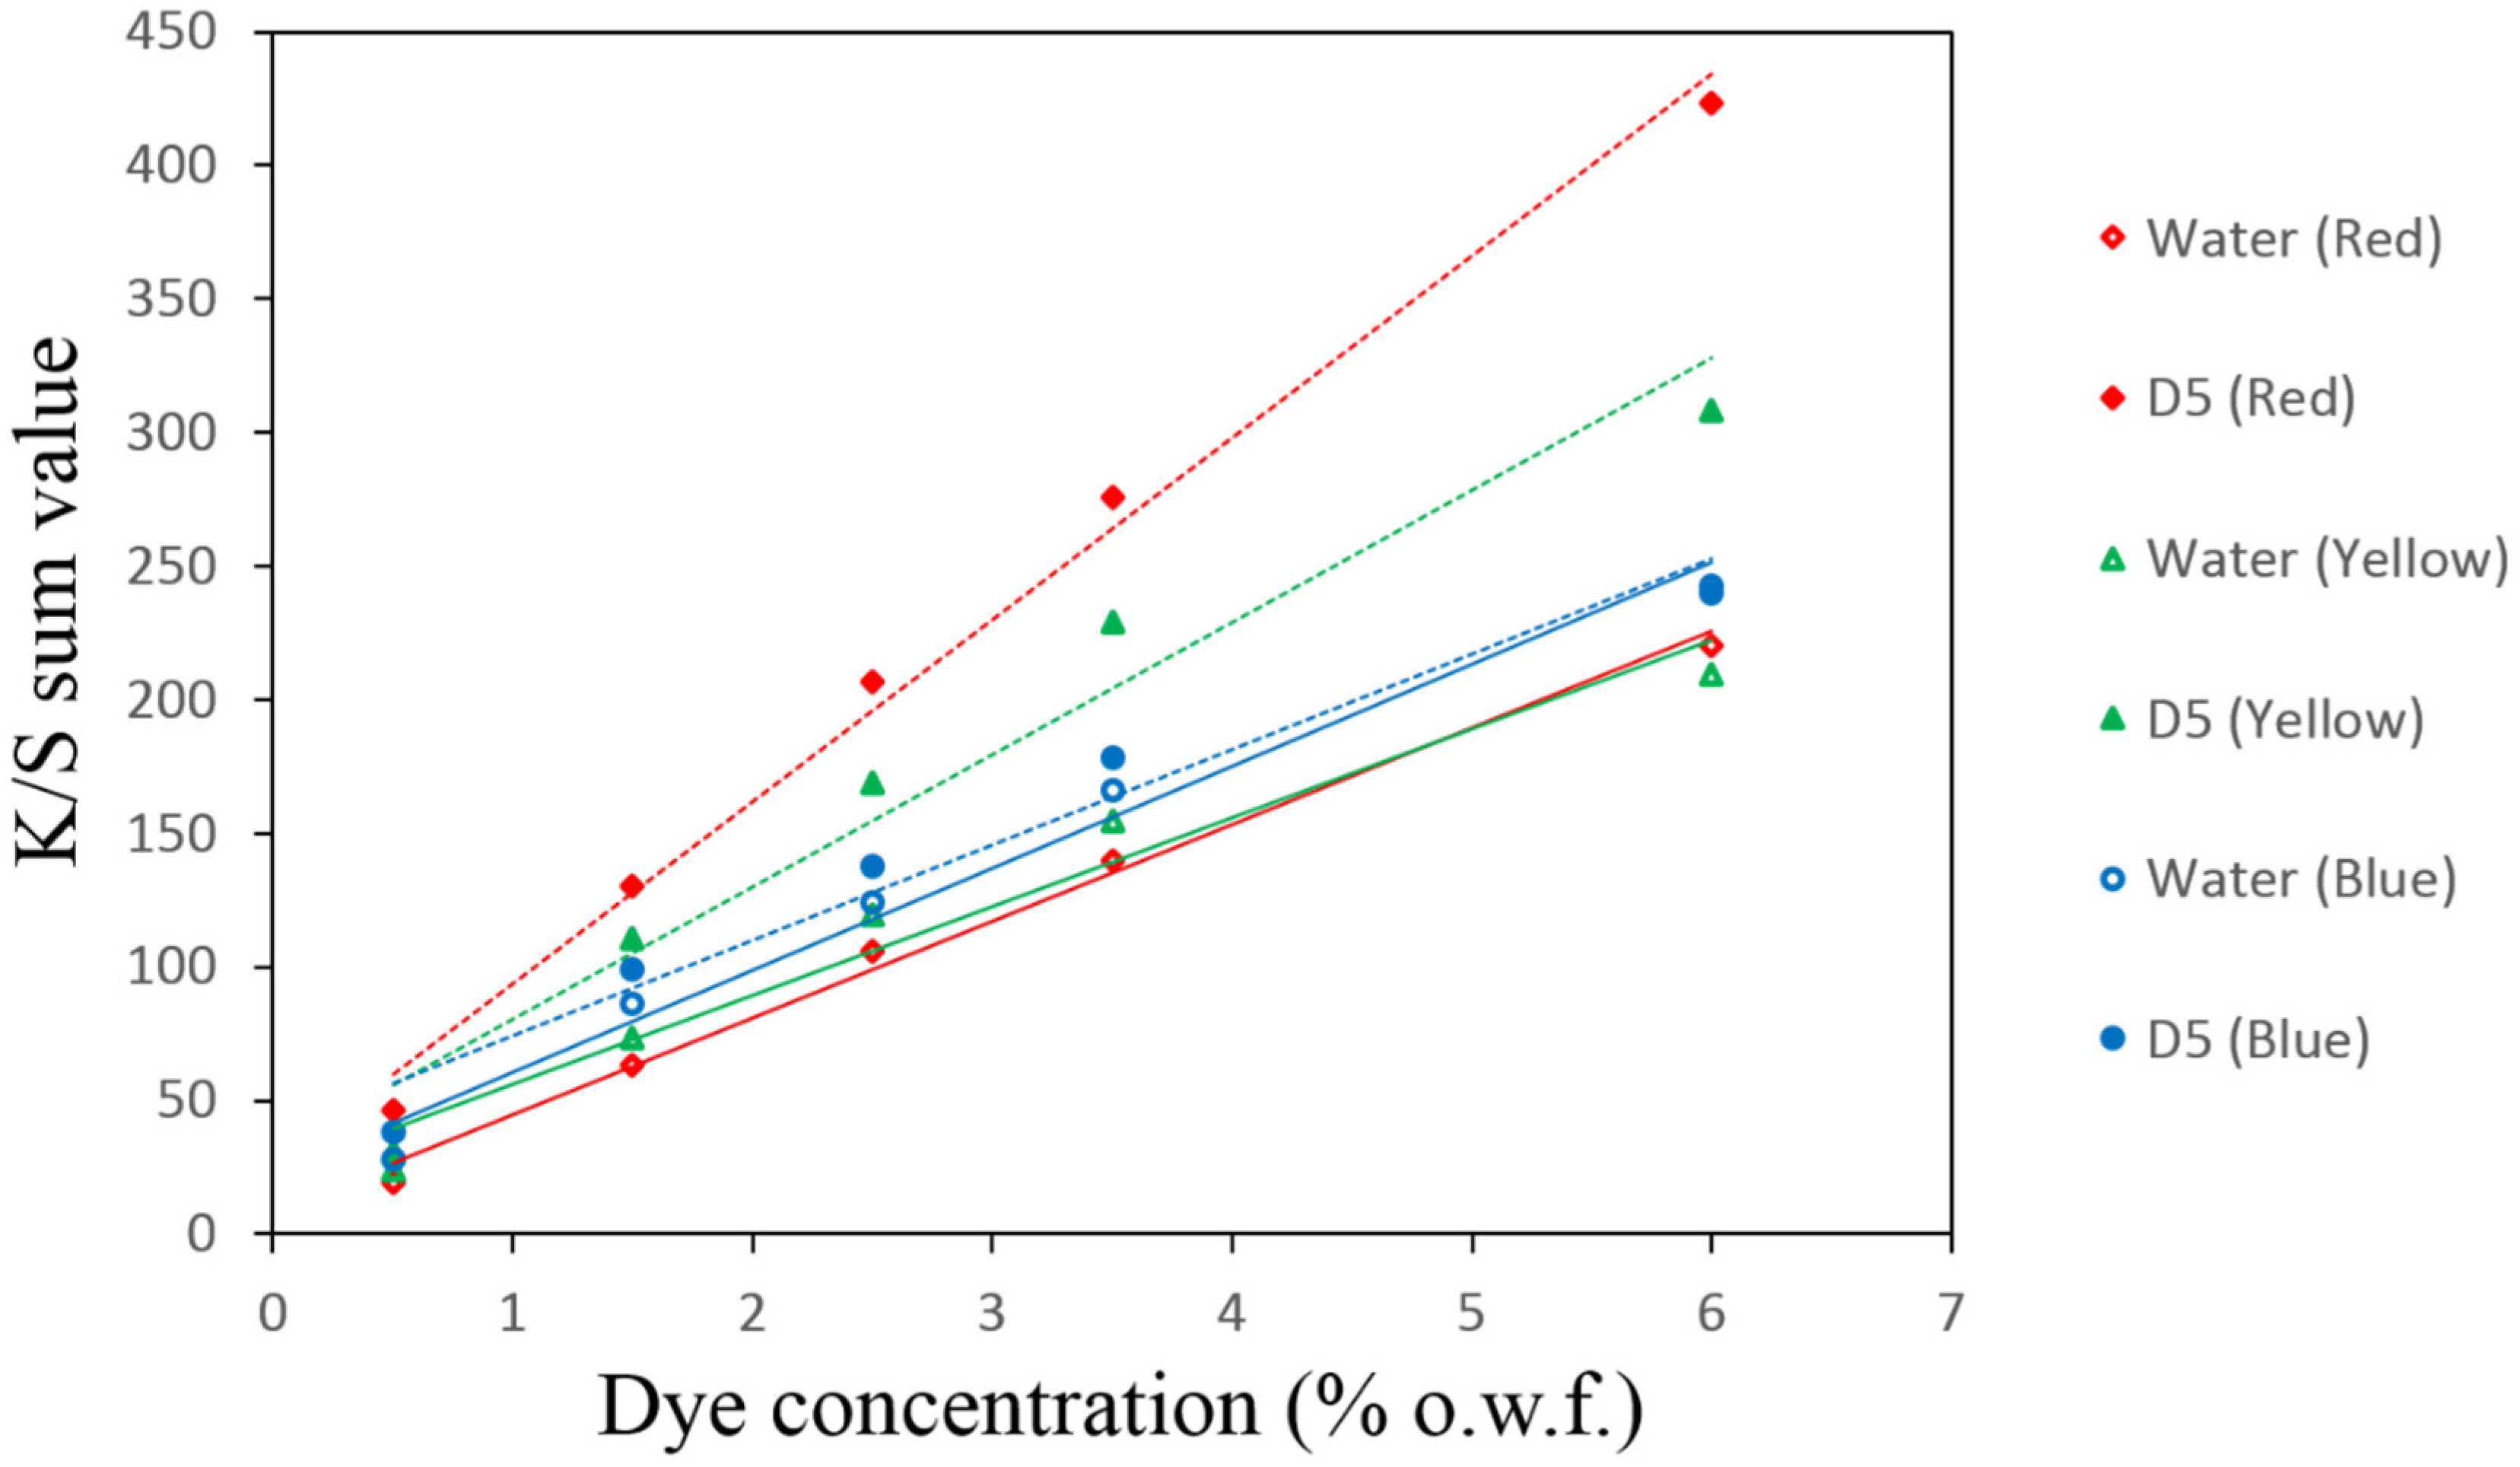
3.2. Linearity of the Calibration Curves

Figure 7 illustrates calibration curves of red, yellow and blue samples batch dyed in water and reverse micellar D5 medium. It is a plot of the K/S sum value versus dye concentration (percentage on weight of fabrics, % owf). The K/S sum value is the summation of K/S values of the samples at wavelengths of 400–700 nm. The results of Figure 7 show that the K/S sum values of red, yellow and blue colors of the samples dyed in the reverse micellar D5 system are higher than samples dyed in water, indicating that the use of the reverse micellar D5 dyeing system can achieve better color yield than the conventional dyeing system.
The linearity of the calibration curves was calculated in terms of R-square (R2), a method widely applied for measuring the goodness-of-fit of a regression [42]. The value of R-square ranged from 0 to 1, where zero meant non-linear and one meant linear in structure. As presented by Figure 7 and Table 5, the values of R-square of water-dyed fabrics ranged from 0.9605 (water yellow) to 0.9937 (water red), whereas the R-square of D5-dyed fabrics ranged from 0.9630 (D5 blue) to 0.9933 (D5 red). This indicates that the calibration curves of samples dyed using the conventional and the D5 reverse micellar system are almost linear in structure and, thus, suitable for computer color matching.

3.3. Computer Color Matching

Table 6 shows the color matching recipes of standard samples dyed by the conventional water-based method with different color difference formulae. It reveals that color matching recipes generated for Sample 1 are similar (yellow: 0.12; blue: 0.08; and red: 0.07) even though different color difference formulae were used. The color matching recipes generated for Sample 2 (yellow: 0.62; blue: 0.50; and red: 0.44) and Sample 3 (yellow: 1.1; blue: 0.86; and red: 0.96) are also quite constant except when using JPC79 (yellow: 0.53; blue: 0.45; and red: 0.45) and FMC2 (yellow: 0.93; blue: 0.82; and red: 0.83), respectively. This indicates that the variations of color matching recipes generated for samples dyed in 0.3%, 1.5% and 3.0% concentrations are generally small.
Table 7 shows color matching recipes of standard samples dyed by the D5 solvent-assisted method with different color difference formulae. It is observed that color matching recipes generated for Sample 4 are similar (yellow: 0.56; blue: 0.53; and red: 0.54) although different color difference formulae were used. Constant results are also found for recipes generated for Sample 5 (yellow: 0.60; blue: 0.46; and red: 0.49) and Sample 6 (yellow: 1.33; blue: 1.11; and red: 1.24) except when using Hunter lab, JPC 79 and CIE94 1.0 (yellow: 0.66; blue: 0.63; and red: 0.58) and CIE L*u*v* and FMC2 (yellow: 1.15; blue: 0.86; and red: 1.07), respectively. This indicates that color matching recipes generated for samples dyed by the solvent-assisted method have slightly larger variations than fabrics dyed by the conventional method.
Table 8 and Table 9 show the color matching difference and the percentage difference between standard samples dyed by the conventional method and the D5 solvent-assisted method using different color difference formulae. The results reveal that most of the measured concentrations generated by using the conventional water-based method are below the theoretical concentrations, while concentrations generated by using the D5 solvent-assisted dyeing method are mostly higher than the expected concentrations. Measured values below the expected concentrations can be explained by the fact that the dye molecules are insufficient to be evenly distributed in the fabrics while the reason for measured values being higher than the expected concentration is the formation of dye aggregates, which may influence the absorption and scattering of light.
Moreover, the difference between theoretical and measured concentration can be explained by the linearity of the calibration curves. Generally speaking, the higher the linearity of the calibration curves, the higher would be the accuracy of the result, and the difference between theoretical and measured concentration would be smaller. It was also observed that at a higher concentration (3%), exemplified by Sample 3 of water-based dyeing and Sample 6 of D5 solvent-assisted dyeing, the difference and percentage difference between the theoretical and measured concentration is greater than that at a lower concentration for both methods, and this could be explained by the degree of dye aggregation and the amount of dye molecules. At a high concentration, the possibility of the formation of dye aggregates and having insufficient dye molecules for an even distribution in the fabrics would be generally higher than that at low concentration.
Furthermore, from Table 7 and Table 8, the results show that at a high concentration (3%), the difference in recipe prediction for Sample 3 dyed in water and Sample 6 dyed in D5 is large. This means that the recipe prediction accuracy of sample dyed in D5 at a high concentration is lower than that in water. Nevertheless, this difference is considered to be tolerable and, thus, acceptable for computer color matching.

3.4. Relative Unlevelness Indices

Table 10 illustrates the relative unlevelness indices (RUI) and visual levelness assessment of water-dyed and D5-dyed fabrics. Values of RUI of water-dyed fabrics are between 0.02 and 0.34, whereas the RUIs of D5-dyed fabrics are between 0.05 and 0.40. This means that the standard and the batch dyed samples, by the conventional water-based method and the D5 solvent-assisted method, can achieve good to excellent levelness, indicating that most dye molecules were in non-aggregate form throughout the dyeing process and they were well dispersed within the fabric in the reverse micellar D5 dyeing system.

4. Conclusions

The computer color matching and levelness of cotton fabrics dyed in non-aqueous medium of decamethylcyclopentasiloxane (D5) with reactive dye was investigated using a non-ionic surfactant reverse-micellar approach comprised of poly(ethylene glycol)-based surfactant and was compared with the conventional water-based dyeing system. The reflectance values of the samples were measured, and no chromatic change was found when the non-ionic reverse micellar D5-assisted dyeing approach was used. The calibration dyeing databases for both dyeing methods were established. The structure of the calibration curves was found to be almost linear with R-square ranging from 0.9605 to 0.9937, and the K/S sum values of D5-dyed samples were higher than water-dyed samples at each calibrated dye concentration. Computer color matching was conducted by using several color difference formulae, and the results reveal that the measured concentrations are nearly the same as the expected concentrations for both methods. This indicates that good color matching can be achieved by using the D5-assisted reverse micellar dyeing system. The levelness of the dyed samples was measured according to the relative unlevelness indices (RUI), and the results indicate that samples dyed by the D5 reverse micellar dyeing system can achieve good to excellent levelness, comparable with the conventional dyeing system.

Acknowledgments

The authors would like to thank the financial support from The Hong Kong Polytechnic University for this work.

Author Contributions

A.Y.L.T. and C.-W.K. conceived and designed the experiments; Y.M.W. and A.Y.L.T. performed the experiments; A.Y.L.T., Y.M.W. and C.H.L. analyzed and interpreted the data; C.-W.K. contributed reagents/materials/analysis tools and supervised all the works; All authors wrote the paper.

Conflicts of Interest

The authors declare no conflict of interest.

References

  1. Dong, Y.; Chen, J.; Li, C.; Zhu, H. Decoloration of three azo dyes in water by photocatalysis of Fe (III)-oxalate complexes/H2O2 in the presence of inorganic salts. Dyes Pigment. 2007, 73, 261–268. [Google Scholar] [CrossRef]
  2. Hickman, W.S. Environmental aspects of textile processing. J. Soc. Dyers Colour. 1993, 109, 32–37. [Google Scholar] [CrossRef]
  3. Perkins, W.S. Textile Coloration and Finishing; Carolina Academic Press: Durham, NC, USA, 1996. [Google Scholar]
  4. Srikulkit, K.; Santifuengkul, P. Salt-free dyeing of cotton cellulose with a model cationic reactive dye. Color. Technol. 2000, 116, 398–402. [Google Scholar] [CrossRef]
  5. Pisuntornsug, C.; Yanumet, N.; O'Rear, E.A. Surface modification to improve dyeing of cotton fabric with a cationic dye. Color. Technol. 2002, 118, 64–68. [Google Scholar] [CrossRef]
  6. Zhang, F.; Chen, Y.; Lin, H.; Lu, Y. Synthesis of an amino-terminated hyperbranched polymer and its application in reactive dyeing on cotton as a salt-free dyeing auxiliary. Color. Technol. 2007, 123, 351–357. [Google Scholar] [CrossRef]
  7. Bechtold, T.; Mussak, R.; Mahmud-Ali, A.; Ganglberger, E.; Geissler, S. Extraction of natural dyes for textile dyeing from coloured plant wastes released from the food and beverage industry. J. Sci. Food Agric. 2006, 86, 233–242. [Google Scholar] [CrossRef]
  8. Vankar, P.S.; Shanker, R.; Mahanta, D.; Tiwari, S. Ecofriendly sonicator dyeing of cotton with Rubia cordifolia Linn. using biomordant. Dyes Pigment. 2008, 76, 207–212. [Google Scholar] [CrossRef]
  9. Mirjalili, M.; Nazarpoor, K.; Karimi, L. Eco-friendly dyeing of wool using natural dye from weld as co-partner with synthetic dye. J. Clean. Prod. 2011, 19, 1045–1051. [Google Scholar] [CrossRef]
  10. Lu, X.; Liu, L.; Liu, R.; Chen, J. Textile wastewater reuse as an alternative water source for dyeing and finishing processes: A case study. Desalination 2010, 258, 229–232. [Google Scholar] [CrossRef]
  11. Jun, J.; Sawada, K.; Takagi, T.; Kim, G.; Park, C.; Ueda, M. Effects of pressure and temperature on dyeing acrylic fibres with basic dyes in supercritical carbon dioxide. Color. Technol. 2005, 121, 25–28. [Google Scholar] [CrossRef]
  12. Hou, A.; Chen, B.; Dai, J.; Zhang, K. Using supercritical carbon dioxide as solvent to replace water in polyethylene terephthalate (PET) fabric dyeing procedures. J. Clean. Prod. 2010, 18, 1009–1014. [Google Scholar] [CrossRef]
  13. Abou Elmaaty, T.; Abd El-Aziz, E.; Ma, J.; El-Taweel, F.; Okubayashi, S. Eco-friendly disperse dyeing and functional finishing of nylon 6 using supercritical carbon dioxide. Fibers 2015, 3, 309–322. [Google Scholar] [CrossRef]
  14. Sawada, K.; Ueda, M. Dyeing of protein fiber in a reverse micellar system. Dyes Pigment. 2003, 58, 99–103. [Google Scholar] [CrossRef]
  15. Wang, Y.; Lee, C.H.; Tang, Y.L.; Kan, C.W. Dyeing cotton in alkane solvent using polyethylene glycol-based reverse micelle as reactive dye carrier. Cellulose 2016, 23, 965–980. [Google Scholar] [CrossRef]
  16. Luisi, P.L. Enzymes hosted in reverse micelles in hydrocarbon solution. Angew. Chem. Int. Ed. Engl. 1985, 24, 439–450. [Google Scholar] [CrossRef]
  17. Liu, D.; Ma, J.; Cheng, H.; Zhao, Z. Investigation on the conductivity and microstructure of AOT/non-ionic surfactants/water/n-heptane mixed reverse micelles. Coll. Surf. A Physicochem. Eng. Asp 1998, 135, 157–164. [Google Scholar] [CrossRef]
  18. Yi, S.; Dong, Y.; Li, B.; Ding, Z.; Huang, X.; Xue, L. Adsorption and fixation behaviour of CI reactive red 195 on cotton woven fabric in a nonionic surfactant Triton X-100 reverse micelle. Color. Technol. 2012, 128, 306–314. [Google Scholar] [CrossRef]
  19. Yi, S.; Deng, Y.; Sun, S. Adsorption and dyeing characteristics of reactive dyes onto cotton fiber in nonionic triton X-100 reverse micelles. Fiber Polym. 2014, 15, 2131–2138. [Google Scholar] [CrossRef]
  20. Yi, S.; Tong, X.; Sun, S.; Dai, F. Dyeing properties of CI reactive violet 2 on cotton fabric in non-ionic TX-100/Span40 mixed reverse micelles. Fiber Polym. 2015, 16, 1663–1670. [Google Scholar] [CrossRef]
  21. Kan, C.W.; Lo, C.K.; Man, W. Environmentally friendly aspects in coloration. Color. Technol. 2016, 132, 4–8. [Google Scholar] [CrossRef]
  22. Zhang, B.; Li, H. Research on application for color matching in textile dyeing based on numerical analysis. In Proceedings of the Computer Science and Software Engineering International Conference, Wuhan, China, 12 December 2008; pp. 357–360. [Google Scholar]
  23. Cheng, F.; Wang, K.; Chen, G. Study on the application of computer color-measuring and matching technology in fur dyeing. China Leather 2004, 15, 31–35. [Google Scholar]
  24. Wang, N.; Yang, L. Application of color matching system in dyeing of cotton. Progress Text. Sci. Technol. 2007, 2, 26–29. [Google Scholar]
  25. Xue, C.; Jia, S.; Li, Z. Application of computer color matching system to nylon fabric dyeing. J. Shaanxi Univ. Sci. Technol. 2005, 4, 49–55. [Google Scholar]
  26. Xue, C.; Yu, C.; Zhang, X. Application of computer color matching system in leather dyeing. Leather Sci. Eng. 2003, 13, 26–29. [Google Scholar]
  27. Robertson, A.R. The CIE 1976 color-difference formulae. Color. Res. Appl. 1977, 2, 7–11. [Google Scholar] [CrossRef]
  28. Luo, M.R. Colour quality evaluation. In Total Colour Management in Textiles; Xin, J.H., Ed.; Woodhead Publishing: Boca Raton, FL, USA, 2006; pp. 57–75. [Google Scholar]
  29. Kuehni, R.G. Industrial color difference: Progress and problems. Color. Res. Appl. 1990, 15, 261–265. [Google Scholar] [CrossRef]
  30. Ingamells, W. Colour for Textiles. Soc. Dyers Colour. 1993. [Google Scholar]
  31. Ibrahim, S.F.; Essa, D.; Osman, E. Statistical method for determining the levelness parameters of different coloured polymeric fabrics. Int. J. Chem. 2011, 3, 11–20. [Google Scholar] [CrossRef]
  32. Uddin, M.G. Study on the color levelness of silk fabric dyed with vegetable dyes. Sustain. Chem. Process. 2015, 3, 1–4. [Google Scholar] [CrossRef]
  33. Yang, Y.; Li, S. Instrumental measurement of the levelness of textile coloration. Text. Chem. Color. 1993, 25, 75–78. [Google Scholar]
  34. Chong, C.; Li, S.; Yeung, K. An objective method for the assessment of levelness of dyed materials. J. Soc. Dyers Colour. 1992, 108, 528–530. [Google Scholar] [CrossRef]
  35. Wan, W.; Liu, J.; Li, S.; Lu, F.; Wang, J.; Zhang, Y. Study on the preparation of D5 reverse micelle systems and their water solubilization performance. Appl. Chem. Ind. 2009, 10, 1417–1420. [Google Scholar]
  36. Fu, C.; Wang, J.; Shao, J.; Pu, D.; Chen, J.; Liu, J. A non-aqueous dyeing process of reactive dye on cotton. J. Text. Inst. 2015, 106, 152–161. [Google Scholar] [CrossRef]
  37. Gao, X.; Liu, J.; Li, Y. The impact of D5-washing on the fabric performance. J. Zhejiang Sci-Tech Univ. 2007, 24, 6–10. [Google Scholar]
  38. Liu, J.Q.; Miao, H.L.; Li, S.Z. Non-Aqueous Dyeing of Reactive Dyes in D5; Trans Tech Publications: Boca Raton, FL, USA, 2012; pp. 138–144. [Google Scholar]
  39. Miao, H.; Fu, C.; Li, Y.; Zhang, Y.; Liu, J. Reactive dyeing of cotton in dye/decamethyl cyclopentasiloxane suspension system. J. Text. Res. 2013, 34, 64–69. [Google Scholar]
  40. Miao, H.; Liu, J.; Li, Y.; Fu, C.; Zhang, Y. Study on hydrolysis kinetics of reactive dyes in dye/D5 suspending system. J. Text. Res. 2013, 34, 77–82. [Google Scholar]
  41. Xin, J.H. Controlling colourant formulation. In Total Colour Management in Textiles; Woodhead Publishing: Boca Raton, FL, USA, 2006; pp. 136–159. [Google Scholar]
  42. Israeli, O. A Shapley-based decomposition of the R-square of a linear regression. J. Econ. Inequal. 2007, 5, 199–212. [Google Scholar] [CrossRef]
Figure 1. The dyeing profile of water-based dyeing.
Applsci 07 00682 g001
Figure 2. The dyeing profile of the reverse micellar D5 solvent dyeing.
Applsci 07 00682 g002
Figure 3. Reflectance curves of the red color of batch samples dyed in water and D5 medium.
Applsci 07 00682 g003
Figure 4. Reflectance curves of the yellow color of batch samples dyed in water and D5 medium.
Applsci 07 00682 g004
Figure 5. Reflectance curves of the blue color of batch samples dyed in water and D5 medium.
Applsci 07 00682 g005
Figure 6. Reflectance curves of the color mixture of standard samples dyed in water and D5 medium.
Applsci 07 00682 g006
Figure 7. Calibration curves of the primary colors of batch samples dyed in water and D5 for color matching.
Applsci 07 00682 g007
Table 1. Dye recipe for calibration dyeing. (% owf, percentage on weight of fabric.)
Dye Conc. on Fabric
(% owf)
Auxiliaries
NaCl (g/L)Na2CO3 (g/L)
0.5205
1.542.55
2.5555
3.5655
6.0805
Table 2. Color fixation (soda ash) concentration used.
Dye Concentration (% owf)Color Fixation Agent to Cotton Weight Ratio (g/g)
0.50.060
1.50.080
2.50.085
3.50.090
6.00.115
Table 3. Concentration of dye (%) for preparing the mixture of color.
Dyeing MethodSampleRed (%)Yellow (%)Blue (%)
Conventional dyeingSample 10.10.10.1
Sample 20.50.50.5
Sample 3111
Reverse micellar dyeingSample 40.10.10.1
Sample 50.50.50.5
Sample 6111
Table 4. Suggested interpretation of the relative unlevelness index (RUI) values (Chong et al.) [34].
RUIVisual Appearance of Levelness
<0.2Excellent levelness (unlevelness not detectable)
0.2–0.49Good levelness (noticeable unlevelness under close examination)
0.5–1.0Poor levelness (apparent unlevelness)
>1.0Bad levelness (conspicuous unlevelness)
Table 5. The R-square value of the dyeing method of three primary colors.
Dyeing MethodR2 Value
Water (Red)0.9937
Water (Yellow)0.9605
Water (Blue)0.9829
Heptane (Red)0.9933
Heptane (Yellow)0.9596
Heptane (Blue)0.9630
Table 6. Color matching recipes of water-based dyed standard samples with different color difference formulae.
FormulaeColorConventional Water-Based Dyeing
Sample 1 (0.3%)Sample 2 (1.5%)Sample 3 (3%)
TheoreticalYellow0.100.501.00
Blue0.100.501.00
Red0.100.501.00
CIEL*a*b*Yellow0.120.621.10
Blue0.080.500.96
Red0.070.440.86
CIEL*u*v*Yellow0.120.621.10
Blue0.080.500.96
Red0.070.440.86
ANLABYellow0.120.621.10
Blue0.080.500.96
Red0.070.440.86
Hunter labYellow0.120.621.10
Blue0.080.500.96
Red0.070.440.86
FMC2Yellow0.120.620.93
Blue0.080.500.82
Red0.070.440.83
JPC79Yellow0.120.531.10
Blue0.080.450.96
Red0.070.450.86
CMC 1.0Yellow0.120.621.10
Blue0.080.500.96
Red0.070.440.86
BFD 1.0Yellow0.120.621.10
Blue0.080.500.96
Red0.070.440.86
CIE94 1.0Yellow0.120.621.10
Blue0.080.500.96
Red0.070.440.86
Table 7. Color matching recipes of solvent dyed standard samples with different color difference formulae.
FormulaeColorD5 Solvent-Assisted Dyeing
Sample 4 (0.3%)Sample 5 (1.5%)Sample 6 (3%)
TheoreticalYellow0.100.501.00
Blue0.100.501.00
Red0.100.501.00
CIEL*a*b*Yellow0.150.601.33
Blue0.130.461.11
Red0.110.491.24
CIEL*u*v*Yellow0.150.601.15
Blue0.130.460.86
Red0.110.491.07
ANLABYellow0.150.601.33
Blue0.130.461.11
Red0.110.491.24
Hunter labYellow0.150.661.33
Blue0.130.631.11
Red0.110.581.24
FMC2Yellow0.150.601.15
Blue0.130.460.86
Red0.110.491.07
JPC79Yellow0.150.661.33
Blue0.130.631.11
Red0.110.581.24
CMC 1.0Yellow0.150.601.33
Blue0.130.461.11
Red0.110.491.24
BFD 1.0Yellow0.150.601.33
Blue0.130.461.11
Red0.110.491.24
CIE94 1.0Yellow0.150.661.33
Blue0.130.631.11
Red0.110.581.24
Table 8. Color matching difference of standard samples from water-based and solvent-assisted dyeing with different formulae.
FormulaeColorWater-Based DyeingD5 Solvent-Assisted Dyeing
Sample 1
(0.3%)
Sample 2
(1.5%)
Sample 3
(3%)
Sample 4
(0.3%)
Sample 5
(1.5%)
Sample 6
(3%)
CIEL*a*b*Yellow↑0.02↑0.12↑0.10↑0.05↑0.10↑0.33
Blue↓0.020.00↓0.04↑0.03↓0.04↑0.11
Red↓0.03↓0.06↓0.14↑0.01↓0.01↑0.24
CIEL*u*v*Yellow↑0.02↑0.12↑0.10↑0.05↑0.10↑0.15
Blue↓0.020.00↓0.04↑0.03↓0.04↓0.14
Red↓0.03↓0.06↓0.14↑0.01↓0.01↑0.07
ANLABYellow↑0.02↑0.12↑0.10↑0.05↑0.10↑0.33
Blue↓0.020.00↓0.04↑0.03↓0.04↑0.11
Red↓0.03↓0.06↓0.14↑0.01↓0.01↑0.24
Hunter labYellow↑0.02↑0.12↑0.10↑0.05↑0.16↑0.33
Blue↓0.020.00↓0.04↑0.03↑0.13↑0.11
Red↓0.03↓0.06↓0.14↑0.01↑0.08↑0.24
FMC2Yellow↑0.02↑0.12↑0.10↑0.05↑0.16↑0.33
Blue↓0.020.00↓0.04↑0.03↑0.13↑0.11
Red↓0.03↓0.06↓0.14↑0.01↑0.08↑0.24
JPC79Yellow↑0.02↑0.12↓0.07↑0.05↑0.10↑0.15
Blue↓0.020.00↓0.18↑0.03↓0.04↓0.14
Red↓0.03↓0.06↓0.17↑0.01↓0.01↑0.07
CMC 1.0Yellow↑0.02↑0.12↑0.10↑0.05↑0.16↑0.33
Blue↓0.020.00↓0.04↑0.03↑0.13↑0.11
Red↓0.03↓0.06↓0.14↑0.01↑0.08↑0.24
BFD 1.0Yellow↑0.02↑0.12↑0.10↑0.05↑0.10↑0.33
Blue↓0.020.00↓0.04↑0.03↓0.04↑0.11
Red↓0.03↓0.06↓0.14↑0.01↓0.01↑0.24
CIE94 1.0Yellow↑0.02↑0.12↑0.10↑0.05↑0.10↑0.33
Blue↓0.020.00↓0.04↑0.03↓0.04↑0.11
Red↓0.03↓0.06↓0.14↑0.01↓0.01↑0.24
↑: positive number (higher than expected) ↓: negative number (lower than expected).
Table 9. Color matching percentage (%) difference of standard samples from water-based and solvent-assisted dyeing with different formulae.
FormulaeColorWater-Based DyeingSolvent-Assisted Dyeing
Sample 1
(0.3%)
Sample 2
(1.5%)
Sample 3
(3%)
Sample 4
(0.3%)
Sample 5
(1.5%)
Sample 6
(3%)
CIEL*a*b*Yellow↑20.12↑24.76↑10.39↑54.98↑20.78↑33.15
Blue↓16.19↑0.95↓3.83↑28.38↓7.18↑11.25
Red↓27.60↓12.33↓14.18↑9.00↓2.72↑23.92
CIEL*u*v*Yellow↑20.12↑24.76↑10.39↑54.98↑20.78↑14.95
Blue↓16.19↑0.95↓3.83↑28.38↓7.18↓14.25
Red↓27.60↓12.33↓14.18↑9.00↓2.72↑7.21
ANLABYellow↑20.12↑24.76↑10.39↑54.98↑20.78↑33.15
Blue↓16.19↑0.95↓3.83↑28.38↓7.18↑11.25
Red↓27.60↓12.33↓14.18↑9.00↓2.72↑23.92
Hunter labYellow↑20.12↑24.76↑10.39↑54.98↑32.30↑33.15
Blue↓16.19↑0.95↓3.83↑28.38↑26.37↑11.25
Red↓27.60↓12.33↓14.18↑9.00↑15.71↑23.92
FMC2Yellow↑20.12↑24.76↓6.92↑54.98↑20.78↑14.95
Blue↓16.19↑0.95↓18.11↑28.38↓7.18↓14.25
Red↓27.60↓12.33↓16.95↑9.00↓2.72↑7.21
JPC79Yellow↑20.12↑5.66↑10.39↑54.98↑32.30↑33.15
Blue↓16.19↓9.34↓3.83↑28.38↑26.37↑11.25
Red↓27.60↓10.52↓14.18↑9.00↑15.71↑23.92
CMC 1.0Yellow↑20.12↑24.76↑10.39↑54.98↑20.78↑33.15
Blue↓16.19↑0.95↓3.83↑28.38↓7.18↑11.25
Red↓27.60↓12.33↓14.18↑9.00↓2.72↑23.92
BFD 1.0Yellow↑20.12↑24.76↑10.39↑54.98↑20.78↑33.15
Blue↓16.19↑0.95↓3.83↑28.38↓7.18↑11.25
Red↓27.60↓12.33↓14.18↑9.00↓2.72↑23.92
CIE94 1.0Yellow↑20.12↑24.76↑10.39↑54.98↑32.30↑33.15
Blue↓16.19↑0.95↓3.83↑28.38↑26.37↑11.25
Red↓27.60↓12.33↓14.18↑9.00↑15.71↑23.92
↑: Positive number (higher than expected), ↓: negative number (lower than expected).
Table 10. Relative unlevelness indices and visual levelness assessment of water-dyed and octane-dyed batch and standard samples.
SampleWaterSolvent
RUIVisual AssessmentRUIVisual Assessment
Red 0.1%0.17Excellent0.19Excellent
Red 0.5%0.34Good0.10Excellent
Red 1.5%0.24Good0.23Good
Red 2.5%0.33Good0.13Excellent
Red 3.5%0.16Excellent0.18Excellent
Yellow 0.1%0.03Excellent0.30Good
Yellow 0.5%0.08Excellent0.22Good
Yellow 1.5%0.01Excellent0.37Good
Yellow 2.5%0.06Excellent0.31Good
Yellow 3.5%0.15Excellent0.11Excellent
Blue 0.1%0.14Excellent0.05Excellent
Blue 0.5%0.04Excellent0.30Good
Blue 1.5%0.03Excellent0.05Excellent
Blue 2.5%0.09Excellent0.30Good
Blue 3.5%0.17Excellent0.40Good
Mixture 0.3%0.02Excellent0.20Good
Mixture 1.5%0.08Excellent0.29Good
Mixture 3.0%0.09Excellent0.18Excellent

