IoT and iTV for Interconnection, Monitoring, and Automation of Common Areas of Residents

1
University Center of Merida, University of Extremadura, Sta. Teresa de Jornet 38, 06800 Mérida, Spain
2
Albarregas High School, Camino Viejo de Mérida, s/n, 06800 Mérida, Spain
3
Suarez de Figueroa High School, Av. Fuente del Maestre s/n, 06300 Zafra, Spain
*
Author to whom correspondence should be addressed.
Appl. Sci. 2017, 7(7), 696; https://doi.org/10.3390/app7070696
Submission received: 1 June 2017
/
Revised: 30 June 2017
/
Accepted: 30 June 2017
/
Published: 6 July 2017
Abstract
:Featured Application
The framework presented in this work, that includes and integrates a wireless sensor network, an IoT platform, and a real interactive TV application, can be deployed within a residential community to provide real-time information, in order to improve the quality of life of its inhabitants.
Abstract
Internet and, in particular, computer networks have become a key issue in our daily lives, due to the birth of wireless technologies. Internet of Things (IoT) aims to integrate sensors and actuators in daily objects, maximizing miniaturization and minimizing the economic cost of these hardware components. The purpose is to connect these components to the Internet through wireless and fixed networks, and thereby produce information in real time which is then stored for later processing. On the other hand, Interactive TV (iTV) combines traditional TV with interactivity similar to that of the Internet and the personal computer. The evolution of TV technology has brought computing power to this device, offering services apart from the traditional ones, making it a device capable of running applications and maximizing its networking potential. This work presents a framework that includes and integrates a wireless sensor network, an IoT platform, and a real interactive TV application. It covers the deployment and communication of the wireless sensor network through the interoperability of data, to final consumption, through a real interactive television application. It has been tested within a residential community to provide real-time information, in order to improve the quality of life of its inhabitants. In addition, it incorporates the possibility of analyzing this information to establish processes with the objective of reducing energy consumption, thus improving sustainability and contributing to the efficient use of existing resources. The proposed framework serves as the basis for any deployment of similar characteristics.
Keywords:
smart city; internet of things; IoT; future internet; interactive TV; Arduino; Zigbee; Thingspeak; WSN1. Introduction
According to a study by the United Nations (UN) Habitat Trends Observatory [1], each year about sixty million people move to reside in urban areas, representing around a million every week. In 2050, 70% of the world’s population will live in cities. This is a challenge that will require transforming cities to make them livable and sustainable, taking into account the important role of information technology and communication that will make today's cities into “smart cities” [2].
A Smart City is considered a city that employs information and communication technologies to get its infrastructure, and offers public services, improved in an interactive and efficient way. This challenge aims to provide its infrastructure with solutions to facilitate user interaction with a wide range of urban elements. This is a digital platform on which a complex ecosystem of multiple agents is developed (the ones which get the information are called sensors and others acting against events are called actuators), managing a lot of data that makes you understand what is happening in the city and allowing you to provide some information and services to citizens more efficiently. The final objectives aim to make the use of resources more efficient, to increase service quality, to identify new needs, to provide information to citizens in real time, and to create a more sustainable path for economic and social development.
The use of information technologies to satisfy the challenges of the cities can be attributed to the strong concern for sustainability, to the social demand for real time information, and to the emergence of new Internet-related technologies, such as mobile devices, the semantic web, cloud computing, or the Internet of Things (IoT) [3].
In urban areas of Spain, mainly young couples with young children are those housed in gated communities. An urban community is a privately owned area that has restricted access, so it tends to be a closed place. This security may be embodied in various elements from simple key access gates, armored security doors, CCTV systems, to an alarm circuit.
A gated community offers a number of bonuses that make it attractive (the family atmosphere is isolated from the busy city center, and it provides extra security). In addition, the owners of these houses share a common property with gardens, sports facilities, and recreation zones. The cost of administering these common spaces depends on the number of services to be managed (management and supervision of the pool, garden, sports facilities, elevators, common lighting, air conditioning and central heating, concierge, and the insurance policy) and, obviously, the number of neighbors.
Under the environment of Smart Cities, the latest trends in construction are based on bioclimatic urbanization. In this development, the homes are based on an effective design that allows the seamless use of natural energies avoiding conventional energy consumption, with the related savings, and constructed following bioclimatic criteria (use of climatic conditions on site, use of recycled and recyclable materials, etc.), focused on generating a sustainable heating and ventilation system for the building. All collected data are sent to a central computer responsible for processing the obtained results, which enables monitoring operation at all times and checking the data for the indicated period.
Each house has installed sensors to monitor various parameters (the temperature at different heights of housing, humidity sensors, air flow meters, presence sensors, CO2, and particulate suspension/powder sensors) for further processing. In some cases, they include weather stations that measure parameters such as solar radiation, outside temperature, pressure, humidity, and electrical consumption and production that discriminate the sources of origin (PV panels, wind turbines, other renewables, and electric network).
In this paper, we present a low cost platform for the monitoring and helping of decision making about different areas in a neighboring community, for efficient management and maintenance, using information and communication technologies and proposing television as an interaction device, called SmartResidents. The systems available in the market are intended, for administration, to focus exclusively on developments to preserve security and restrict/prevent access to suspicious or undesirable presences, as well as to prevent attempted theft. Our proposal also contributes to safety. In addition, it is responsible for reporting and monitoring various parameters that will help make services work efficiently.
The main novelty of this paper is the development of a framework that integrates not only a wireless sensor network and an IoT platform but also a real front-end application for Interactive Television (iTV). In this work, the deployment of sensors and their online access has been successfully addressed, which has not been without challenges [4]. On the other hand, iTV (representing the evolution of traditional television) is a new platform on which new applications, utilities, and services for the end user are being developed. In this case, we provide a new ability to control the residential environment from the comfort of the home chair. iTV has the challenge of finding standards that support the new capabilities it can offer [5], and guides and tools for the development of new applications, as it is the case that competes us.
This article is organized as follows. In Section 2, the technologies involved are introduced into the platform. In Section 3, the proposed architecture for SmartResidents is specified. In Section 4, we detail the deployment scenario of the built prototype. Section 5 concludes with the work done, as well as the proposals for future work.
2. Technologies Involved
In this section we present the technologies involved in the aforementioned platform: Internet of Things (IoT), interactive TV, and REST Web services.
2.1. Internet of Things
The Internet was conceived as a global network to offer services such as WWW (World Wide Web) or FTP (File Transfer Protocol) to enable computers and users to communicate and exchange information. However, in recent years the storage and processing capacity of other kind of devices has improved significantly, providing them with the necessary resources for their integration into the global network. Furthermore, communication technologies are also evolving and electronic devices are becoming smaller and more affordable, making objects in our environment belong to what is known as the Internet of Things (IoT), a dynamic global infrastructure network with auto-configuration capabilities based on communication protocols and open standards, where all kinds of devices called “things” remain interconnected, interacting and working together to achieve common goals. Figure 1 presents an outline of the interactions that occur between the different entities of the IoT. IoT involves, in the context of wireless sensor networks (WSNs), connecting objects to the Web, allowing them communicating with other devices, objects, and people [6].
These devices are able to communicate with their environment by exchanging data and information captured and autonomously, reacting to events in the physical world. It is referred to as smart devices or smart things [7]. When we talk about smart devices, we mean any object in our environment capable of capturing and collecting information, transmitting it through the existing network infrastructure, receiving data from the network it belongs to, and acting in certain established conditions [8].
An IoT device generates a lot of data that must be stored and processed; however, the storage and processing capabilities of these devices are often limited. For this reason, the ability to transmit information autonomously from IoT devices through standard Internet protocols enables the storage of such data in external storage systems that provide persistence and processing capabilities. Within IoT architecture, these features belong to what are considered intermediate layers or middleware, that is, a software layer between the physical devices and applications that allow the developer to select the details of various underlying technologies and contribute to a rapid prototyping of service-oriented applications. The third layer would form the applications that consume data stored in the intermediate layer. Moreover, communication with smart devices can be bidirectional, so that some information sent to these devices may cause activation, according to established conditions.
The main components of an IoT device are [9]:
- Control Unit: usually a microcontroller or microcomputer with a single integrated circuit containing a processor, memory, and programmable input/output. This input/output can be programmed to collect data from physical devices (e.g., sensors) or to control external devices (e.g., LED screens or engines).
- Sensors: Devices responsible for measuring a physical quantity (temperature, humidity, etc.) and converting it into a signal that can be read and interpreted by the control unit.
- Communication Module: component device consisting of an electronic module that provides independent connectivity through communication protocols by using a wired or wireless network. This communication module can be configured through an intermediate node or direct Internet connection nodes.
- Power Supply: A small battery and a solar cell provided with any device for power supply loading.
2.2. Interactive TV
Moreover, traditionally, the most used ways to interact with intelligent systems have been mobile devices: smartphones, tablets, and PCs. However, the world of technology is continuously evolving, not only in the computer world but also in the world of television. This evolution has occurred at a hardware level going from CRT displays to LED screens, but also in another direction. Televisions have begun to incorporate digital content, and therefore a new term, SmartTV, was created. SmartTVs or intelligent TVs involve the integration of digital content, such as social networks, video portals, web browsing tools, or application execution platforms in a device traditionally used for consuming non-interactive linear content. From the 70’s, with the Teletext emergence, broadcasters have always tried to develop new ways to reach viewers. The great opportunity comes with iTV [10]. iTV (Interactive Television) is a way to watch TV in which the viewer can enjoy additional services (compared to the content provided by conventional television, which traditionally uses a one-way communication). The level of interactivity will depend on the possibilities of such content, from a more basic level where the user accesses this information but their actions are not communicated through a return channel, to a truly interactive experience, where the actions of the viewer with the contents are reported to the diffuser through a return channel and produce a response [11]. Throughout time there have been different standards whose main focus has been the development of interactive applications for television, including HbbTV [12,13]. It is a standard that convinces producers and television broadcasting because it standardizes the dissemination of interactive content against the “walled garden” model, in which the manufacturer guarantees an optimal user experience in exchange for exercising tight control over the content and applications that can run. However, the reality is that broadcasters do not provide HbbTV content and most of the current TVs are not compatible with this technology, so the launch is still going slower than expected. Conversely, models that transform televisions into smart devices are taking force (i.e., ones integrating this service as part of the TV, such as Samsung or LG (and others) through alternative devices connected to it, for example, Apple TV and Google TV (now Android TV).
The integration of television as a device for accessing the information society opens up a range of possibilities in applications development. On the one hand, Spanish people, for example, spend 246 minutes a day watching television [14], so the frequency of use compared to other media is considerably higher. Furthermore, SmartTVs propose attractive forms of interaction with the user, such as voice control, motion control, facial recognition, etc., resulting in a more motivating experience for users. Finally, the possibility of its use throughout a single input device with simple user interfaces, normally the remote control, causes greater acceptance by a broad range of user profiles.
2.3. RESTful Web Services for Communicating with the Cloud
Access to the services provided by the cloud has to be direct, open and interoperable, so the communication mechanisms used and the APIs provided should be easy to implement for each platform and development environment [15]. The principal mechanism for providing access to cloud platforms is Web Services. Using standard communication mechanisms based on HTTP, a Web Service can give certain functionality to other developers so that they can integrate it into their applications without knowing how it is implemented or the platform on which it is deployed. As advantages, we can mention the independence of both the language and the platform, and Web Services are based on the exchange of XML message standards. Moreover, most Web Services send HTTP messages, resulting in an advantage for the development of Internet-based applications.
There are currently two options for the development of web services: the traditional approach based on the exchange of SOAP messages and other REST-based approaches [16,17]. SOAP is a standard that describes the exchange of XML-based information with a specific format that describes the communication between clients and Web Service messages. REST is a software architectural style for distributed systems such as the Web. The exchange of messages and extendable standards and the use of a global addressing scheme have led to the success of the Web, making it scalable to the level of the Internet. REST motivation arises in the extension of these features. Its aim is to describe any interface that transmits specific data from a domain over HTTP without an additional layer, as SOAP does. It should be noted that REST is not a standard, just a style of architecture that is based on standards such as HTTP, URL, XML, etc. Accordingly, unlike SOAP, REST can access the contents of a service using HTTP GET or POST requests, remove it through HTTP DELETE requests, or update with HTTP UPDATE requests. A REST-based service includes four aspects: (i) the URI that represents and identifies the service; (ii) the types of service supported by the data (usually JSON, XML or CSV); (iii) the set of operations supported by service and accessible via HTTP; and (iv) the API requests to be specified in a hypertext language. REST’s decoupled architecture and lighter weight communications between producer and consumer make REST a popular building style for cloud-based APIs
3. System Architecture
This paper proposes the technologies introduced in Section 2 as the basis for the development of an IoT platform that allows for the real-time monitoring of common areas in a community of neighbors, using iTV as a medium of interaction. As proposed in [18], this architecture consists of three layers. Firstly, a first physical layer formed by sensors, actuators, and control units with communication hardware. Secondly, a logic layer constituted by a storage system and computer tools for data analysis and, finally, a presentation or application layer that allows for the visualization and interpretation of data across different platforms. Following the criteria proposed in [19], we have considered the following aspects in the design of the proposed architecture:
- Integration of a heterogeneous infrastructure: the heterogeneity of devices and networks used should be homogenized for its integration into the platform and so expose its functionality in a standard way.
- Infrastructure based on IoT: a great variety of devices should be integrated into the platform so that the access from it and to it can be done uniformly. Furthermore, it is necessary to expose all the chances of detection or performance transparently through well-defined interfaces to facilitate application development.
- Services Cloud: It should be possible to take advantage of the capabilities of cloud computing to provide tools and functionality to application developers, enabling the setting up of applications as far as possible from existing software artifacts, creating new services from others that already exist.
The proposed architecture can be seen in the Figure 2, in which you can see the three different layers: physical, logical, and application.
3.1. Physical Layer (WSN)
The physical layer is comprised of a WSN, in charge of capturing environmental data for normalization processing and sending them to the logic layer responsible for storage and further processing. The basic components of this layer are sensor nodes. They contain sensors and/or actuators. Sensors can measure physical phenomena such as temperature, humidity, and light, and provide a measurable representation of this phenomenon on a scale or specific range. There exist analog sensors, which generate a continuous output signal in time and amplitude between a voltage range, typically between 0 V and 5 V, and digital sensors, which produce a discrete signal that is the digital representation of a measured amount, usually equivalent to 0 or 1 equals 0 V and 5 V. Furthermore, the actuators are devices that operate under a specific condition or event named trigger. Although there are many actuators embedded in electronic integrated circuits, the most used in common environments are relays, capable of activating a circuit remotely (for example, turning on a light) and servo motors, devices capable of activating some simple movements (for example, turning a webcam). Each sensor node is equipped with a communication module responsible for transforming the information received in radio waves that allows communication with a control unit. The communication technology used in the WSN is ZigBee [20], one of the latest and most advanced wireless technologies for the communication of devices (through secure connections with a low rate of sending data, maximizing battery life, and low cost). ZigBee is a wireless communication protocol based on the IEEE 802.15.4 (developed by ZigBee Alliance) created for low power electronic devices and sensors which can perform wireless communications. Within the advantages of ZigBee it is worth mentioning their low cost, optimal transfer rate for these types of devices, range up to 100 m outdoors in networks of different topologies, and ability to manage thousands of devices on the same network [21].
Additionally, as Doukas indicated [9], there are several reasons why Arduino is an alternative to other microcontrollers on the market. Among them, we can highlight its low cost and cross-platform compatibility. Arduino proposes a platform for prototyping that is composed of a hardware board and a development environment. It employs an open-source electronics platform that is extensible and is based on the Atmel ATMEGA8 and ATMEGA168 microcontrollers. It also provides an easy-to-use development environment that uses free and extensible software through C++ libraries. In the above-mentioned architecture (see Figure 2), the physical layer is composed of two types of nodes: sensor nodes and control units. Both are built on Arduino microcontrollers. Each sensor node will cover a particular area of land from which it will communicate the data acquired by its sensors and actuators through the Zigbee protocol. Control units, in addition to supporting Zigbee, have a wireless connection that allows them to be permanently connected to the Internet, allowing a hybrid architecture, which combines interior and exterior zones. Each control unit will act in two different ways:
- When receiving a datum from a sensor node, it performs its processing and sends it to the logic layer via an HTTP POST connection using URI of the resource REST to update. The processing of these data consists of their normalization to adapt a physical quantity to the storage format in the logical layer.
- In the case of the actuators, the microcontroller checks the logical layer periodically to detect a possible change of status and to trigger an event that generates a task on an actuator installed on a sensor node.
In addition, the control units are responsible for the automatic detection of faults in the sensor nodes. For this, a method based on Round Trip Delay (RTD) is used [22].
For secure transmission of information between the sensor nodes and the control units, both RSA and Diffie-Hellman, based on the elliptic curve cryptography, have worked optimally in WSNs [23].
3.2. Logical Layer
The data generated by the sensors should be processed and stored so that they are persistent and accessible from different networks and for different applications. Given the benefits introduced in Section 2.2, the IoT platforms rely on computing environments in the cloud and architectures oriented to a service for storing and processing data, enabling the user to build applications that incorporate these services, forgetting effects on maintenance and how or where they are deployed.
Among other equally valid alternatives [24], such as Carriots (Madrid, Spain, https://www.carriots.com/) or Temboo (New York, NY, USA, https://temboo.com/), we have opted for ThingSpeak (Marlborough, MA, USA, https://thingspeak.com/) as the IoT platform for the logic layer. ThingSpeak [25] is an open source platform for IoT that offers a full and intuitive REST API to store and retrieve data using the HTTP protocol on the Internet or a local area network. In addition to the storage and retrieval of data, the ThingSpeak API allows the processing of numerical data such as timeline, averages, medians, or summations and creating expression data analysis easily in MATLAB. ThingSpeak organizes information in eight input channels that support numeric and alphanumeric data each. Each data is stored along with the date, time, and a unique identifier, which makes it a uniquely accessible object via a URI. Each channel supports CSV, XML, and JSON data interchange formats for its use in third party applications formats. In addition, the API provides functionality for generating statistical graphics from the cloud and its integration into an external application. To read or write data to a ThingSpeak channel, an application should take an HTTP GET or POST request via the provided API and the URI that identifies the object to update. Thus, each field is a REST object accessible via REST HTTP requests and POST and GET methods. In addition, we have experience with this platform in other projects [26].
In the proposed architecture, the data supplied by the sensors is organized in fields, which, in turn, are organized into channels. Figure 3 shows the interaction between different components of the SmartResidents architecture.
3.3. Application Layer
As discussed in Section 1, one of the trends in the world of technology is the connected TV. The television has evolved from being “the boob tube” to be an Internet-connected hybrid device capable of running applications that use that connection, employing user interfaces adapted to screen size and interactive interfaces through devices such as remote distance or pointing devices. Although standards such as HbbTV seem to be the future option for interactive television, where producers offer interactive content independent from the device manufacturer, today SmartTV covers most market shares, despite being a manufacturer-dependent platform without regard to any type of standard. Neither technologies are mutually exclusive, since the same device can integrate a SmartTV platform dependent on the manufacturer and be compatible with the HbbTV standard for interactive content consumption. The dependence of a SmartTV platform of specific standards of each manufacturer causes technical fragmentation between the different platforms, so the standard development applications are clearly affected. For this reason, more and more users choose to use external devices such as Set Top Box (STB) that converts a conventional TV into a smart TV. Within this sector various TV manufacturers platforms can be differentiated (Apple TV, Google TV, etc.), that offer applications through their own portals or generic devices based on a particular platform, e.g., Android.
In the proposed architecture, although the data stored in the logical layer are accessible from any device and application, it intends to use the television as the main access device. The TV is a device that exists in most houses, runs longer than any other appliance throughout the day, and is an accessible means to a great deal of user profiles. The running of applications on television requires certain peculiarities that are different from running on other platforms, due to features such as the size and orientation of the screen and the limitations of user interaction. On a television, screen orientation is always horizontal and larger than other devices, and users are placed at a much larger visualization distance. This influences the design of the user interface so that navigation is usually established from left to right, based on the horizontal orientation of the screen (where the available actions are always visible through simple menus). In addition, the user always marks the active choice not to lose focus and the elements are at a distance that allows a perfect differentiation.
The objective of the application is to take advantage of the size of the television screen, typically above 32-inches, to visualize an overview of the urbanization, where the exact location of each of the sensors and actuators can be observed. Google Maps [27] provides a set of APIs that let you embed the functionality of Google Maps into a website or application. The goal is to use this tool to display a satellite map geo-located at the urbanization. On this map, using the API mentioned and the longitude and latitude data over its real sensor situation on the ground, a number of markers associated with each of the deployed sensors are strategically placed, showing, at all times, the last data read, as well as the date/time of reading. This mechanism offers clear advantages from the point of view of application functionality, as the user sees the exact location of the sensors and has access to real time information on the map itself. On the other hand, it is worth mentioning the advantages of using an open, flexible, and updated mapping system, where all maps are in the cloud providing fast, efficient, and highly available access.
4. Deployment Scenario and Prototype
Based on the proposed architecture, a prototype has been developed and deployed. The physical location corresponds to a closed community of neighbors, covering approximately 6000 m2 in the town of Mérida, Badajoz in Spain. The complex consists of three buildings with a total of 148 homes and is equipped with two swimming pools, green areas, a playground, and a paddle tennis court.
4.1. Physical Layer
The physical layer has 12 sensor nodes. Currently, each sensor node consists of an Arduino microcontroller and a Xbee shield, with a Series 1 802.15.4 XBee module connected and a Grove shield with a sensor connected. Table 1 shows the sensors used.
All sensors used (see Table 1) form part of the Grove system (Figure 4) from Seeedstudio (San Leandro, CA, USA, www.seeedstudio.com/wiki/GROVE_System) that allows an easy plug connection with the grove base shield.
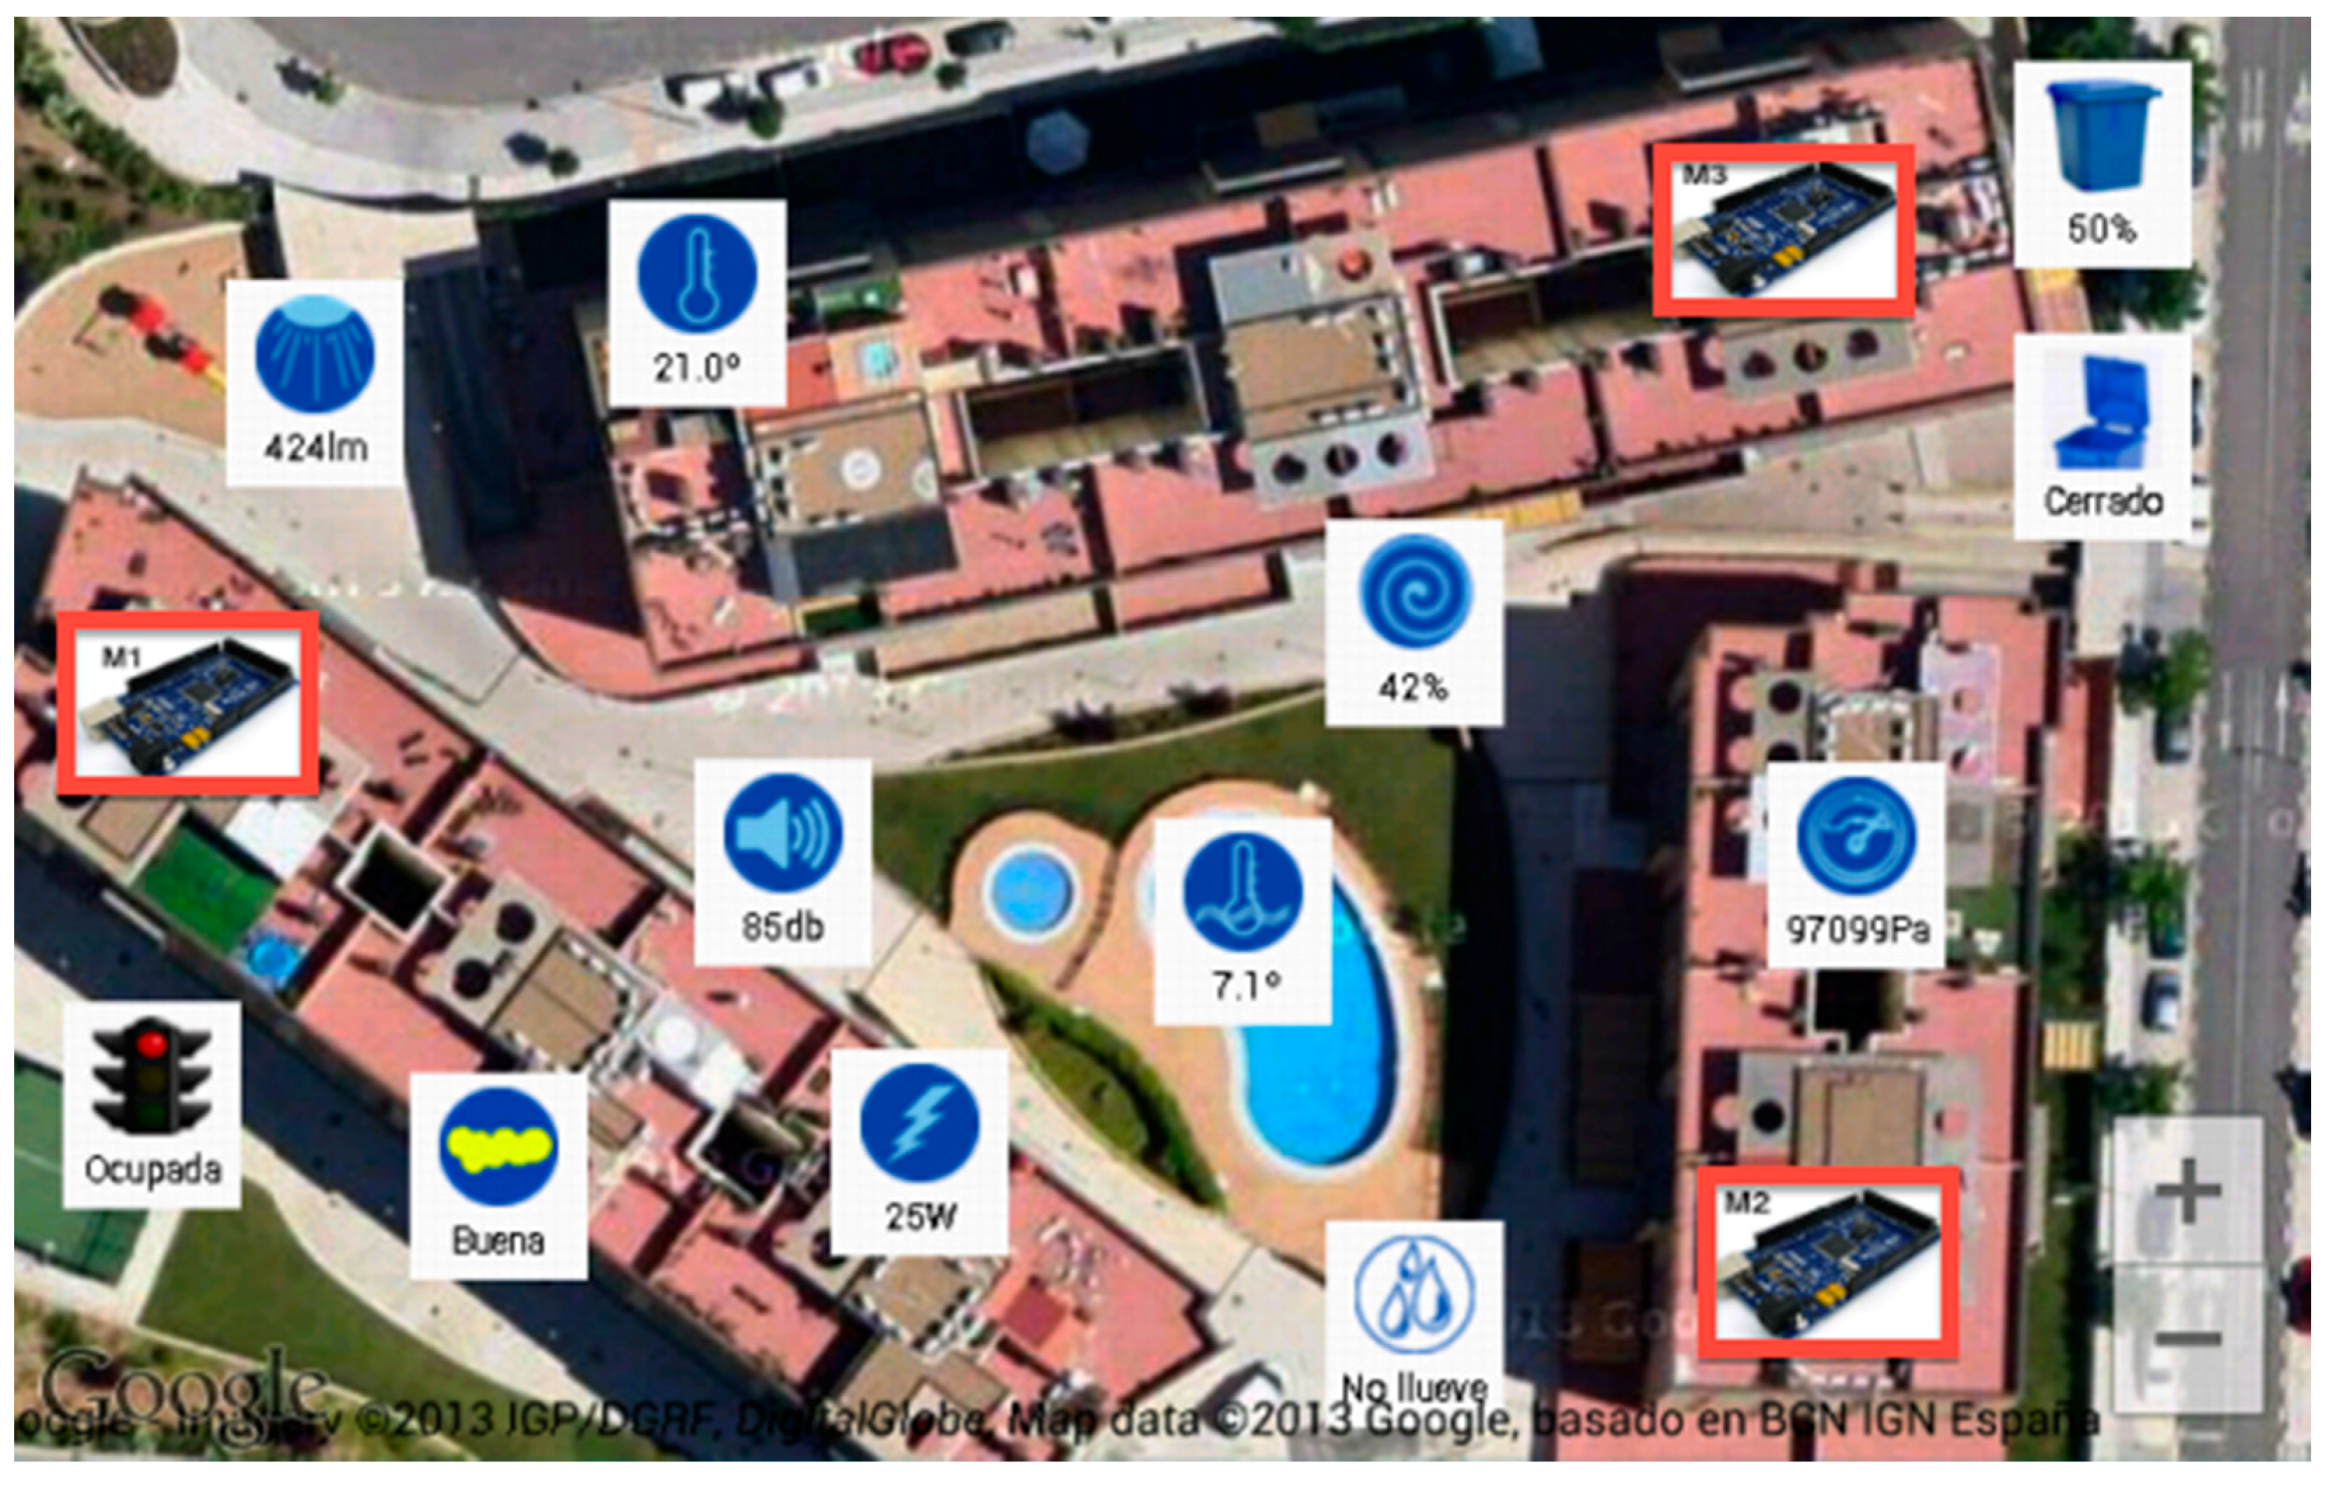
In addition, the physical layer consists of three control units. Each control unit consists of an Arduino microcontroller and an Xbee shield with an Xbee module connected and a wifi shield. The function of each control unit is to process the data received from the sensors within range to send to the logical layer. These control units are distributed to cover the full extent of the urbanization. The communication between the sensor nodes and the control unit uses the Zigbee protocol. Sensor nodes have limited functionality: they spend most of their time in sleep mode and wake up only to send information when asked for it (or to update it, if the sensor node has an actuator installed). Thus, sensor nodes behave periodically as active Zigbee nodes. Some of the sensors produce data that should be normalized into the control unit before being sent to the logical layer. When the data is ready, the control unit sends it through the Wifi connection, which allows the use of the TCP/IP network infrastructure. This wireless connection can be used in control units because these devices are connected to the electric current, therefore they can meet the energy needs of these connections and produce benefits such as increased bandwidth, ease of configuration, and flexibility in the network. The status of the three microcontrollers can be seen in Figure 5.
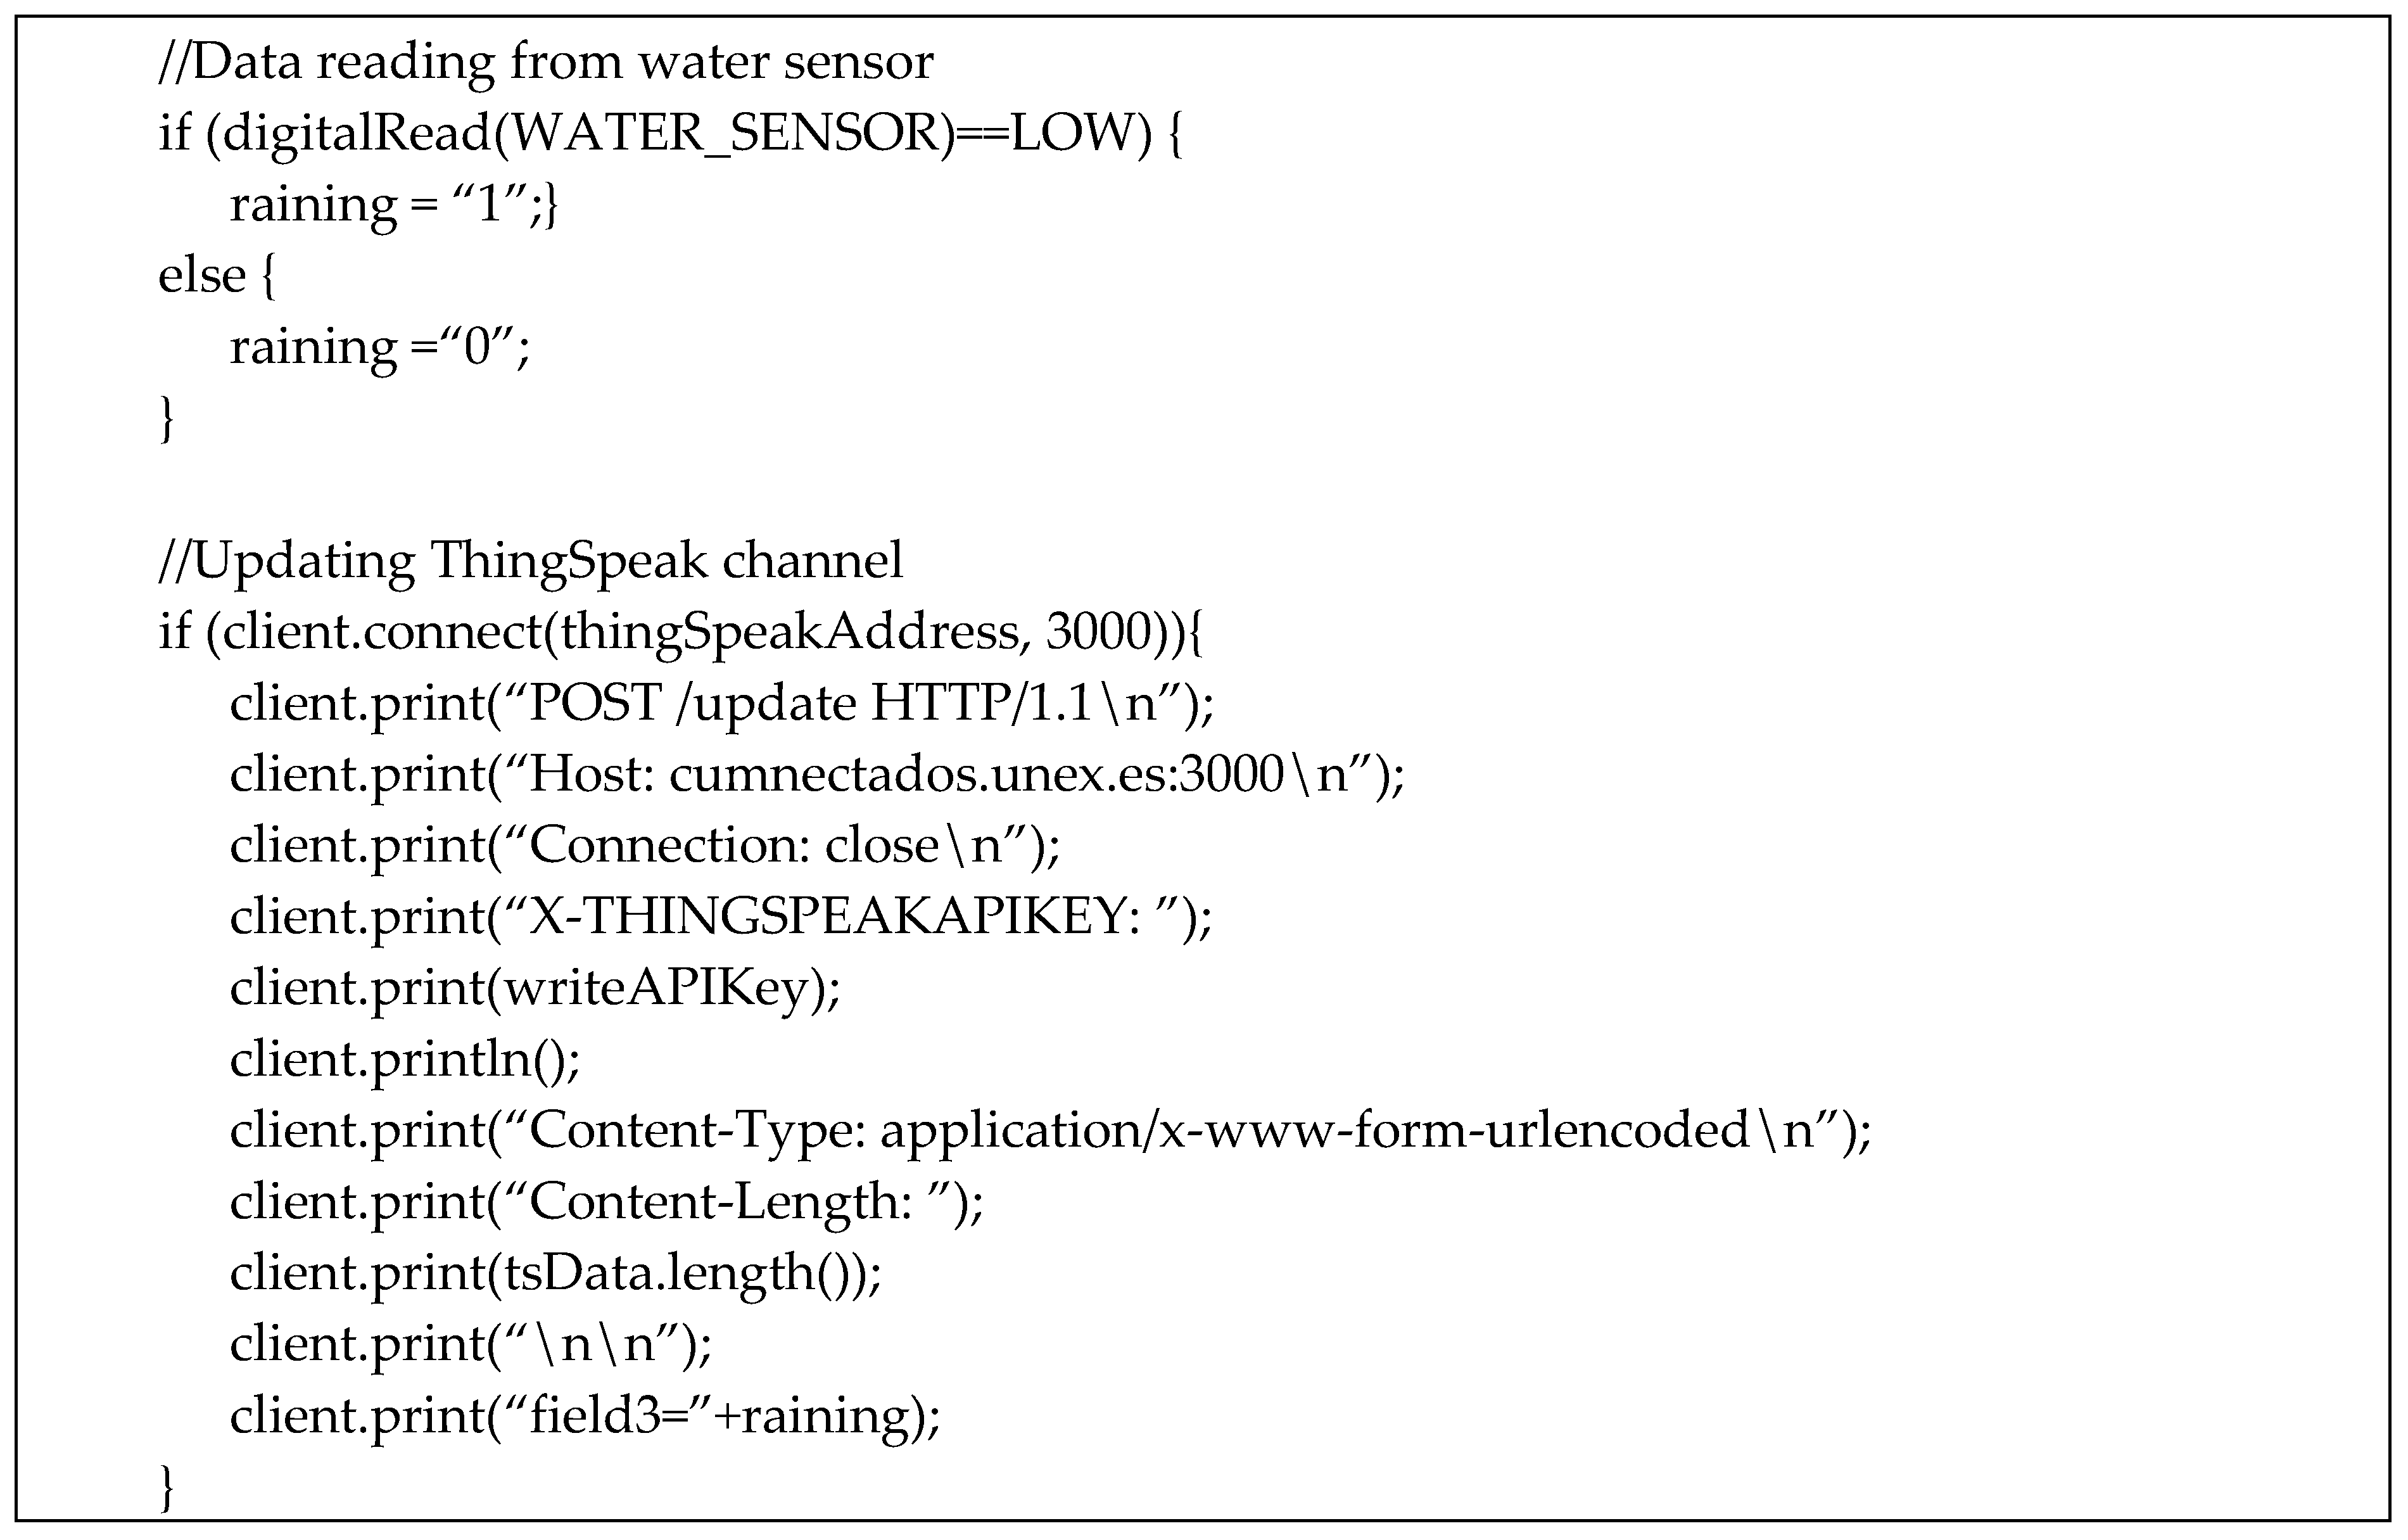
Figure 6 shows the code executed by the control unit to read data from the rain sensor and send it to the logical layer. After taking a rain sensor reading, in this case a digital sensor that provides discrete values 0 and 1, an HTTP POST request is made to update the field assigned to this sensor.
4.2. Logical Layer
The logical layer has been built using ThingSpeak (https://thingspeak.com/) as a cloud IoT platform for storing and processing data. The middleware layer of SmartResidents consists of two channels, including the different fields in which the data generated by the sensors are allocated. Although ThingSpeak sets default public channels, SmartResidents channels are private, so a write and a read key is automatically generated on each channel by the platform and must first be used from the physical layer to update the information in each channel, and then from the application layer in order to consume the data stored there.
The association between channels and fields can be seen in the Table 2:
4.3. Application Layer
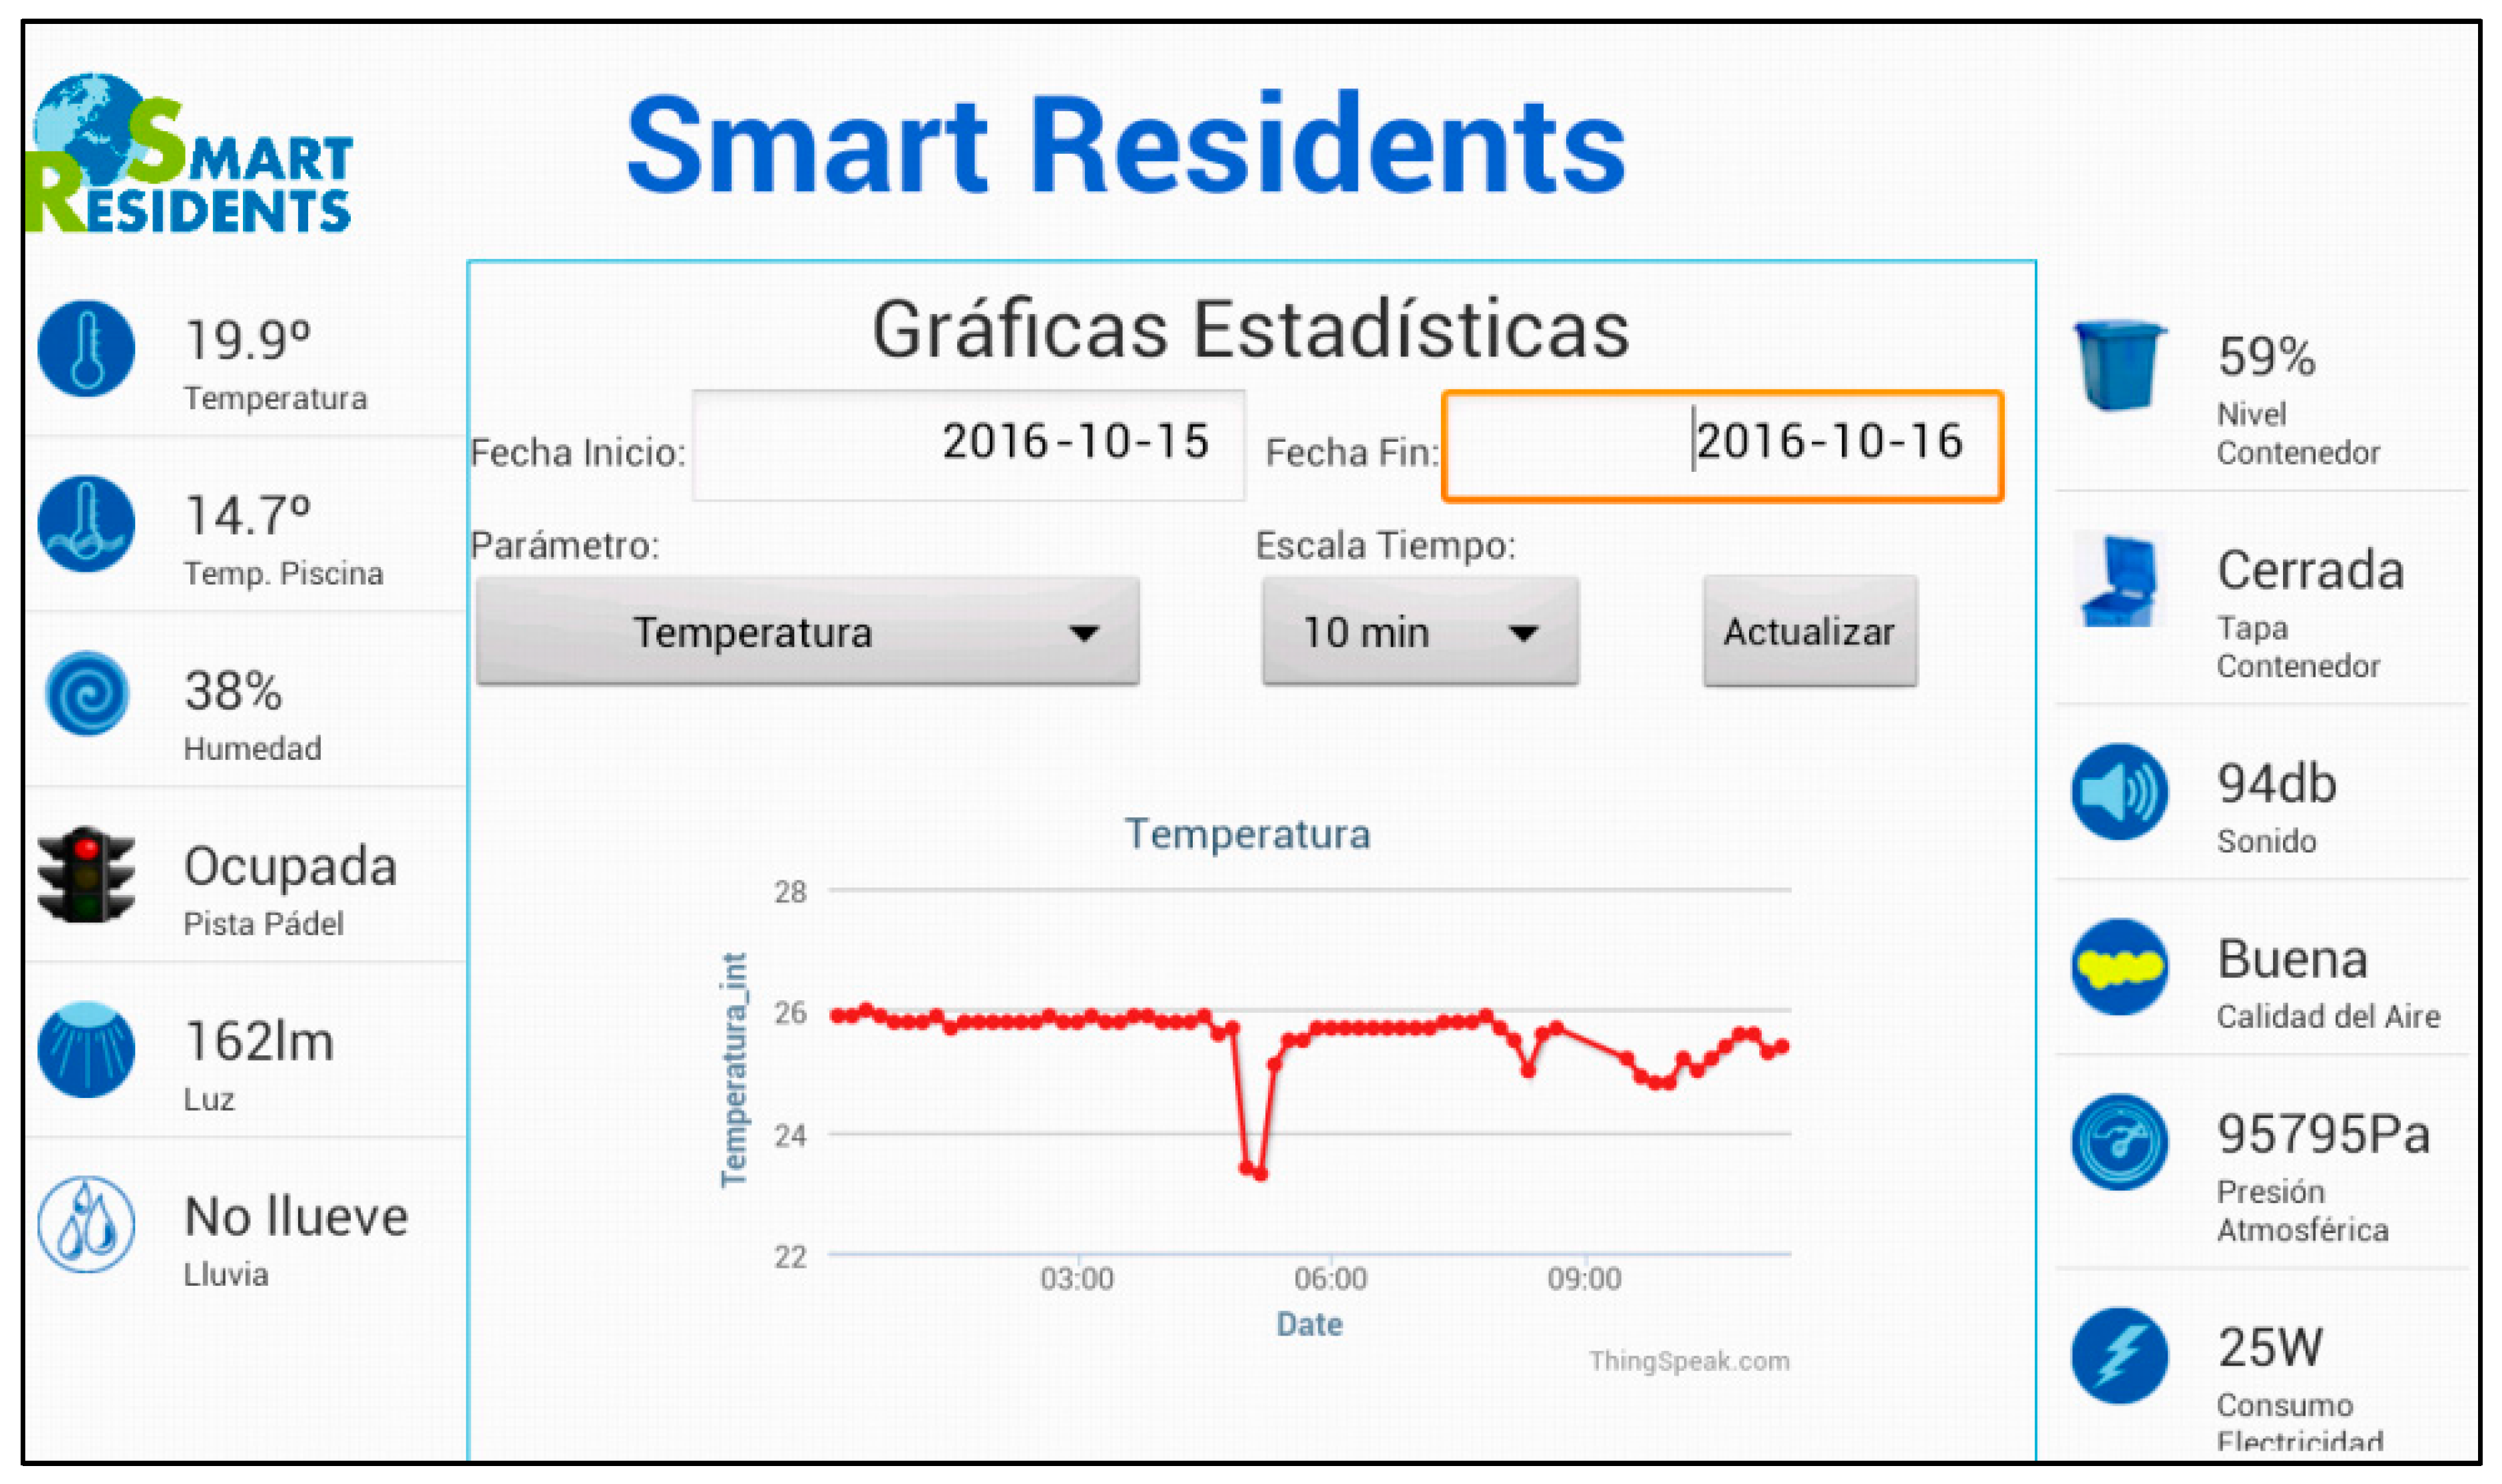
The application layer is developed using a TV viewing platform. The execution platform is based on the Android operating system running the application on an external device and generating an output that is redirected to the television. The application is developed by taking into account the characteristics of the display device, which has features such as: large screen size, horizontal orientation, and limited interaction devices from a remote or small keyboard with a pointing device. For this, the design of the user interface has two vertical menus, placed on the left and right. The application layer performs various data processing tasks in order to generate information that may be displayed to the user. As an example, we could include the use of a paddle court. The motion sensor placed in the court records information on motion detected continuously, and the application uses this information to determine whether the track is occupied, if motion has been recorded in the last five minutes. The SmartResidents interface can be seen in Figure 7.
As can be seen in Figure 7, the application displays a satellite map located geographically where each sensor appears represented by an identifying icon, next to the last value obtained. This map allows the user to view a visual representation of the location of each sensor. The same information is shown in two vertical navigable menus on the left and right of the map. By processing the data supplied by the logic layer, the application layer interprets the data in accordance with the user interface, in order to display it in a more attractive way. For example, the state of the paddle tennis court is represented by an icon containing a red light if it is busy and green if it is not. Another example is the air quality icon showing different colors, which reflect the data collected: green for excellent values, yellow for good values, orange for warning, and finally red for dangerous values.
Through vertical options from menus and icons on the map, you can access a second screen as shown in Figure 8, through which the application provides more specific statistical data on each of the measurements. Through the form, you can set filter parameters such as date range and time scale. The figure shows a graph with the evolution of temperatures on 16 October 2016, with a time scale of 10 min.
As Android is a platform available on many mobile devices, including smartphones and tablets, the application may have been adapted to the particularities of these device interfaces, while the application logic is the same as for a television.
4.4. Stored Data
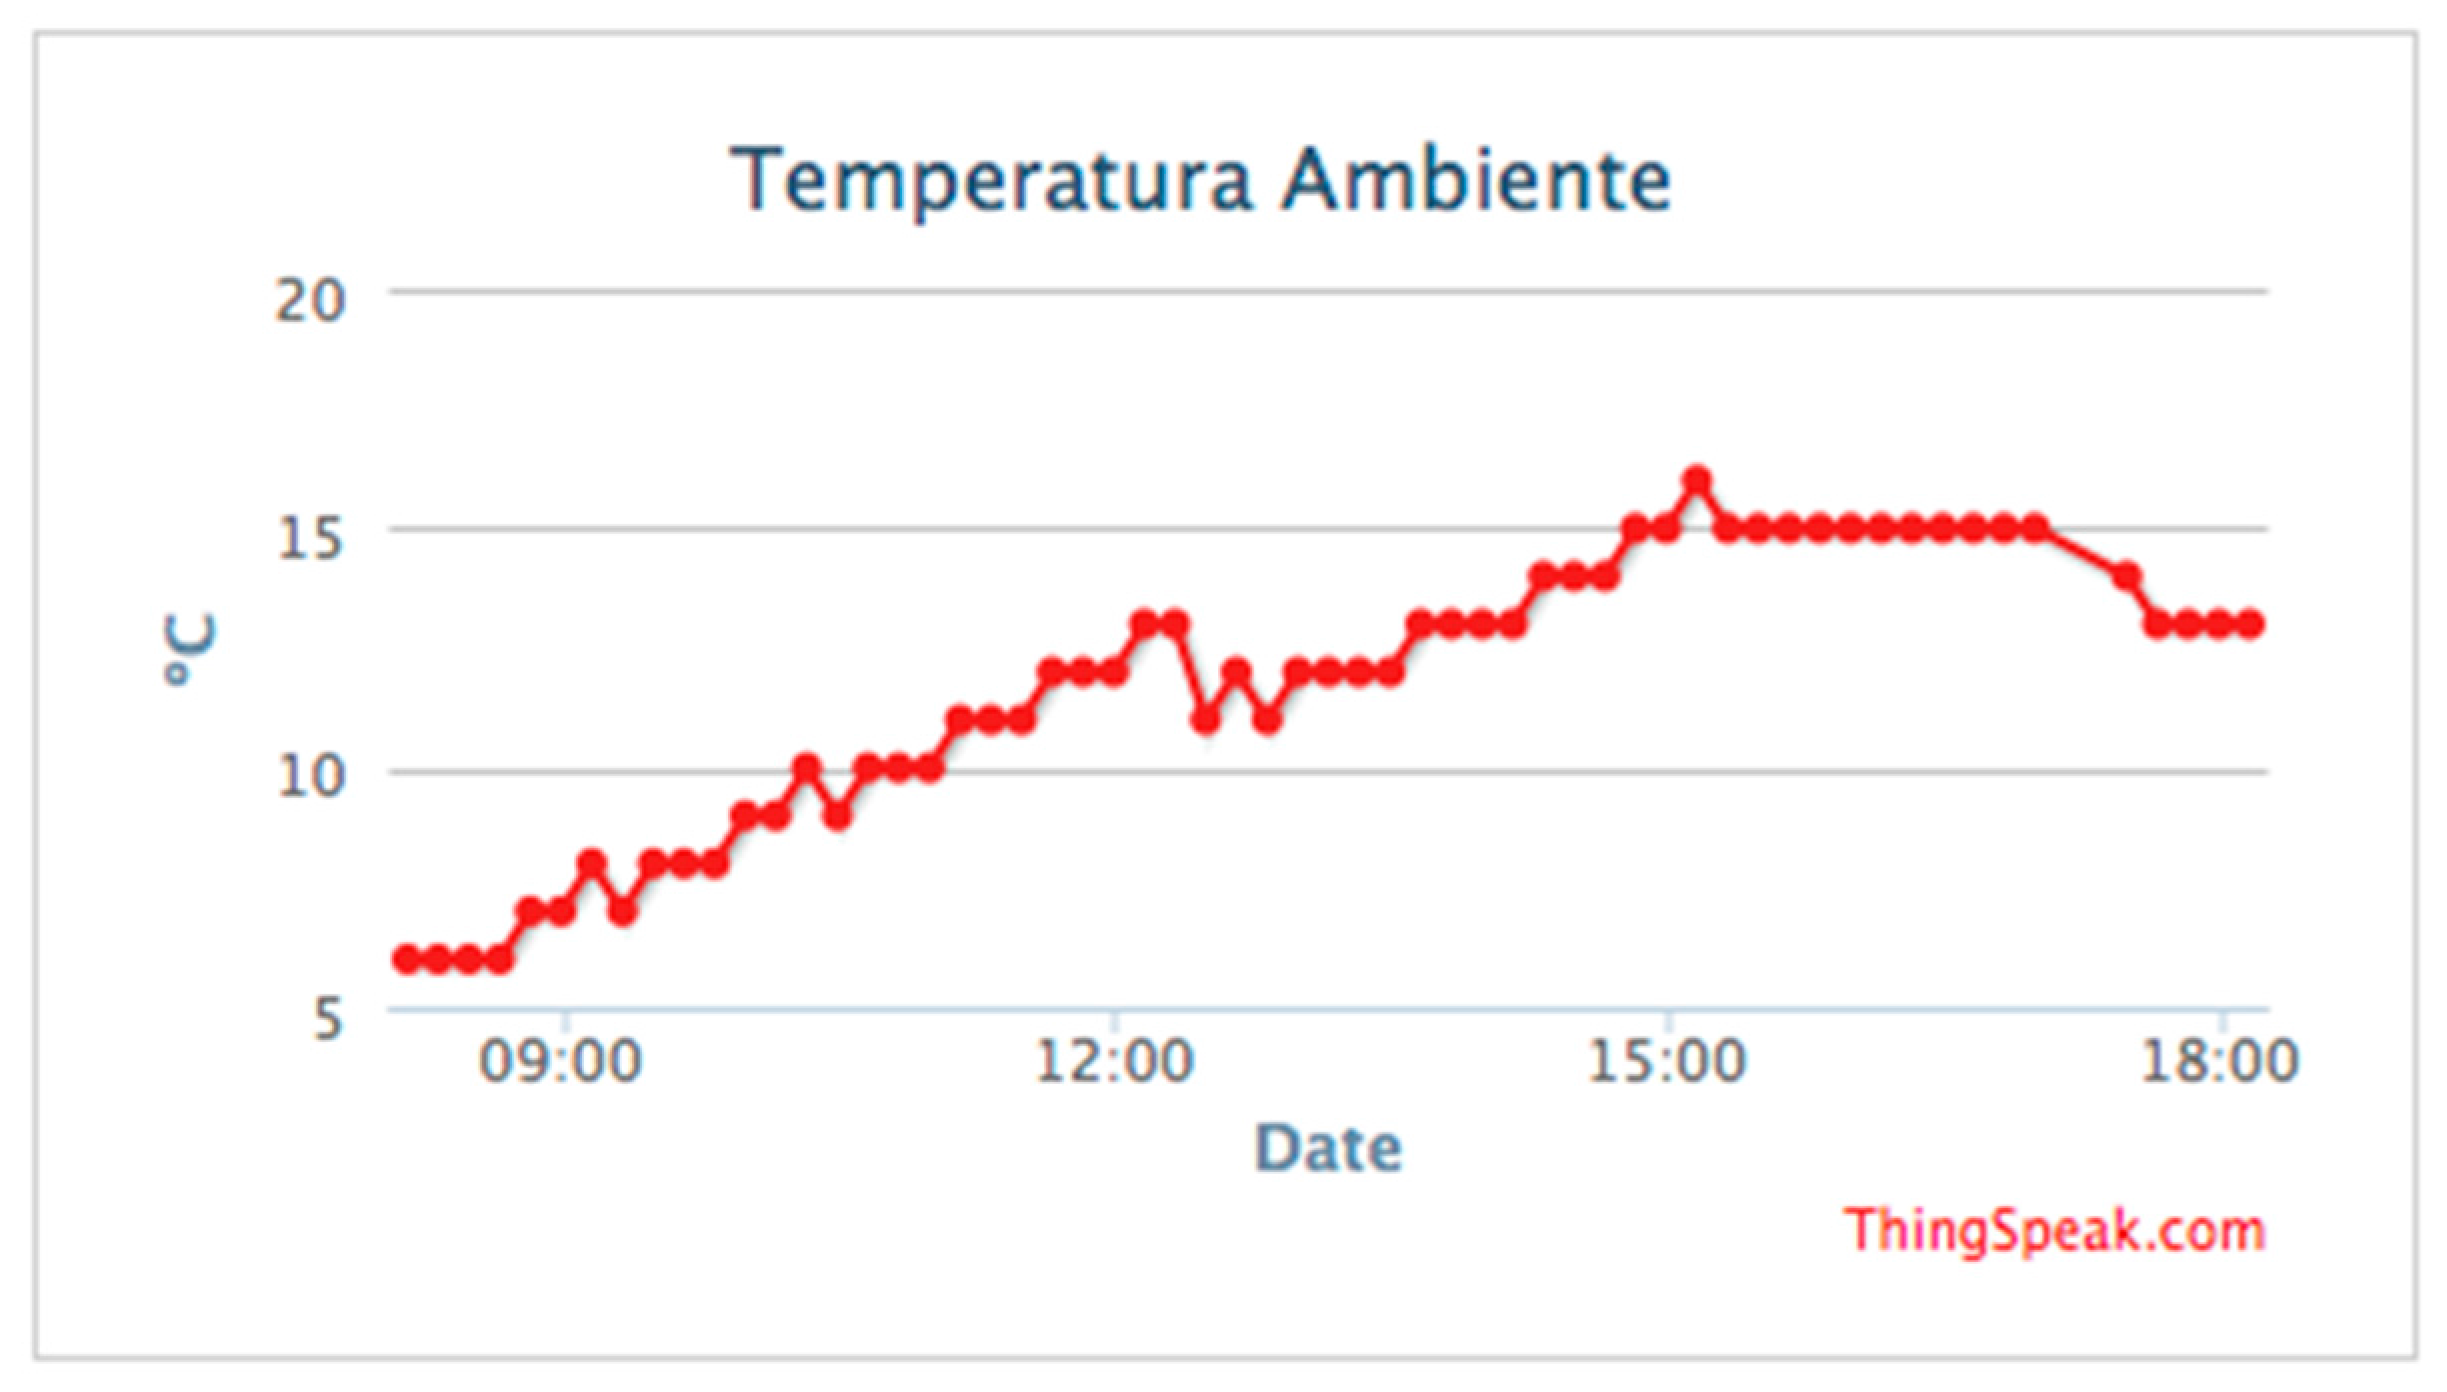
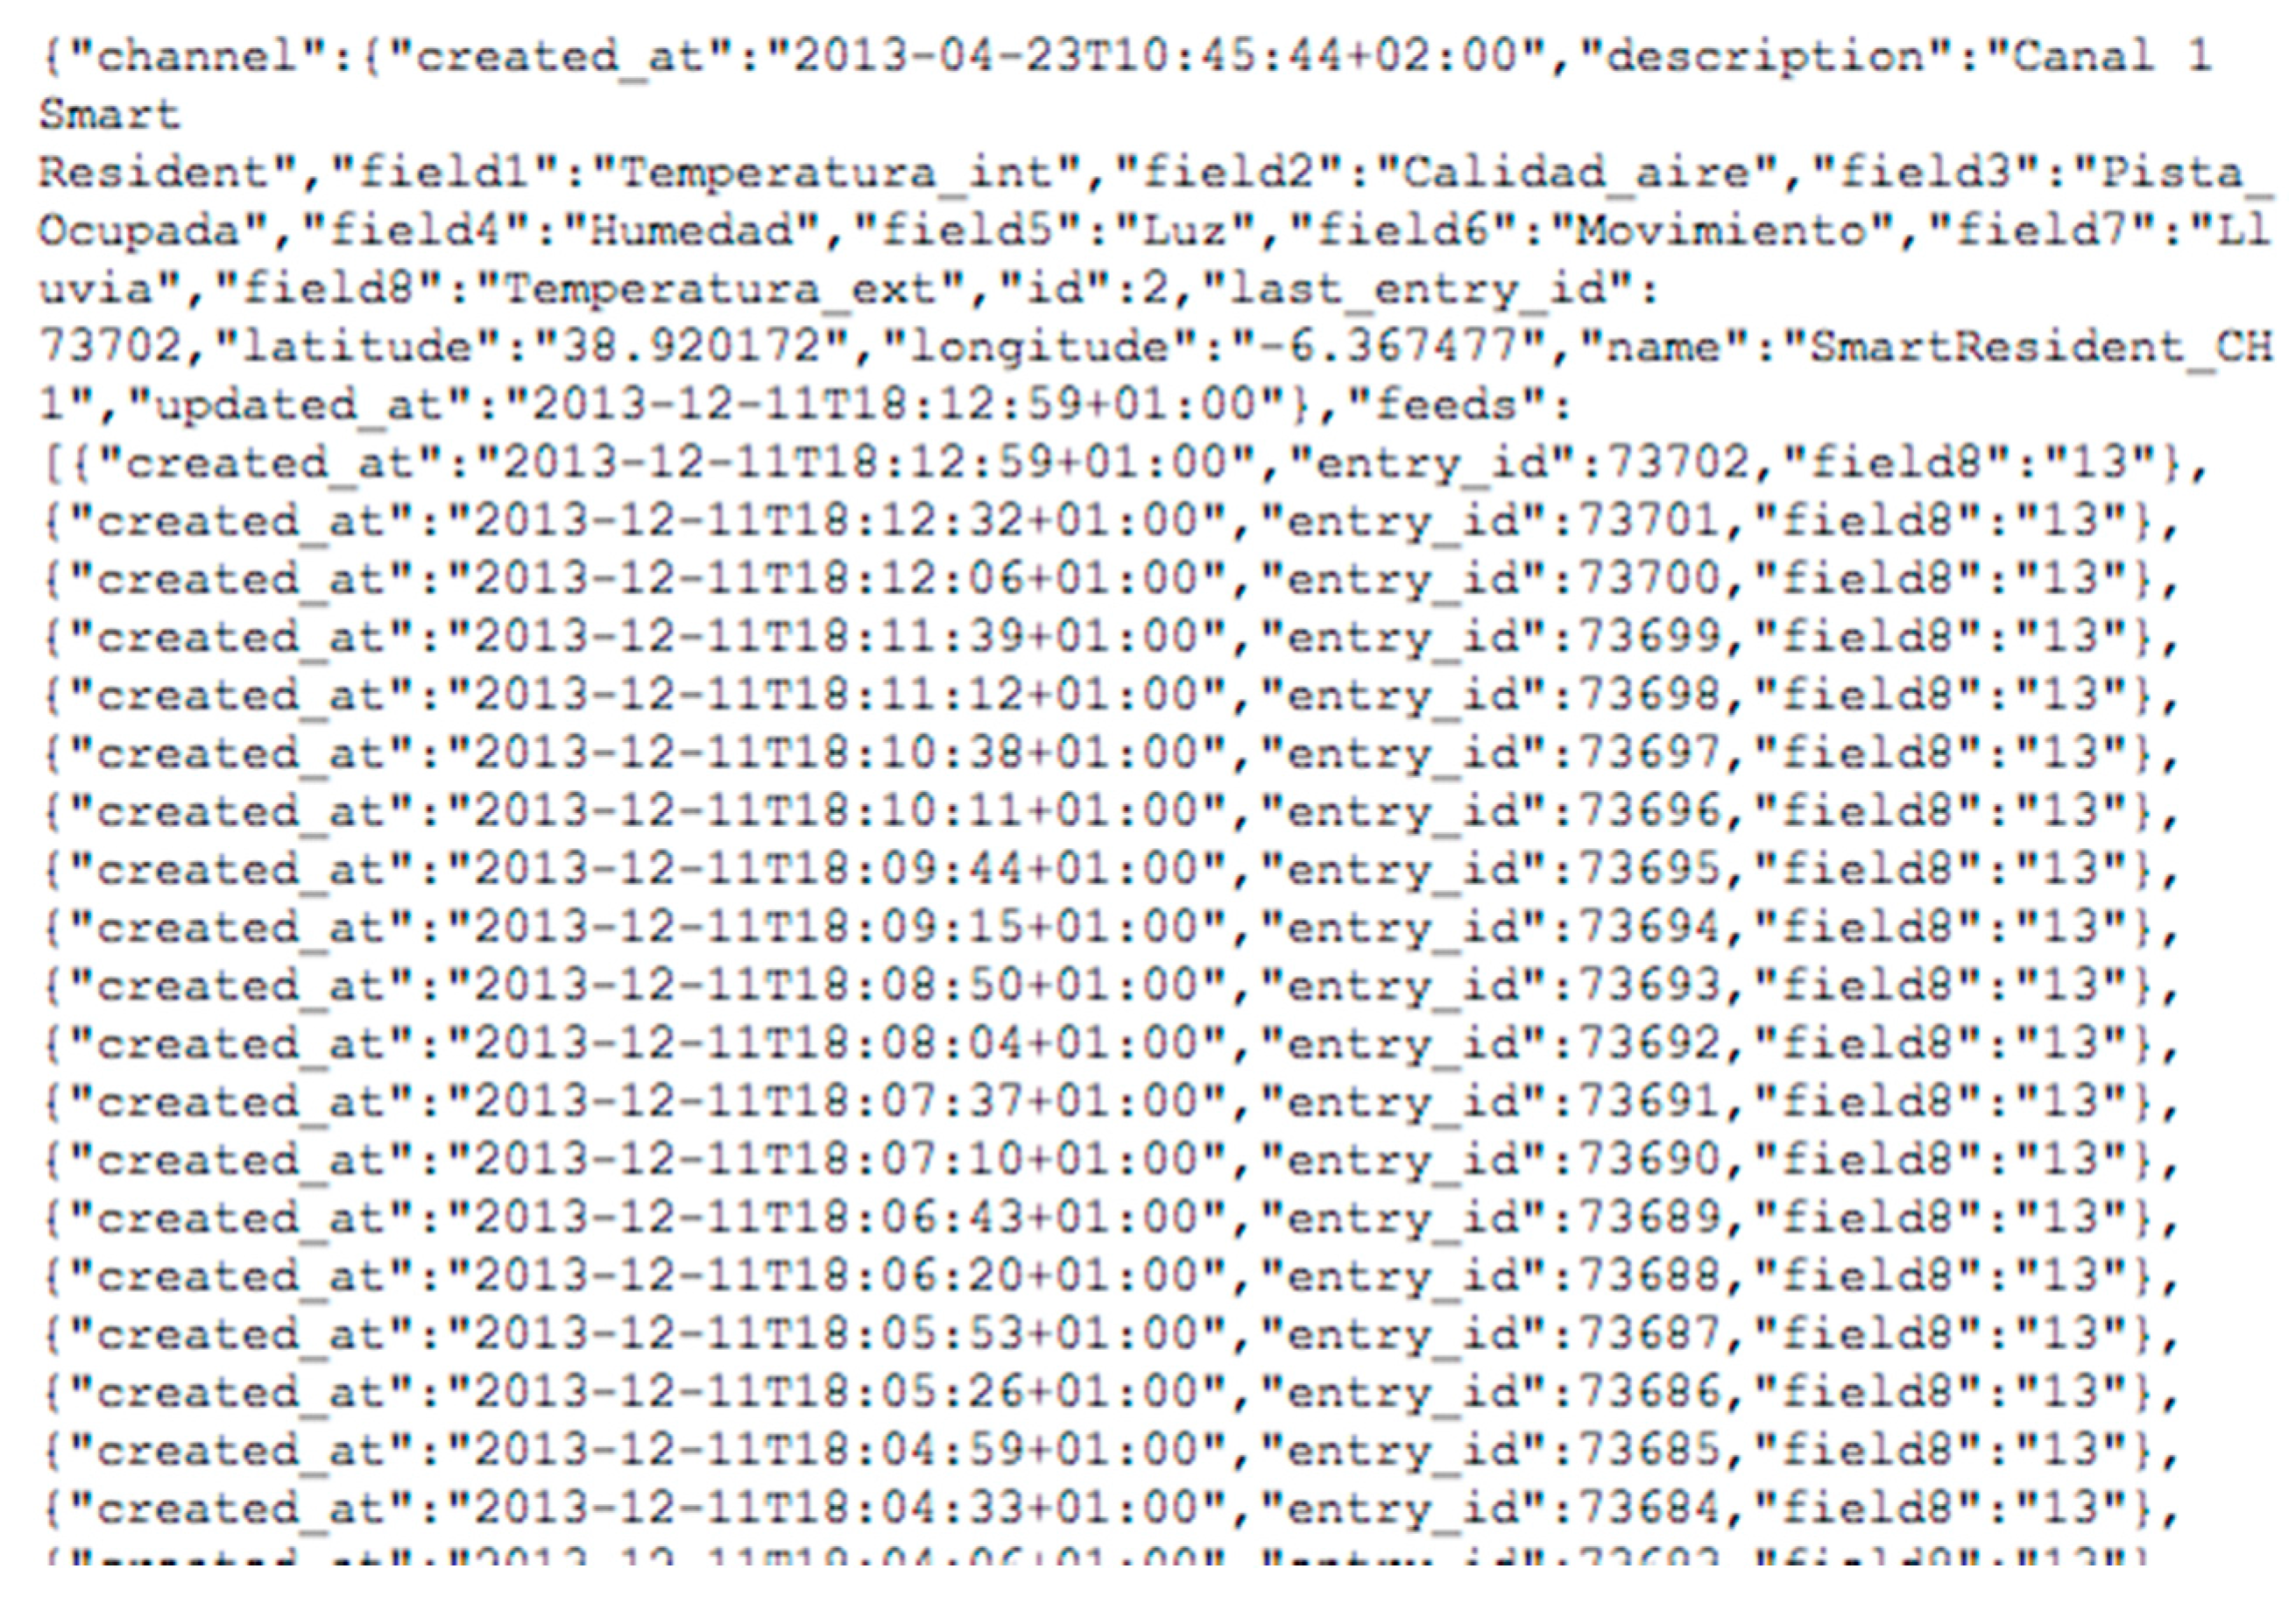
One of the main services offered by SmartResidents to its users is providing real-time data of different types that can be consulted from the television as the primary interaction element. The user knows in an instant if the paddle tennis court is occupied at any given time, the temperature of the pool or the air outside, whether dumpsters in a given area are full, or the noise levels in the area, which undoubtedly improves residents’ quality of life. In addition, changes in all these factors may be consulted using different time scales or dates, allowing more thorough analysis for a specific end goal. Figure 9 shows the changes in the temperature for a given day from 08:00 H to 18:00 H, in time intervals of 10 min, using graphics to show the benefits of cloud computing. SmartResidents integrates this functionality in the application.
These analysis capabilities allow stored information to be analyzed thoroughly, using the tools provided by the logical layer. The analysis capabilities of cloud computing (through the use of information technology and communications, or more advances tools [28]), allows the provision of alternative services to improve energy management and optimize the use of existing resources to be focused on. Along these lines, a number of proposals are introduced in the next section.
5. Potential Benefits
Potential benefits of the proposed prototype are derived from the analysis and exploitation of different data analysis techniques, as proposed in [28]. For example, by leveraging the capabilities for data analysis offered by the logical layer (ThingSpeak), it is possible to react to changes and make decisions that result in improved community services and more efficient management of existing resources. The resources analyzed were as follows:
- Optimization for dumpsters: the data provided by the sensor, placed in dumpsters, records the times when residents throw out the trash and determines the time of collection. The aim is to establish a schedule for the deposit of waste so that the containers are full for the shortest possible time, especially in summer.
- Rationalization of water consumption for watering gardens: the analysis of soil moisture at different times of the year can rationalize the consumption of water by adjusting watering schedules according to the time of the year. In addition, possible future work could include installing sensors in order to activate sprinklers, based on humidity measured in real time.
- Measurement of noise levels: within the established norms for hours in which noise levels should be considerably lower, or respecting the schedules for using the pool in summer. Sound sensors allow continuous logging of noise levels in those areas allowing measurement of the times when noise levels exceed the maximum allowed.
- Optimizing power consumption: sensors enable electricity consumption to be read in real time for different devices. This allows users to adapt their consumption at times when rates are lower. In addition, the light sensors allow public lighting levels to be set depending on the light intensity at a given moment, allowing for a more efficient consumption without being subject to strict schedules.
- Pollution levels: one of the current concerns of city dwellers is environmental pollution. SmartResidents can continuously record pollution levels based on different parameters that provide insightful statistics on times, days, or time intervals of contamination.
- Swimming pool remote measurement: measuring oxidation-reduction potential (ORP), pH, and cloride levels of water can determine if the water quality in the swimming pool is sufficient for recreational purposes. Otherwise, the pool maintenance person will be alerted and will undertake the necessary actions to restore water sanitation.
Use of certain statistical resources: managing a residential community means balancing neighborhood expenses as effectively as possible. With the SmartResidents platform, statistics on the use of certain common resources can be calculated, for example, the maintenance required by the paddle court, according to usage by residents. The contrast between the potential benefit and the prototype’s low cost justify the investment. The cost of the hardware components needed for the prototype deployment came to $1400 (each sensor node costs $87 and each control unit costs $117).
6. Conclusions and Future Work
Changes in the storage and processing capabilities of increasingly smaller and cheaper devices, as well as communication technologies, have led to a multitude of objects of daily life becoming part of what is known as the Internet of Things, a global network infrastructure and dynamic communication protocol based on open standards, where all kinds of devices called “things” interact and collaborate to achieve common goals. This is the basis for the construction of complex ecosystems where multiple agents interact to provide more efficient services, usually within Smart Cities. On the other hand, television has evolved into Interactive Television, becoming devices capable of running applications and connecting to the Internet allowing the viewer to enjoy additional services beyond the content provided by conventional television, which is based on one-way communication. SmartResidents introduces architecture for monitoring and automation in residential communities through the integration of paradigms leading to Future Internet: on the one hand, the Internet of Things, a platform for the collection, transmission, storage and processing of data generated by sensors; and secondly, interactive television that allows access to device information across applications, with simple user interfaces adapted to the particularities of the device. Televisions used as an access device allow new services to be used through a device that has traditionally been used for consumption of TV content, only while leveraging its processing capabilities. Television, thus, becomes a much more active member of the household, a medium through which we interact with our environment.
The proposed architecture for SmartResidents is extendable and scalable, as it is possible to change the size or configuration of the physical layer to adjust to new requirements without adversely affecting the quality of service. The heterogeneity of the nodes in the WSN, and data generated by them, can be saved using a unified and standardized data model to facilitate interoperability [29]. The interaction between the layers is established through a well-defined interface so that changes in one of them do not affect the others.
At present we are working on an update of this IoT ecosystem, in two main lines: first, in the interaction with the inhabitants, through other devices (such as smartwatches with Telegram bots, for example), to alert for inappropriate values of some sensors or failure in some of the nodes of the physical layer; second, we want to improve the physical layer by upgrading the microcontrollers of the sensor nodes to more innovative solutions, like ESP8266 or Arduino MKR1000.
Acknowledgments
None. No funding to declare.
Author Contributions
H.S., C.G.-C., and J.E.A. provided the conception and design of SmartResidents’ architecture; J.E.A. and M.M. performed the calibration of all sensors; C.G.-C. and J.E.A. developed the prototype and deployed it in the community of neighbors; H.S. and M.M. supervised the prototype's operation, the acquisition, and visualization of data in real time; H.S., C.G.-C. were responsible for drafting the article and revised it critically for important intellectual content; J.E.A. and M.M. gave final approval of the version to be submitted.
Conflicts of Interest
The authors declare no conflict of interest.
References
- United Nations, Department of Economic and Social Affairs, Population Division. World Urbanization Prospects: The 2014 Revision, Highlights (ST/ESA/SER.A/352). Available online: https://esa.un.org/unpd/wup/publications/files/wup2014-highlights.Pdf (accessed on 5 July 2017).
- Schaffers, H.; Komninos, N.; Pallot, M.; Trousse, B.; Nilsson, M.; Oliveira, A. Smart cities and the future internet: Towards cooperation frameworks for open innovation. In The Future Internet (FIA 2011); Domingue, J., Galis, A., Eds.; Springer: Berlin/Heidelberg, Germany, 2011; Volume 6656, pp. 431–446. [Google Scholar]
- AMECIT. Informe de Smart Cities 2012. Available online: http://ametic.es/es/publicaciones/smart-tics (accessed on 5 July 2017).
- Chen, N.; Xiao, C.; Pu, F.; Wang, X.; Wang, C.; Wang, Z.; Gong, J. Cyber-physical geographical information service-enabled control of diverse in-situ sensors. Sensors 2015, 15, 2565–2592. [Google Scholar] [CrossRef] [PubMed]
- Schwalb, E. ITV handbook: Technologies & standards. Comput. Entertain. 2004, 2, 17. [Google Scholar]
- Pajares, G. Sensors and technologies in Spain: State-of-the-art. Sensors 2014, 14, 15282–15303. [Google Scholar] [CrossRef] [PubMed]
- Kuniavsky, M. Smart Things: Ubiquitous Computing User Experience Design, 1st ed.; James, M., Ed.; Elsevier: San Francisco, CA, USA, 2010; pp. 1–287. [Google Scholar]
- Atzori, L.; Iera, A.; Morabito, G. The internet of things: A survey. Comput. Netw. 2010, 54, 2787–2805. [Google Scholar] [CrossRef]
- Doukas, C. Building Internet of Things with the Arduino, 1st ed.; CreateSpace: North Charleston, SC, USA, 2012; pp. 1–352. [Google Scholar]
- Obrist, M.; Bernhaupt, R.; Tscheligi, M. Interactive TV for the home: An ethnographic study on users’ requirements and experiences. Int. J. Hum.-Comput. Interact. 2008, 24, 174–196. [Google Scholar] [CrossRef]
- Chorianopoulos, K.; Lekakos, G. Introduction to social TV: Enhancing the shared experience with interactive TV. Int. J. Hum.-Comput. Interact. 2008, 24, 113–120. [Google Scholar] [CrossRef]
- HbbTV. Available online: http://www.hbbtv.org/ (accessed on 31 May 2017).
- Merkel, K. Hybrid broadcast broadband TV, the new way to a comprehensive TV experience. In Proceedings of the 2011 14th ITG Conference on Electronic Media Technology (CEMT), Dortmund, Germany, 23–24 March 2011; IEEE: Washington, DC, USA, 2011; pp. 1–4, ISBN 978-1-4577-1269-2. [Google Scholar]
- Anuario SGAE de las Artes Escénicas, Musicales Yaudiovisuales 2013. Available online: http://www.anuariossgae.com/anuario2013/home.html# (accessed on 31 May 2017).
- Mahesh, D.S.; Savitha, S.; Anvekar, D.K. A cloud computing architecture with wireless sensor networks for agricultural applications. Int. J. Comput. Netw. Commun. Secur. 2014, 2, 34–38. [Google Scholar]
- AlShahwan, F.; Moessner, K. Providing SOAP web services and RESTful web services from mobile hosts. In Proceedings of the 2010 Fifth International Conference on Internet and Web Applications and Services (ICIW), Barcelona, Spain, 9–15 May 2010; IEEE: Washington, DC, USA, 2010; pp. 174–179. [Google Scholar]
- Pautasso, C.; Zimmermann, O.; Leymann, F. Restful web services vs. “Big”’ web services: Making the right architectural decision. In Proceedings of the 17th International Conference on World Wide Web, WWW ’08, Beijing, China, 21–25 April 2008; ACM: New York, NY, USA, 2008; pp. 805–814. [Google Scholar]
- Gubbi, J.; Buyya, R.; Marusic, S.; Palaniswami, M. Internet of things (IoT): A vision, architectural elements, and future directions. Future Gener. Comput. Syst. 2013, 29, 1645–1660. [Google Scholar] [CrossRef]
- Sánchez, L.; Elicegui, I.; Cuesta, J.; Muñoz, L.; Lanza, J. Integration of utilities infrastructures in a future internet enabled smart city framework. Sensors 2013, 13, 14438–14465. [Google Scholar] [CrossRef] [PubMed]
- ZigBee Alliance. Available online: http://www.zigbee.org/ (accessed on 31 May 2017).
- Baronti, P.; Pillai, P.; Chook, V.W.C.; Chessa, S.; Gotta, A.; Hu, Y.F. Wireless sensor networks: A survey on the state of the art and the 802.15.4 and ZigBee standards. Comput. Commun. 2007, 30, 1655–1695. [Google Scholar] [CrossRef]
- Navanth Duche, R.; Sarwade, N.P. Sensor Node Failure Detection Based on Round Trip Delay and Paths in WSNs. IEEE Sens. J. 2014, 14, 455–464. [Google Scholar] [CrossRef]
- Chelli, K. Security issues in wireless sensor networks: Attacks and countermesures. In Proceedings of the World Congress on Engineering 2015 Vol I (WCE 2015), London, UK, 1–3 July 2015; Ao, S.I., Gelman, L., Hukins, D.W.L., Hunter, A., Korsunsky, A.M., Eds.; Newswood Limited: Hong Kong, China, 2015; pp. 519–524. [Google Scholar]
- Singh, K.J.; Kapoor, D.S. Create your own internet of things: A survey of IoT platforms. IEEE Consum. Electron. Mag. 2017, 6, 57–68. [Google Scholar] [CrossRef]
- Maureira, M.A.G.; Teernstra, L.; Teernstra, L. ThingSpeak—An API and web service for the internet of things. World Wide Web, 1915. Available online: http://mediatechnology.leiden.edu/images/uploads/docs/wt2014_thingspeak.pdf (accessed on 31 May 2017).
- Palma, D.; Agudo, J.E.; Sánchez, H.; Macías, M.M. An internet of things example: Classrooms access control over near field communication. Sensors 2014, 14, 6998–7012. [Google Scholar] [CrossRef] [PubMed]
- Google Maps. Available online: https://maps.google.es/ (accessed on 31 May 2017).
- Danieletto, M.; Bui, N.; Zorzi, M. RAZOR: A Compression and classification solution for the internet of things. Sensors 2014, 14, 68–94. [Google Scholar] [CrossRef] [PubMed]
- Nachabe, L.; Girod-Genet, M.; ElHassan, B. Unified data model for wireless sensor network MyOntoSens Ontology. IEEE Sens. J. 2015, 15, 3657–3667. [Google Scholar] [CrossRef]
Figure 1.
Interactions in the Internet of Things [9] (http://www.buildinginternetofthings.com). Reproduced with permission with [9]. Createspace Independent Publishing Platform, 2012.
Figure 1.
Interactions in the Internet of Things [9] (http://www.buildinginternetofthings.com). Reproduced with permission with [9]. Createspace Independent Publishing Platform, 2012.

Figure 2.
SmartResidents Architecture.
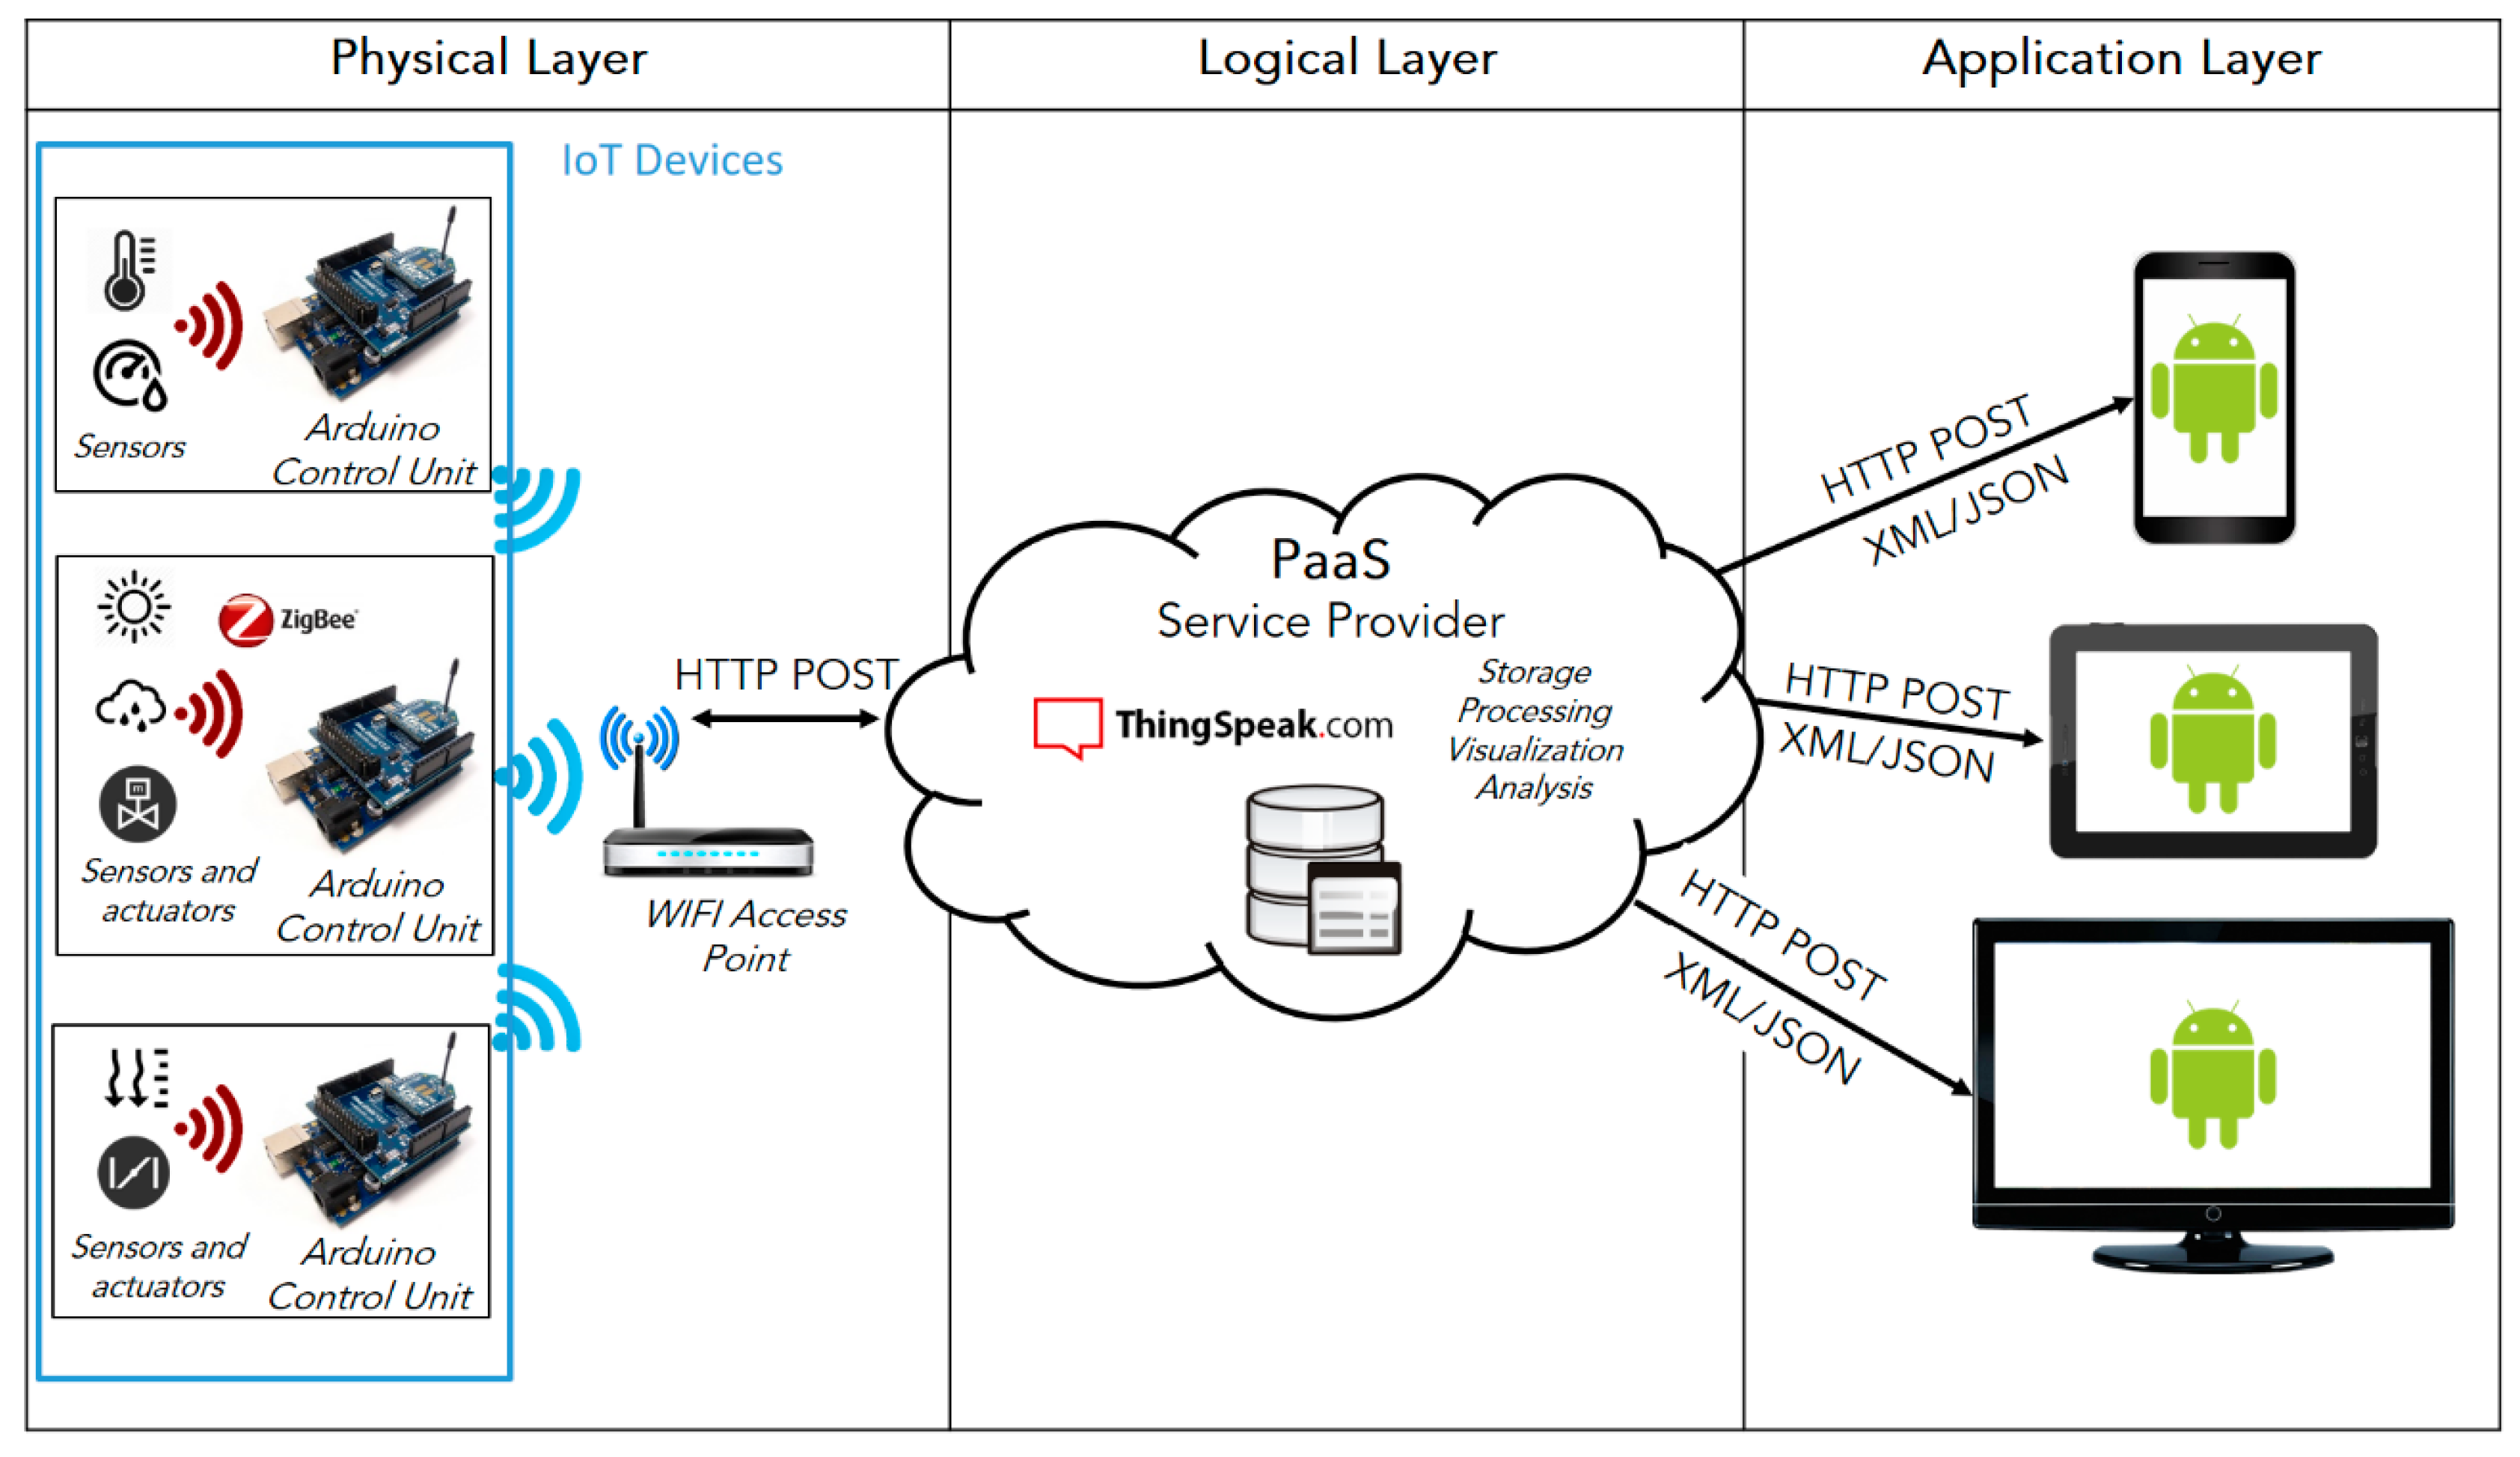
Figure 3.
Interaction between SmartResidents actors.
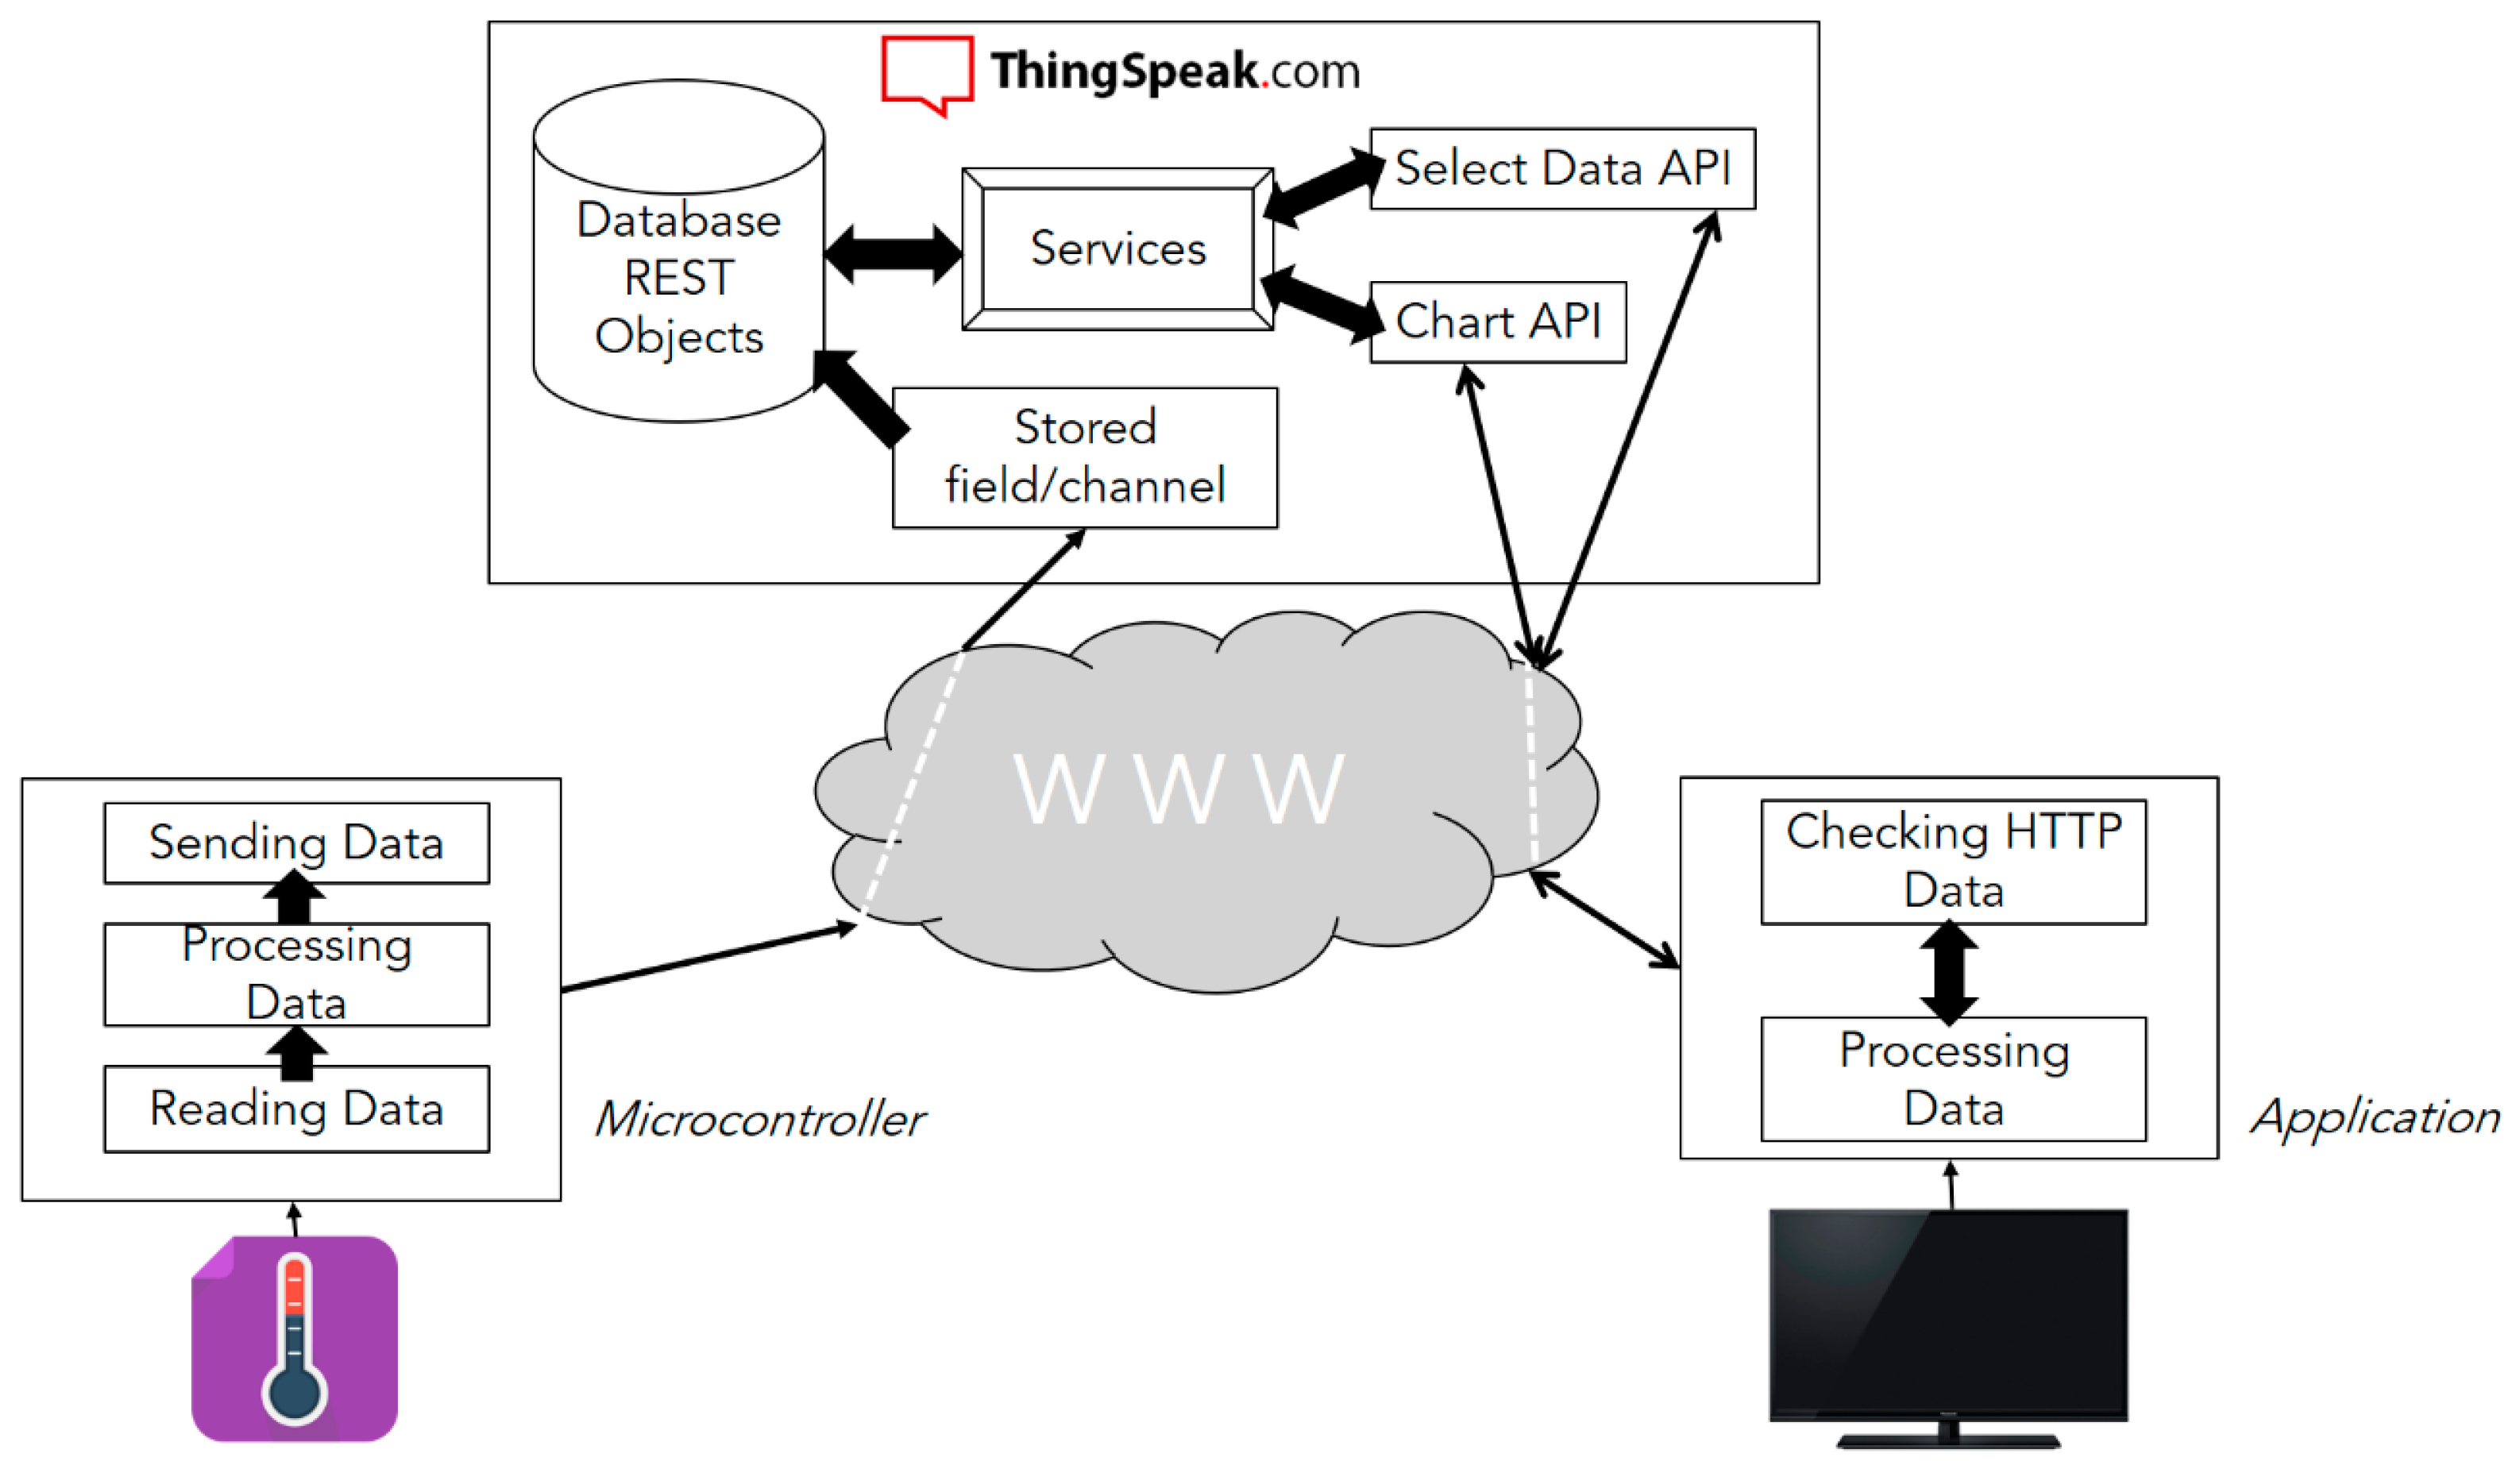
Figure 4.
Groove system sensors.
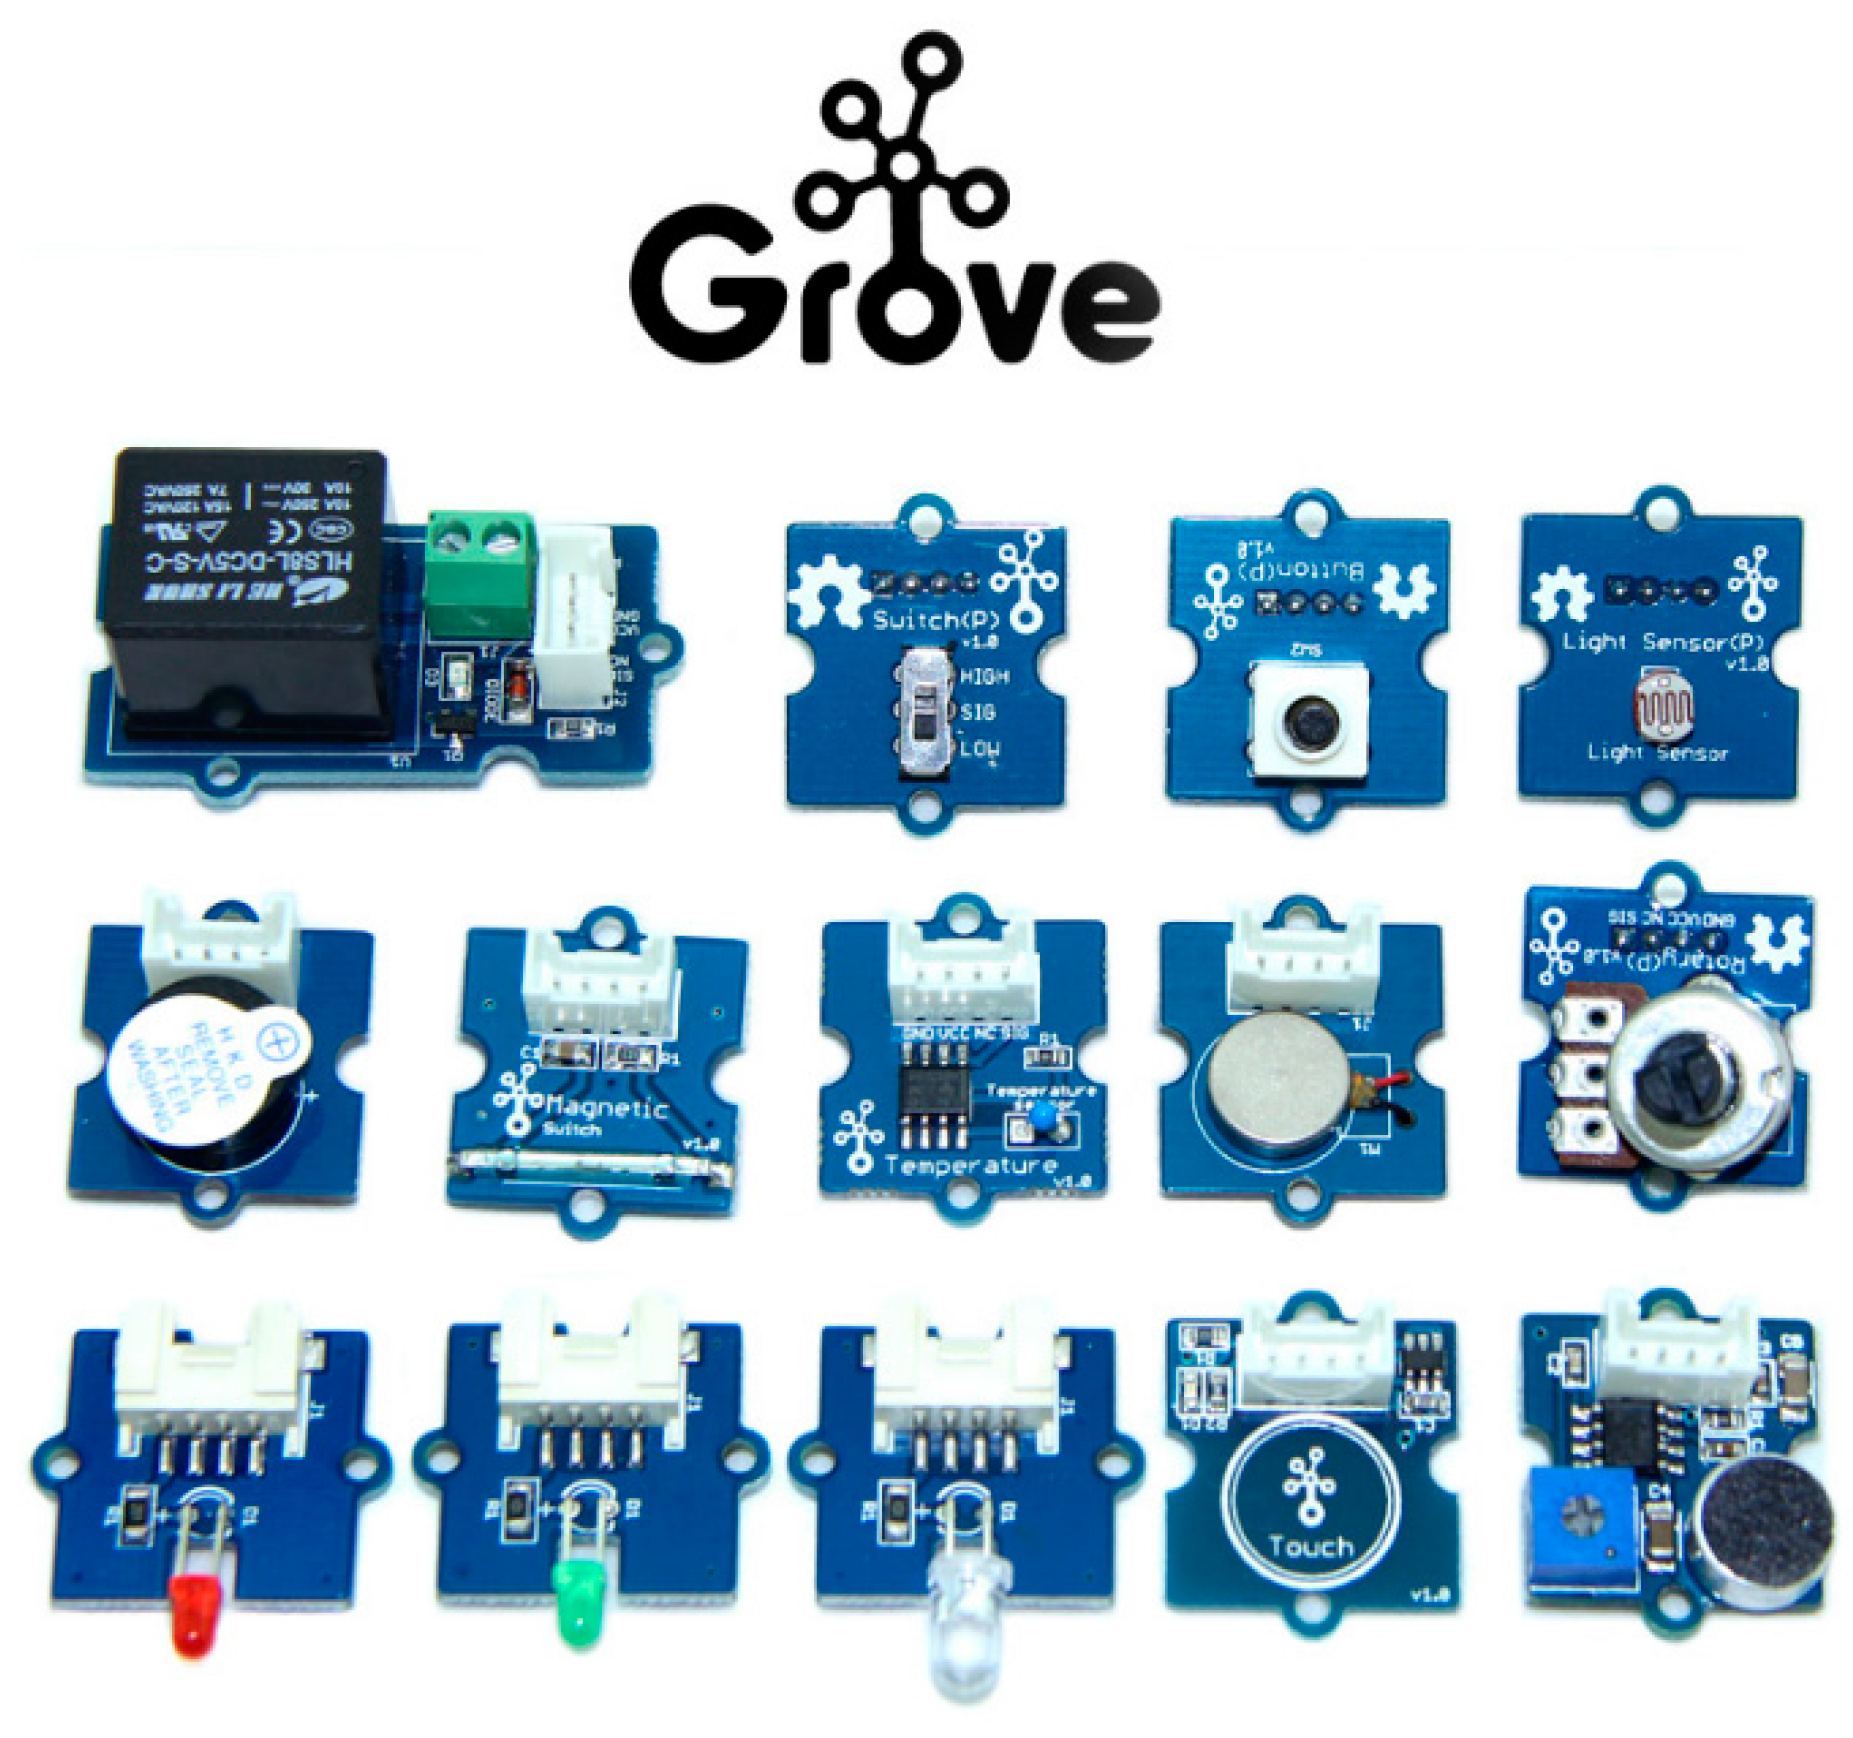
Figure 5.
Location of sensors and microcontrollers in SmartResidents.

Figure 6.
Logic layer update from Arduino (Rain sensor).

Figure 7.
SmartResidents interface.
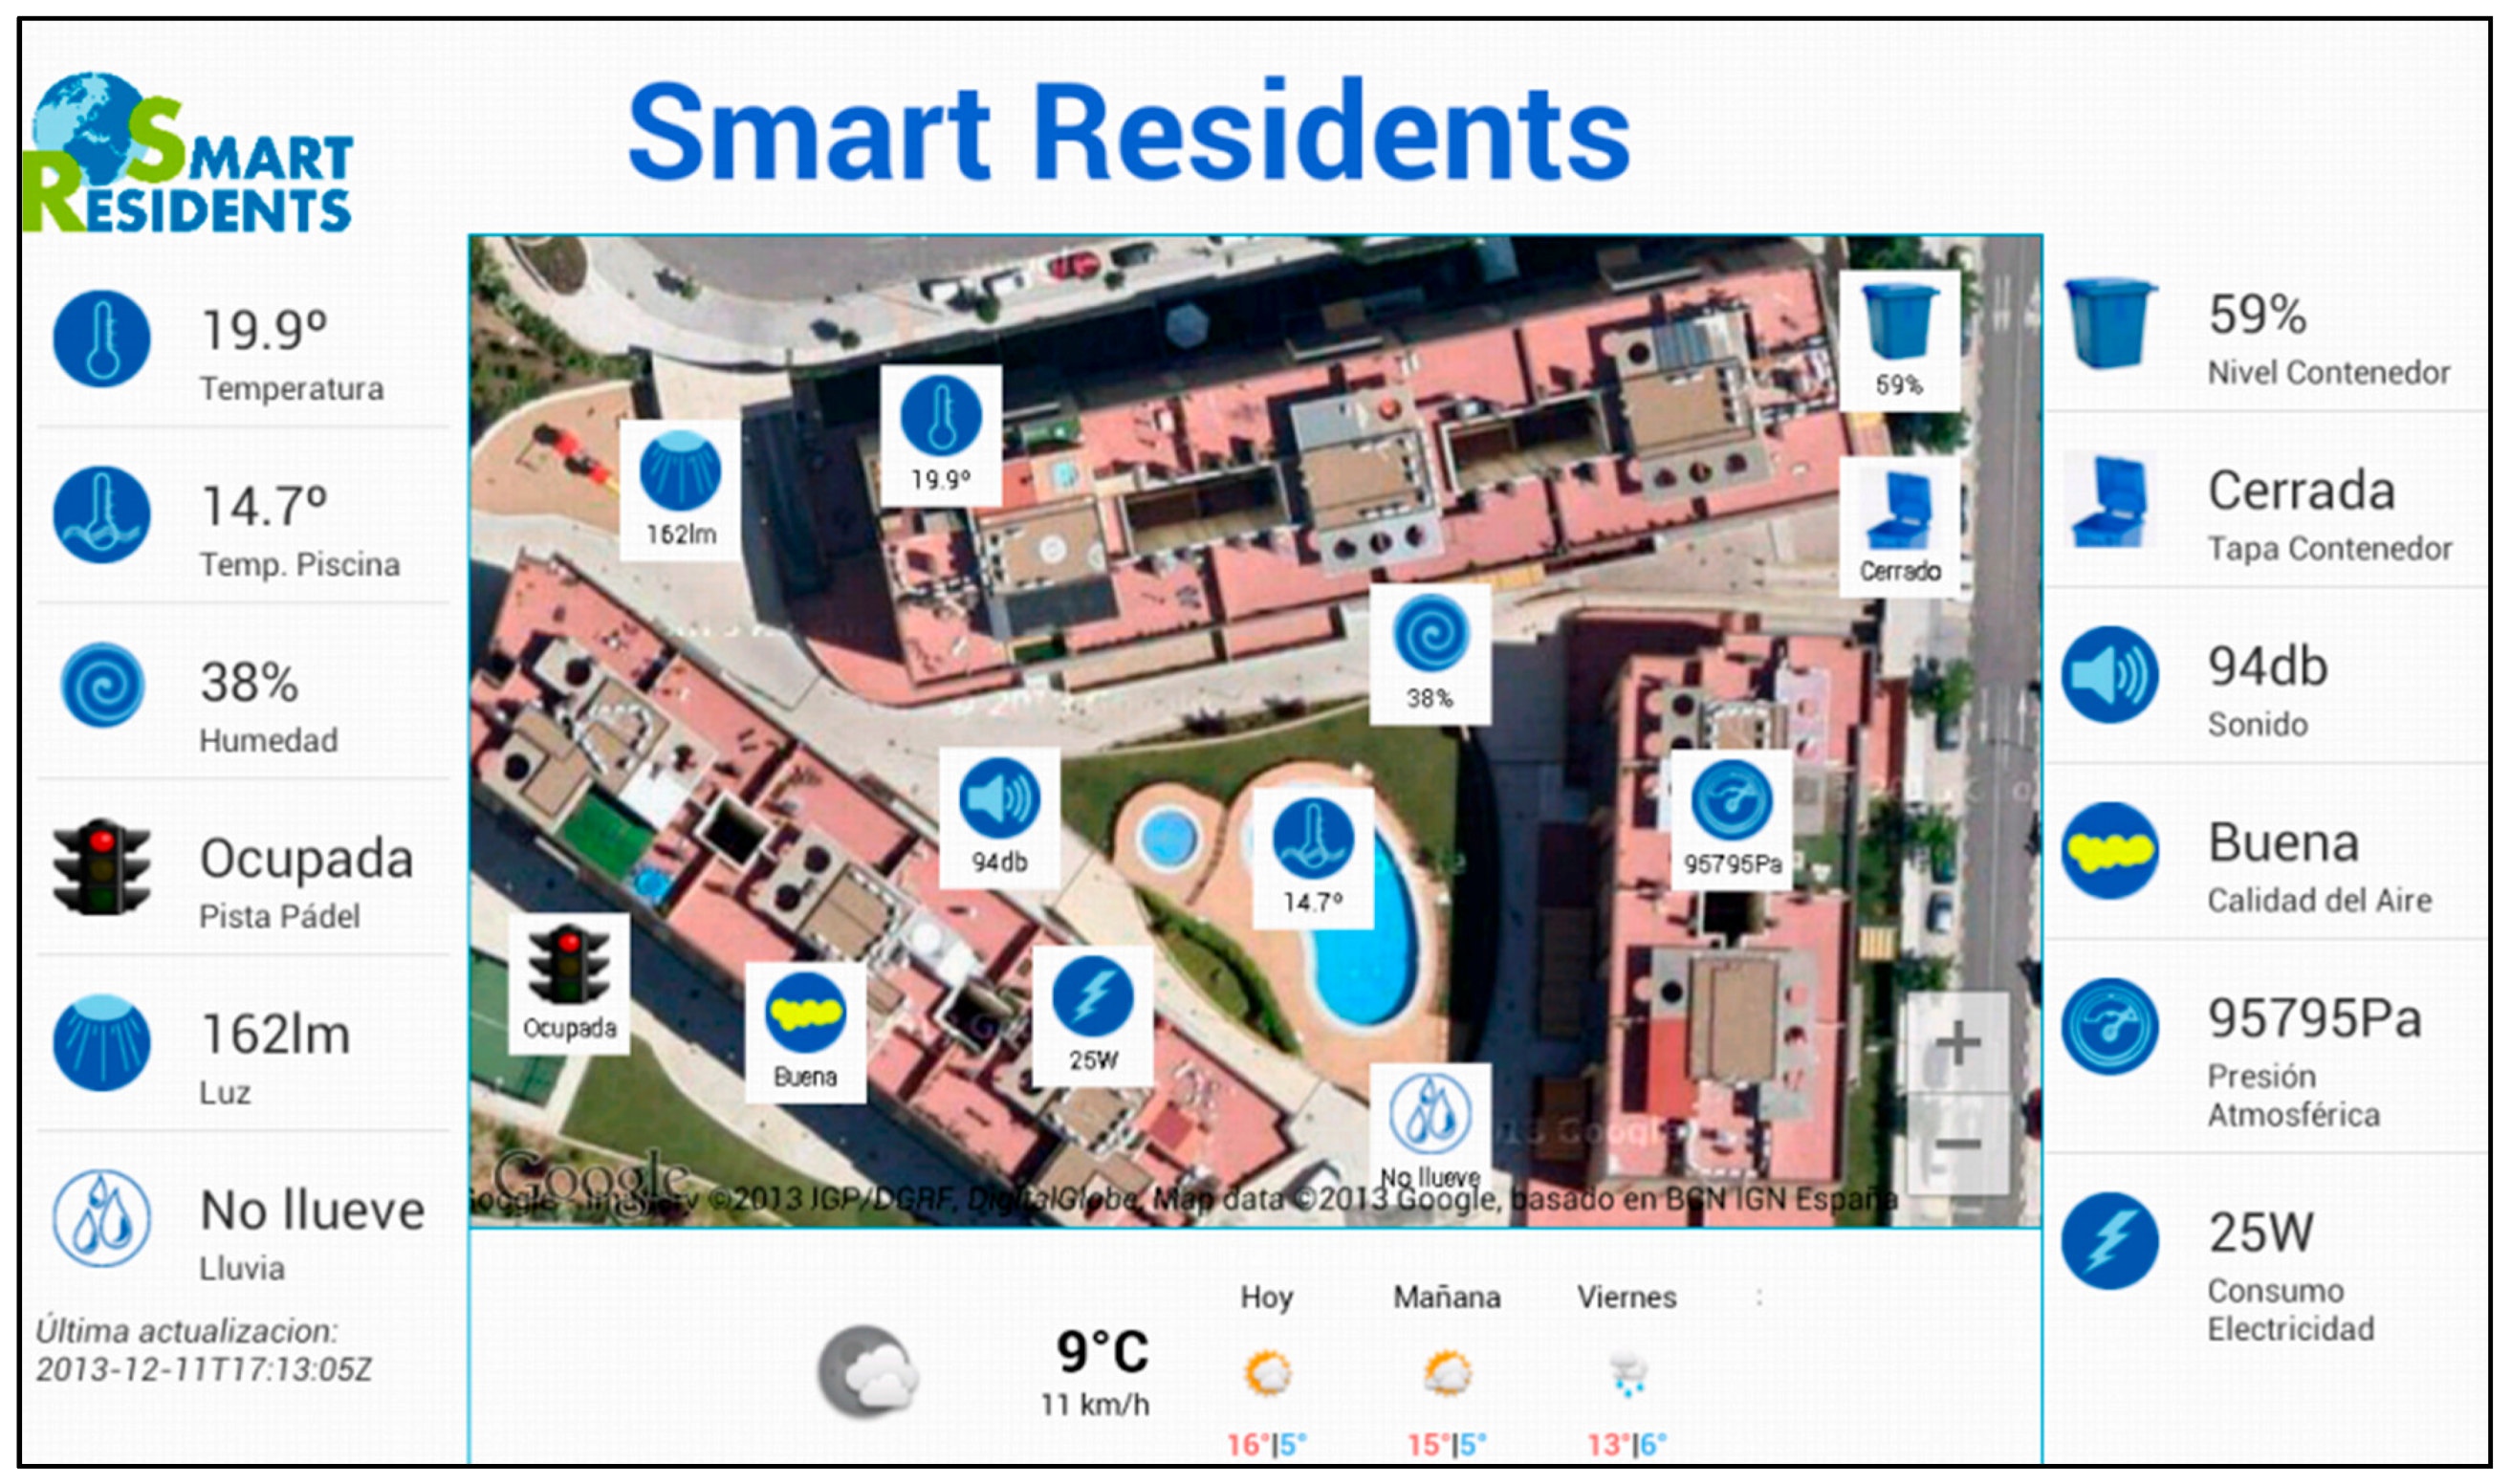
Figure 8.
SmartResidents interface for a specific sensor (Temperature).

Figure 9.
Temperature change graph.

Figure 10.
JSON data to graph Figure 9.
Figure 10.
JSON data to graph Figure 9.


Table 1.
Sensors used.
| Sensor | Magnitude | Type |
|---|---|---|
| Ambient temperature | °C | Analogue |
| Water temperature | °C | Analogue |
| Rain | Yes/No | Digital |
| Humidity | % | Analogue |
| Light | Lm | Analogue |
| Ultrasound | Cm | Analogue |
| Movement | Yes/No | Digital |
| Sound | Db | Analogue |
| Atmospheric pressure | Pa | Analogue |
| Electricity usage | W | Analogue |
| Air quality | level | Analogue |
| Smoke | level | Analogue |
Table 2.
Channels-fields association in ThingSpeak.
| Channel | Field | Sensor |
|---|---|---|
| SmartResident_CH1 | ||
| Field1 | Temperature | |
| Field2 | Air quality | |
| Field3 | Rain | |
| Field4 | Humidity | |
| Field5 | Movement | |
| Field6 | Water temperature | |
| SmartResident_CH2 | ||
| Field1 | Rubbish container level | |
| Field2 | Rubbish container cap | |
| Field3 | Electricity usage | |
| Field4 | Sound | |
| Field5 | Smoke | |
| Field6 | Atmospheric pressure | |
© 2017 by the authors. Licensee MDPI, Basel, Switzerland. This article is an open access article distributed under the terms and conditions of the Creative Commons Attribution (CC BY) license (http://creativecommons.org/licenses/by/4.0/).
Share and Cite
MDPI and ACS Style
Sánchez, H.; González-Contreras, C.; Agudo, J.E.; Macías, M. IoT and iTV for Interconnection, Monitoring, and Automation of Common Areas of Residents. Appl. Sci. 2017, 7, 696. https://doi.org/10.3390/app7070696
AMA Style
Sánchez H, González-Contreras C, Agudo JE, Macías M. IoT and iTV for Interconnection, Monitoring, and Automation of Common Areas of Residents. Applied Sciences. 2017; 7(7):696. https://doi.org/10.3390/app7070696
Chicago/Turabian StyleSánchez, Héctor, Carlos González-Contreras, J. Enrique Agudo, and Miguel Macías. 2017. "IoT and iTV for Interconnection, Monitoring, and Automation of Common Areas of Residents" Applied Sciences 7, no. 7: 696. https://doi.org/10.3390/app7070696
Note that from the first issue of 2016, this journal uses article numbers instead of page numbers. See further details here.