Experimental Study on the Physical Simulation of Water Invasion in Carbonate Gas Reservoirs
by
Feifei Fang
1,2, 
Weijun Shen
1,3,*,
Shusheng Gao
2,4,
Huaxun Liu
2,4,
Qingfu Wang
3 and
Yang Li
4 1
School of Engineering Science, University of Chinese Academy of Sciences, Beijing 100049, China
2
Institute of Porous Flow and Fluid Mechanics, Chinese Academy of Sciences, Langfang 065007, Hebei, China
3
Institute of Mechanics, Chinese Academy of Sciences, Beijing 100190, China
4
PetroChina Research Institute of Petroleum Exploration and Development, Beijing 100083, China
*
Author to whom correspondence should be addressed.
Appl. Sci. 2017, 7(7), 697; https://doi.org/10.3390/app7070697
Submission received: 6 June 2017
/
Revised: 27 June 2017
/
Accepted: 29 June 2017
/
Published: 7 July 2017
(This article belongs to the Special Issue Clean Energy and Fuel (Hydrogen) Storage)
Abstract
:Water invasion in carbonate gas reservoirs often results in excessive water production, which limits the economic life of gas wells. This is influenced by reservoir properties and production parameters, such as aquifer, fracture, permeability and production rate. In this study, seven full diameter core samples with dissolved pores and fractures were designed and an experimental system of water invasion in gas reservoirs with edge and bottom aquifers was established to simulate the process of water invasion. Then the effects of the related reservoir properties and production parameters were investigated. The results show that the edge and bottom aquifers supply the energy for gas reservoirs with dissolved pores, which delays the decline of bottom-hole pressure. The high water aquifer defers the decline of water invasion in the early stage while the big gas production rate accelerates water influx in gas reservoirs. The existence of fractures increases the discharge area of gas reservoirs and the small water influx can result in a substantial decline in recovery factor. With the increase of permeability, gas production rate has less influence on recovery factor. These results can provide insights into a better understanding of water invasion and the effects of reservoir properties and production parameters so as to optimize the production in carbonate gas reservoirs.
1. Introduction
The production of water from gas producing wells is a common occurrence in gas fields. It is attributed to one or more of several reasons such as normal rise of gas-water contact, water coning or water fingering [1,2,3,4]. Water coning occurs in gas reservoirs with the edge-and-bottom aquifer drive, and water will flow into the wellbore from below and above of the perforations and consequently interfere with gas production [5]. Water coning is a common problem which increases the cost of producing operations and raises some environmental problems related to water disposal, and reduces the efficiency of the depletion mechanism and the overall recovery [6]. Thus, understanding the questions such as water invasion in gas reservoirs and its effects on recovery factor is significant for predicting gas productivity and optimizing extraction conditions.
Water invasion is a complex phenomenon observed in oil and gas reservoirs, which will occur due to pressure gradients close to the production well and the imbalance between the viscous and gravity forces around the completion interval [7,8]. There are three essential forces controlling the mechanism, which includes the capillary, viscous and gravity forces [6]. With the change of pressure drawdown, the viscous force pushes the gas phase into the production well, and the lift up of the gas-water interface will be caused by the dynamic pressure distribution near the production well [6,9,10,11]. In contrast, the gravity force will cause water to remain in the gas saturated resign of the reservoirs. When the dynamic force at the wellbore exceeds the gravity force, the pressure gradient will cause the local gas-water contact to rise upward, which will contribute to water invasion and interfere with gas production.
Some studies on water invasion in gas reservoirs and its impact on gas productivity have been considered in the past. Muskat and Wycokoff [12] studied the water coning phenomenon and demonstrated clearly that water coning would occur at high pressure drop. Hoyland [13] pointed out that the gravity force was dominant at initial reservoir conditions, and the viscous force would arise to part of the controlling mechanism when the pressure drawdown increased. Saad et al. [14] and Bahrami et al. [15] analyzed the problem of water coning in naturally fractured reservoirs using experimental work and field data, respectively. Cheng et al. [16] and Shen et al. [4] performed the effects of the reservoir properties on water coning with the numerical simulation. Hu et al. [17] and Xiong et al. [18] established a mathematical model to predict water properties and the performance of water invasion with the data of gas and water production. Perez et al. [19] used a coning radial model to evaluate the occurrence of coning in naturally fractured reservoirs. Hu et al. [20] and Shen et al. [21] used reservoir cores to analyze the effects of different aquifers on water invasion. Azim [7] proposed a fully coupled poroelastic multiphase fluidflow numerical model to understand the water coning phenomenon in naturally fractured reservoir under the effects of various rock and fluid properties. So far there has been a lot of research work carried out on the performance of water invasion in gas reservoirs. However, water invasion of gas reservoirs is not fully understood and many uncertainties still exist in the process. Hence, there is a necessity to understand water invasion and the effects of these reservoir and production parameters on the problem so as to optimize gas productivity in gas reservoirs.
In this study, the experimental system of water invasion in gas reservoirs with the edge-and-bottom aquifer was established, and the elastic expansion of water and gas was considered. Seven full diameter core samples with dissolved pores and fractures were designed and the physical simulations of water invasion in carbonate gas reservoirs were conducted. Then the effects of the related reservoir properties and production parameters, such as water invasion energy, aquifer, production rate, permeability and fracture, were studied and discussed. These results can provide a better understanding of water invasion for improving the gas recovery and development benefit in carbonate gas reservoirs.
2. Experimental Systems and Methods
2.1. Experimental Systems
In the physical simulation of water invasion in gas reservoirs, previous studies only considered the elastic expansion of formation water when simulating the edge-and-bottom aquifer [20,21]. However, the compressibility of formation water is between 3.4 × 10⁻⁴ and 5.0 × 10⁻⁴ MPa−1 in gas reservoirs with the finite edge-and-bottom aquifer [22]. Thus, the elastic expansion capacity of an aquifer is very weak and the aquifer expansion caused by the formation pressure drop is small. For example, when the pressure drop of formation water is 50 MPa, the aquifer expansion only accounts for about 2% of aquifer reserves. That is why water coning will occur at 20 times, 100 times and even infinite aquifer considering the aquifer expansion [21]. Therefore, there will be a false understanding that water coning will occur in strong aquifers if water invasion only considers the elastic expansion capacity of an aquifer, but this contradicts that water invasion in some gas reservoirs takes place without a strong aquifer.
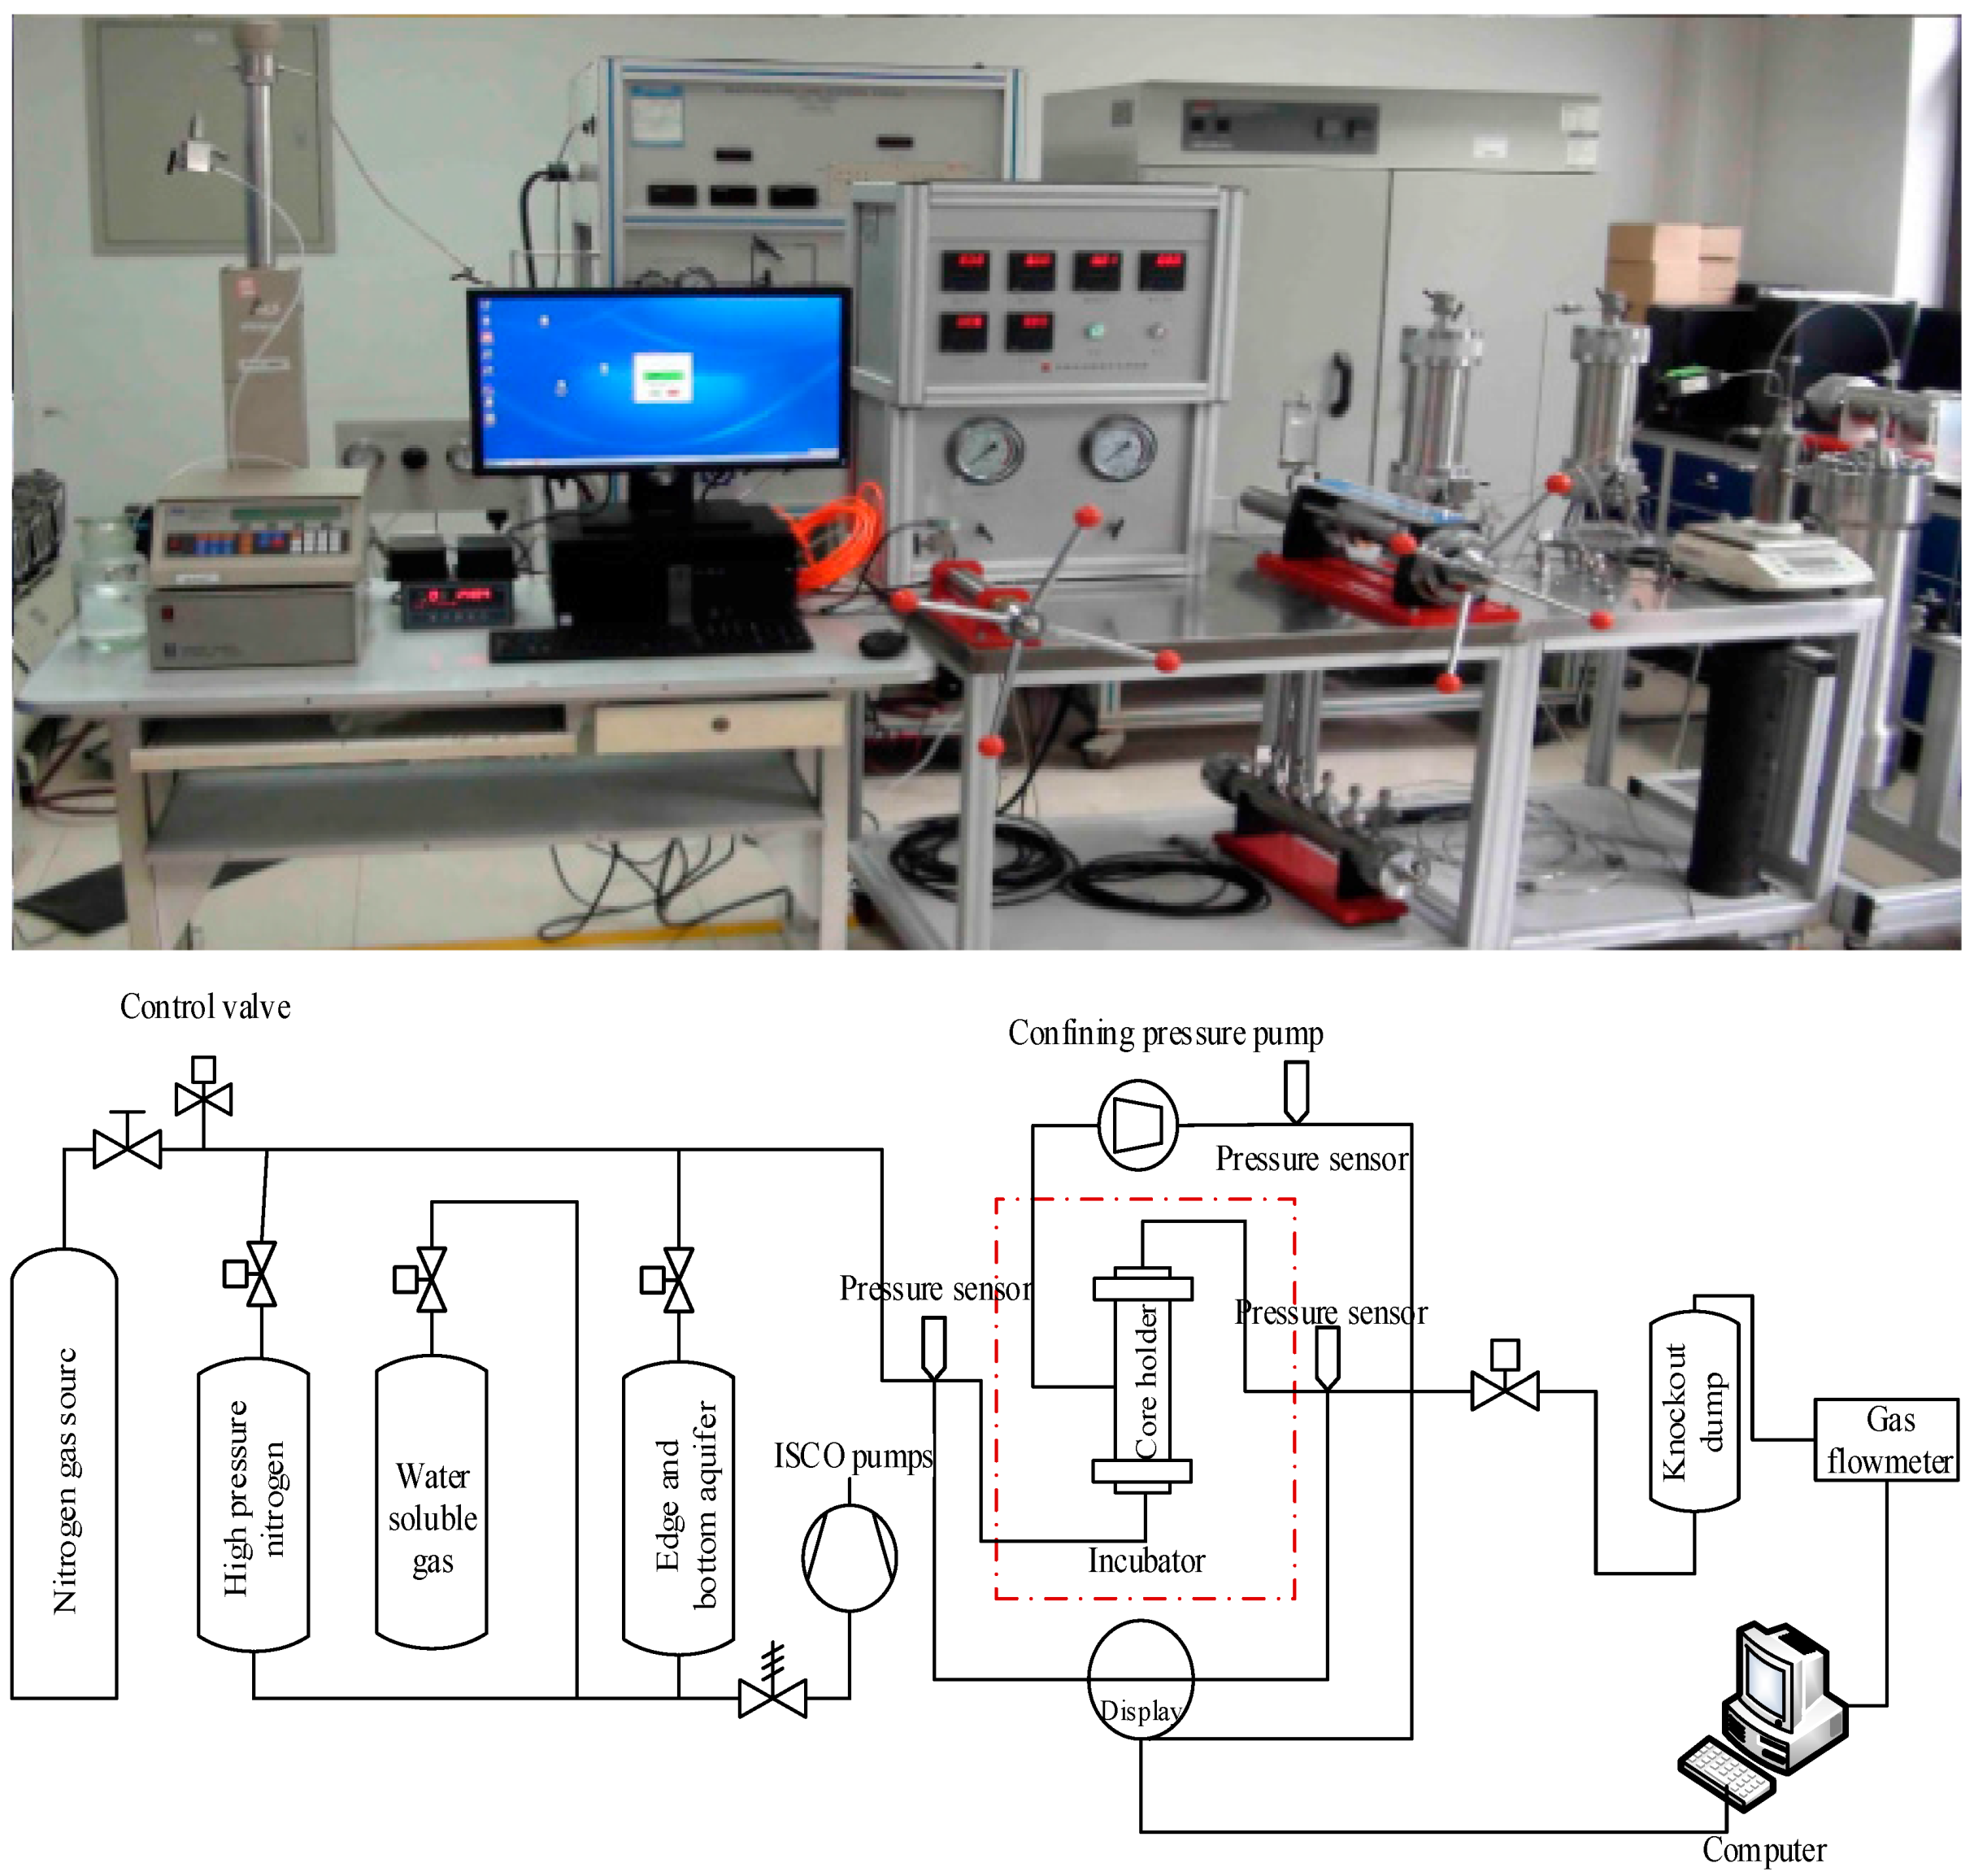
In order to simulate water invasion of gas reservoirs with the edge-and-bottom aquifer accurately, the energy source of water invasion is not just the elastic expansion of aquifer, and the effects of rock pore compression and water soluble gas expansion should be considered. The solubility of natural gas in water is mainly affected by formation pressure, temperature, and the salinity of formation water [23,24]. With the increasing of formation pressure and temperature, the gas solubility in water rises gradually. The solubility declines gradually with the increasing of water salinity. According to the previous studies [23], there is a gas reservoir with origin formation temperature of 150 °C, formation pressure of 60 MPa, and water salinity of 19,029 mg/L. When the aquifer is 5 times and pressure drawdown is 40 MPa, the limit adsorption of natural gas in formation water is about 3.7% of reservoir reserves. However, when reservoir pressure declines to 40 MPa in the development of gas reservoirs, the overall pressure drop of formation water is much less than 40 MPa. Therefore, the desorption of water soluble gas can be negligible in contrast to reservoir reserves. As it is very difficult to dissolve gas in water completely, the experiment only considers the elastic expansion energy of water soluble gas, which ignores the desorption effect due to pressure drop. The experimental system of water invasion in gas reservoirs with edge and bottom aquifer was shown in Figure 1, which was composed of nitrogen gas source, ISCO pump, confining pressure pump, core holder, pressure sensor, gas flowmeter and data acquisition system, etc.
2.2. Experimental Methods
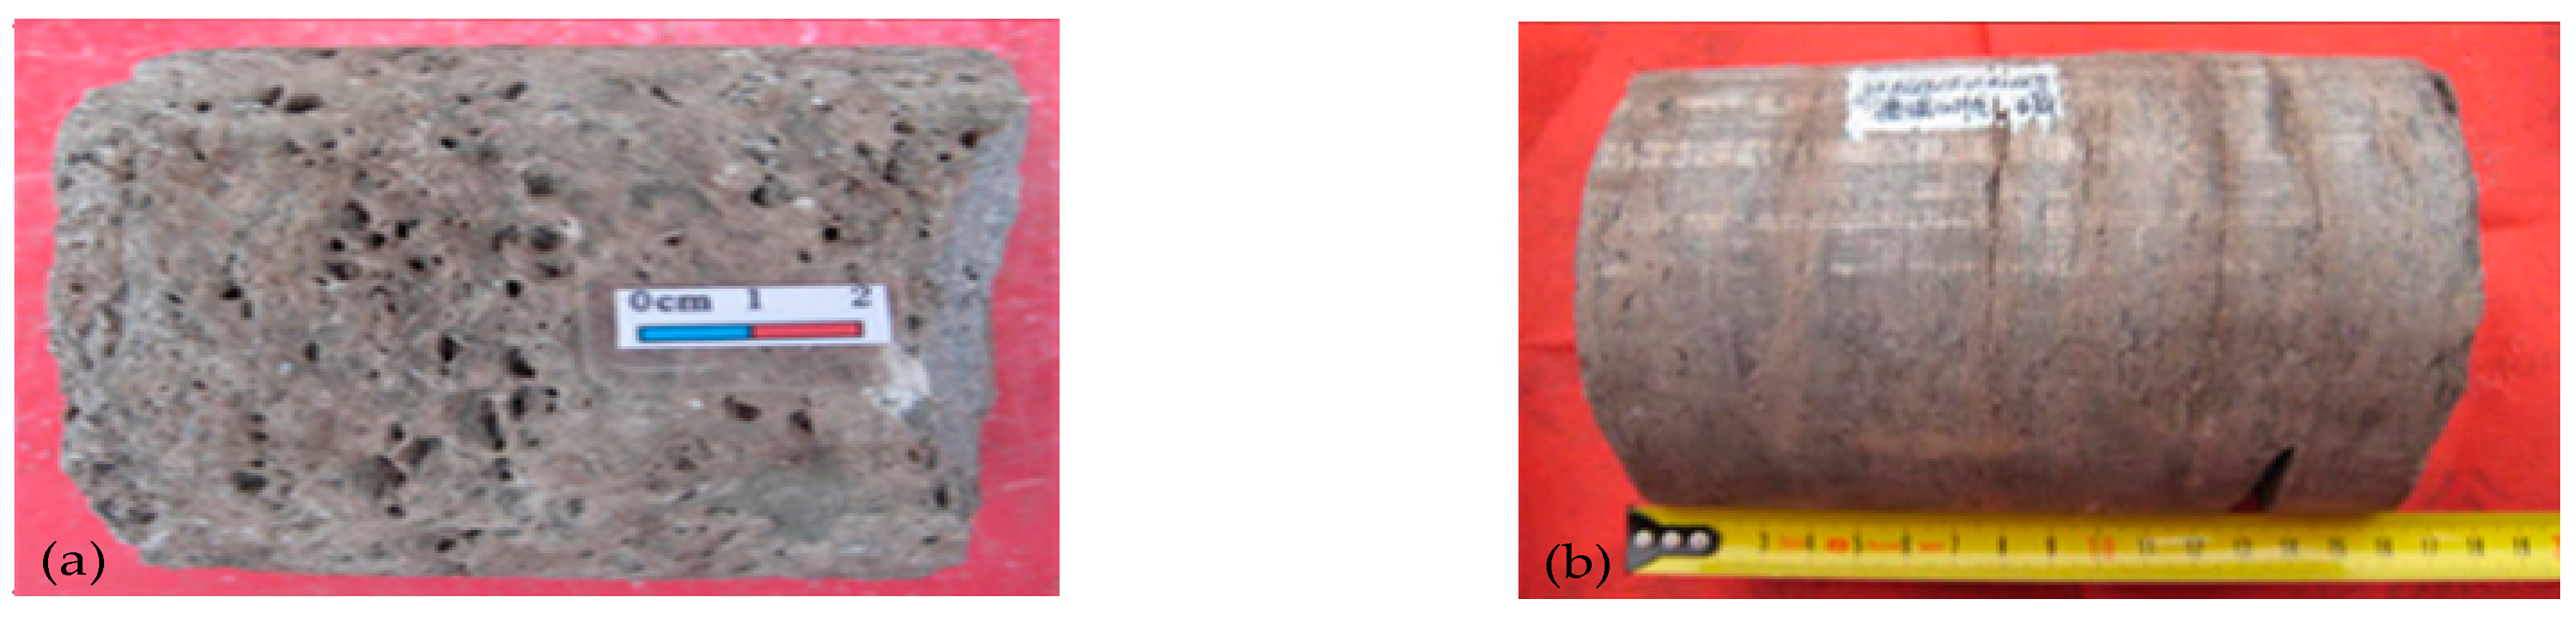
Experimental core samples were obtained from carbonate gas reservoirs of Anyue gas field, which is located in Sichuan Province, China [25,26]. The reservoirs are characterized by strong heterogeneity, including dissolved vugs, pores and fractures, which are shown in Figure 2a,b, respectively. The core samples from NO. 1 to NO. 5 were dissolved pores while the sample NO. 6 and NO. 7 cores contained micro and macro fractures, respectively. The properties of carbonate core samples used in the study were summarized in Table 1. During the experiment, the edge-and-bottom aquifer (formation water) was 8.0 × 10⁴ mg/L and the nitrogen gas source was 99.99% of purity. According to the experimental process, the experimental system was connected and the device tightness was checked. Then a confining pressure of 40 MPa was added to the experimental core, and a nitrogen of 30 MPa was saturated to the experimental core. Meanwhile, the experimental system of water invasion was synchronized to 30 MPa, which was the same as the reservoir pressure. Then the gas flowmeter was opened to simulate the production of gas reservoirs, and the pressure, flowrate and time was recorded until the abandonment pressure reached 3 MPa. Finally, the above experimental procedures were repeated after changing core samples, and the physical simulations with different water invasion energies, aquifers, production rates, permeabilities, fractures were conducted successively. The experiments of water invasion conducted on different conditions were summarized in Table 2.
3. Results and Discussion
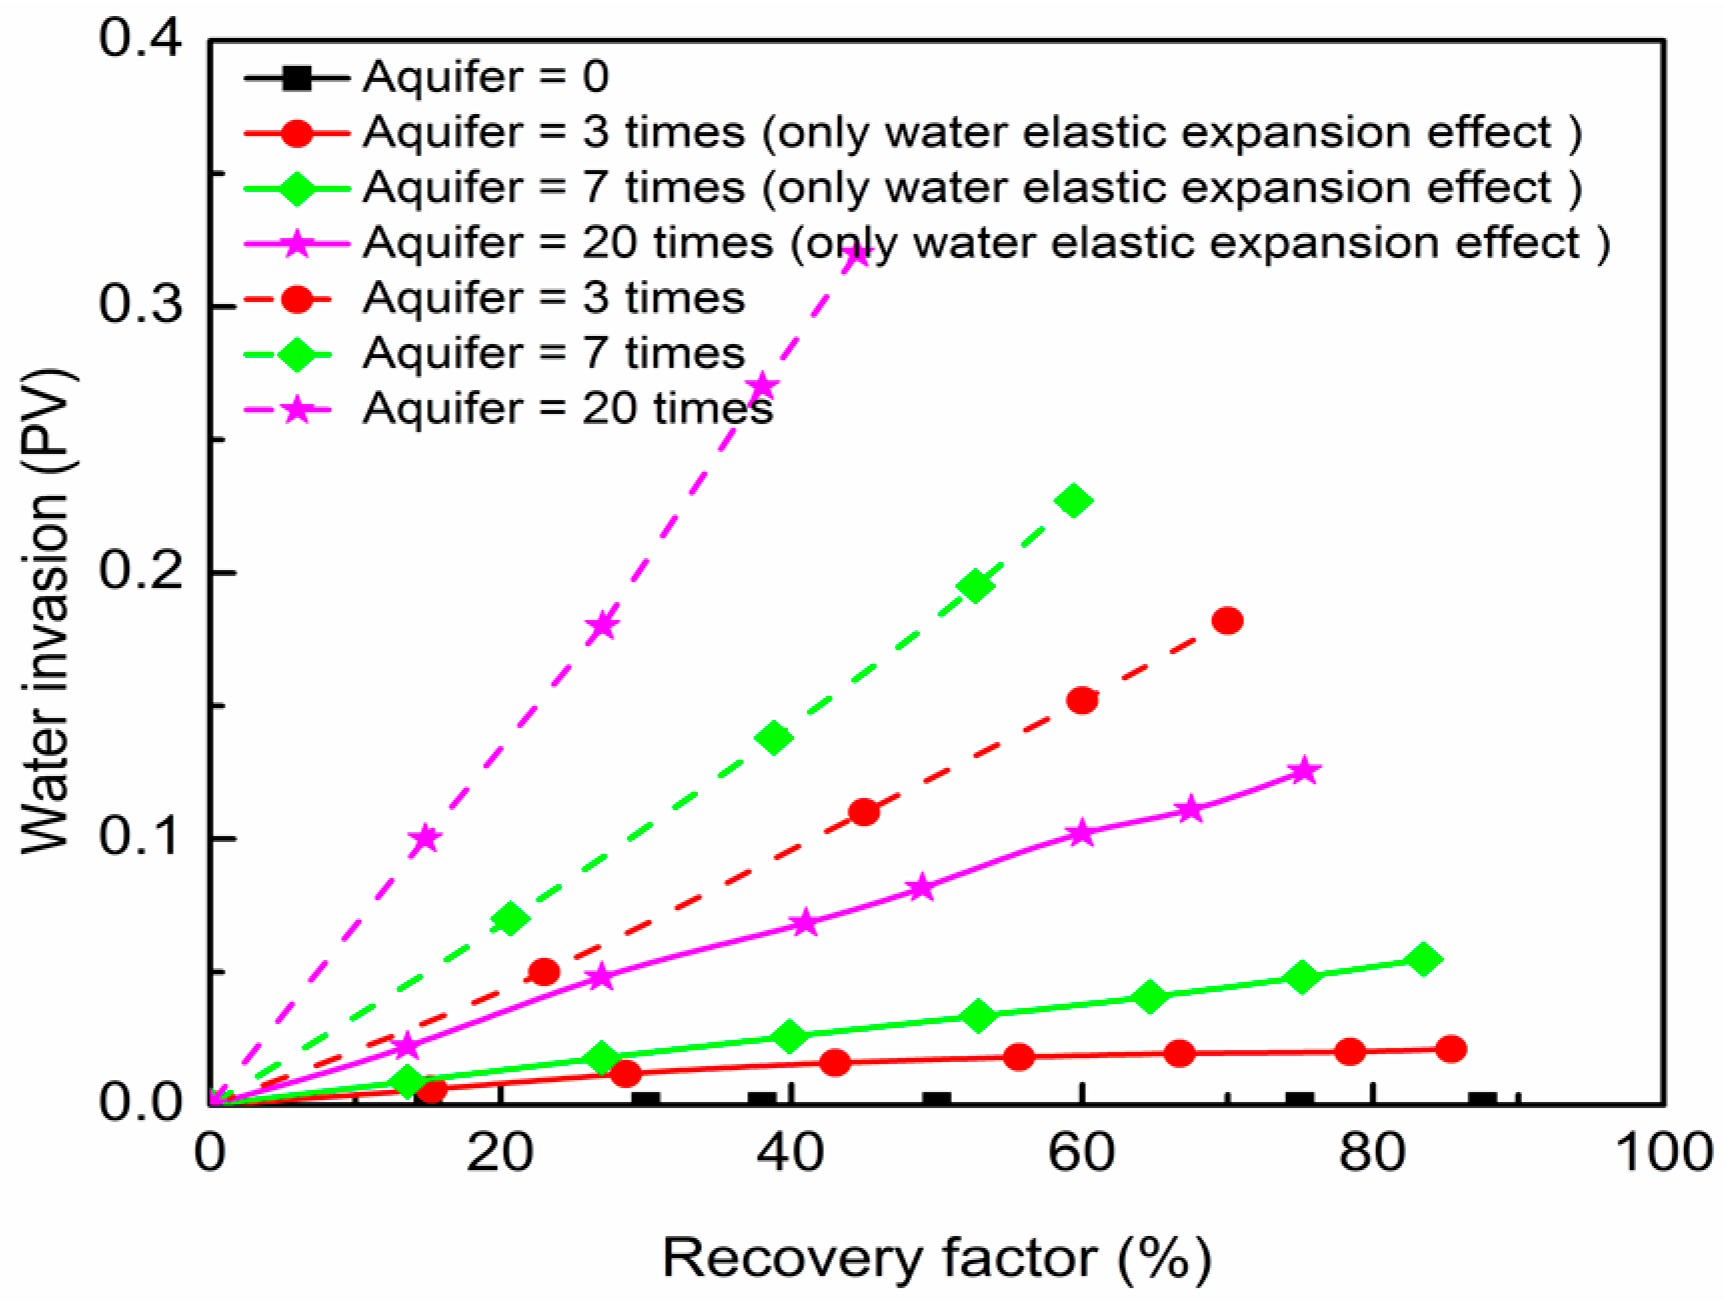
3.1. Effect of Different Water Invasion Energies
Water supplies an extra mechanism to produce gas reservoirs, and it is important to understand the effects of water energies [22,23]. The core 4 is chosen to study the effects of different water invasion energies. The gas production rate and original saturation pressure are 1000 mL/min and 30 MPa, respectively. The experiments to understand water invasion are conducted when only considering the water elastic expansion effect, comprehensively water flexibility and elastic expansion of water soluble gas. The water invasion versus gas recovery in different water invasion energies is shown in Figure 3. From the result of Figure 3, we can see that water invasion with 3 times and 7 times aquifer are 0.021 PV and 0.055 PV when water invasion energy only considers the effect of water expansion. They are far less than water invasion considering water elastic expansion and elastic expansion of water soluble gas, which are 0.182 PV and 0.227 PV, respectively. The water invasion is very small with considering water elastic expansion whether it is 3 times or 7 times aquifer. The decline range of recovery factor is less than 5.0% compared with no aquifer. When the aquifer is 20 times, the dramatic phenomenon of water invasion occurs [21]. While comprehensively considering water invasion energies, the water invasion of 3 times aquifer is 0.182 PV and the recovery factor decreases by 17.6%, which has a strong influence on gas production. Therefore, during the simulation of water invasion we should not only consider the elastic expansion of water, but also consider the elastic expansion of water soluble gas.
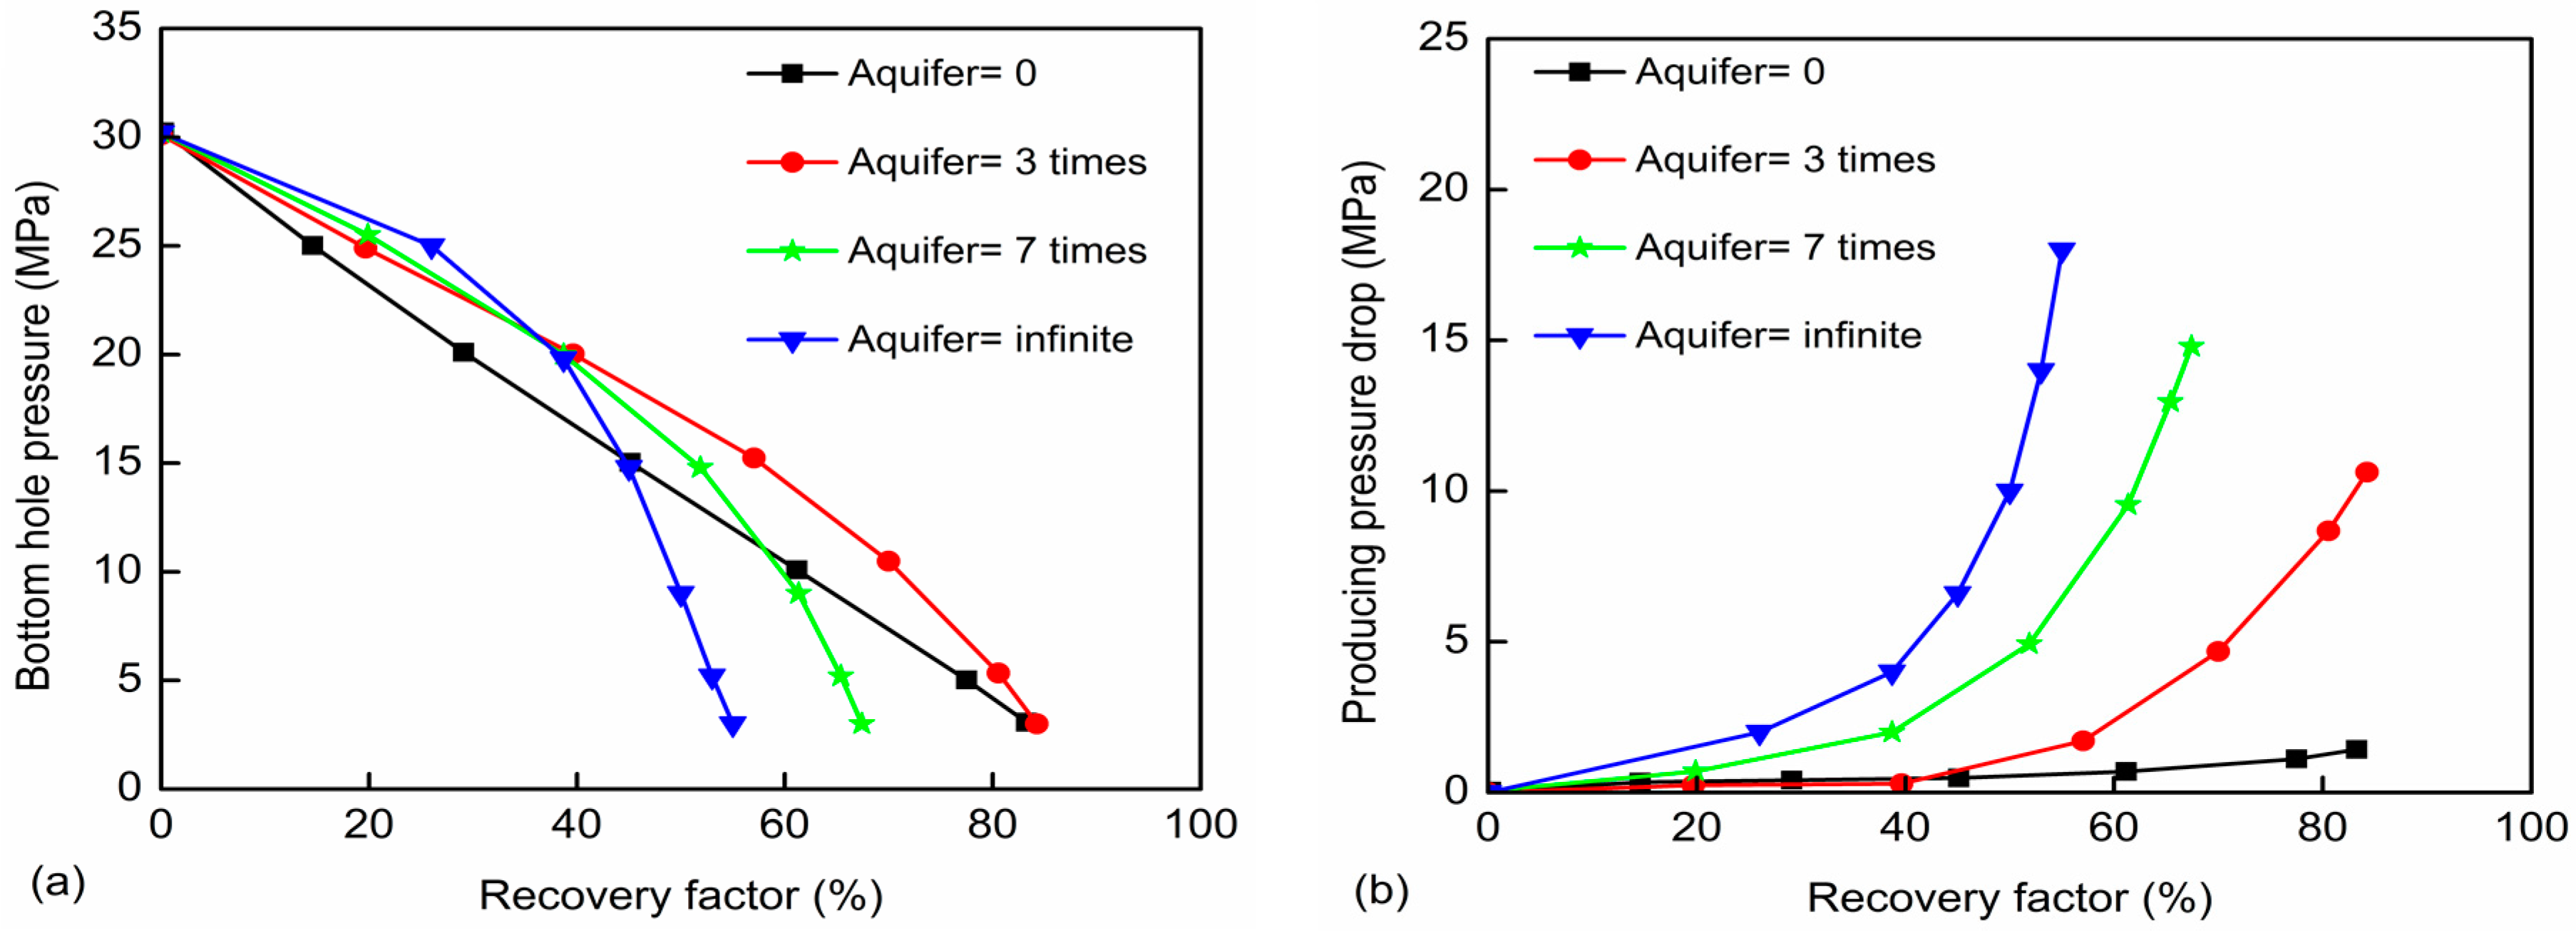
3.2. Effect of Different Aquifer Sizes
Nearly all gas reservoirs are surrounded by water-bearing rocks called aquifers [11]. The aquifer size has an important effect on water invasion and gas production in gas reservoirs [6,10]. The core 3 is used to study the effects of water invasion with different aquifer sizes. The gas production rate and original saturation pressure are 1000 mL/min and 30 MPa, respectively. The experiments of water invasion without aquifer and with 3 times, 7 times and infinite aquifer are performed, and the results are illustrated in Figure 4. From the result of the Figure 4a, it can be observed that the bottom-hole pressure decreases linearly with recovery factor when there is no aquifer. The pressure drop increases gradually with the increase of recovery factor, but the pressure drop is only 1.43 MPa until the production ends, shown in Figure 4b. This suggests that gas seepage resistance is very small without the edge-and-bottom aquifer and the recovery factor is high which can reach 83.26%.
When there exists the edge-and-bottom aquifer, bottom-hole pressure changes with the increase of recovery factor, and there is a concave change in Figure 4a. This is because the early water invasion delays the decline of bottom-hole pressure. At the same recovery factor, the larger the aquifer is, the larger the bottom-hole pressure is. This shows that the early water invasion with the edge-and-bottom aquifer is the gas supply of energy, and the larger the aquifer is, the greater the energy supply is. In the late water invasion, the seepage resistance increases and bottom-hole pressure drops rapidly due to the existence of two phase flow. Thus, in the production and development of gas reservoirs, we can reversely infer the strength of edge-and-bottom aquifer according to the change of bottom-hole pressure so as to prevent the risk of water invasion. Moreover, there exists an obvious inflection point between pressure drop of gas reservoirs with edge-and-bottom aquifer. The bottom-hole pressure drops slowly before the point and the pressure drop increases slowly. However, the bottom-hole pressure drops sharply after the point and the pressure drop rises sharply. The larger the aquifer is, the lower the recovery factor is [20]. This is because it belongs to single-phase flow in the early water invasion, and the gas-water interface is relatively stable. With an increase of water invasion, the single-phase flow gradually shifts to the two-phase flow. Consequently, the seepage resistance and pressure dropdown increases and the recovery factor reduces.
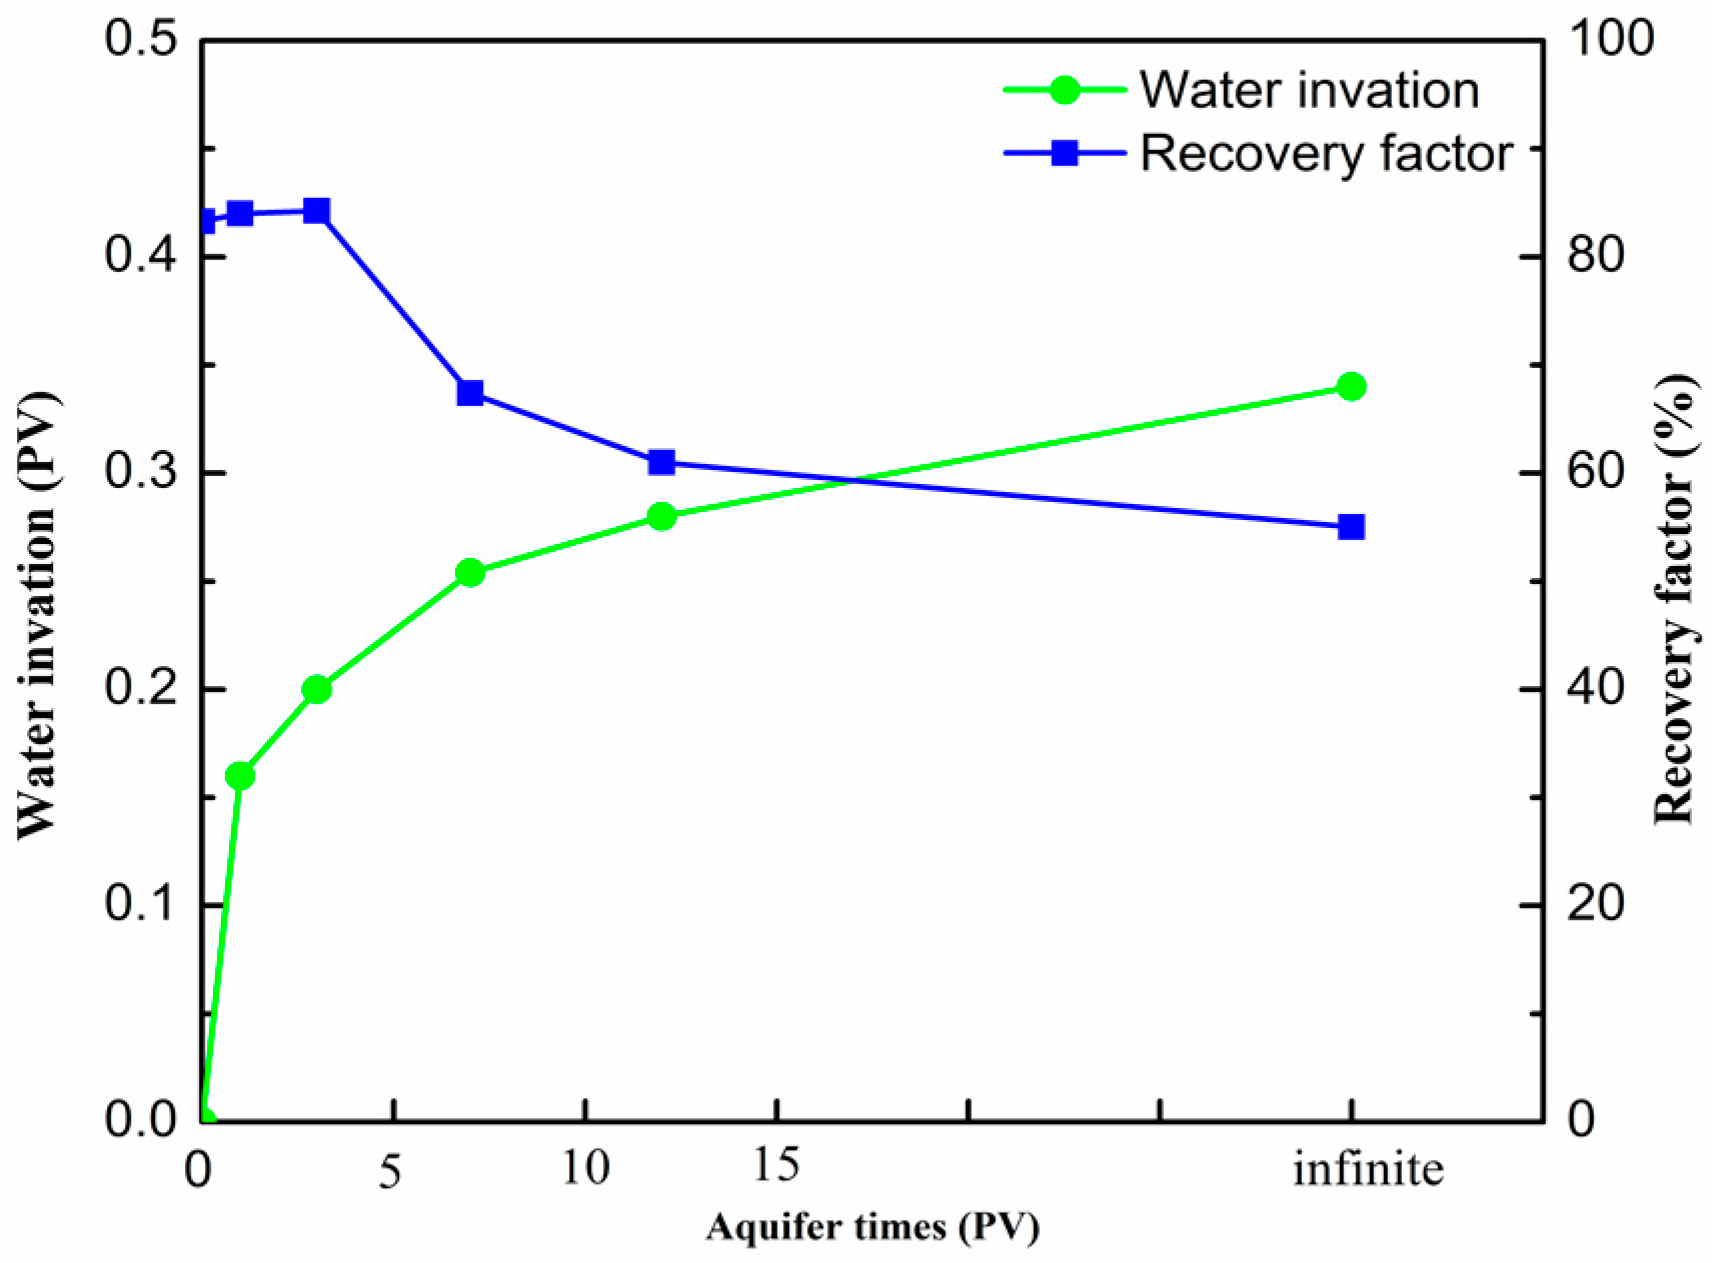
From the result of Figure 5, water invasion gradually increases with the increase of aquifer size [4,11]. However, when the aquifer size increases to a certain value, the growth of water invasion changes slowly. With the increase of aquifer size, the recovery factor increases then decreases, and the recovery factor reaches the maximum with the 3 times aquifer. It shows that when the permeability is 0.1 mD, the small aquifer provides positive energy to gas reservoirs. Less water occupies the storage space of gas reservoirs, which displaces partial gas and improves the recovery factor. With the increase of aquifer size, water invasion energy increases. Water displaces gas and some gas will be trapped through the breaker, flow around and water lock. When water invasion is mainly governed by trapped gas, the recovery factor reduces.
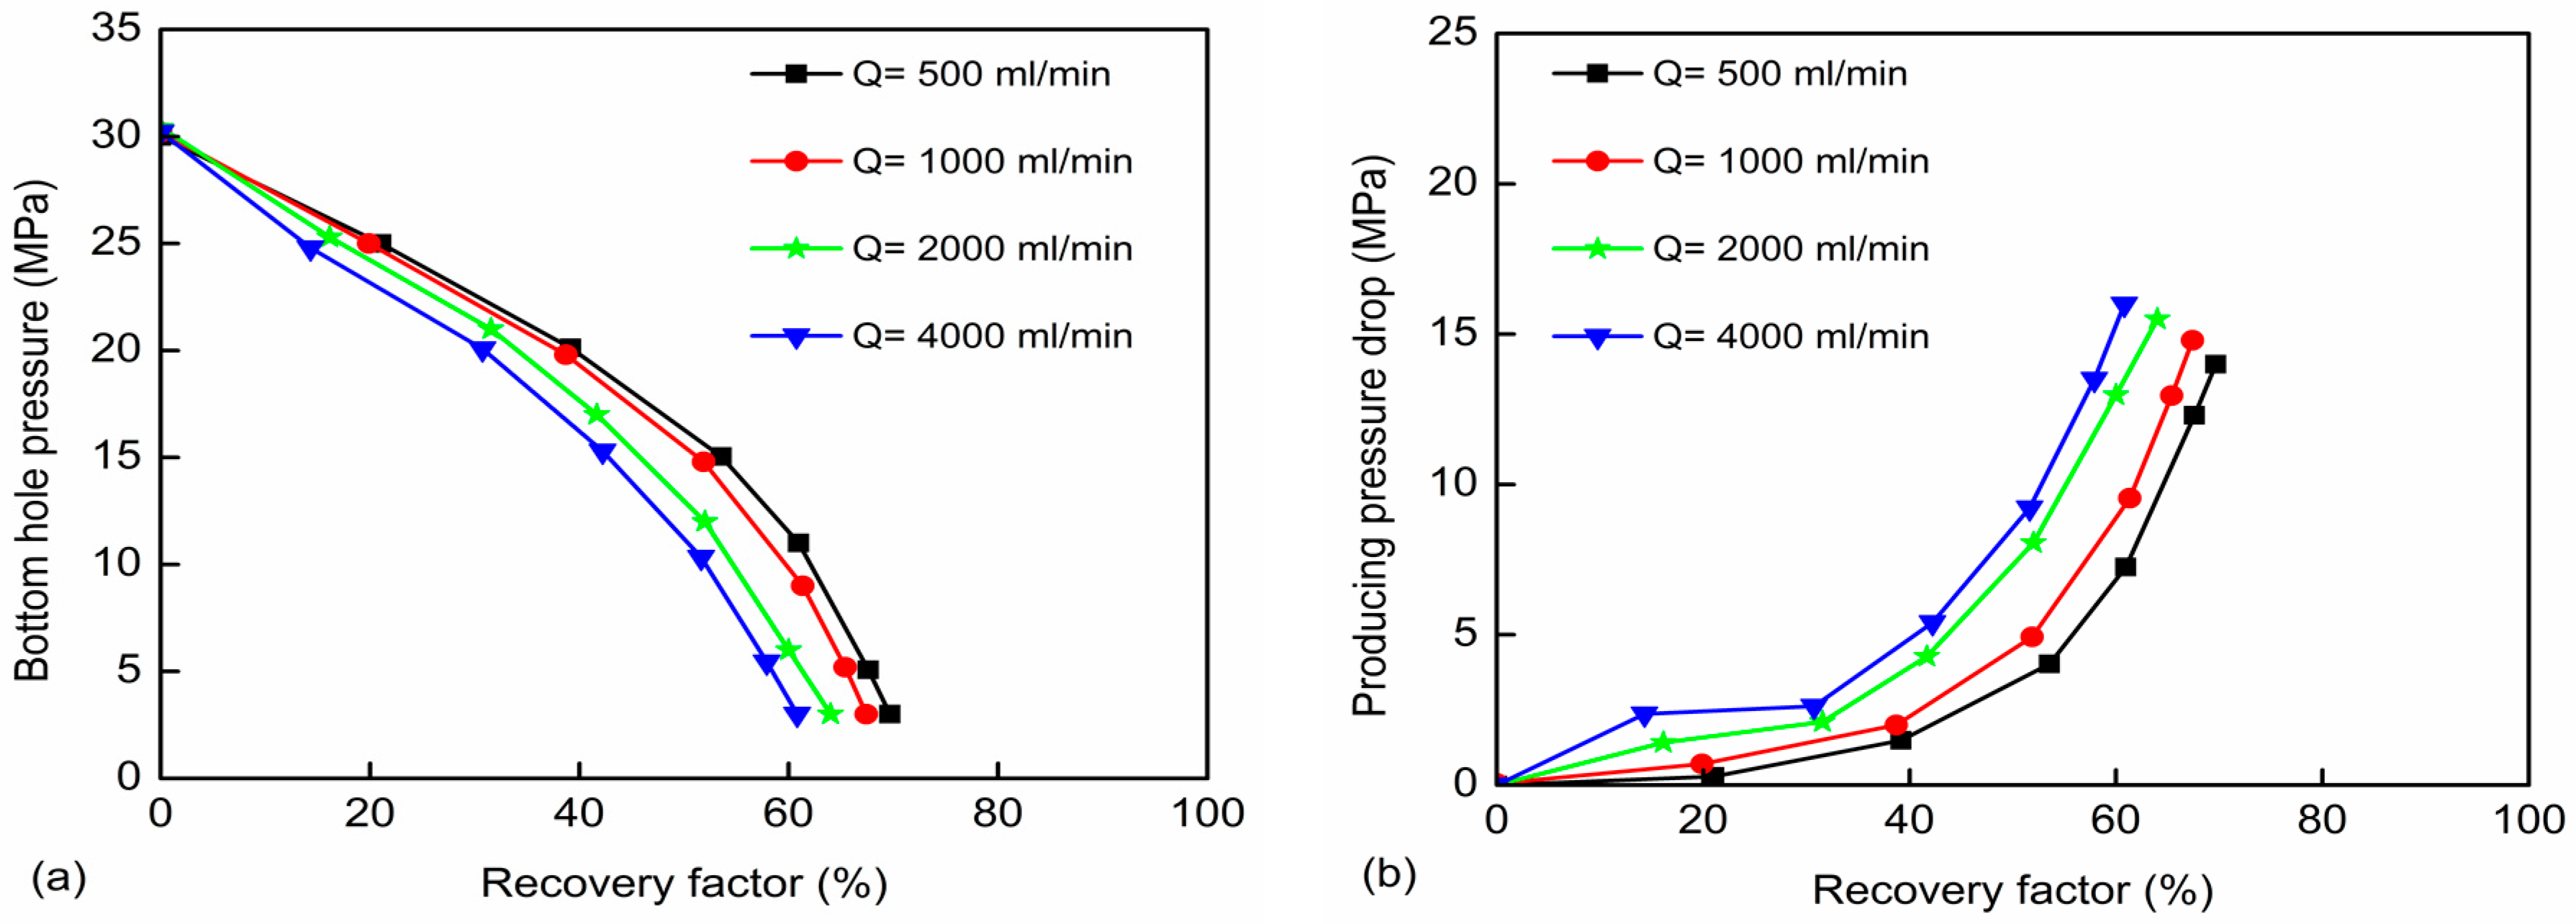
3.3. Effect of Different Production Rates
Gas production rate is a significant parameter in the development of gas reservoirs, which affects water coning and ultimate recovery [11,13]. In order to study the effects of different production rates, the core sample 2 is used to simulate water invasion in carbonate gas reservoirs. The aquifer size and original saturation pressure are 7 times and 30 MPa, respectively. The effects of gas production rates from 500 mL/min to 4000 mL/min are selected to simulate water invasion. Figure 6a,b shows bottom-hole pressure and producing pressure drop versus recovery factor for different production rates, respectively. It can be seen that when the recovery factor is less than 30%, the gas production rate has less impact on bottom-hole pressure and pressure drop. In the middle and later period, the gas production rate has a large effect on bottom-hole pressure and pressure drop. At the same recovery factor, the bigger the gas production rate is, the lower the bottom-hole pressure is and the larger the pressure drop is. This suggests that the bigger the gas production rate is, the more that the water invasion affects the recovery factor.
Figure 7a,b shows water invasion versus time for different production rates and recovery factor versus gas production rate, respectively. From the result, it can be known that water invasion changes linearly with time in the same aquifer size, and the rate of water invasion approximates to a certain value. This suggests that the water invasion of gas reservoirs with dissolved pores belongs to a uniform advancing process. The greater the gas production rate is, the faster the water invasion is [4]. Gas production rate increases from 500 mL/min to 4000 mL/min, and recovery factor decreases from 69.66% to 60.82%. The excessively high production gas rate goes against the recovery factor.
3.4. Effect of Different Permeabilities
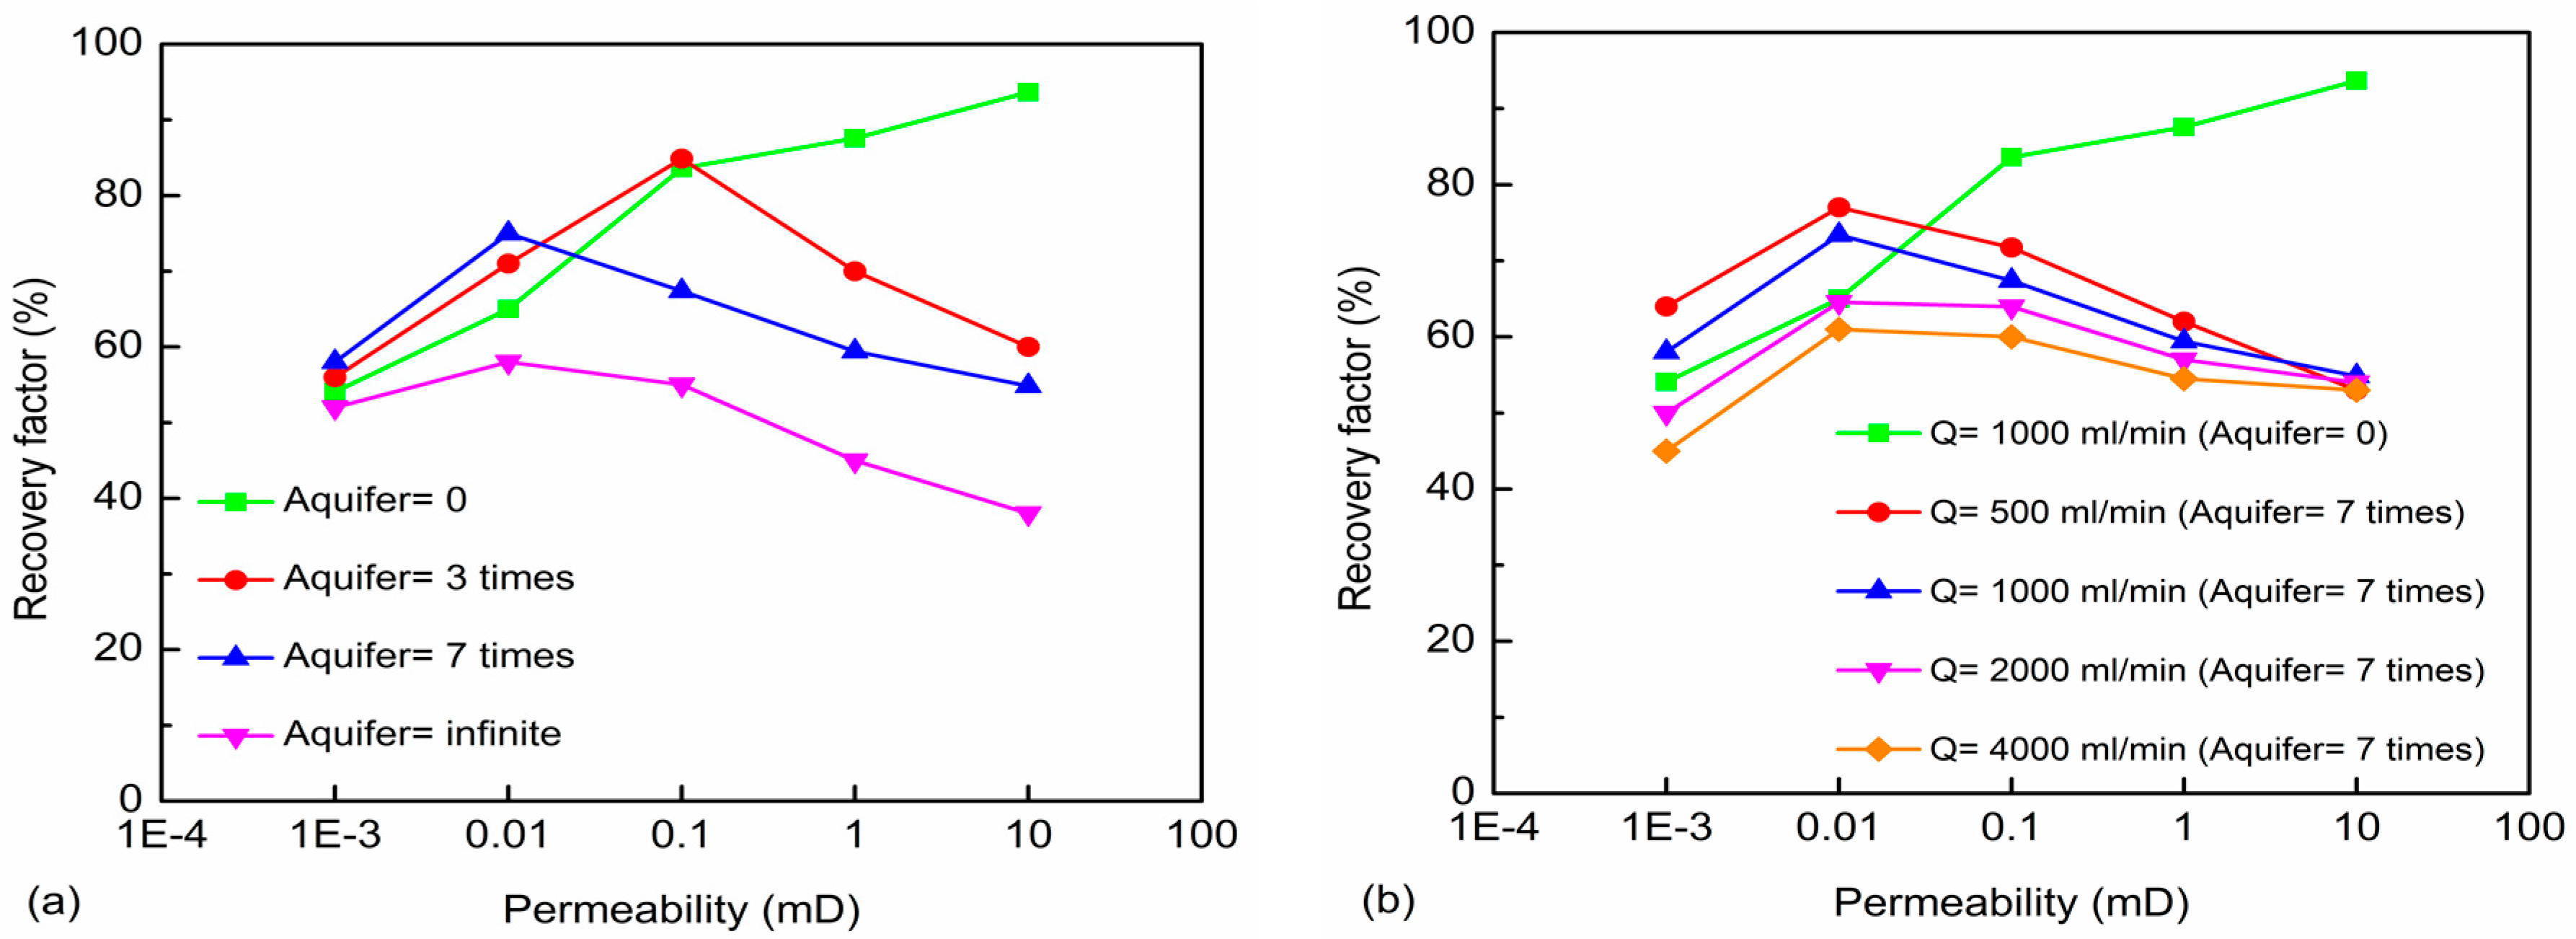
Permeability is a property of the reservoir rock that measures the capacity and ability of the formation to transmit fluid [11]. The core samples with different permeabilities are conducted to understand the effects of water invasion. The gas production rate and original saturation pressure are 1000 mL/min and 30 MPa, respectively. The experiment results without aquifer and with 3 times, 7 times and infinite aquifer are illustrated in Figure 8a. From the result of Figure 8a, it can be seen that the recovery factor increases gradually with the increase of permeability when there is no aquifer [21]. This is because the gas flow resistance in the low permeability core is far greater than its resistance in high permeability core, which is determined by the micro-pore structure characteristic of reservoirs. The recovery factor of the low permeability core with 0.001 mD is 54.09%, and it is considerably lower than that of 94.60% in high permeability with 10 mD. When the permeability is less than 0.1 mD, the 3 times aquifer promotes gas production and the recovery factor can increase by 3.7~8.5%. Once permeability exceeds 0.1 mD, water invasion reduces greatly, increasing the recovery factor, and the decrease is between 20.07% and 35.90%. This shows that the greater the permeability is, the more the aquifer size has an obvious effect on recovery factor at the same gas production rate. The gas reservoirs with different permeabilities correspond to an optimum aquifer, which can maximize the recovery factor. The lower the permeability is, the larger the corresponding aquifer is. The 0.1 mD core is 3 times aquifer while the 0.01 mD core is 7 times aquifer.
Figure 8b shows water invasion with different production rates between 500 mL/min and 4000 mL/min in the 7 times aquifer. When the permeability is 0.001 mD, gas production rate increases from 500 mL/min to 4000 mL/min and the related recovery factor reduces from 64% to 45%. While the permeability is 10 mD, gas production rate increases from 500 mL/min to 4000 mL/min and recovery factor is almost kept at about 54%. This indicates that the increase of gas production rate reduces the recovery factor of gas reservoirs, but the impact on recovery factor decreases with the increase of permeability. Thus, in the low and extra-low permeability reservoirs, we should control gas production rate in the development of gas reservoirs and extend production time so as to achieve the high recovery factor while we should properly speed up gas production rate in the medium-high permeability reservoirs.
3.5. Effect of Different Fractures
In carbonate gas reservoirs, the pore structure of carbonate rock is more heterogeneous, including dissolved vugs, pores and fractures [26]. The existence of fractures has a strong influence on water and gas flow in gas reservoirs [14]. The core samples without different fractures are selected to study the effects of water invasion. The gas production rate is 1000 mL/min and original saturation pressure is 30 MPa, respectively. The experimental results without aquifer and with 3 times, 7 times and infinite aquifer are provided in Figure 9. From the result of Figure 9a, it is seen that the recovery factor of core 6 is higher than that of core 3 when there is no aquifer [21]. This suggests that the existence of fractures increases the discharge area of gas reservoirs when the permeability is close, which provides a prior seepage channel and increases the recovery factor of gas reservoirs [21]. When the aquifer increases from no aquifer to infinity, the recovery factor of core 6 decreases from 88.13% to 29.99%, which is far higher than that of core 3. Figure 9b shows water invasion versus aquifer times for different fractures. The water invasion of core 6 is less than that of core 3. When the core contains fractures, fractures are the main channels of water advance and small water influx can make recovery factor fall sharply. Hence, we should depict and know the location of fractures and aquifer so as to keep away from the connecting zone between fractures and aquifer in the well-spaced development of gas reservoirs.
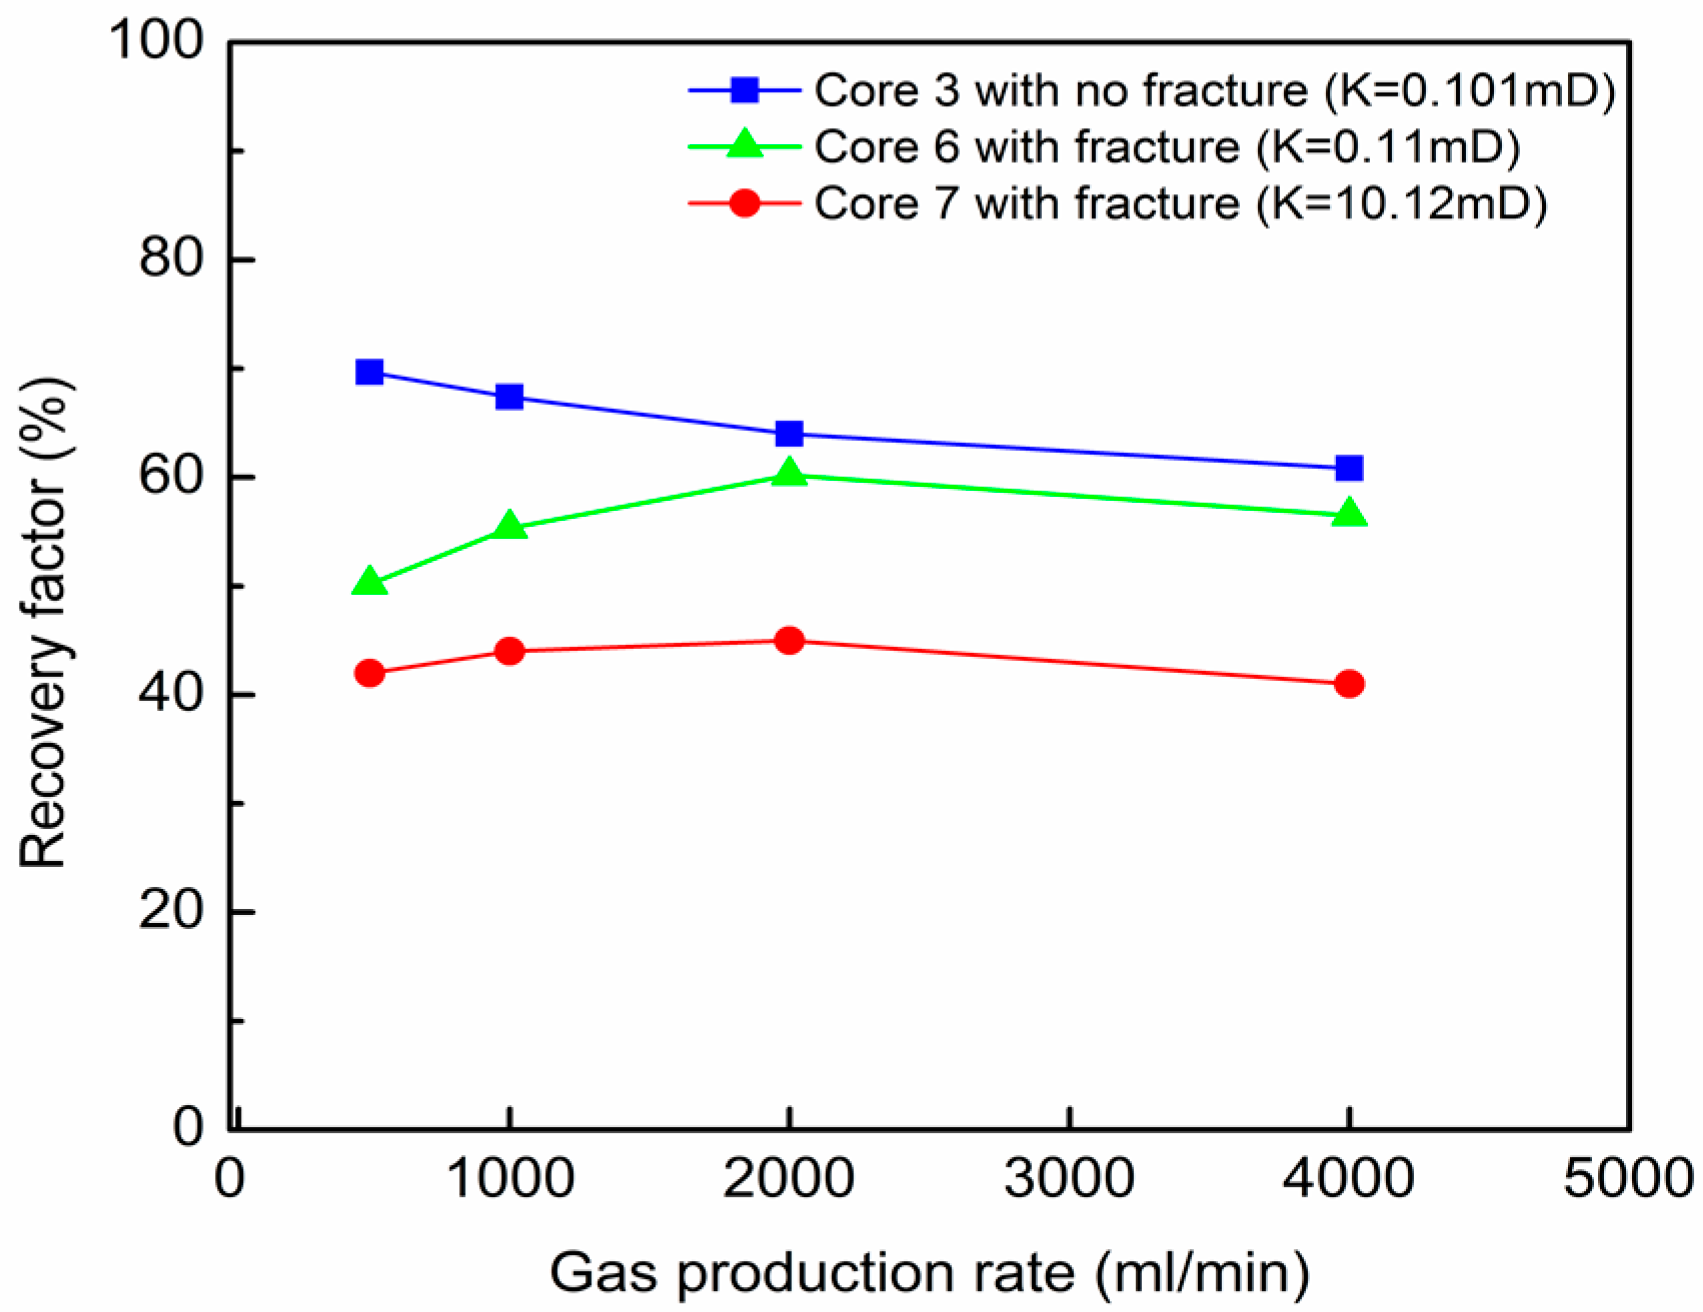
In order to understand the effects of production rates for different fractures, the core samples are used to simulate water invasion from 500 mL/min to 4000 mL/min. The aquifer size is 7 times and the original saturation pressure is 30 MPa. Figure 10 illustrates recovery factor versus gas production rate for different fractures. From the result of Figure 10, it can be observed that the recovery factor of the cores with dissolved pores decreases with the increase of gas production rate. The recovery factor of the fracture cores increases and then decreases as gas production rate increases, and there exists an optimal gas production rate. That is to say, the production rate of gas reservoirs is equal to the rate which provides gas to fractures from base rocks. Thus, it is very significant to choose a reasonable production rate in the development of fractured gas reservoirs.
4. Conclusions
In this study, the experimental system of water invasion in gas reservoirs with edge and bottom aquifer was established and the elastic expansions of water and water soluble gas were considered. Seven full diameter core samples with dissolved pores and fractures were designed to simulate the process of water invasion in carbonate gas reservoirs. Then the effects of the related reservoir properties and production parameters were investigated. The following conclusions can be drawn from the study: During the physical simulation of water invasion energy source and performance, the elastic expansions of water and water soluble gas have a great influence. The aquifer size, gas production rate and permeability affects water invasion in gas reservoirs with dissolved pores. The bigger the aquifer is, the higher the water invasion is, and the greater the energy of gas reservoir provided by aquifer is. Moreover, the slower the bottom-hole pressure in early water invasion drops, the more quickly the bottom-hole pressure drops in the latter. Gas reservoirs with different permeabilities correspond to an optimum aquifer. The lower the permeability is, the larger the aquifer is. The higher the gas production rate is, the faster the water invasion is. However, gas production rate has less influence on recovery factor with the increase of permeability. The existence of fractures provides a prior seepage channel for water invasion in fractured gas reservoirs. The water will advance rapidly along the fractures, and the smaller water influx may result in a significant recovery factor.
Acknowledgments
This work was supported by National Science and Technology Major Project of the Ministry of Science and Technology of China Project (NO. 50150503-12 and NO. 2016ZX03005), and by the Project of PetroChina Research Institute of Petroleum Exploration & Development (NO. RIPED-LFFY-2017-JS-118). We thank the support from the Youth Foundation of Key Laboratory for Mechanics in Fluid Solid Coupling Systems, Chinese Academy of Sciences.
Author Contributions
Feifei Fang, Shusheng Gao, Huaxun Liu and Weijun Shen designed and discussed the experiment; Feifei Fang and Huaxun Liu conducted the experiment; Feifei Fang, Huaxun Liu, Qingfu Wang and Weijun Shen analyzed and discussed the results; Feifei Fang and Weijun Shen wrote the paper; Yang Li gave the help and suggestion in the revised manuscript.
Conflicts of Interest
The authors declare no conflict of interest.
References
- Namani, M.; Asadollahi, M.; Haghighi, M. Investigation of water coning phenomenon in iranian carbonate fractured reservoirs. Adv. Biomed. Res. 2007, 1, 28–33. [Google Scholar]
- Ould-Amer, Y.; Chikh, S.; Naji, H. Attenuation of water coning using dual completion technology. J. Pet. Sci. Eng. 2004, 45, 109–122. [Google Scholar] [CrossRef]
- Shen, W.J.; Li, X.Z.; Liu, X.H.; Lu, J.L. Analytical comparisons of water coning in oil and gas reservoirs before and after water breakthrough. Electron. J. Geotech. Eng. 2014, 19, 6747–6756. [Google Scholar]
- Shen, W.J.; Liu, X.H.; Li, X.Z.; Lu, J.L. Water coning mechanism in Tarim fractured sandstone gas reservoirs. J. Cent. South Univ. 2015, 22, 344–349. [Google Scholar] [CrossRef]
- Jafari, I.; Jamshidi, S.; Masihi, M. Investigating the mechanism of water inflow in gas wells in fractured gas reservoirs and designing a controlling method. Int. J. Chem. Environ. Biol. Sci. 2012, 3, 482–487. [Google Scholar]
- Zendehboudi, S.; Elkamel, A.; Chatzis, I.; Ahmadi, M.I.; Bahadori, A.; Lohi, A. Estimation of breakthrough time for water coning in fractured systems: Experimental study and connectionist modeling. AIChE J. 2014, 60, 1905–1919. [Google Scholar] [CrossRef]
- Azim, R.A. Evaluation of water coning phenomenon in naturally fractured oil reservoirs. J. Pet. Explor. Prod. Technol. 2016, 6, 279–291. [Google Scholar] [CrossRef]
- Amooie, M.A.; Soltanian, M.R.; Xiong, F.; Dai, Z.; Moortgat, J. Mixing and spreading of multiphase fluids in heterogeneous bimodal porous media. Geomech. Geophys. Geo-Energy Geo-Resour. 2017, 1–20. [Google Scholar] [CrossRef]
- Meyer, H.I.; Garder, A.O. Mechanics of two immiscible fluids in porous media. J. Appl. Phys. 1954, 25, 1400–1406. [Google Scholar] [CrossRef]
- Blake, J.R.; Kueera, A. Coning in oils reservoirs. Math. Sci. 1988, 13, 36–47. [Google Scholar]
- Ahmed, T. Reservoir Engineering Handbook, 4th ed.; Gulf Professional Publishing, Imprint Elsevier: Oxford, UK, 2010. [Google Scholar]
- Muskat, M.; Wycokoff, R.D. An approximate theory of water-coning in oil production. Trans. AIME 1935, 114, 144–163. [Google Scholar] [CrossRef]
- Høyland, L.A.; Papatzacos, P.; Skjaeveland, S.M. Critical rate for water coning: Correlation and analytical solution. SPE Reserv. Eng. 1989, 4, 495–502. [Google Scholar] [CrossRef]
- Saad, E.D.S.; Darwich, T.; Asaad, Y. Water Coning in Fractured Basement Reservoirs. In Proceedings of the Middle East Oil Show, Manama, Bahrain, 11–14 March 1995. [Google Scholar]
- Bahrami, H.; Shadizadeh, S.R.; Goodarzniya, I. Numerical Simulation of Coning Phenomena in Naturally Fractured Reservoirs. In Proceedings of the 9th Iranian Chemical of Engineering Congress, Iran University of Science and Technology (IUST), Tehran, Iran, 23–25 November 2004. [Google Scholar]
- Cheng, K.H.; Jiang, T.W.; Wang, X.Y.; Mou, W.J.; Pan, Z.C. A study on water invasion mechanism of the bottom-water gas reservoir in the ordovician system of hetian-he gas field. Nat. Gas Ind. 2007, 27, 108–110. [Google Scholar]
- Hu, S.; Lin, Q.; Tang, J. Analysis method of aquifer behavior and water invasion performance partly trapped in heterogeneous gas reservoir. Nat. Gas Ind. 2004, 24, 78–81. [Google Scholar]
- Xiong, Y.; Yang, S.; Le, H.; Tang, J.; Yu, X. A new method of water influx performance analysis on fracture gas reservoirs with bottom water. Nat. Gas Ind. 2010, 30, 61–64. [Google Scholar]
- Perez, E.; Garza, F.R.D.L.; Samaniego-Verduzco, F. Water Coning in Naturally Fractured Carbonate Heavy Oil Reservoir—A Simulation Study. In Proceedings of the SPE Latin America and Caribbean Petroleum Engineering Conference, Mexico City, Mexico, 16–18 April 2012. [Google Scholar]
- Hu, Y.; Shao, Y.; Lu, Y.; Zhang, Y.F. Experimental study on occurrence models of water in pores and the influencing to the development of tight gas reservoir. Nat. Gas Geosci. 2011, 22, 176–181. [Google Scholar]
- Shen, W.J.; Li, X.Z.; Liu, X.H.; Lu, J.L.; Jiao, C.Y. Physical simulation of water influx mechanism in fractured gas reservoirs. J. Cent. South Univ. (Sci. Technol.) 2014, 45, 3283–3287. [Google Scholar]
- Jin, Z.H.; Johnson, S.E. Effects of elastic anisotropy on primary petroleum migration through buoyancy-driven crack propagation. Geomech. Geophys. Geo-Energy Geo-Resour. 2017, 1–14. [Google Scholar] [CrossRef]
- Fan, H.C.; Huang, Z.L.; Yuan, J.; Gao, G.; Tong, C.X. Solubility experiment of methane-rich gas and features of segregation and accumulation. J. Jilin Univ. (Earth Sci. Ed.) 2011, 41, 1033–1039. [Google Scholar]
- Perera, M.S.A.; Ranjith, P.G.; Choi, S.K.; Airey, D. Numerical simulation of gas flow through porous sandstone and its experimental validation. Fuel 2011, 90, 547–554. [Google Scholar] [CrossRef]
- Zou, C.N.; Du, J.H.; Xu, C.C.; Wang, Z.C.; Zhang, B.M.; Wei, G.Q; Wang, T.S.; Yao, G.S.; Deng, S.H.; Liu, J.J.; et al. Formation, distribution, resource potential and discovery of the Sinian-Cambrian giant gas field, Sichuan Basin, SW China. Pet. Explor. Dev. 2014, 41, 278–293. [Google Scholar] [CrossRef]
- Li, X.Z.; Gu, Z.H.; Wan, Y.J.; Liu, X.H.; Zhang, M.L.; Xie, W.R.; Su, Y.H.; Hu, Y.; Feng, J.W.; Yang, B.X.; et al. Geological characteristics and development strategies for Cambrian Longwanmiao Formation gas reservoir in Anyue gas field, Sichuan Basin, SW China. Pet. Explor. Dev. 2017, 44, 398–406. [Google Scholar] [CrossRef]
Figure 1.
Experimental system of water invasion in gas reservoirs with edge and bottom aquifer.

Figure 2.
Core samples from the carbonate gas reservoir of Anyue gas field. (a) Core sample with vugs and pores; (b) Core sample with micro fractures.
Figure 2.
Core samples from the carbonate gas reservoir of Anyue gas field. (a) Core sample with vugs and pores; (b) Core sample with micro fractures.

Figure 3.
Water invasion versus recovery factor for different water invasion energies.

Figure 4.
Bottom hole pressure and producing pressure drop versus recovery factor for different aquifers. (a) Bottom hole pressure; (b) producing pressure drop.
Figure 4.
Bottom hole pressure and producing pressure drop versus recovery factor for different aquifers. (a) Bottom hole pressure; (b) producing pressure drop.

Figure 5.
Water invasion and recovery factor versus aquifer times.

Figure 6.
Bottom hole pressure and producing pressure drop versus recovery factor for different production rates. (a) Bottom hole pressure; (b) producing pressure drop.
Figure 6.
Bottom hole pressure and producing pressure drop versus recovery factor for different production rates. (a) Bottom hole pressure; (b) producing pressure drop.

Figure 7.
Water invasion versus time for different production rates and recovery factor versus gas production rate (a) Water invasion; (b) recovery factor.
Figure 7.
Water invasion versus time for different production rates and recovery factor versus gas production rate (a) Water invasion; (b) recovery factor.
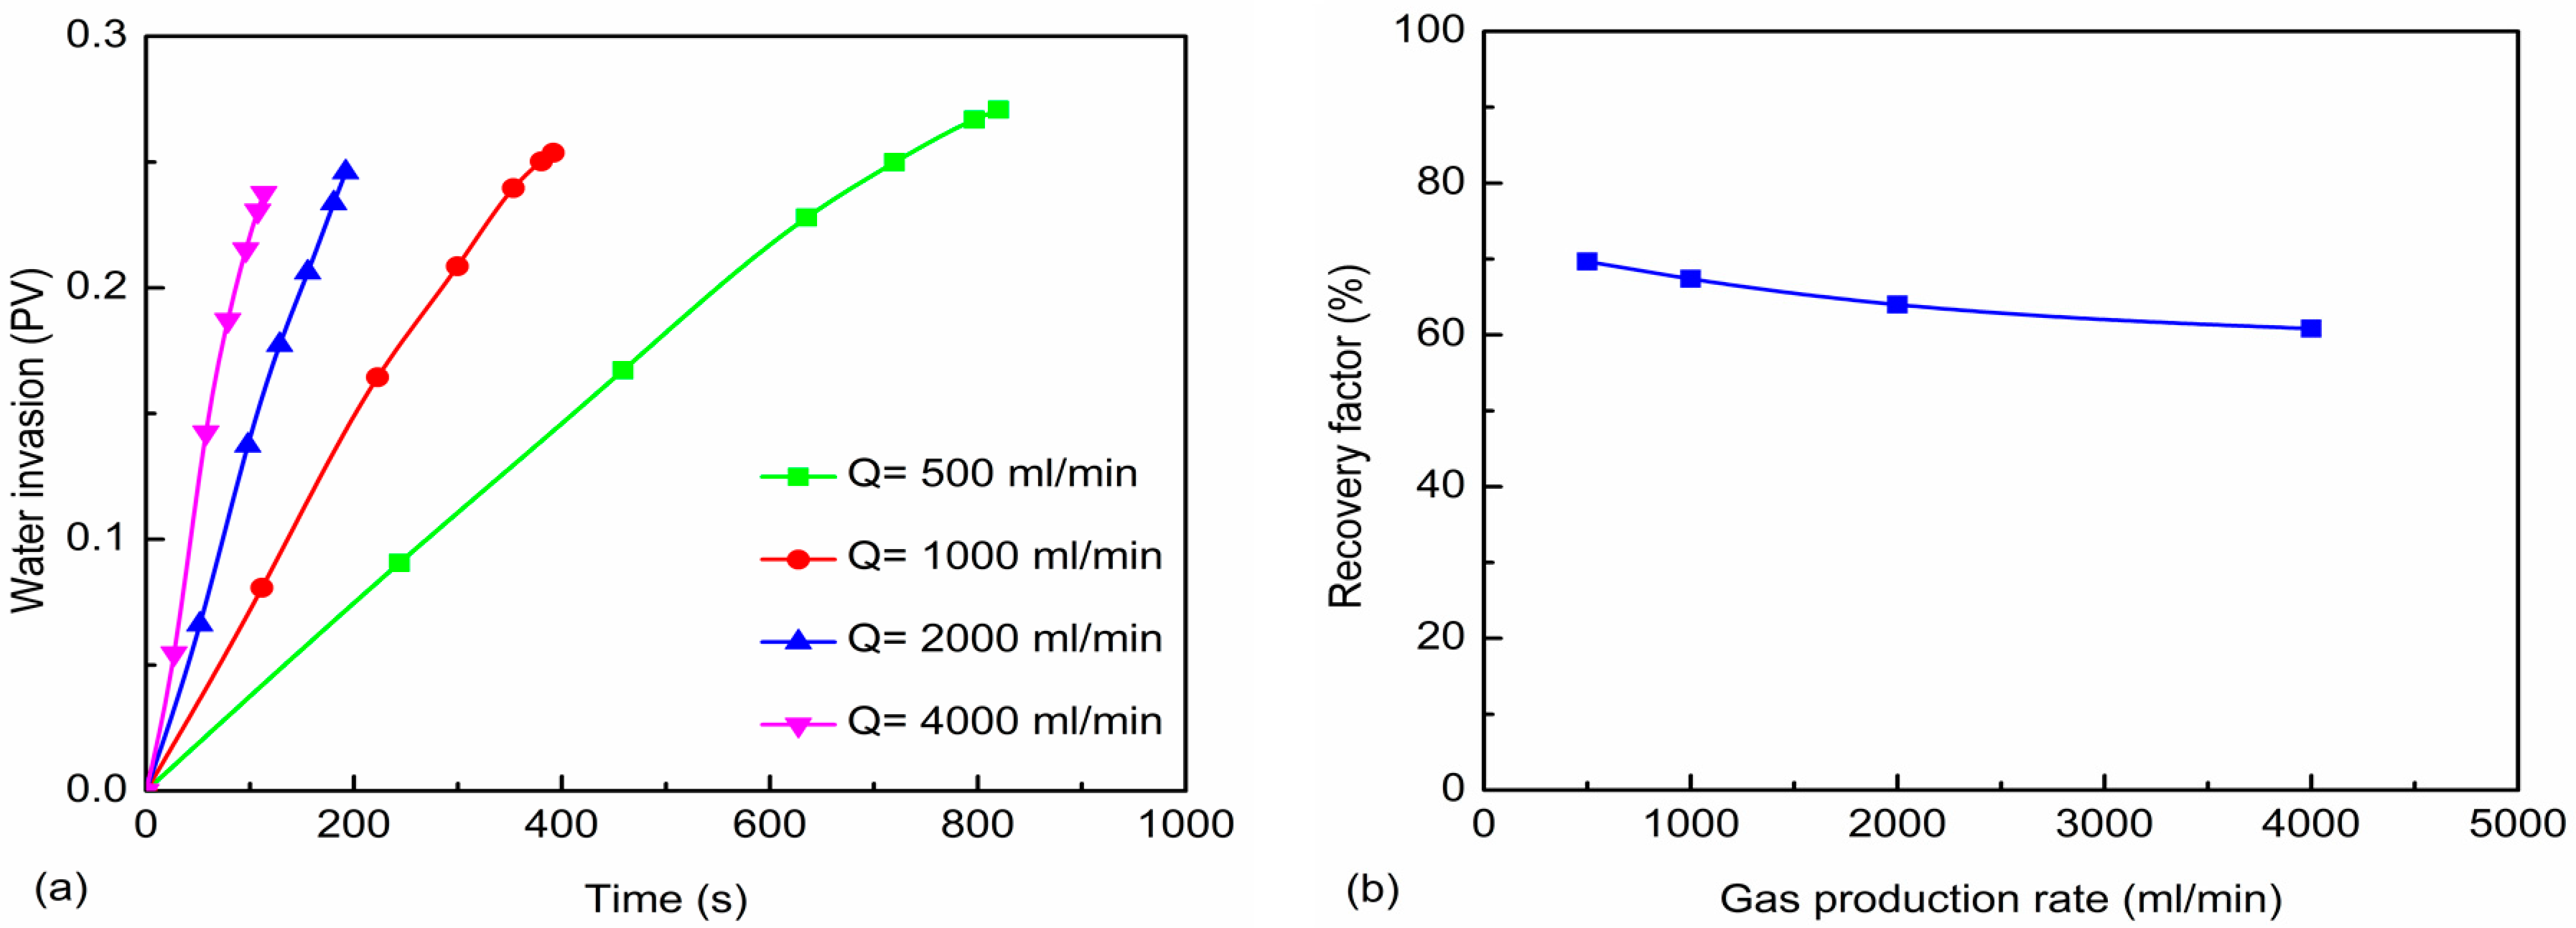
Figure 8.
Recovery factor versus permeability for different aquifers and production rates. (a) Different aquifers; (b) different production rates.
Figure 8.
Recovery factor versus permeability for different aquifers and production rates. (a) Different aquifers; (b) different production rates.

Figure 9.
Recovery factor and water invasion versus aquifer times for different fractures. (a) Recovery factor; (b) water invasion.
Figure 9.
Recovery factor and water invasion versus aquifer times for different fractures. (a) Recovery factor; (b) water invasion.
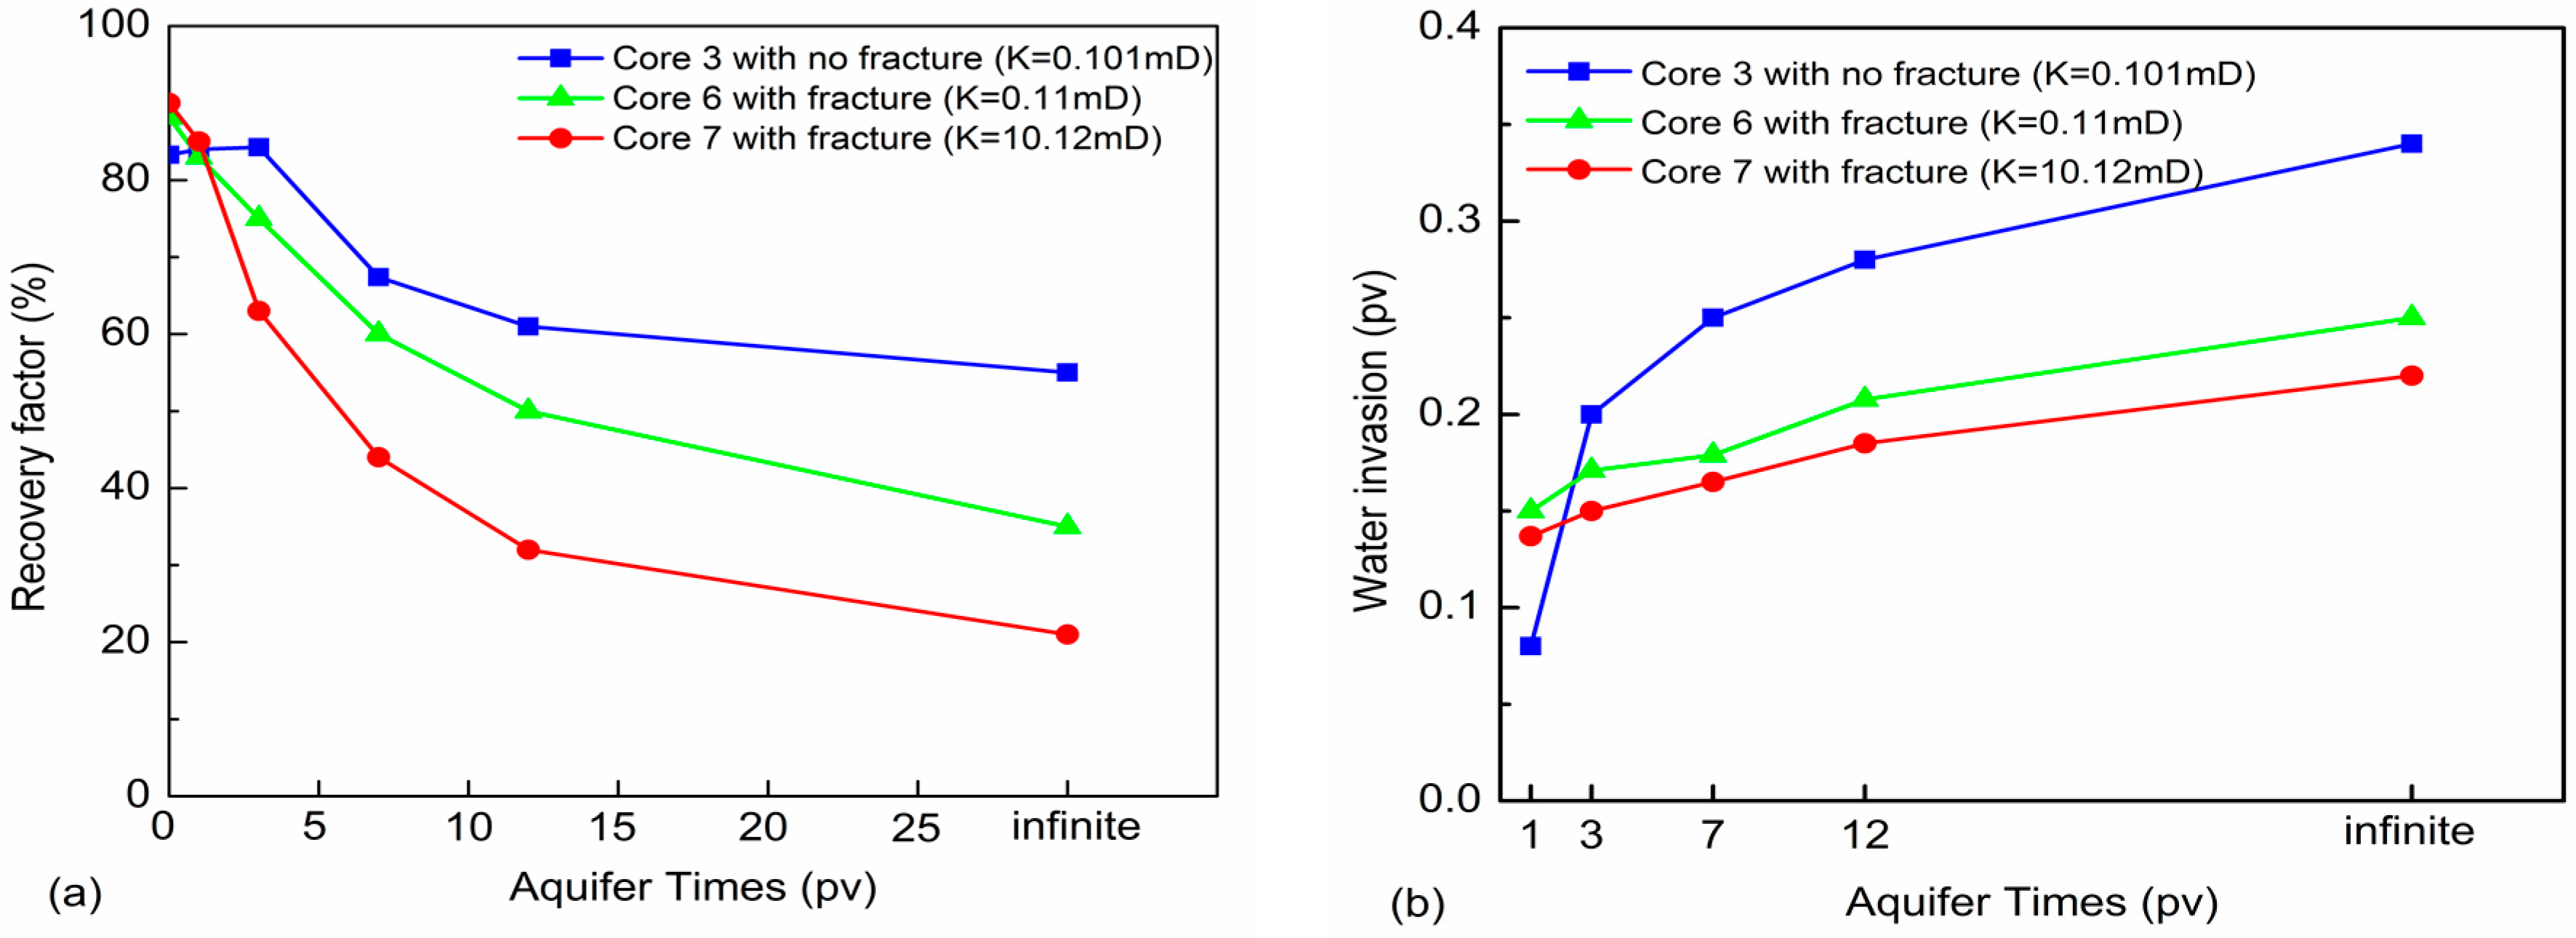
Figure 10.
Recovery factor versus gas production rate for different fractures.


Table 1.
Some properties of carbonate core samples used in this study.
| NO. | Length (cm) | Diameter (cm) | Permeability (mD) | Porosity (%) |
|---|---|---|---|---|
| 1 | 10.105 | 10.438 | 0.001 | 4.10 |
| 2 | 9.807 | 10.021 | 0.021 | 4.30 |
| 3 | 10.156 | 10.440 | 0.101 | 5.10 |
| 4 | 10.350 | 10.159 | 1.010 | 8.80 |
| 5 | 10.153 | 10.357 | 15.310 | 10.60 |
| 6 | 10.255 | 10.257 | 0.110 | 5.30 |
| 7 | 10.250 | 10.257 | 10.120 | 5.40 |
Table 2.
Different experiments of water invasion conducted in this study.
| NO. | Fracture | Aquifer Size (Times) | Production Rate (mL/min) |
|---|---|---|---|
| 1 | no | 0, 3, 7, infinite | 500, 1000, 2000, 4000 |
| 2 | no | 0, 1, 3, 7, 12, infinite | 500, 1000, 2000, 4000 |
| 3 | no | 0, 3, 7, infinite | 500, 1000, 2000, 4000 |
| 4 | no | 0, 3, 7, infinite | 500, 1000, 2000, 4000 |
| 5 | no | 0, 3, 7, infinite | 500, 1000, 2000, 4000 |
| 6 | yes | 0, 3, 7, 12, infinite | 500, 1000, 2000, 4000 |
| 7 | yes | 0, 3, 7, 12, infinite | 500, 1000, 2000, 4000 |
© 2017 by the authors. Licensee MDPI, Basel, Switzerland. This article is an open access article distributed under the terms and conditions of the Creative Commons Attribution (CC BY) license (http://creativecommons.org/licenses/by/4.0/).
Share and Cite
MDPI and ACS Style
Fang, F.; Shen, W.; Gao, S.; Liu, H.; Wang, Q.; Li, Y. Experimental Study on the Physical Simulation of Water Invasion in Carbonate Gas Reservoirs. Appl. Sci. 2017, 7, 697. https://doi.org/10.3390/app7070697
AMA Style
Fang F, Shen W, Gao S, Liu H, Wang Q, Li Y. Experimental Study on the Physical Simulation of Water Invasion in Carbonate Gas Reservoirs. Applied Sciences. 2017; 7(7):697. https://doi.org/10.3390/app7070697
Chicago/Turabian StyleFang, Feifei, Weijun Shen, Shusheng Gao, Huaxun Liu, Qingfu Wang, and Yang Li. 2017. "Experimental Study on the Physical Simulation of Water Invasion in Carbonate Gas Reservoirs" Applied Sciences 7, no. 7: 697. https://doi.org/10.3390/app7070697
Note that from the first issue of 2016, this journal uses article numbers instead of page numbers. See further details here.