
Investigation into the Vibrational Responses of Cylinder Liners in an IC Engine Fueled with Biodiesel


1
Department of Vehicle Engineering, Taiyuan University of Technology, Taiyuan 030024, China
2
Center for Efficiency and Performance Engineering, University of Huddersfield, Huddersfield HD1 3DH, UK
3
Quanjiao Power Co., Ltd., Quanjiao 239500, China
*
Authors to whom correspondence should be addressed.
Appl. Sci. 2017, 7(7), 717; https://doi.org/10.3390/app7070717
Submission received: 21 April 2017
/
Revised: 27 June 2017
/
Accepted: 4 July 2017
/
Published: 13 July 2017
Abstract
:The paper presents a study of the relationship between the combustion behavior and vibration response of internal combustion (IC) engines fueled with biodiesel based on finite element modelling along with experimental evaluation. An improved finite element (FE) model is established and validated to predict the dynamic responses of cylinder liners with respect to two main sources: combustion shock and piston side thrust. Based on the validated FE model, the response characteristics of the cylinder liner in an IC engine fueled with biodiesel and its causal relationship with excitation sources have been predicted. Due to the lower calorific value of biodiesel, a greater amount of fuel is injected into the combustion chamber to maintain power outputs, which results in a prolonged combustion duration and subsequent higher overall vibration levels, compared with that of diesel. The advanced ignition of biodiesel is the main cause to the compound effect on the coupling of piston side-thrust force, thereby resulting in a nonlinear increase in the root mean square (RMS) of local vibration response close to the combustion top dead center (TDC). These key findings provides insight understandings for not only biodiesel combustion diagnostics but also more accurate diagnostics of fossil diesel based on nonintrusive vibrations.
1. Introduction
Promoted by the realization of dwindling fossil fuel supplies and their adverse environmental impacts, more and more types of alternative fuels to fossil diesel have been investigated and used in compression ignition (CI) engines. It has been shown by many studies [1,2,3,4] and small-scale applications [5,6] that the use of biodiesel can be feasible as burning such fuels in a diesel engine can produce the desired power and an emission level similar to that of fossil diesel. It has also been observed that there are many significant differences in using biodiesel in terms of combustion behaviors, burning residuals, vibration and noise emissions, which might be attributed to their significant difference in physical and chemical properties [7,8]. However, the majority of studies on biodiesel have mainly focused on its power performance, efficiency and emission performance, without fully investigating the potential effects on the vibro-acoustic emissions of engines caused by its significant differences in physical and chemical properties. Consequently, the impacts of the long-term use of biodiesel on structural failure, overall service lifespans and the associated maintenance activities of internal combustion (IC) engines are not yet fully understood.
It has been found that there are many differences in the chemical components and combustion characteristics of biodiesels from various feed stocks [8]. To bring the service performance of biodiesel close to that of fossil diesel, that is, to fuel CI engines with biodiesel without modifying engines, appropriate additives and performance improvers are usually needed in the preparation of biodiesel. So far, the service performance, such as power performance, fuel economy and exhaust emission, has been generally selected as the optimization objective of biodiesel preparation. However, the noise, vibration and harshness (NVH) performance of an IC engine is rarely considered as the objective of fuel optimization design. This hinders the attempt at achieving service life extension and maintenance cost reduction through the optimization design of biodiesel.
In order to investigate the differences in engine NVH performance fueled with biodiesel and fossil diesel, some preliminary experimental studies have been performed. Uludamar et al. [8] proposed that, due to the high oxygen fraction, the combustion quality of biodiesel is better than that of conventional fossil diesel. The average engine vibration fueled with pure sunflower, canola and corn biodiesels decreased by 2.80%, 3.87% and 3.72% respectively when compared with fossil diesel. Smoother combustion with the usage of biodiesel means lowering the vibration emissions of the engine body. Biodiesel has a higher cetane value, which means that it is much easier to ignite after being injected into the combustion chamber. Advanced ignition or earlier premixed combustion can effectively shorten the ignition delay period, thus reducing the peak of pressure rise rate. It can be inferred that the burning of biodiesel may be helpful to reduce the dynamic responses of engines. However, as Alisaraei et al. [7] found, with an increase of the operating speed, especially at high-load conditions, a four-cylinder engine fueled with a blended fuel consisting of biodiesel and diesel with a blending ratio from 20% to 40% (biodiesel in blended fuel) shows much more intense vibration and noise emissions than the diesel under high-speed operating conditions. This phenomenon can hardly be explained just by the combustion characteristics of biodiesel, suggesting that vibration characteristics are determined by complex dynamic behaviors. It is essential to investigate the generating mechanism of dynamic responses and to study the causal relationship between the excitation sources and structural vibrations, thus achieving a more in-depth understanding of the vibrational characteristics of IC engines fueled with biodiesel.
The piston-cylinder assembly is one of the engine’s key subsystems that determine the performances of vibration, noise and, hence, service lifespan. In earlier research, more than 80% of the total engine noise and vibration has been shown to stem from cylinder liners’ dynamic response to combustion in the cylinder and the piston slaps. To fully understand the influences of fuels’ combustion characteristics on engine vibrational responses, it is essential to make a thorough and detailed study of the dynamic behavior of cylinder liners and their generation mechanism. Geng [9] and Dolatabadi et al. [10] studied the dynamic response of cylinder liners by establishing the mathematical dynamic model and proposed preliminary predictions about the occurrence timing and observable numbers of piston slaps on liners. Nonetheless, due to the limited degree of freedom, the difficulty of defining boundary conditions and lack of structural characteristics, their predicted occurrence timing and observable number are not in good agreement with the experimental results. In order to obtain more accurate and reliable simulation results, some researchers have investigated the liner dynamics by using the finite element analysis technique.
Structural analysis of cylinder liners has been reported using finite element analysis (FEA) [11,12,13]. The static deformation, forced response analysis and frequency response analysis of cylinder liners were undertaken based on finite element models, for impact force calculation and liner response analysis [13]. However, the majority of these finite element method (FEM)-based studies were performed based on a quasi-static model in which the modal characteristics and reaction upon the piston of cylinder liners were neglected. Obviously, such models may not be able to reflect the phenomena of actual contacts between piston and cylinder due to invertible elastic deformations under dynamic forces.
In this paper, to gain an in-depth understanding of the dynamic responses of cylinder liners to in-cylinder combustion shocks and piston slaps, a finite element model is developed by taking into account structural modal characteristics, nonlinearities of assembly constraints and time-varying exciting forces. Based on the established dynamic model, the response characteristic of liner structure and its relationship with the combustion properties of biodiesel have been investigated. The paper is organized into five sections in addressing the subject. Section 2 details the development of the FEM-based model, which includes model validation against experimental measurements from a single-cylinder diesel engine. Section 3 investigates the dynamic responses of the cylinder liner to different excitation sources and fuel types. Section 4 introduces the design and construction of the experiment system. Section 5 examines the correlation between the numerical and experimental results and evaluates the liner’s responses to the combustion of biodiesel and Section 6 summarizes the conclusions obtained through this initial work.
2. Structural Characteristics and Dynamic Behaviors of Cylinder Liners
The cylinder liner, or cylinder sleeve is one of the central components of reciprocating engines. In addition to forming part of the combustion chamber, cylinder liners also provide swept space for a piston reciprocates. A typical wet cylinder liner construction is shown in Figure 1. In order to achieve a thermal equilibrium, the outer surface of the wet liner is in direct contact with the coolant. The liner’s upper flange is bolted to the cylinder head and cylinder block to limit its axial degree of freedom. The lower external surface of the liner is mounted onto the engine body within the clearance fitting. To prevent leakage of the liquid coolant into the crankcase, the lower end of the wet liner is sealed with the help of a rubber sealing ring.
2.1. Meshing and Boundary Conditions
To improve the computational efficiency, some geometric details on the outer surface of the cylinder liner were neglected. The model of cylinder liner was configured to have 7121 hexahedral isoparametric solid elements using ANSYS Workbench, while the other components were treated as rigid body in modeling to reduce the need for solution time and computing sources, as shown in Figure 2b. Because of the large number of simulation steps in the transient dynamics analysis, about 1000 steps for each case, both the larger number of grids and smaller mesh size can result in a dramatic increase in the need for solution time and computing sources. Specifically, when the grid size is chosen to be 2.5 mm, half the thickness of the liner, the solution time of a whole operating cycle is 5.8 times the grid size of 5 mm, while the amplitude error of the two simulated displacement is less than 2%. For the balance between acceptable accuracy and computing efficiency, hexahedral elements with a grid size of 5 mm are adopted for three-dimensional meshes. Arranging the mesh with finer elements in this way allows for vibration analysis at frequencies up to 10 kHz, which was estimated based on analytical analysis when the liner is assumed to be a uniform cylindrical shell [14]. Even so, the solution time of a whole operating cycle takes up to seven hours. The material for the liner in this research is ductile cast iron QT600-3 [15]; material parameters appear in Table 1.
Boundary conditions of the studied cylinder liner are shown in Figure 2a where the liner is a non-uniform cylinder-shaped shell with end-flanges. To avoid altering the liner’s modal characteristics caused by improper boundary condition definition, the fixed joints and clearance fits have been modelled through constructing a series of frictionless CONTACT pairs as seen in Figure 2b, which effectively avoids the errors induced by over-simplification and inappropriate structural equivalent in the modelling of the cylinder dynamics [14]. In this way, it allows taking into account more successfully the slight changes in modal characteristics of the cylinder liner, leading to more accurate analysis.
In addition, to handle the nonlinearities arisen from the contact constraints, a reduced method from the Newmark implicit integration method was chosen to solve the motion equations. The method has acceptable accuracy in solving the nonlinear model. In the meantime, it has better computing efficiency.
2.2. Excitation Configurations
Previous studies [16] have shown that over 80% of the total engine vibration emissions can be attributed to the dynamic response of cylinder liners to the two major excitation sources: combustion shock and piston slaps.
2.2.1. Combustion Shock
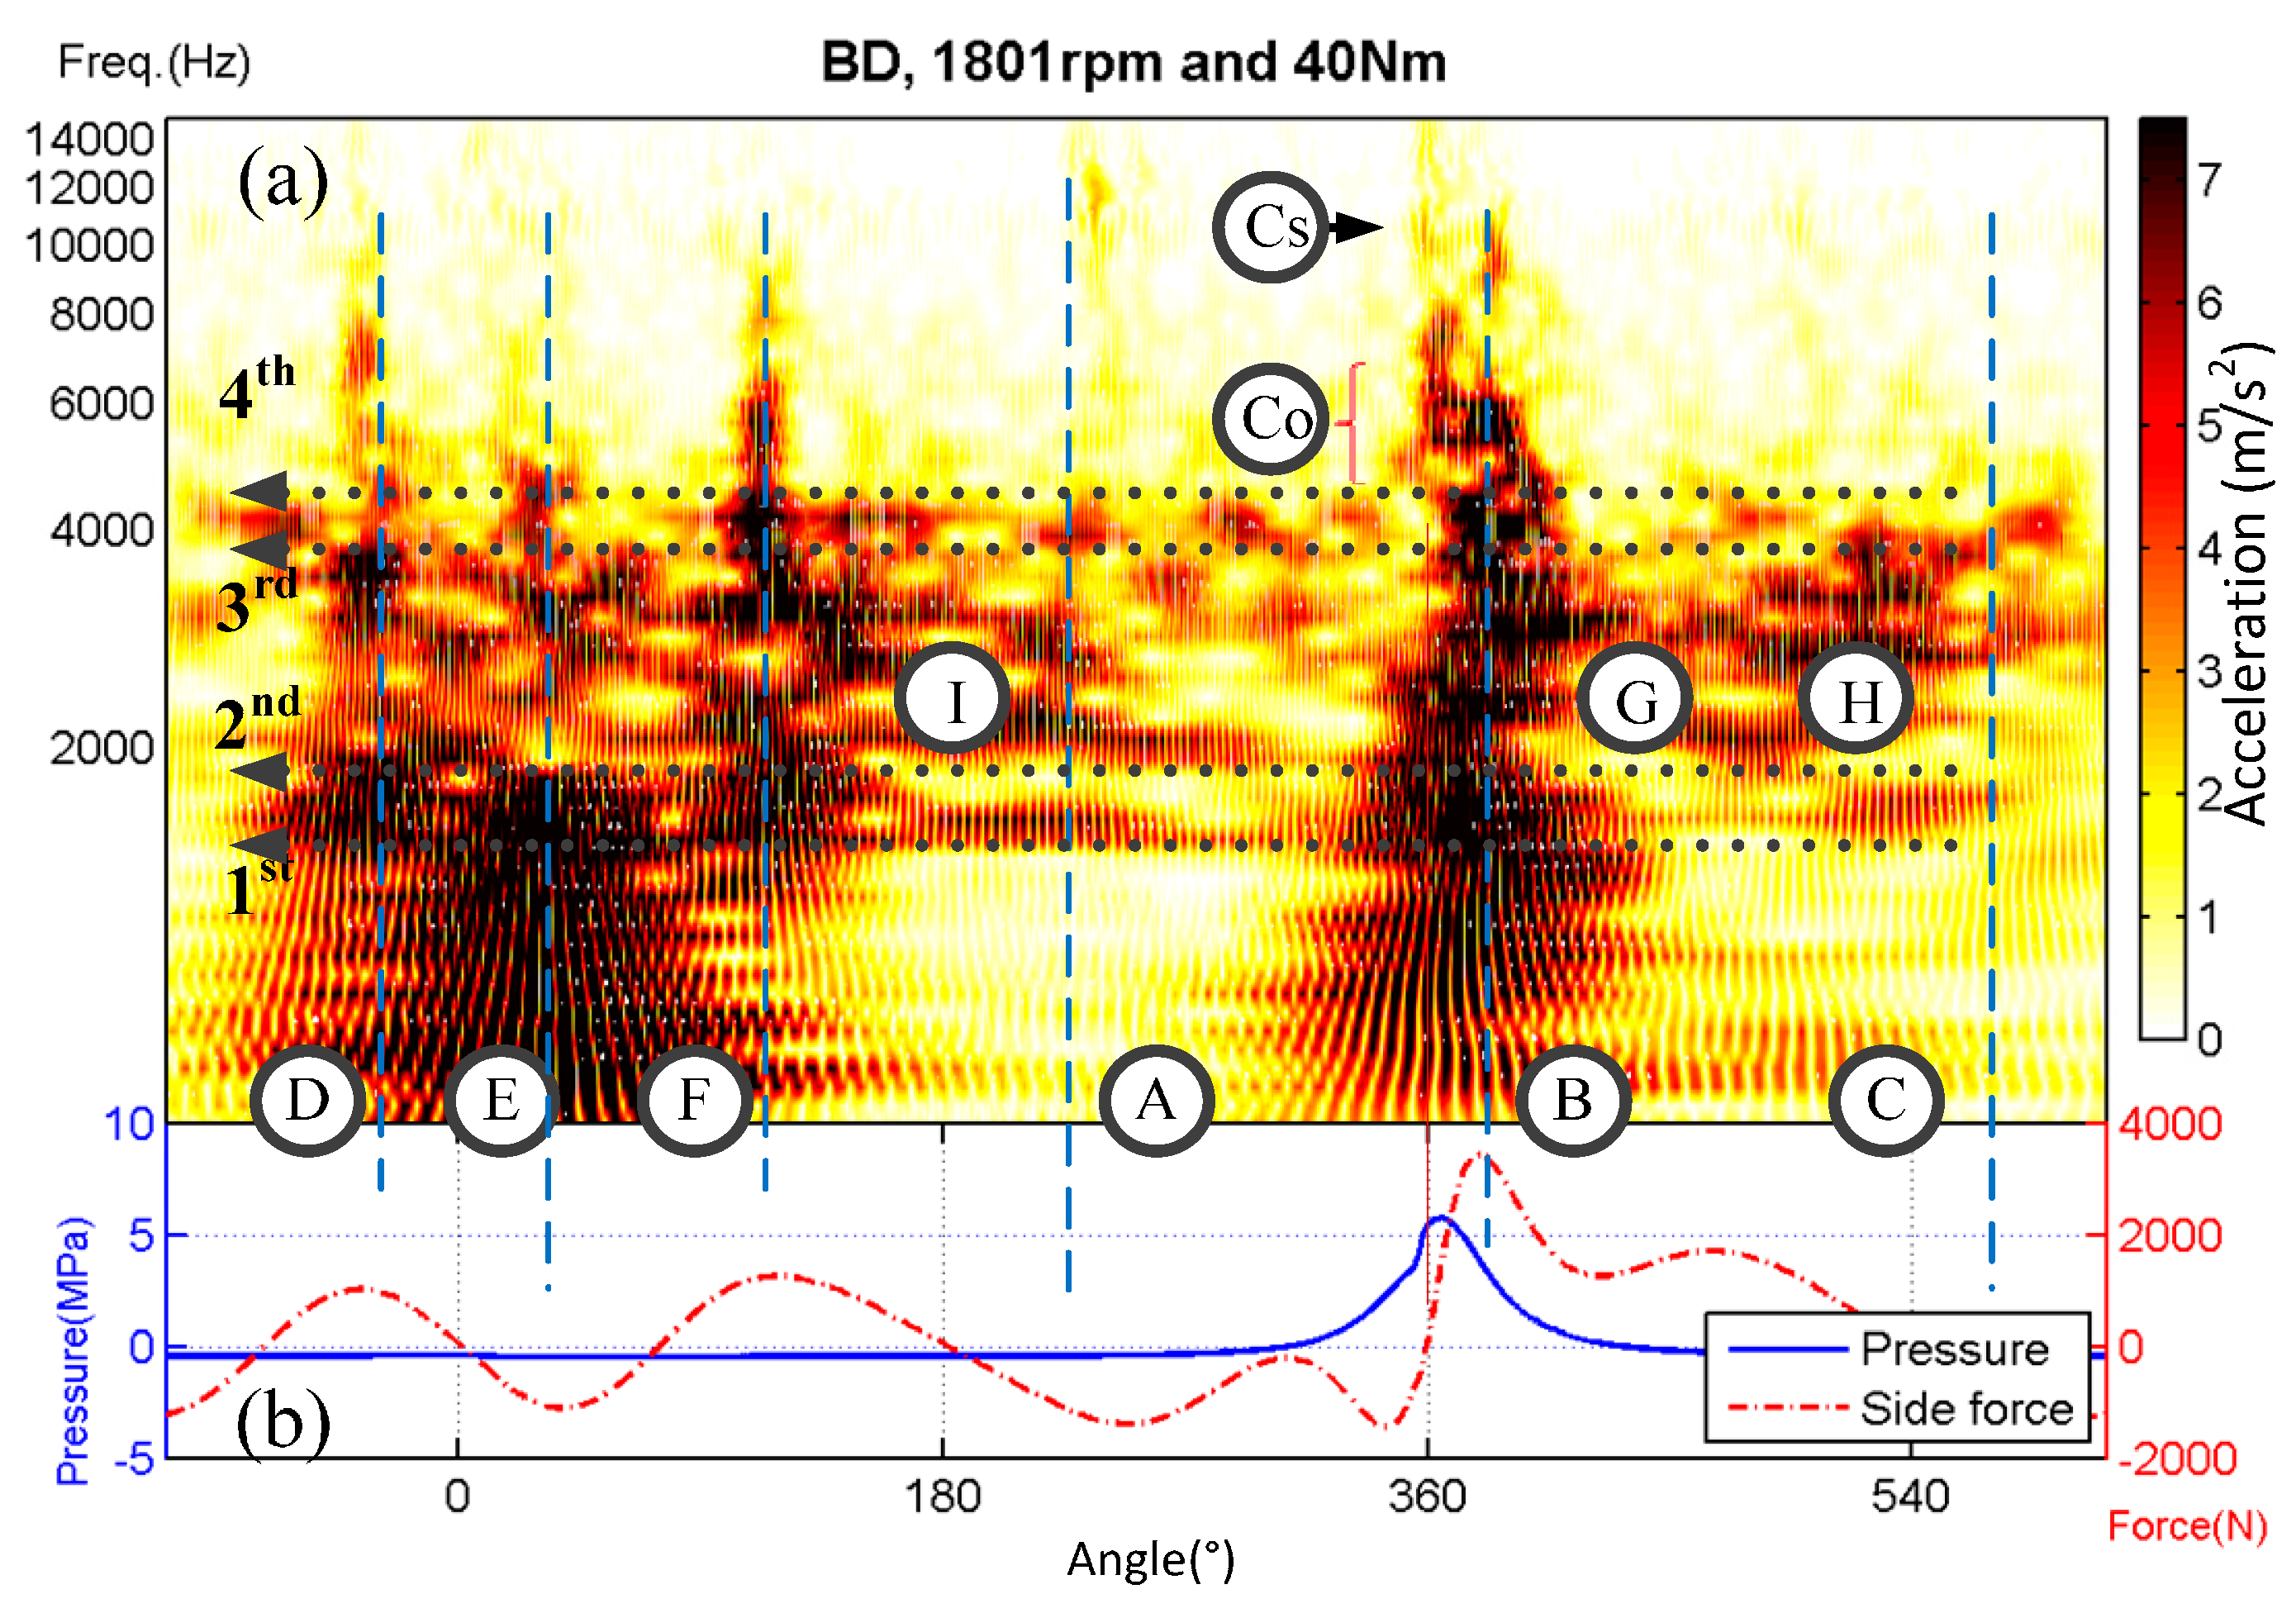
Combustion pressure and pressure rise rate will both achieve maximum values during the premixed combustion period. Unstable combustion can cause high frequency oscillations in the pressure profile. These pressure changes directly impact on the liner’s inner surface, creating combustion excitations. Figure 3a shows a short-time Fourier transform (STFT) result of the pressures measured in the cylinder at engine speed of 1800 rpm and load of 40 Nm, which clearly shows the combustion shock spreads a wide frequency range around TDC. For more clarification in understanding the STFT result, the raw pressure signal and the pressure rise rate (PRR) presented alongside of STFT in Figure 3b. In particular, the STFT result in Figure 3a shows a series of oscillations in the frequency range of 4000–8000 Hz during premixed combustion right after pressure peaks at a crank angle close to 360°, marked as Impact Co. It is unstable gas turbulences in the combustion chamber and the lack of homogeneity in combustion that causes these oscillations [17]. Simultaneously, as these gas oscillations fall in the modal frequency ranges, they also induce richer high frequency responses of cylinder liners.
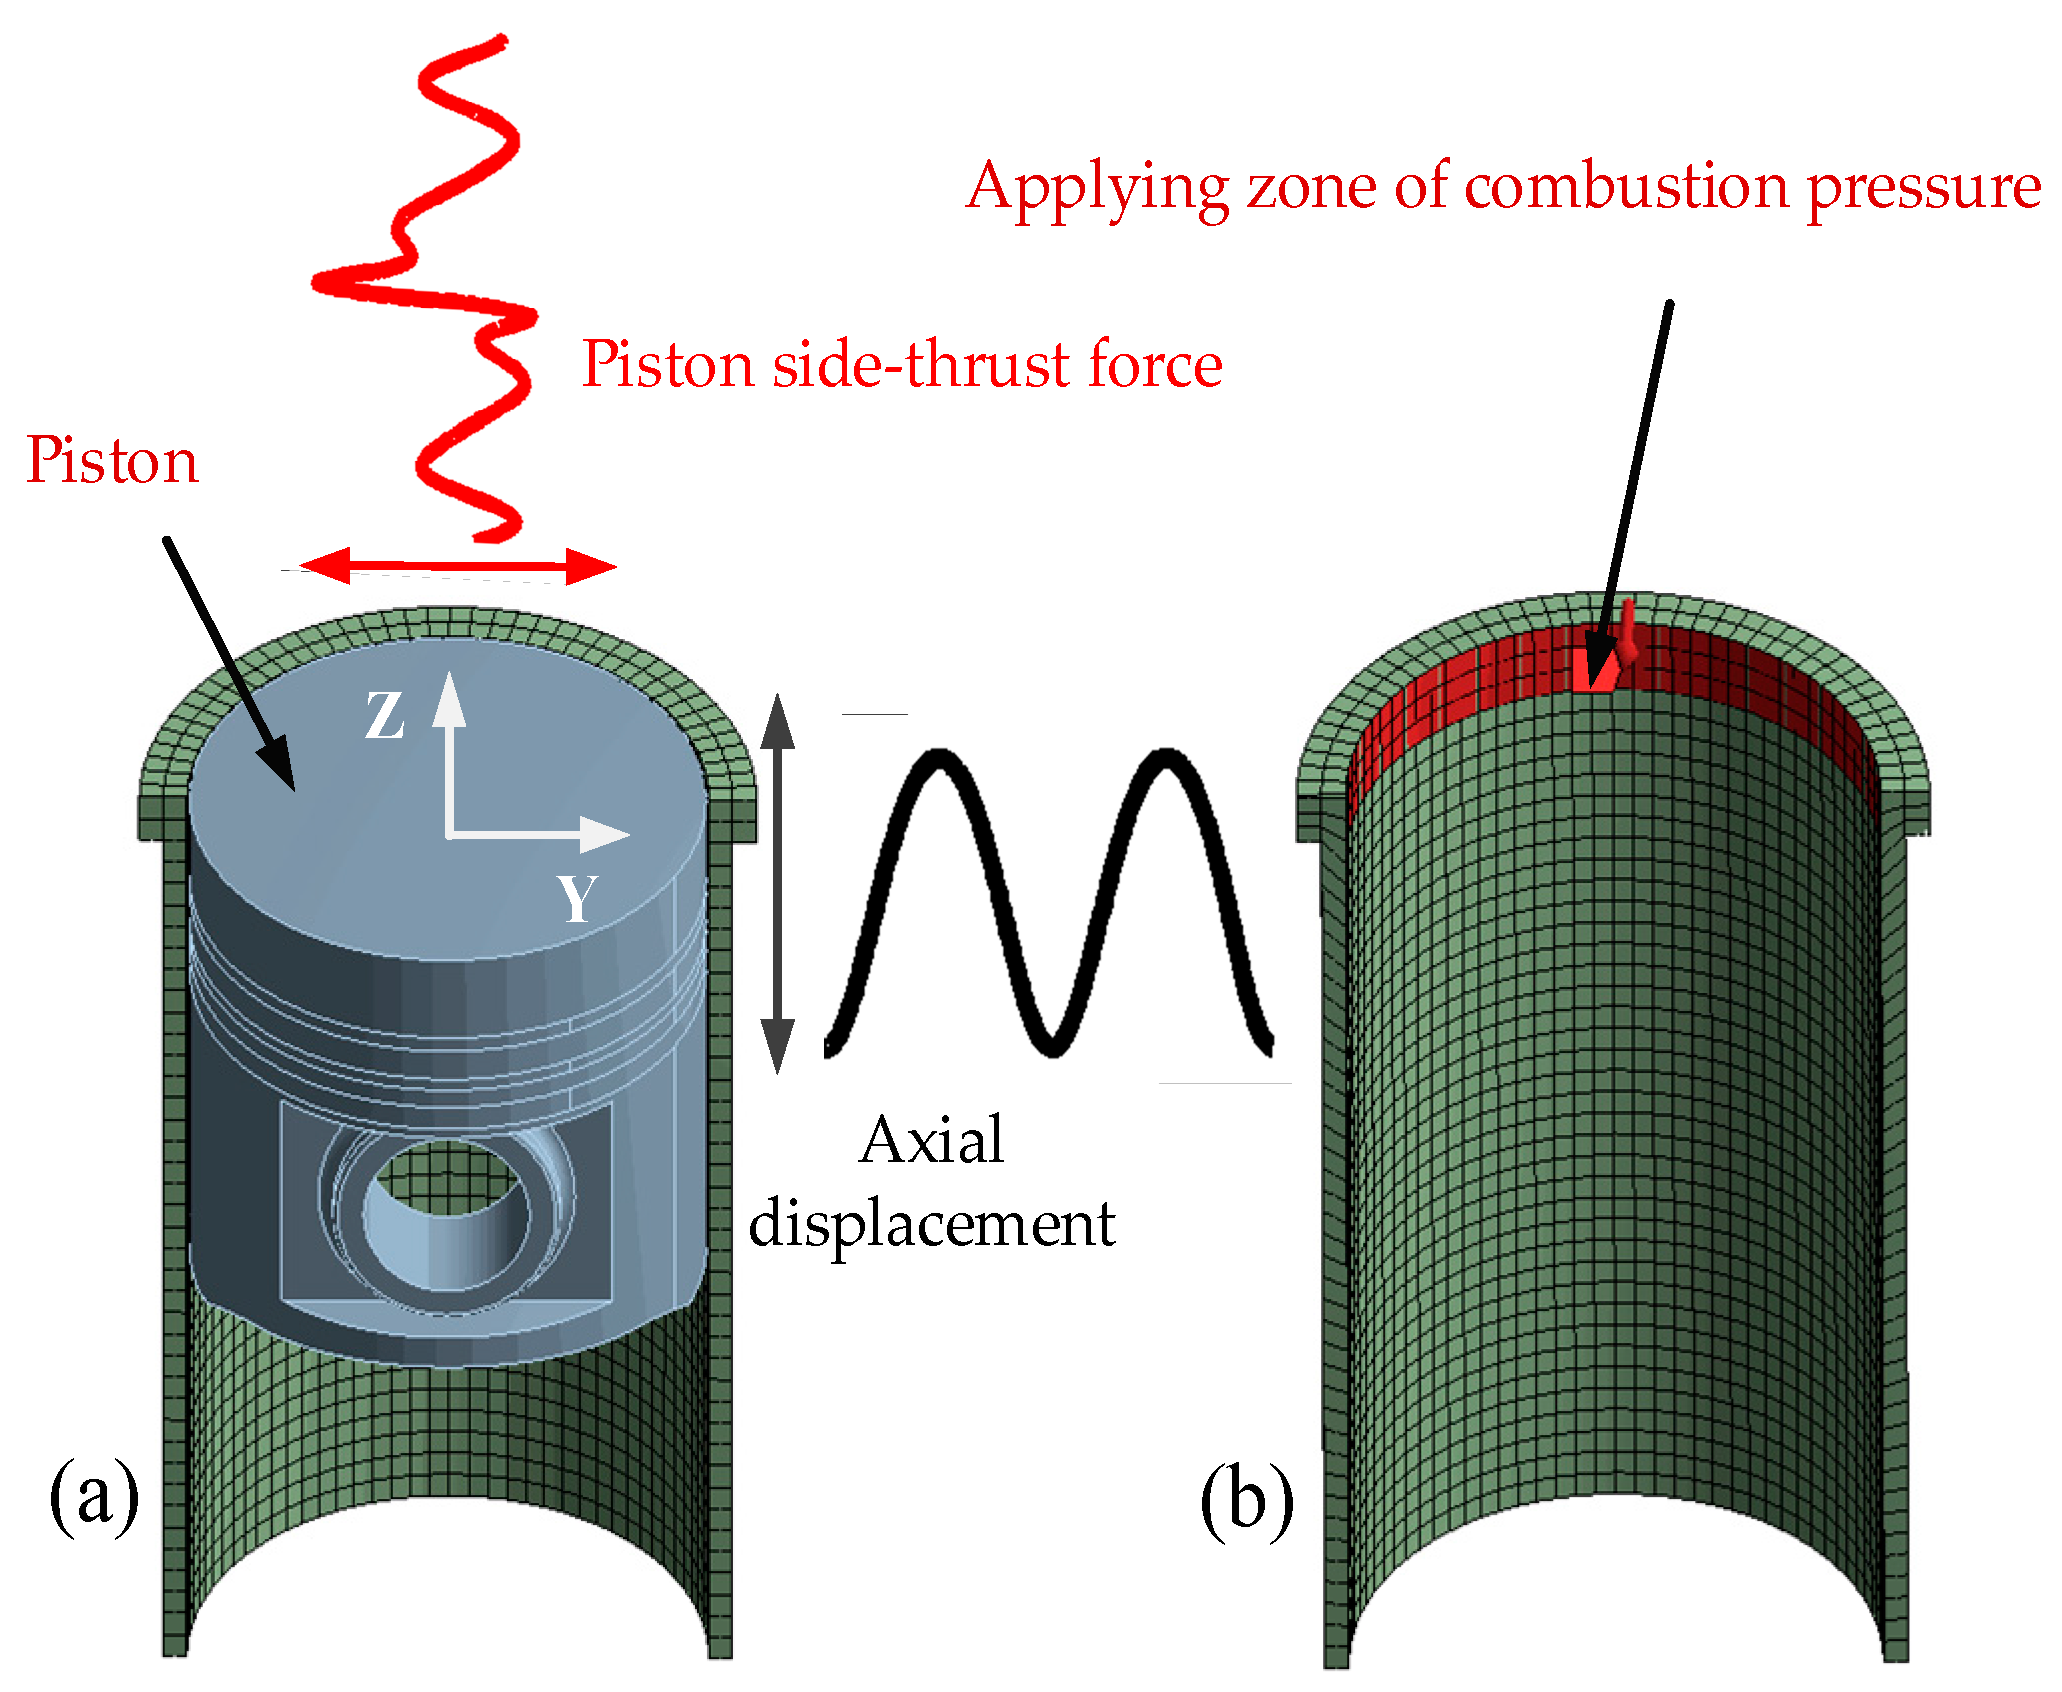
2.2.2. Piston Side Thrust
Driven by the combustion pressure Pc and inertial force Pi, the piston assembly moves laterally and impact the liner surface ceaselessly while it moves up and down longitudinally. Figure 4 shows the dependence of the side-thrust force Fy upon combustion and inertial forces. In addition because time-varying nature of these forces, the side-thrust force pushes the piston assembly away from one side to the other, slapping the cylinder liners intermittently [9].
For more accurate analysis, the piston side-thrust force can be calculated according to the kinematic connection, the specific expression for the longitudinal displacement of piston xp in terms of the crank angle ωt can be derived as [18]:
where λ = rc/l, rc is the crank radius and l is the length of the connecting rod. Furthermore, Equation (1) can be simplified into a first-term approximation form [9]:
The side-thrust force of the piston assembly toward the cylinder wall can be decomposed from the longitudinally acting combustion force Pc and the inertial force of the moving piston assembly (m1 is the equivalent mass of the piston assembly). Along with the periodically changing pendular angle of the connecting rod, the side-thrust force is also periodically changing, with a periodic term , which pushes the piston assembly to skip from one side to the other. Finally, the piston side-thrust force Fy can be calculated by [9]:
The crankshaft and connecting rod mechanism govern the longitudinal movement of piston assembly. The side-thrust force calculated in Equation (3) is the force driving lateral movement of the piston. Since the sliding friction between the piston and liner surfaces is less than 2% of the piston side-thrust force [9,19], the friction behaviors between the piston and liner surfaces are not considered in the model. The clearance between the matching surfaces was modelled with a frictionless contact pair to limit lateral movement of the piston. As shown in Figure 5a, the piston’s translational degree of freedom is perpendicular to the moving plane and is set as free in order to avoid over-constraint. The calculation is simplified by setting rotational degree of freedom (DOF) of the piston tilting motion as free, while ignoring all other rotational freedoms. In this way, the key motions of the piston are modelled closer to the reality.
Combustion excitation is represented by the in-cylinder pressure data collected from the pressure sensor mounted on the test engine. To accelerate the simulation process, sampling points were resampled to 1800, from 3600 points of raw cylinder pressure signal by polyphase implementation, to show the compression and power strokes. As shown in Figure 5b, the application zone for the combustion force was restricted to the top zone of the liner’s inner surface. The height of this zone is 15 mm, enough to simulate the areas of effective contact at the moment of combustion shock. The zone has a height of 15 mm, allowing it to simulate the effective contacting areas at the moment when the combustion shock occurs.
Prior to the formal dynamic simulation, the correctness and accuracy of the established FE model is verified based on an experimental modal analysis. The modal test was conducted to obtain the free-free modal responses of the studied liner. Subsequently, the accuracy of the established FE model is confirmed by comparing modal frequencies from the modal test with that of the FEA.
Table 2 shows a good agreement between simulated and measured modal frequencies, with an error (except for the first mode) of less than 3%. The material parameter configuration and the simplified geometric shape are thus shown to be appropriate to represent the cylinder liner’s dynamic response features below 10 kHz. It should be noted that during the modelling process, certain geometric details such as the grooves of sealing surfaces on the outer surface of the studied liner are neglected, which leads to slight decrease of the first mode frequency in simulation.
Numerical analysis for understanding vibration responses to the two main excitations is based on the established model when the input is either the force of in-cylinder combustion or the piston slap force. Figure 6 shows two representative responses with respect to the combustion shock and piston slap at a 370° crank angle under identical operating condition: 1800 rpm and 40 Nm.
As Figure 6a shows, most of the deformation caused by the combustion shock is in the liner’s top portion. The piston slap response, on the other hand, extended throughout the entire liner structure, as seen in Figure 6b. Removing translation movement and deformations resembling static deformations, allows extraction of information concerning the magnitude of local high-frequency deformations. The amplitude of combustion shock-induced response is predicted to be about 0.02 microns, which, being a lot less than the roughness of the lubricated surfaces, may be regarded as negligible for predicting lubrications between piston rings and liners, however, deformation caused by piston slaps can reach 0.1 micron, or roughly one fifth of the amplitude of roughness.
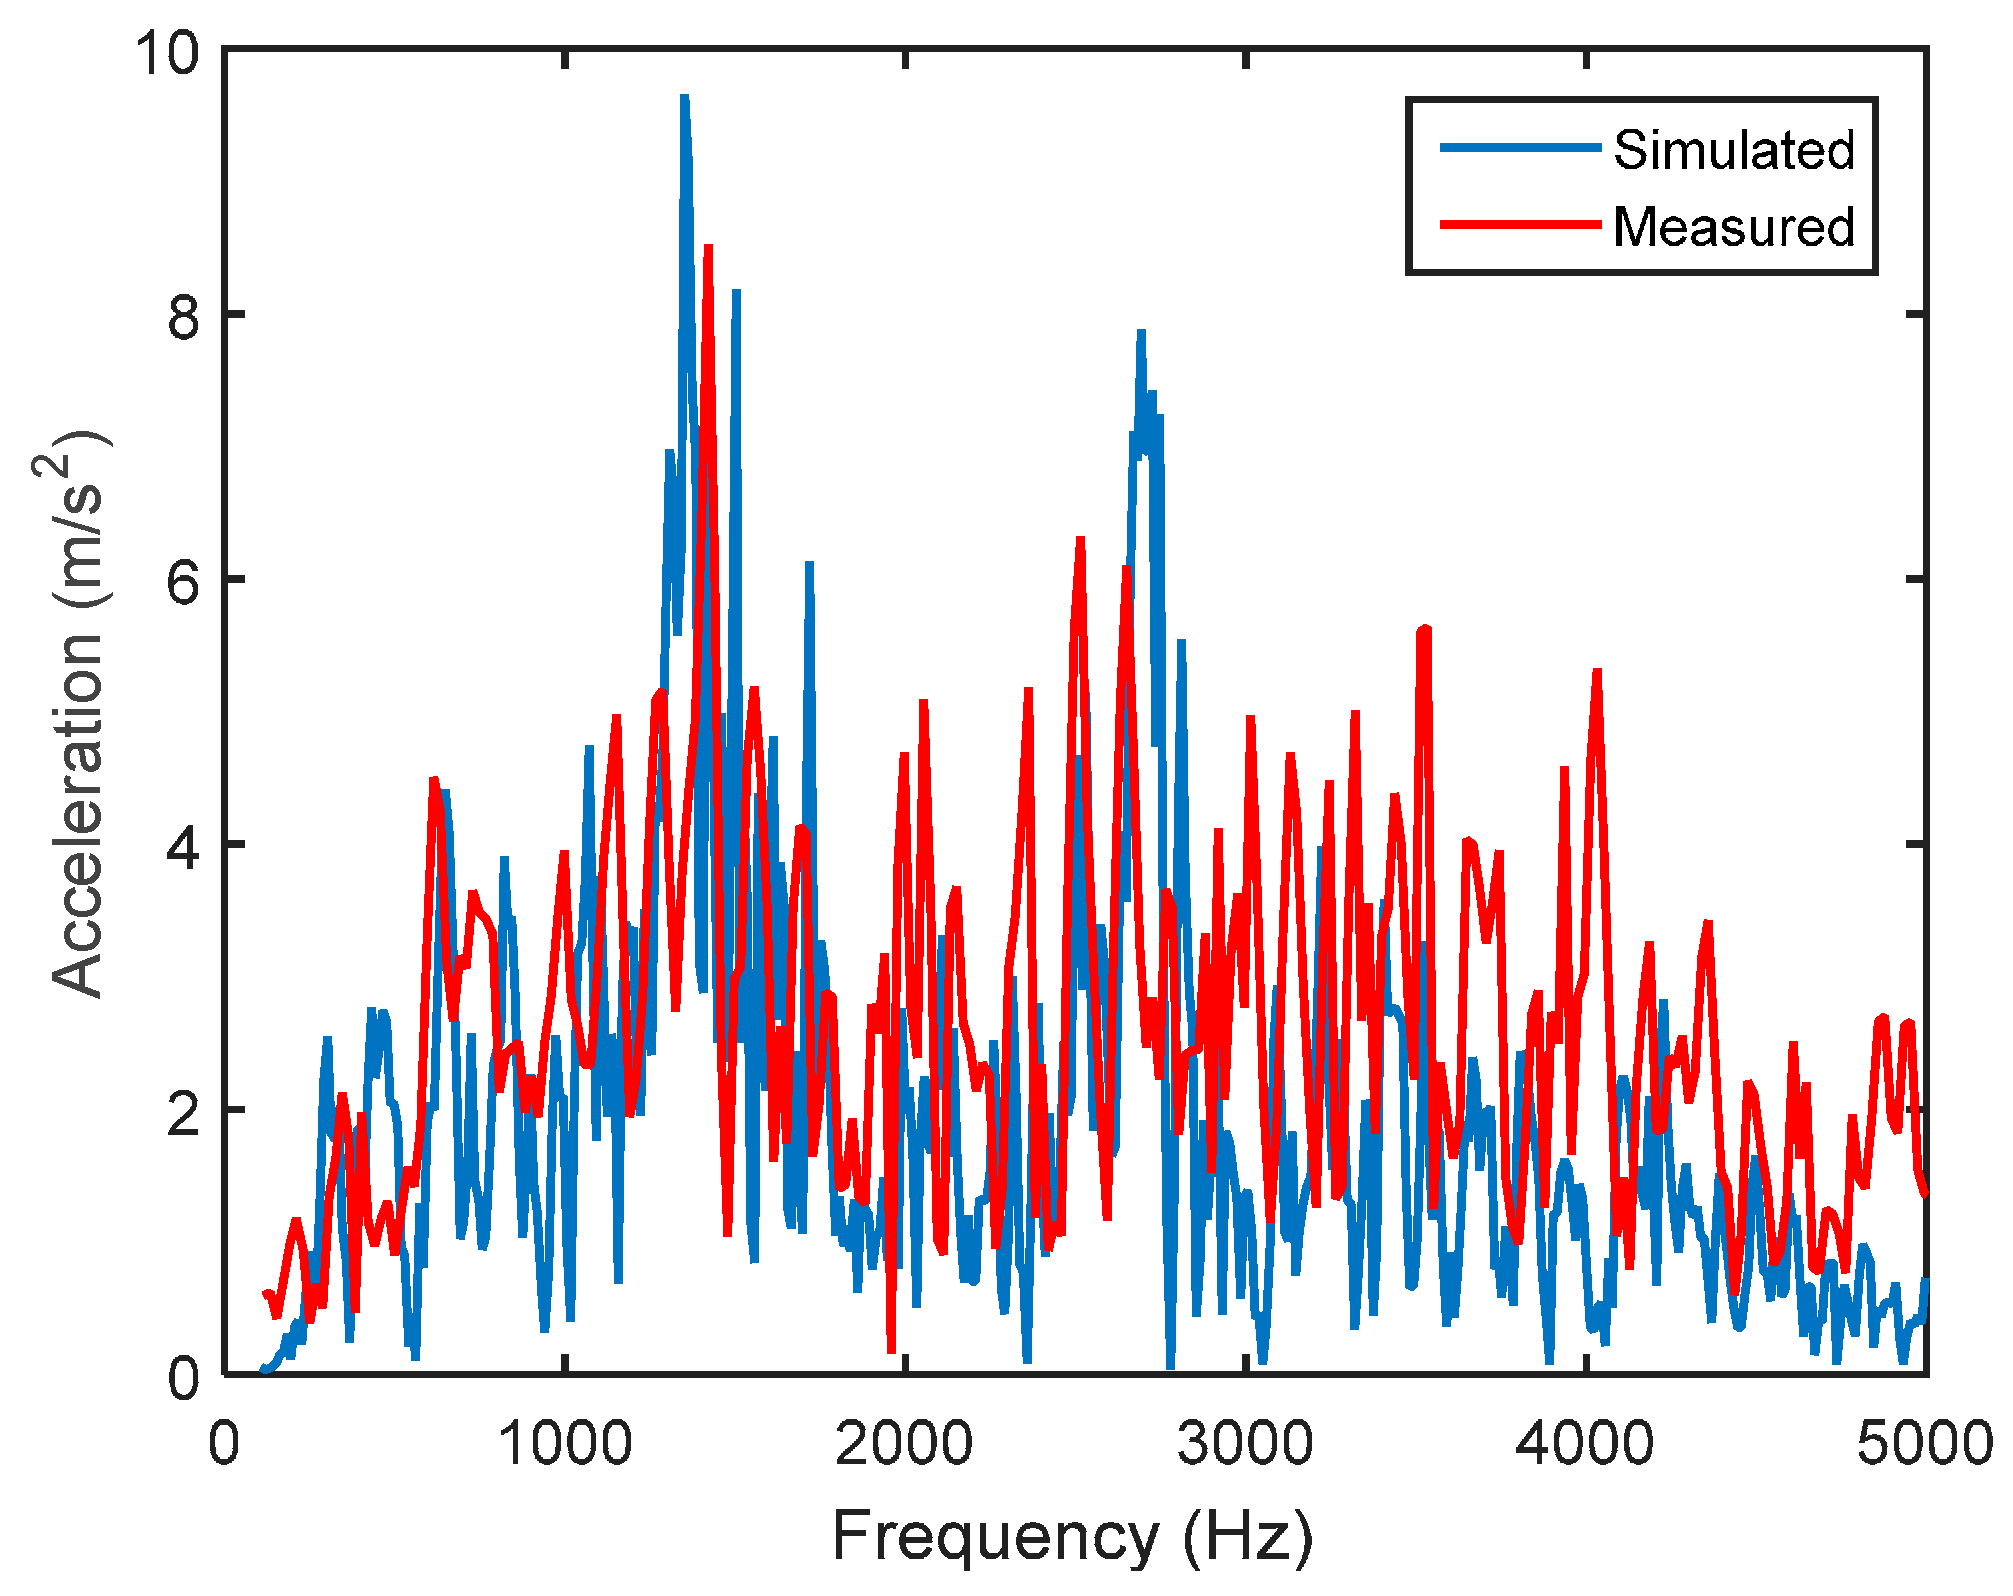
To further verify the rationality of the established model, the simulated and measured radial acceleration responses of a typical node on the anti-thrust side of the liner, corresponding to the measuring point in the following actual test, were examined. Figure 7 shows that the amplitude of simulated acceleration spectrum is close to the measured one in terms of significant peaks and frequency ranges. It is further shown that the established model can properly characterize the cylinder liner’s dynamic response features.
3. Numerical Analysis
3.1. Physicochemical Properties of Biodiesel
Biodiesel has promising lubricating properties and cetane number compared to low sulfur diesel fuels [19]. The lower heating value of biodiesel is about 37.4 MJ/kg, which is 9% lower than regular fossil diesel. Biodiesel has higher cetane values, resulting in better ignition. The higher cetane number a fuel possesses, the more easily the fuel can combust in a compression ignition engine. Faster premixed combustion can effectively shorten the ignition delay period, reducing the peak of pressure rise rate. Therefore, higher-cetane fuel is usually considered to cause an engine to run more smoothly and quietly. The basic physical and chemical properties of biodiesel and standard diesel are shown in Table 3.
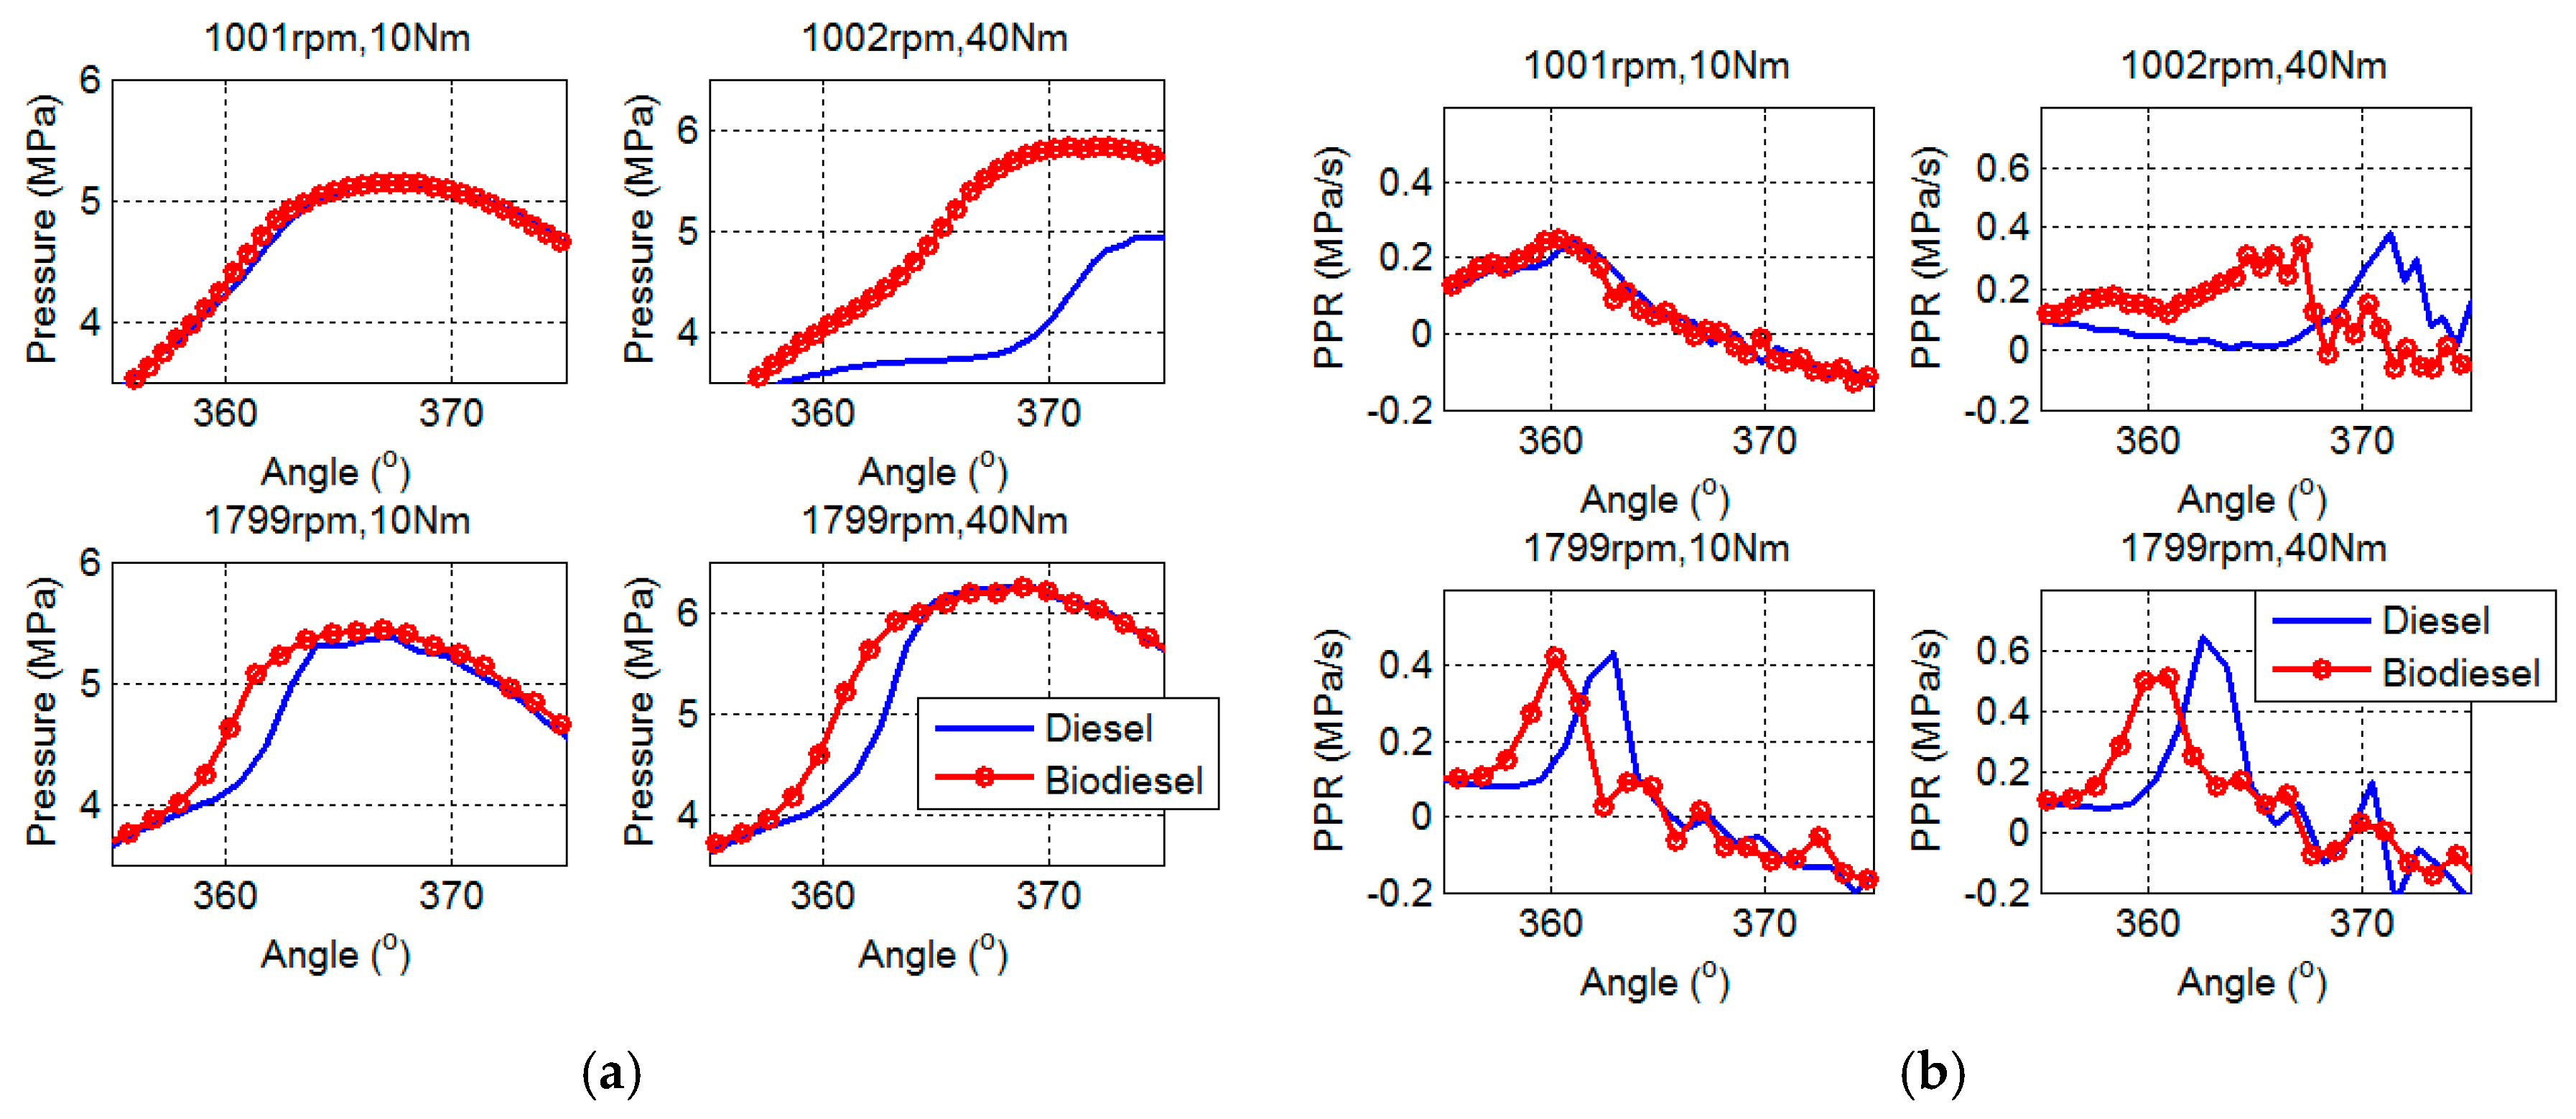
In this study, pure biodiesel and pure fossil diesel were prepared and used as the basis for investigating the influences of alternative fuels. The biodiesel was produced from waste cooking oil based on ASTM D6751-09 standard [20]. The in-cylinder combustion pressures of two kinds of fuels at four different operating conditions were acquired from a single-cylinder diesel engine. The measured pressure curves and calculated pressure rise rates are presented in Figure 8.
Compared with fossil diesel, biodiesel always shows a pre-ignition phenomenon in different operating conditions, as seen in Figure 8. A higher cetane number of biodiesel means faster in-cylinder burning velocity. The faster the premixed combustion, the shorter the ignition delay period and the lower the peak of pressure rise rate. This also explains why biodiesel possesses a lower magnitude in the peak of pressure rise rate than the others.
In the operating condition of 1000 rpm engine speed and 40 Nm torque output, both fuels exhibit substantial delays in the peak of combustion pressure. With the engine load going up, the increased fuel delivery per cycle will significantly enhance the heat release of the premixed combustion phase, and enlarge the in-cylinder pressure. In the meantime, the increased proportion of premixed combustion can cause phase delay in the whole combustion process, resulting in the appearance of a significantly delayed pressure peak.
As mentioned above, the periodically changing side-thrust force can be decomposed from the longitudinally acting combustion force and inertial force of the moving piston assembly. Therefore, the lateral driving force of the piston that is applied to the cylinder liner is bound to be affected by variations in the combustion force, determined by the combustion characteristics of different fuels.
The influence of differences in fuel types on the piston side-thrust force mainly manifests clear differences in its peak value and associated phase. Under low speed conditions, the peak value of the side-thrust force after combustion top dead center (TDC) burning with biodiesel is lower than that with diesel, as seen in Figure 9a,b, which might be attributed to the lower pressure peaks. In the high-speed condition of 1800 rpm and 10 Nm, the peak value of biodiesel is slightly larger than that of diesel. Under high-speed conditions, the peak values of side force burning with biodiesel are close to those of diesel. This is because biodiesel has lower energy content than diesel fuel. Therefore, more fuel is injected into the combustion chamber to obtain the same amount of power as that of the diesel-fueled engine, resulting in a longer period of high-pressure in-cylinder state, i.e., prolonged mixing-controlled combustion phase. A prolonged mixing-controlled combustion phase can lead to a separation between the peaks of the combustion force and the longitudinal inertia force of piston assembly. The combustion force acting on the piston head is not completely cancelled, thereby resulting in a greater lateral force around the crank angle of 380°.
Due to the compound effect between the combustion force and inertia force, the peaks of piston side-thrust force appear around the crank angle of 380–385°, which shows that there is a large deviation between the peaks of side-thrust force and pressure. Therefore, to understand the cause of changes in piston side-thrust forces fueled with biodiesel relative to fossil diesel, it is essential to contrast and analyze the amplitude of in-cylinder pressure from the crank angle of 375° to 385°.
As seen in Figure 10a, the amplitudes of in-cylinder pressure burning with biodiesel and diesel are consistent with the peak value of side thrust forces under all four operating conditions in Figure 9, suggesting that the peak value of piston side-thrust force depends more on the amplitude of pressure during mixing-controlled combustion period around 380–385°, rather than the amplitude of peak pressure or pressure rise rate. The amplitude of combustion pressure at the initial stage of mixing-controlled combustion period is jointly determined by the cetane number and the heating value of fuel types. The advanced ignition phase, caused by the higher cetane number of biodiesel, results in a lower amplitude of in-cylinder pressure burning with biodiesel during the initial stage of mixing-controlled combustion period than diesel. Under high-speed conditions, the combustion-supporting characteristic of the high oxygen fraction in biodiesel improves the combustion process, thus leading to a combustion pressure close to, or even above, the pressure of diesel.
The peak values of force rise rates show a high similarity to the rise rates of in-cylinder pressure, as shown in Figure 10b. This may be because the changing trend of inertia force is relatively gentle; the rise rate of in-cylinder pressure is more likely to dominate the changes of piston side-thrust force. In addition, these differences in the force rise rate may cause significant changes in the lateral displacement and velocity of piston assembly before the collision, thus affecting the impact process and its subsequent vibrational responses. The similarity between the rise rates of piston side-thrust force and in-cylinder pressure indicates that the high cetane number is the most critical factor affecting the piston lateral movement and cylinder dynamics.
For a better understanding of the differences in the dynamic responses to combustion shocks and piston slaps, the radial displacement responses of a node on the anti-thrust side of the liner, corresponding to the measuring point in the actual test, are examined in subsequent sections.
3.2. Dynamic Responses to Combustion Forces
Figure 11 shows the predicted liner responses to a measured combustion force burning standard diesel fuel at a working condition of 1800 rpm speed and 40 Nm torque. The predicted displacement response in Figure 11b shows a profile close to the curve of combustion pressure; significant responses cluster near combustion top dead center. In addition to the quasi-static response, a series of high-frequency responses appeared at combustion TDC and sustained for a relatively long duration, which are more obvious in the predicted acceleration responses. After combustion TDC, Figure 11a shows a noticeable dynamic response in the frequency range from 5000 to 8000 Hz; it is marked as Impact Co. Given the high similarity between the predicted dynamic response and oscillations in combustion pressure observable in Figure 3a in the frequency location and the attenuation pattern, it is clear that this event is primarily a forced response caused by high frequency oscillations of in-cylinder pressure.
It can be clearly seen that a series of oscillating components appear at about 365° and in the frequency band of 8000–12,000 Hz, marked as Impact Cs. As there are no such frequency contents in the pressure profile and the oscillation sustains for a long period, which exists even when the input pressure is very low, it is regarded as the modal responses of the liner. Further examination places the frequency band at 8559 to 10,012 Hz, corresponding to the range of the 8th–12th modes identified by modal experiment, as shown in Table 2.
Simulation results show that the liner structure’s high-frequency modal responses can be activated by the in-cylinder combustion shock, which are attributed to the rapid rise rate of pressure during the premixed combustion period. After high-pass filtering, the amplitude of local deformation was calculated. As operating speed and load increase from 1000 rpm/10 Nm to 1800 rpm/40 Nm, the deformation magnitude of the measuring node rises from 0.004 to 0.015 microns. The combustion shock-induced deformation may be negligible to affect lubrications, because its amplitude is less than 3% of the surface roughness amplitude.
Predicted dynamic responses to combustion force measured from the test engine burning biodiesel under the same operating condition of 1800 rpm speed and 40 Nm torque are shown in Figure 12. Basically, the response patterns of biodiesel are similar to those of diesel.
As Figure 12 shows, the modal responses of biodiesel sustain longer than those of diesel, which can be attributed to the longer duration of mixed-controlled combustion period. Because of the lower calorific value of biodiesel, a much larger amount of fuel delivery needed to be injected into the combustion chamber in order to output the same mechanical power, thereby resulting in a longer combustion duration.
3.3. Dynamic Responses to Piston Slaps
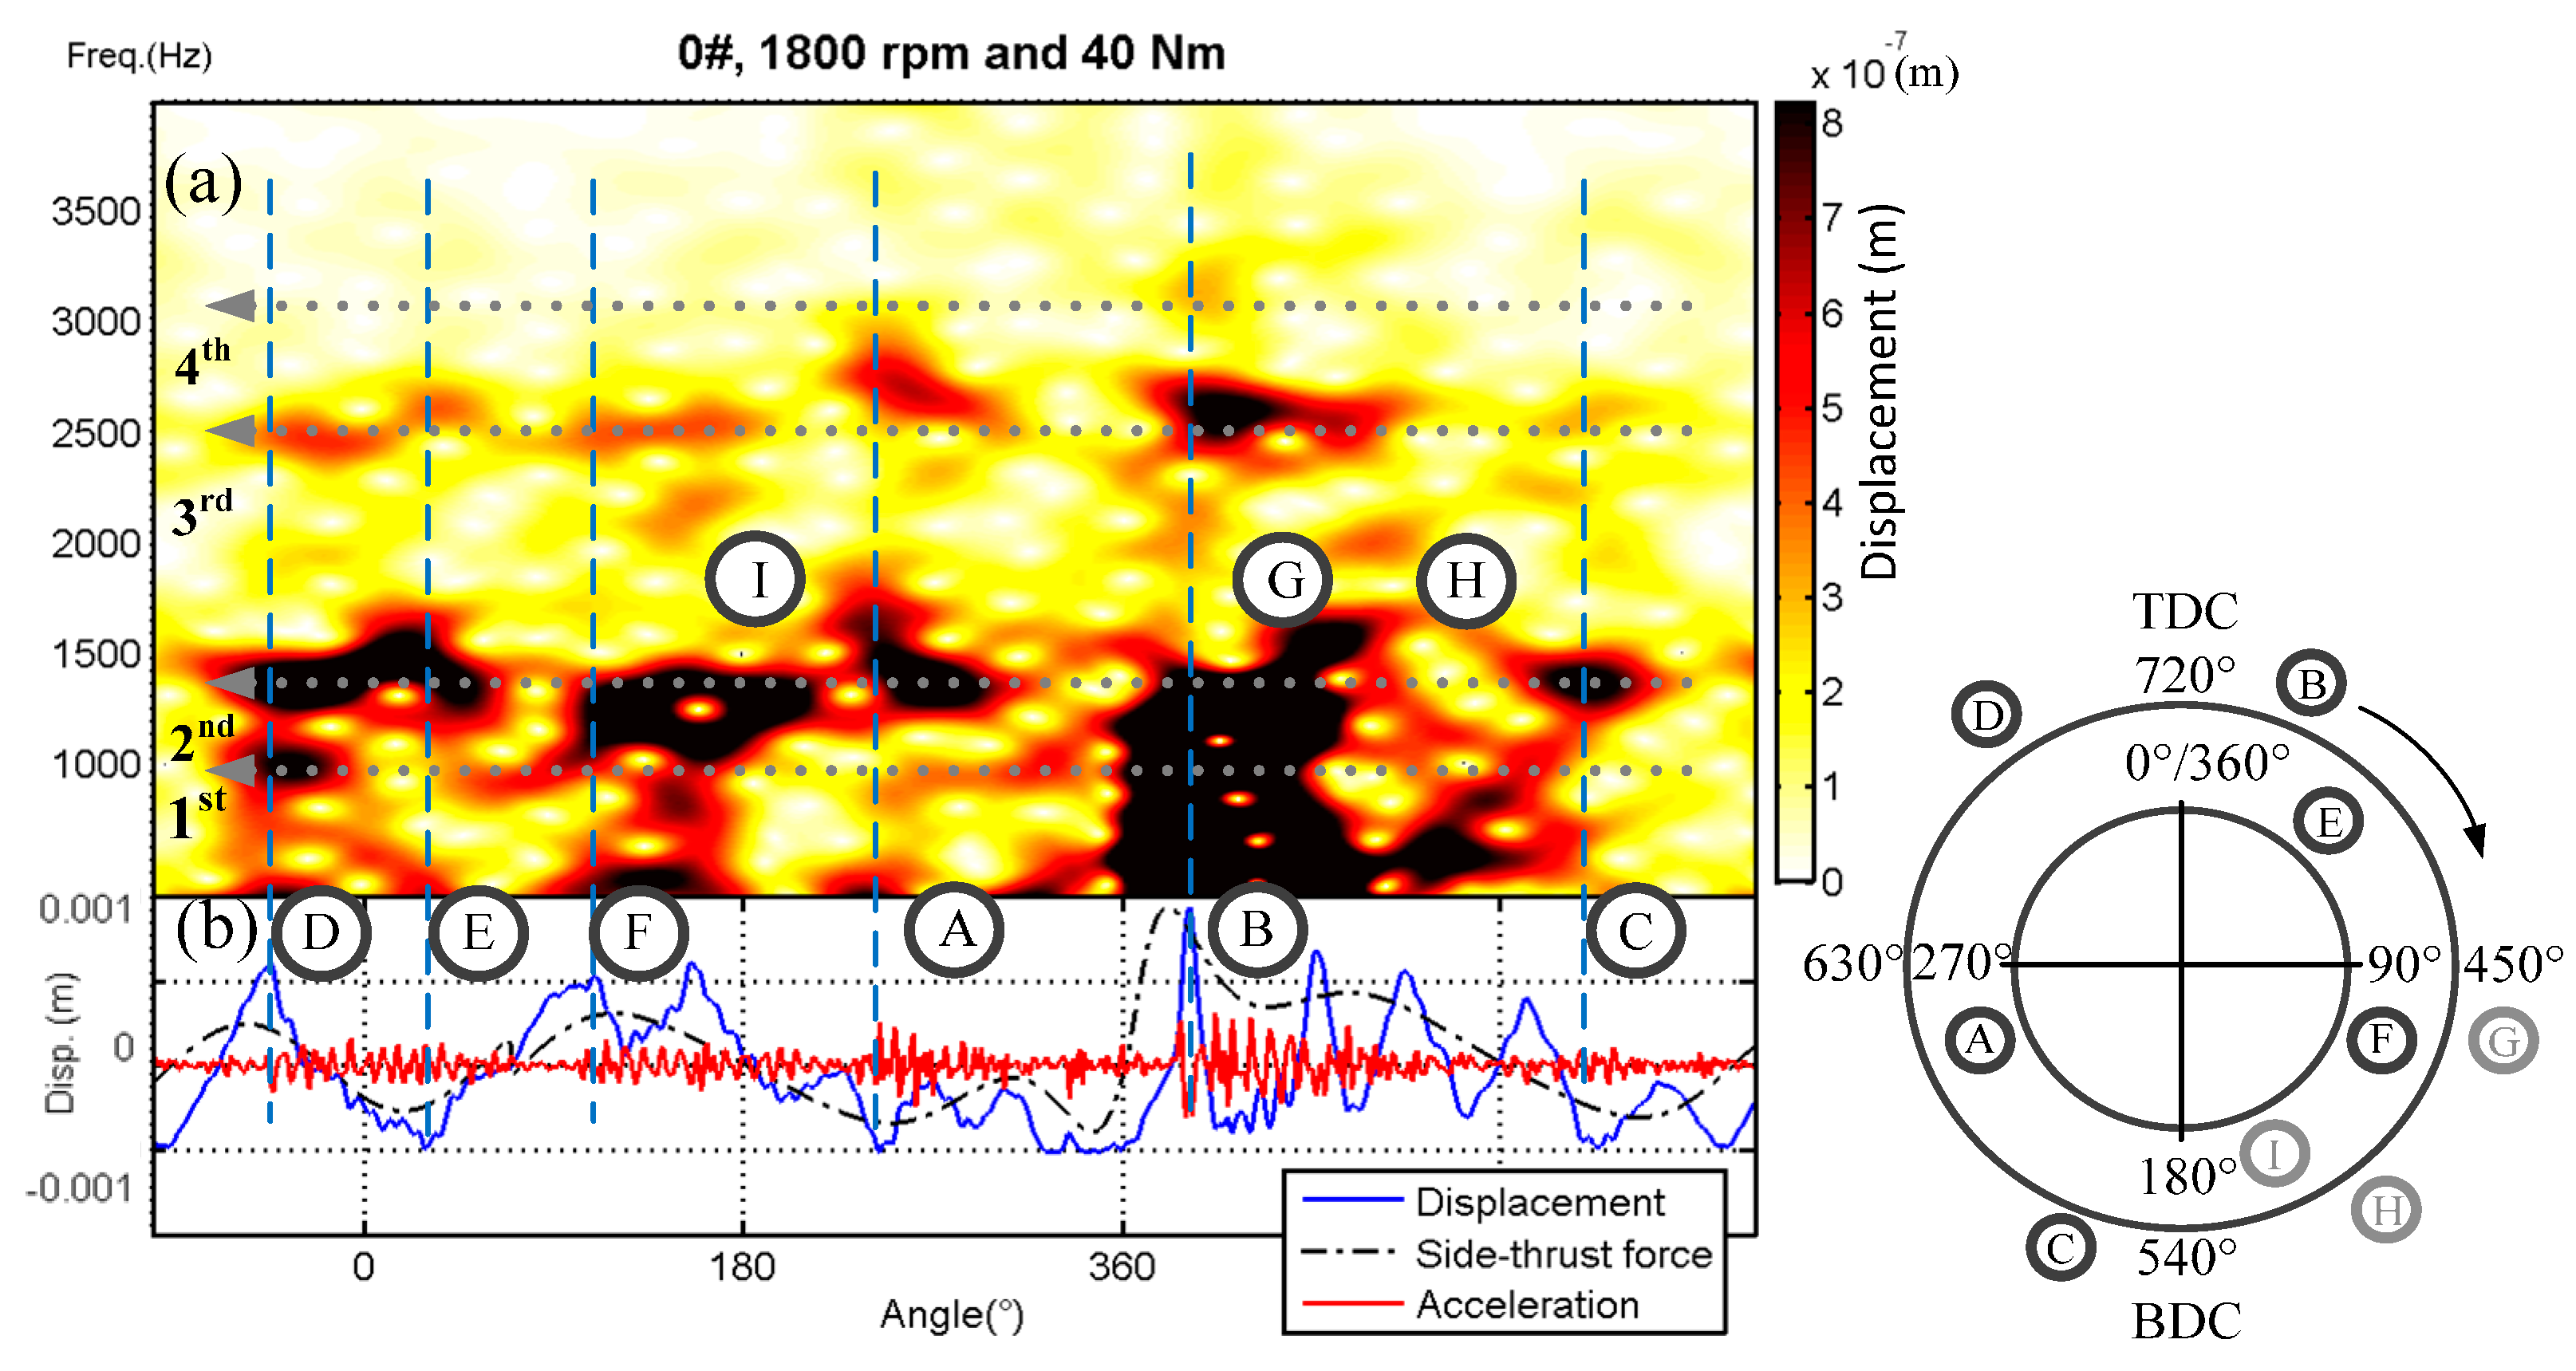
In the case of the piston side slaps being considered alone, the dynamic response of the liner measured from the same sampling point shows more complex and abundant patterns, as seen in Figure 13a, under the operating condition of 1800 rpm and 40 Nm. In Figure 13a, it is possible to identify six separate and transient responses to highs and troughs of piston side-thrust force, and these are marked Impact A to Impact F. For the most part, these responses are in the frequency band relating to the first three modes, and that is particularly so for responses to slaps away from combustion.
Three other dynamic events are also observable in Figure 13a, and these are marked as Impact G, H and I. These events arise from secondary impacts caused by sustained high-amplitude side-thrust force, rather than by any particular force peak or trough, indicating that a sustained high-amplitude side-thrust force might cause additional impacts.
The frequency range between 500 and 3000 Hz has been chosen by earlier studies [9,10,21,22,23] to identify and analyze the piston slap-induced events. As Figure 13 shows, there is probably some truth to this, which may stem from mode characteristics inherent in liner structures. As this study shows, piston slap-induced dynamic responses occur for the most part in the 600–3500 Hz range, near the first four modes’ frequency band, suggesting that the way cylinder liners respond dynamically may depend on their structural modes to a high degree.
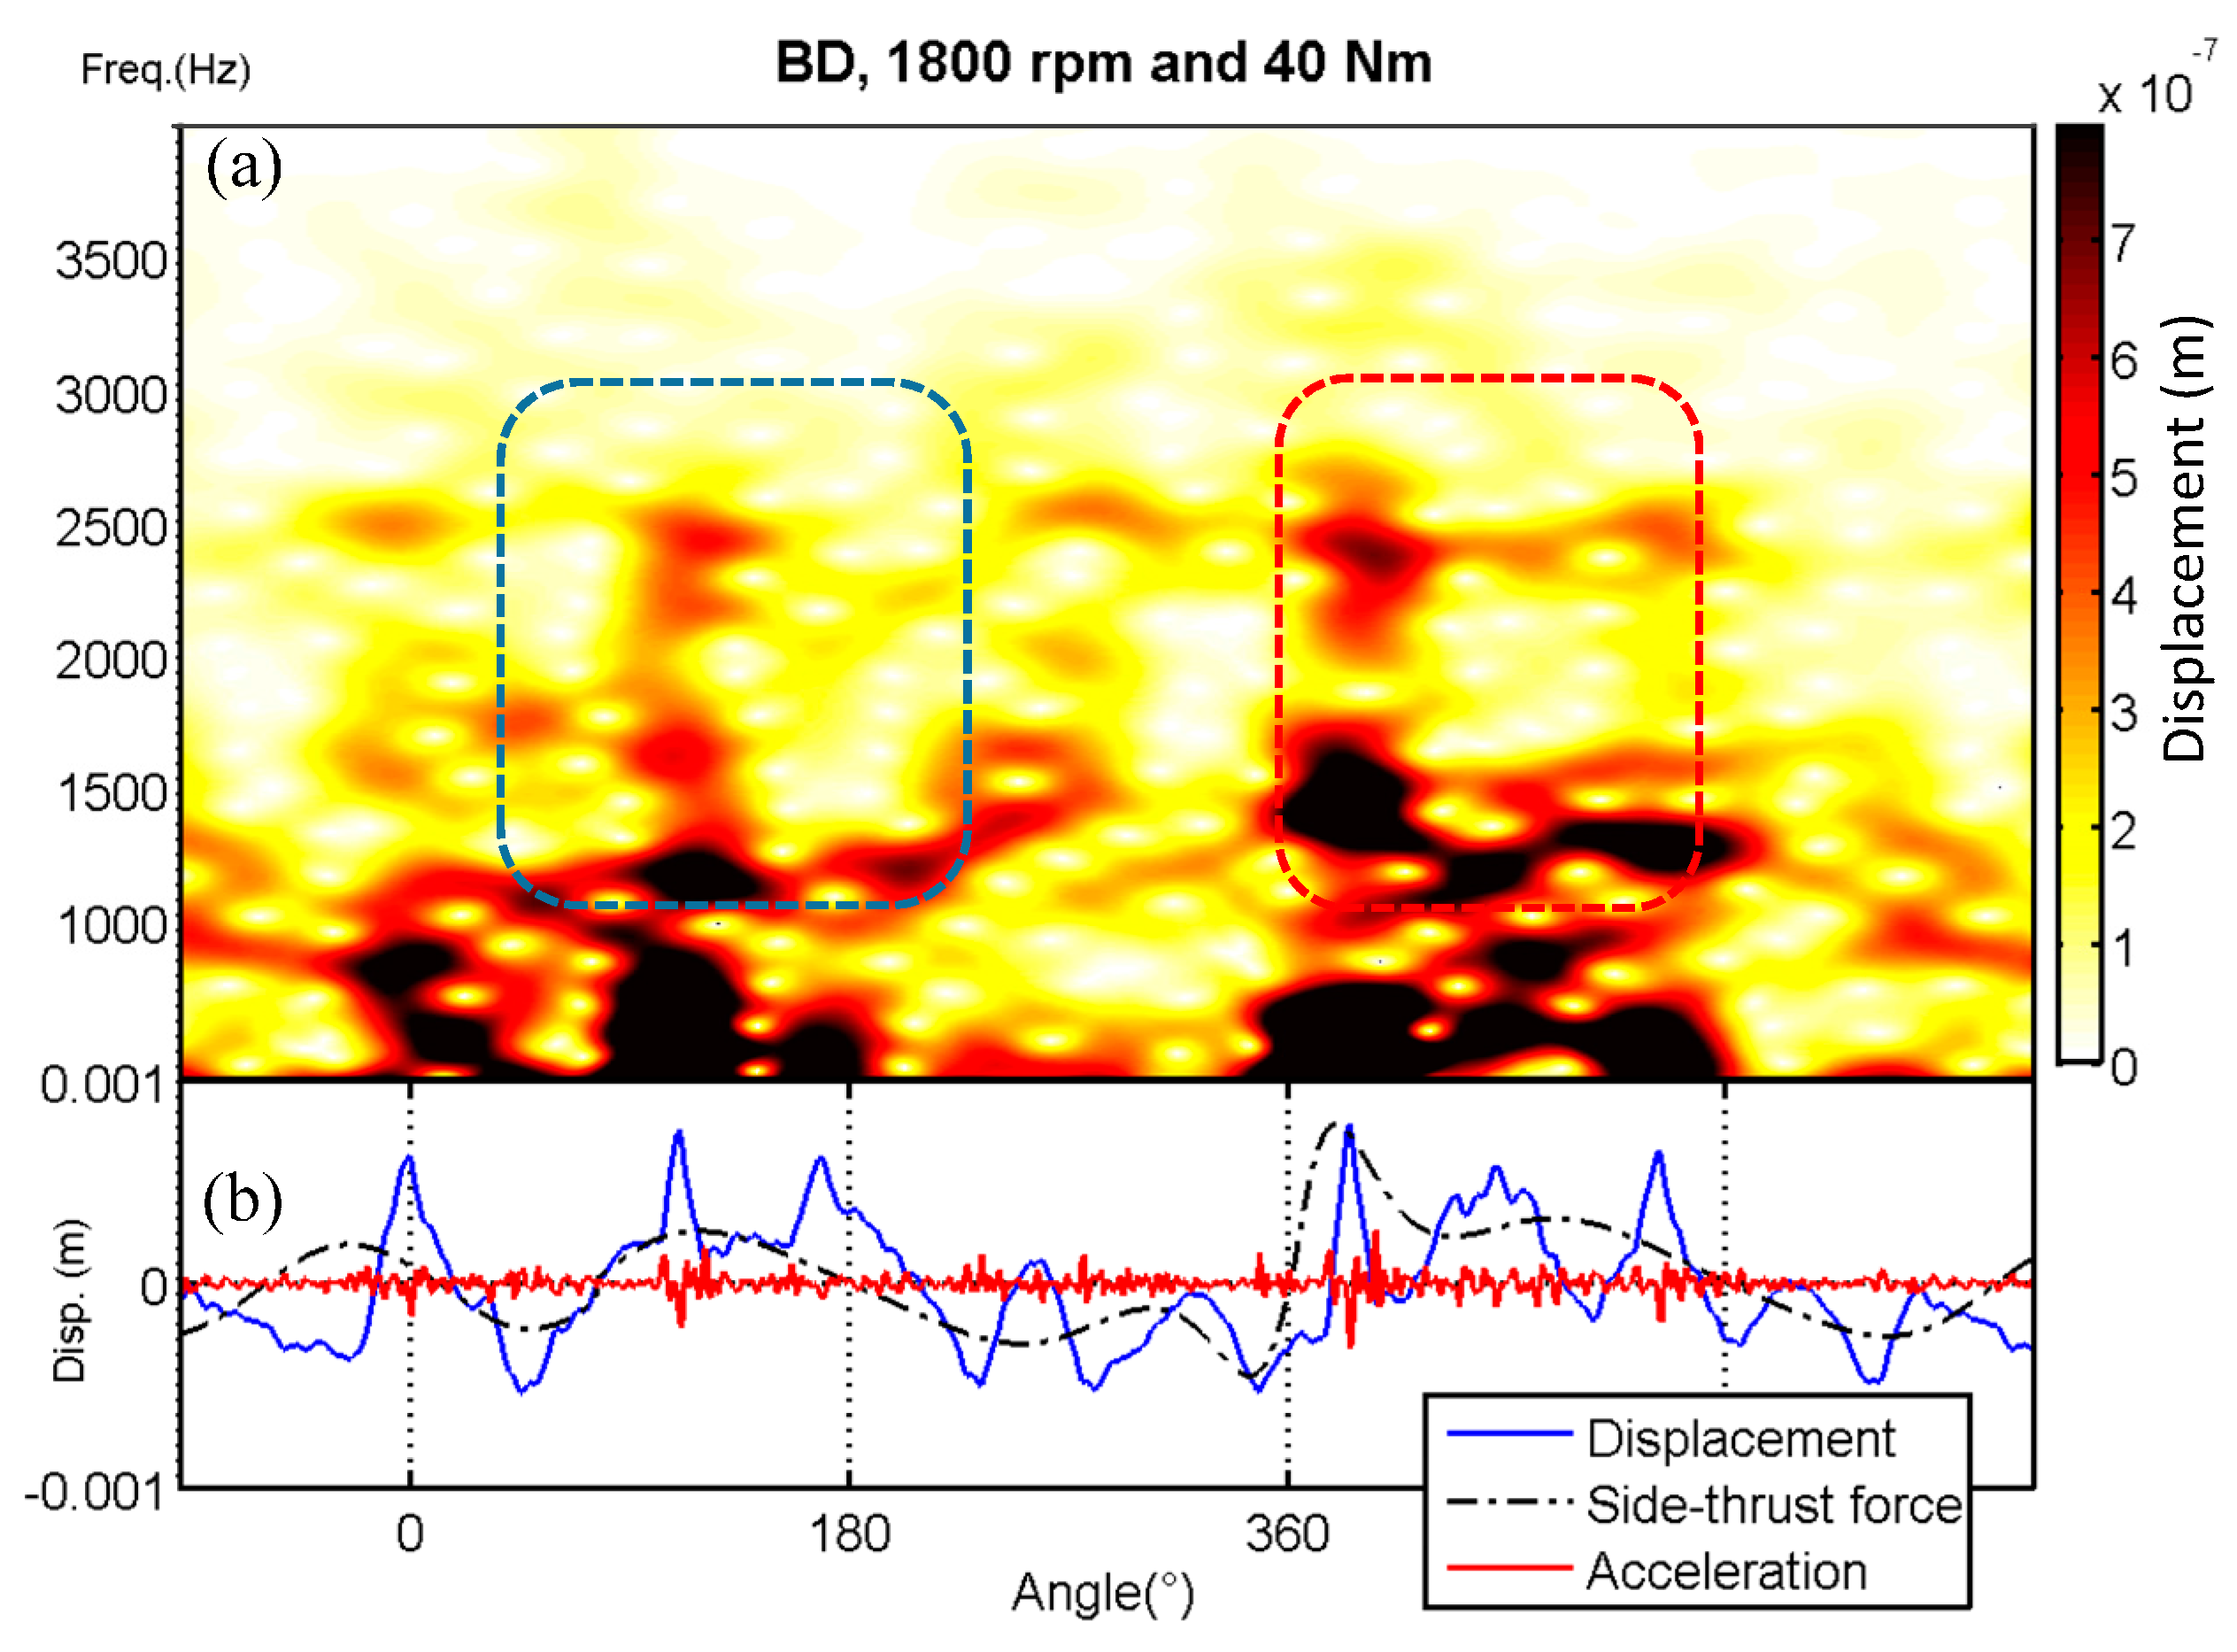
In the case of the piston lateral slap being considered alone, the dynamic responses of the liner burning biodiesel show a similar pattern in STFT results to that of diesel, under the same operating condition of 1800 rpm and 40 Nm. As can be seen in Figure 14a, the overall energy distribution of slap-induced responses fueled with biodiesel is significantly reduced compared to that of diesel in Figure 13a. This shows that the piston movement driven by the smoother combustion excites fewer mode components in low frequency ranges.
It should be noted that distinguishable differences in the local response features between the two fuels can be clearly observed around the combustion TDC and exhaust TDC, marked with red and blue rectangles in Figure 14. The STFT result of biodiesel shows much more localized dynamic responses about the exhaust TDC compared with those of diesel. Conversely, the diesel presents more intense dynamic responses around the combustion TDC than the biodiesel. These complex and even reverse trends of local features can hardly be interpreted using the differences in the physical and chemical properties of fuel types. Therefore, it is necessary to perform some contrastive and diagnostic analyses on these features under different operating conditions to understand the generating mechanisms behind them in depth.
3.4. Diagnostic Analysis
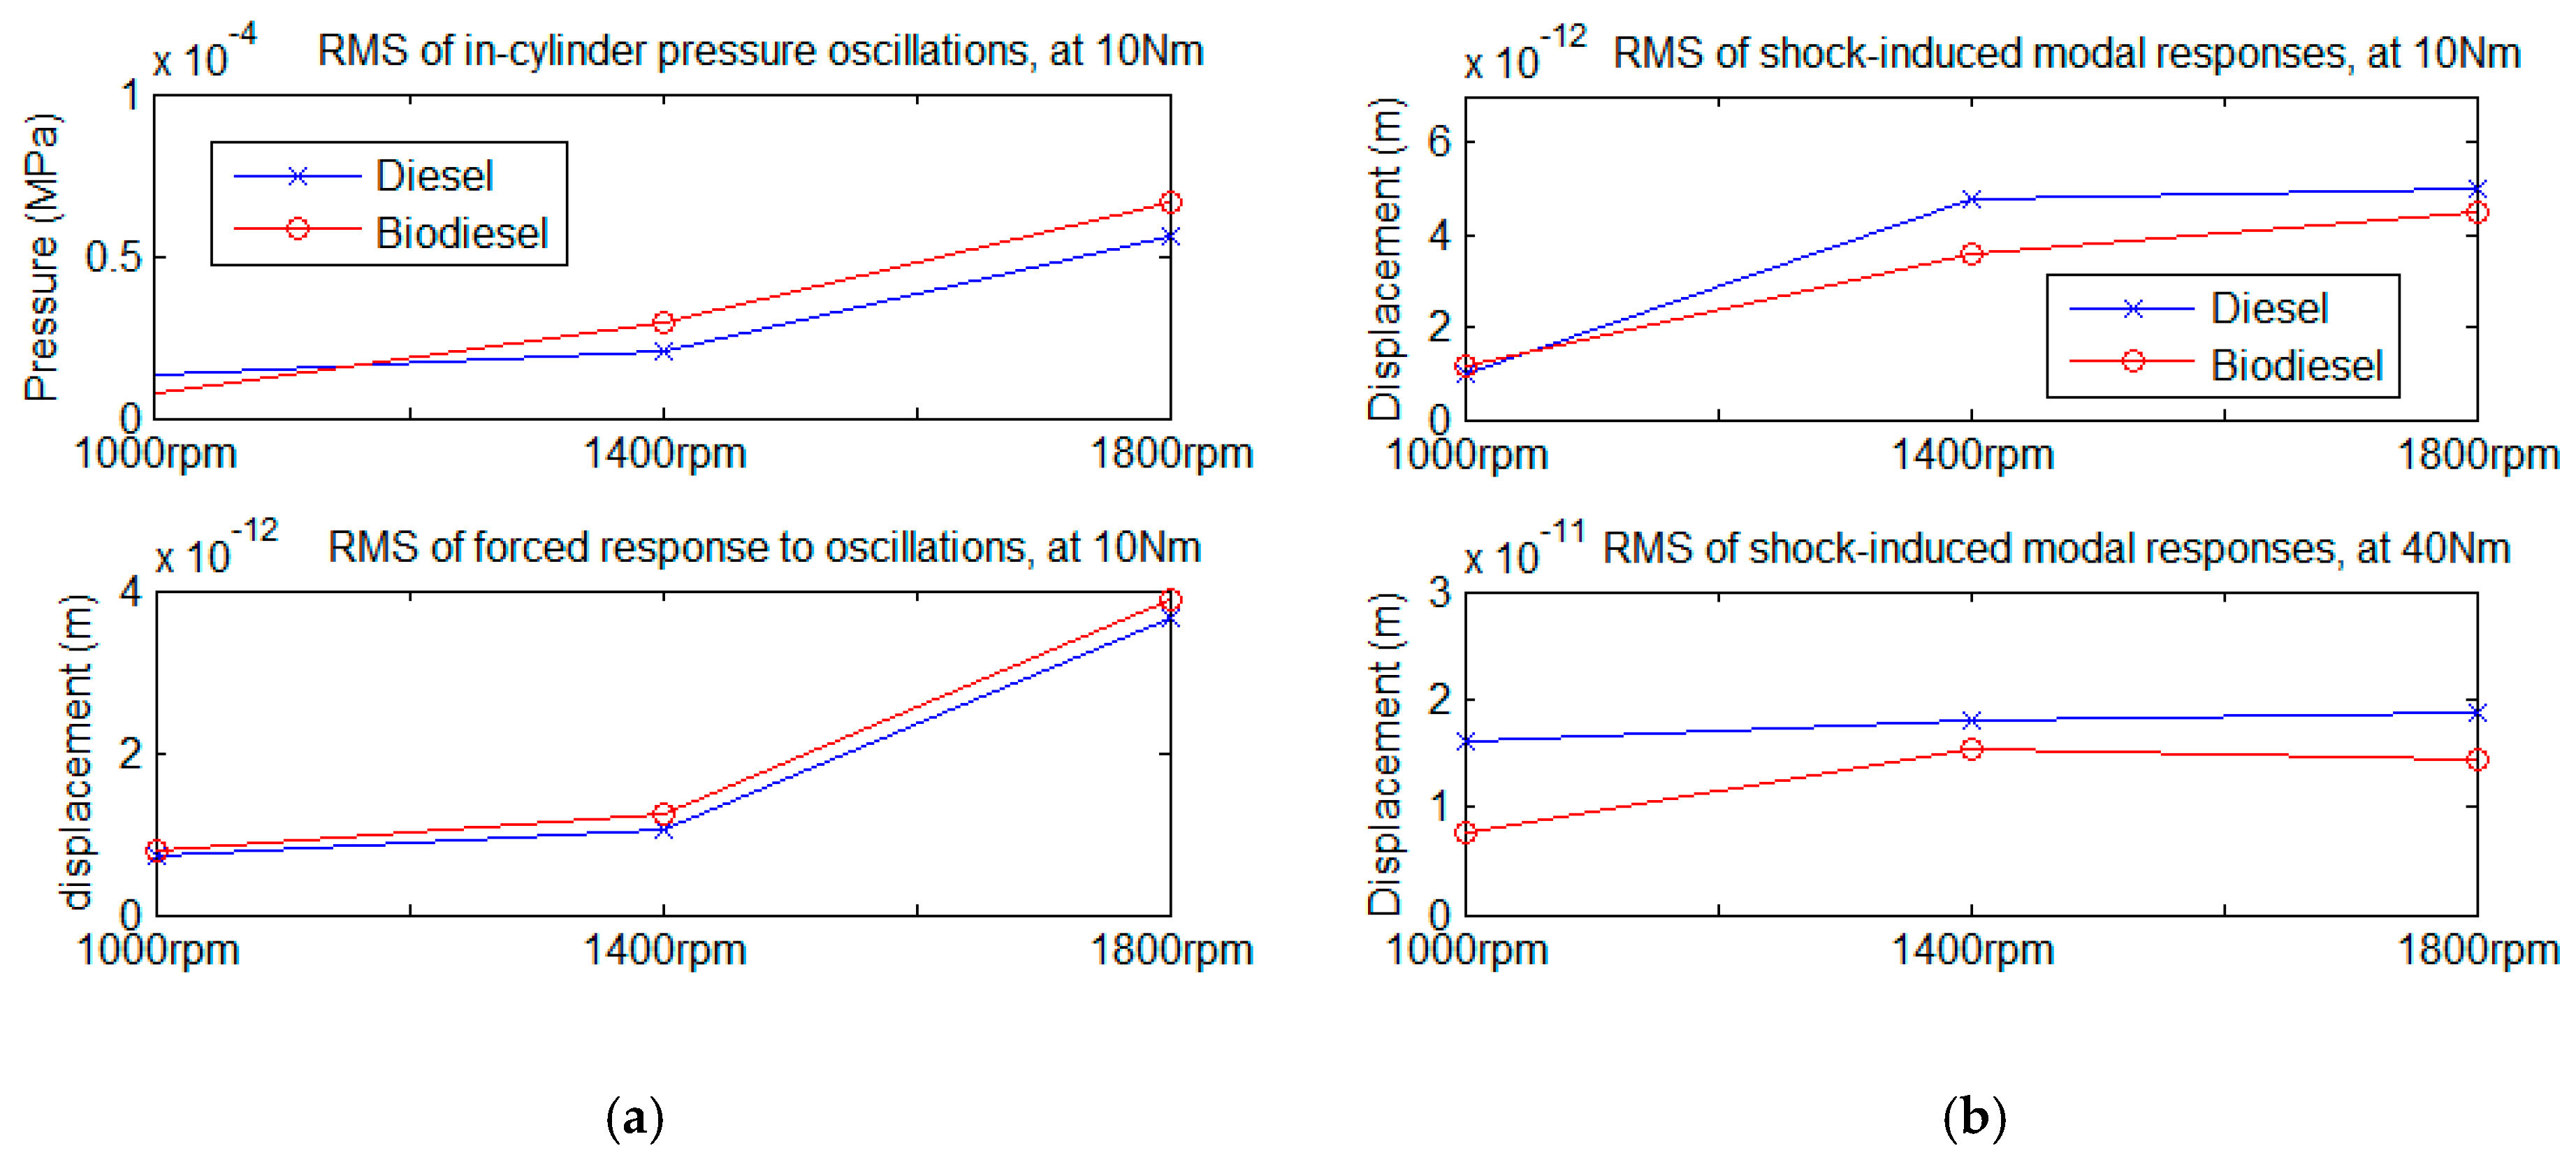
To achieve the diagnostic quantitative analysis for different operating conditions, the RMS results of four local responses, respectively marked as Impact Co and Impact Cs, the blue rectangle and red rectangle in Figure 14, have been calculated and drawn as shown in Figure 15 and Figure 16.
Figure 15a presents the RMS results of local features with regard to the oscillations in combustion pressure and the simulated responses to combustion oscillations Impact Co. It can be clearly seen that the changing trends of simulated dynamic responses Impact Co are highly proportional to those of combustion oscillations. This consistency provides clear evidence that the event associated with Impact Co is primarily the forced response caused by the high frequency oscillations of in-cylinder pressure.
The RMS results of modal responses of Impact Cs induced by different fuels show more abundant information. As can be seen in the bottom plot of Figure 15b, under high load conditions, with the fuel injection quantity increasing, the atomisation of biodiesel during the premixed combustion phase deteriorated significantly, thereby resulting in a reduction of the shock strength and the consequent dynamic responses.
To analyze the variation trends of dynamic responses to piston slaps, the RMS results of local responses around two TDCs, marked with blue and red rectangles in Figure 14, have been calculated and drawn, as shown in Figure 16.
As shown in Figure 16a, under low load conditions, almost all of the RMSs of dynamic responses to slap events after the exhaust TDC increase steadily with the running speed rising. The upward trend of RMSs fueled with biodiesel shows the most rapid rise, which may be due to the prolonged combustion duration as a result of the larger amount of biodiesel injection (biodiesel possesses a lower calorific value). The delayed mixing-controlled combustion phase can cause a relative increase in the kinetic energy of piston side slaps in the exhaust stroke, thereby resulting in the rise of RMSs around the exhaust TDC.
The RMS results of two fuels after combustion TDC show more complex variation tendencies, as shown in Figure 16b. Under low-load conditions, with the increase in the operating speed, both fuels show similar trends to the forced responses Impact Co of combustion oscillations, indicating that the slap-induced responses around the combustion TDC are basically consistent with the in-cylinder combustion behaviors under low-load conditions. Under high-load conditions, the RMS result of biodiesel shows a clearly decreasing tendency after an increase, which cannot be well interpreted by the combustion characteristics of biodiesel itself.
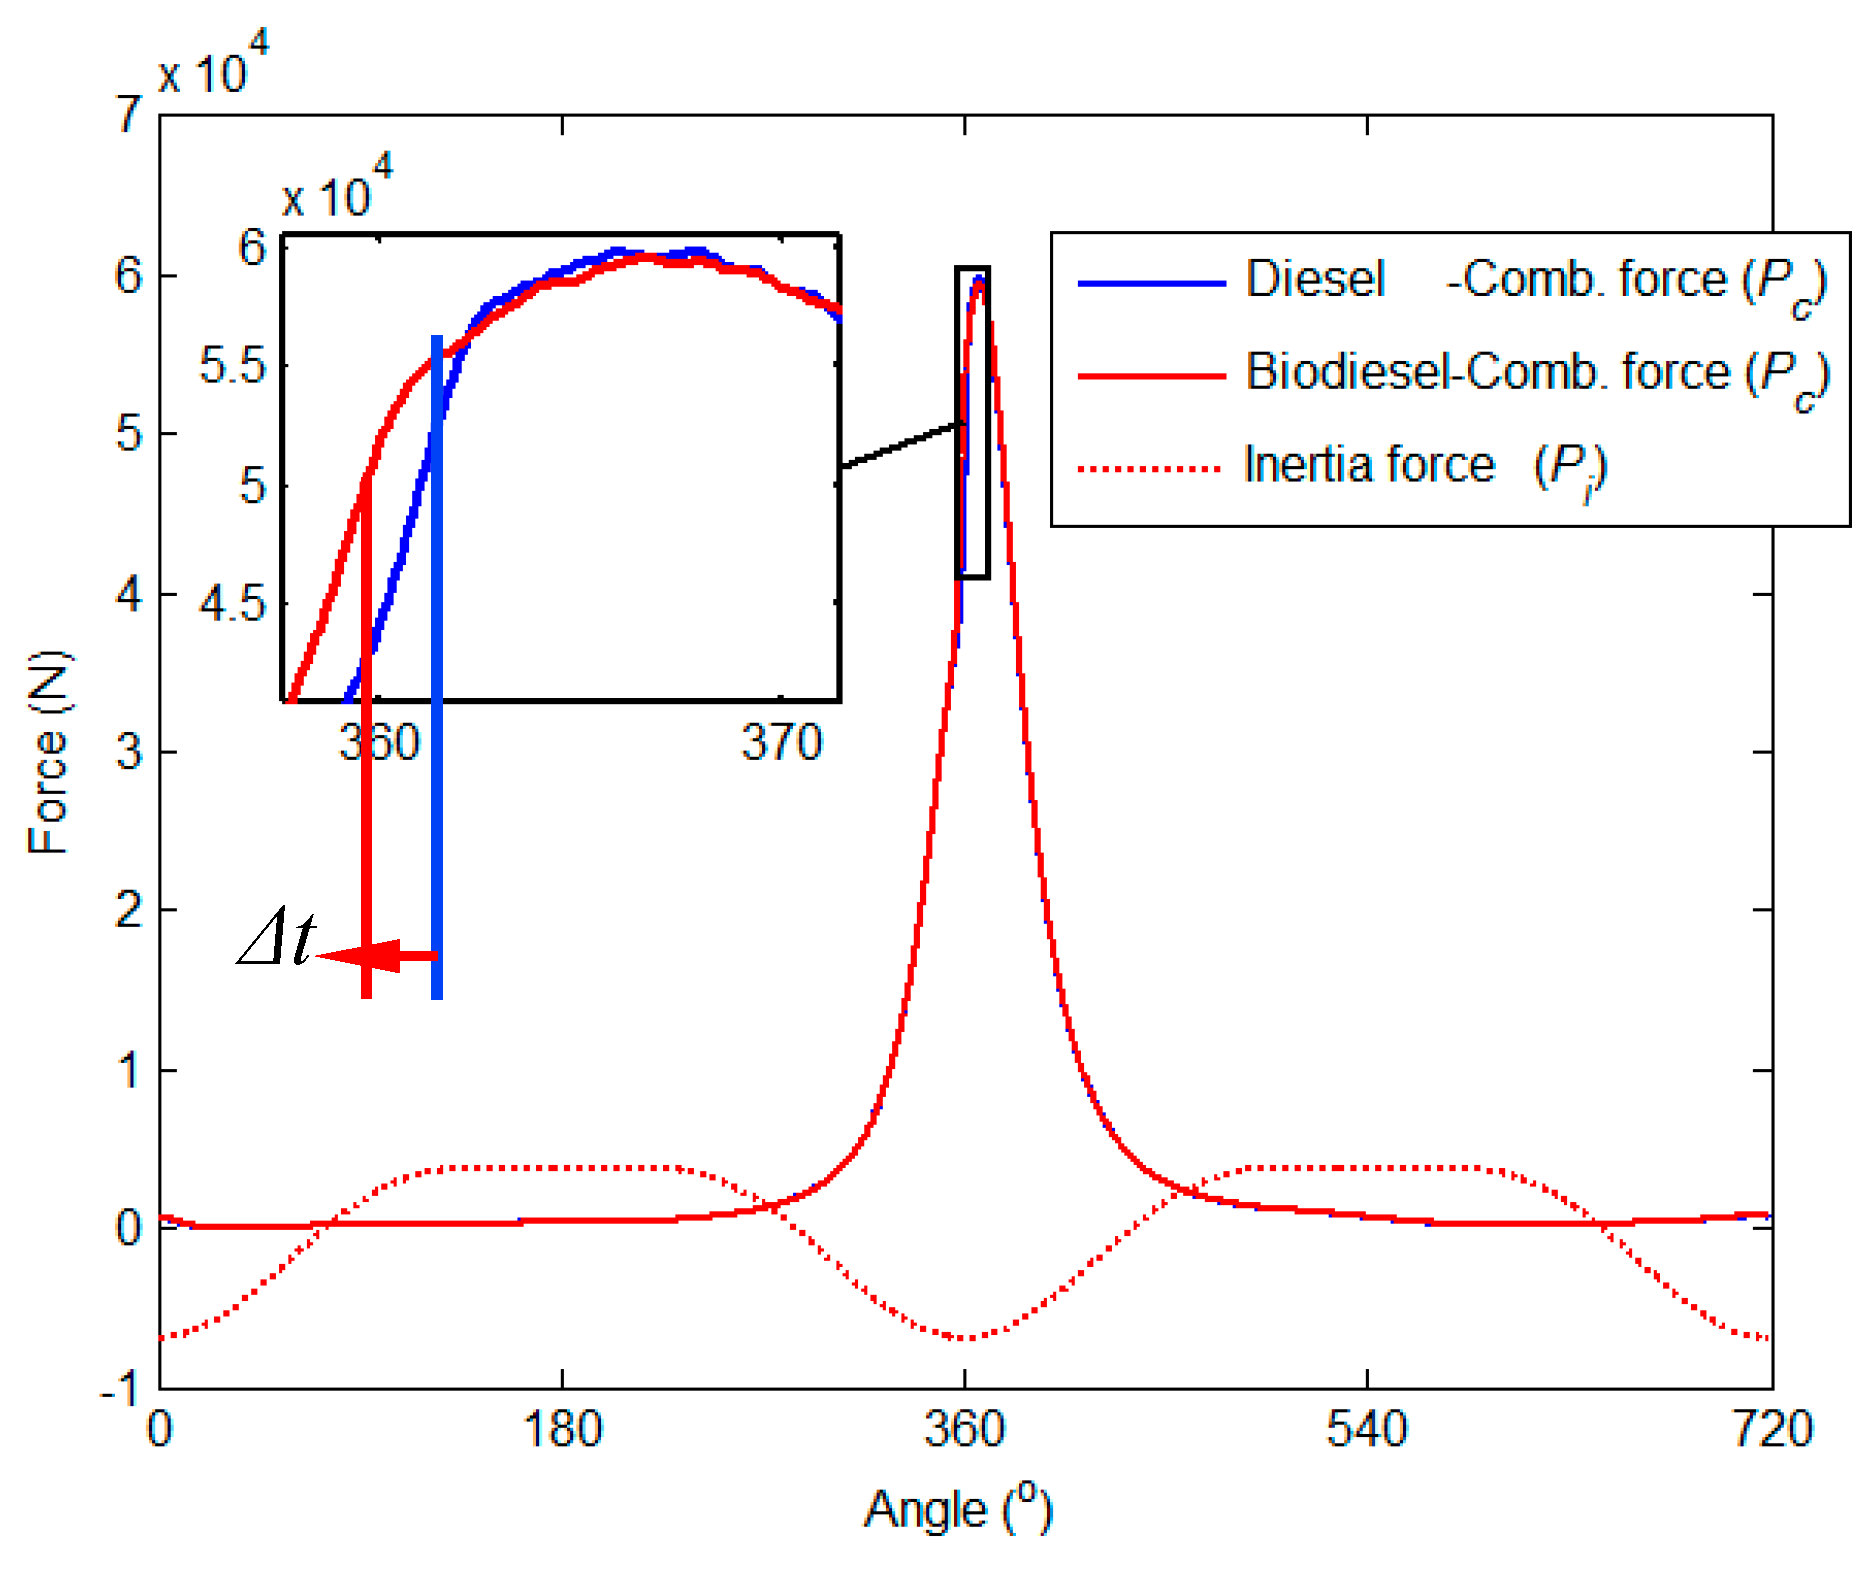
To reveal the reasons for this trend, it is necessary to have an in-depth understanding of the formation mechanism of the piston side-thrust force, and especially the effects of combustion pressure on the peak value of piston thrust force around the combustion TDC. Figure 17 shows a typical characteristic of the piston side-thrust force, combined with the longitudinally acting combustion force Pc and axial inertia force of piston assembly Pi, obtained based on the engine in this study.
As the piston side-thrust force is decomposed from the longitudinally acting combustion force and the inertia force of the moving piston assembly, which pushes the piston assembly from one side of the cylinder wall, skipping onto the other side [9]. Mathematically, this phenomenon can be expressed by the following equations:
The inertia force of the piston assembly is roughly proportional to the square of the crankshaft speed, which means that the inertia force will grow rapidly with the increase of the running speed. Due to the opposite sign, when the increment of the inertia force is greater than that of the combustion force, the cancellation between the combustion force and the inertia force will lead to a decrease in the peak value of the side-thrust force, thereby resulting in a decreasing trend after an increase, as shown in Figure 16b.
Principally, with the increase of running speed, the piston inertia force of the entire work cycle increases significantly, which results in a corresponding rise in the kinetic energy of piston slaps. Therefore, the RMS result of the liner dynamic response rises steadily with the increase of running speed, represented by the RMSs of local responses near the combustion TDC, as shown in Figure 16a. The advanced ignition caused by the high cetane number of biodiesel can have a significant contribution to the compound effect on the piston side-thrust force, thereby resulting in a nonlinear trend of the RMSs of local response near the combustion TDC.
4. Design of Experiments
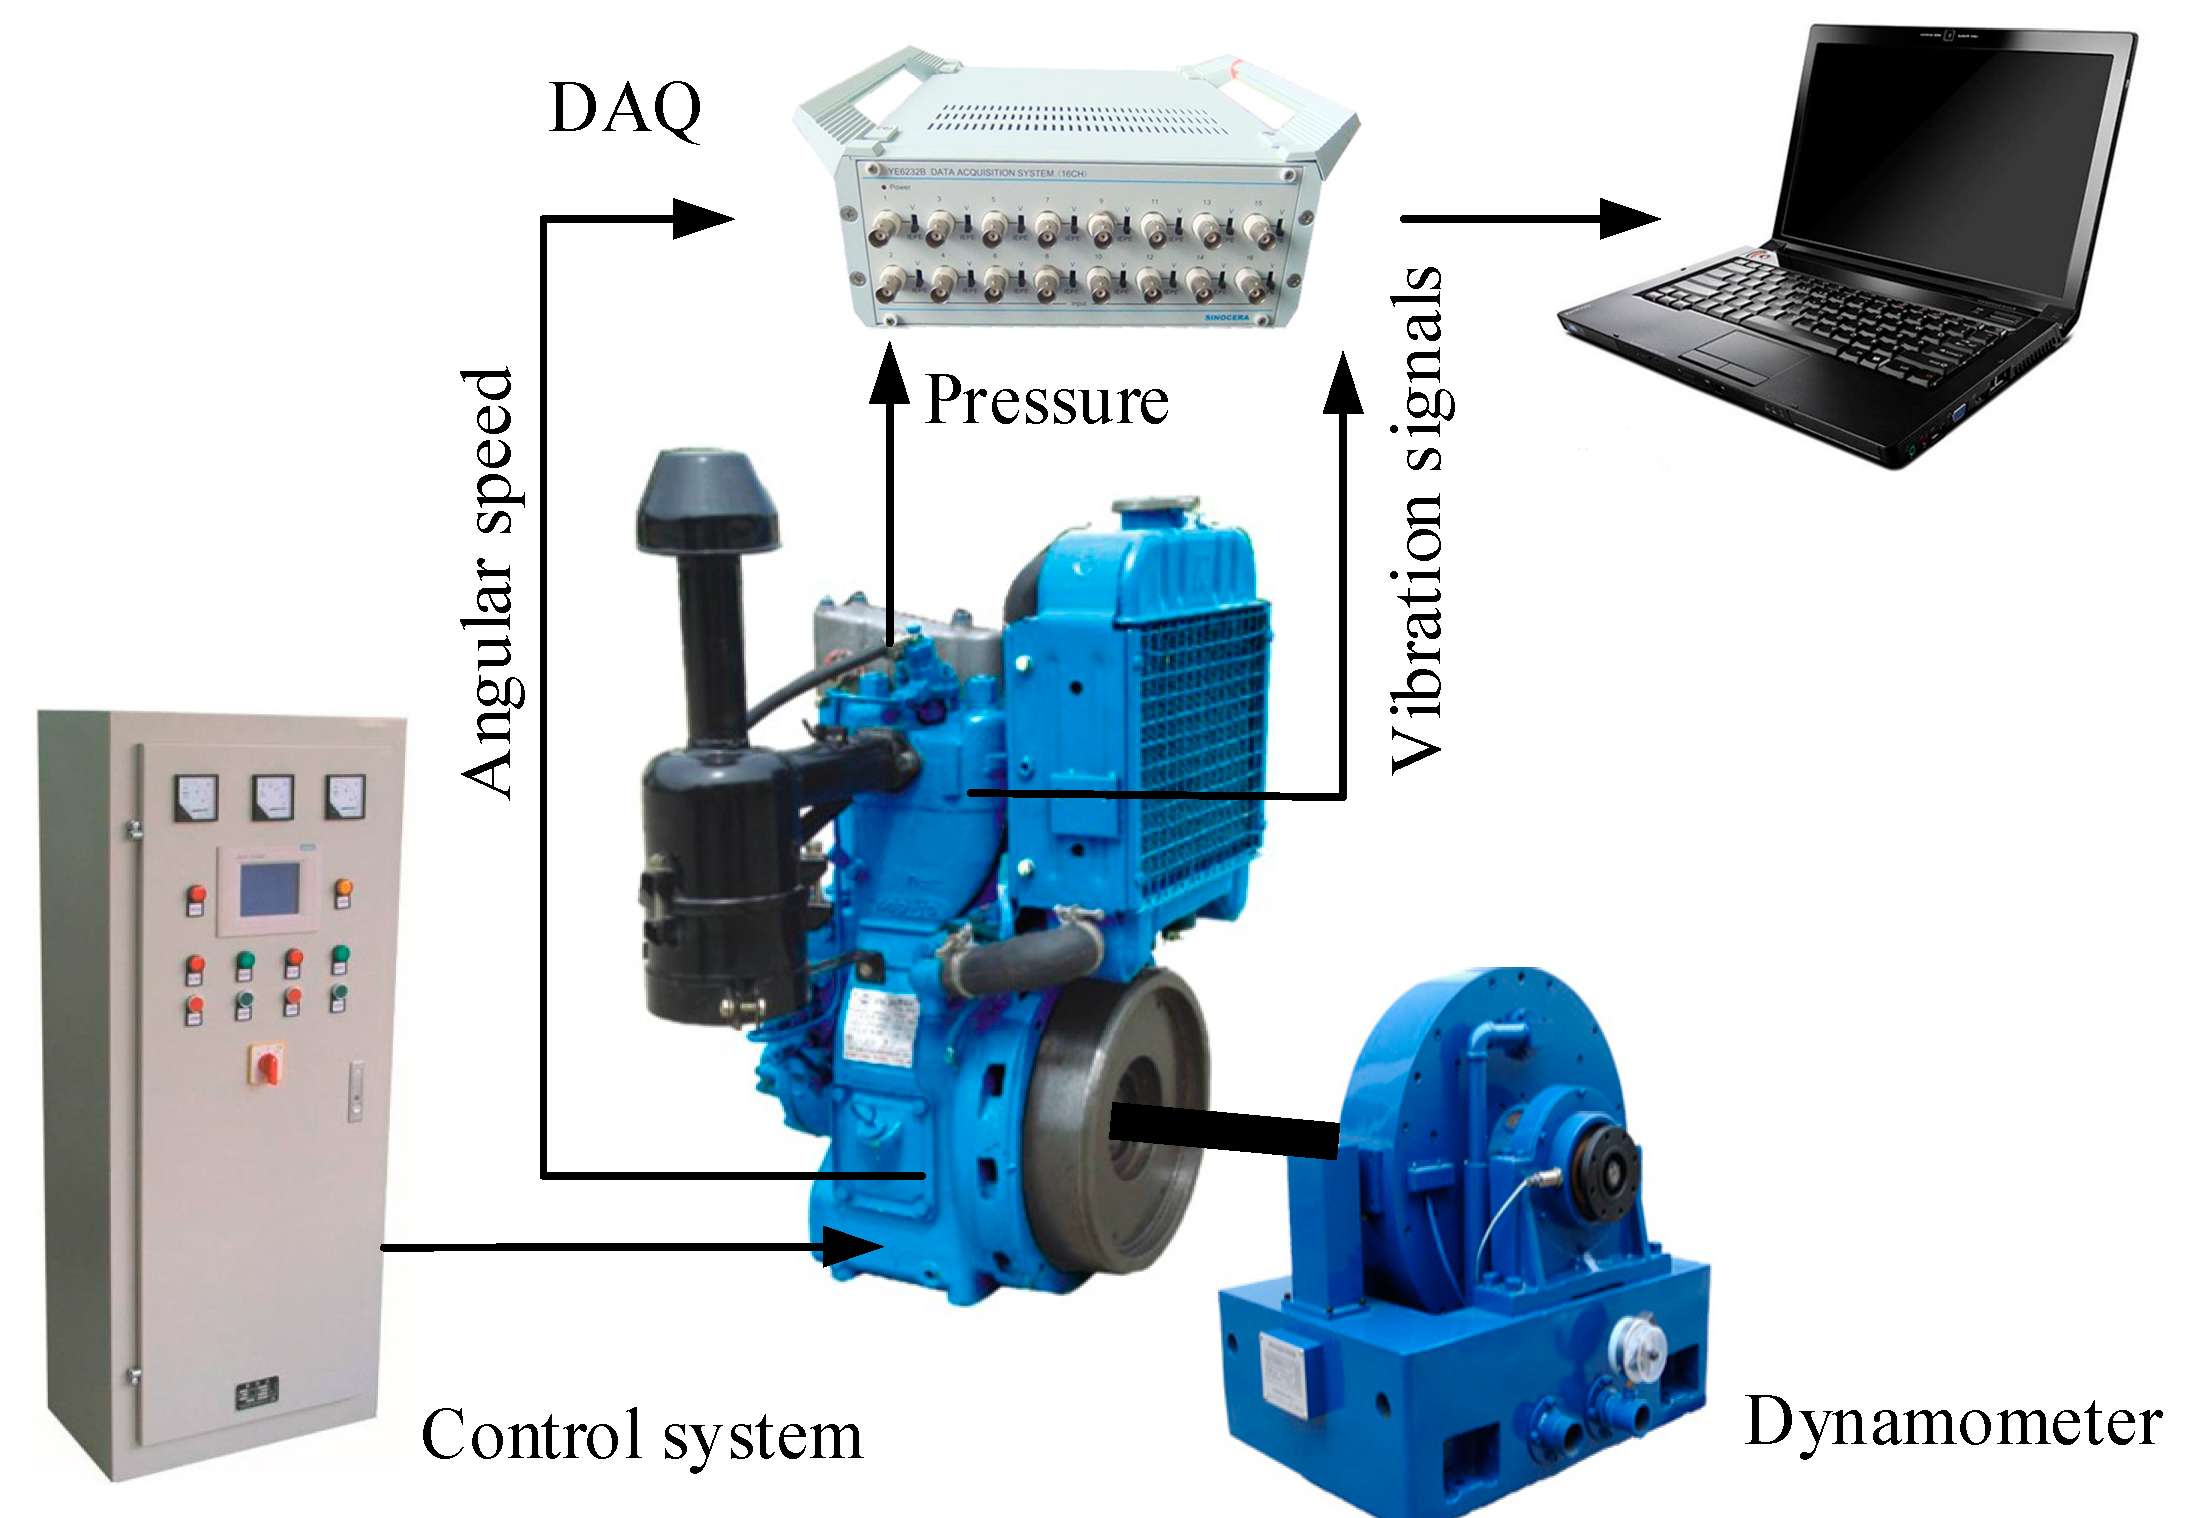
To verify the numerical predictions, experimental studies were made based on a single-cylinder diesel engine, detailed in Table 4. An accelerometer for measuring liner vibrations was installed directly on the external surface of the liner through a waterproof adapter. In addition, in-cylinder pressure, engine speed and time-based crank angle were also recorded for both the FE model calculations and results calibrations. The experimental setup is illustrated in Figure 18. All of the data were recorded simultaneously by a multiple channel acquisition system, and thereafter processed offline for making corresponding comparisons against FE model predictions. In order to compare the collected data and to perform the time domain or angular domain average of the signals, a reference point was obtained by using a Hall shaft encoder to measure a special indentation on the front face of the flywheel.
For comparison purposes, raw signals were collected from the sensors under different operating conditions and fueled with different fuels, meaning that the engine was running at three speeds, from 1000 to 1800 rpm, in intervals of 400 rpm, with two loads being applied at each speed: 10 and 40 Nm, as shown in Table 5.
5. Experimental Results and Discussion
5.1. CWT Analysis
Continuous wavelet transform (CWT) is used to extract dynamic responses from the non-stationary raw vibration data and localize them in joint frequency and time domains. To obtain reliable results, an average of 80 engine cycles was used to further suppress random noise and short duration interferences. Figure 19 shows a typical CWT result of the liner vibration under the operating condition of 1800 rpm and 40 Nm. The time-frequency characteristics in Figure 19a are very informative and can be viewed with key patterns as follows:
Impact Co and Impact Cs mark the significant responses, which occur near combustion TDC at 360° in the frequency ranges of 6000 to 8000, and 8000 to 12,000 Hz. These events well correspond to the in-cylinder peak pressure, which conforms to numerical predictions in Section 3.2 and Figure 11.
Impact A to Impact F mark other distinctive responses, which correspond with piston slap-induced dynamic events and are consistent with Section 3.3 and Figure 13. The frequency band of these dynamic responses, from 900 to 4000 Hz, is highly correlated with the liner’s first four modal frequencies.
Three other events, Impact G, H and I, around 2000 Hz, predicted in the dynamic simulation are also observable in Figure 19a. It follows that repeated impacts can be caused by a sustained high-amplitude side-thrust force, agreeing with the prediction of the established FE model.
Since the peak pressure and PRR of biodiesel are not as high as those of diesel, the combustion shock-induced responses Impact Co and Impact Cs of biodiesel are located in the frequency range from 5000 to 7000 and 10,000 to 12,000 Hz, slightly lower than the diesel, as shown in Figure 20. However, in the entire work cycle, biodiesel showed more abundant and intensive response events than the diesel, which is agreeable with the numerical prediction in Section 3.3 and Figure 14. This may be due to the prolonged combustion duration as a result of a larger amount of biodiesel injection (biodiesel possesses a lower calorific value). The extended mixed-controlled combustion phase can cause a relative increase in the kinetic energy of piston side slaps, thereby resulting in the increase in response intensity and the number of observable events.
The time-frequency responses of the liner to combustion shocks under a lower load are similar to those under higher load conditions, which are marked as Impact Cs in Figure 21. However, the combustion is smoother when they are in a frequency band from 4000 to 7000 Hz, which is 2000 Hz lower than that of the higher load. Smoother combustion leads to a piston movement that excites a greater number of low-frequency components, so that almost all slap-induced events over 2000 Hz are markedly reduced.
As shown in Figure 22, after the combustion TDC, the slap-induced events fueled with biodiesel are weaker than those with fossil diesel, which may be attributed to the enhanced compound effect between the combustion force and the inertia force of the piston, as mentioned in Section 3.4. There are significant differences in the response characteristics between the different fuels. However, it can be seen that the dynamic responses of the same fuel under different operating conditions possess a similar pattern in the time-frequency characteristics. In other words, the response patterns of a fuel are definite and unique, corresponding to the physicochemical properties of the fuel itself.
To get a further understanding of these differences in the localized response features fueled with alternative fuels, it is necessary to perform some contrastive and diagnostic analyses on these features under different operating conditions.
5.2. Diagnostics of the Impacts of Different Fuels
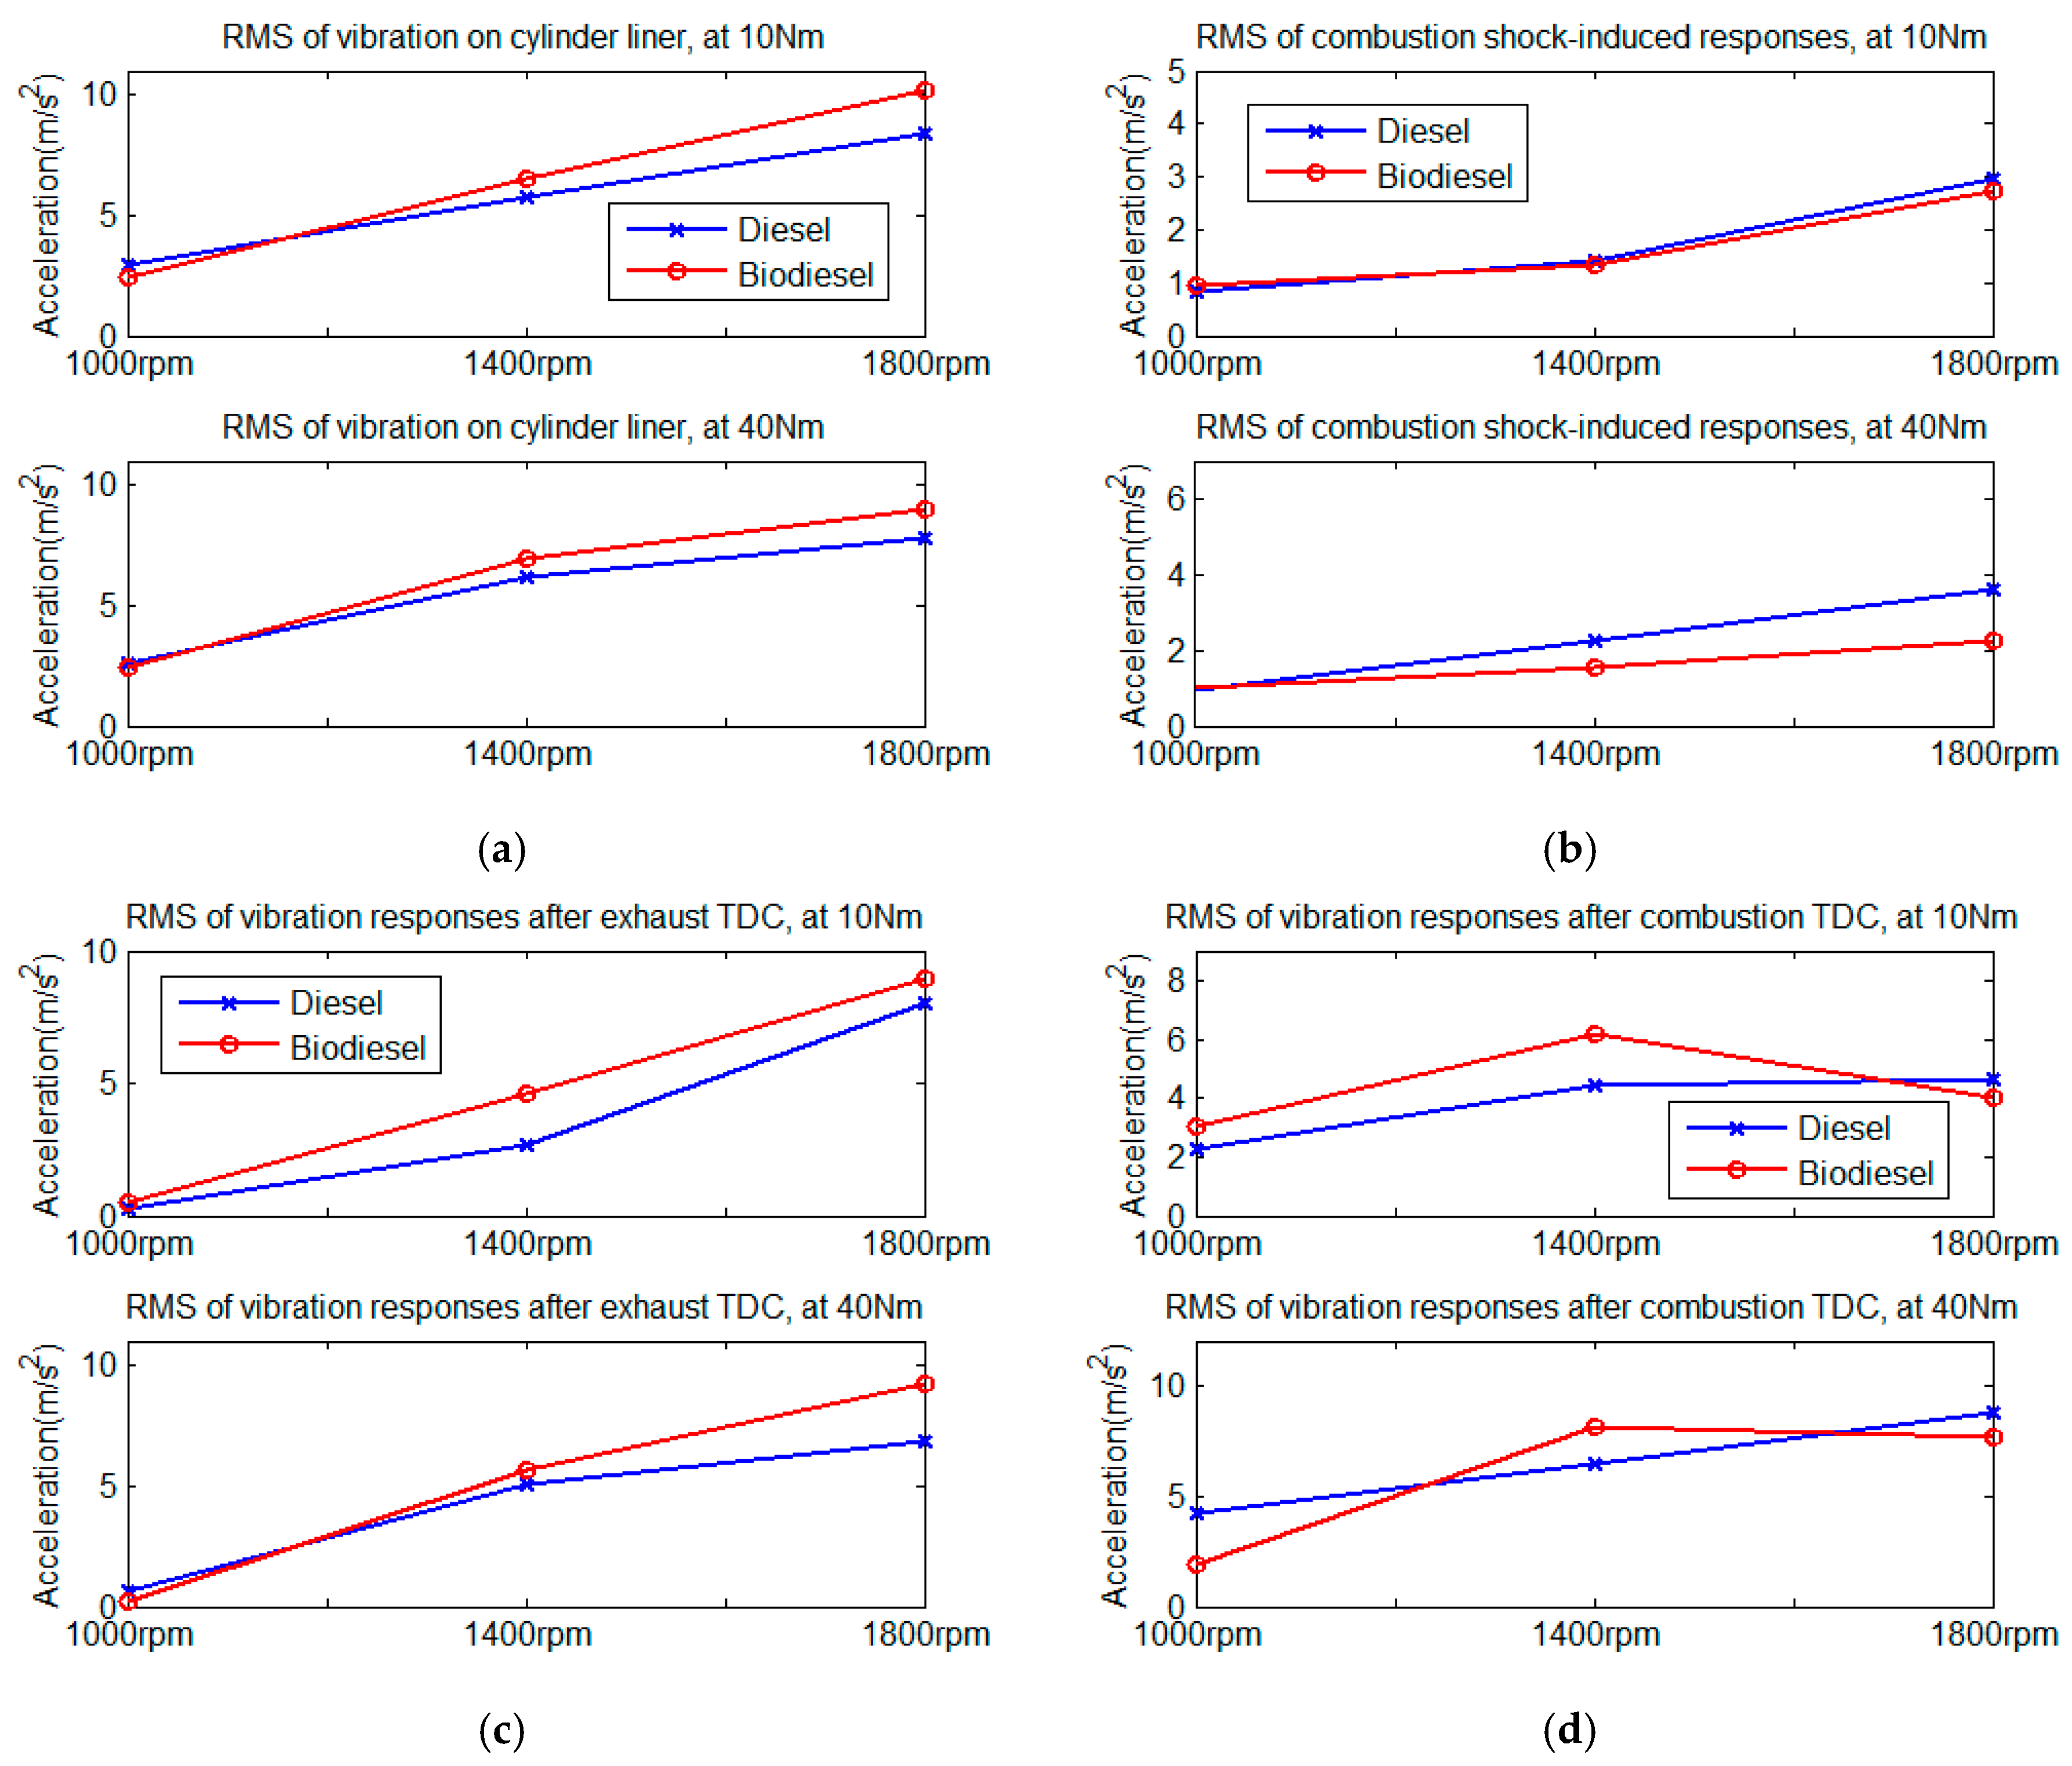
In order to study the variation trends of localized dynamic responses to different fuels, several representative local features were chosen to carry out comparative analysis. The root mean square (RMS) results of combustion shock-induced dynamic response Impact Cs have been drawn, as shown in Figure 23b. The RMS results of piston slap-induced events Impact B and Impact E, at combustion TDC and exhaust TDC, under different operating conditions, are presented in Figure 23c,d.
First of all, the overall RMS results of vibrations measured from the cylinder liner have been calculated and drawn, as shown in Figure 23a. As the operating speed increases, the RMS value of the vibrations on the cylinder liner gradually increases.
With an increase of the operating speed, the RMS of the liner vibration fueled with biodiesel shows a greater increment than the diesel, which might be attributed to the prolonged combustion duration. Due to the lower calorific value of biodiesel, a greater amount of fuel was injected into the combustion chamber to generate the same mechanical power as the diesel. The extended combustion duration led to a relative increase in the kinetic energy of the piston lateral movement, thereby resulting in a rapid rise in the RMS of the liner vibrations.
To understand the direct influence of combustion shock on the dynamic responses of the cylinder liner, the RMS results of combustion shock-induced vibration Impact Cs are presented in Figure 23b. With an increasing engine speed, the RMS of combustion shock-induced response shows a proportional increase to the peak value of the pressure rise rate, suggesting that the selected local feature can well characterize the immediate influence of the combustion force to dynamic responses.
The differences between the biodiesel and fossil diesel in combustion-induced responses are even more pronounced than the overall responses. As the speed increases, under both load conditions of 10 and 40 Nm, the RMS of biodiesel becomes less than that of the diesel. This trend can well correspond to the combustion properties of biodiesel regarding the peak value of the pressure rise rate. A smaller peak value is reached in the rise rate of pressure due to the smoother in–cylinder combustion of biodiesel, which means the frequency contents of in-cylinder combustion pressure are relatively less and not sufficient to motivate many clear mode responses.
Then, a contrastive analysis on the localized response characteristic is approached by choosing two typical local features after combustion TDC and exhaust TDC, respectively, in order to study the influence of piston lateral movement on the cylinder dynamic response characteristics under different conditions.
The RMS results of piston slap-induced events Impact B and Impact E, around the combustion TDC and exhaust TDC, respectively, under different operating conditions, are presented in Figure 23c,d. As shown in Figure 23c, the changing trends of RMSs after exhaust TDC correspond well to the previous numerical prediction in Section 3.4 and in Figure 16a. The inertia force of piston assembly is directly proportional to the square of crankshaft speed, as seen in Equation (5). The lateral inertia force of piston assembly increases dramatically with the square of running speed, from 1000 to 1800 rpm. Consequently, the kinetic energy of the piston lateral movement shows a rapid growth, along with an increase in the running speed, resulting in a sharp increase in the vibrational responses to the piston slap after exhaust TDC.
Differences in the response trends between fuel types show a similar pattern to those of the overall vibrations, which further confirms the earlier proposed explanation that the overall responsive intensity is determined by the combustion duration. The magnitude of the inertial force is more affected by the driving action of combustion force during the late stage of combustion, which contains part of the mixed-controlled combustion phase and late combustion phase. The extended combustion duration of biodiesel can cause a relative increase in the kinetic energy of the piston lateral movement, thereby resulting in a rapid growth in the RMS around exhaust TDC.
As seen in Figure 23d, the variation trend of dynamic responses after combustion TDC has also shown a high similarity to the numerical prediction in Section 3.4 and Figure 16b. The RMS of biodiesel shows a clear tendency of decrease after an increase, which cannot be well interpreted by the combustion characteristics of biodiesel itself. As the speed increases, the ignition phase of biodiesel advances gradually, resulting in the enhanced compound effect between the combustion force and the inertia force of the piston. Since the driving action of the combustion force is substantially offset by the inertia force, the magnitude of the piston side-thrust force drops significantly, eventually leading to the downward trend for the high-speed conditions.
6. Conclusions
To study the vibration characteristics of compression ignition (CI) engines fueled with biodiesel, this paper explores the dynamic responses of cylinder liners using a finite element model which includes structural modal characteristics, nonlinearities of assembly constraints and time-varying exciting forces. The high similarity of continuous wavelet transform representations between model predictions and vibration measurements have verified the model accuracy. Moreover, the characteristics of vibration response at the cylinder liner for the engine running with biodiesel blends and its causal relationship with combustion behaviors have been obtained and verified with experiments, providing insight understating for vibration based combustion diagnostics. The key conclusions from this study can be summarized as follows:
- The dynamic responses of the cylinder liner to combustion shocks appear in a higher frequency band from 4 to 12 kHz, whereas those of the piston impacts are in a lower frequency range from 1 to 4 kHz. Furthermore, the predicted amplitude of local responses is at the order of 0.01 microns due to the combustion shocks, which may be negligible to affect lubrications. However, piston slaps can lead to deformation as high as 0.1 micros, being about 20% of roughness amplitude.
- The variation trends of combustion shock-induced responses can well correspond to the combustion characteristics of biodiesel regarding to the peak value of the pressure rise rate. The frequency contents of in-cylinder combustion pressure fueled with biodiesel are less than the fossil diesel, and insufficient to cause a clearer modal responses.
- The extended combustion duration of biodiesel can cause a relative increase in the kinetic energy of piston lateral movement, thereby leading to a rise of vibration intensity close to the exhaust top dead center (TDC).
- Due to the compound effect between the combustion force and piston inertia force, the rise rate of the piston side-thrust force close to the combustion top dead center (TDC) shows a nonlinear decrease with the increase in speeds, thereby resulting in a nonlinear trend in the root mean square curve of liner local responses.
Acknowledgments
The support of the Natural and Scientific foundation of China NO. 51375326, are gratefully acknowledged. Thanks are due to Jie Zhao, Huanhuan Wang, Miaoshuo Li, Haoyu Lu, Xingchen Lu, Hu Zhang and Xuan Dang, of Taiyuan University of Technology, for their help in modelling and testing.
Author Contributions
All authors contributed to the research work. Guoxing Li and Fengshou Gu established the finite element method-based model and designed the experiments. Tie Wang and Andrew Ball analysed the simulation results and reviewed the research work. Jianjun You participated in the experiments.
Conflicts of Interest
The authors declare no conflict of interest.
References
- Ge, J.C.; Yoon, S.K.; Kim, M.S.; Choi, N.J. Application of Canola Oil Biodiesel/Diesel Blends in a Common Rail Diesel Engine. Appl. Sci. 2016, 7, 34. [Google Scholar] [CrossRef]
- Tashtoush, G.; Al-Widyan, M.I.; Al-Shyoukh, A.O. Combustion performance and emissions of ethyl ester of a waste vegetable oil in a water-cooled furnace. Appl. Therm. Eng. 2003, 23, 285–293. [Google Scholar] [CrossRef]
- Aydin, H.; Bayindir, H. Performance and emission analysis of cottonseed oil methyl ester in a diesel engine. Renew. Energy 2010, 35, 588–592. [Google Scholar] [CrossRef]
- Murillo, S.; Míguez, J.L.; Porteiro, J.; Granada, E.; Morán, J.C. Performance and exhaust emissions in the use of biodiesel in outboard diesel engines. Fuel 2007, 86, 1765–1771. [Google Scholar] [CrossRef]
- Salvi, B.L.; Subramanian, K.A.; Panwar, N.L. Alternative fuels for transportation vehicles: A technical review. Renew. Sustain. Energy Rev. 2013, 25, 404–419. [Google Scholar] [CrossRef]
- Agarwal, A.K. Biofuels (alcohols and biodiesel) applications as fuels for internal combustion engines. Prog. Energy Combust. Sci. 2007, 33, 233–271. [Google Scholar] [CrossRef]
- Taghizadeh-Alisaraei, A.; Ghobadian, B.; Tavakoli-Hashjin, T.; Mohtasebi, S.S.; Rezaei-asl, A.; Azadbakht, M. Characterization of engine’s combustion-vibration using diesel and biodiesel fuel blends by time-frequency methods: A case study. Renew. Energy 2016, 95, 422–432. [Google Scholar] [CrossRef]
- Uludamar, E.; Tosun, E.; Aydın, K. Experimental and regression analysis of noise and vibration of a compression ignition engine fuelled with various biodiesels. Fuel 2016, 177, 326–333. [Google Scholar] [CrossRef]
- Geng, Z.; Chen, J. Investigation into piston-slap-induced vibration for engine condition simulation and monitoring. J. Sound Vib. 2005, 282, 735–751. [Google Scholar] [CrossRef]
- Dolatabadi, N.; Theodossiades, S.; Rothberg, S.J. On the identification of piston slap events in internal combustion engines using tribodynamic analysis. Mech. Syst. Signal Process. 2015, 58–59, 308–324. [Google Scholar] [CrossRef]
- Cho, J.R.; Moon, S.J. A numerical analysis of the interaction between the piston oil film and the component deformation in a reciprocating compressor. Tribol. Int. 2005, 38, 459–468. [Google Scholar] [CrossRef]
- Jafari, A.A.; Khalili, S.M.R.; Azarafza, R. Transient dynamic response of composite circular cylindrical shells under radial impulse load and axial compressive loads. Thin-Walled Struct. 2005, 43, 1763–1786. [Google Scholar] [CrossRef]
- Murakami, H.; Nakanishi, N.; Ono, N.; Kawano, T. New Three-Dimensional Piston Secondary Motion Analysis Method Coupling Structure Analysis and Multi Body Dynamics Analysis; SAE Technical Paper; SAE International: Warrendale, PA, USA, 2012. [Google Scholar] [CrossRef]
- Farshidianfar, A.; Farshidianfar, M.H.; Crocker, M.J.; Smith, W.O. Vibration analysis of long cylindrical shells using acoustical excitation. J. Sound Vib. 2011, 330, 3381–3399. [Google Scholar] [CrossRef]
- ISO 1083:2004—Spheroidal Graphite Cast Irons—Classification, ISO. Available online: http://www.iso.org/iso/catalogue_detail.htm?csnumber=33243 (accessed on 31 July 2016).
- Kanda, H.; Okubo, M.; Yonezawa, T. Analysis of Noise Sources and Their Transfer Paths in Diesel Engines; SAE Technical Paper 900014; SAE International: Warrendale, PA, USA, 1990. [Google Scholar]
- Wei, H.; Wei, J.; Shu, G. Calculation on cylinder pressure fluctuation by using the wave equation in KIVA program. Chin. J. Mech. Eng. 2012, 25, 362–369. [Google Scholar] [CrossRef]
- Hartog, J.P.D. Mechanical Vibrations; Courier Corporation: North Chelmsford, MA, USA, 1985. [Google Scholar]
- Ting, L.L.; Mayer, J.E. Piston Ring Lubrication and Cylinder Bore Wear Analyses, Part II—Theory Verification. J. Lubr. Technol. 1974, 96, 258–266. [Google Scholar] [CrossRef]
- ASTM. ASTM D6751-09, Standard Specification for Biodiesel Fuel Blend Stock (B100) for Middle Distillate Fuels; ASTM International: West Conshohocken, PA, USA, 2009; Available online: www.astm.org (accessed on 4 July 2017).
- Badaoui, M.E.; Danière, J.; Guillet, F.; Servière, C. Separation of combustion noise and piston-slap in diesel engine—Part I: Separation of combustion noise and piston-slap in diesel engine by cyclic Wiener filtering. Mech. Syst. Signal Process. 2005, 19, 1209–1217. [Google Scholar] [CrossRef]
- Servière, C.; Lacoume, J.-L.; El, M. Badaoui, Separation of combustion noise and piston-slap in diesel engine—Part II: Separation of combustion noise and piston-slap using blind source separation methods. Mech. Syst. Signal Process. 2005, 9, 1218–1229. [Google Scholar] [CrossRef]
- Singer, I.L.; Pollock, H. Fundamentals of Friction: Macroscopic and Microscopic Processes; Springer Science & Business Media: Berlin, Germany, 2012. [Google Scholar]
Figure 1.
Construction of wet cylinder liner.
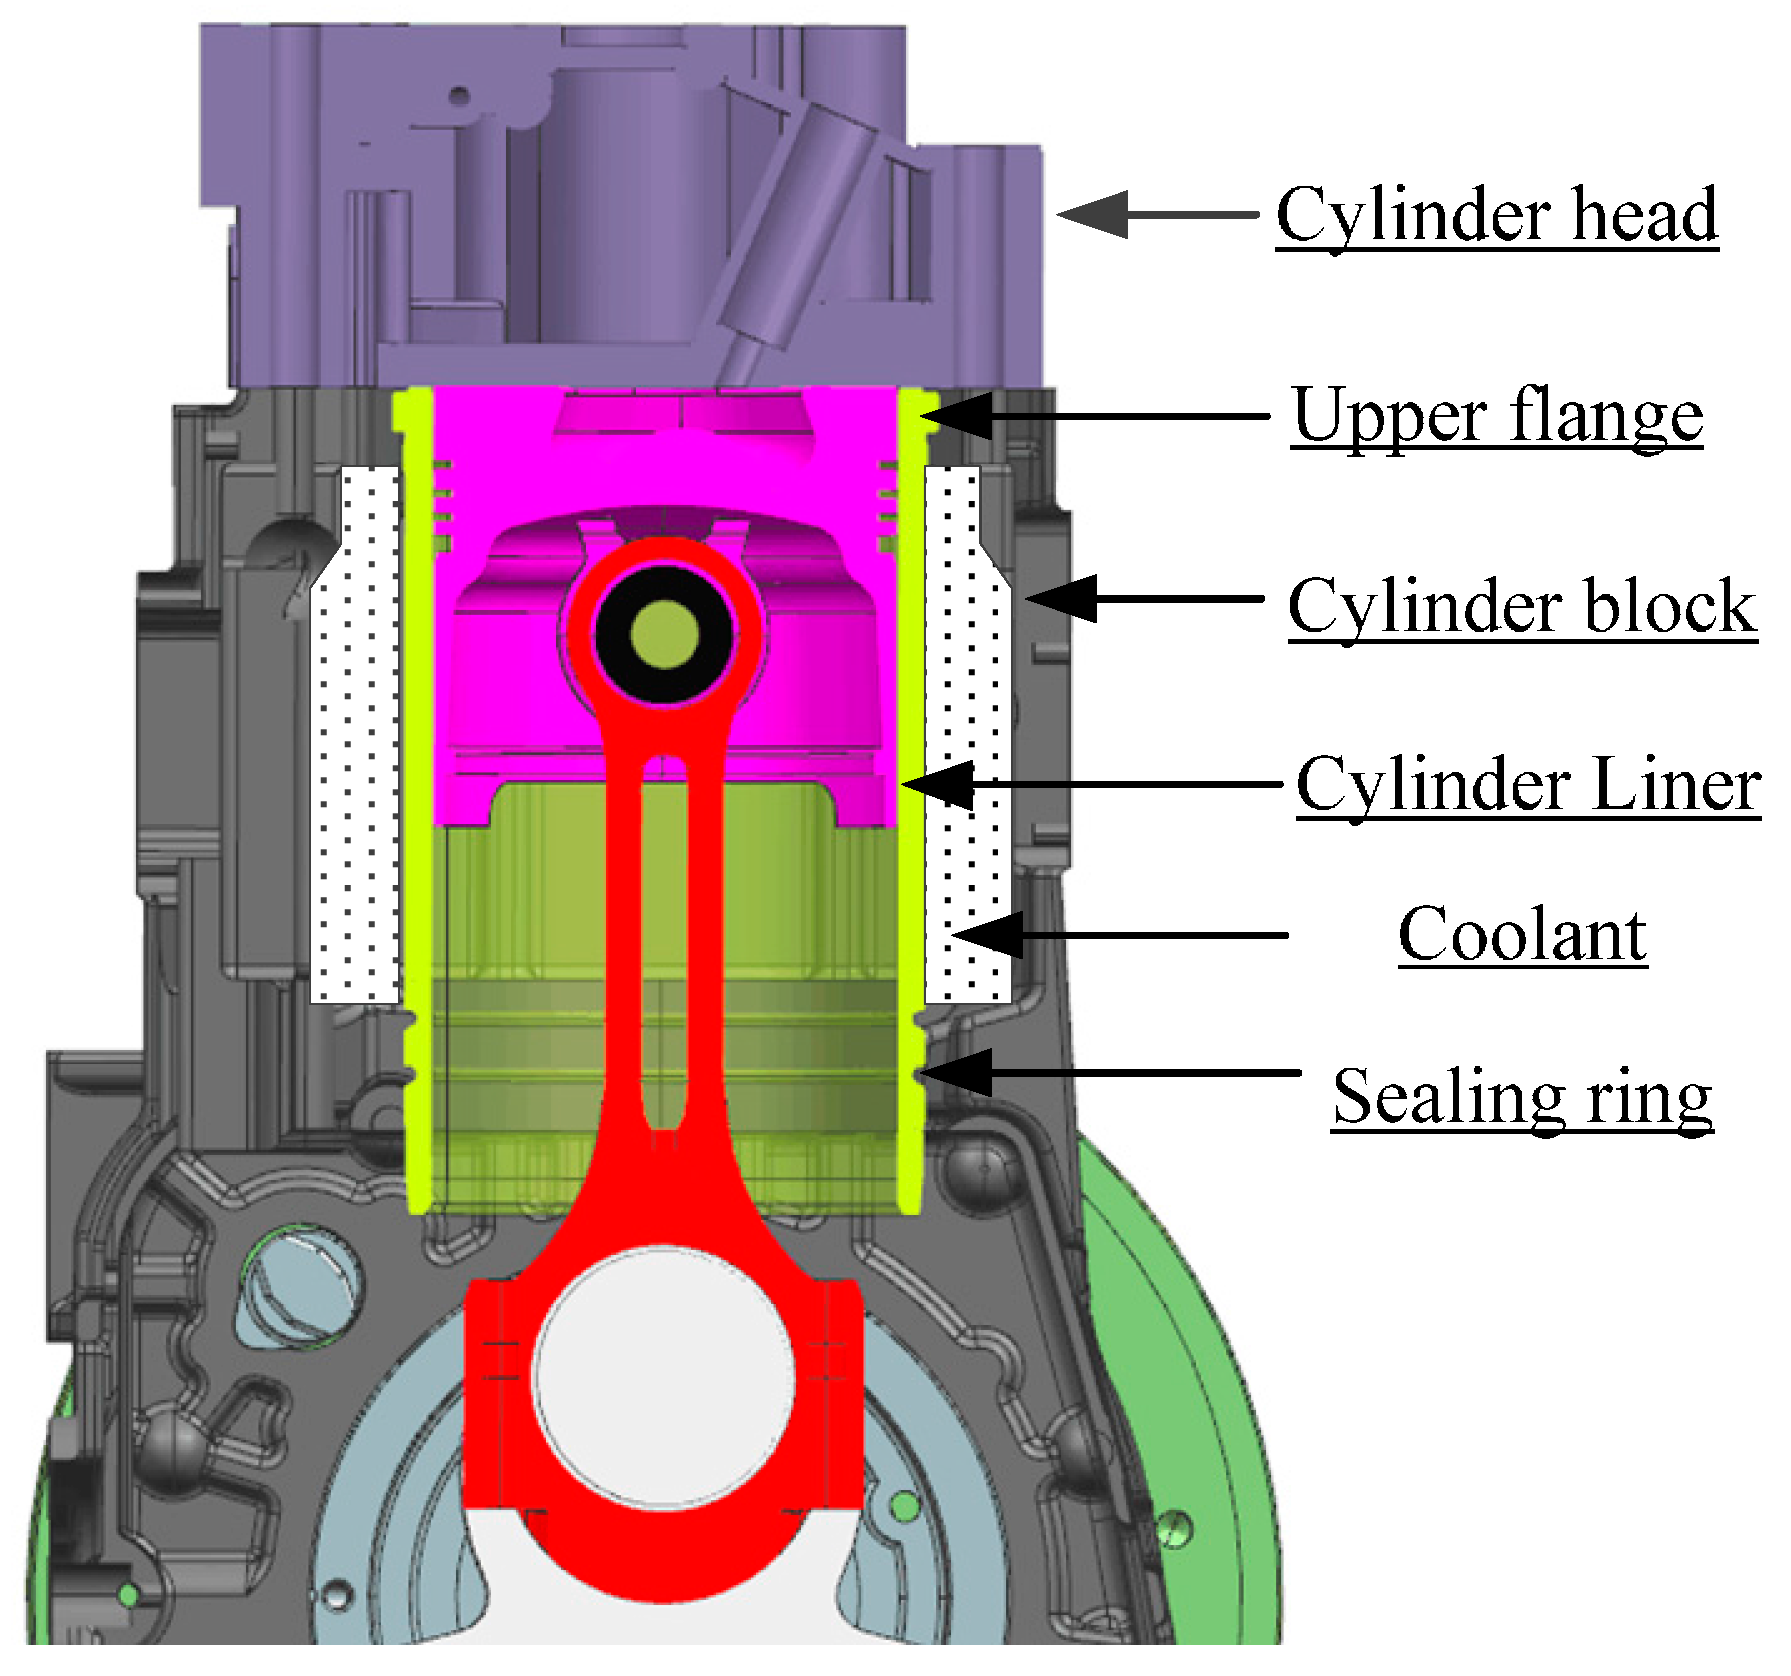
Figure 2.
Boundary constraints of cylinder liner: (a) Boundary conditions of the cylinder liner; (b) Finite element model of the studied cylinder liner.
Figure 2.
Boundary constraints of cylinder liner: (a) Boundary conditions of the cylinder liner; (b) Finite element model of the studied cylinder liner.
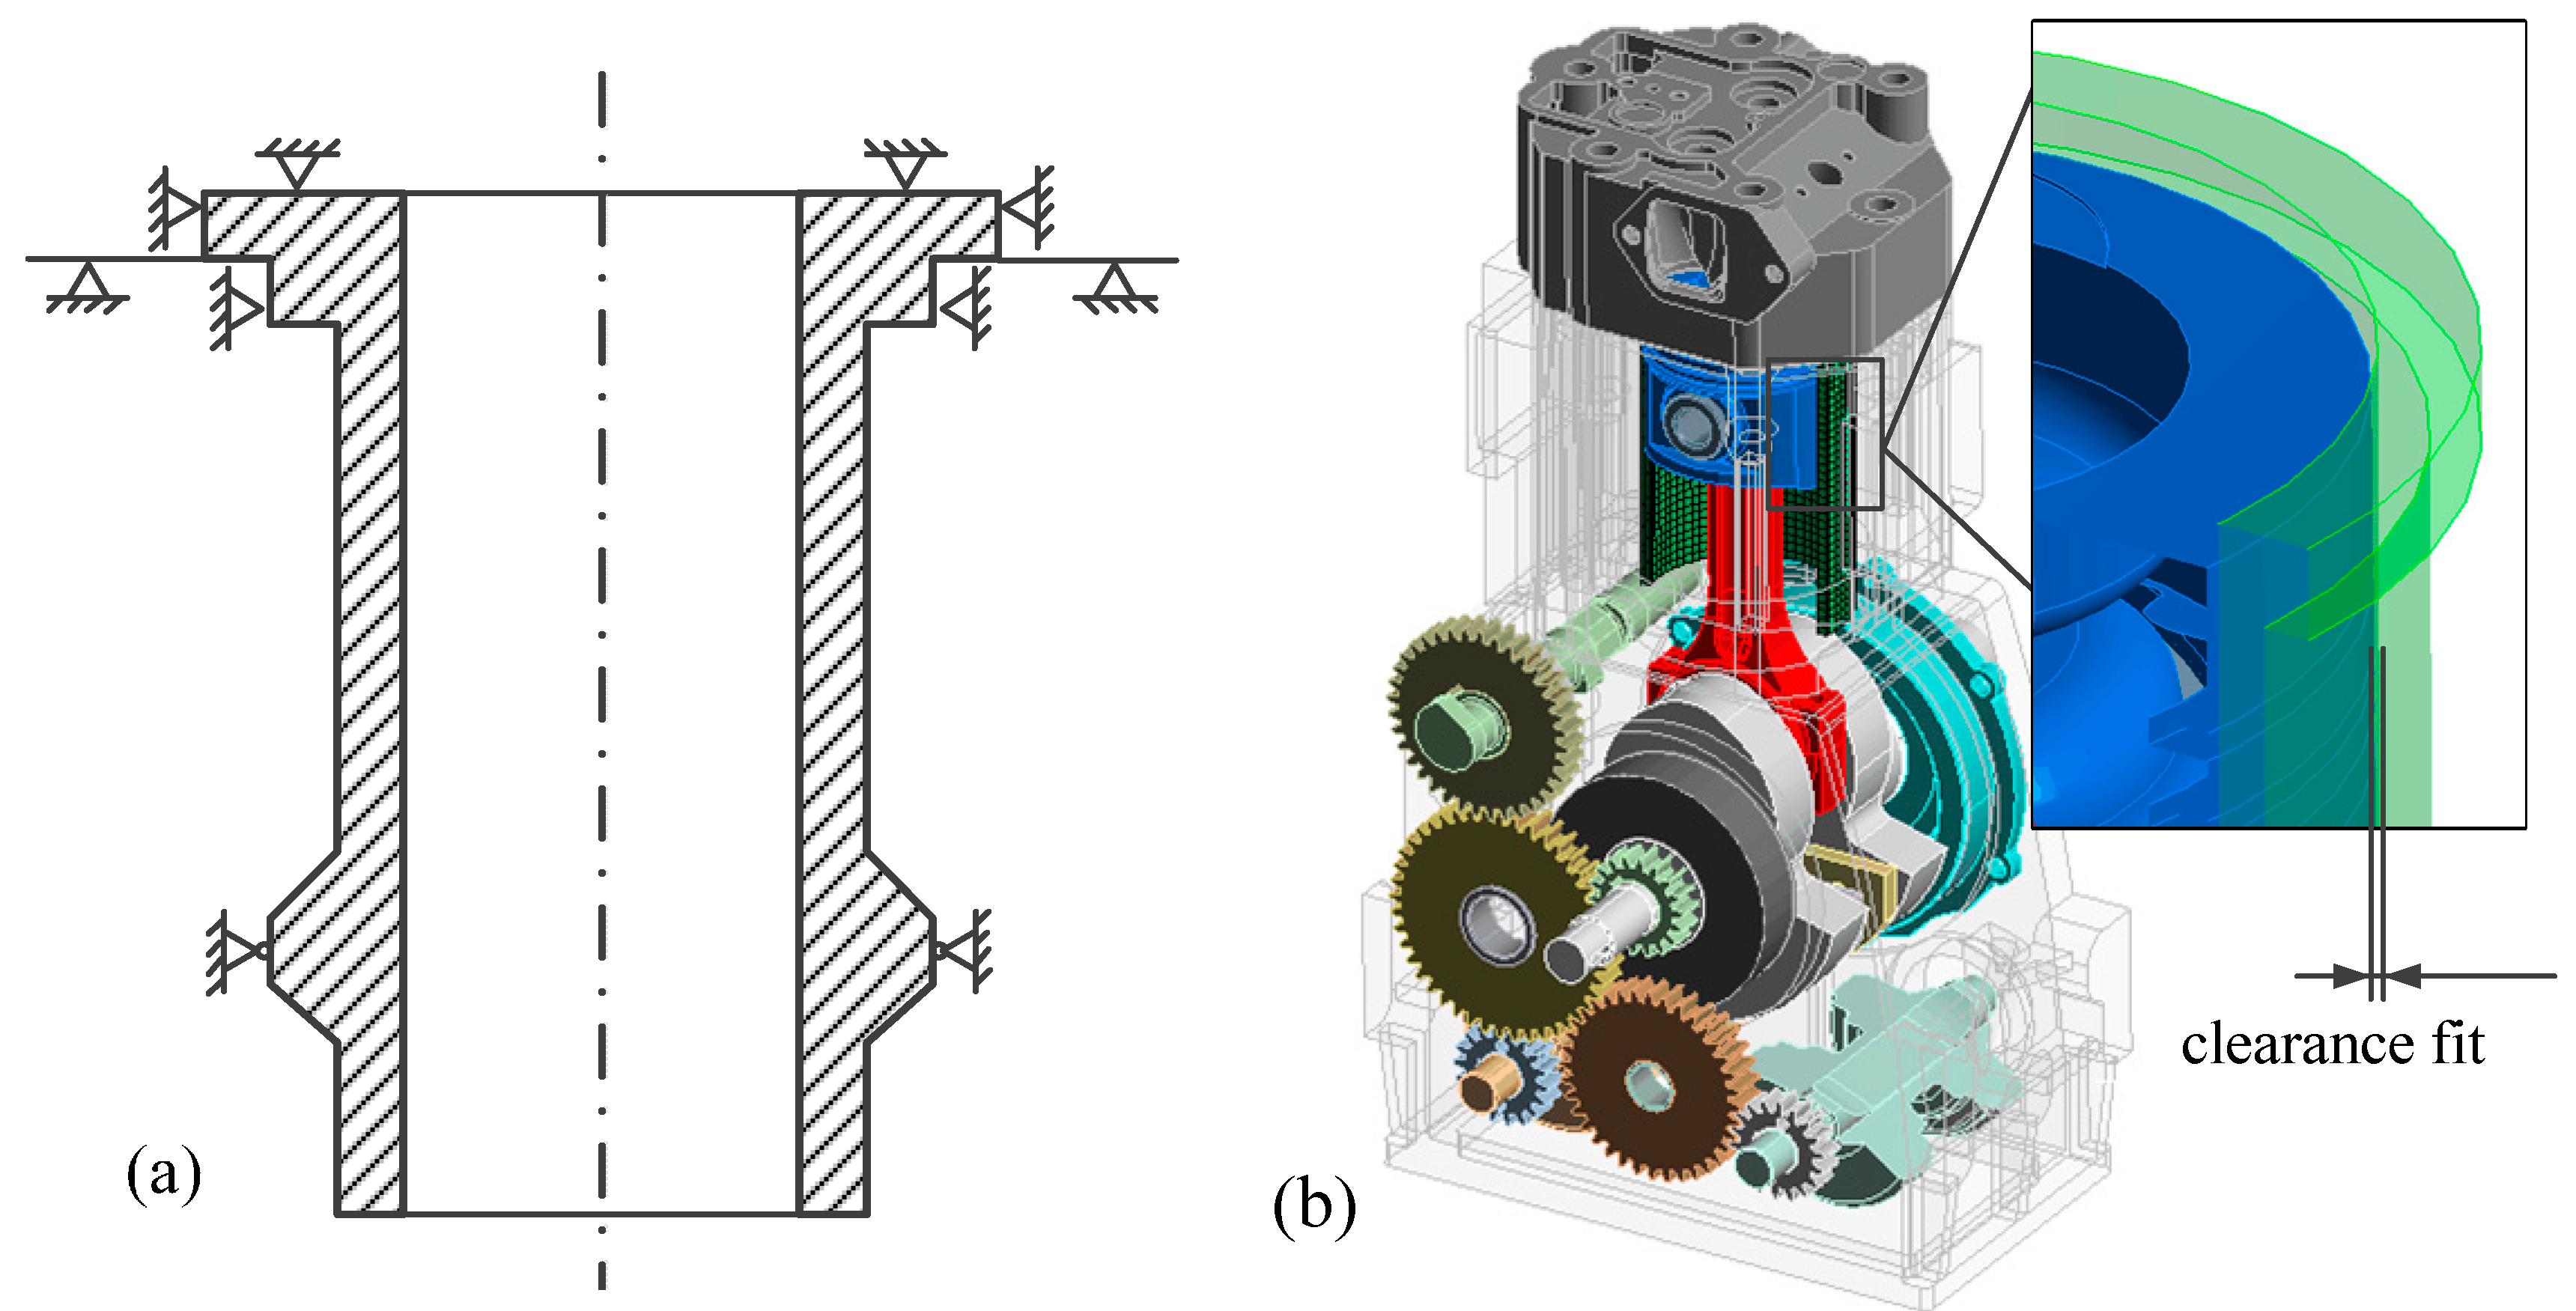
Figure 3.
Short-time Fourier transform (STFT) of measured in-cylinder pressure; (a) STFT result of the pressure measured at engine speed of 1800 rpm and load of 40 Nm; (b) Raw pressure signal and the pressure rise rate.
Figure 3.
Short-time Fourier transform (STFT) of measured in-cylinder pressure; (a) STFT result of the pressure measured at engine speed of 1800 rpm and load of 40 Nm; (b) Raw pressure signal and the pressure rise rate.

Figure 4.
Dynamic model of cylinder assembly.
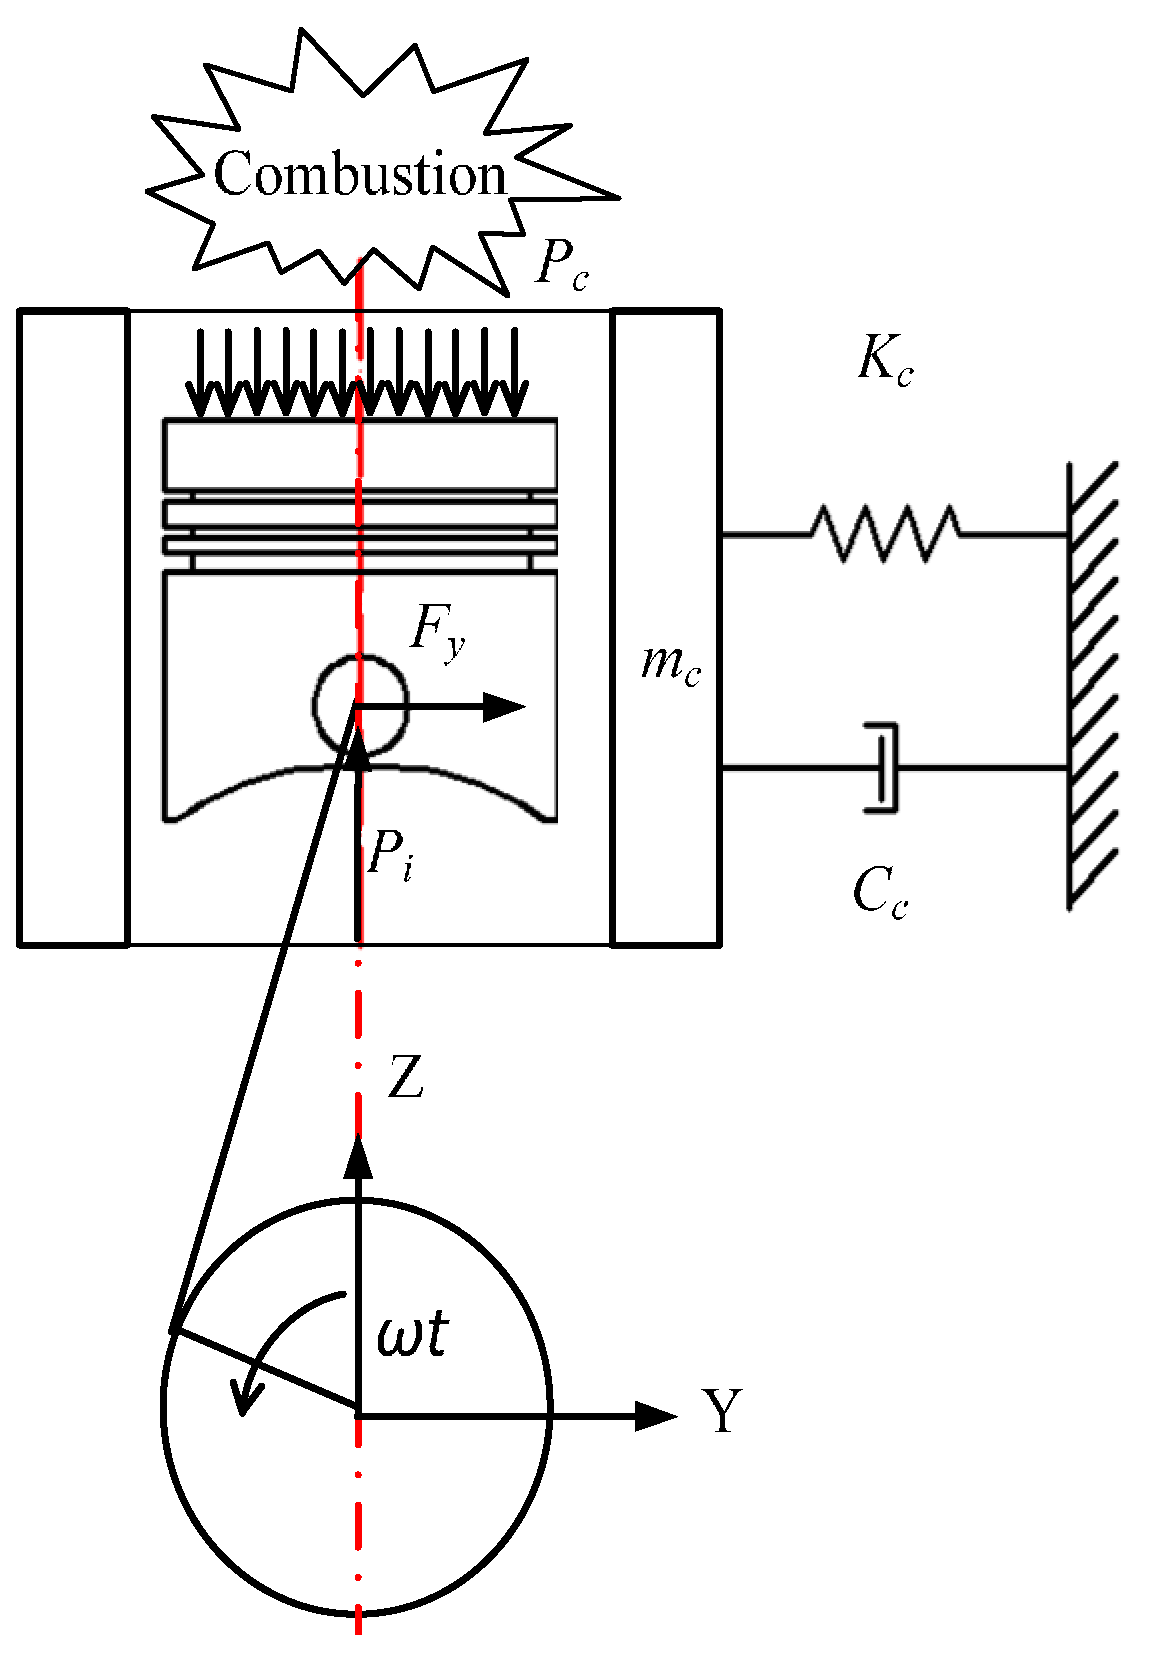
Figure 5.
Excitation configurations of cylinder model; (a) Piston slap; (b) Combustion shock.

Figure 6.
Total deformation of cylinder liner (mm); (a) Response to combustion shock; (b) Response to piston slap.
Figure 6.
Total deformation of cylinder liner (mm); (a) Response to combustion shock; (b) Response to piston slap.
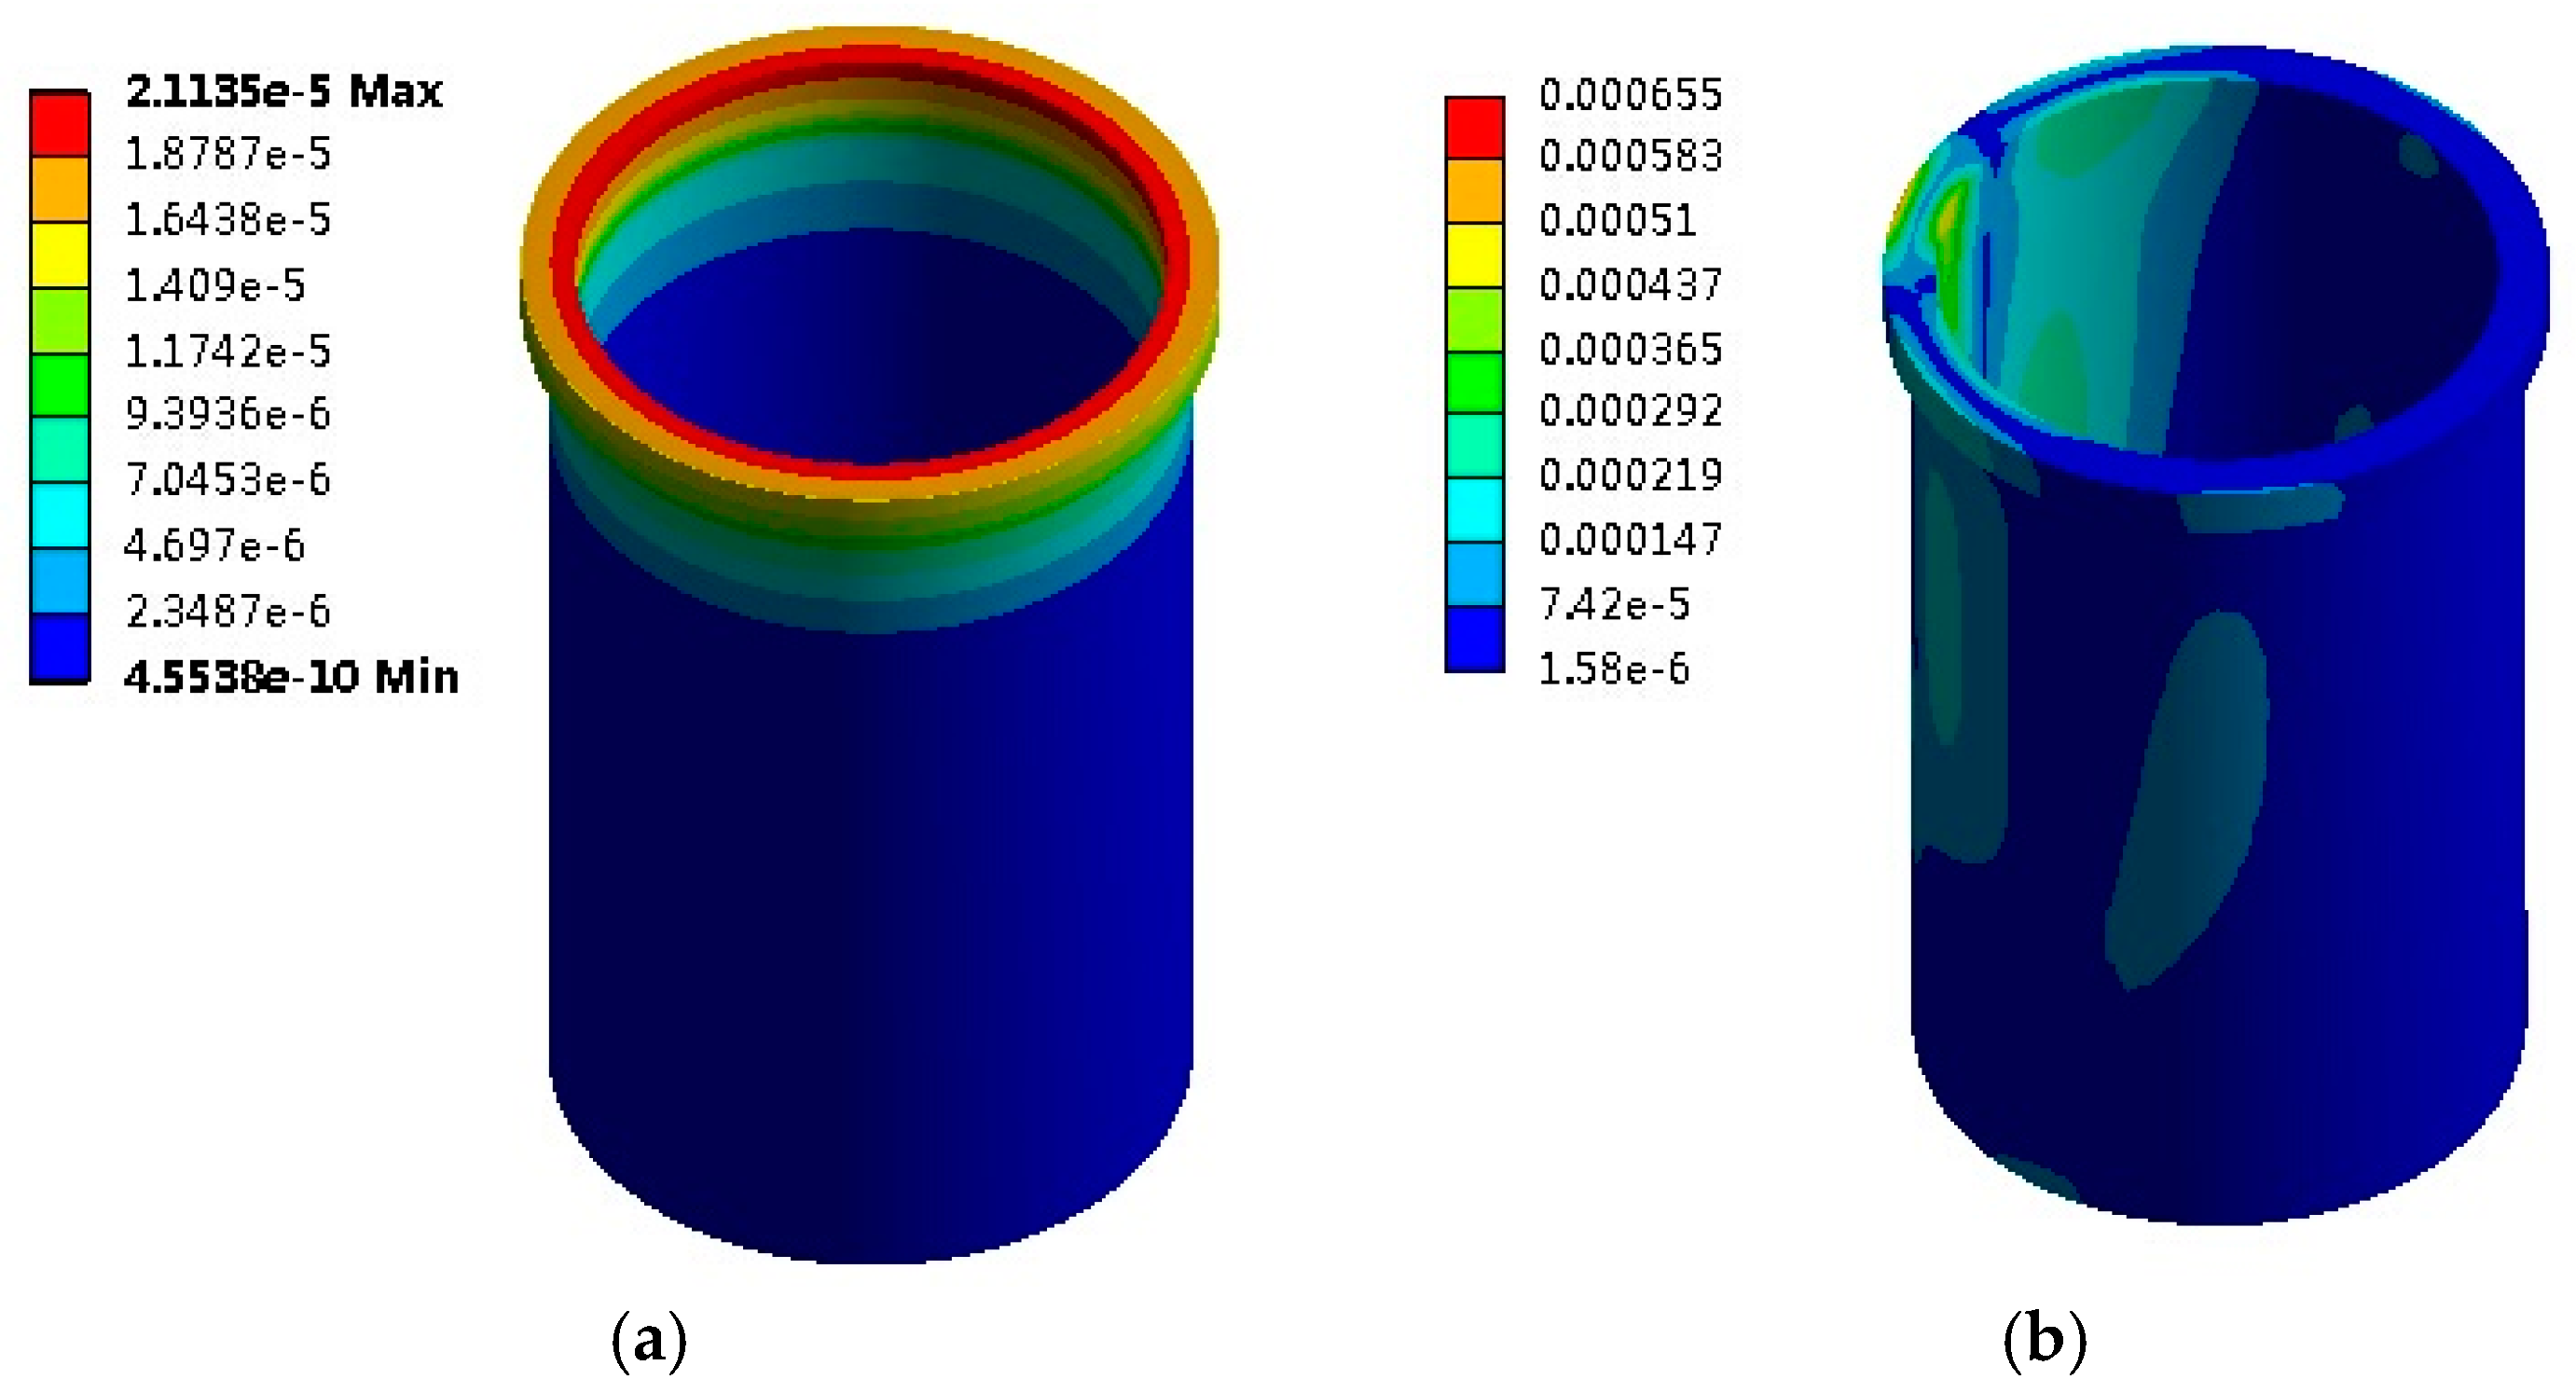
Figure 7.
Comparison of simulated and measured acceleration spectra.

Figure 8.
In-cylinder pressure curves and pressure rise rates: (a) Measured in-cylinder pressure; (b) Rise rate of in-cylinder pressure.
Figure 8.
In-cylinder pressure curves and pressure rise rates: (a) Measured in-cylinder pressure; (b) Rise rate of in-cylinder pressure.

Figure 9.
Piston side-thrust forces of alternative fuels under different operating conditions: 1000 rpm and 10 Nm; (b) 1000 rpm and 40 Nm; (c) 1800 rpm and 10 Nm; (d) 800 rpm and 40 Nm.
Figure 9.
Piston side-thrust forces of alternative fuels under different operating conditions: 1000 rpm and 10 Nm; (b) 1000 rpm and 40 Nm; (c) 1800 rpm and 10 Nm; (d) 800 rpm and 40 Nm.
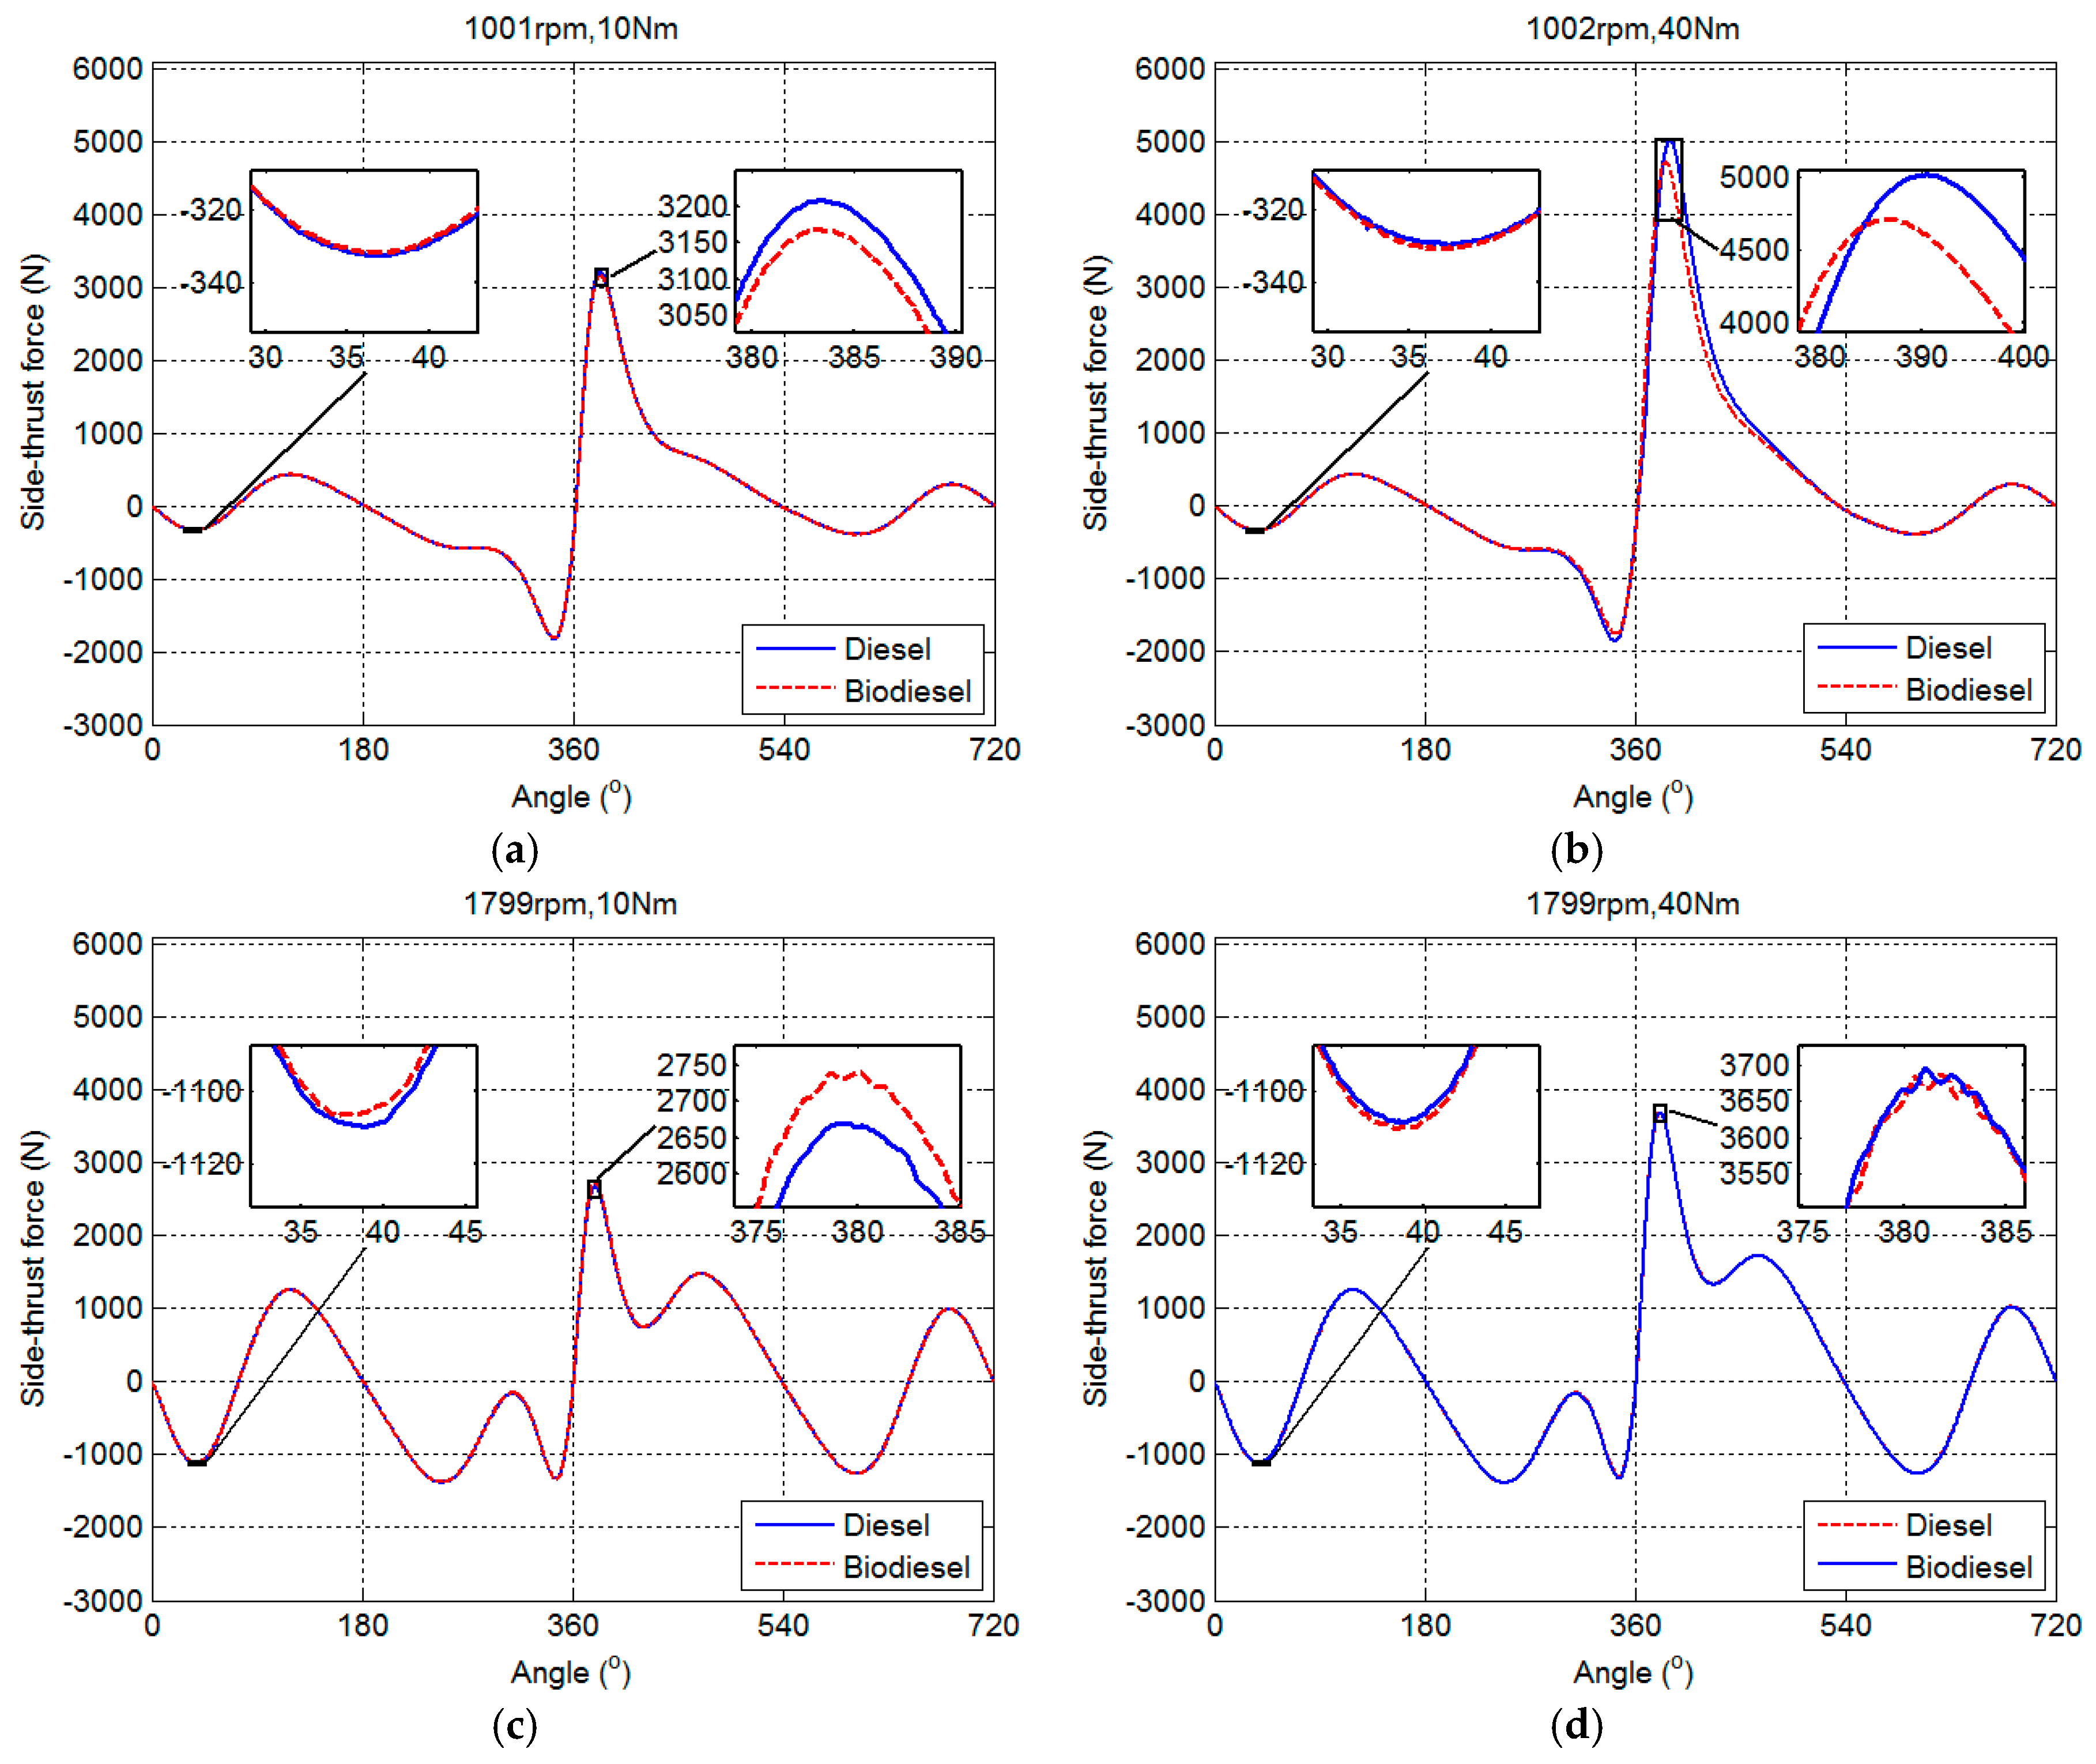
Figure 10.
Piston side-thrust forces of alternative fuels under different operating conditions: (a) In-cylinder pressure around 380°–385°; (b) Peak values of force rise rate.
Figure 10.
Piston side-thrust forces of alternative fuels under different operating conditions: (a) In-cylinder pressure around 380°–385°; (b) Peak values of force rise rate.
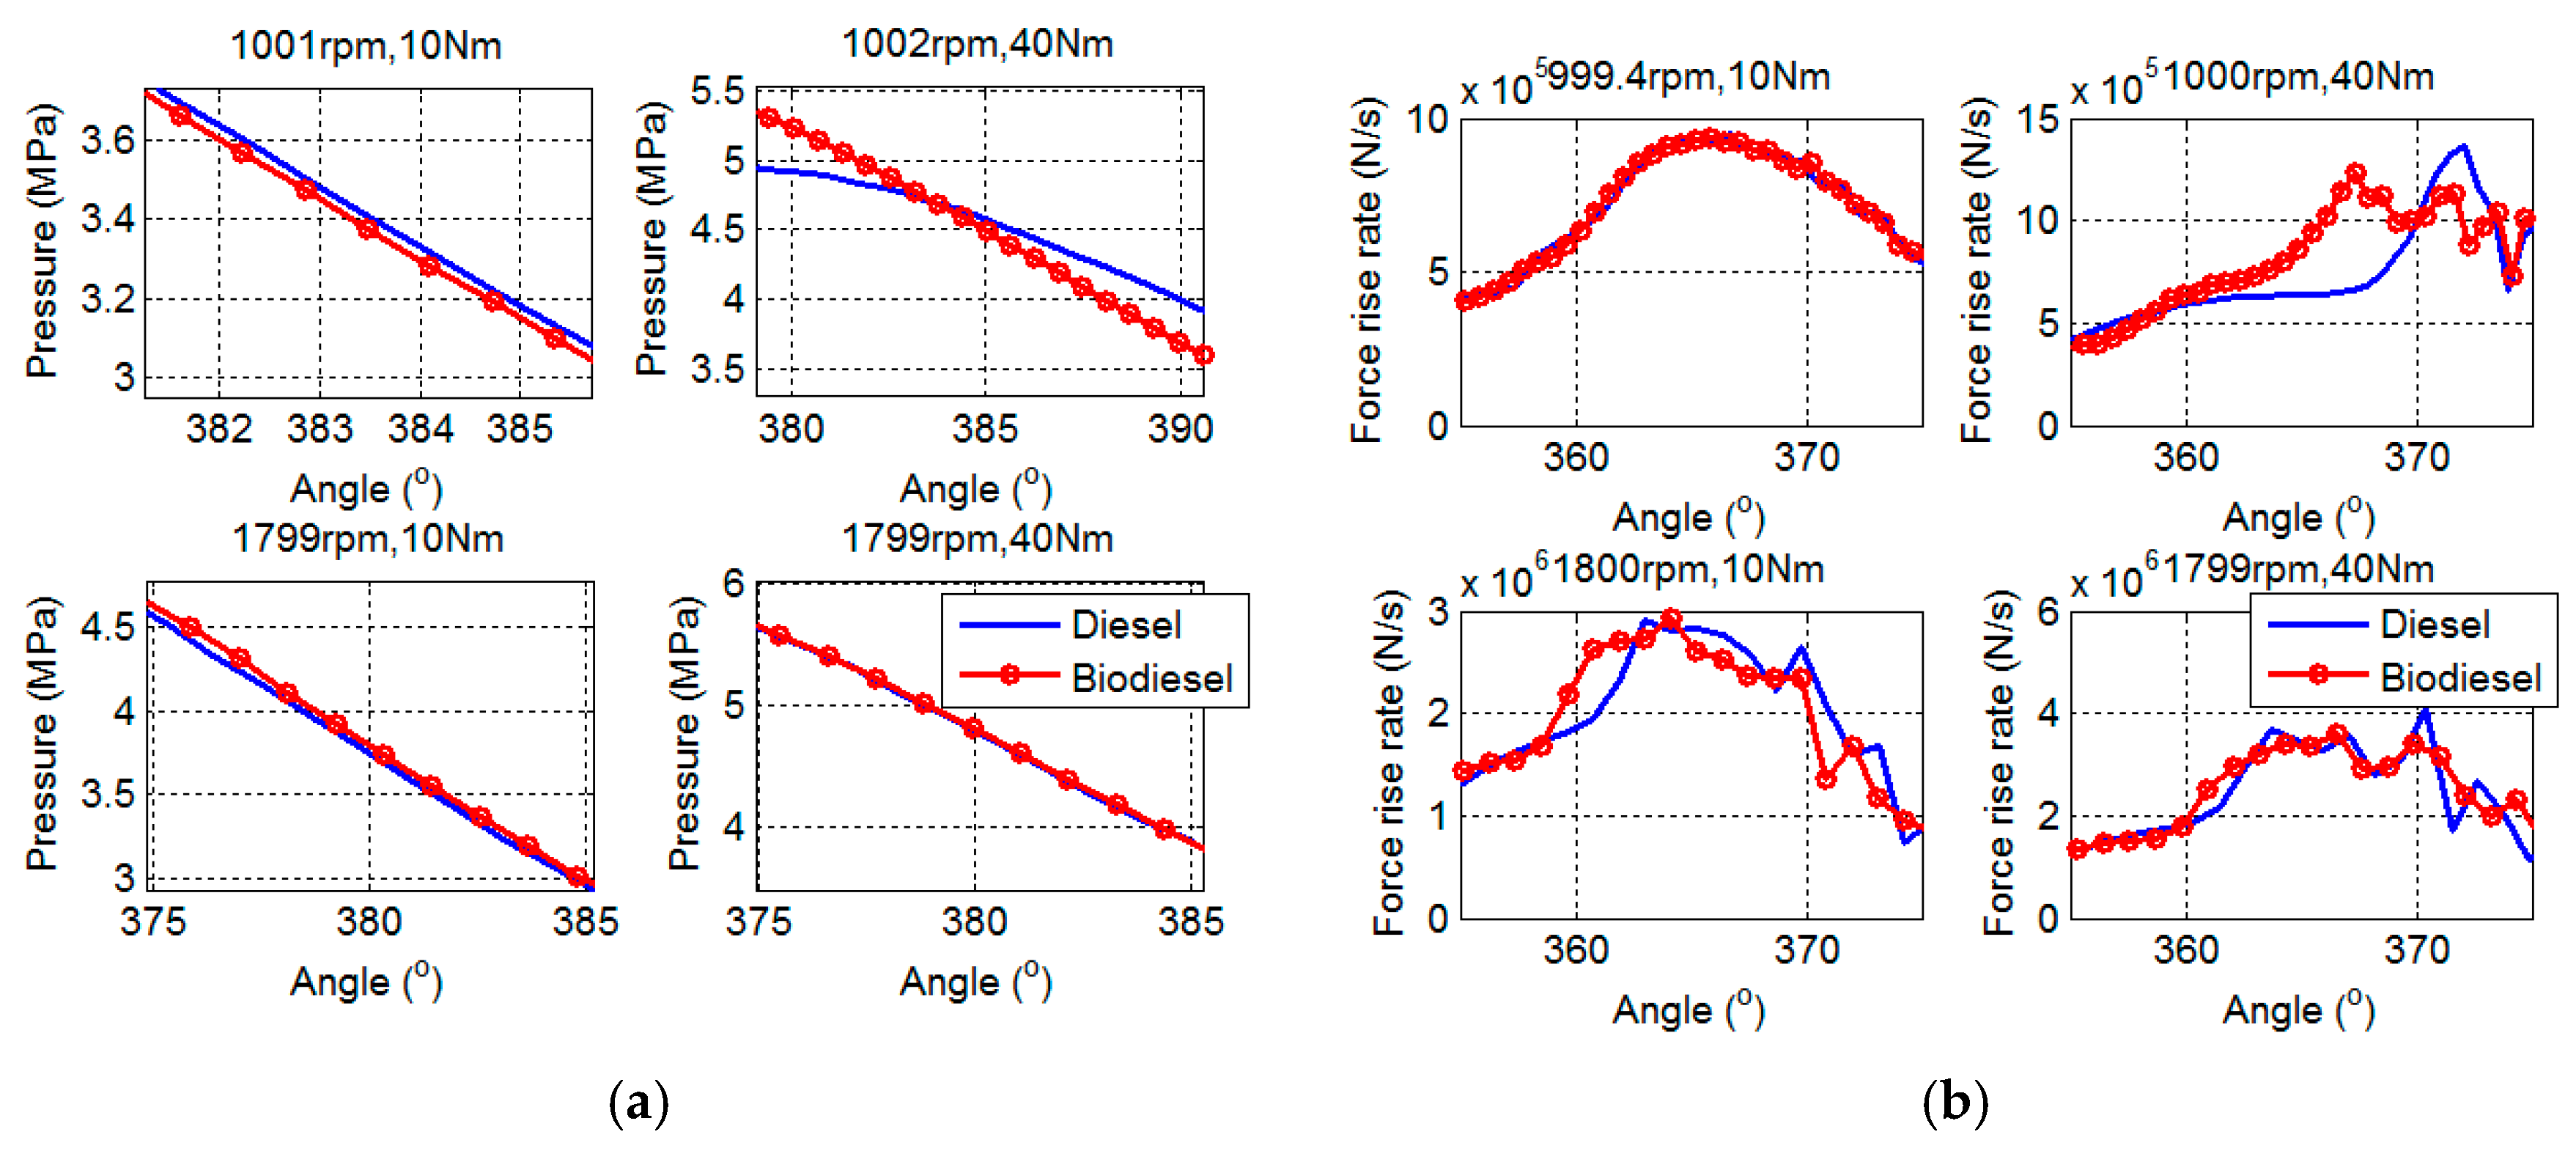
Figure 11.
Short-time Fourier transform (STFT) of predicted displacement response to combustion under 40 Nm and 1800 rpm; (a) STFT result of predicted displacement response; (b) Predicted displacement and acceleration responses.
Figure 11.
Short-time Fourier transform (STFT) of predicted displacement response to combustion under 40 Nm and 1800 rpm; (a) STFT result of predicted displacement response; (b) Predicted displacement and acceleration responses.
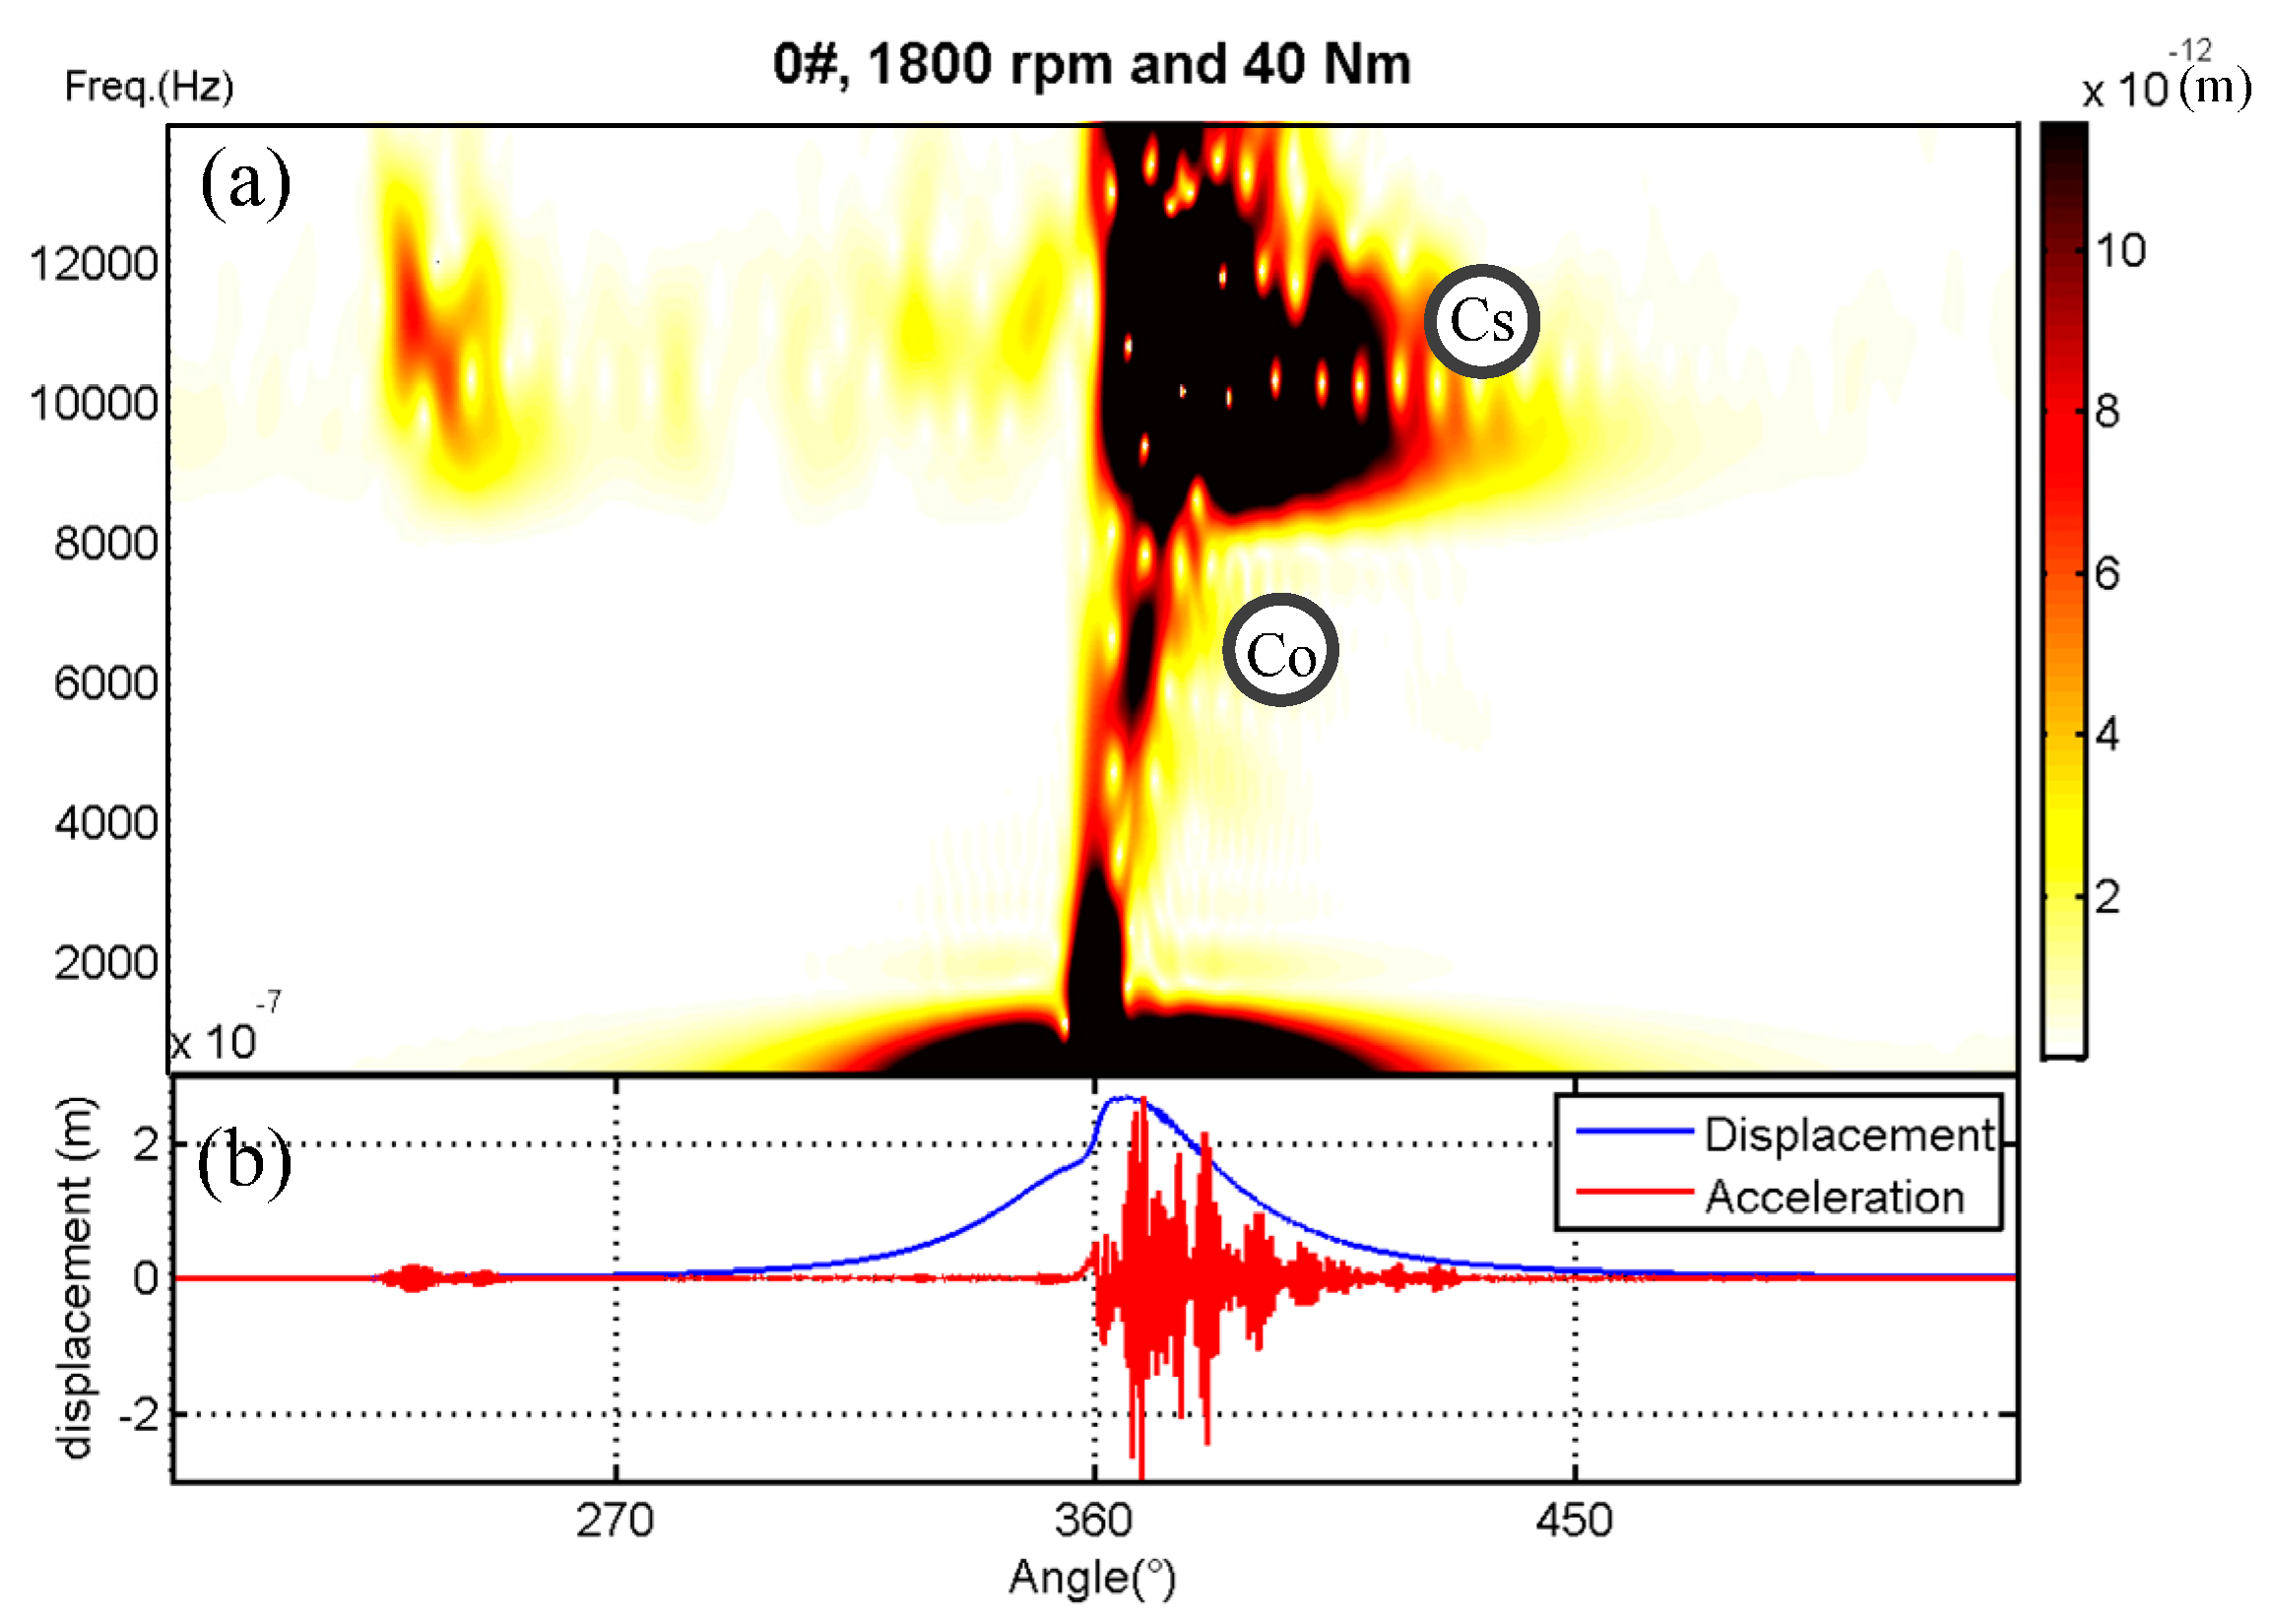
Figure 12.
The Short-time Fourier transform (STFT) of dynamic responses to the combustion of biodiesel, 1800/40 (m); (a) STFT result of predicted displacement response; (b) Predicted displacement and acceleration responses.
Figure 12.
The Short-time Fourier transform (STFT) of dynamic responses to the combustion of biodiesel, 1800/40 (m); (a) STFT result of predicted displacement response; (b) Predicted displacement and acceleration responses.
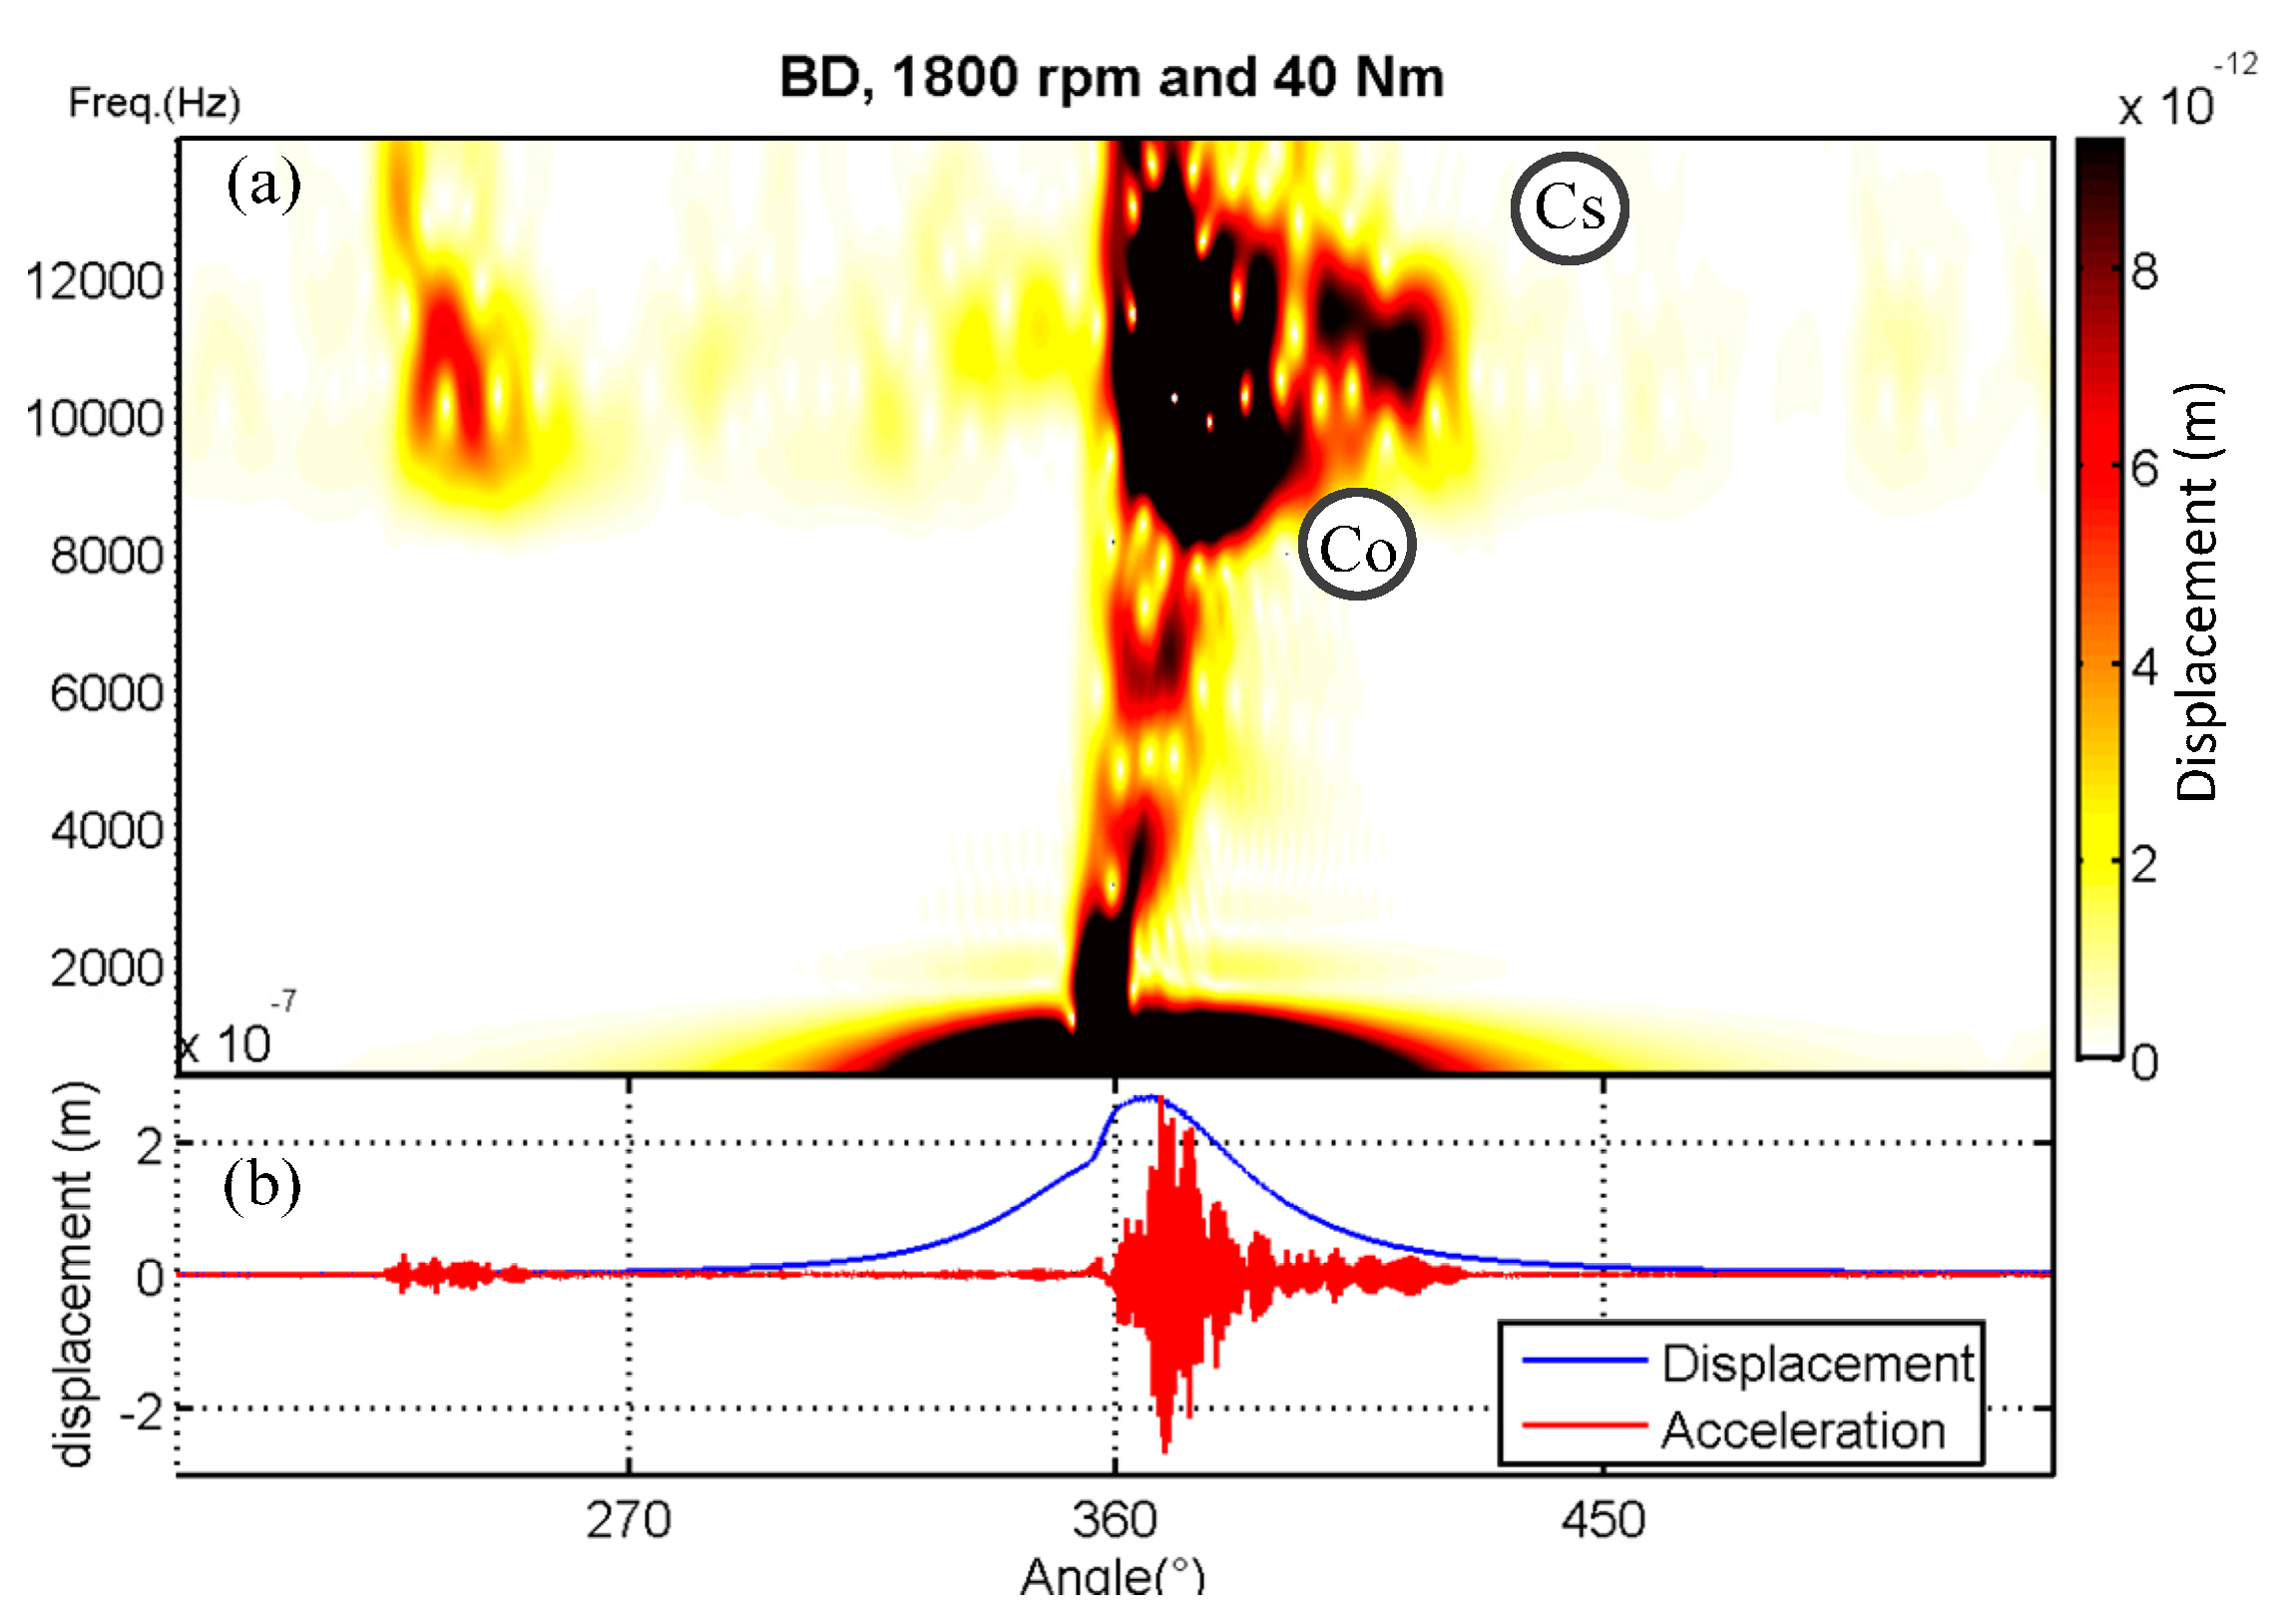
Figure 13.
Short-time Fourier transform (STFT) of responses to piston slaps under 40 and 1800 Nm; (a) STFT result of predicted displacement response; (b) Piston side-thrust force, predicted displacement and acceleration responses.
Figure 13.
Short-time Fourier transform (STFT) of responses to piston slaps under 40 and 1800 Nm; (a) STFT result of predicted displacement response; (b) Piston side-thrust force, predicted displacement and acceleration responses.

Figure 14.
The Short-time Fourier transform (STFT) of dynamic responses to piston slaps of biodiesel; (a) STFT result of predicted displacement response; (b) Piston side-thrust force, predicted displacement and acceleration responses.
Figure 14.
The Short-time Fourier transform (STFT) of dynamic responses to piston slaps of biodiesel; (a) STFT result of predicted displacement response; (b) Piston side-thrust force, predicted displacement and acceleration responses.

Figure 15.
The variation trends of combustion shock-induced events; (a) Root mean square (RMS) results of pressure oscillations and Impact Co event; (b) Root mean square (RMS) results of Impact Cs under different loads.
Figure 15.
The variation trends of combustion shock-induced events; (a) Root mean square (RMS) results of pressure oscillations and Impact Co event; (b) Root mean square (RMS) results of Impact Cs under different loads.

Figure 16.
The variation trends of combustion piston slap-induced events; (a) Root mean square (RMS) results of predicted displacement response after exhaust top dead center (TDC); (b) RMS results of predicted displacement response after combustion TDC.
Figure 16.
The variation trends of combustion piston slap-induced events; (a) Root mean square (RMS) results of predicted displacement response after exhaust top dead center (TDC); (b) RMS results of predicted displacement response after combustion TDC.
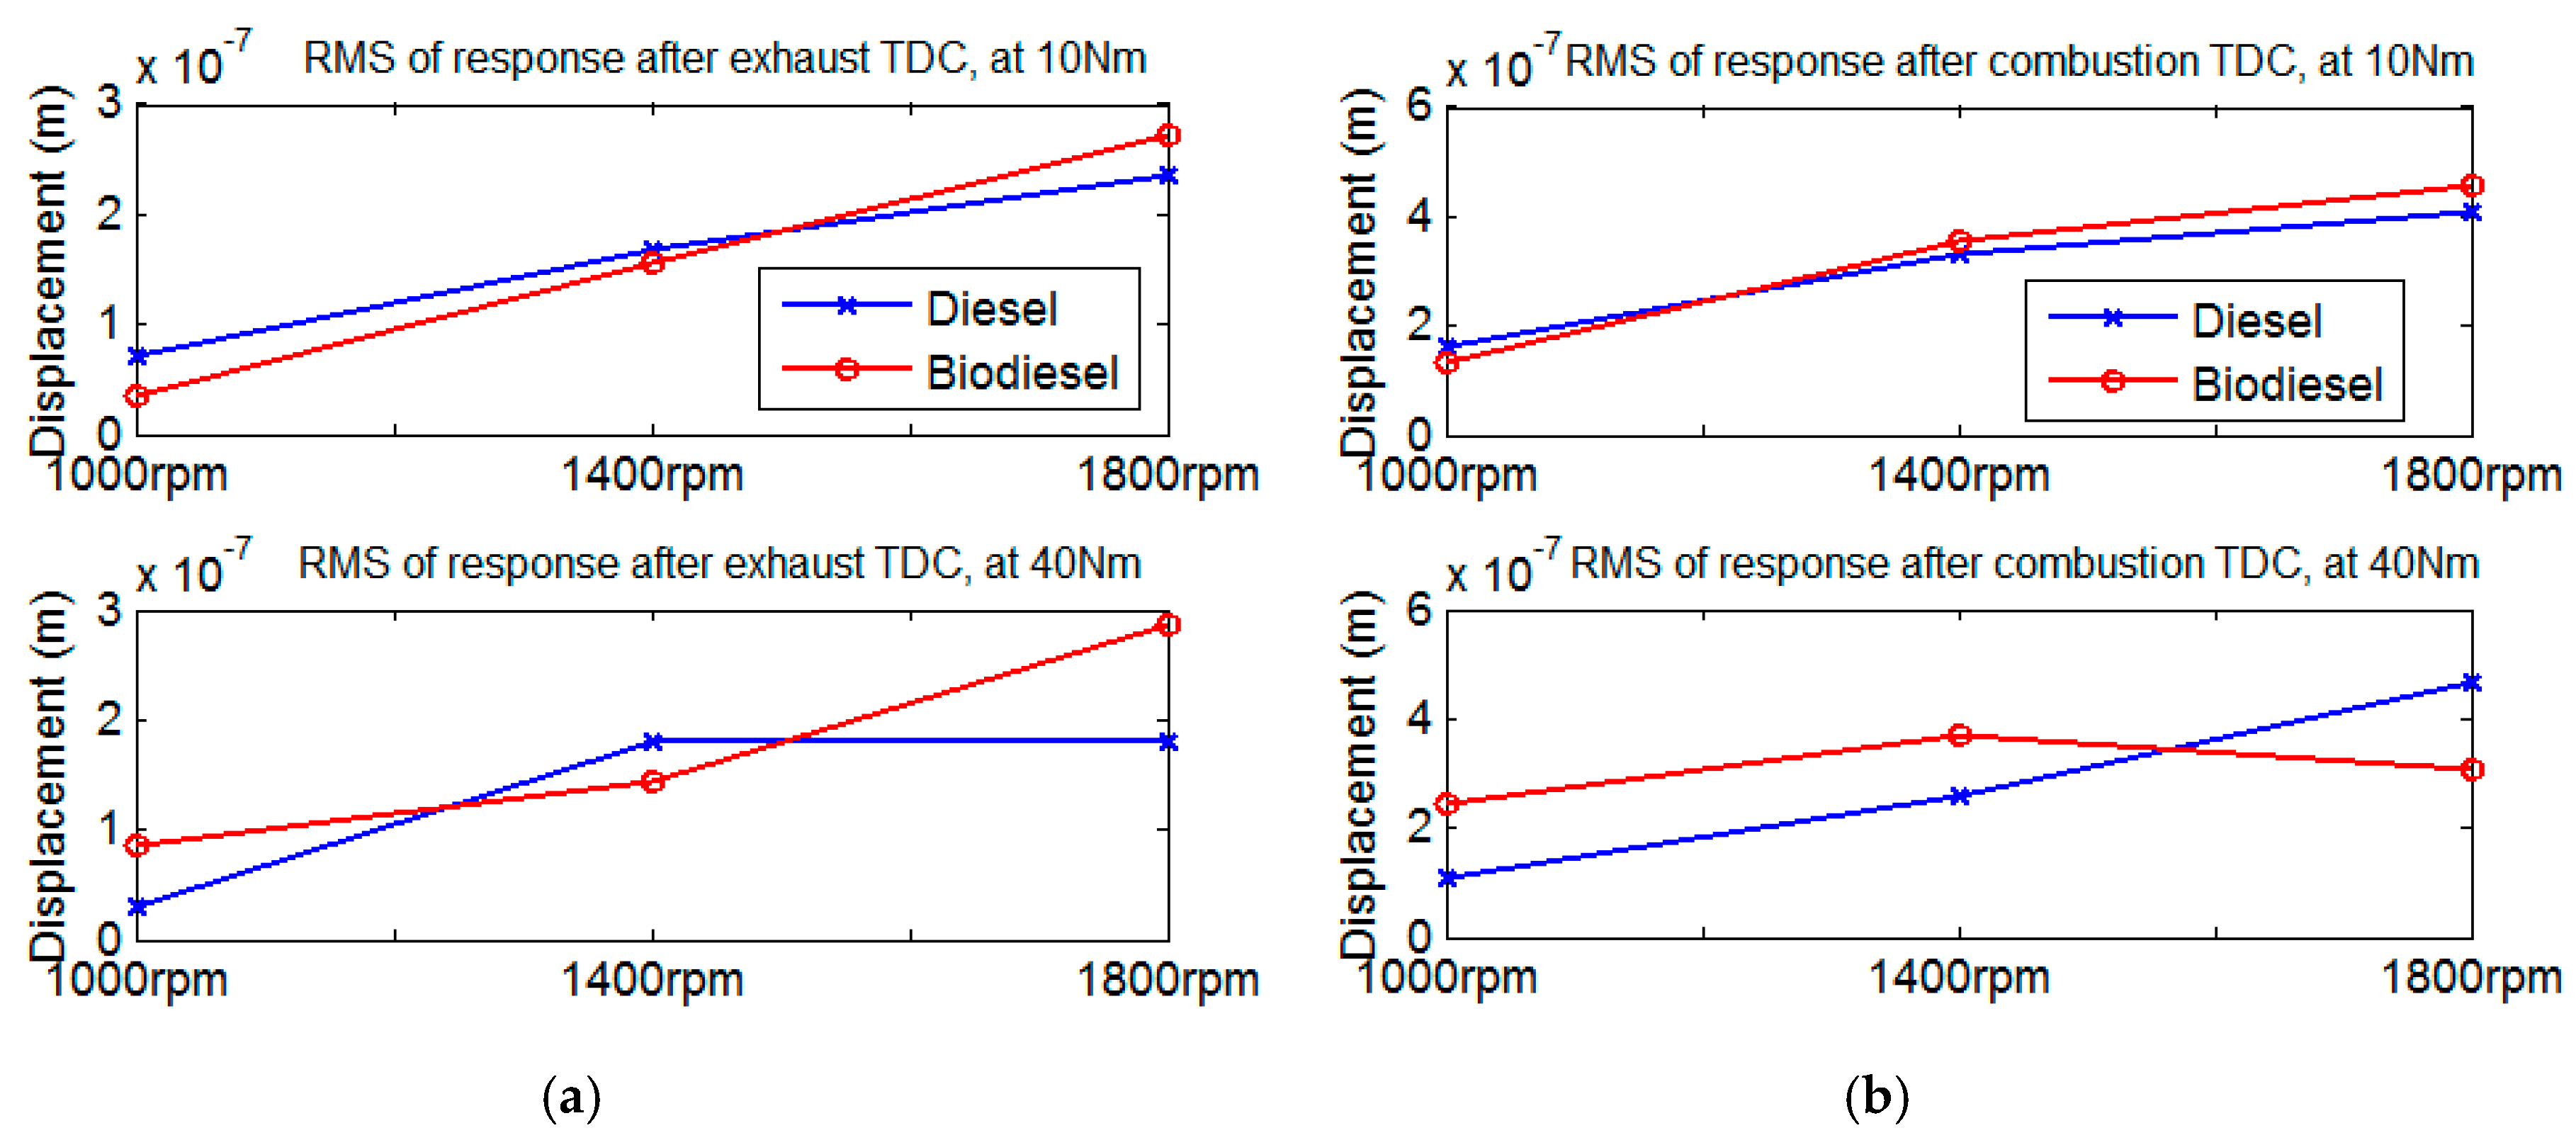
Figure 17.
The decomposition of combustion force and axial inertia force.

Figure 18.
Schematic of the diesel engine test rig.

Figure 19.
Continuous wavelet transform (CWT) of vibration signal fueled with diesel under 40 Nm and 1800 rpm: (a) CWT result of measured acceleration response; (b) Measured in-cylinder pressure and calculated piston side-thrust force.
Figure 19.
Continuous wavelet transform (CWT) of vibration signal fueled with diesel under 40 Nm and 1800 rpm: (a) CWT result of measured acceleration response; (b) Measured in-cylinder pressure and calculated piston side-thrust force.
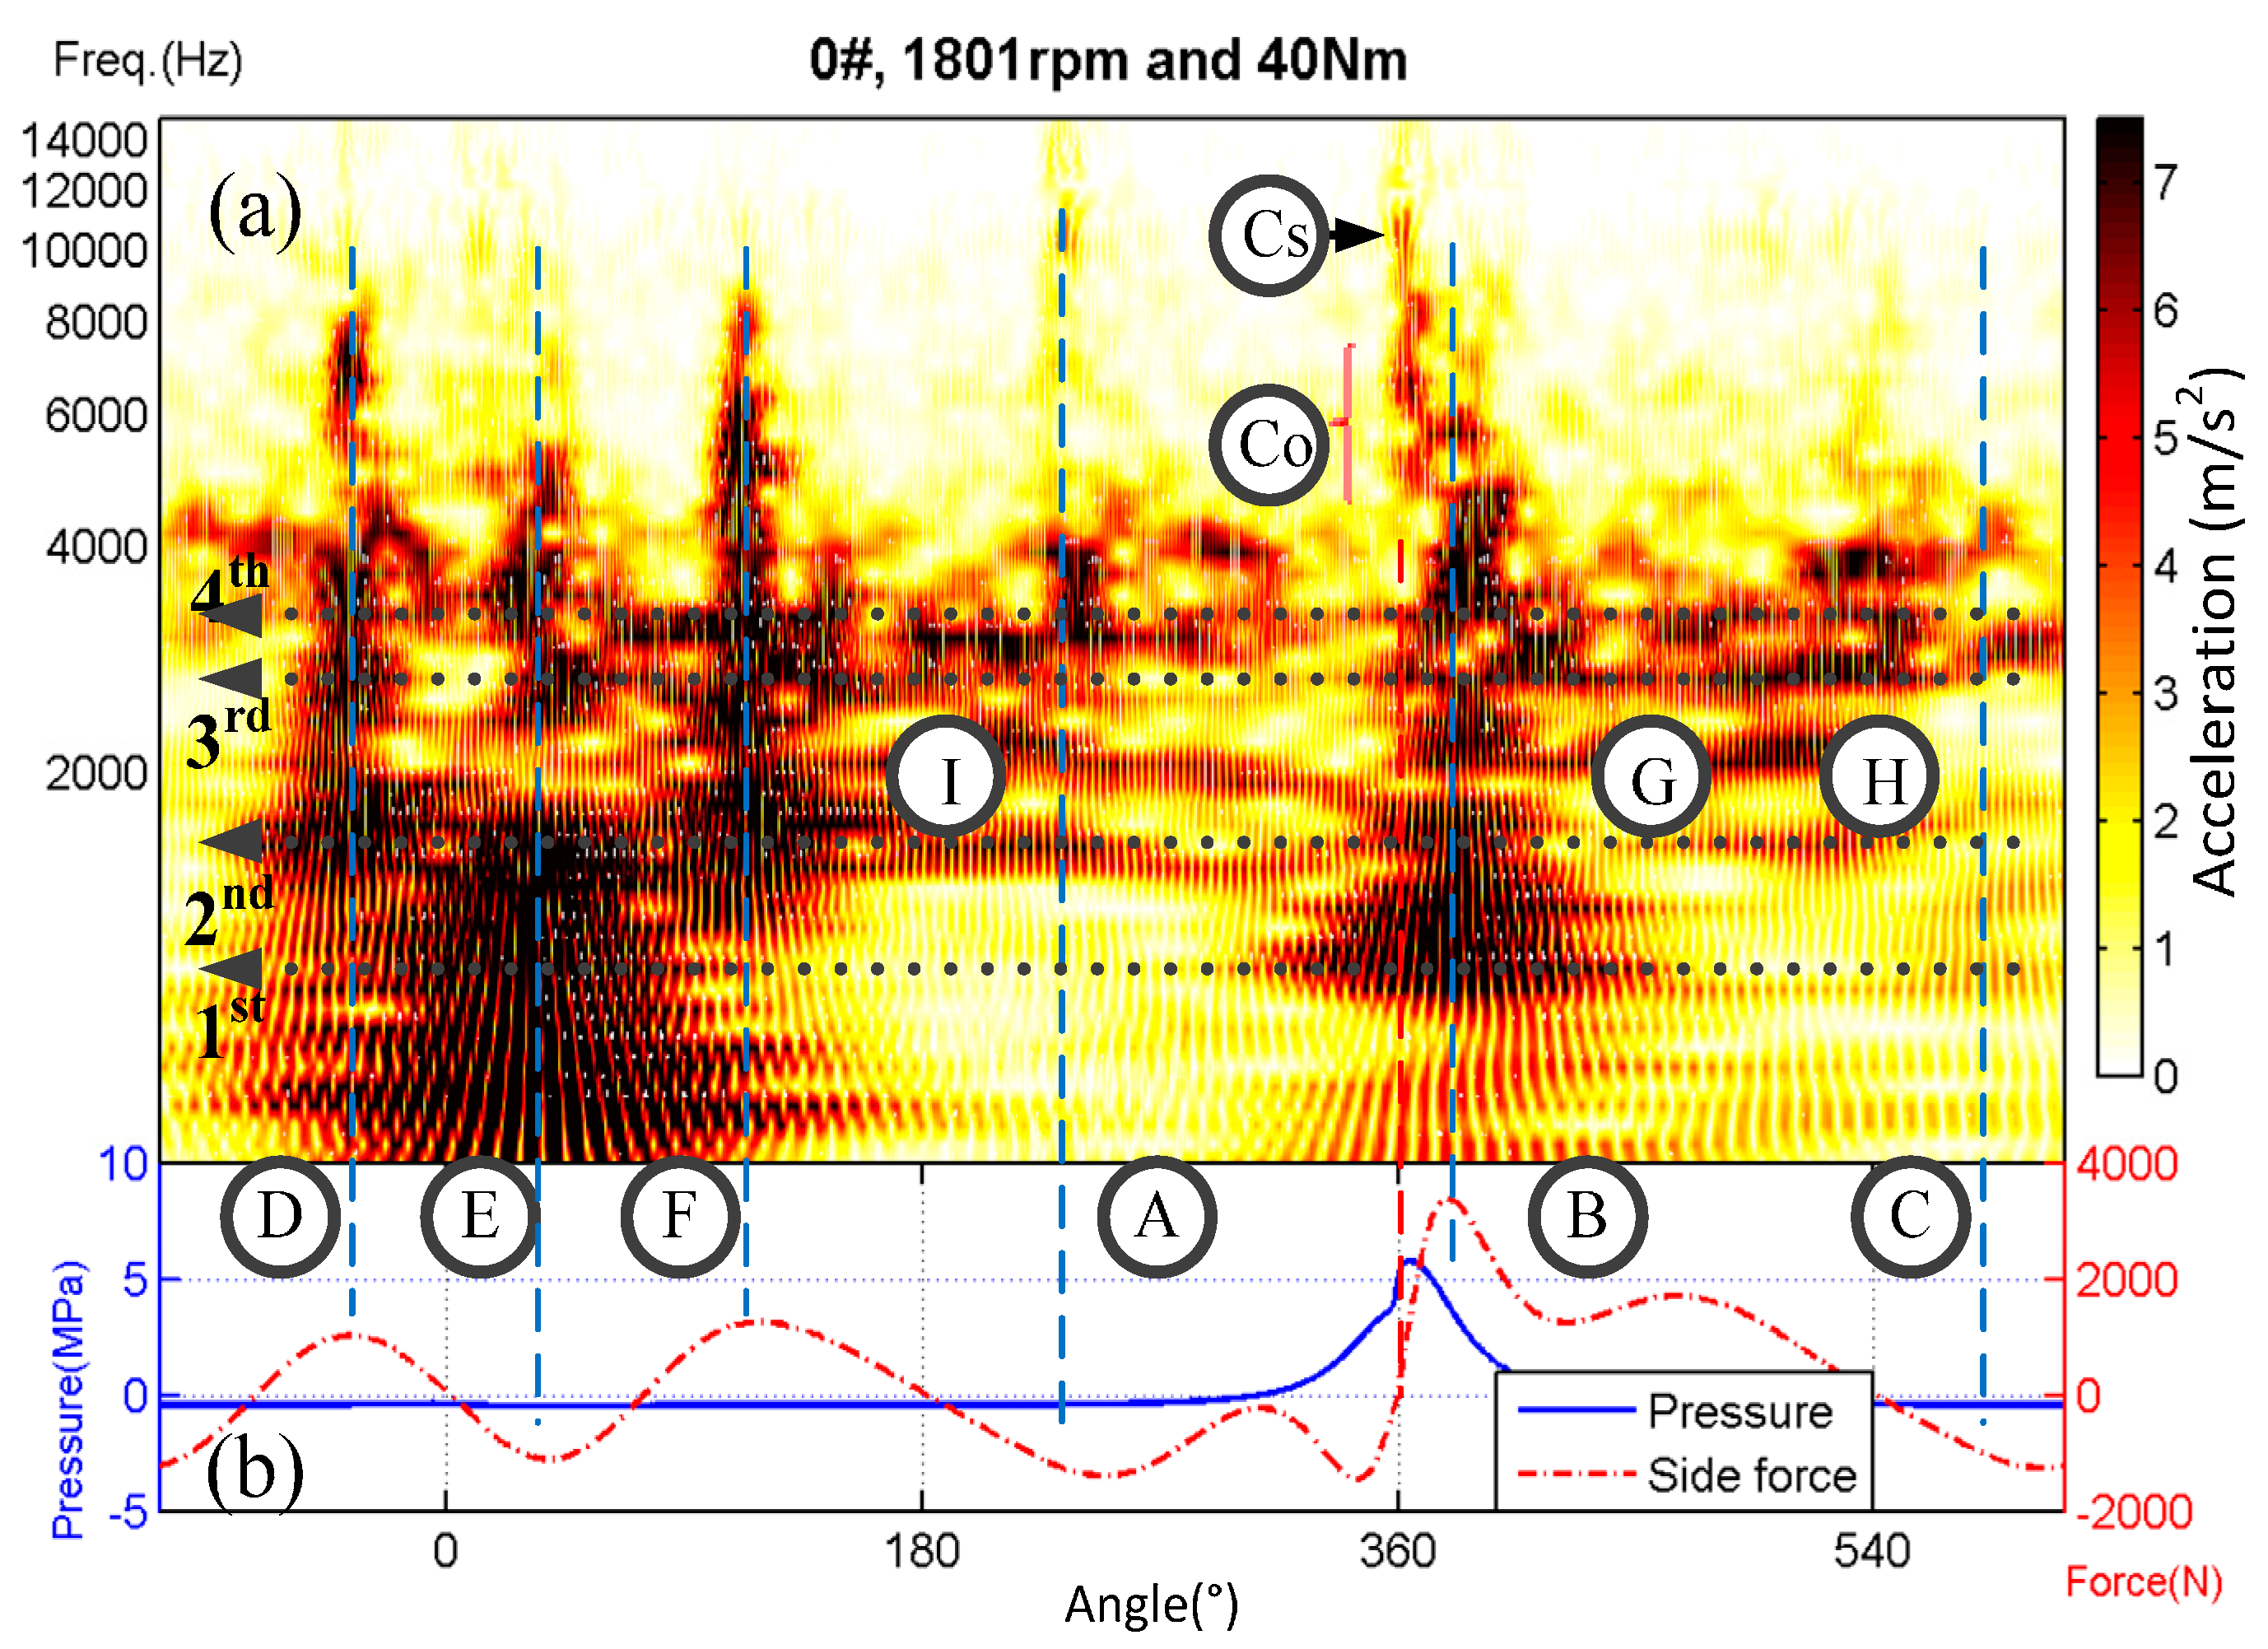
Figure 20.
Continuous wavelet transform (CWT) of vibration signal fueled with biodiesel under 40 Nm and 1800 rpm; (a) CWT result of measured acceleration response; (b) Measured in-cylinder pressure and calculated piston side-thrust force.
Figure 20.
Continuous wavelet transform (CWT) of vibration signal fueled with biodiesel under 40 Nm and 1800 rpm; (a) CWT result of measured acceleration response; (b) Measured in-cylinder pressure and calculated piston side-thrust force.

Figure 21.
Continuous wavelet transform (CWT) of vibration signal fueled with diesel under 10 Nm and 1800 rpm; (a) CWT result of measured acceleration response; (b) Measured in-cylinder pressure and calculated piston side-thrust force.
Figure 21.
Continuous wavelet transform (CWT) of vibration signal fueled with diesel under 10 Nm and 1800 rpm; (a) CWT result of measured acceleration response; (b) Measured in-cylinder pressure and calculated piston side-thrust force.
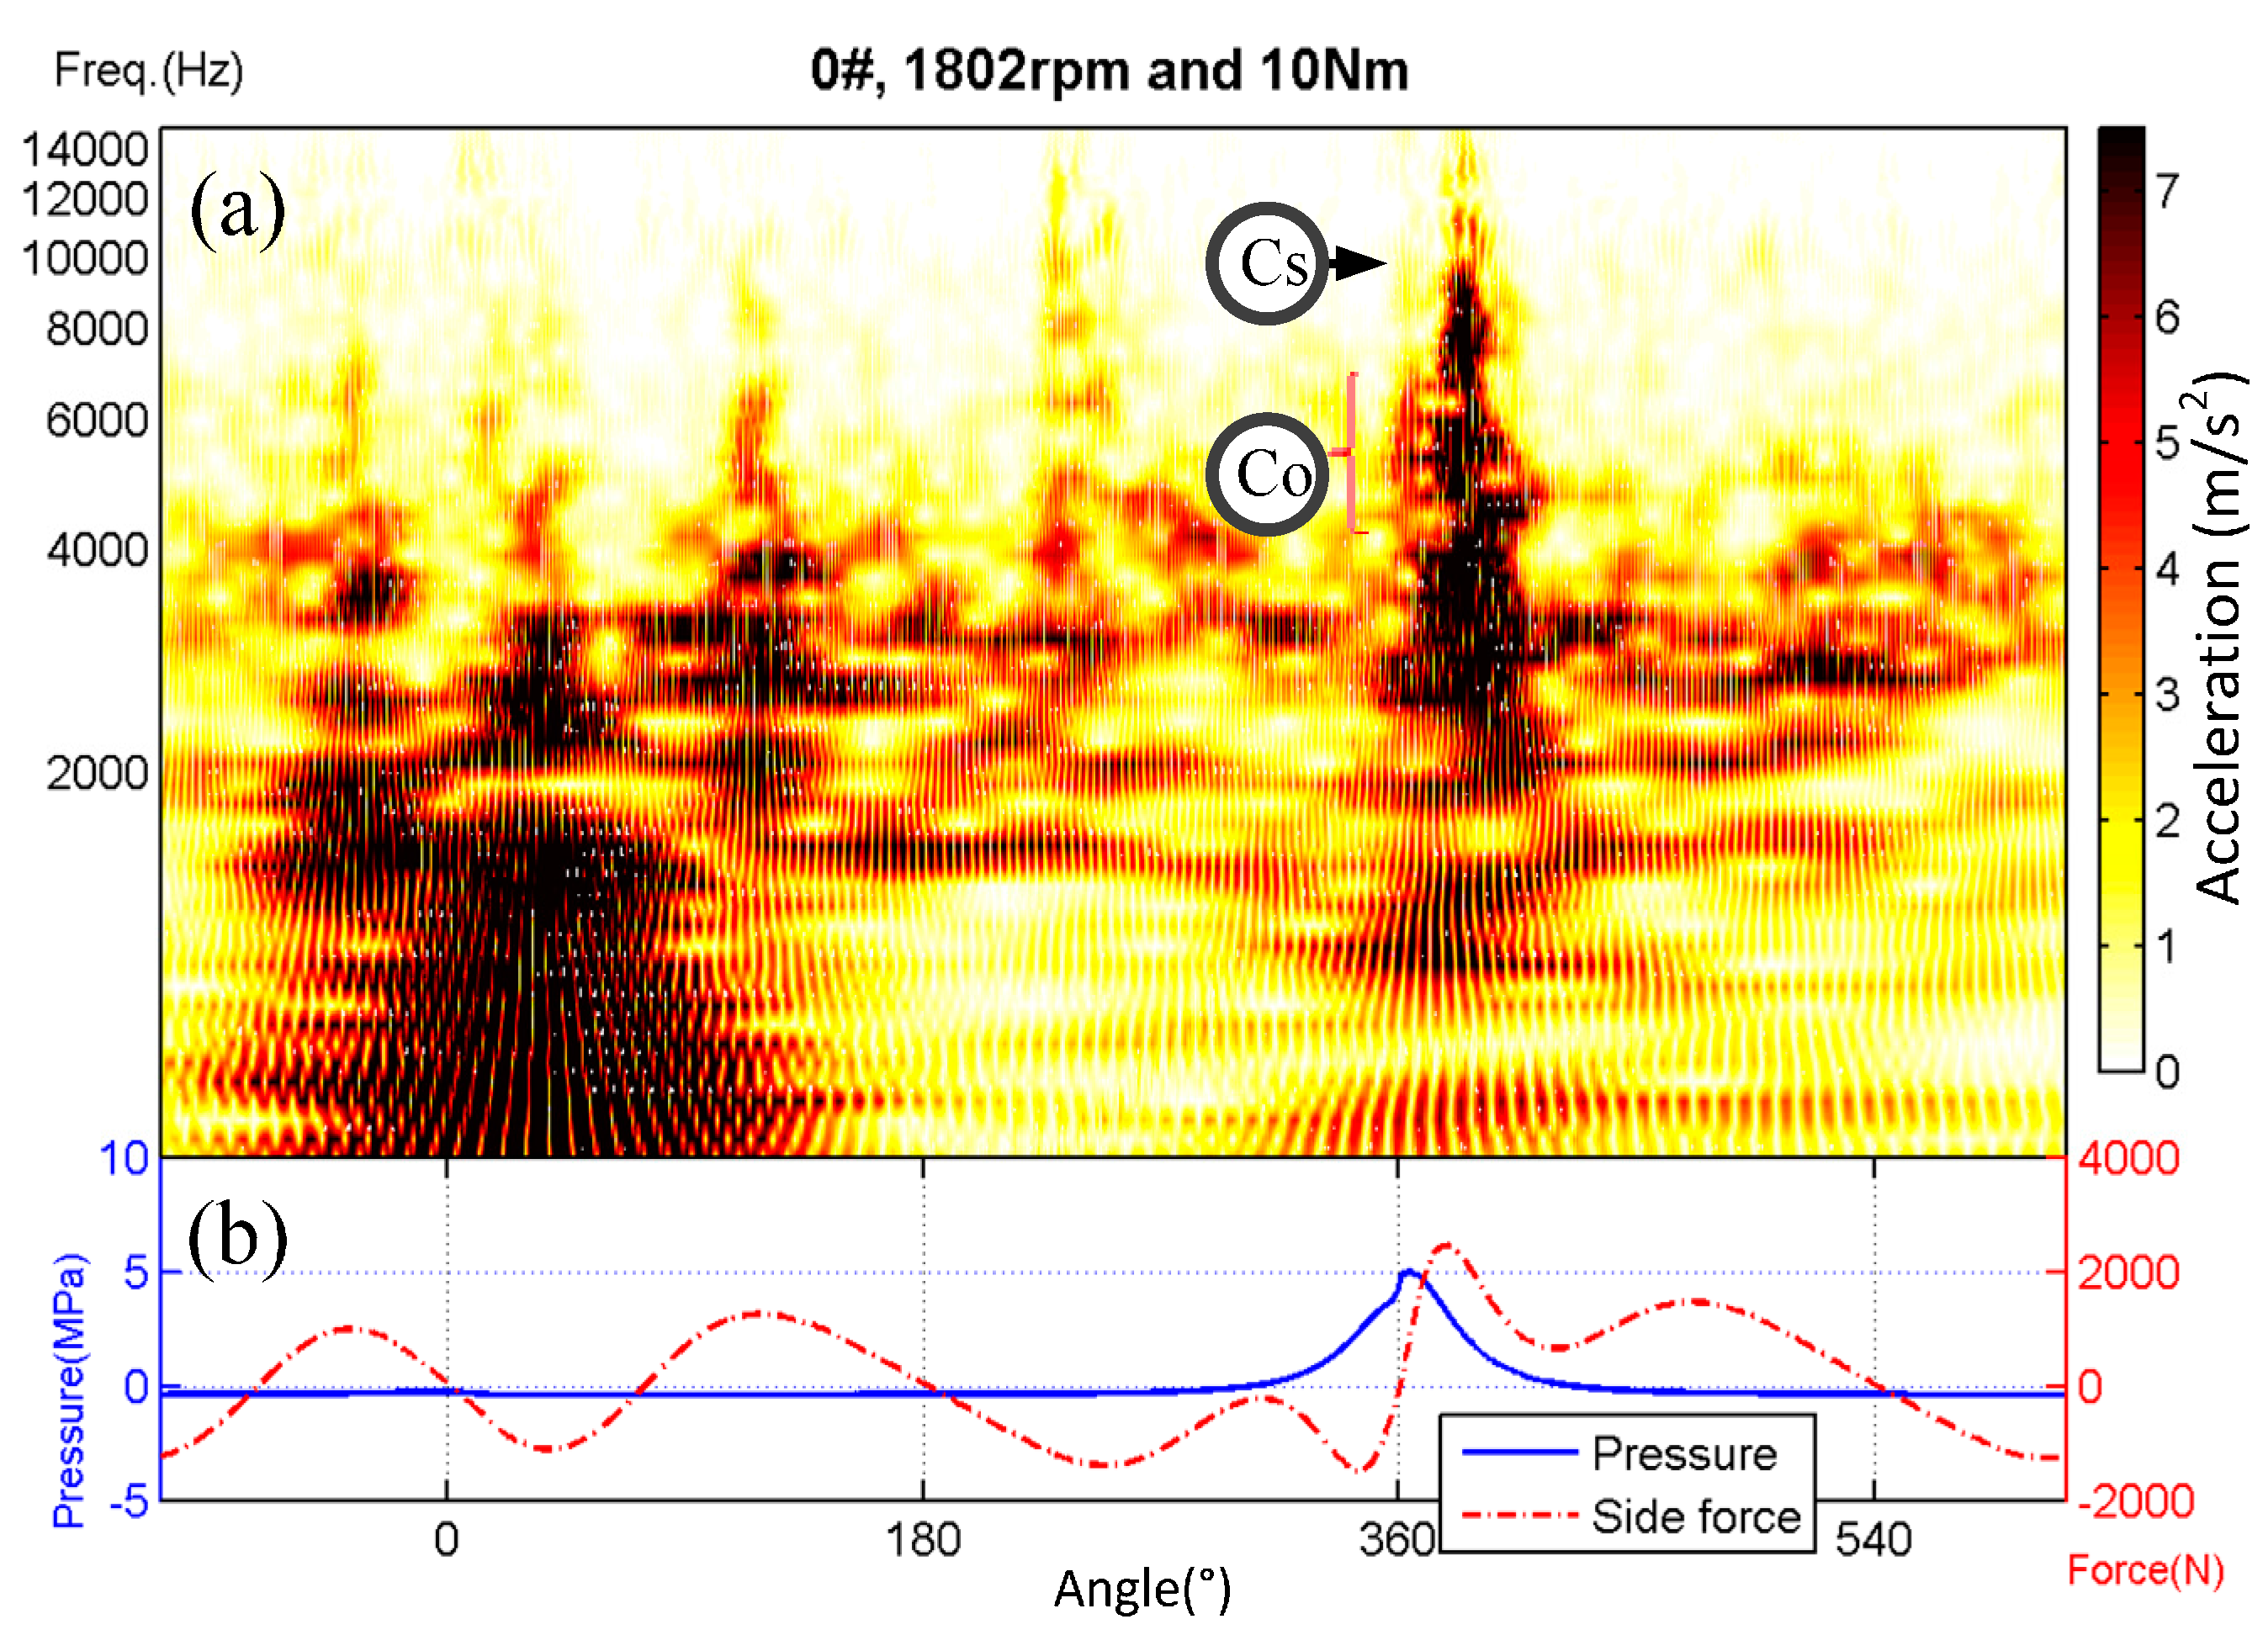
Figure 22.
Continuous wavelet transform (CWT) of vibration signal fueled with biodiesel under 10 Nm and 1800 rpm; (a) CWT result of measured acceleration response; (b) Measured in-cylinder pressure and calculated piston side-thrust force.
Figure 22.
Continuous wavelet transform (CWT) of vibration signal fueled with biodiesel under 10 Nm and 1800 rpm; (a) CWT result of measured acceleration response; (b) Measured in-cylinder pressure and calculated piston side-thrust force.
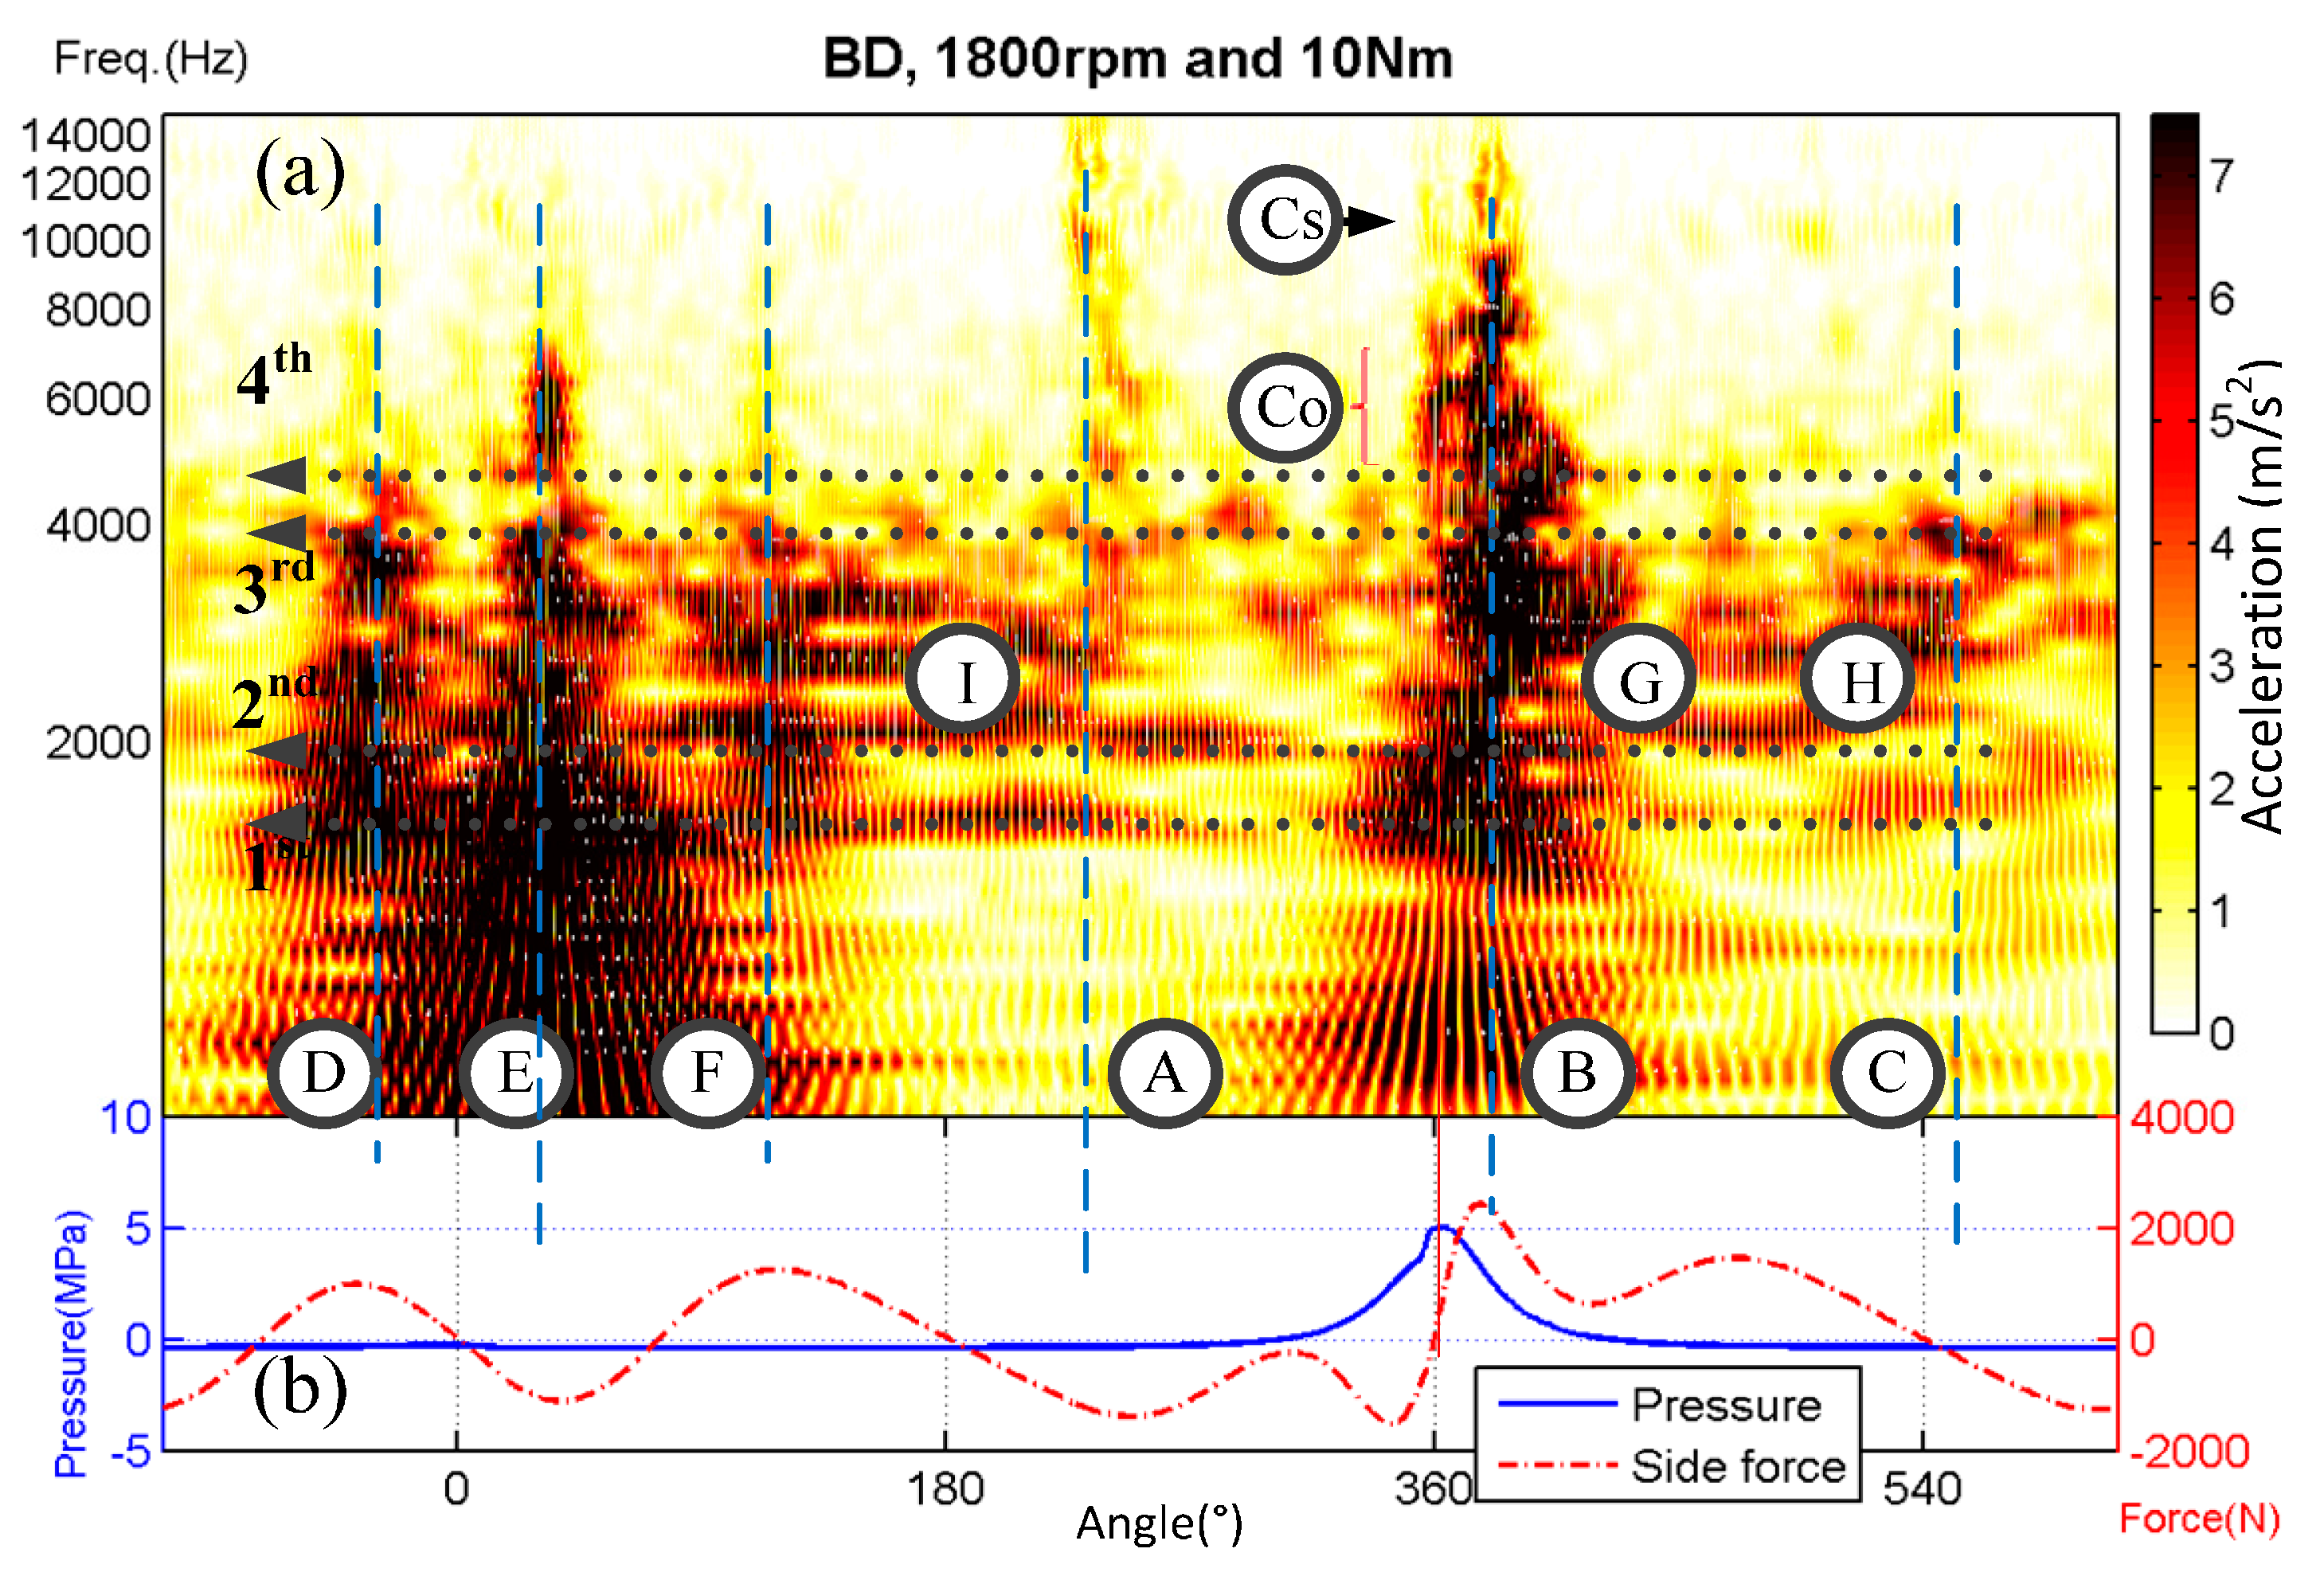
Figure 23.
Comparison of characteristic parameters between different fuels; (a) Overall RMSs of liner vibrations; (b) RMSs of localised responses to combustion shocks; (c) RMSs of local responses after exhaust TDC; (d) RMSs of local responses after combustion TDC.
Figure 23.
Comparison of characteristic parameters between different fuels; (a) Overall RMSs of liner vibrations; (b) RMSs of localised responses to combustion shocks; (c) RMSs of local responses after exhaust TDC; (d) RMSs of local responses after combustion TDC.


Table 1.
Material properties of QT600-3.
| Density (kg/m3) | Young’s Modulus (Pa) | Poisson’s Ratio | Bulk Modulus (Pa) | Shear Modulus (Pa) |
|---|---|---|---|---|
| 7120 | 1.69 × 10¹¹ | 0.286 | 1.316 × 10¹¹ | 6.5708 × 10¹⁰ |
Table 2.
Simulated and measured mode frequency of cylinder liner.
| No. | Simulated Frequencies (Hz) | Measured Frequencies (Hz) | Error (%) | No. | Simulated Frequencies (Hz) | Measured Frequencies (Hz) | Error (%) |
|---|---|---|---|---|---|---|---|
| 1 | 929.0 | 974.7 | 4.62 | 9 | 6673.2 | 6569.7 | 1.58 |
| 2 | 1229.7 | 1217.5 | 1.04 | 10 | 6979.5 | 6896.1 | 1.21 |
| 3 | 2567.3 | 2584.8 | 0.68 | 11 | 7926.9 | 7872.2 | 0.69 |
| 4 | 3128.7 | 3195.2 | 2.08 | 12 | 8732.6 | 8559.4 | 2.02 |
| 5 | 4191.4 | 4117.7 | 1.78 | 13 | 9011.1 | 8956.7 | 0.61 |
| 6 | 4301.5 | 4324.5 | 0.53 | 14 | 9321.0 | 9177.1 | 1.57 |
| 7 | 4847.0 | 4711.5 | 2.88 | 15 | 9879.4 | 9760.0 | 1.22 |
| 8 | 5832.1 | 5785.3 | 0.81 | 16 | 9939.9 | 10,012.5 | 0.72 |
Table 3.
Physical and chemical properties of alternative fuels.
| Properties | Density (20 °C)/(g/cm3) | Heat of Vaporization (kJ/kg) | Lower Heating Value (MJ/kg) | Kinematic Viscosity (mm2/s) | Surface Tension (mN/m) | Cetane |
|---|---|---|---|---|---|---|
| Diesel | 0.831 | 250 | 42.6 | 2.6 | 31.1 | 55 |
| Biodiesel | 0.884 | 320.2 | 37.4 | 5.2 | 30.4 | 59 |
Table 4.
Specification of the test engine.
| Manufacturer | Quanjiao Power Co., Ltd., Quanjiao, China |
|---|---|
| Engine type | QCH1125 |
| Number of cylinders | One |
| Combustion system | Direct injection, toroidal combustion chamber |
| Bore/stroke | 125/115 mm |
| Displacement volume | 1.093 L |
| Compression ratio | 18:1 |
| Cylinder liners | Cast iron replaceable wet liner |
| Start of fuel injection | 14 ± 2 degrees before top dead center (BTDC) |
| Rated power | 14.7/2400 kW/r/min |
| Piston clearance | 0.5 mm |
| Piston-pin offset | 0 mm |
Table 5.
Test operating procedure.
| Fuel Type | Speed (rpm) | Load (Nm) |
|---|---|---|
| Diesel | 1000, 1400, 1800 | 10, 40 |
| Biodiesel | 1000, 1400, 1800 | 10, 40 |
Table 6.
Properties of biodiesel [23].
Table 6.
Properties of biodiesel [23].
| Property | Measured | Units |
|---|---|---|
| Composition | 77 | % C |
| 12 | % H | |
| 11 | % O | |
| Density | 879 | Kg/m3 |
| LHV, KJ/Kg | 38.5 | MJ/Kg |
| Kinematic Viscosity | 4.9 | mm2/s |
© 2017 by the authors. Licensee MDPI, Basel, Switzerland. This article is an open access article distributed under the terms and conditions of the Creative Commons Attribution (CC BY) license (http://creativecommons.org/licenses/by/4.0/).
Share and Cite
MDPI and ACS Style
Li, G.; Gu, F.; Wang, T.; You, J.; Ball, A. Investigation into the Vibrational Responses of Cylinder Liners in an IC Engine Fueled with Biodiesel. Appl. Sci. 2017, 7, 717. https://doi.org/10.3390/app7070717
AMA Style
Li G, Gu F, Wang T, You J, Ball A. Investigation into the Vibrational Responses of Cylinder Liners in an IC Engine Fueled with Biodiesel. Applied Sciences. 2017; 7(7):717. https://doi.org/10.3390/app7070717
Chicago/Turabian StyleLi, Guoxing, Fengshou Gu, Tie Wang, Jianjun You, and Andrew Ball. 2017. "Investigation into the Vibrational Responses of Cylinder Liners in an IC Engine Fueled with Biodiesel" Applied Sciences 7, no. 7: 717. https://doi.org/10.3390/app7070717
Note that from the first issue of 2016, this journal uses article numbers instead of page numbers. See further details here.