Automatic Definition of an Anatomic Field of View for Volumetric Cardiac Motion Estimation at High Temporal Resolution


1
Department of Cardiovascular Sciences, KU Leuven, 3000 Leuven, Belgium
2
Department of Biomedical Engineering, Tsinghua University, 100084 Beijing, China
*
Author to whom correspondence should be addressed.
Appl. Sci. 2017, 7(7), 752; https://doi.org/10.3390/app7070752
Submission received: 7 June 2017
/
Revised: 17 July 2017
/
Accepted: 20 July 2017
/
Published: 24 July 2017
(This article belongs to the Special Issue Ultrafast Ultrasound Imaging)
Abstract
:Fast volumetric cardiac imaging requires reducing the number of transmit events within a single volume. One way of achieving this is by limiting the field of view (FOV) of the recording to the myocardium when investigating cardiac mechanics. Although fully automatic solutions towards myocardial segmentation exist, translating that information in a fast ultrasound scan sequence is not trivial. In particular, multi-line transmit (MLT) scan sequences were investigated given their proven capability to increase frame rate (FR) while preserving image quality. The aim of this study was therefore to develop a methodology to automatically identify the anatomically relevant conically shaped FOV, and to translate this to the best associated MLT sequence. This approach was tested on 27 datasets leading to a conical scan with a mean opening angle of 19.7° ± 8.5°, while the mean “thickness” of the cone was 19° ± 3.4°, resulting in a frame rate gain of about 2. Then, to subsequently scan this conical volume, several MLT setups were tested in silico. The method of choice was a 10MLT sequence as it resulted in the highest frame rate gain while maintaining an acceptable cross-talk level. When combining this MLT scan sequence with at least four parallel receive beams, a total frame rate gain with a factor of approximately 80 could be obtained. As such, anatomical scan sequences can increase frame rate significantly while maintaining information of the relevant structures for functional myocardial imaging.

1. Introduction
Over the last decades, volumetric cardiac ultrasound imaging has gained momentum as the modality of choice to assess cardiac morphology and visualize global heart motion [1]. Recently, 3D cardiac ultrasound has also been used to quantitatively assess regional cardiac dynamics and several commercial products for 3D speckle tracking are now readily available [2]. One of the challenges for 3D motion estimation remains the relatively low image quality of the volumetric ultrasound data set. Particularly, its relatively low spatiotemporal resolution is of concern. Indeed, state-of-the-art commercial systems make use of a combination of several techniques in order to improve frame rate while maintaining image quality, such as limiting the field of view (FOV) [3], decreasing the line density [4], using electrocardiography (ECG) gating [5], and/or applying parallel receive beamforming (i.e., multi-line acquisition, MLA) [6]. This typically results in a frame rate of up to ~30 Hz when scanning with a moderate line density, when using a representative wide-angle field of view (i.e., ~60° × ~60°) and when gating is performed over four to six cardiac cycles. ECG gating not only lengthens the acquisition but can also induce artefacts due to arrhythmias, breathing, motion or incorrect gating. A frame rate of 30 Hz for a 60° × 60° opening angle is adequate to evaluate cardiac morphology and visualize global heart motion [1]. However, when trying to visualize the mechanical activation wave associated with the contraction of the heart, a frame rate around 500 Hz is needed [4], while assessing the mechanical properties of the heart by measuring the speed by which (acoustically induced) shear waves propagate through the myocardium requires even higher frame rates [7]. Based on the desired cardiac application, the temporal resolution of the imaging system should thus be adapted.
Recently, two other solutions have been proposed to increase the temporal resolution of the 3D systems. On the one hand, Diverging Wave Imaging (DWI) has been introduced, which uses a sparse virtual array located behind the probe [8]. This allows volumetric imaging at very high rates since the line density is only restricted by the reconstruction time. However, the use of unfocused beams implies that the energy of the beam is spread over a wider area resulting in low pressures which do not allow for harmonic imaging. In addition, the overall signal-to-noise ratio drops, having a negative impact on motion estimators (as illustrated by the Cramer–Rao Lower Bound [9]).
On the other hand, multi-line transmit beamforming (MLT) has been proposed to increase temporal resolution by simultaneously transmitting multiple focused beams allowing harmonic imaging [10]. While its frame rate gain is more limited than that of diverging wave imaging [11] and although potential artifacts such as cross-talk might be introduced due to the interaction between neighboring MLT beams, it preserves image quality [10] and is an attractive imaging approach. Indeed, it has recently been demonstrated that cross-talk artifacts can be suppressed by using proper apodization [11], by avoiding the main directions of the transducer [6], by frequency-coding the different MLT beams [12,13], and/or by physically separating the beams in space [9]. Furthermore, MLT can easily be combined with MLA to further increase the temporal resolution. More precisely, the width of the transmit beams can be customized based on the desired amount of receive parallelization for each transmit beam. Based on Expression (10) of [14], at least 4MLA (two in azimuth and two in elevation) can be reconstructed per focused beam in 3D for a typical cardiac 2D matrix array transducer. In order to allow a higher number of MLA, broader beams can be transmitted by reducing the transmit aperture. It should also be noted that safety issues due to the acoustic superposition of the MLT beams in the near field are of little concern. Indeed, we recently demonstrated that by small modifications of the transmit beamforming (i.e., introducing small delays or phase shifts between different MLT beams), the near-field pressure can be adjusted to remain within safety regulations [15]. Finally, in order to test the feasibility of MLT for volumetric imaging, a qualitative [16] and a quantitative [17] study were recently performed where the 2D findings were extrapolated to 3D. It was shown, by in silico and in vitro experiments, that a 16MLT-4MLA with transmit and receive apodization (Tukey α = 0.5) generates volumetric images within a single heartbeat with an appropriate image quality for functional cardiac imaging [17].
Despite these fast imaging solutions, it is important to note that the typical volumetric ultrasound recording remains pyramidal, implying that a significant portion of the reconstructed image lines are not relevant to analyze 3D myocardial dynamics. Therefore, a straightforward way to reduce the number of transmit events is by limiting the FOV to the anatomically relevant space only, i.e., to a conically shaped volume, which captures the myocardium throughout the cardiac cycle. This reduced FOV can then be combined with the aforementioned parallelized scan sequences in order to further increase frame rate.
Although fully automatic solutions towards myocardial segmentation exist, translating that information in a fast ultrasound scan sequence is not obvious. The aim of this study was therefore to (1) develop a methodology to automatically define the characteristics of the conically shaped FOV given a segmented myocardial volume, and (2) to set up an appropriate MLT scan sequence to scan the associated FOV as fast as possible. Ideally, the FOV definition and its associated parallel scan sequence would be implemented in real-time and customized per patient.
2. Methods
2.1. Anatomical Relevant Space
The relevant FOV for functional cardiac imaging can be defined from a 3D dataset as follows:
- Automatic real-time segmentation of myocardial boundariesA fully automatic real-time segmentation of the left ventricular myocardium in a volumetric ultrasound recording was performed using the B-spline Explicit Active Surfaces (BEAS) framework [18,19]. More specifically, BEAS uses two explicit functions, one to represent the endocardial surface and another to represent the myocardial thickness. This allows to fully characterize the endo- and epicardial surfaces. These surfaces can then be used to define a binary mask identifying voxels belonging to the myocardium only.
- Coverage functionUsing these binary images, a “coverage function” was defined as follows. First, based on the ray-tracing principle, the path of a given scanline within the volumetric image volume can be traced. The pixels belonging to that scanline are compared with the binary mask, in order to compute the percentage of pixels of the given scanline belonging to the myocardium. Finally, this procedure is repeated for all scan lines in the original pyramidal volume leading to a “coverage function”.
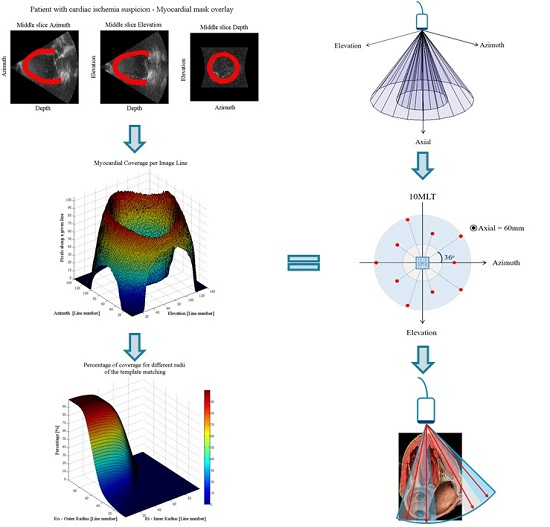
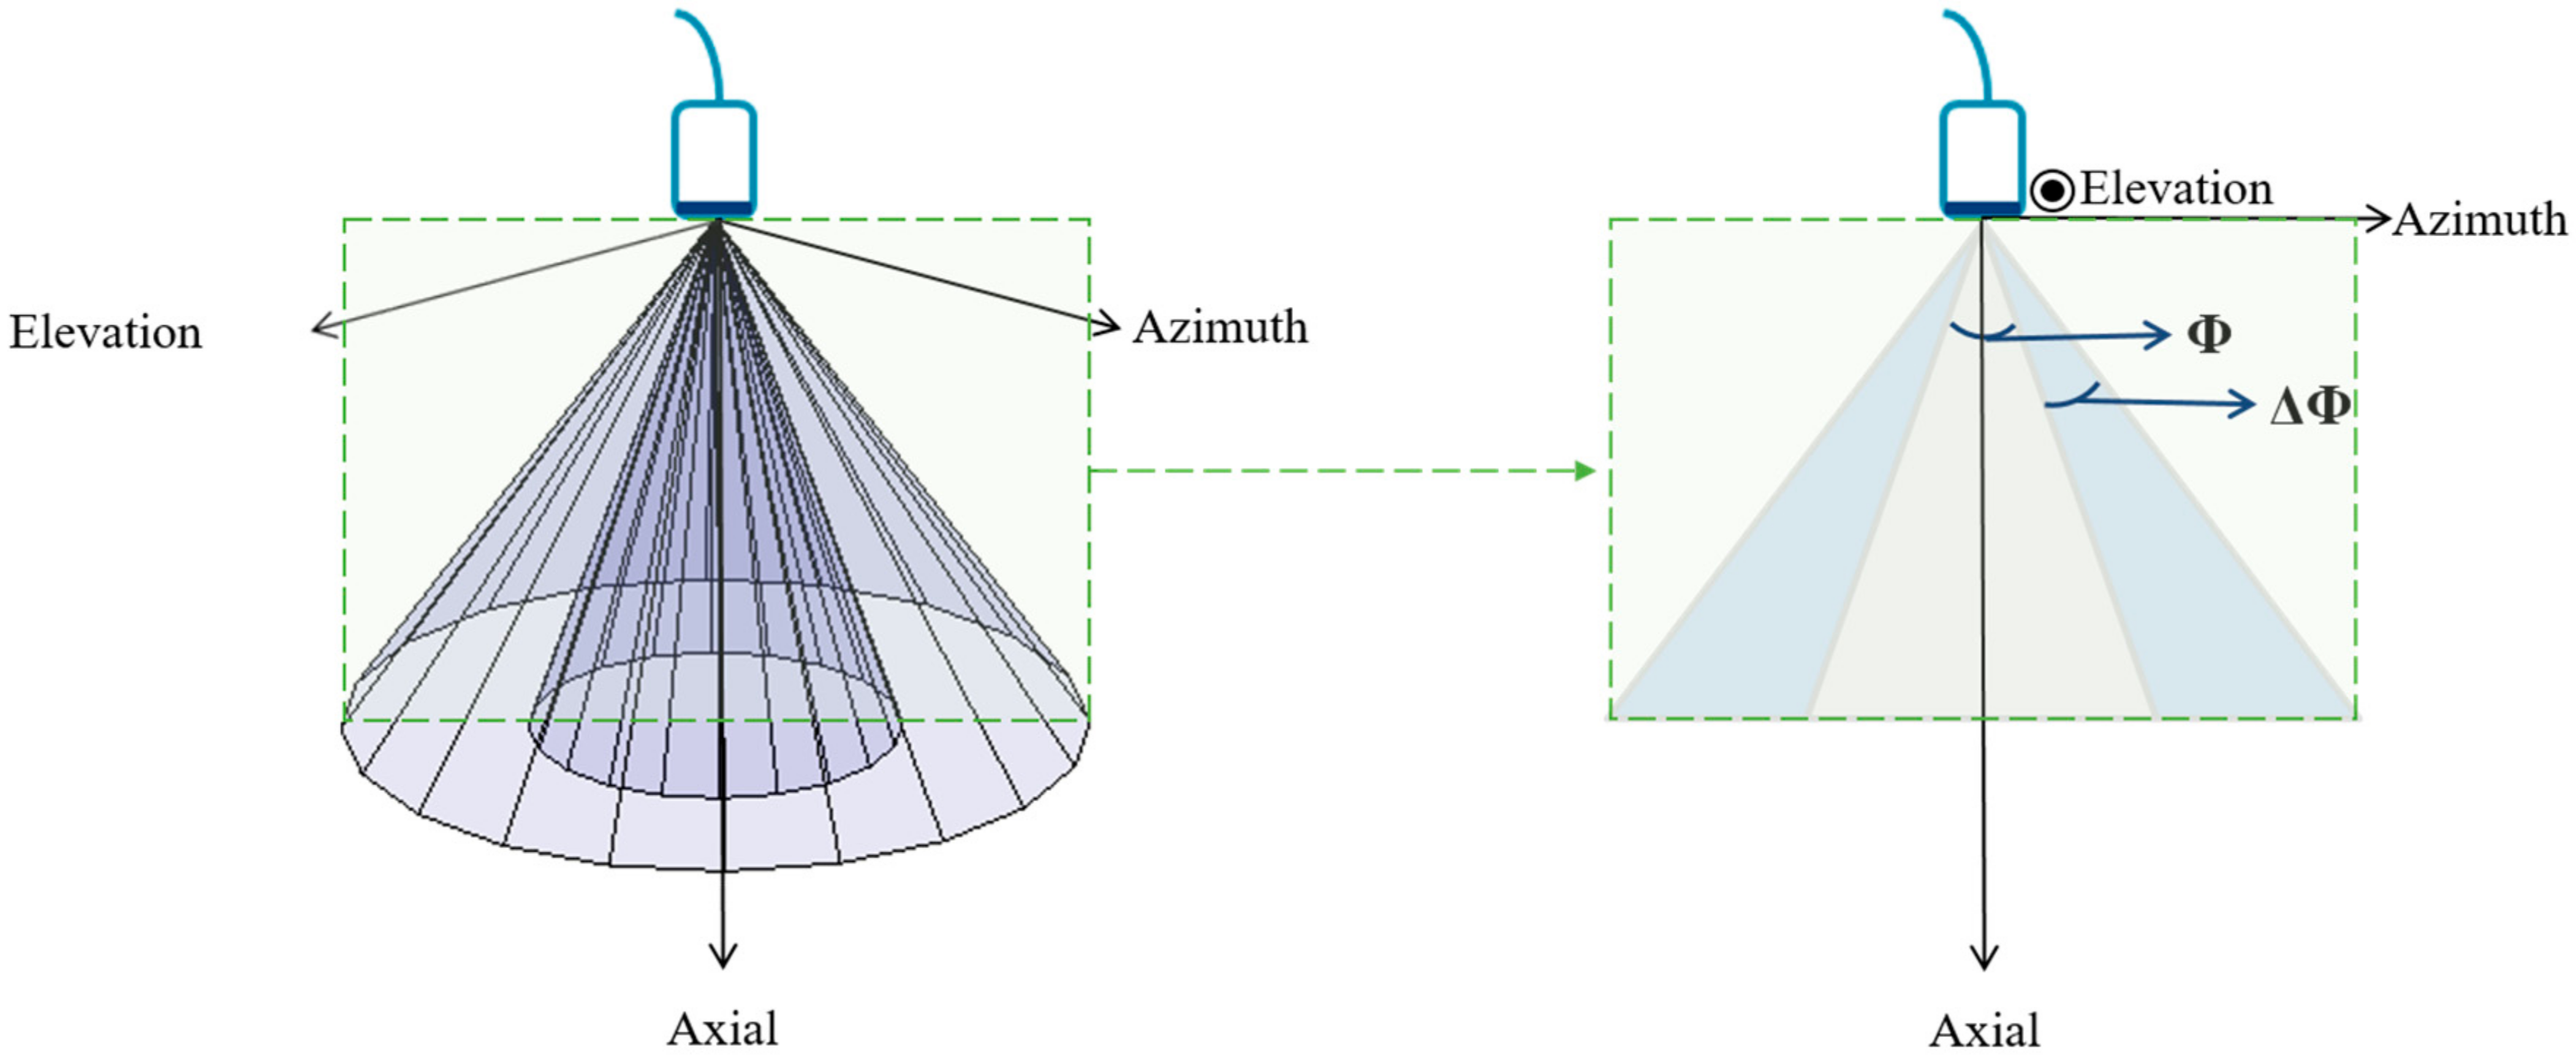
- Ring-shaped template matchingTo find a spatially continuous FOV that covers a given percentage of the total amount of myocardium (i.e., prospectively defined by the user as “T”), a ring-shaped template matching was used. This shape was chosen as an approximation of the left ventricular geometry when looking down from the apex, i.e., when the transducer is placed in an apical position. In 3D, this FOV therefore defines a hollowed cone, Figure 1 (left). We express the amount of myocardial coverage T as a function of the inner radius of the ring template () and its thickness (). In order to effectively gain frame rate, a compromise has to be made between the amount of myocardial coverage, i.e., T, and the extent of the FOV. From all and combinations that provide T myocardial coverage, the one with minimal was chosen, as this would keep the volume to be scanned minimal. In this way, it is ensured that the desired T coverage is obtained using the least amount of lines possible (i.e., at the highest frame rate). In turn, these radii are used to determine the parameters (opening angle, Φ, and thickness, dΦ) for a conical scan, as represented in Figure 1 (right). These radii give directly the inner and outer image lines that define the inner and outer surface of the cone. Then, using the angular inter-beam spacing, the line numbers can be converted to the respective angles.
2.2. Parallelized Scan Sequence
In order to find the best scan sequence for a given FOV, the cross-talk energy level of several MLT setups can be quantified by computer simulation. In particular, a 2D square phased array transducer (10 × 10 mm2, 32 × 32 elements, 312.5 µm pitch) transmitting a Gaussian pulse with a central frequency of 2.5 MHz and 50% bandwidth was simulated using a graphical computer unit (GPU) based implementation of the spatial impulse response method (Simpulse) [20]. The transmit beams were focused at a depth of 60 mm while dynamic focusing was used during receive. Tukey apodization (α = 0.5) was applied in both transmit and receive to suppress cross-talk artifacts. Furthermore, the MLT beams were spread circumferentially around the conically shaped FOV in an equiangular manner, and were staggered in the radial direction between neighboring beams to increase the inter-beam spacing and therefore to reduce cross-talk. Such staggering was chosen to be half the thickness of the hollow cone at the focal depth. The cross-talk energy level of the MLT systems can be determined using the process described in [17]. As such, simulations of the two-way beam profiles were performed on a plane parallel to the transducer surface (i.e., C-plane) at a depth of 65 mm (i.e., around halfway the common imaging depth for cardiac applications). This depth was chosen based on our previous in silico findings [17] while using the exact same system configuration. It was shown that the best performing system at this depth was also the system of choice at other depths and steering angles. In this study, we therefore focused on evaluating the systems′ performance at this depth only.
To quantify how the energy of a beam spreads in the volume and potentially interferes with other MLT beams, the same procedure as in [17] was followed. In short, a beam was transmitted into one of the MLT directions ( and subsequently received along each of the MLT beam directions (including the same transmit direction: ). Next, the sum of the energy while transmitting and receiving in the same MLT direction was considered as single-line-transmission (SLT) energy (i.e., the ideal situation), whereas cross-talk was computed as the sum of the energy that deviates from the transmit beam towards the other remaining MLT directions, i.e., when transmitting in a given MLT direction but receiving in one of the other remaining MLT directions. This procedure was repeated for every MLT beam in the setup. The final cross-talk energy level () was quantified in decibels. Mathematically, this can be expressed as:
where: is a given MLT direction being assessed; is a MLT direction different from the direction being tested (); is the total number of MLT beams in the system; is the energy in the C-plane when transmitting in a given MLT direction and receiving in one of the other directions ( (i.e., cross-talk); and, is the energy in the C-plane when transmitting in a given MLT direction while receiving in the same direction (i.e., SLT energy).
Please note that in the present study, the FOV definition and its associated parallel scanning sequence have been proposed considering apical view acquisitions only.
3. Experiments
To test this approach, 27 volumetric ultrasound datasets were randomly selected from the DOPPLER-CIP database (a large multi-center clinical FP7-funded study), which targeted patients suspected of (chronic) ischemia [21]. The mean opening angle for the volumetric scans in azimuth and elevation was 53.5°, resulting in approximately 7282 scanlines. The data was acquired using a GE E9 scanner (GE Vingmed, Horten, Norway) equipped with a 4 V transducer. The segmentation was performed at the end-diastole. A coverage threshold T of 85% was chosen.
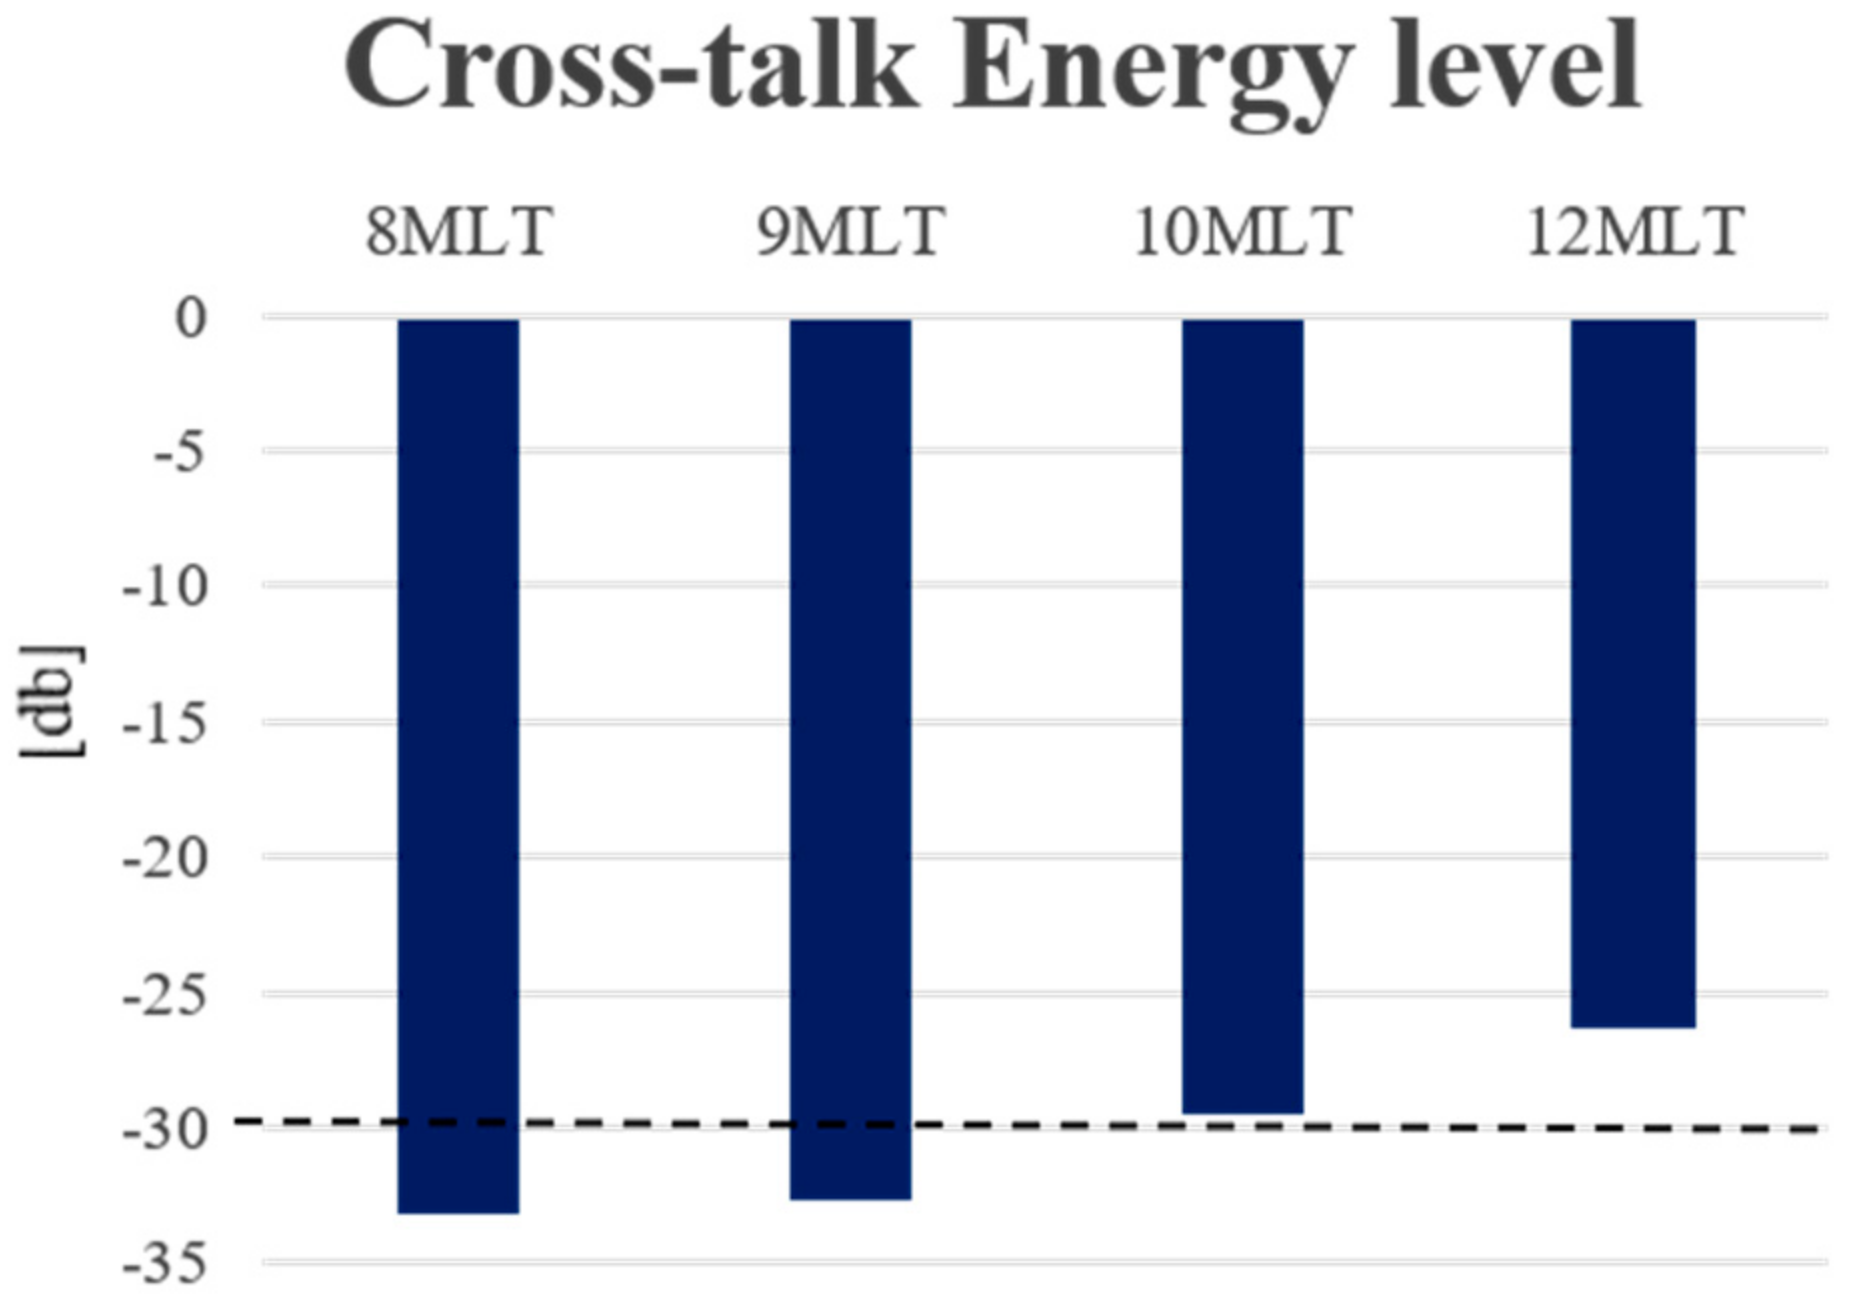
After finding the anatomical relevant space, four systems were investigated: 8MLT, 9MLT, 10MLT and 12MLT as illustrated in Figure 2. The cross-talk energy level of the systems was quantified using Equation (1), and a threshold of −30 dB was defined to give acceptable B-mode signal-to-noise ratio (SNR). Although this pre-defined cut-off was arbitrarily chosen from a retrospective analysis of our 2D in silico and in vivo findings, 3D in vitro experiments have nevertheless corroborated that this is a suitable measurement, even maybe a bit too restrictive, to ensure an adequate image quality [13].
4. Results
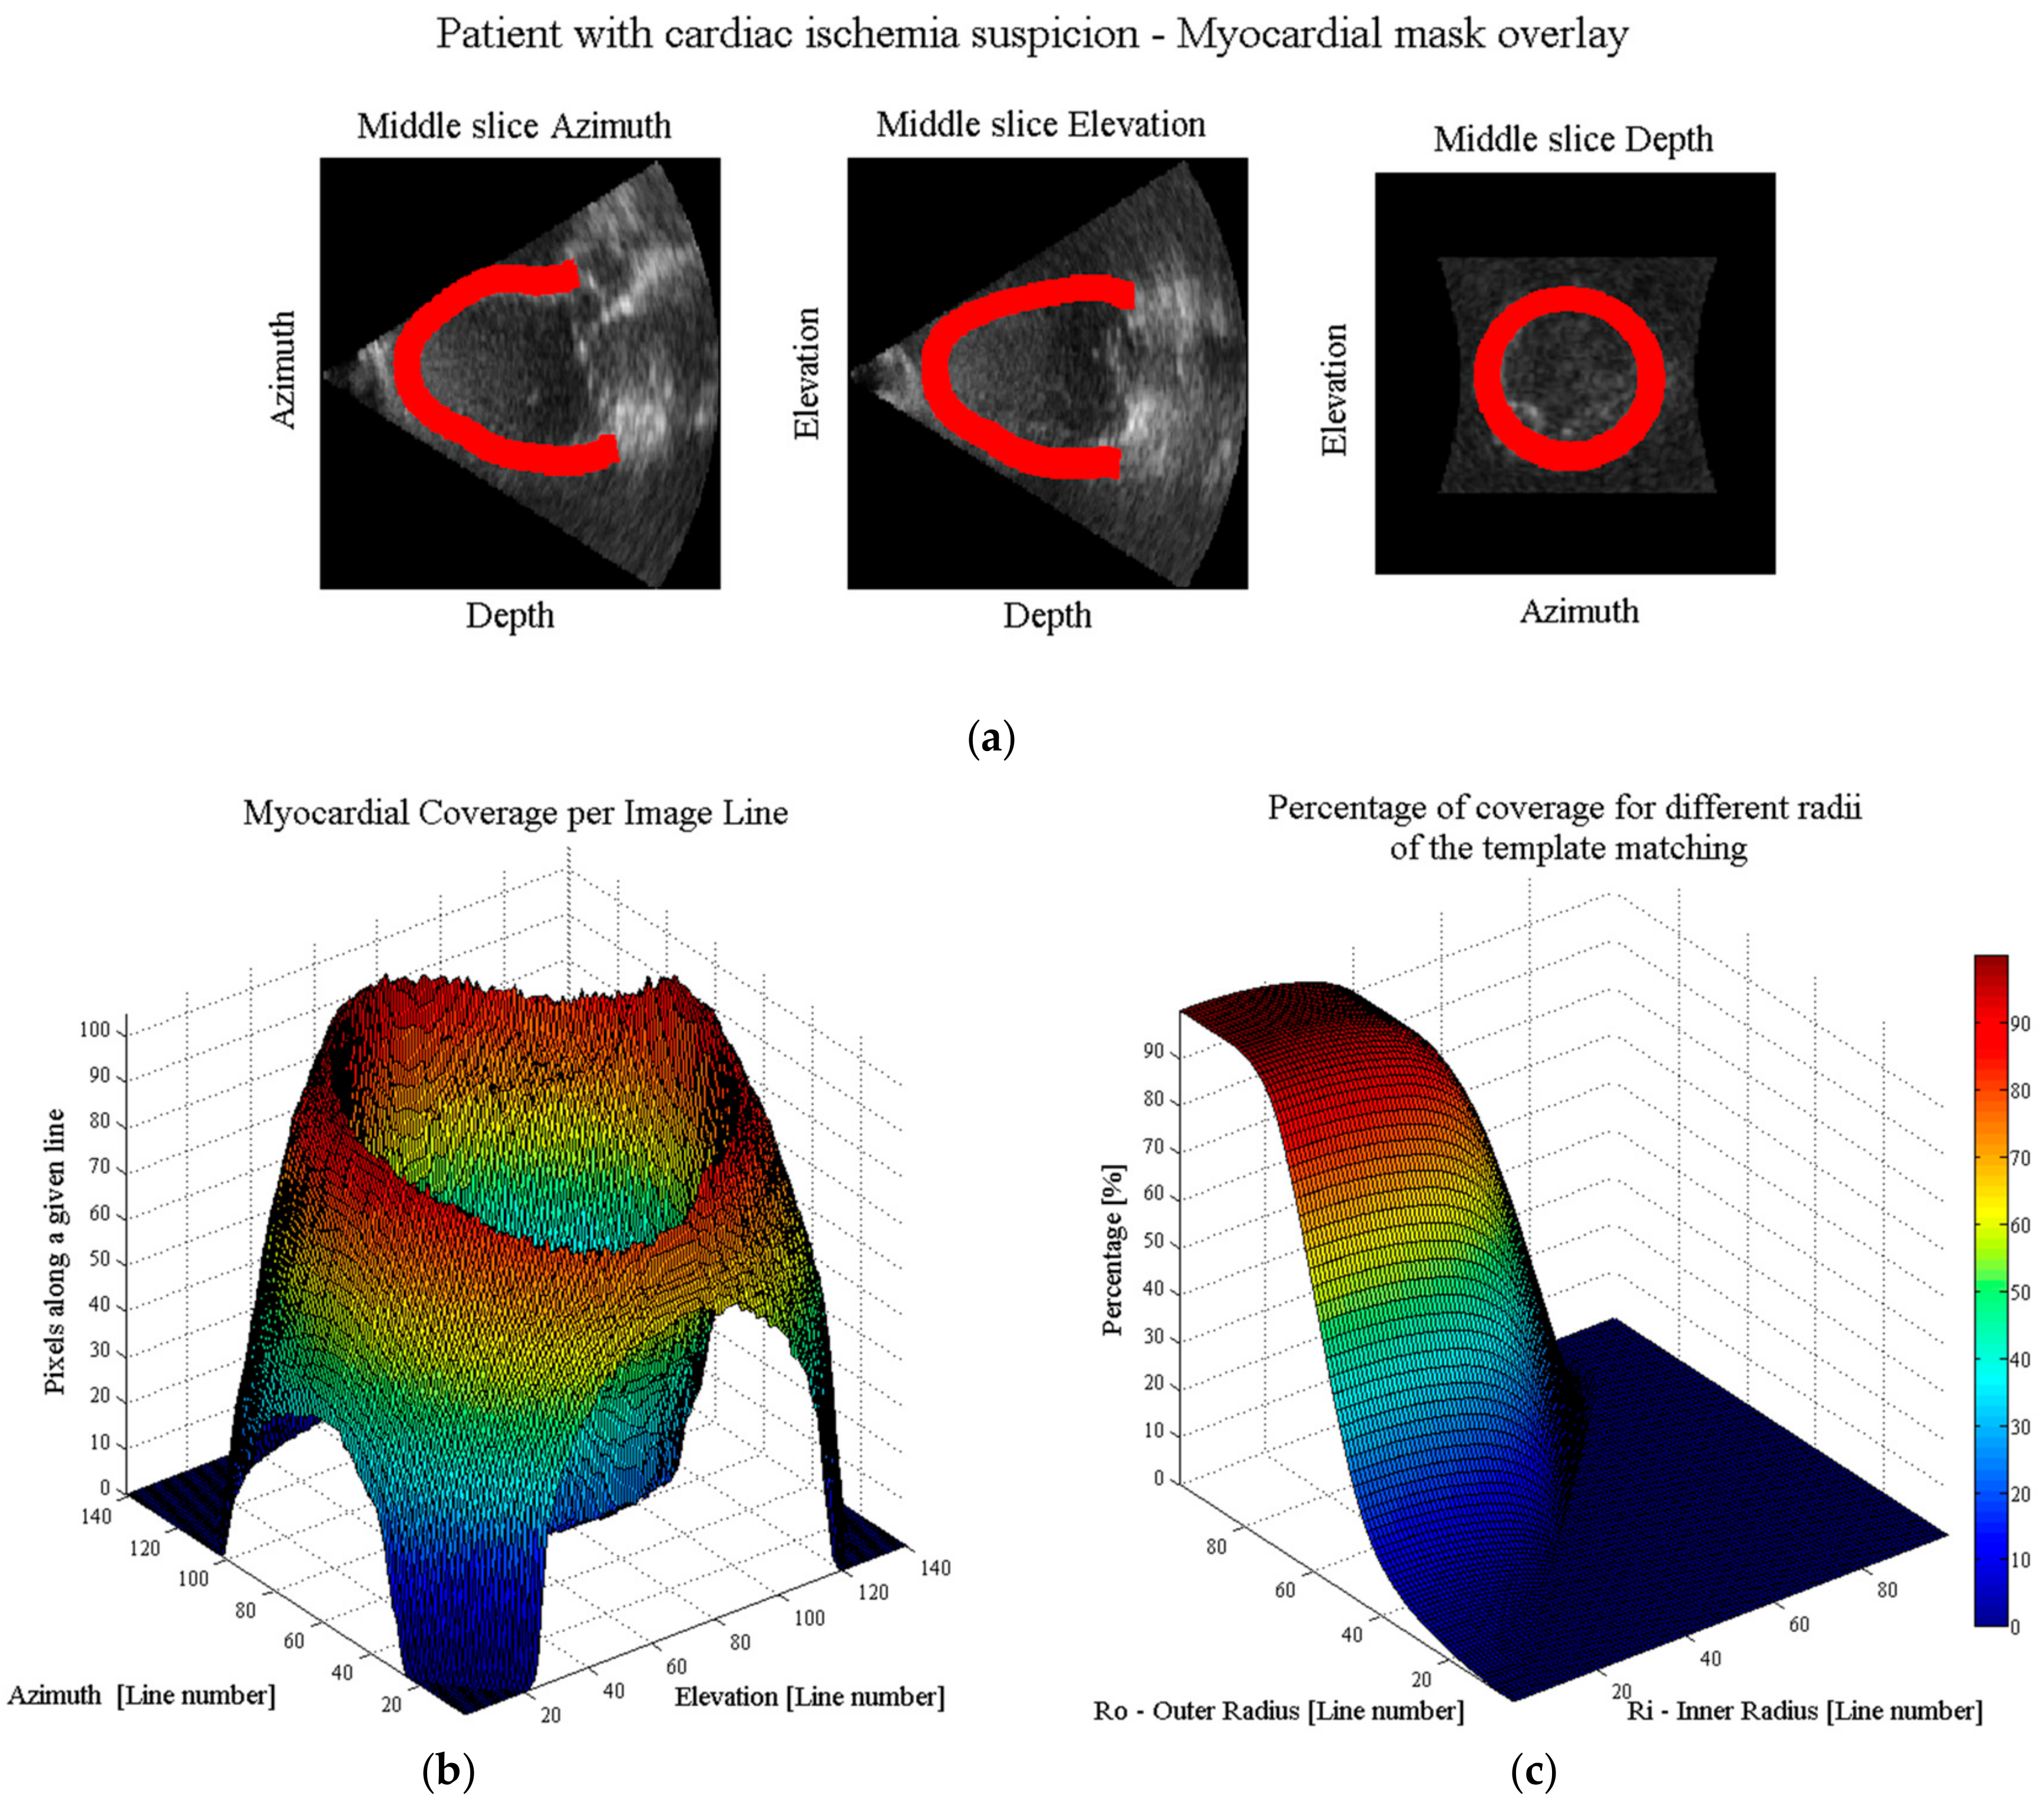
An example of the workflow to determine the anatomical relevant space is shown in Figure 3. Figure 3a illustrates the segmented myocardial boundaries as overlays over the three orthogonal slices through the middle of the ultrasonic volume. Given these binary coordinates, the myocardial coverage per line is quantified as displayed in Figure 3b. As expected, the lines crossing the ventricular walls have the highest percentage of coverage while the ones crossing the apex have the lowest. Finally, the percentage of coverage can be chosen using the ring-shaped template matching. Logically, the smaller the inner radius and the bigger the outer radius, the higher the total myocardial coverage, Figure 3c.
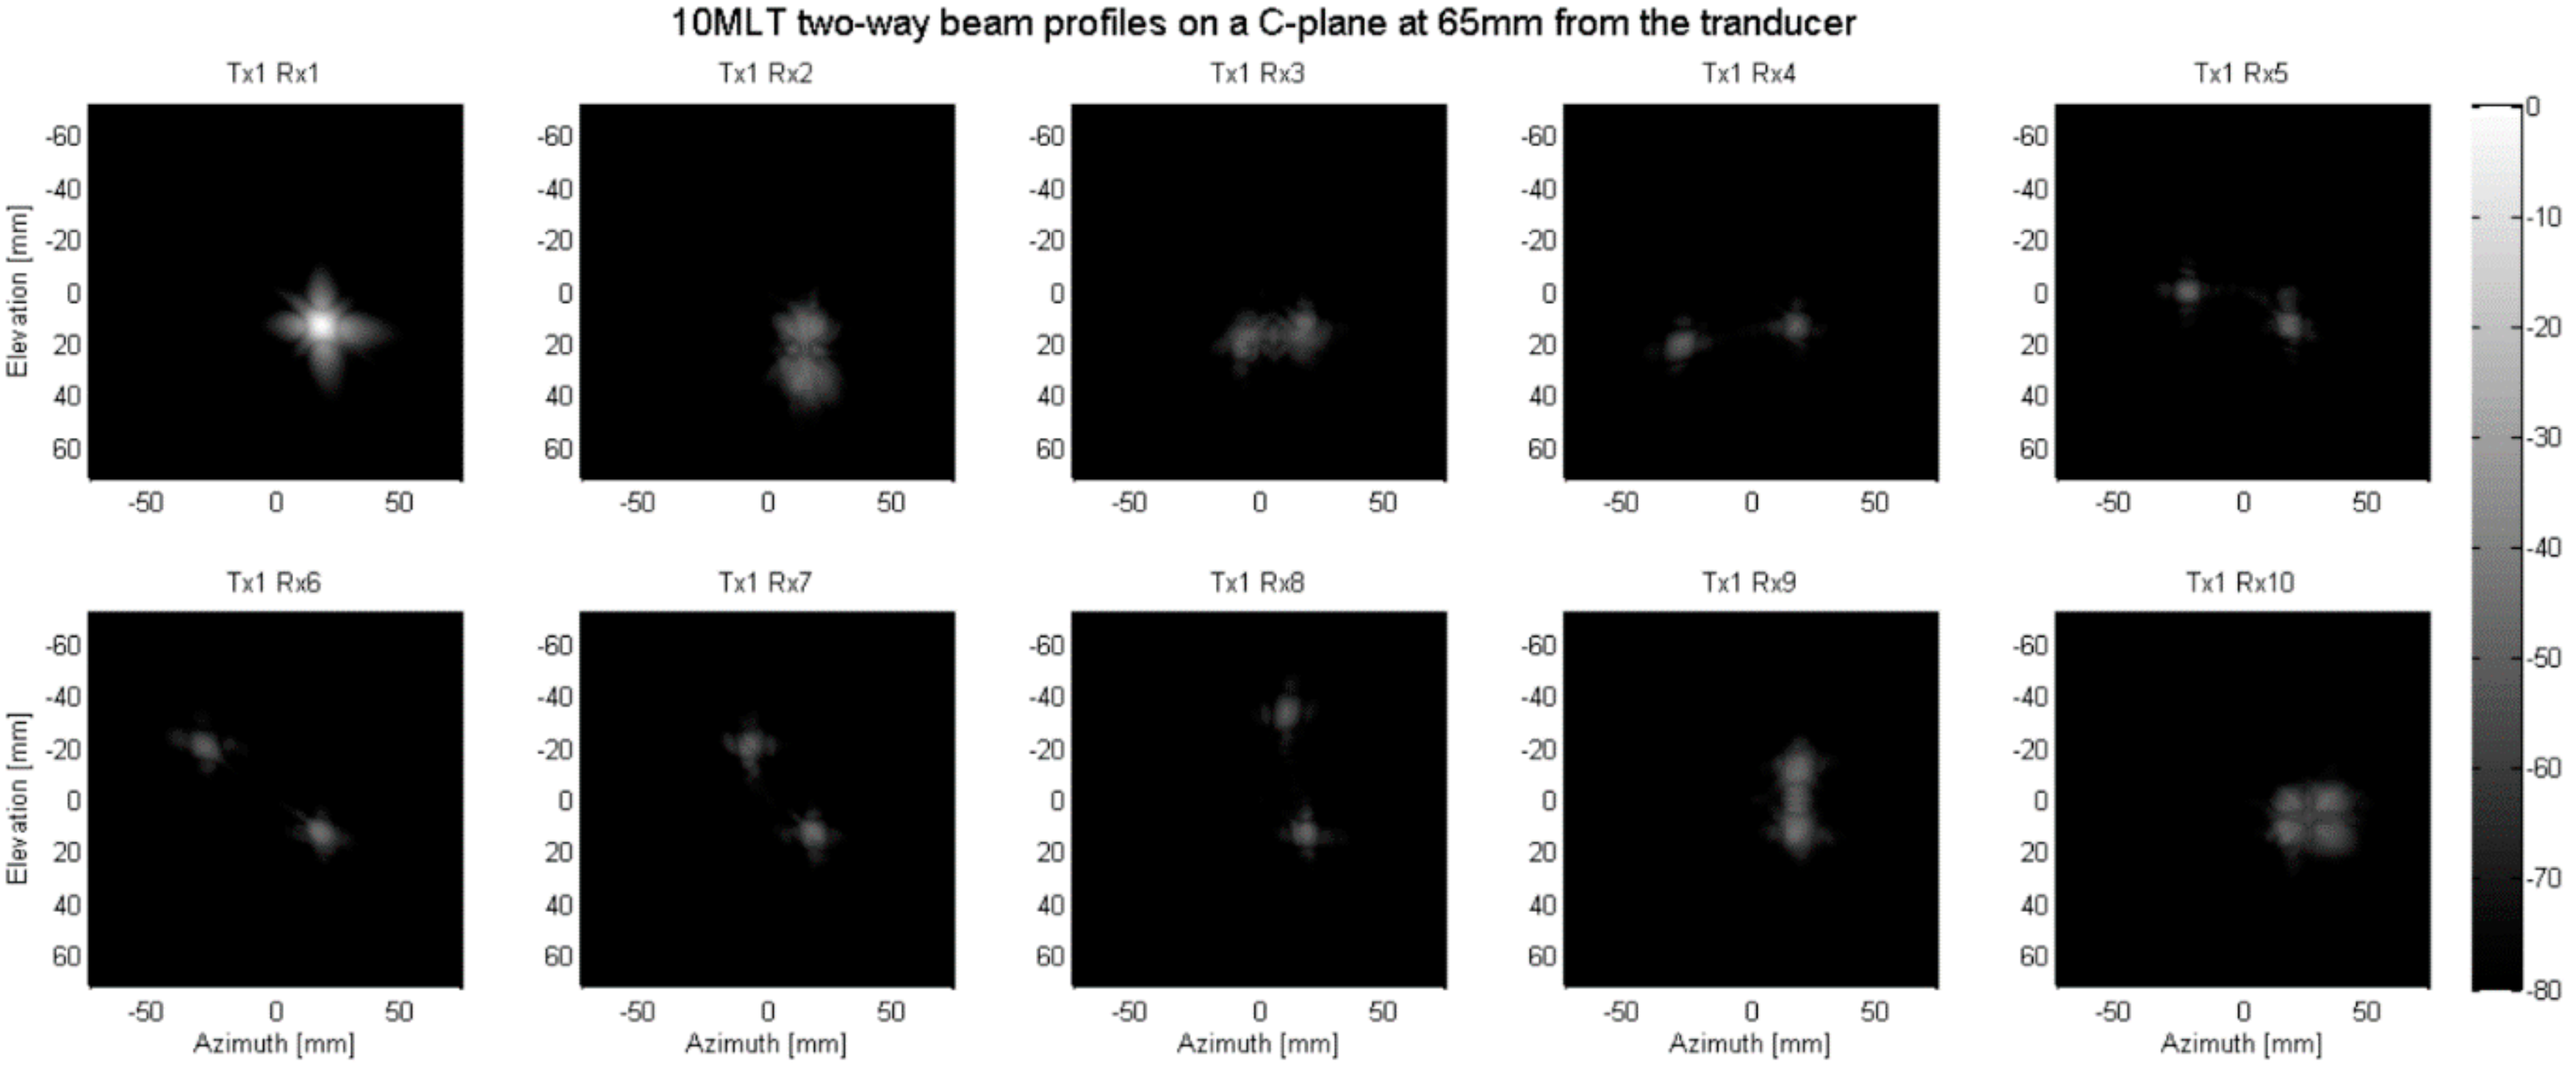
For all datasets tested, the mean opening angle (Φ) for the conical scan was 19.7° ± 8.5° while the mean “thickness” of the cone (dΦ) was 19° ± 3.4°. Therefore, a reduction of 48.9% in the number of scan lines required to cover the FOV at full-line density was achieved, approximately doubling the frame rate. Given this estimated “mean” conical FOV, the cross-talk energy level of all the MLT setups was calculated. Figure 4 shows an example of the two-way beam profiles in a C-plane used to calculate the inter-beam interference of a 10MLT system, where a beam was transmitted in one direction and received in each of the MLT directions. The cross-talk energy levels of the tested systems are presented in Figure 5. As can be noted, the 8MLT and 9MLT systems reached the pre-defined threshold of −30 dB, while the 10MLT was only half a dB above. The 12MLT system on the other hand was about 4 dB above the cut-off.
5. Discussion
In this study, a methodology to find the anatomical relevant space for functional cardiac imaging has been described. This method was used to compute the parameters for a conical scan and to find an optimal MLT scan sequence to further speed up the acquisition process. In particular, an average opening angle of 19.7° and a mean thickness of 19° for the conical scan were found, resulting in 48.9% less transmit events per volume and, therefore, a gain in frame rate of about 2. In comparison, simply reducing the pyramidal FOV of current 3D systems to the epicardium in end-diastole would only result in a reduction of 25.6% in the number of transmit events or a gain in frame rate of about 1.3. This is expected, given the significant size of the inner cone, which would be subtracted in the presented approach.
Clearly, these values depend on the threshold T defining the amount of myocardial coverage that should be retained. The lower the coverage, the higher the gain in frame rate but the more myocardium that remains outside the FOV and can therefore not be analyzed for function. Thus, this threshold should be chosen with caution and in consideration of the specific application. Although T was considered fixed in this study, it could also be chosen dynamic. Hereby, one would accommodate for the fact that the myocardial wall thickness changes during the cardiac cycle, which implies that the FOV is expected to be dynamic as well. If T is constant, this implies that the line density would have to be variable during the cardiac cycle in order to keep the acquisition time of a single frame constant. Alternatively, line density is kept fixed implying that the T would dynamically need adjustments to keep the total scan time for a given anatomic volume the same. In this study, the T value was arbitrarily set fixed to 85% but could be modified as required. Nevertheless, this arbitrary threshold allowed to provide initial insight into the characteristics of the conical FOV to be encountered in a clinical setting. It should be mentioned that the ring-shape template matching used to determine the opening angles of the conical volume might not be ideal given the left ventricular geometry. As such, an elliptic template might be more adequate but as this also complicates the MLT setup, this extension remains to be investigated in future work and was considered outside the scope of this initial feasibility study on anatomical volumetric imaging.
In this proof-of-concept study, the segmentation was performed at the end-diastole phase only to obtain the largest epicardial mask possible as an upper limit of the outer cone to limit the FOV. However, this could imply that the inner cone, of the field of view was underestimated as the endocardial border moves inwards during systole. Ideally, the segmentation is therefore envisioned to be dynamic throughout the cardiac cycle in order to adjust the FOV dynamically as well.
Given the characteristics of the typical conical volumes to be encountered in a clinical setting, the 8MLT, 9MLT and 10MLT systems seemed to be able to generate high frame rate images while preserving an appropriate image quality as these implementations reached our predefined threshold of −30 dB cross-talk. Even though this threshold was at first chosen from retrospectively analyzing our MLT findings in 2D [22], our recent 3D in vitro experiments corroborated that this threshold is indeed a reliable proxy for good image quality [13]. In fact, very recently Ramalli et al. [23] demonstrated both in vitro and in vivo that a 12MLT system can generate 2D images of clinically diagnostic value while this system had inter-beam cross-talk levels well above our pre-defined −30 dB threshold [11]. As such, our −30 dB threshold was likely conservative implying that also the 12MLT system tested in the context of anatomical imaging remains an attractive option that should be evaluated experimentally.
Overall, the combination of MLT and the definition of an anatomic FOV would thus imply a gain in frame rate up to 24 (considering 12MLT an option). As it has previously been proposed that at least 4MLA (two in azimuth and two in elevation) can be reconstructed per focused beam for a typical 2D cardiac matrix array transducer [14], this implies that the proposed sequences could effectively gain a factor up to 96 in frame rate at full line density. Similarly, if an MLT-4MLA sequence is implemented an actual frame rate gain factor of 64, 72 and 80 could be obtained when using 8 MLT, 9 MLT and 10MLT beams respectively. Finally, in order to further improve the temporal resolution of the data set, line density and/or interpolating the received scanline data could be considered. As such, if required for the desired cardiac application, frame rates in the order of hundreds or even thousands of Hertz could be achieved if a sparse anatomical scan sequence is implemented. For example, according to the current guideline for cardiac chamber quantification [1], for the assessment of regional left ventricular (LV) function (e.g., wall motion or regional strain), the ventricle is divided into segments. One of the segmentation models commonly used divides the apex, the basal and midventricular levels, in six segments each. Resulting in an 18-segment model. As such, as little as six beams would be required to scan the left ventricle with a clinically relevant spatial sampling (i.e., one sample per LV segment). Thus, using MLT beamforming, a single transmit event could evaluate all LV segments defined this way at a volume rate of 5 kHz (i.e., equal to the Pulse Repetition Frequency (PRF) typically used for cardiac imaging). However, six beams around the left ventricular myocardium may be too few to correctly resolve cardiac kinematics. As a consequence, a trade-off between the frame rate and the spatial sampling of the volume has to be made. For instance, if the 12MLT-4MLA sequence is applied to scan the FOV, 48 image lines could be reconstructed per transmit event. If five transmit events are then performed, 240 samples around the circumference could be acquired at a frame rate of 1 kHz. Depending on the application, the transmit events could be performed radially or circumferentially, while properly staggering the scanning sequence should ensure that the inter-beam distance remains constant. Although such sequence would result in inhomogeneous spatial sampling (i.e., transmit beams are further apart than MLA beams), the MLA beams could be used to assess local kinematics (e.g., 3D motion) while the MLT beams allow for sampling different segments of the LV simultaneously.
Only MLT systems with 8 to 12 parallel beams were evaluated in this study, as this was the range of number of beams that gave a significant increase in frame rate while having a moderate cross-talk energy level. It can be expected that systems with less than eight parallel beams will have a better image quality; however, due to their low impact on the frame rate they were not considered in this study. Furthermore, given that the inter-beam interference of the 12MLT system was above the predefined threshold, it can be expected that adding more MLT beams will only result in worse image quality.
In order to translate the proposed scan sequence to the clinical setting, several approaches could be envisioned. For example, one could consider a fixed conical volume based on a statistical analysis of what is likely to be encountered in a clinical setting, and define an optimal MLT sequence for this volume as described in the present study. However, given the large variability of ventricular size and shape, a fairly large FOV would be required implying that only a relatively moderate increase in frame rate would be achieved.
A better alternative would be to ask the user to first identify the FOV in the pyramidal volume acquired using conventional imaging. This FOV could then be used to set up the fast MLT imaging sequence. Nevertheless, this manually delineated FOV adapted to the patients’ anatomy would still remain relatively large to ensure that the myocardium remains inside during the full cardiac cycle. Evidently, as there is a time lag between finding the FOV and defining the imaging scan sequence, the latter would not have to be done in real-time (but sufficiently fast) and different MLT setups could prospectively be linked to characteristic dimensions of the conical volume in a look-up table (LUT).
Finally, a third—and preferred—alternative would be to use a dynamic FOV definition based on a fully automatic 3D ultrasound myocardial segmentation. These technologies are already available, e.g., [24,25]. This would lead to an optimal, narrow FOV, and thus an optimal frame rate gain. Given the simplicity of defining the proposed coverage function (whose calculation can be parallelized in a straightforward manner), and given the possibility of real-time template matching [26], the anatomical FOV could be dynamically defined. Then, the best-fitting parallelized scan sequence can be looked up in a LUT which could—similar to the LUT used in the manual FOV definition—prospectively be defined for a set of predefined dynamics FOVs. Of note in this context is that MLT beamforming has recently been demonstrated to be possible in real time [23] and does not require off-line image reconstruction.
Thus, the ideal workflow for anatomical cardiac imaging could be envisioned as:
- A pyramidal volume is acquired at a conventional frame rate (i.e., ~30 Hz).
- The coverage function and the ring-shaped template matching are applied to define an anatomical conically shaped FOV.
- Based on (iii), a fast scanning sequence is automatically selected using a LUT giving the best combination of transmit and receive parallelization (i.e., MLT-MLA) to scan the detected region-of-interest.
- The anatomical relevant space is scanned at high spatiotemporal resolution for subsequent motion analysis.
The proposed approach offers approximately twice the frame rate of the pyramidal 3D MLT approach previously presented by our team [17], despite the fact that it uses less parallelization (i.e., 12MLT-4MLA vs. 16MLT-4MLA). This improvement is obviously due to the reduced FOV to the anatomical relevant space. However, the effective gain in frame rate can only be quantified after choosing the scan sequence based on the desired application as pointed out above.
Please note that the presented methodology was defined for apical view acquisitions only. This is because most of the 3D cardiac kinematic analysis, such as motion and deformation imaging, require a volume scanned from the apex. Although, parasternal view acquisitions are mostly used to asses aortic and pulmonary valves, they are also used for circumferential strain evaluation which is not possible to be appraised with the current approach.
Due to mainly hardware limitations, in vitro and in vivo experiments of a MLT implementation could not be studied and therefore the capability of MLT-MLA systems to precisely record the motion of the heart could not be corroborated. On the one hand, transmitting into several directions simultaneously requires the application of non-identical electric excitation pulses (EEPs) to all elements in the phased array transducer. These pulses are defined as the sum of the EEPs that would be applied on the individual elements when emitting the transmit beams separately. As this sum will result in the superposition of the EEPs, to date, MLT implementations were done on systems having arbitrary waveform generators (AWG). This is particularly relevant for 3D imaging as the superposition of EEPs can become significant (e.g., up to 16 for a 16MLT imaging sequence). However, as most of the available scanners are equipped with a tri-state pulse generator, the implementation of an MLT sequence on such scanner is not straightforward. One way of overcoming this limitation is by clipping the superposed MLT sequences to the maximum of the available pulser. It has been found in preliminary tests that the clipped EEPs are capable of well-resembling the ideal MLT sequence, despite the drop of the transmit energy which might reduce the capability of the acoustic wave to propagate in depth and might decrease the acoustic pressure. On the other hand, matrix array transducers (essential to 3D imaging) have between 2000 and 4000 individual elements which makes wiring costly and impractical. Several methods have been proposed to limit cabling between the US probe and the back-end of the console. Among these methods is subaperture beamforming (SAP) which is most commonly implemented in clinical scanners. SAP divides the transducer aperture in subsets of elements that are beamformed inside the probe and the resulting signal is transferred through a single wire. In this way, the number of wires required to connect the transducer and the back-end of the console are reduced to the number of “sub-apertures”. Therefore, beamforming is typically done in two phases where part of the beamforming is done in the transducer itself while the pre-beam formed signals are combined in the front-end in order to generate the individual image lines (i.e., two-stage beamforming [27]). Recently, it has been shown that severe imaging artifacts are introduced while using this technique for DWI [28]. This is due to delay errors which cause grating lobes and reduced penetration. Thus, due to the complexity of MLT sequences, an adaptation for clinical transducers using SAP must be implemented, which represents a challenge that needs to be investigated. Moreover, current state-of-the-art commercial systems are fully equipped to beamform MLA beams in real time. Therefore, the translation of the proposed method into commercial systems remains challenging, since this would not only require changing imaging methodology but also redesigning hardware.
6. Conclusions
Anatomical scanning in combination with MLT-MLA beamforming techniques can increase frame rate significantly while keeping information of the relevant structures for functional myocardial imaging. When limiting the FOV to a cone, a frame rate gain factor of about 2 could be achieved. Furthermore, when combined with parallel transmit/receive beamforming and transmit/receive apodization (Tukey: ), frame rate could be further increased with a 64-fold, 72-fold or 80-fold factor in the case of an 8MLT-4MLA, 9MLT-4MLA or 10MLT-4MLA configuration, respectively, while showing acceptable cross-talk levels. Although the tested 12MLT-4MLA configuration, with the same apodization, did not reach the predefined cross-talk limit, its 96-fold frame rate gain might outweigh its loss in image quality. It therefore remains a possible implementation to be investigated in future in vivo and/or in vitro experiments.
Acknowledgments
The research leading to these results has received funding from the European Research Council under the European Union′s Seventh Framework programme (FP7/2007–2013)/ERC Grant Agreement number 281748.
Author Contributions
Alejandra Ortega under the supervision and guidance of Jan D’hooge, developed the presented methodology, performed the experiments and wrote the paper. Joao Pedrosa and Brecht Heyde contributed with the segmentation masks used in the experiments, and Ling Tong contributed with her knowledge about parallel beamforming implemented in the methodology. All coauthors contributed with reading and improving the manuscript.
Conflicts of Interest
The authors declare no conflict of interest.
References
- Lang, R.M.; Badano, L.P.; Mor-Avi, V.; Afilalo, J.; Armstrong, A.; Ernande, L.; Flachskampf, F.A.; Foster, E.; Goldstein, S.A.; Kuznetsova, T.; et al. Recommendations for cardiac chamber quantification by echocardiography in adults: An update from the American society of echocardiography and the European association of cardiovascular imaging. Eur. Heart J. Cardiovasc. Imaging 2015, 16, 233–271. [Google Scholar] [CrossRef] [PubMed]
- Jasaityte, R.; Heyde, B.; D’hooge, J. Current state of three-dimensional myocardial strain estimation using echocardiography. J. Am. Soc. Echocardiogr. 2013, 26, 15–28. [Google Scholar] [CrossRef] [PubMed] [Green Version]
- D’hooge, J.; Konofagou, E.; Jamal, F.; Heimdal, A.; Barrios, L.; Bijnens, B.; Thoen, J.; Van de Werf, F.; Sutherland, G.R.; Suetens, P. Two-dimensional ultrasonic strain rate measurement of the human heart in vivo. Ultrason. Ferroelectr. Freq. Control. IEEE Trans. 2002, 49, 281–286. [Google Scholar] [CrossRef]
- Kanai, H.; Koiwa, Y. Myocardial rapid velocity distribution. Ultrasound Med. Biol. 2001, 27, 481–498. [Google Scholar] [CrossRef]
- Pernot, M.; Fujikura, K.; Fung-Kee-Fung, S.D.; Konofagou, E.E. ECG-gated, mechanical and electromechanical wave imaging of cardiovascular tissues in vivo. Ultrasound Med. Biol. 2007, 33, 1075–1085. [Google Scholar] [CrossRef] [PubMed]
- Shattuck, D.P.; Weinshenker, M.D.; Smith, S.W.; von Ramm, O.T. Explososcan: A parallel processing technique for high speed ultrasound imaging with linear phased arrays. J. Acoust. Soc. Am. 1984, 75, 1273–1282. [Google Scholar] [CrossRef] [PubMed]
- Sarvazyan, A.P.; Rudenko, O.V.; Swanson, S.D.; Fowlkes, J.B.; Emelianov, S.Y. Shear Wave Elasticity Imaging: A new ultrasonic technology of medical diagnostic. Ultrasound Med. Biol. 1998, 24, 1419–1435. [Google Scholar] [CrossRef]
- Provost, J.; Papadacci, C.; Arango, J.E.; Imbault, M.; Fink, M.; Gennisson, J.-L.; Tanter, M.; Pernot, M. 3D ultrafast ultrasound imaging in vivo. Phys. Med. Biol. 2014, 59, L1–L13. [Google Scholar] [CrossRef] [PubMed]
- Walker, W.F.; Trahey, G.E. A fundamental limit on the performance of correlation based phase correction and flow estimation techniques. In Proceedings of the IEEE Ultrasonics Symposium, Montréal, QC, Canada, 23–27 August 2004. [Google Scholar]
- Prieur, F.; Dénarié, B.; Austeng, A.; Torp, H. Multi-Line Transmission in Medical Imaging Using the Second-Harmonic Signal. IEEE Trans. Ultrason. Ferroelectr. Freq. Control 2013, 60, 2682–2692. [Google Scholar] [CrossRef] [PubMed]
- Tong, L.; Gao, H.; D’hooge, J. Multi-transmit beamforming for fast cardiac imaging-a simulation study. IEEE Trans. Ultrason. Ferroelectr. Freq. Control. 2013, 60, 1719–1731. [Google Scholar] [CrossRef] [PubMed]
- Demi, L.; Verweij, M.D.; Van Dongen, K.W. Parallel transmit beamforming using orthogonal frequency division multiplexing applied to harmonic imaging—A feasibility study. IEEE Trans. Ultrason. Ferroelectr. Freq. Control 2012, 59, 2439–2447. [Google Scholar] [CrossRef] [PubMed]
- Demi, L.; Ramalli, A.; Giannini, G.; Mischi, M. In Vitro and in Vivo tissue harmonic images obtained with parallel transmit beamforming by means of orthogonal frequency division multiplexing. IEEE Ultrason. Symp. Proc. 2015, 62, 230–235. [Google Scholar] [CrossRef] [PubMed]
- Hergum, T.; Bjastad, T.; Kristoffersen, K.; Torp, H. Parallel Beamforming Using Synthetic Transmit Beams. IEEE Trans. Ultrason. Ferroelectr. Freq. Control 2007, 54, 271–280. [Google Scholar] [CrossRef] [PubMed]
- Santos, P.; Tong, L.; Ortega, A.; Løvstakken, L.; Samset, E.; D’hooge, J. Acoustic Output of Multi-Line Transmit Beamforming for Fast Cardiac Imaging. IEEE Trans. Ultrason. Ferroelectr. Freq. Control 2015, 62, 1320–1330. [Google Scholar] [CrossRef] [PubMed]
- Tong, L.; Ortega, A.; Gao, H.; D’hooge, J. Fast three-dimensional ultrasound cardiac imaging using multi-transmit beamforming: A simulation study. IEEE Ultrason. Symp. Proc. 2013, 60, 1456–1459. [Google Scholar]
- Ortega, A.; Provost, J.; Tong, L.; Santos, P.; Heyde, B.; Pernot, M.; D’hooge, J. A comparison of the performance of different multi-line transmit setups for fast volumetric cardiac ultrasound. IEEE Trans. Ultrason. Ferroelectr. Freq. Control 2016, 63, 1. [Google Scholar] [CrossRef] [PubMed]
- Barbosa, D.; Dietenbeck, T.; Schaerer, J.; D’hooge, J.; Friboulet, D.; Bernard, O. B-spline explicit active surfaces: An efficient framework for real-time 3-D region-based segmentation. IEEE Trans. Image Process. 2012, 21, 241–251. [Google Scholar] [CrossRef] [PubMed]
- Pedrosa, J.; Barbosa, D.; Heyde, B.; Schnell, F.; Rösner, A.; Claus, P.; D’hooge, J. Left Ventricular Myocardial Segmentation in 3-D Ultrasound recordings: Effect of Different Endocardial and Epicardial Coupling Strategies. IEEE Trans. Ultrason. Ferroelectr. Freq. Control 2017, 64, 525–536. [Google Scholar] [CrossRef] [PubMed]
- Bruyneel, T.; Ortega, A.; Tong, L.; D’hooge, J. A GPU-based implementation of the spatial impulse response method for fast calculation of linear sound fields and pulse-echo responses of array transducers. Proceedings of IEEE Ultrasonic Symposium, Prague, Czech Republic, 21–25 July 2013. [Google Scholar]
- Rademakers, F.; Engvall, J.; Edvardsen, T.; Monaghan, M.; Sicari, R.; Nagel, E.; Zamorano, J.; Ukkonen, H.; Ebbers, T.; Di Bello, V.; et al. Determining optimal noninvasive parameters for the prediction of left ventricular remodeling in chronic ischemic patients. J. Scand. Cardiovasc. 2013, 47, 329–334. [Google Scholar] [CrossRef] [PubMed]
- Tong, L.; Ramalli, A.; Jasaityte, R.; Tortoli, P.; D’hooge, J. Multi-transmit beamforming for fast cardiac imaging—Experimental validation and in vivo application. IEEE Trans. Med. Imag. 2014, 33, 1205–1219. [Google Scholar] [CrossRef] [PubMed]
- Ramalli, A.; Dallai, A.; Boni, E.; Bassi, L.; Meacci, V.; Giovannetti, M.; Tong, L.; D’hooge, J.; Tortoli, P. Multi transmit beams for fast cardiac imaging towards clinical routine. In Proceedings of the IEEE International Ultrasonics Symposium (IUS), Tours, France, 18–21 September 2016. [Google Scholar]
- Barbosa, D.; Dietenbeck, T.; Heyde, B.; Houle, H.; Friboulet, D.; D’hooge, J.; Bernard, O. Fast and fully automatic 3D echocardiographic segmentation using B-spline explicit active surfaces: Feasibility study and validation in a clinical setting. Ultrasound Med Biol. 2013, 39, 89–101. [Google Scholar] [CrossRef] [PubMed]
- Orderud, F.; Rabben, S.I. Real-time 3D segmentation of the left ventricle using deformable subdivision surfaces. In Proceedings of the IEEE Computer Society Conference on Computer Vision and Pattern Recognition (CVPR), Anchorage, AK, USA, 23–28 June 2008. [Google Scholar]
- Jurie, F.; Dhome, M. Real Time Robust Template Matching. In Proceedings of the 13th British Machine Vision Conference, University of Cardiff, Cardiff, Wales, 2–5 September 2002; pp. 1–10. [Google Scholar]
- Savord, B.J. Beamforming Methods and Apparatus for Three-Dimensional Ultrasound Imaging Using Two-Dimensional Transducer Array. U.S. Patent 6013032A, 11 January 2000. [Google Scholar]
- Santos, P.; Haugen, G.; Løvstakken, L.; Samset, E.; D’hooge, J. Diverging Wave Volumetric Imaging Using Sub-Aperture Beamforming. IEEE Trans. Med. Imag. 2016, 63, 2114–2124. [Google Scholar]
Figure 1.
Graphical representation of a conical scan for anatomical imaging in 3D (left) and 2D (right), where Φ and ΔΦ represent the opening angle and thickness of the cone, respectively.
Figure 1.
Graphical representation of a conical scan for anatomical imaging in 3D (left) and 2D (right), where Φ and ΔΦ represent the opening angle and thickness of the cone, respectively.

Figure 2.
View of the tested multi-line transmit (MLT) systems looked from a C-plane at 60 mm with respect to the rectangular aperture (central blue square). The MLT beams are spread out in an equiangular manner in the circumferential direction of the cone while steered in the radial direction. In this way, the beams are as far apart as possible and therefore the inter-beam interference is reduced.
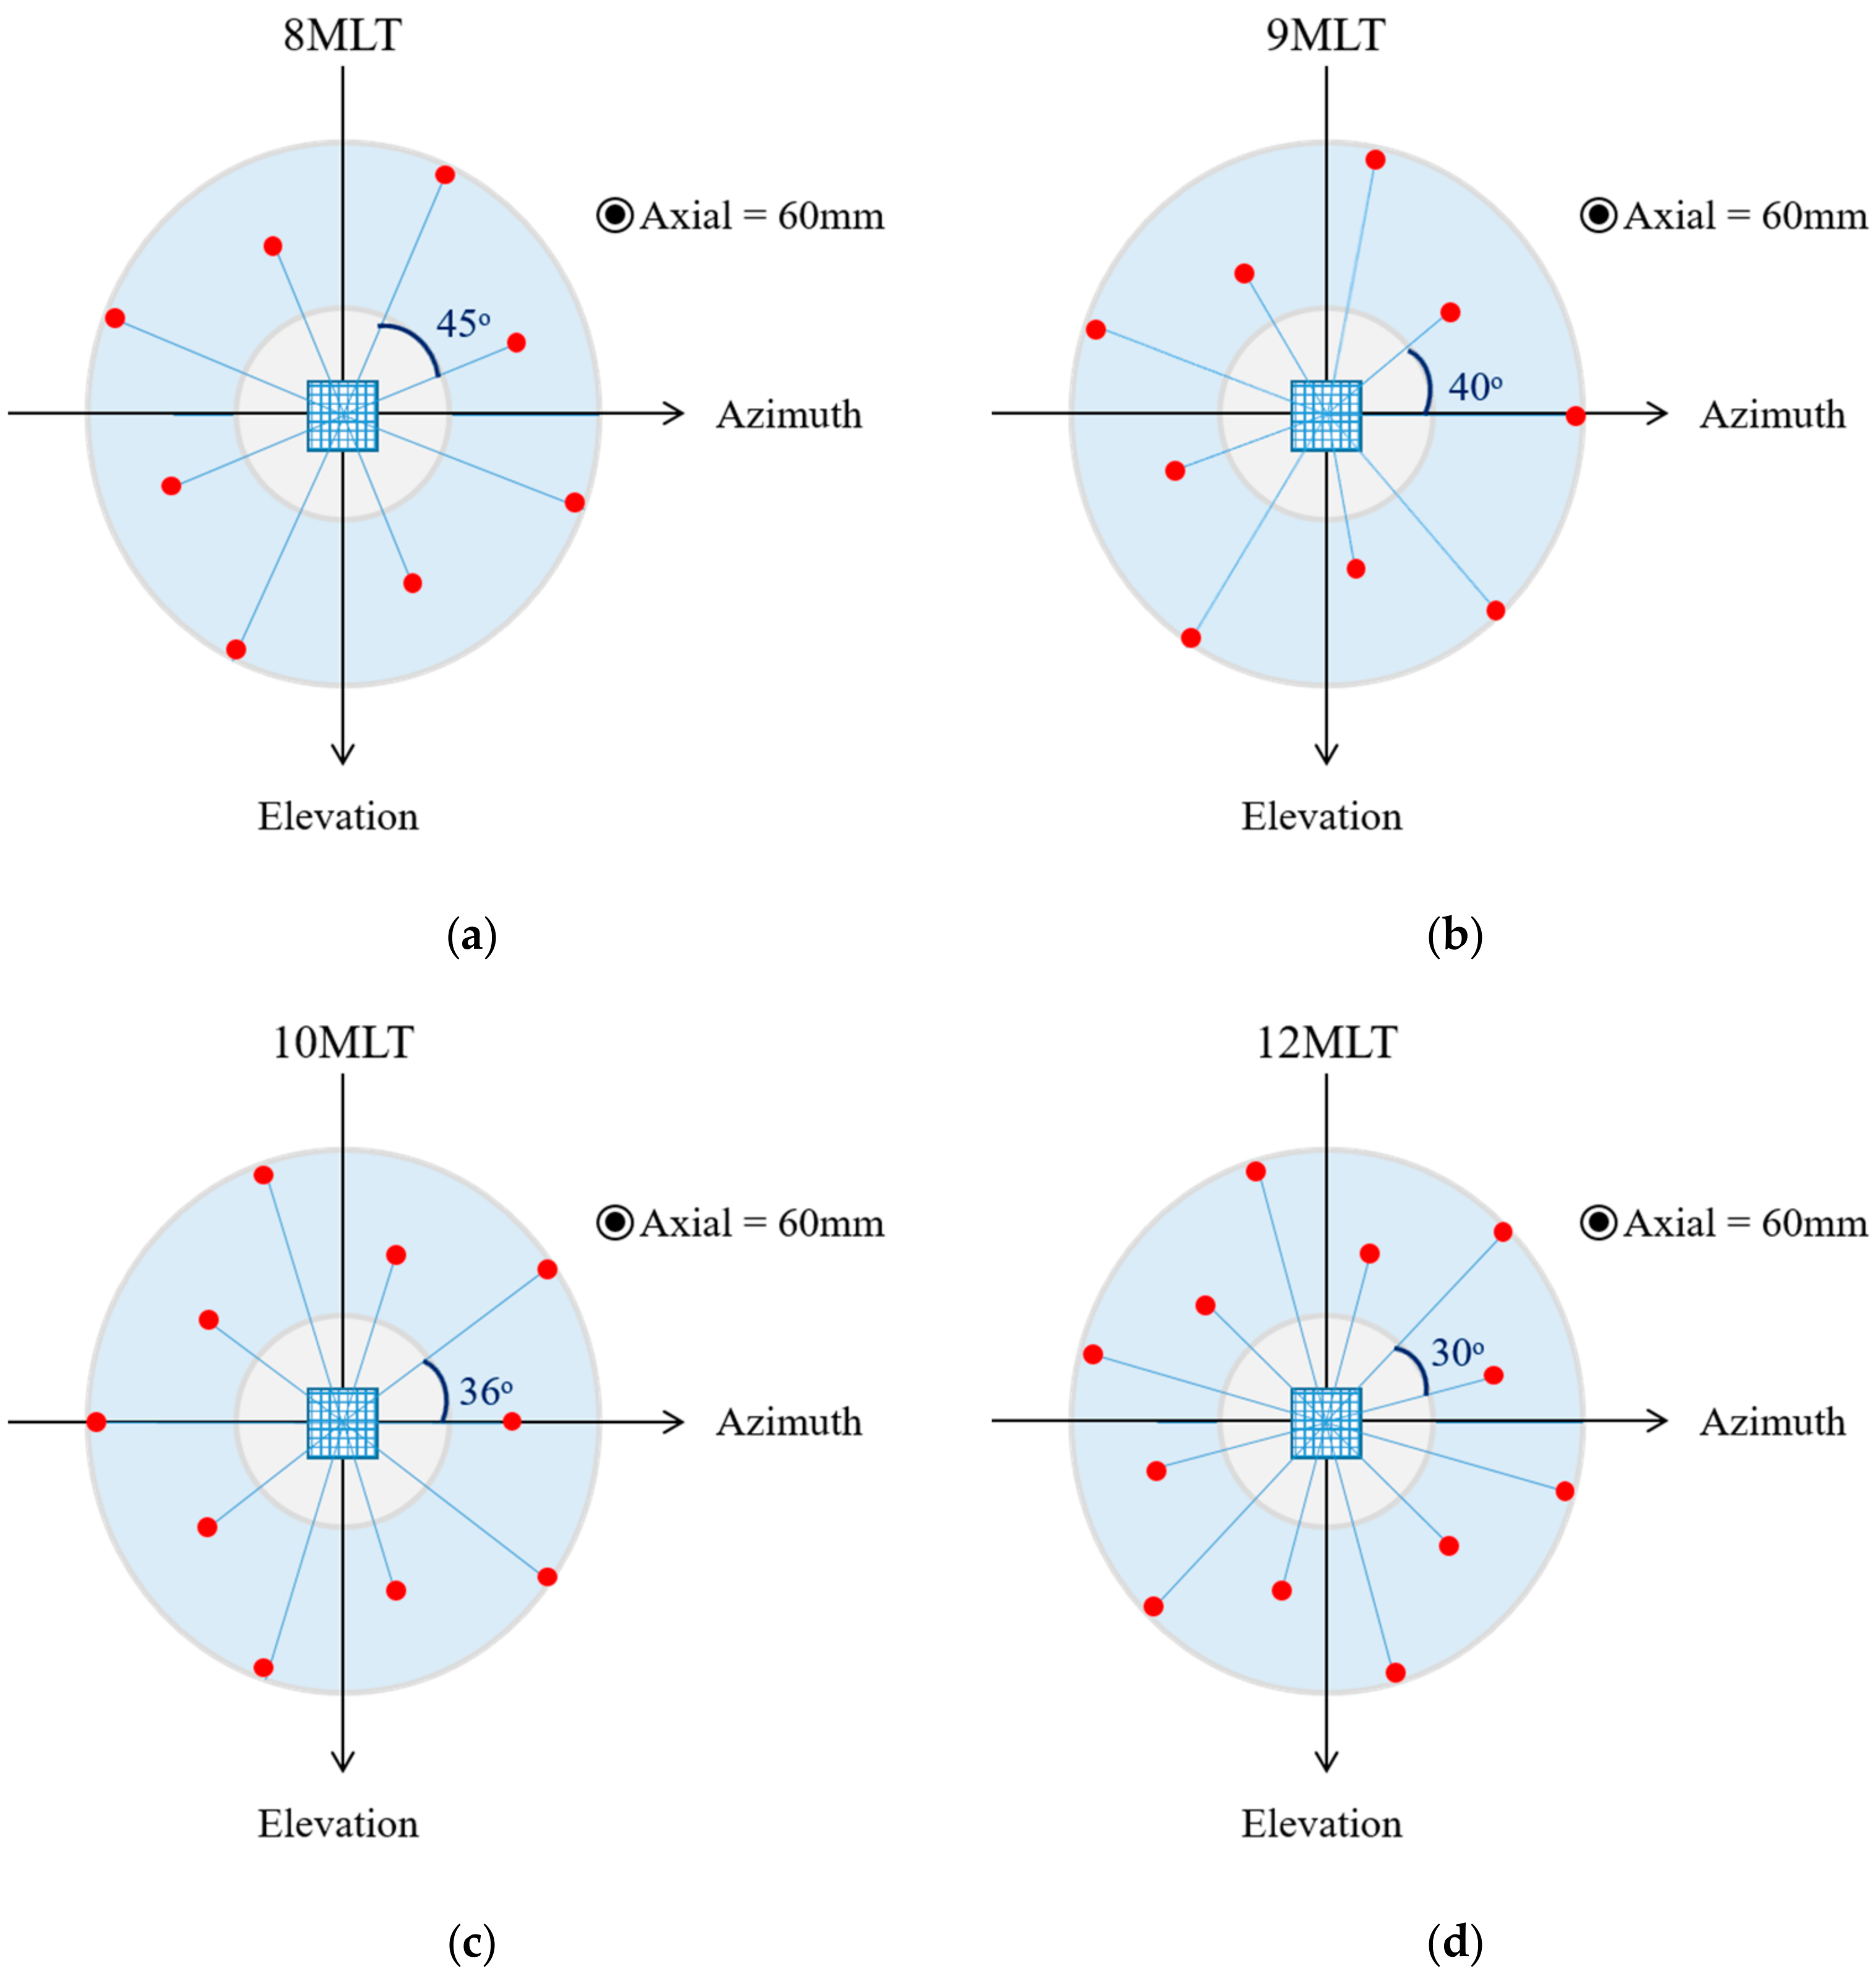
Figure 3.
Example of the workflow to determine the anatomical relevant space: (a) Myocardial segmentation shown as a mask overlaid in three orthogonal slices through the middle of the ultrasound volume (from left to right: azimuth, elevation and depth); (b) Computed coverage function expressing the percentage of pixels along each image line that belong to the myocardium; (c) Percentage of myocardial coverage as a function of the inner radius (Ri) and the outer radius (Ro) of the ring-shaped template.

Figure 4.
Two-way beam profiles of a 10MLT system on a C-plane at 65 mm, when transmitting at one direction (i.e., θi) and receiving in all other MLT directions (i.e., θ1,..θi,..θj). Tukey apodization (α = 0.5) was used in transmit and receive. The first subplot can be seen as the single line transmit signal (i.e., the ideal case), and the remaining ones as noise (i.e., cross-talk). This information was used to evaluate Equation (1) which quantifies the cross-talk energy level of the system.

Figure 5.
Cross-talk energy level of the different tested setups for the estimated ‘mean’ conical FOV. The tested systems were: 8MLT, 9MLT, 10MLT and 12MLT, all with transmit/receive Tukey apodization (α = 0.5). The cross-talk cut-off was defined as −30 dB for an acceptable B-mode image quality.
Figure 5.
Cross-talk energy level of the different tested setups for the estimated ‘mean’ conical FOV. The tested systems were: 8MLT, 9MLT, 10MLT and 12MLT, all with transmit/receive Tukey apodization (α = 0.5). The cross-talk cut-off was defined as −30 dB for an acceptable B-mode image quality.

© 2017 by the authors. Licensee MDPI, Basel, Switzerland. This article is an open access article distributed under the terms and conditions of the Creative Commons Attribution (CC BY) license (http://creativecommons.org/licenses/by/4.0/).
Share and Cite
MDPI and ACS Style
Ortega, A.; Pedrosa, J.; Heyde, B.; Tong, L.; D’hooge, J. Automatic Definition of an Anatomic Field of View for Volumetric Cardiac Motion Estimation at High Temporal Resolution. Appl. Sci. 2017, 7, 752. https://doi.org/10.3390/app7070752
AMA Style
Ortega A, Pedrosa J, Heyde B, Tong L, D’hooge J. Automatic Definition of an Anatomic Field of View for Volumetric Cardiac Motion Estimation at High Temporal Resolution. Applied Sciences. 2017; 7(7):752. https://doi.org/10.3390/app7070752
Chicago/Turabian StyleOrtega, Alejandra, João Pedrosa, Brecht Heyde, Ling Tong, and Jan D’hooge. 2017. "Automatic Definition of an Anatomic Field of View for Volumetric Cardiac Motion Estimation at High Temporal Resolution" Applied Sciences 7, no. 7: 752. https://doi.org/10.3390/app7070752
Note that from the first issue of 2016, this journal uses article numbers instead of page numbers. See further details here.