A Real Model of a Micro-Grid to Improve Network Stability
by
 ,
,
Petr Marcon
1,2,* ,
,
Zoltan Szabo
1,2, 
Ivo Vesely
2,3,
Frantisek Zezulka
2,3,
Ondrej Sajdl
2,
Zdenek Roubal
1,2 and
Premysl Dohnal
1 1
Department of Theoretical and Experimental Electrical Engineering, FEEC, Brno University of Technology, Technicka 12, 61600 Brno, Czech Republic
2
Centre for Research and utilization of Renewable Energy, FEEC, Brno University of Technology, Technicka 12, 61600 Brno, Czech Republic
3
Department of Control and Instrumentation, FEEC, Brno University of Technology, Technicka 12, 61600 Brno, Czech Republic
*
Author to whom correspondence should be addressed.
Appl. Sci. 2017, 7(8), 757; https://doi.org/10.3390/app7080757
Submission received: 30 June 2017
/
Revised: 14 July 2017
/
Accepted: 22 July 2017
/
Published: 26 July 2017
(This article belongs to the Special Issue Smart Home and Energy Management Systems)
Abstract
:This paper discusses the smart energy model of a smart grid using a significant share of renewable energy sources combined with intelligent control that processes information from a smart metering subsystem. An algorithm to manage the microgrid via the demand-response strategy is proposed, accentuating the requirement that the total volume of energy produced from renewable sources is consumed. Thus, the system utilizes the maximum of renewable sources to reduce CO2 emissions. Another major benefit provided by the algorithm lies in applying the current weather forecast to predict the amount of energy in the grid; electricity can then be transferred between the local and the main backup batteries within the grid, and this option enables the control elements to prepare for a condition yet to occur. Individual parts of the grid are described in this research report together with the results provided by the relevant algorithm.
1. Introduction
The initial period within the development of electricity systems began in the mid-19th century. At this stage, electric energy was transferred via direct current (DC); the main obstacle consisted in the impossibility of producing and transferring higher electric power rates. Alternating current (AC) and its production perspectives then became known around 1870. However, within electrification through alternate current, an essential move forward only came later with the inventions of the synchronous alternator, three-phase system, transformer, and asynchronous motor (demonstrated by N. Tesla in 1887). Since then, transmission systems have exclusively used AC current, although generally in micro-grids and smart grids, DC current has recently re-assumed importance for energy transmission [1,2,3,4] as it reduces line loss caused by reactive power [5]. The AC system is commonly used in households because most appliances are designed for this related type of feeding, but there still remains the question of whether DC-based appliances could be a more advantageous solution for home micro-grids. Obviously, the concept includes the possibility of switching between DC and AC loads via converters [6]; in this context [5], characterizes a controlled, full-wave AC/DC rectifier integrated in a closed control loop. The basic criterion for embedding DC appliances in DC smart grid consists in the economy of use [7].
Currently, direct current is being increasingly provided by photovoltaic sources and wind power plants. Both of these renewable sources, however, often reduce the stability of the grid, and control algorithms are thus required to maintain stable voltage and frequency. Grid control and optimization possibilities are outlined in many articles, using a wide range of simple and sophisticated methods [8,9,10,11]. Sanchez et al., for example, analyzed the stability issue by means of the Nyquist criteria, and with the impedance relation method [12]. Conti et al. then describe micro-grid stabilization via central controller aggregates exploiting a genetic algorithm to ensure all the information necessary for optimal operation is present [13], and Colson et al. utilize particle swarm optimization in conjunction with dynamic programming [14]. Another sophisticated method to optimize grid stability is enhanced bee colony optimization [15,16].
The basic micro-grid control tool is embodied in the demand-response (DR) algorithm, which can be coupled with the optimization procedures described above. DR-based programs constitute an effective approach to resolving the problem of wind and photovoltaic power fluctuations [17,18,19,20]. Further, Cha et al. propose an operational algorithm for the individual agents of a test micro-grid that comprises a battery energy storage system (BESS) and an intelligent load [21].
The central purpose of a smart grid is to secure an effective way to manage the load growth, reduce the pollution of the environment, and improve the comprehensive energy efficiency and power supply reliability. The low carbon requirement is closely related to emission cutting in the automotive industry [22,23,24,25,26]. From the perspective of the demand-response strategy as well, it appears suitable to charge vehicles with a smart grid in order to help maintain the stability of the network [27]; for example, diverse strategies for the vehicle-to-grid (V2G) connection are discussed by L. Drude [28], who set his proposals in the urban region of Florianópolis, Brazil.
In micro-grids, the most frequent energy storage method relies on batteries [29,30]. Another major option is to use a hybrid electrothermal storage system that employs a battery and a hot water tank along with an electrical water heater as a controllable load; all of these components then facilitate the actual energy management within the micro-grid [31]. The solution presented within this paper combines a battery with metal hydride-based storage.
Generally, the proposed article describes a smart energy model (SEM) of a micro-grid and defines a management strategy suitable for micro-grid control within the Czech Republic. The SEM to be discussed herein constitutes a hardware implementation of a laboratory smart grid, a smart metering system, and a physical simulator of energy consumption, all materialized by the Laboratory of Automation and Embedded Systems of the Centre for Research and Utilization of Renewable Energy (CVVOZE, Brno, the Czech Republic). The purpose of the SEM is to simulate the different physical states in all types of smart grid networks and to develop new network types and related control possibilities. A major advantage of the discussed model lies in its simplicity and economical character (low initial set-up costs), and it is also important to note that various scenarios, including the demand-response approach, can be effectively tested. Two different levels of control algorithm testing are available: plain software simulation of the energy balance in the grid, and the use of real energy from renewable sources to control the micro-grid stability. The latter option is obviously more time-consuming. In the given context, the article also contributes to the general awareness of micro-grids and their varied applications.
2. General Technical Specifications of the Smart Energy Model
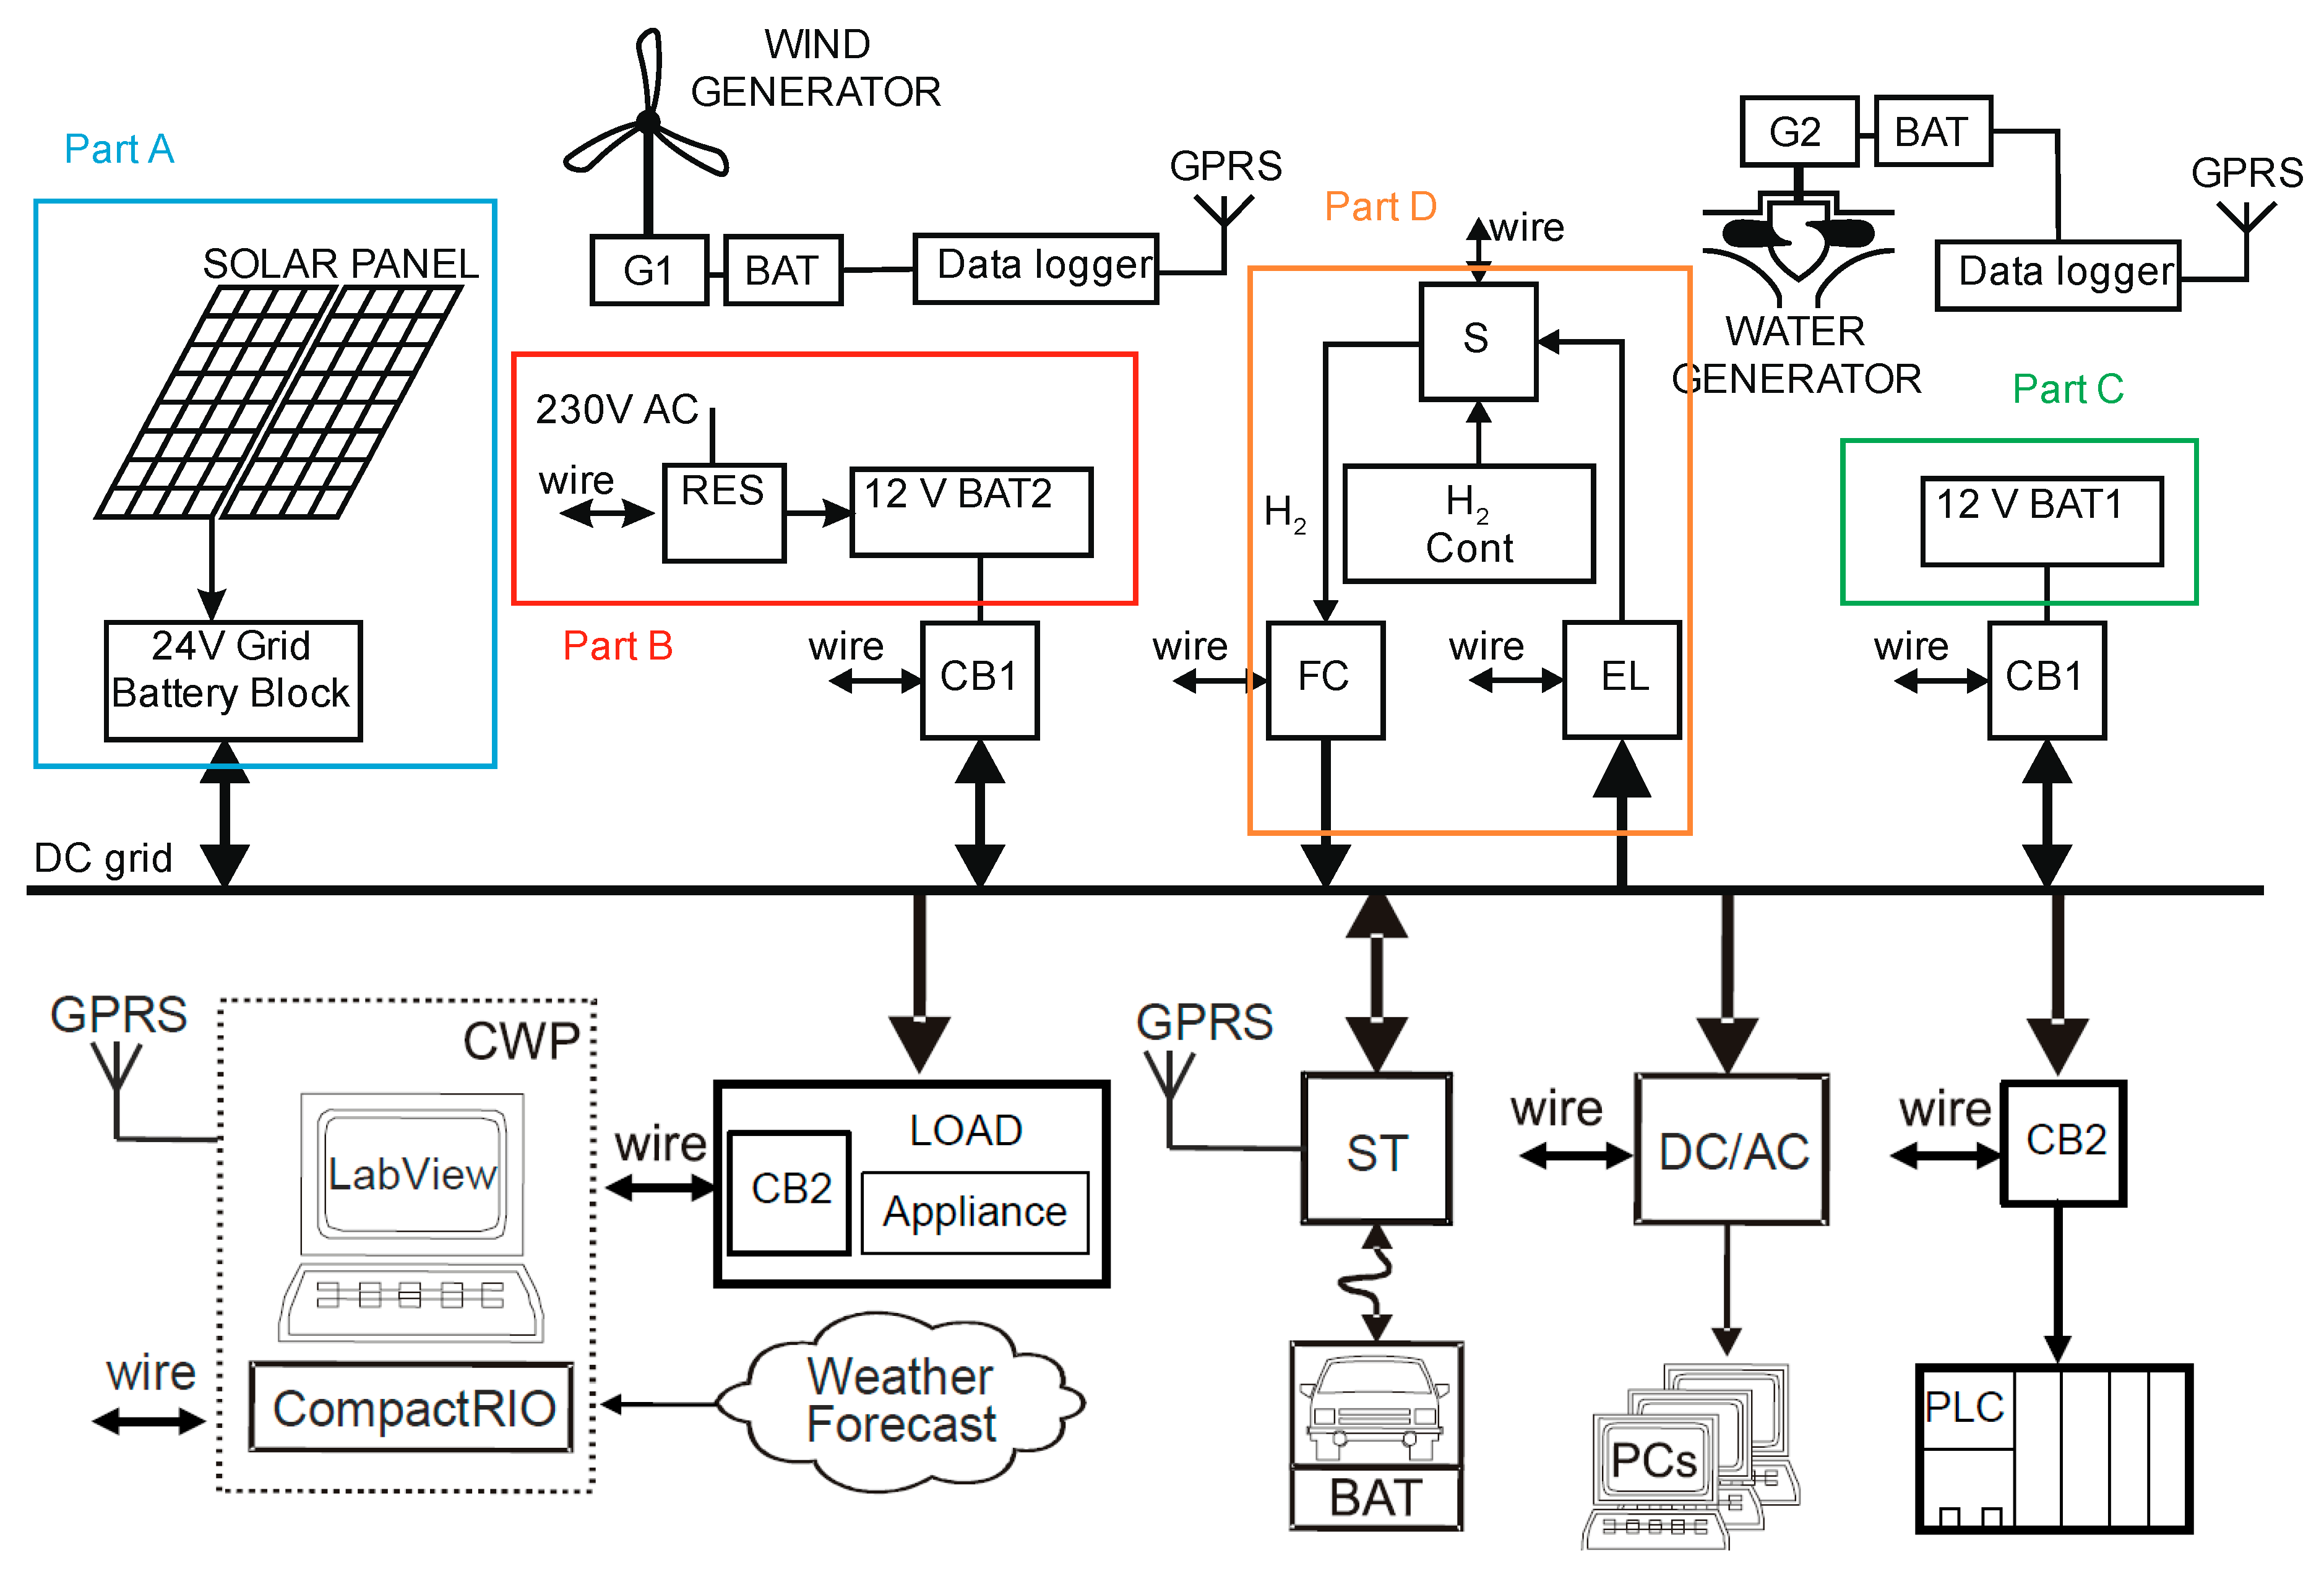
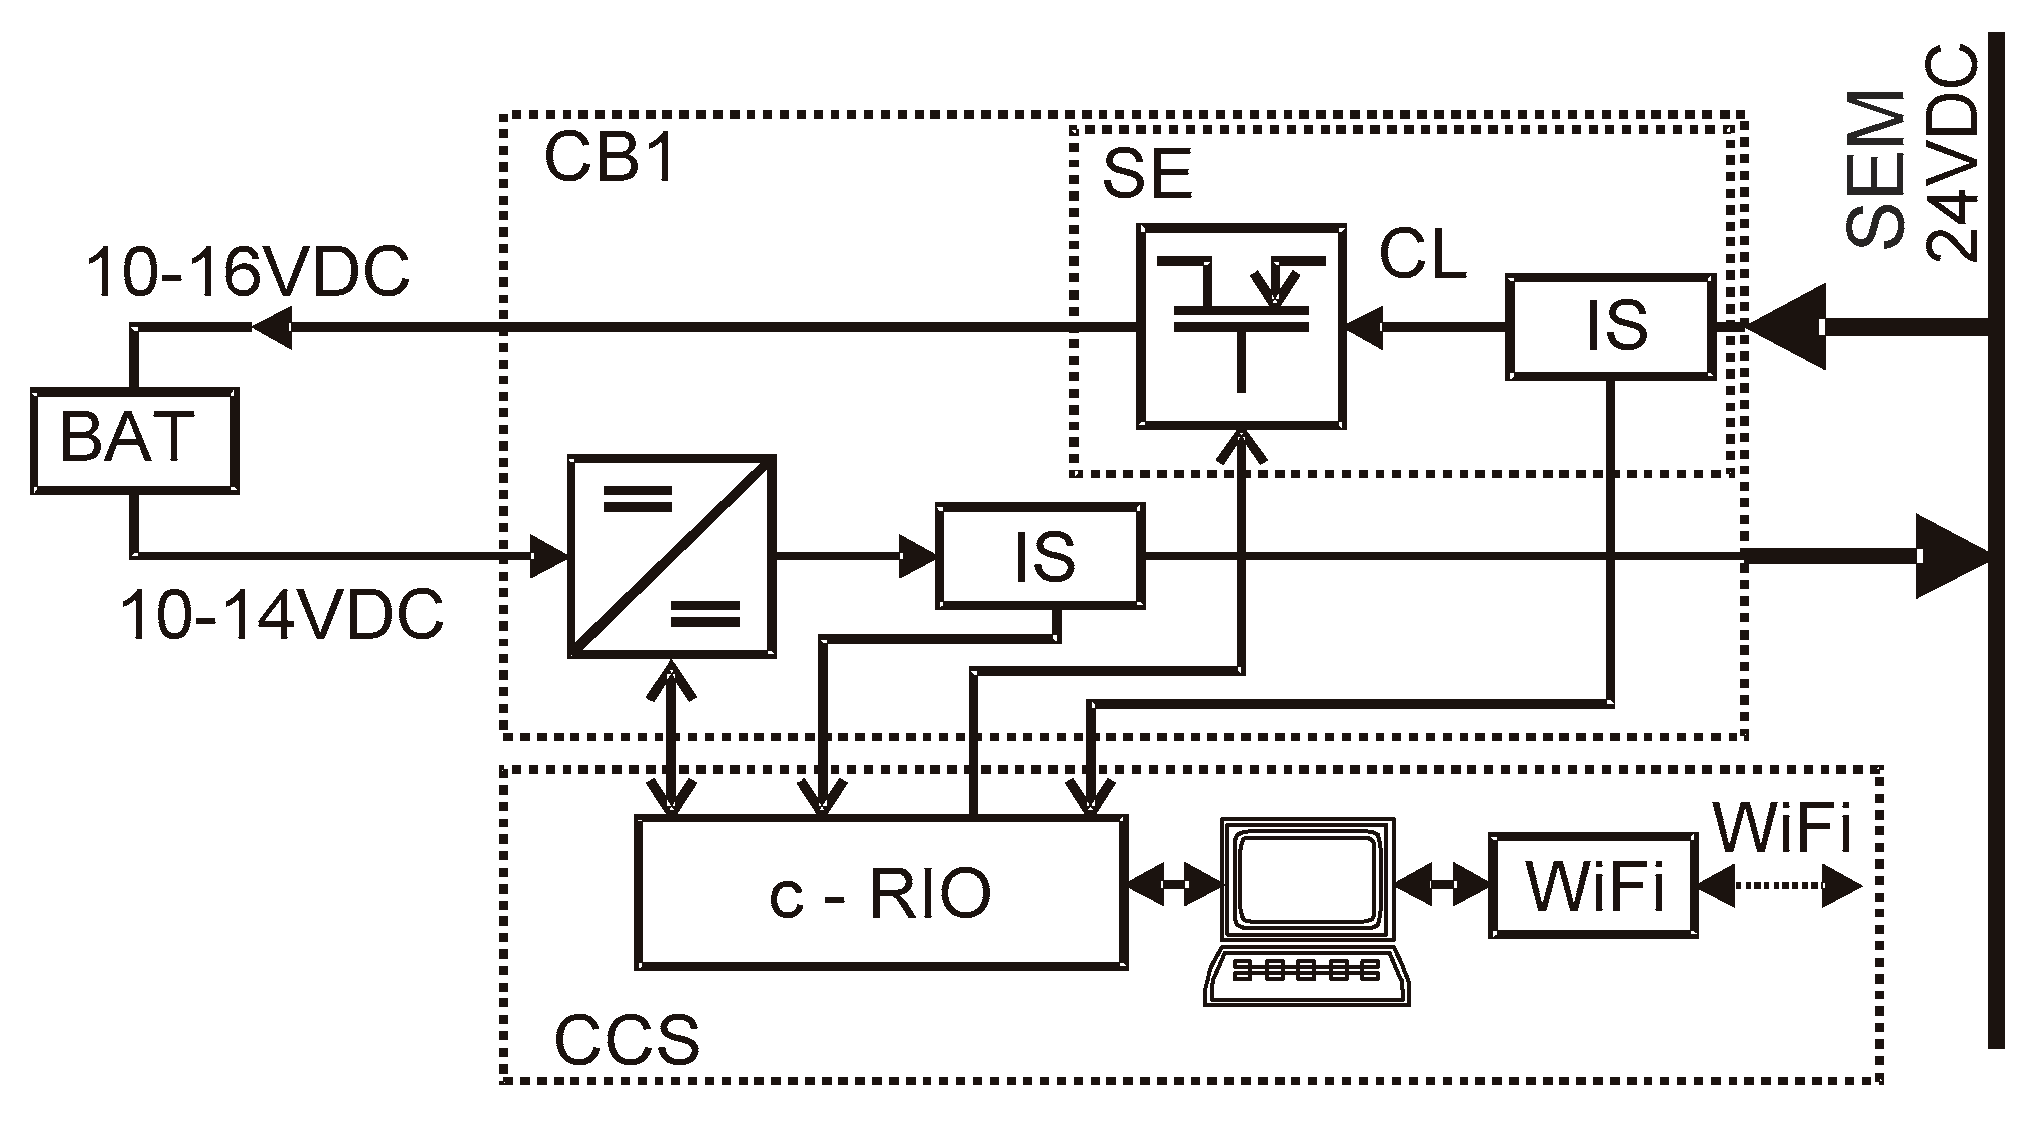
Considering the simplicity of the physical materialization, safety of experiments, and low implementation costs, together with the proposed usage in households, farms, and other small energy consumers, the SEM operates with 24 VDC. In all, the entire model is based on physical testing and simulation, stabilizes the grid, and enables maximal exploitation of the electric energy produced by the appended renewable energy sources (such as photovoltaics, wind power plants, hydroelectric stations, and fuel cells). Energy consumption from the grid is controlled by the real-time embedded industrial controller made by National Instruments for industrial control systems—CompactRIO (Austin, TX, USA) and CB1 control blocks (Brno, Czech Republic). The smart grid portion of the SEM is connected with the smart metering portion; smart metering and consumption control represent typical small consumers that participate in the smart energy system, utilizing the demand-response principles. Depending on the cost of the energy, the individual consumer, in conjunction with the central control station, will switch on or off large electrical appliances in the household or, in general, “control” their consumption rates. A block diagram of the proposed experimental micro-grid is shown in Figure 1, which includes a functional characterization of the blocks and principles of the computer-based control; the thick lines denote the energy flows.
3. Description of the DC Micro-Grid
A number of small or miniature power plants using renewable energy sources are connected to the grid; some of these can be found within the automation laboratory where the SEM is located. Importantly, PV panels are installed on the roof of the building; for practical reasons, however, a significant portion of the plants are based at remote locations. After being produced, the electrical energy (power) from these distant suppliers is measured by a data logger, which then communicates the obtained information via GPRS to the control centre (CC). The physical equivalent of the energy generated in such external power plants is simulated by a relevant remote energy source model—a remote energy source (RES)-controlled power box (available at the automation laboratory) connected into the SEM by means of the CB1 modules (Figure 1). The RES is managed by the CompactRIO control system according to the data received from the wireless data logger.
3.1. Energy Sources
This chapter discusses the renewable sources linked to the grid.
3.1.1. Photovoltaic Panels
A major energy source utilized within our micro-grid consists in two solar panels with the total power of 360 Wp; these panels are connected into the 24 VDC grid via a Solartec regulator. If the voltage provided by the solar panels is higher than that of the battery block, the device will charge the battery to its full capacity, using overvoltage protection to terminate the process at the desired moment.
3.1.2. Fuel Cell
3.1.3. Miniature Hydroelectric Power Station
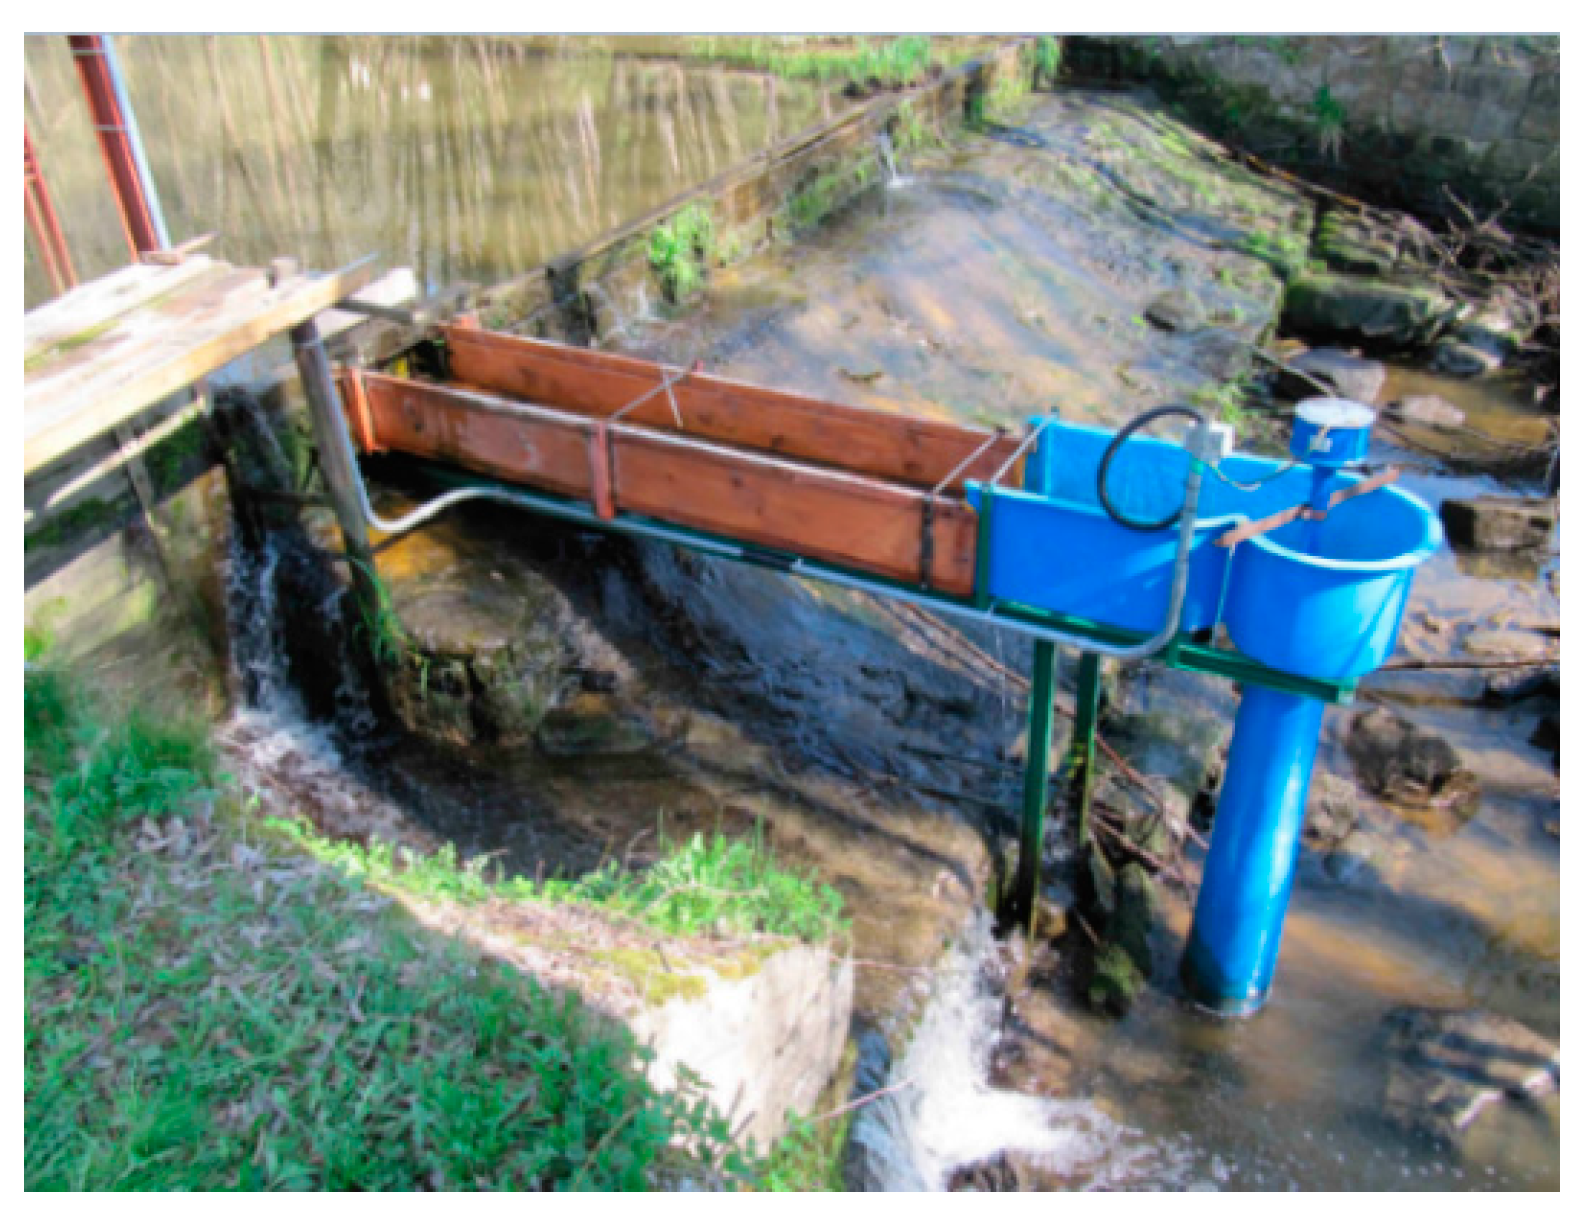
Water is one of the most powerful natural forces known to date, and hydropower plants capture and process rainfall energy to generate electricity. If we assume the actual manufacturing of components for electric energy stations and review the entire construction process, hydropower plants produce the lowest amount of CO2 (4–36 g/kWh). Thus, in addition to solar power systems, a micro-hydropower plant is also included in our micro-grid. This plant, located 120 km from the laboratory, is capable of generating the maximum power of 500 W; the basic layout and position are illustrated in Figure 3. For any effective modeling of the SEM, the performance of the hydroelectric plant has to be carefully monitored. Further, the performance depends on the volume of water passing the weir; this volume is then proportional to the level held by a purpose-built barrier to secure the influx to the turbine. The energy produced is fed to a regulator that keeps the harmonic network voltage at 230 VAC and maintains the frequency at 50 Hz.
Advantageously, a load (such as a charger) can be connected to the output of the regulator. The charger services the 12 V battery of the datalogger transmitting, to a MySQL server, the data related to the water level and the current output power value; the procedure corresponds to that adopted in the photovoltaic station [33].
3.1.4. Miniature Wind Power System
The set of applied energy sources also includes a small wind power plant (Air 40 made by Primus Wind Power, Colorado, CO, USA), whose turbine is linked to a 12 V battery and supplies 160 W at its highest performance. Similarly to the hydroelectric station, the wind power plant is not connected directly to the grid, meaning that we employ the RES to simulate the physically generated energy according to the measured data.
3.2. Micro-Grid Storage
The central aim is to utilize the maximum renewable energy available at any moment. Ideally, this would be a logical and the most economical principle to follow, but in practice it denies the physical fundamentals of electric energy, considering the consumer requirements and respecting the possibilities of not only the electrical distribution but also the information and control systems. Moreover, the actual electricity storage is a difficult problem involving most of the methods currently applied for the given purpose. In the presented micro-grid, however, only two types of storage are used, and these will be discussed in the following sections.
3.2.1. Accumulators
The former approach relies on accumulators, employing six batteries within the entire smart grid. The capacity of one battery corresponds to 120 Ah.
3.2.2. Hydrogen Storage
The latter technique exploits a metal hydride storage tank, Figure 3. The vessel is made from special alloys capable of holding hydrogen atoms in their crystal lattice. In order to obtain the largest possible surface area to secure such storage, the alloys are pulverized. The hydrogen is introduced into the tank under a slightly positive pressure and reacts with the alloy to form metal hydride. This process is exothermic, i.e., heat is dissipated; then, in order to discharge the hydrogen from the tank, heat must be reintroduced. Metal hydride tanks exhibit a high storage density with respect to the volume, but they also have a low storage density in relation to the weight. We use an Ovonic™ metal hydride storage tank (Heliocentris, Berlin, Germany) with the hydrogen content of 850 L (Figure 4) [34].
3.3. Hydrogen Circuit
In the presented micro-grid, a hydrogen circuit is applied when all the accumulators are fully charged and the smart grid shows an energy surplus (namely, the related photovoltaic panels, wind power plants, or small hydroelectric plants generate energy on a constant basis). Such a surplus is then used to produce hydrogen, and this product is stored in the metal hydride storage case.
In our case, a small hydrogen circuit containing a metal hydride canister is applied; for an effective description, this hydrogen circuit can be subdivided into three main parts. The first of these components is an electrolyzer (a hydrogen generator) with a dryer and a purifier; the second one embodies the storage, or a metal hydride storage tank with a valve system to switch between charging and consumption; and the third one consists of an FC.
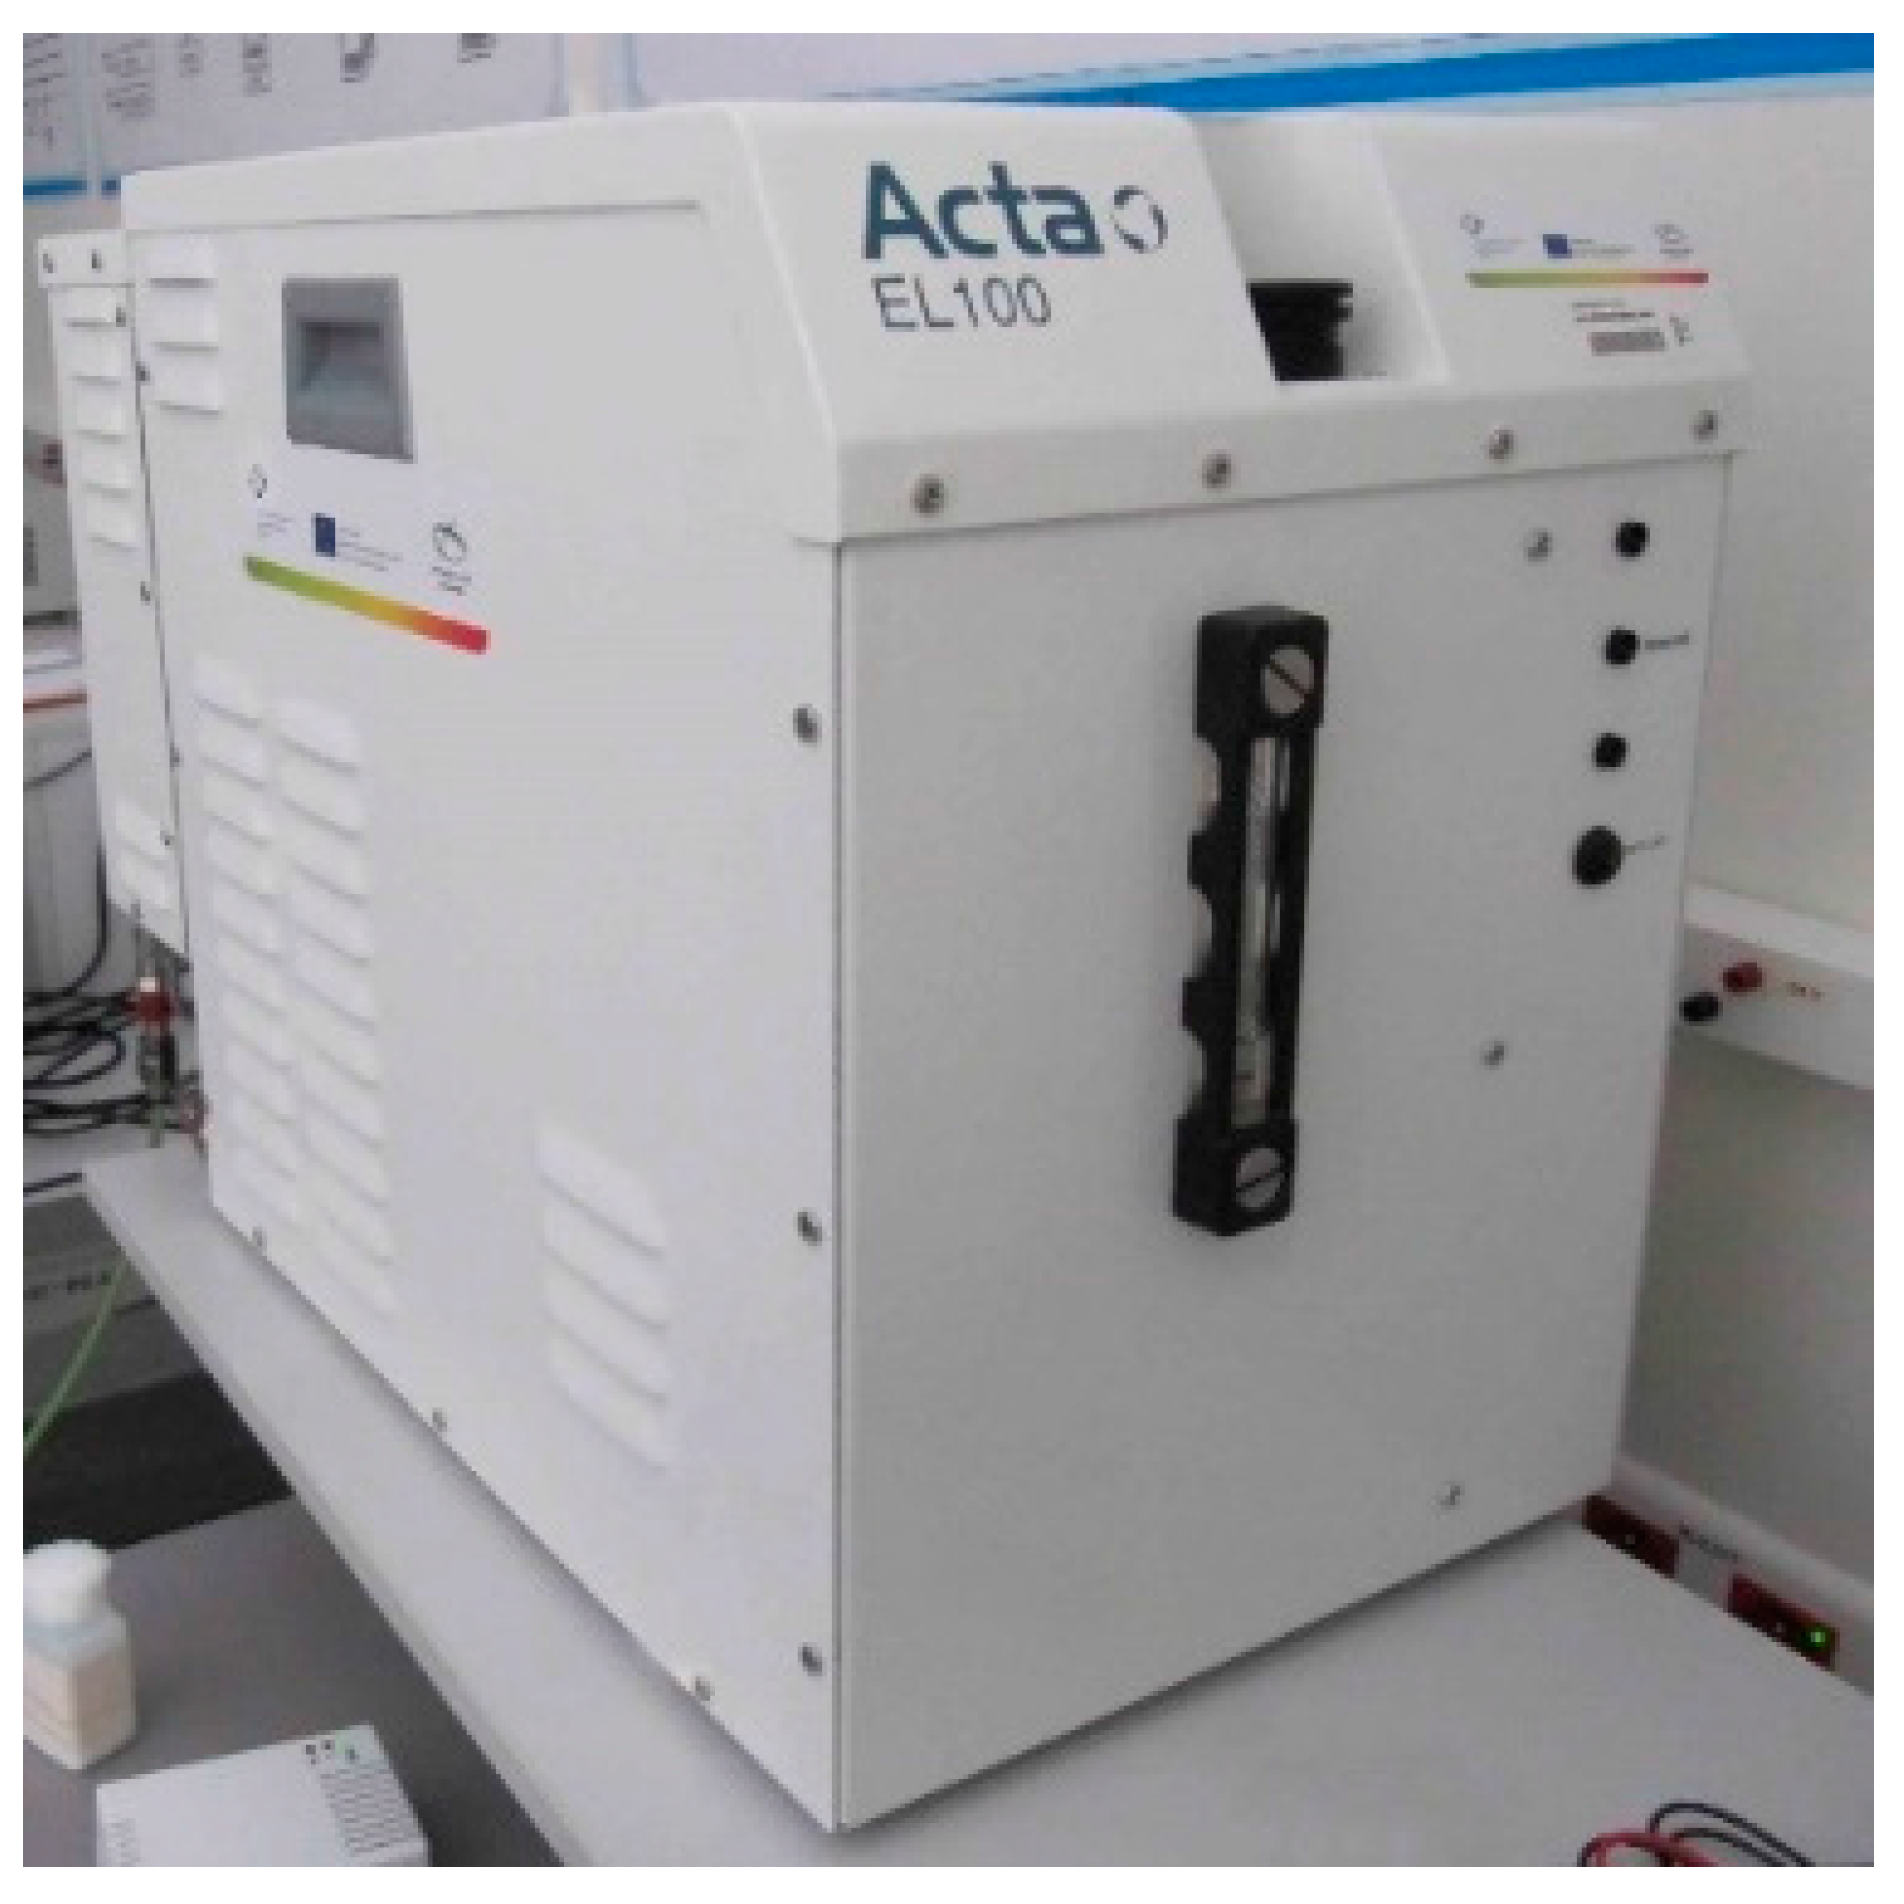
We opted to use an ACTA EL100c electrolyzer (Crespina, Italy) with a dryer hydrogen generator (Figure 5). The technical specifications of the EL100c are as follows: maximum hydrogen flow rate of @ 20 °C/1 bar, 100 NI/h; max. pressure of 30 bar; hydrogen purity of 99.95% @ 30 bar; max. power consumption of 700 W; and max. water consumption of 0.1 L/h [35].
The hydrogen laboratory arrangement is outlined within the block diagram and image shown in Figure 6. The entire circuit can be controlled using LabView made by National Instruments (Austin, TX, USA) and CompactRIO, via a signal communicated by the CWP control program. If an energy surplus is detected, the program will send a signal to activate the relevant controlled switch; the electrolyzer and dryer will then start to operate. The electrolyzer is capable of producing very clean (with 99.95% purity) dry hydrogen at 30 bar. Such a high pressure has to be decreased to the value of 10 bar by means of a manual reduction valve; the reduced pressure is applied to fill the hydrogen storage, namely, the metal hydride canister.
In the opposite state, a condition when the local accumulators are discharged and only an insufficient amount of energy is available in the network, LabView dispatches a signal to open controlled valve 2; through the open valve, hydrogen will be transported from the metal hydride storage to the FC. The hydrogen pressure, however, has to be maintained at 0.45 bar; otherwise, the cell could be destroyed. Further, it is also possible to utilize a flowmeter to determine the quantity of hydrogen flowing from the metal hydride storage. The FC, too, is switched on by a signal because its actual start needs to be performed in the no-load mode; only after approximately 10 s, the controlled DC/DC converter is connected. The converter regulates the amount of current flowing from the FC, thus facilitating optimal operation of the cell.
The resulting efficiency of the hydrogen circuit can therefore be expressed as an amount of approximately 16%.
3.4. Communication and Control Elements to Manage the Devices and Instrumentation of the Smart Energy Model
The physical equivalents of the energy generated through the water and wind power plants are simulated by the RES-controlled power module connected into the SEM via the CB1 module, Figure 1 and Figure 7. The CB1 is a significant module facilitating energy transfer and voltage transformation from 12 VDC to 24 VDC and vice versa. The CB1 and RES are controlled by the CompactRIO system according to the data received from the wireless data logger. Each power control device (the CB1, CB2, and RES) uses its input/output circuits to communicate with the CC physically via wired connections in the laboratory. These low-power control connections are only schematically indicated in Figure 1 for better clarity.
The CompactRIO regulates the flow of energy from different sources and controls the actual electricity consumption; the CC system can thus determine the power from the different simulated power plants.
The real power stations physically connected to the grid are the applied FC and solar panels, and each of them supplies the SEM with approximately 200–300 W peak. The simple physical materialization, the safety of the experiments, and the low cost all enable the SEM to operate with 24 VDC and to store the surplus energy in electric car batteries. Instead of a large, centralized battery storage, the designed SEM employs a number of batteries, one for each power station. Although storing electric energy into hydrogen appears to be a less promising solution, a hydrogen FC (a metal-hydride container as serving as the hydrogen storage) will be integrated into the SEM to form a peak energy source.
The data transfer from the remote energy sources is performed using the Global Systgem for Mobile Communications (GSM) data logger. The related power meters are located near the water and wind power plants, and the measured data of the immediate generated power are transmitted wirelessly (GPRS) to the control centre with the CompactRIO. The laboratory provides for wired connection (RS 232 or RS 485) between the CB1 and CB2 power controllers.
The physical model of all the remote renewable energy sources (RES) is simulated by a QPX1200SP 1200 W DC power supply (Huntingdon, UK). The RES battery is connected to the SEM via one of the CB1 control blocks, a bidirectional power switcher enabling us to pump power to and from the grid. The block comprises a controlled DC/DC converter for voltage adjustment (upward) and utilizes the power from the local 12 V batteries (which can supply from 8 V to 14 V, according to the current charge level). Based on the information from the meter, the CompactRIO regulates the voltage and employs the related CB1 to control the power supplied into the SEM; this power corresponds to that obtained from the remote energy sources.
For any case where the energy produced by the RES connected to the SEM is greater than the total consumption of the SEM, each current regulator (CB1) is equipped with a controlled battery charger. According to the chosen algorithm, the SEM charges the batteries with controlled power until the selected recharge level is reached. Another physical source of the SEM is the FC; this cell is connected to the SEM via its own voltage regulator.
The energy consumption from the grid is regulated by the CompactRIO control system and the CB2 box.
The described smart grid part of the SEM is connected with the smart metering one [15,16]. The actual smart metering and the consumption control represent a typical small energy consumer to participate in the smart energy system, utilizing the demand-response principle. Depending on the cost of the energy, an individual consumer, in cooperation with the control centre, will switch on or off the main electrical appliances in the household; in other words, and more generally, he or she will “control” their consumption.
Importantly, household consumption is also simulated, including 30 appliances turned on according to their use during the day. The relevant tables invariably define the frequency and duration of an appliance’s activity within a definite time period. The switching times are generated randomly to operate as close to reality as possible. From these data, we then obtain the total generated appliance power, which is recalculated and communicated partly to the real appliances in the laboratory and partly to the electrical load. The battery capacity and power output of the sources are used to calculate the individual appliance powers in such a manner that they correspond to the real operating conditions At this point, it is important to note that our model is 30-fold smaller than a real home network.
3.5. Controlled Consumption System
Figure 1 shows the elements that can be involved in a controlled consumption system. First, we need to consider the laboratory instrumentation, or the programmable logical controllers, with 24 VDC power supply; these are connected to the SEM via a controlled circuit breaker. Second, there are a number of PCs connected via a non-controlled DC/AC converter. We also plan to design, materialize, and connect into the model a vehicle charging station (ST) equipped with a controlled ST to provide for not only e-car battery charging, but also the related energy take-off for cases of energy deficiency in the grid.
The system is fitted with a STATRON Electronic Load Type 3229 (LOAD) (Fürstenwalde, Germany) controlled load device, which enables us to consume more than 50 A at 24 V. The Electronic Load is managed by the CC according to the smart control algorithms, and facilitates the physical simulation of total energy consumption typical of small energy consumers.
4. Microgrid Voltage Stability Control
This section chapter characterizes the microgrid control strategy, which is designed to improve the voltage stability. The voltage in the 24 VDC grid is intended to be stable, namely, to exhibit the lowest possible fluctuation rate. An exact voltage value, however, cannot be obtained if several energy sources and multiple appliances are connected; importantly, the proposed strategy will maintain the voltage within the range of (22–26) V.
4.1. Microgrid Voltage Level Stability Control: Control Strategy of the CC
The control framework is centrally implemented in LabView. The algorithm recognizes two control levels, a higher and a lower one (Figure 8). The lower layer is responsible for distributing the energy as needed or according to the higher level strategy. The control commands are transmitted at a very high speed, in the order of milliseconds. The safety of the system and the basic operations are ensured mainly at the lower level. In terms of security, the primary problem lies in monitoring the battery charge to prevent power off take at a low voltage or, conversely, to eliminate any charging if the voltage is too high. These protective elements are contained twice in the model: first, they are installed as hardware in the CB1 and remain effective during the energy transfer between the main network and the other batteries; second, the system comprises software protection, which duplicates its hardware counterpart, and also controls the transfer of energy from the power stations directly into the battery. Specifically, the elements are used in simulating the remote sources, another part of the lower layer. The data from these sources are processed, enabling the influx of a corresponding amount of energy to the grid through two 12 V batteries (denoted as BAT2 in Figure 1).
Yet another item affiliated with this level consists of the energy transfer control, materialized on the basis of the actual voltage values in each battery; here, the central idea is invariably to secure enough energy in the main network, from which the appliances draw the required power.
Figure 1 introduces four different types of storage, A to D. For better orientation in the network management, we will describe their function within the grid. The first part, A, is directly connected to the main smart grid network, with the energy stored in two 12 V batteries connected in series; the main line is thus 24 V. As already mentioned, all appliances are connected to this line. To eliminate any unnecessary energy transfer, the largest source of energy is directly connected to the 24 V storage tool, and therefore directly to the main network. In this case, the grid comprises also the two photovoltaic panels. The remaining parts of the sequence A to D, starting with portion B, are used predominantly for temporary energy storage or to store the energy supplied by the other sources. In block B, the simulated energy from the remote sources is stored in two 12 V batteries connected in parallel and can be transferred to the main line, if necessary.
Simultaneously, however, the batteries are used as temporary storage for the main line, especially when the remote sources do not generate sufficient energy. Part C is only used to store electricity temporarily and finds application mainly in situations when the solar panels and remote sources provide too much power and the consumption or storage size cannot cover the entire incoming volume. The last part, D, is hydrogen storage.
The overall control is set to a three-day cycle. In this cycle, the normal operating condition occurs if the power plants supply enough energy during one day but provide only a reduced amount over the two days that follow. For such operation, it is sufficient to regulate the energy transfer only at the lower level of control. In any case when the sources ensure only a low volume of energy during all the three days, the public power grid must be used to compensate for the shortage. Otherwise, with surplus energy, the higher level is involved in the control process. In this context, one of the aims of the higher layer is to use all the energy from the sources available at a given moment. If there are more days with surplus supply, the storage of energy is disabled by the high voltage of the batteries, and the source powers must be reduced. To avoid this situation, the higher control level uses the weather forecast to predict the volume of generated energy.
4.2. Algorithm Using the Weather Forecast to Predict the Microgrid-Generated Volume of Energy
Conceptually, the algorithm exploits the scenario where the Sun is expected to shine, enabling the 24 V grid battery block to become fully charged, while at the same time, another storage spot of the microgrid (such as the hydrogen canister) contains only a modest amount of energy. A similar scheme applies to hydropower plants and rainy weather.
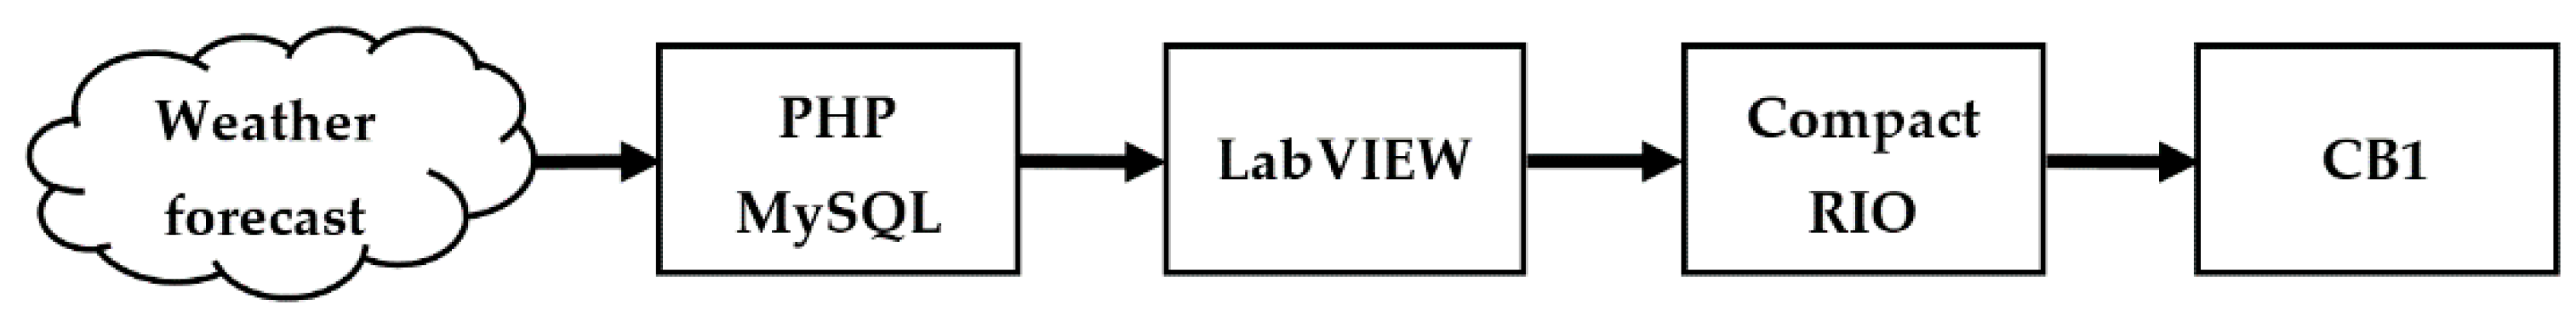
The weather forecast is acquired from a remote web server, https://www.yr.no, providing data related to the temperature, cloud cover, and precipitation, with an interval of one hour. This server was identified as the most effective tool of its kind in satisfying our basic requirements, namely, weather forecasting for the city of Brno, (Moravia, Czech Republic), where the microgrid is located. As indicated in Figure 9, the data from the server are modified using Hypertext Preprocessor (PHP) script, stored in the MySQL database, and then read out to control the microgrid via LabView. The obtained information enables us to direct the energy flows within the individual means of storage, utilizing CompactRIO and CB1.
In our case, 48-h weather forecasts are utilized. If we establish that some source will generate a large amount of energy while the direct storage battery is full, the control will attempt to move the energy from the battery to another means of storage (such as the hydrogen circuit) in order to increase the capacity of the batteries located close to the power plant.
Another method to regulate available storage space depending on the weather forecast consists in the demand-response principle; this enables us to switch on the appliances in which the start-up time is not a critical parameter. However, not many appliances of the given type are present in the home, and thus the principle finds wider applications in more extensive networks.
4.3. Demand-Response Principle Implemented in the Microgrid
For the purposes of modeling the demand-response principle, we defined a table introducing the energy consumption of a typical household, where the expected (requested) consumption values during a regular day are summarized. According to Table 1, the control algorithm of the CC provides the immediate consumption values and the amount of energy to be requested in a longer period. The algorithm also defines the tariff (from the immediate as well as the predictive lack of or access to energy in the grid) and switches the appliances on or off.
The proposed smart metering model includes a distributed smart electrical sockets and a central smart meter. This system enables us to supplement Table 1 with actual and historical consumption data; alternatively, Table 1 can be completely replaced with real–time information from the smart metering subsystem.
5. Results of the Tested Algorithm
The hardware configuration outlined in Figure 1 was, together with the microgrid stability control structure, tested within one of the scenarios possible.
The experiment is based on a plan which actively uses the demand-response algorithm. This algorithm then depends on several factors, including the total energy in the grid, the connected local storage reservoirs, and the weather forecast. The designed procedure, referred to as “consume all you produce”, triggers when we know from the forecast that, during the days to come, enough energy will be provided by the power stations and that the grid will not be able to absorb the entire volumes supplied.
Exploiting the given scenario, we measured and displayed the patterns of the voltage and energy flow in the microgrid during a period of 75 min. Figure 10 below represents the power arrangement in the grid. The green pattern characterizes the power supplied to the microgrid; in the described case, the monitoring was performed on a sunny day, enabling the system to draw power especially from the photovoltaic panels. The red pattern then illustrates the consumption of the appliances being operated at the moment (including, for example, regular home appliances). As the electrical energy consumption rate is significantly smaller than the rate of energy supplied to the grid, and considering that all the storage reservoirs were full, we triggered the demand-response algorithm, which embodies a part of the control strategy (Figure 8) executed through LabVIEW. The applied procedure then allowed us to activate the load (including but not limited to water heaters, freezers, air conditioning, thermoregulators, and powerbank or other chargers); this step led to an increased energy off-take in the grid. The corresponding pattern is plotted in violet (Figure 10).
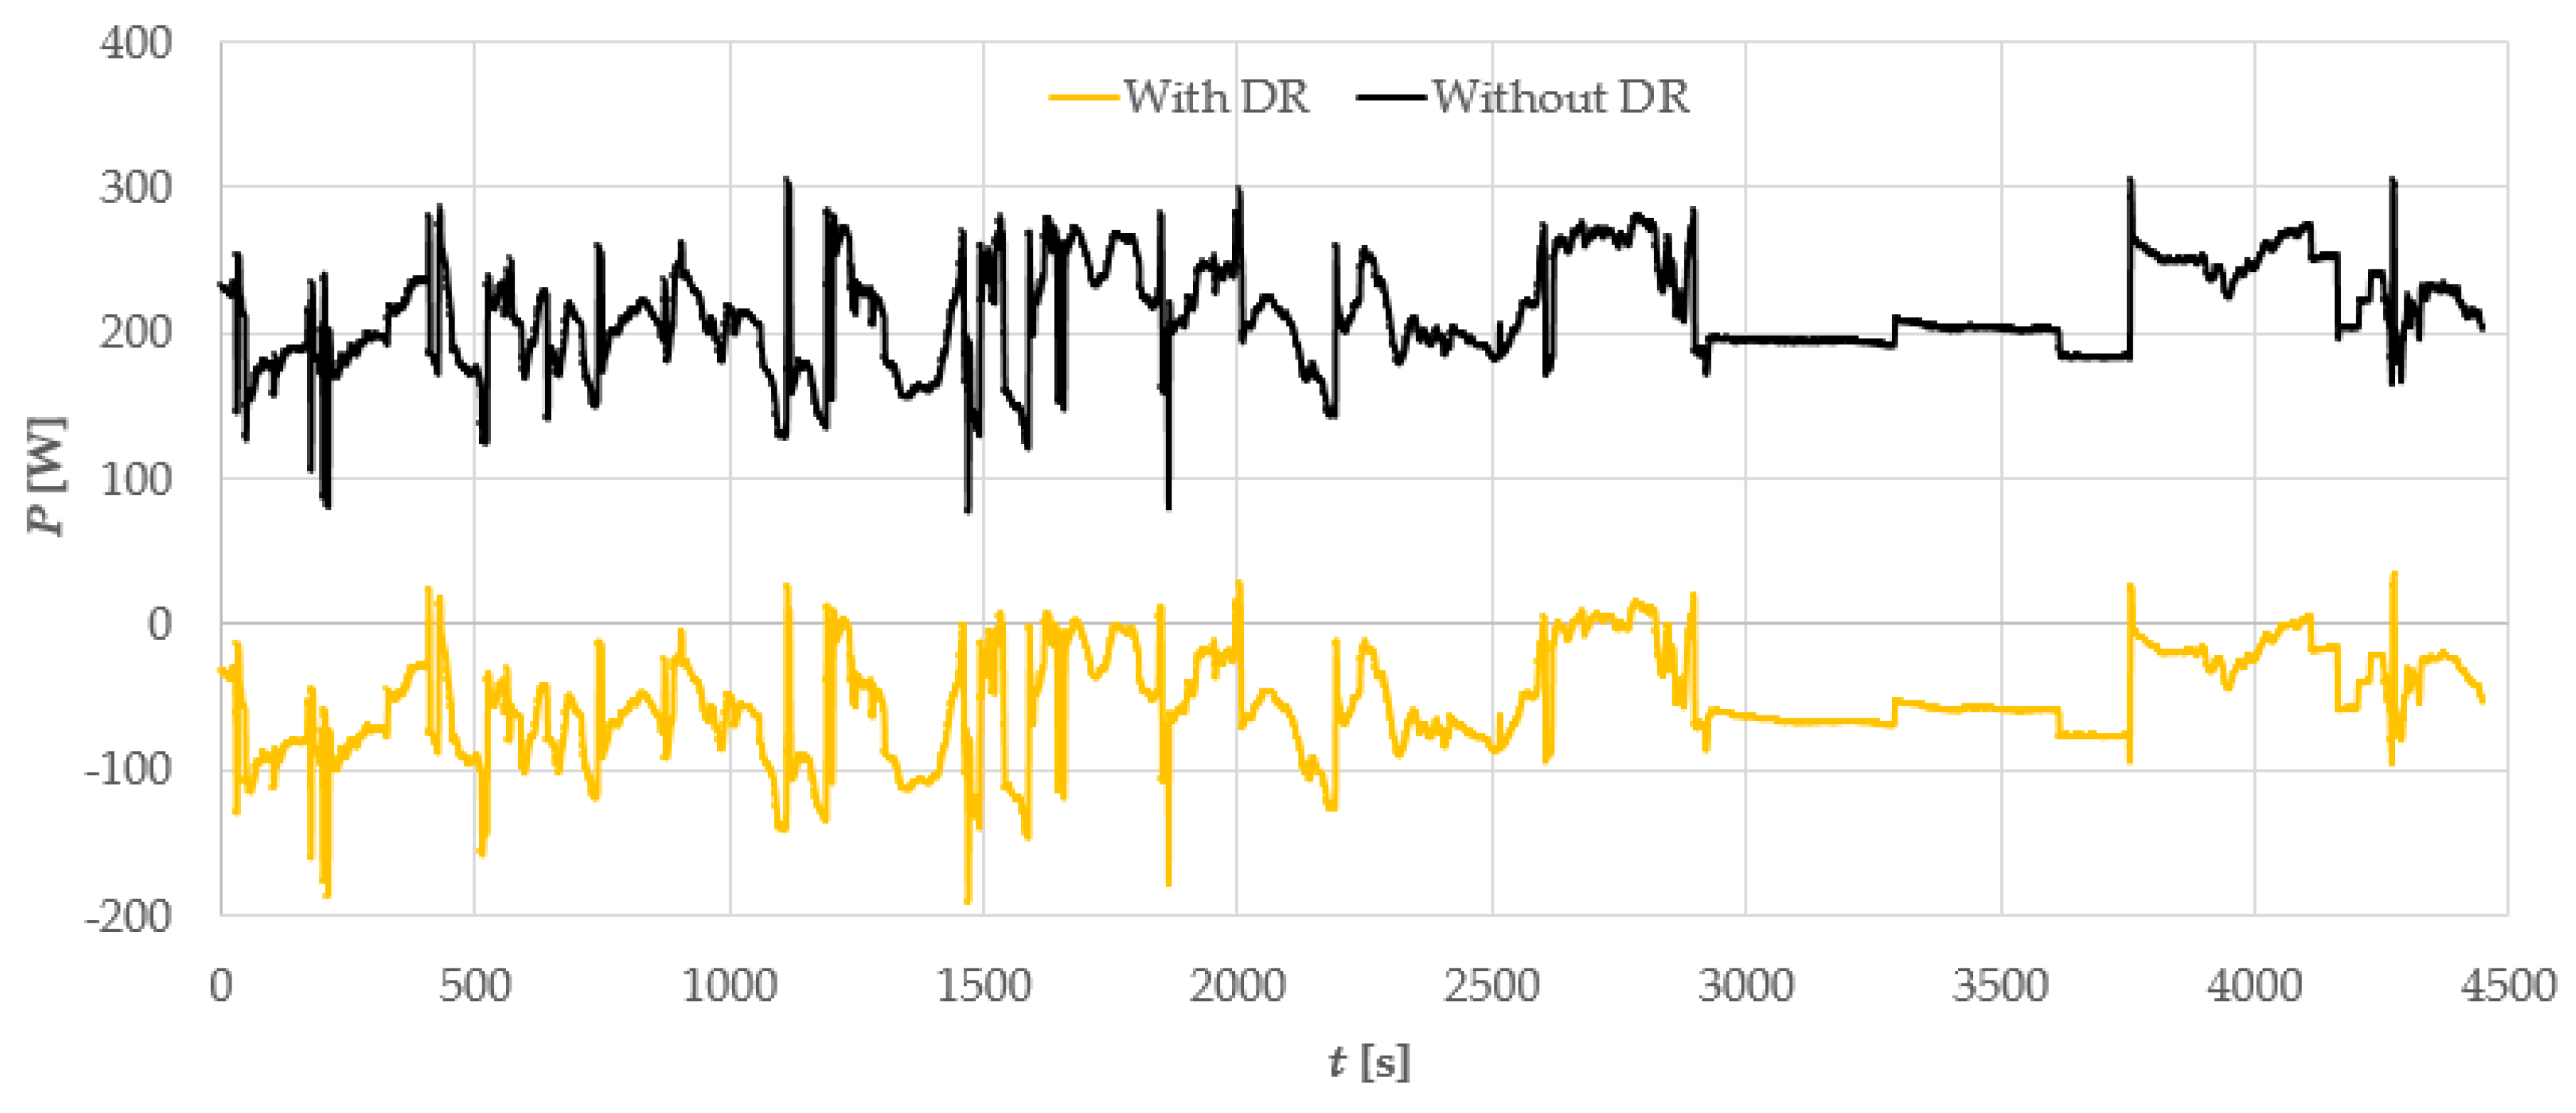
Figure 10 and Figure 11 show that, at almost all the given instants of time, more energy than produced was taken off the grid. As regards the voltage stability (Figure 12), however, the energy in the microgrid can be neglected because the appliances are supplied from selected storage spots in the grid and the implemented weather forecast informed the control algorithm that at least the following three days would be sunny, making it possible for the photovoltaic panels to supply the maximum energy. This energy would subsequently be stored back into the relevant storage reservoirs.
Without the demand-response algorithm, the surplus energy, represented in black (Figure 11), could not be utilized. Integrating the pattern showed that the energy lost during the 75 min cycle amounted to approximately 7.9 kJ; conversely, the proposed algorithm facilitates reaching the pursued goal of “consume all you produce”.
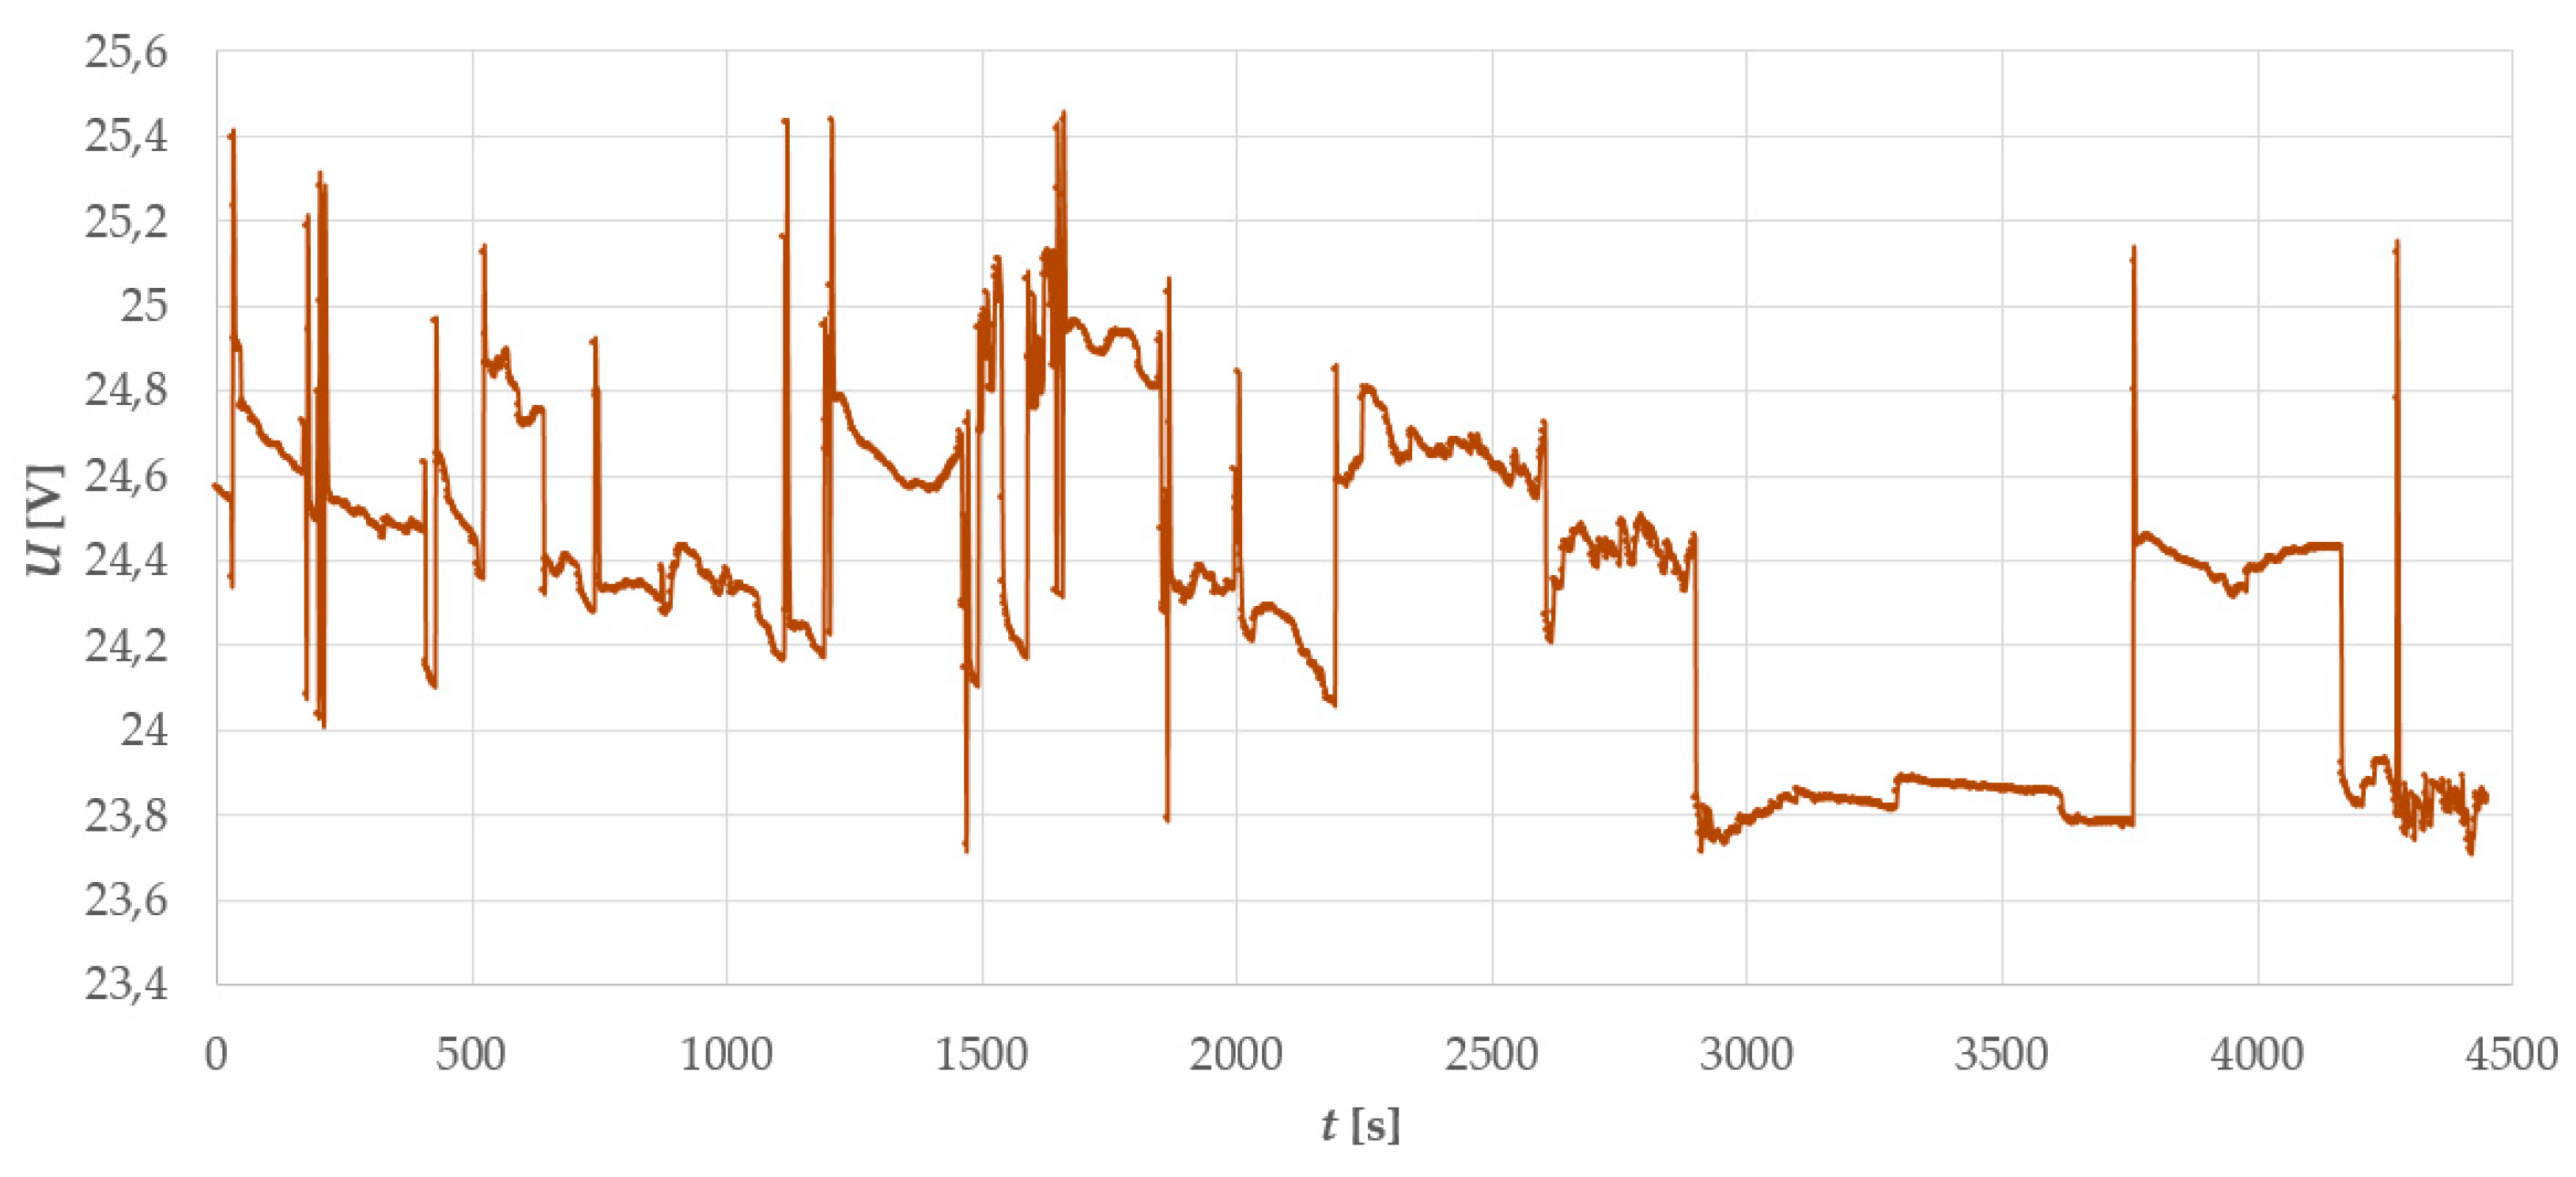
The diagram in Figure 12 indicates that the voltage in the direct current grid stabilized between approximately 23.7 V and 25.4 V. the relative deviation from the 24 V was about 6%, a value acceptable for the connected devices.
6. Conclusions
The article discusses the physical materialization of a smart energy model (SEM, Figure 1). The SEM is a smart grid model exhibiting a significant proportion of renewable energy sources, which are further combined with intelligent control utilizing information from a smart metering subsystem. The main advantages of the proposed grid consist in its simplicity, portability, and the broader possibility of testing the control algorithm, which exploits the demand-response strategy. Conversely, the actual use of a 24 VDC grid may be interpreted as a drawback; however, a DC/AC converter can obviously be connected, and alternating loads are applicable too. The results of the tested algorithms also generally hold for networks with a higher grid voltage. To facilitate the energy transfer from the 12 VDC batteries to the grid and vice versa, we designed and characterized a special CB1 module. This block can operate as a step-up or step-down converter, and is controlled via CompactRIO and LabView.
A micro-grid control strategy utilizing the demand-response mode was proposed and outlined within the paper; the central aspect of this approach consists in that the entire volume of energy produced through renewable sources must be effectively utilized. Thus, the analyzed method promoted the maximum use of renewable sources to decrease the current rate of CO2. Another major benefit brought by the algorithm can be identified in employing the current weather forecast to predict the amount of energy in the network; this property then enables us to transfer the applicable energy between the local BATs and the main backup BAT of the grid. The designed algorithm, described in Section 4, is mainly useful in a stand-alone microgrid; its performance and results are presented in Figure 10 and Figure 11.
The end user will benefit mainly from the more effective consumption of energy produced by renewable sources. Further, the algorithm will switch, within a pre-selected interval (this may reduce the user’s comfort, but the interval can be chosen by the user himself), appliances included in the demand-response strategy; such a feature is very convenient for multiple consumers who regularly operate various types of chargers or power banks, namely, appliances connectable to a microgrid in the demand-response mode. The actual usage of smart metering then enables us to monitor and assess the consumption of individual devices.
The proposed hardware and software concepts were verified on one of the possible scenarios, specified in Section 5. It follows from Figure 11 that using the microgrid control approach characterized in Section 4 embodied the factor to verify the pre-set goal of “consume all you produce”. The relative voltage error during the tests did not exceed 6%, as shown in Figure 12.
Acknowledgments
The authors gratefully acknowledge financial support from the Ministry of Education, Youth and Sports under projects No. LO1210—“Energy for Sustainable Development (EN-PUR)” solved in the Centre for Research and Utilization of Renewable Energy).
Author Contributions
Frantisek Zezulka and Petr Marcon performed the main research tasks and, with Premysl Dohnal, wrote the full manuscript to propose the original idea. Zoltan Szabo and Zdenek Roubal fabricated, modified and supplied the hardware for the grid, whereas Ivo Vesely, Ondrej Sajdl and Zoltan Szabo designed and materialized the micro-grid control strategy.
Conflicts of Interest
The authors declare no conflict of interest.
Abbreviations
The following abbreviations are used in the manuscript:
| DC | Direct Current |
| AC | Alternate Current |
| DR | Demand-Response |
| BESS | Battery Energy Storage System |
| V2G | Vehicle-to-Grid |
| SEM | Smart Energy Model |
| HW | Hardware |
| CVVOZE | Centre for Research and Utilization of Renewable Energy |
| CB1 or CB2 | Control Block 1 or Control Block 2 |
| BAT | Battery |
| RES | Physical model of the Remote Energy Source |
| EL | Electrolyzer |
| S | Valve to switch and control the hydrogen flow |
| FC | Fuel cell |
| ST | Vehicle Charging Station |
| G1 | Wind Turbine Generator |
| G2 | Water Turbine Generator |
| CC | Control Centre |
| PV | Photovoltaic |
| GPRS | General Packet Radio Service |
| GSM | Global System for mobile Communications |
References
- Lasseter, R.H.; Paigi, P. Micro-grids: A conceptual solution. In Proceedings of the Power Electronics Specialists Conference, Aachen, Germany, 20–25 June 2004; pp. 4285–4290. [Google Scholar]
- Olivares, D.E.; Cañizares, C.A.; Kazerani, M.; Mehrizi-Sani, A.; Etemadi, A.H.; Iravani, R.; Hajimiragha, A.H.; Gomis-Bellmunt, O.; Saeedifard, M.; Palma-Behnke, T.; et al. Trends in Micro-grid. Control. Proc. IEEE Trans. Smart Grid 2014, 5, 1905–1919. [Google Scholar] [CrossRef]
- Logenthiran, T.; Srinivasan, D.; Khambadkone, A.M.; Aung, H.N. Multiagent System for Real-Time Operation of a Micro-grid in Real-Time Digital Simulator. Proc. IEEE Trans. Smart Grid 2012, 2, 925–933. [Google Scholar] [CrossRef]
- Huang, J.; Jiang, C.; Xu, R. A review on distributed energy resources and Micro-grid. Renew. Sustain. Energy Rev. 2008, 12, 2472–2483. [Google Scholar]
- Wang, Y.N.; Zhu, X.R. Research on the control strategy of Bus Voltage of DC-Micro-grids utilizing bidirectional AC/DC converters. Procedia Eng. 2011, 15, 848–853. [Google Scholar]
- Long, B.; Jeong, T.W.; Lee, J.D.; Jung, Y.C.; Chong, K.T. Energy Management of a Hybrid AC–DC Micro-Grid Based on a Battery Testing System. Energies 2015, 8, 1181–1194. [Google Scholar] [CrossRef]
- Miceli, R. Energy Management and Smart Grids. Energies 2013, 6, 2262–2290. [Google Scholar] [CrossRef] [Green Version]
- Tanaka, K.; Yoza, A.; Ogimi, K.; Yona, A.; Senjyu, T.; Funabashi, T.; Kim, C.H. Optimal operation of DC smart house system by controllable loads based on smart grid topology. Renew. Energy 2012, 39, 132–139. [Google Scholar] [CrossRef]
- Taylor, P. Increased renewable energy Penetration on island power systems through distributed Fuzzy load control. In Proceedings of the International Conference Renewable Energies Islands Towards 100% RES Supply, Crete, Greece, 15–19 January 2001. [Google Scholar]
- Oh, S.J.; Yoo, C.H.; Chung, I.Y.; Won, D.J. Hardware-in-the-Loop Simulation of Distributed Intelligent Energy Management System for Micro-grids. Energies 2013, 6, 3263–3283. [Google Scholar] [CrossRef]
- Yang, W.M.; Wang, X.G.; Li, X.Y.; Liu, Z.Y. An Active Power Sharing Method among Distributed Energy Sources in an Islanded Series Micro-Grid. Energies 2014, 7, 7878–7892. [Google Scholar] [CrossRef]
- Sanchez, S.; Molinas, M.; Degano, M.; Zanchetta, P. Stability evaluation of a DC micro-grid and future interconnection to an AC system. Renew. Energy 2014, 62, 649–656. [Google Scholar] [CrossRef]
- Conti, S.; Nicolosi, R.; Rizzo, S.A. Optimal dispatching of distributed generators in an MV autonomous micro-grid to minimize operating costs and emissions. In Proceedings of the IEEE International Symposium in Industrial Electronics (ISIE), Bari, Italy, 4–7 July 2010; pp. 2542–2547. [Google Scholar]
- Colson, C.; Nehrir, M.; Poumousavi, S. Towards real-time micro-grid power management using computational intelligence methods. In Proceedings of the IEEE Power and Energy General Meeting, Providence, RI, USA, 25–29 July 2010; pp. 1–8. [Google Scholar]
- Lin, W.M.; Tu, C.S.; Tsai, M.T. Energy Management Strategy for Micro-grids by Using Enhanced Bee Colony Optimization. Energies 2016, 9. [Google Scholar] [CrossRef]
- Karaboga, D.; Akay, B. A comparative study of artificial bee colony algorithm. J. Appl. Math. Comput. 2009, 214, 108–132. [Google Scholar] [CrossRef]
- Jovanovic, R.; Bousselham, A.; Bayram, I.S. Residential Demand Response Scheduling with Consideration of Consumer Preferences. Appl. Sci. 2016, 6. [Google Scholar] [CrossRef]
- Yao, J.G.; Yang, S.C.; Wang, K.; Yang, Z.; Song, X. Concept and Research Framework of Smart Grid “Source-Grid-Load” Interactive Operation and Control. Autom. Electr. Power Syst. 2012, 36, 1–6. [Google Scholar] [CrossRef]
- Wang, Q.; Guan, Y.; Wang, J. A chance-constrained two-stage stochastic program for unit commitment with uncertain wind power output. IEEE Trans. Power Syst. 2012, 27, 206–215. [Google Scholar] [CrossRef]
- Vahedipour-Dahraie, M.; Najafi, H.R.; Anvari-Moghaddam, A.; Guerrero, J.M. Study of the Effect of Time-Based Rate Demand Response Programs on Stochastic Day-Ahead Energy and Reserve Scheduling in Islanded Residential Microgrids. Appl. Sci. 2017, 7, 378. [Google Scholar] [CrossRef]
- Cha, H.-J.; Won, D.-J.; Kim, S.-H.; Chung, I.-Y.; Han, B.-M. Multi-Agent System-Based Micro-grid Operation Strategy for Demand Response. Energies 2015, 8, 14272–14286. [Google Scholar] [CrossRef]
- Galus, M.D.; Zima, M.; Andersson, G. On integration of plug-in hybrid electric vehicles into existing power system structures. Energy Policy 2010, 38, 6736–6745. [Google Scholar] [CrossRef]
- Camus, C.; Farias, T.; Esteves, J. Potential impacts assessment of plug-in electric vehicles on the Portuguese energy market. Energy Policy 2011, 39, 5883–5897. [Google Scholar] [CrossRef]
- Perujo, A.; Ciuffo, B. The introduction of electric vehicles in the private fleet: Potential impact on the electricity supply and on the environment. A case study for the Province Milan, Italy. Energy Policy 2010, 38, 4549–4561. [Google Scholar] [CrossRef]
- Hartmann, N.; Özdemir, E. Impact of different utilization scenarios of electric vehicles on the german grid in 2030. J. Power Sources 2011, 196, 2311–2318. [Google Scholar] [CrossRef]
- Mwasilu, F.; Justo, J.J.; Kim, E.; Do, T.D.; Jung, J. Electric vehicles and smart grid interaction: A review on vehicle to grid and renewable energy sources integration. Renew. Sustain. Energy Rev. 2014, 34, 501–516. [Google Scholar] [CrossRef]
- Morais, H.; Sousa, T.; Vale, Z.; Faria, P. Evaluation of the electric vehicle impact in the power demand curve in a smart grid environment. Energy Convers. Manag. 2014, 82, 268–282. [Google Scholar] [CrossRef]
- Drude, L.; Pereira, L.C., Jr.; Rüther, R. Photovoltaics (PV) and electric vehicle-to-grid (V2G) strategies for peak demand reduction in urban regions in Brazil in a smart grid environment. Renew. Energy 2014, 68, 443–451. [Google Scholar] [CrossRef]
- Yoo, C.-H.; Chung, I.-Y.; Lee, H.-J.; Hong, S.-S. Intelligent Control of Battery Energy Storage for Multi-Agent Based Micro-grid Energy Management. Energies 2013, 6, 4956–4979. [Google Scholar] [CrossRef]
- Golembiovsky, M.; Dedek, J.; Slanina, Z. Low cost balancing unit design. AIP Conf. Proc. 2017, 1836. [Google Scholar] [CrossRef]
- Pascual, J.; Sanchis, P.; Marroyo, L. Implementation and Control of a Residential Electrothermal Micro-grid Based on Renewable Energies, a Hybrid Storage System and Demand Side Management. Energies 2014, 7, 210–237. [Google Scholar] [CrossRef]
- Kueter, U.; Hoeller, S.; Voigt, C. Fuel Cell Technology for Classroom Instruction; H-TEC EDUCATION: Hydrogeit, Germeny, 2010; p. 144. [Google Scholar]
- Marcon, P.; Roubal, Z.; Zezulka, Z.; Szabo, Z.; Sajdl, O.; Stibor, K. Energy Sources for an Experimental Electrical Network: PV Panel and Micro-Hydroelectric Power Plants. IFAC Proc. 2013, 46, 449–454. [Google Scholar] [CrossRef]
- Heliocentris. Ovonic™ Solid Hydrogen Storage Canisters 60/250/760 standard liters. In Operation Guide, 3rd ed.; Heliocentris Energiesysleme GmbH: Berlin, Germany, 2011; p. 15. [Google Scholar]
- ACTA Powered by Nature. EL100c-EL250c User Manual—Rev. 1.1. Italy, 2013. Available online: http://www.actaspa.com (accessed on 12 June 2017).
Figure 1.
A block diagram of the smart energy model (SEM) (CB1—control block 1; CB2—control block 2; BAT (BAT1, BAT2)—battery; RES—physical model of a remote energy source; EL—electrolyzer; S—valve to switch and control the hydrogen flow to the fuel cell (FC); ST—vehicle charging station; G1—wind turbine generator, 12 VDC and 160 W; G2—water turbine generator with 230 V, 50 Hz, and 500 W; CC—control centre, CWP—central workplace.

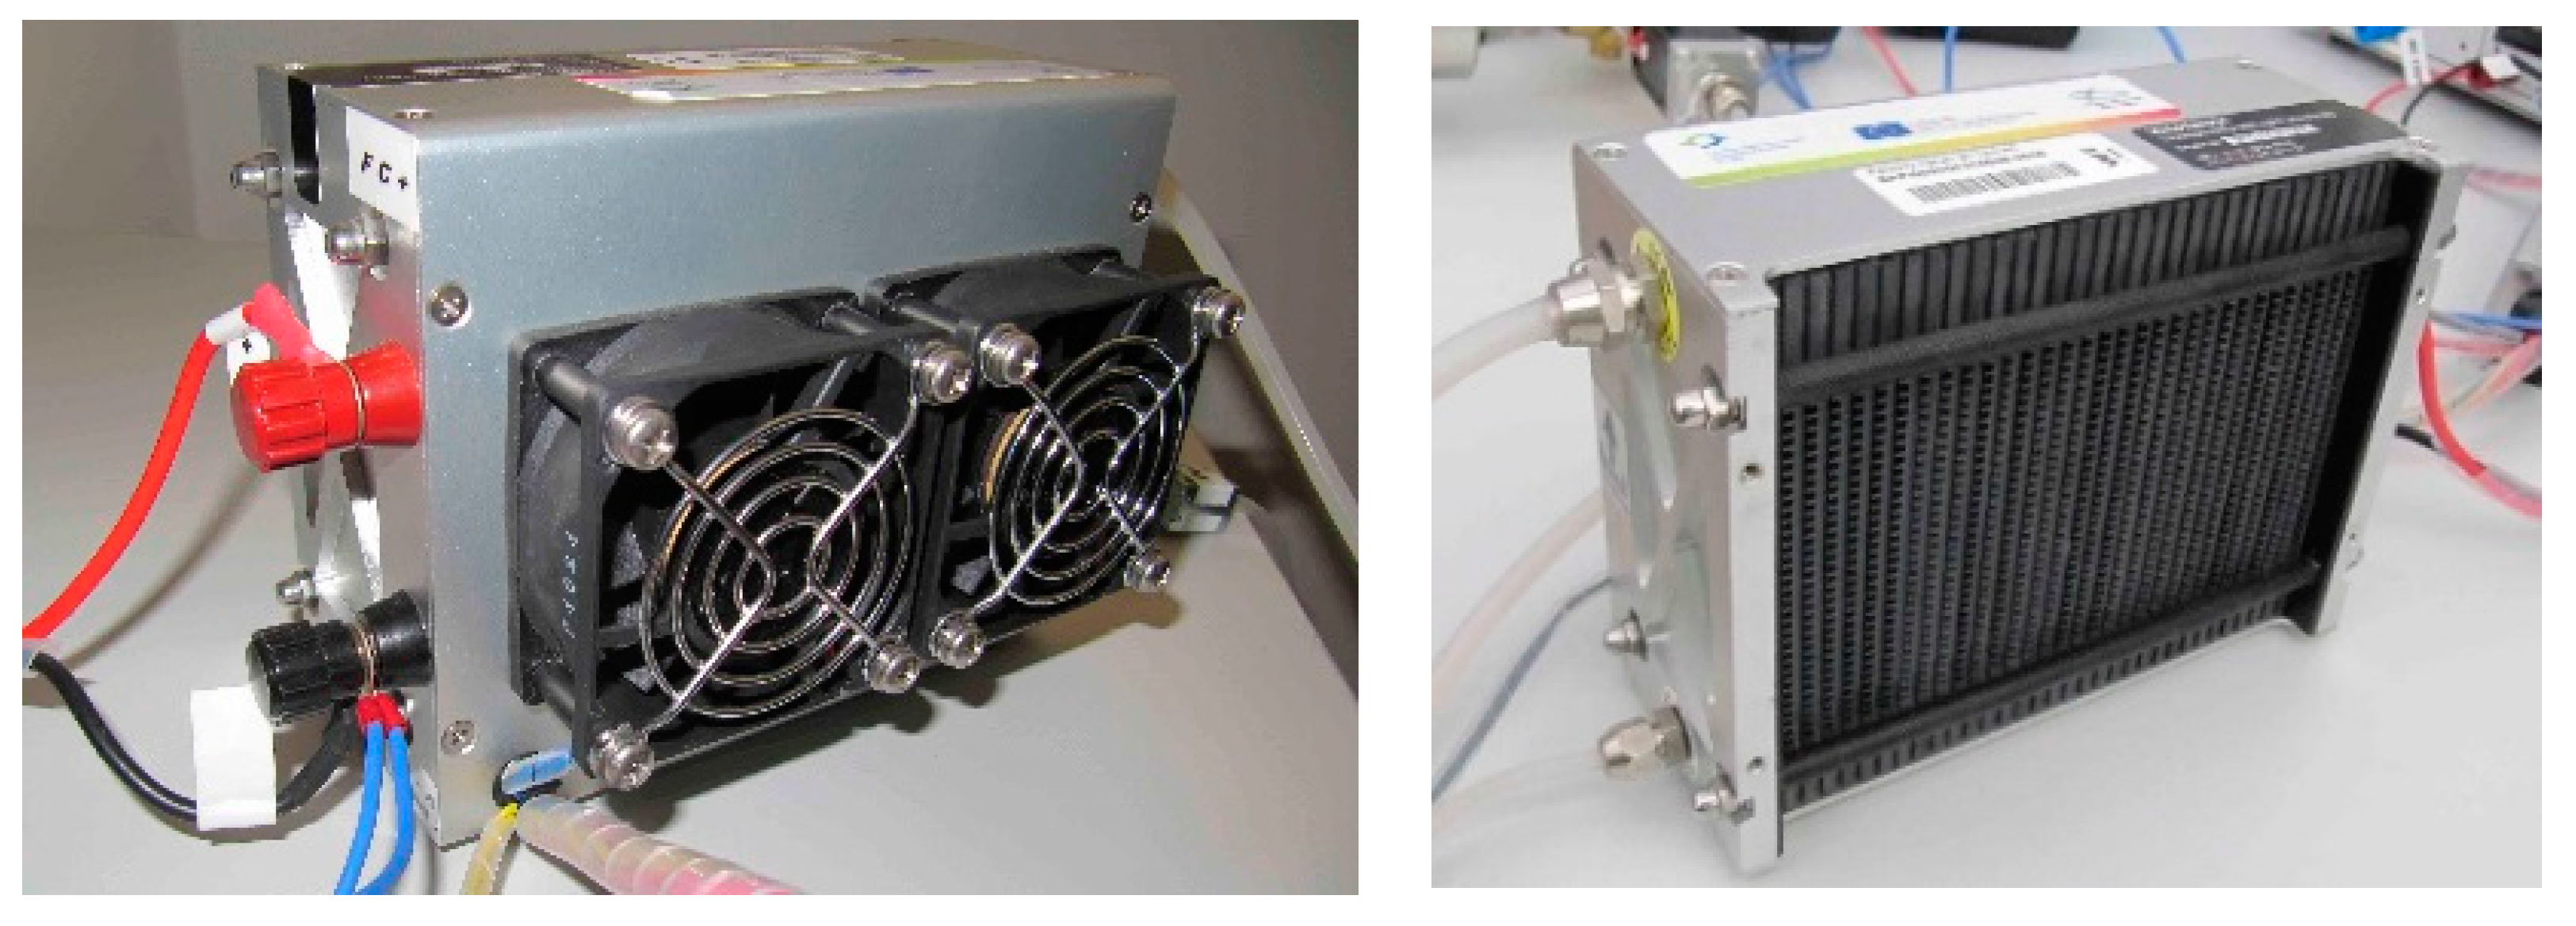
Figure 2.
The H-200 FC Stack by Horizon FC Technologies (left- and right-hand side).

Figure 3.
The small hydropower plant with a maximum power of 500 W.

Figure 4.
The Ovonic™ solid hydrogen storage canister, 760 sl (standard liters).
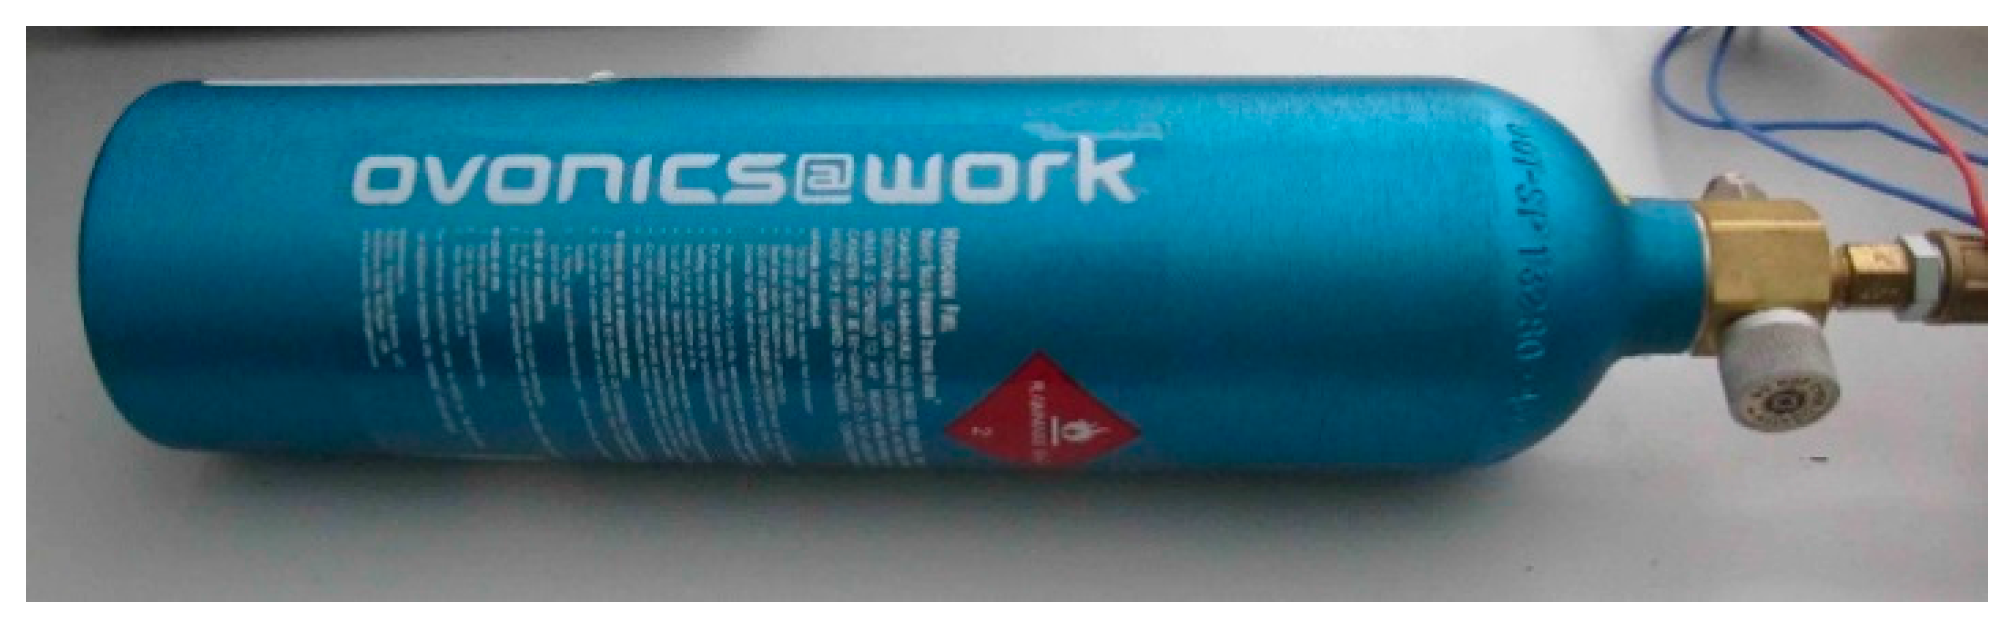
Figure 5.
The ACTA EL100c hydrogen generator including a dryer.

Figure 6.
A block diagram of the hydrogen circuit.
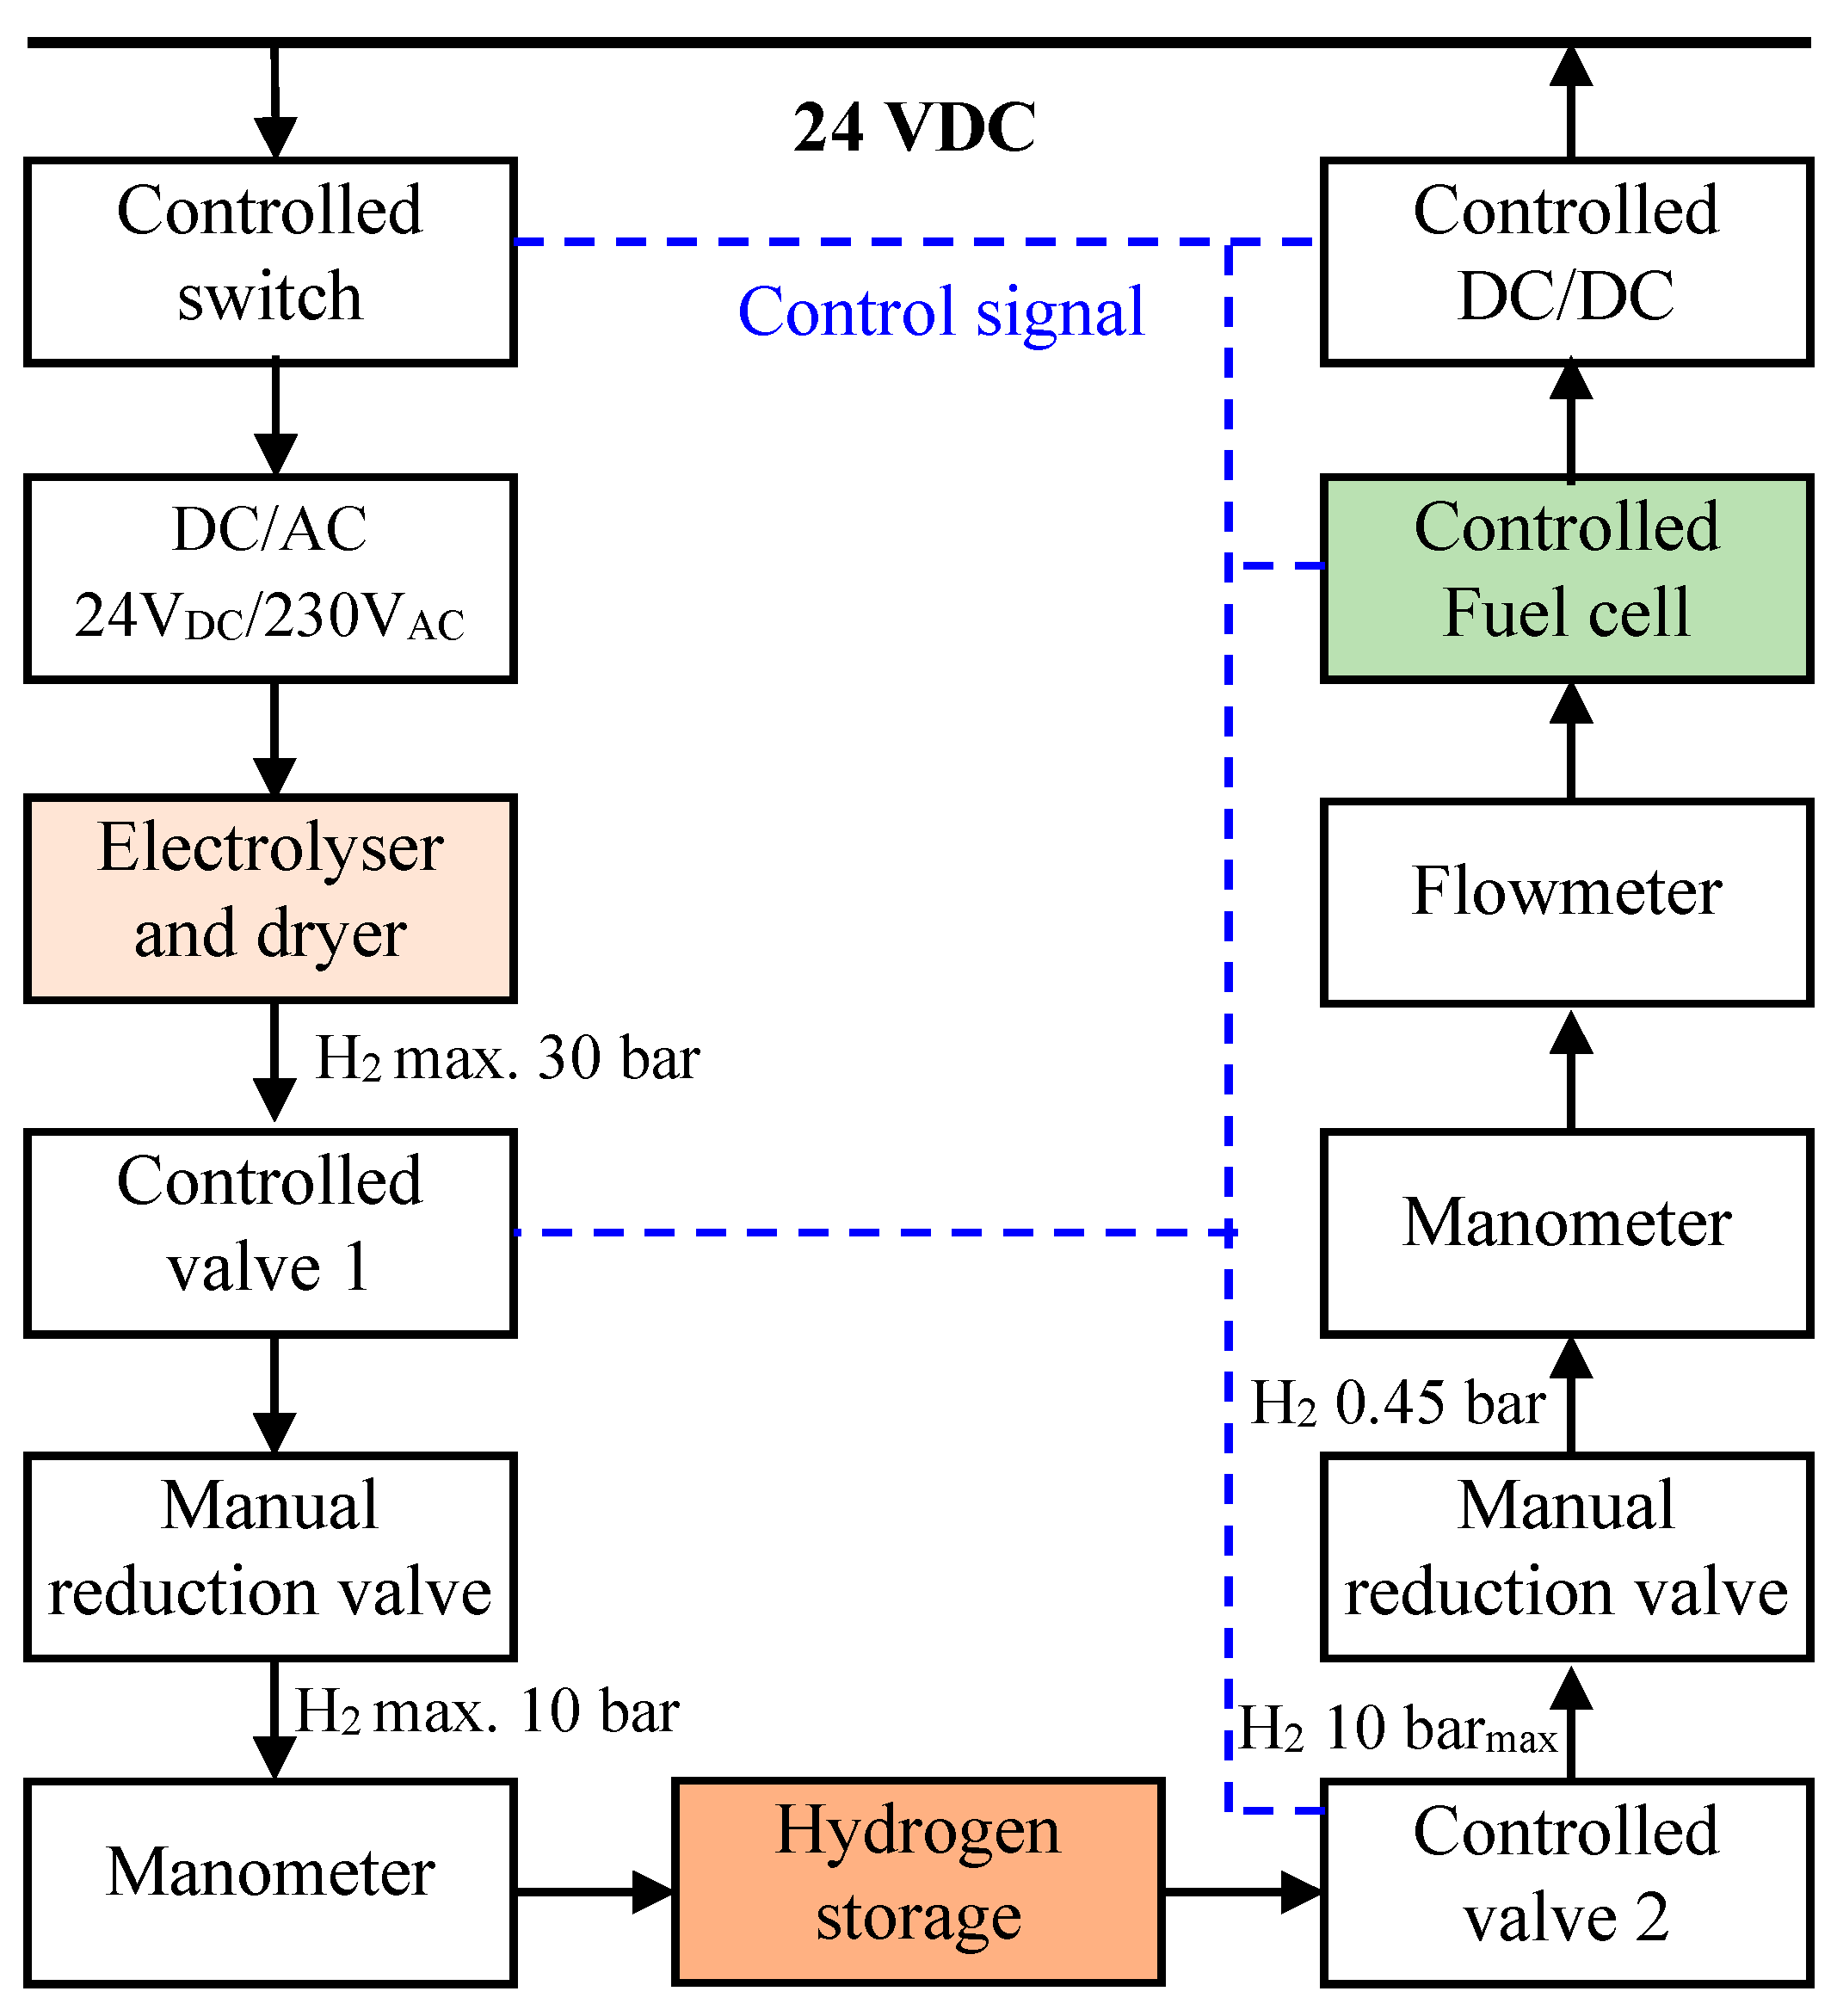
Figure 7.
A diagram of the CB1 power controller.

Figure 8.
The structure of the SEM control and the control levels.
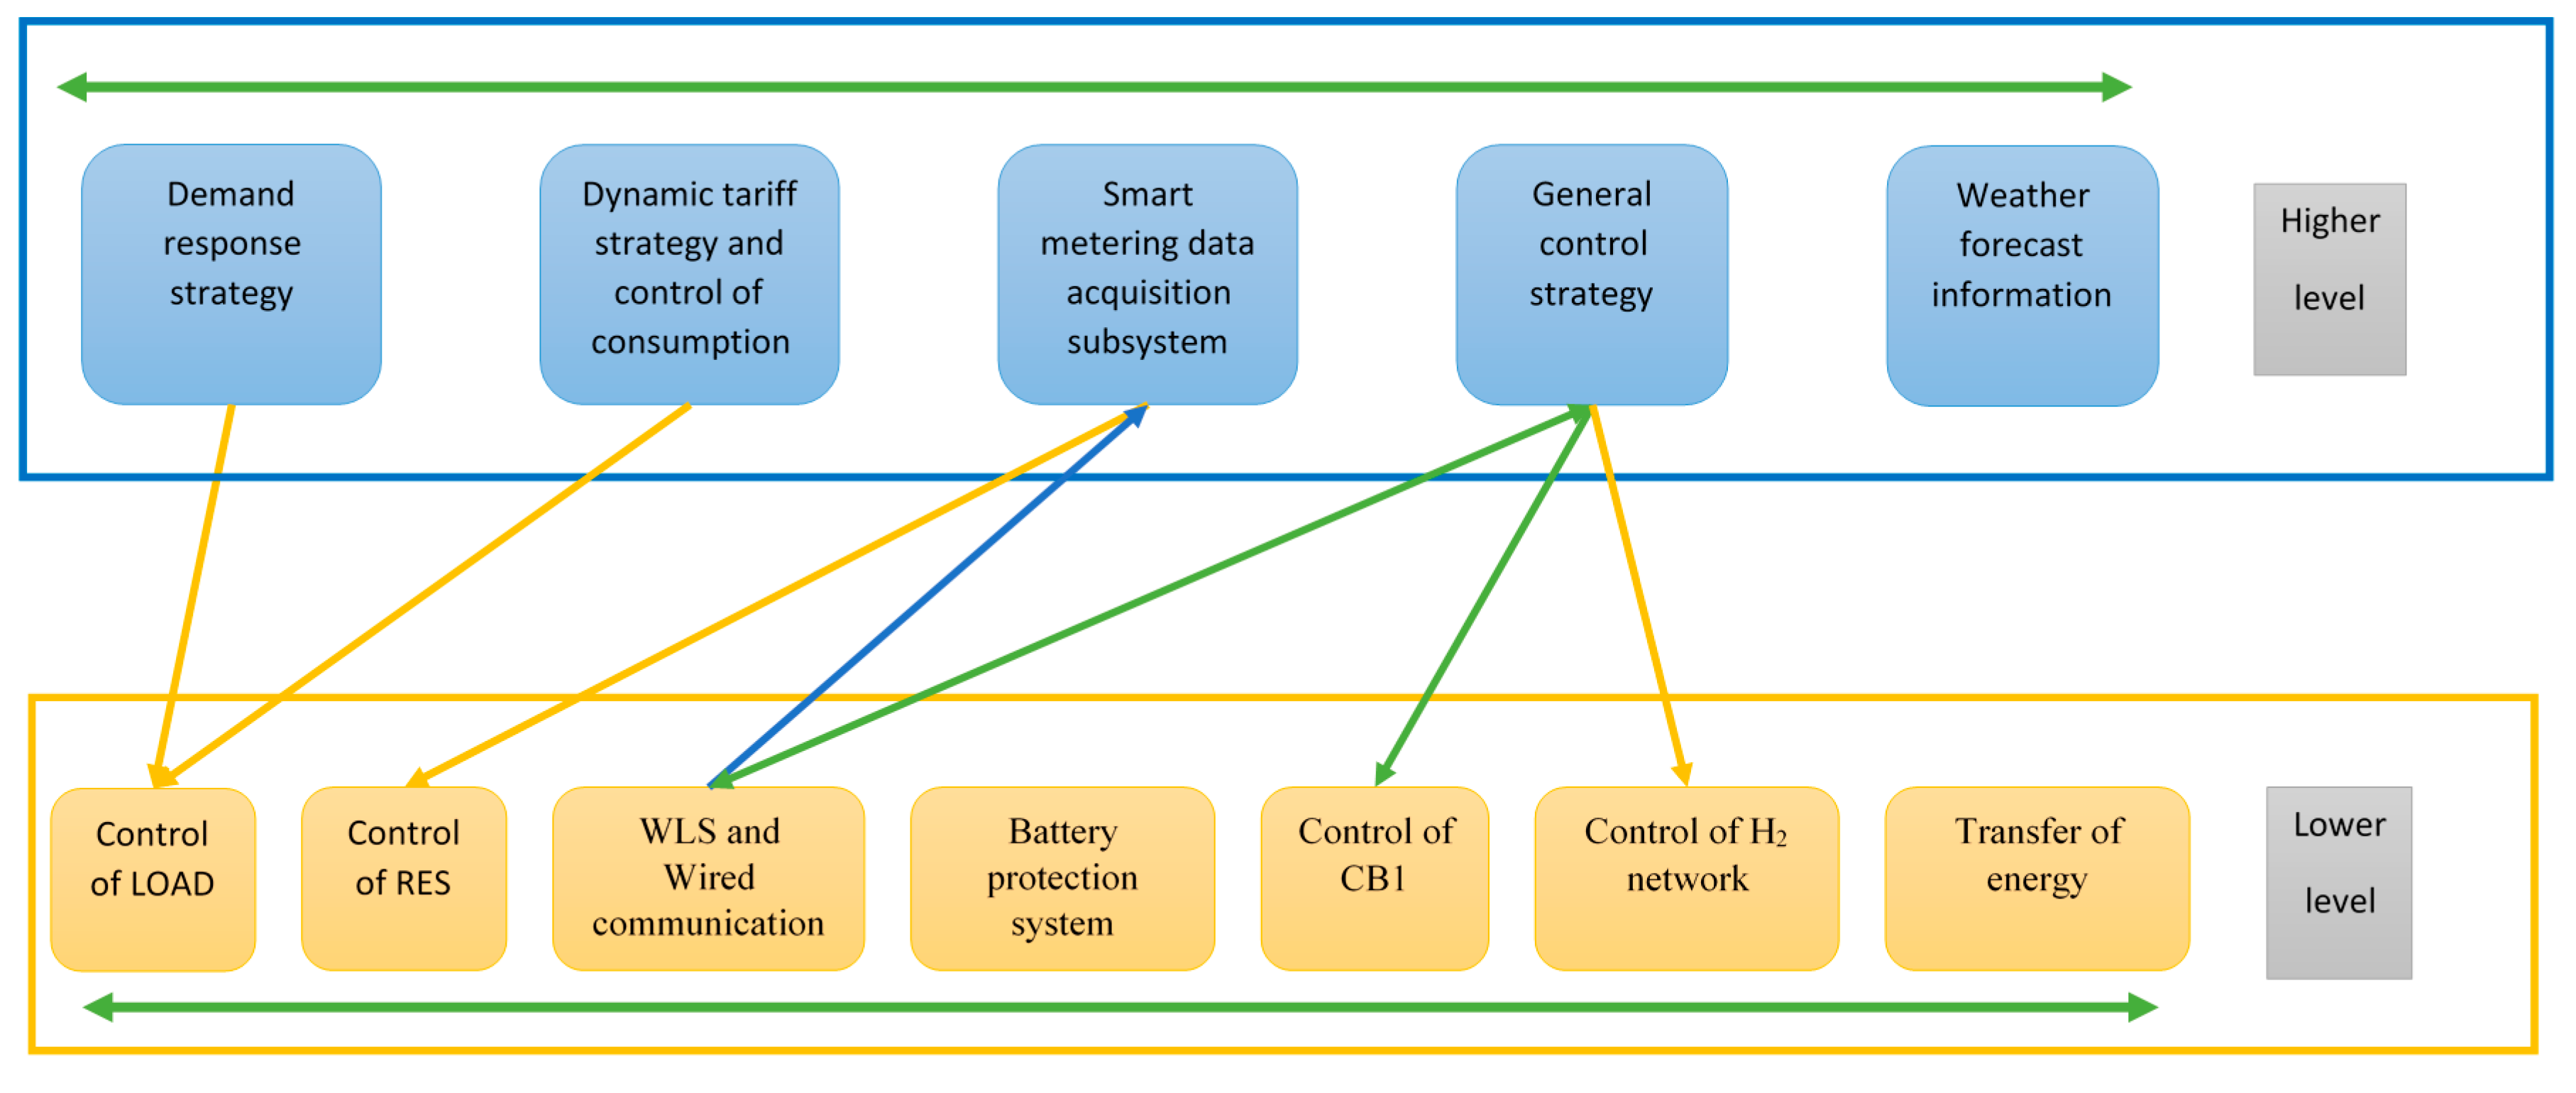
Figure 9.
Controlling the energy flow in the microgrid, using the data extracted from the applied weather forecast source.
Figure 9.
Controlling the energy flow in the microgrid, using the data extracted from the applied weather forecast source.

Figure 10.
The microgrid: The patterns describing the power supplied and taken off (red—the power consumption with demand response disabled; violet—the power consumption with demand response activated; green—power supplied by all sources).
Figure 10.
The microgrid: The patterns describing the power supplied and taken off (red—the power consumption with demand response disabled; violet—the power consumption with demand response activated; green—power supplied by all sources).
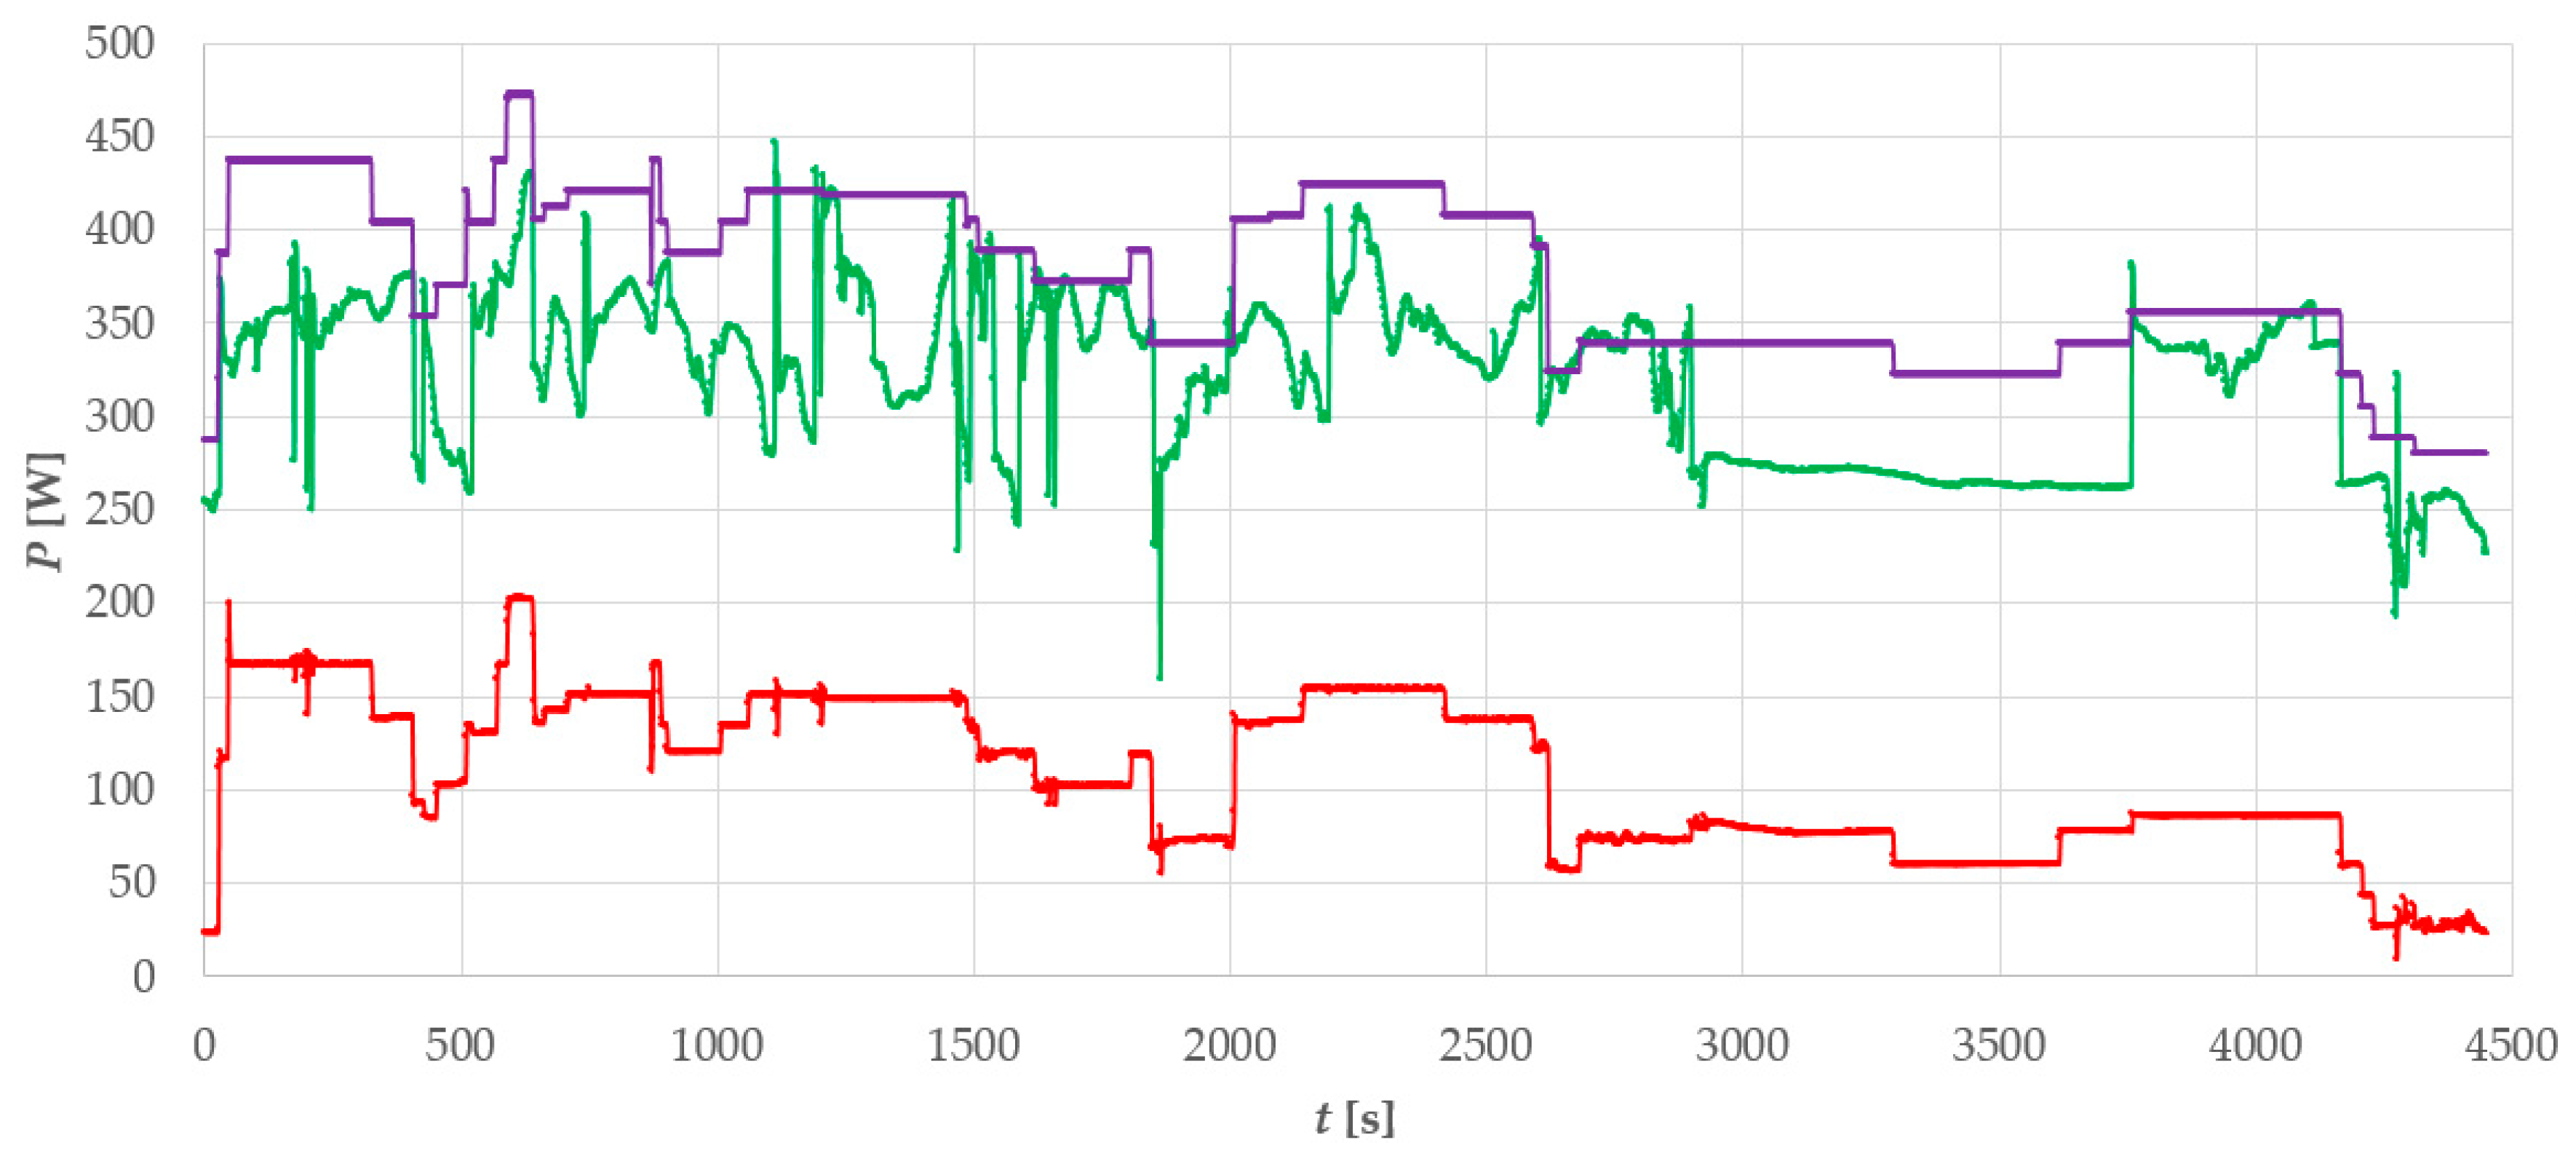
Figure 11.
The difference between the energy rates supplied to and consumed in the microgrid, with and without demand response activated.
Figure 11.
The difference between the energy rates supplied to and consumed in the microgrid, with and without demand response activated.

Figure 12.
The grid voltage pattern related to time.

Table 1.
The estimated energy consumption schedule of a typical small consumer (a summertime Monday).
Table 1.
The estimated energy consumption schedule of a typical small consumer (a summertime Monday).
| Appliance | Power (kW) | Hour of the Day | Run Time (min) | Frequency Per Day | |||||
|---|---|---|---|---|---|---|---|---|---|
| 0 | 1 | … | 21 | 22 | 23 | ||||
| Washing machine | 3 | 0 | 0 | … | 0 | 0 | 0 | 150 | 1 |
| Dishwasher | 1.5 | 0 | 0 | 0 | 0 | 0 | 72 | 0 | |
| Fridge | 0.5 | 1 | 1 | 1 | 1 | 1 | 10.2 | 24 | |
| Freezer | 0.5 | 1 | 0 | 0 | 1 | 0 | 7.5 | 12 | |
| Oven | 2.5 | 0 | 0 | 0 | 0 | 0 | 120 | 0 | |
| Iron | 0.7 | 0 | 0 | 0 | 0 | 0 | 120 | 0 | |
| TV1 | 0.2 | 0 | 0 | 1 | 1 | 1 | 60 | 4 | |
| TV2 | 0.15 | 0 | 0 | 0 | 0 | 0 | 60 | 5 | |
| Radio | 0.02 | 0 | 0 | 0 | 0 | 0 | 90 | 2 | |
| PC | 0.25 | 0 | 0 | 1 | 1 | 1 | 60 | 14 | |
| Notebook | 0.07 | 0 | 0 | 1 | 1 | 0 | 60 | 4 | |
| Light 1 | 0.04 | 0 | 0 | 1 | 2 | 1 | 5 | 7 | |
| Light 2 | 0.06 | 0 | 0 | 1 | 1 | 0 | 60 | 3 | |
| … | … | … | … | … | … | … | … | … | |
© 2017 by the authors. Licensee MDPI, Basel, Switzerland. This article is an open access article distributed under the terms and conditions of the Creative Commons Attribution (CC BY) license (http://creativecommons.org/licenses/by/4.0/).
Share and Cite
MDPI and ACS Style
Marcon, P.; Szabo, Z.; Vesely, I.; Zezulka, F.; Sajdl, O.; Roubal, Z.; Dohnal, P. A Real Model of a Micro-Grid to Improve Network Stability. Appl. Sci. 2017, 7, 757. https://doi.org/10.3390/app7080757
AMA Style
Marcon P, Szabo Z, Vesely I, Zezulka F, Sajdl O, Roubal Z, Dohnal P. A Real Model of a Micro-Grid to Improve Network Stability. Applied Sciences. 2017; 7(8):757. https://doi.org/10.3390/app7080757
Chicago/Turabian StyleMarcon, Petr, Zoltan Szabo, Ivo Vesely, Frantisek Zezulka, Ondrej Sajdl, Zdenek Roubal, and Premysl Dohnal. 2017. "A Real Model of a Micro-Grid to Improve Network Stability" Applied Sciences 7, no. 8: 757. https://doi.org/10.3390/app7080757
Note that from the first issue of 2016, this journal uses article numbers instead of page numbers. See further details here.