Enhancement of Sea Wave Potential Energy with Under-Sea Periodic Structures: A Simulation and Laboratory Study


Institute of Applied Mechanics, National Taiwan University, Taipei 10617, Taiwan
*
Author to whom correspondence should be addressed.
Appl. Sci. 2017, 7(8), 782; https://doi.org/10.3390/app7080782
Submission received: 29 June 2017
/
Revised: 26 July 2017
/
Accepted: 28 July 2017
/
Published: 2 August 2017
(This article belongs to the Special Issue Selected Papers from IEEE ICASI 2017)
Abstract
:This paper is devoted to a theoretical investigation on the wave amplitude enhancement of surface sea water waves with under-sea periodic arrays of cylinders. A two-dimensional shallow water wave equation is derived and solved by using the plane-wave expansion method. The lattice types studied here include triangular, square and hexagonal lattices. These under-sea structures alter the sea bottom topography and induce constructive interference on the surface water waves. Given that the wave potential energy is dependent on the square of the wave amplitude, this mechanism can thus be used to increase the potential energy. It is shown that the enhancement factor depends on two geometric parameters and the maximum wave amplitude can be found by adjusting the two geometric parameters. Among the lattice types, the triangular and square lattice structures can induce more wave amplitude enhancement (and thus potential energy) than the hexagonal structures. Guided by numerical simulations, we have performed a reduced-scale water tank experiment to demonstrate the feasibility of the proposed idea. Preliminary experimental results show promising evidence of the predicted wave amplitude enhancement, suggesting perspective real-scale nearshore deployment and test.

1. Introduction
Oceans and seas cover about 70% of the earth’s surface and naturally become an ideal solar energy collector and storage place. These renewable energies are available in different forms such as surface waves, tidal currents or thermal gradients [1,2,3,4,5,6]. However, these energy resources are extremely difficult to extract from the open waters both technically and economically. Currently, there is no viable scheme to utilize these energies for large-scale production, although several significant improvements have been demonstrated in the past decade [7,8].
The overall performance of a sea wave energy conversion (SWEC) device depends on many technical factors such as energy-converting efficiency and transport loss. Most studies on SWEC devices focus on refining the wave converter and energy transport while treating the incoming waves passively. At present, the wave power generation is still in the research frontline and mostly under testing phases, which mostly put emphasis on the energy-conversion efficiency of the back-end electric power generator sets. Sea wave energy is inherently stochastic and the conversion of energy is extremely complex due to the highly varying energy flux and wide time scales. A successful deployment requires a full evaluation of favorable coastal environments, device durability, and energy sustainability, that is truly based on a well-coordinated interdisciplinary effort. The bottleneck encountered is that the engineering conditions of utilizing the energy are limited to specific areas of ocean, often with high average wave energy density for economic consideration, where only small-scale power generation could be carried out. On the other hand, there is relatively less research to control the wave amplitude, which belongs to the front-end wave gathering techniques in reducing the technical threshold [3,9,10,11].
It has been known for some time that sea bottom topography can significantly influence the surface wave amplitude and phases [12,13]. Since the sea wave potential energy is proportional to the square of the wave amplitude (height), it is proposed here to study the possibility of enhancing the wave amplitude using under-sea periodic arrays of cylinders. These cylinder structures can be used to concentrate water-wave energy, and thus increase the conversion efficiency. For example, if the wave period is fixed, the energy-conversion efficiency depends mainly on the significant wave height, which is roughly proportional to the wave amplitude if other parameters are invariant [14]. Therefore, doubling the wave amplitude using the under-sea structure would yield a quadruple increment of the efficiency. Recently, there have been proposals to utilize periodic structures to concentrate light waves, sound waves and water waves [15,16,17,18,19,20,21,22,23,24,25]. In our previous studies, we have pointed out that by optimizing the constraints of periodic arrangement, surface waves can be enhanced when propagating over periodic structures [26]. Therefore, in this paper we systematically discuss the influence of the energy enhancement factor by searching for the optimal geometrical parameters (the ratio of cylinder radius to the lattice constant and the ratio of the water depth to free water level) and the lattice configurations. Considering the actual seashore requirements, we choose a specific set of parameters and perform a reduced-scale water tank experiment. Both simulation and experimental results are reported and our results show clear physical evidence for the wave amplitude enhancement, which give a very promising opportunity for a successful real-scale nearshore deployment and test.
The rest of this paper is arranged in the following way. In Section 2, the two-dimensional shallow water wave equations are derived and solved numerically. In Section 3, the simulation results are presented and discussed. Using the Froude scaling scheme, we design and conduct a reduced-scale water tank experiment. The experimental results are compared with the theoretical prediction at a specific set of parameters. In Section 4, we conclude this work and call for a cross-disciplinary collaboration for the actual-scale test.
2. Materials and Methods
A summary of the physical quantities used in this work is listed in Table 1.
In this section, the working equations for governing the shallow water waves over under-sea structures are derived. Shallow water waves are also called long gravity waves, which appear on the free water surface. Since the wavelength of a shallow water wave is longer than the effective water depth, the propagation of the wave (amplitude as well as phase) is highly sensible to the bottom topology. For example, the giant tsunami wave is known to be induced by sudden alternation of the sea bottom shape.
The shallow water wave equation is a simplified fluid dynamics system that can be used to describe the horizontal motion of fluid. Yu and Kim [27] have applied an invariant imbedding method to study the influence of bottom topography on the propagation of linear shallow water waves over a one-dimensional array. The present study extends their formulation to the two-dimensional (2D) case. The surface wave propagating on an interface overlying the 2D triangular periodic lattice of rigid circular cylinders of radius r standing vertically on the bottom is schematically depicted in Figure 1.
The water depth from the mean water level (denoted as h0) to the top of cylinder is denoted by. The motion of an incompressible inviscid fluid is governed by the following Equation (1), Euler’s equation:
where is the three-dimensional velocity vector, is the pressure in the fluid, is the fluid density, and is the gravitational acceleration. The following Equations (2)–(4), show the Equation (1) in its components:
When the horizontal scale of motion is much faster than the vertical motion, the hydrostatic balance becomes a statement that gravity is balanced by a pressure gradient force, implying that vertical accelerations are negligible. Introducing the above hypotheses, the Equation (4) becomes the following Equation (5):
We define as the vertical displacement from the mean water level which describes the shape of the surface wave. By integrating the Equation (5), one can get the following Equation (6):
where is the constant atmospheric pressure. We assume approximately uniform flow across any vertical section through the water. This condition yields that the horizontal velocities components remain in phase with the surface elevation. By substituting Equation (6) into Equations (2) and (3), we get the following Equations (7) and (8):
When the horizontal velocities are depth-independent, using a control volume consisting of water, the mass continuity equation is given by the following Equation (9):
where is the cross-sectional area element. By expanding Equation (9) we obtain the continuity Equation (10):
Equations (7), (8) and (10) are the nonlinear shallow water wave equations. If the attention is restricted on small wave amplitudes (, and are very small), Equations (7) and (8) can be linearized in the following Equations (11) and (12):
and the mass continuity equation, can therefore be expressed by the following Equation (13):
By taking time derivative on Equation (13) and eliminating the velocities, the wave equation for becomes:
Let us try the solution of in the form, , the equation satisfied by H is the following Equation (15):
Therefore, by designing through deployment of under-sea structures, we can obtain the enhancement factor (H with respect to the free amplitude) and search for the optimal parameters for constructive interference to occur. A simplifying factor in our model is neglecting the stress effect of the structure on the fluid mechanics. Therefore, there is no solid–fluid coupling considered herein. If the structure is being made of strengthened concrete, the hydraulic pressure induced by the wave motion is too small to affect the geometry of the solid structure. Moreover, the concerned activity occurs within the sea surface level which is far from the surface of the structure, as compared to the expected strain size. Therefore, we expect minor stress effect on the wave amplitude enhancement. On the other hand, the lattice geometry is expected to significantly alter the wave amplitude, similar to the case in photonic crystals.
Wave energy is in general extracted by a SWEC device from the wave-induced motion that is converted into mechanical energy, and then transformed to electricity. This can be achieved by using hydraulic systems such as the Pelamis shown in Figure 1. Pelamis is a surface attenuator designed to operate within the sea surface circumstance. It consists of semi-submerged cylindrical sections, aligned perpendicular to the wavefront of the incoming wave and utilizes the relative motion among the sections [28]. The sections move relative to one another as waves pass the machine. This wave-induced motion causes the cylinders to pump oil through hydraulic motors, which in turn drive generators. Electricity is then transmitted along a connecting cable to a junction on the seabed. Therefore, it is the wave height that determines the generated power of such a device. The Pelamis is thus interacting with the under-sea structure through the wave height enhancement.
3. Results and Discussion
3.1. Numerical Simulation Set-Up
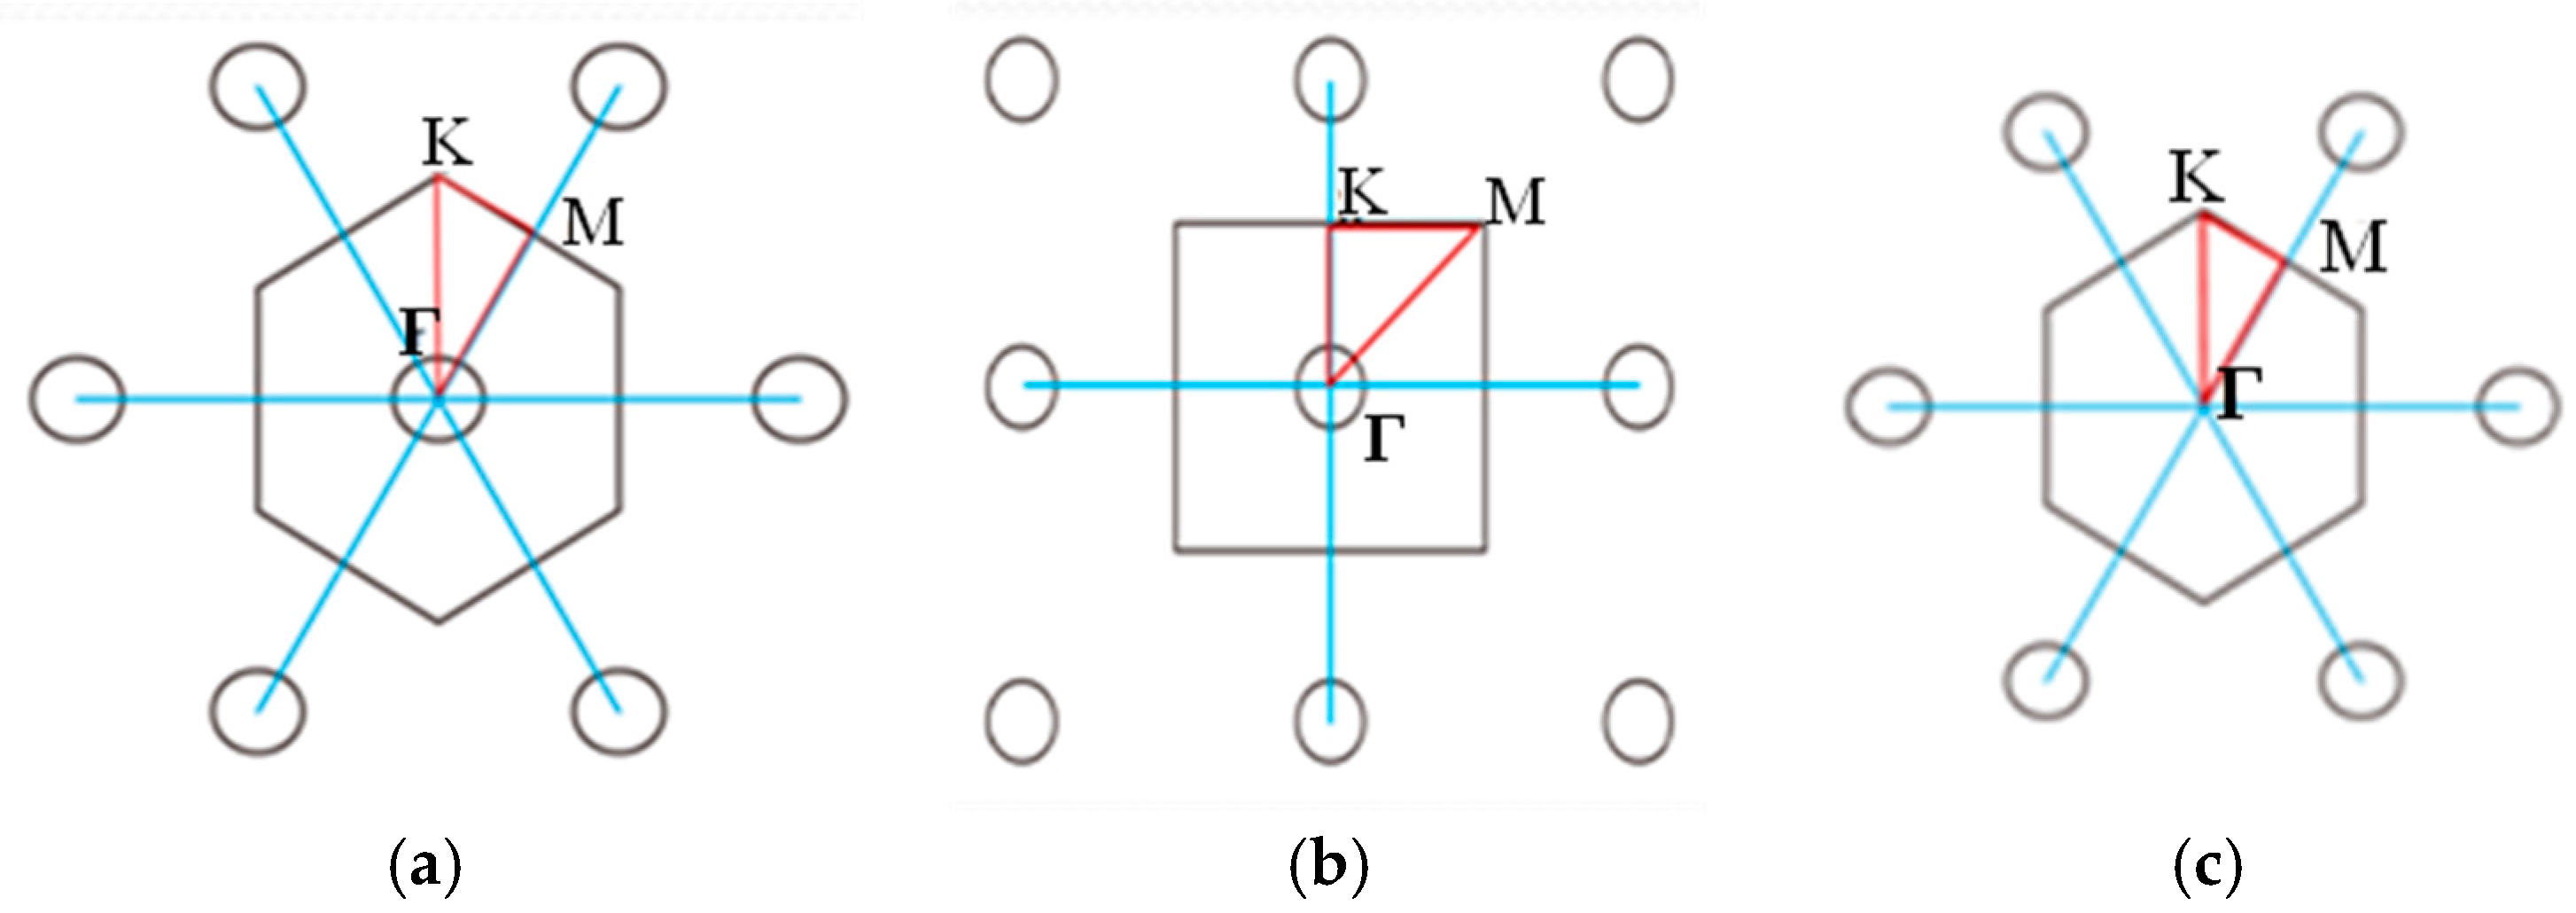
It is now well known that when the incident water wave enters the non-uniform media area, it would be scattered (or diffracted) by the structures to produce the multiple scattering phenomenon. The transmission properties of water waves through artificial crystals can be obtained from the calculated transmission wave. Three lattice types are considered, i.e., triangular, square and hexagonal lattice arrays. The ΓK or ΓM direction of the lattice structure is set to be parallel to the incident wave side, as shown in Figure 2, where Γ, M, and K are the points of the first Brillouin zone in the irreducible representations of the corresponding symmetry groups. For a concrete example, a triangular lattice with the lattice constant a is considered. The k-point inside the irreducible Brillouin zone is derived by walking from Γ (0, 0) to M (0, 0.5) π/a to K (1/3, −1/3) π/a and back to Γ. Any arbitrary wavevector can be constructed by linear combinations of these basis vectors.
For our purpose, the most suitable dimensionless units can be defined in terms of the lattice constant a, the water wavelength λ and the wave velocity c. In these numerical results, the frequencies at a specific mode are normalized, and expressed by the basic unit fn = a/λ. Using the dimensionless variables, the wave amplitude depends only on two parameters; namely the ratio of h0/h and the ratio of r/a. The wave equation is solved by the plane-wave expansion method as implemented in the open-source MIT Photonic Bands (MPB) software package. Briefly, this method can be used to compute fully vectoral eigenmodes of the wave equations with periodic boundary conditions by preconditioned conjugate-gradient minimization of the block Rayleigh quotient in a plane-wave basis [29]. Here the lattice vector is discretized by a grid of N = {322, 642, 1282, 2562, 5122} points. Convergence tests have been carefully examined with respect to the basis set size, K (or M)-point sampling, and aliasing (cell size). The pure computation error for N above 1282 can be expected to be less than 1%.
3.1.1. Model A: Triangular Lattice
Firstly, consider the transmission of water waves across the triangular lattice structure, which is derived by putting cylinders at the center and the vertices of a hexagon, shown in Figure 3. Figure 3a presents a typical wave amplitude distribution with the incident wave along the ΓK direction. Clearly, the waves gain amplitude enhancement and energy concentration right on top of the cylinder. Figure 3b presents the dependence of the maximum wave amplitude on h0/h and r/a in the ranges of 2~13 and 0.1~0.5, respectively. It can be seen that the amplitude of water surface can be enhanced up to a factor of 5 with reference to the free wave amplitude (the enhancement factor). As h0/h increases and r/a decreases, the enhancement factor reaches to the largest value within the searching regions. Furthermore, it is noteworthy that the value of the enhancement factor is much smaller when the wave is incident in the ΓM direction, as compared with that in the ΓK direction.
Table 2 lists the numerical enhancement factors on h0/h and r/a in the ranges of 8~13 and 0.14~0.24 when the cylinders are arranged in the triangular lattice, respectively.
3.1.2. Model B: Square Lattice
Next, consider the transmission of water waves across the square lattice structure, as shown in Figure 4 for the transmission patterns. A typical wave amplitude distribution with the incident wave along the ΓM direction is shown in Figure 4a. The concentration areas are not exactly right on top of the cylinder but form band structures. In this case, the conversion efficiency in the ΓM direction appears to be higher than the ΓK direction. Figure 4b presents the maximum wave amplitude which bears a very similar pattern to that for the triangular lattice structure. However, as compared to the case of triangular lattice, the enhancement factor is appreciably larger.
Table 3 lists the numerical enhancement factors when the cylinders are arranged in the square lattice. It is noted that there are some sparse points where the amplitude vanishes. These correspond to the forbidden frequency regions as the wave propagates through the band-gap areas.
3.1.3. Model C: Hexagonal Lattice
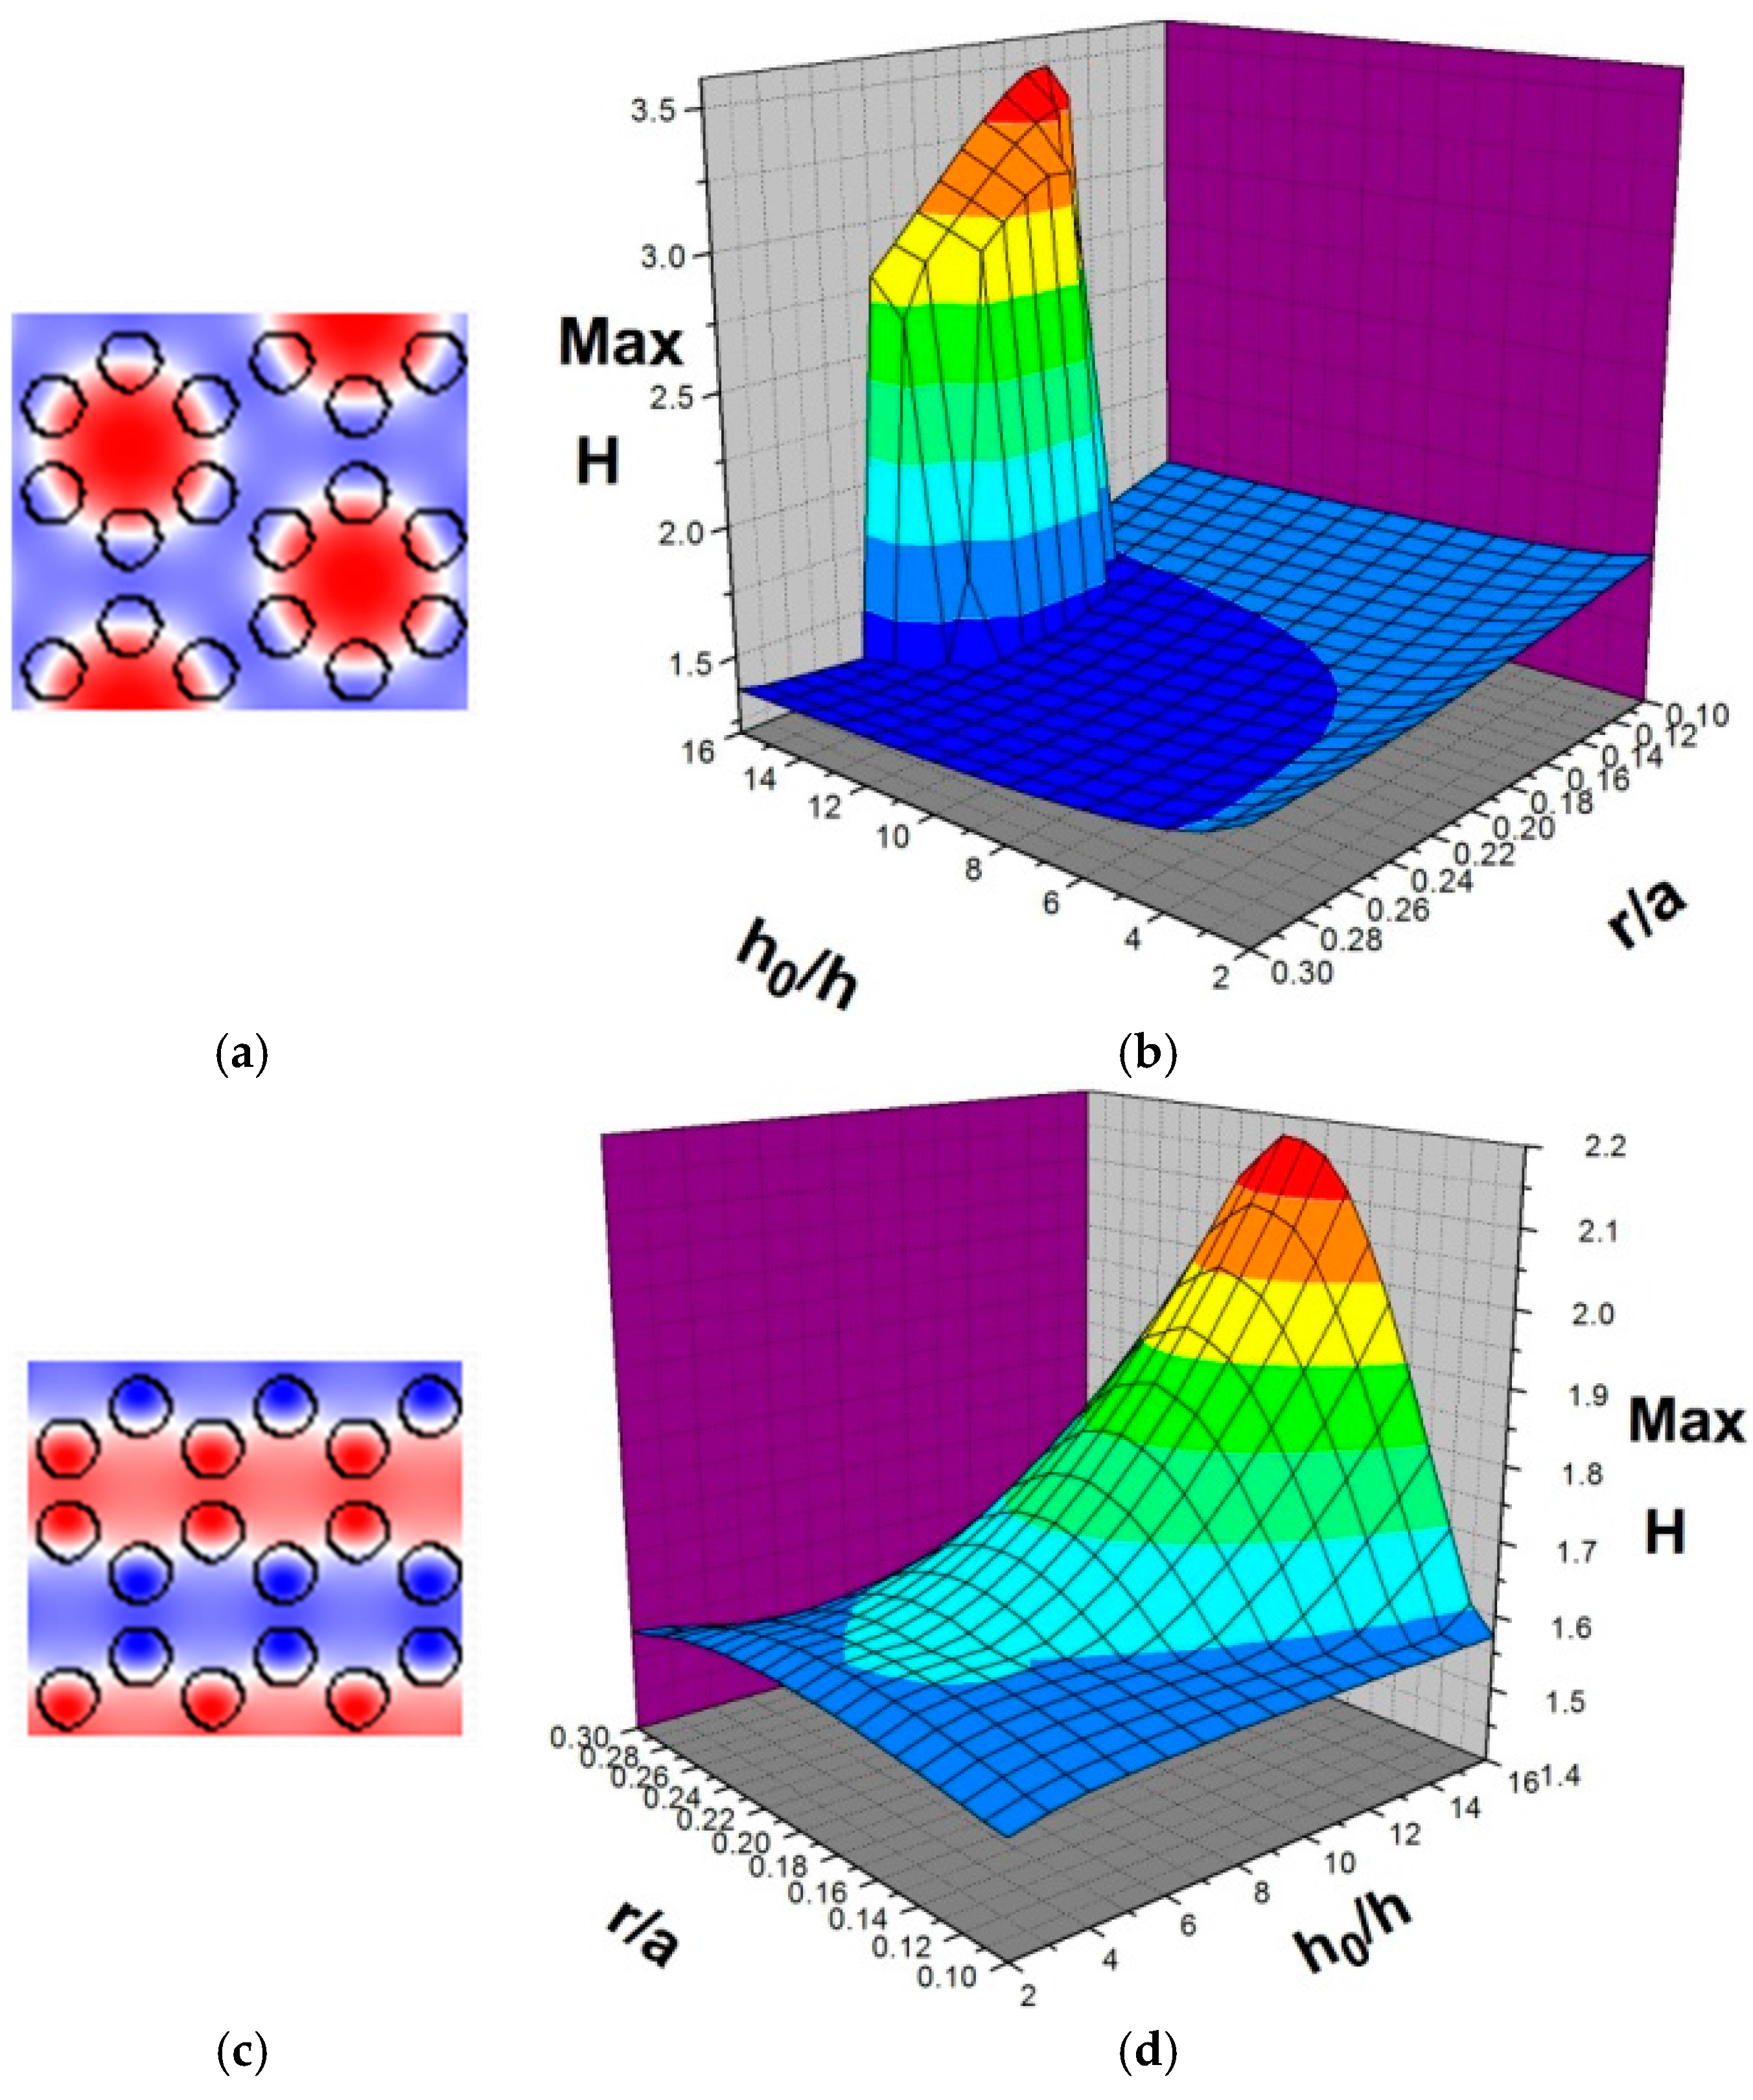
Similarly, consider the transmission of water waves across the hexagonal lattice structure, which is derived by putting cylinders at the vertices of a hexagon, shown in Figure 5. In Figure 5a,b and Figure 5c,d, the incident waves are along the ΓK and ΓM directions, respectively. In both cases, the simulation results indicate effective wave enhancement phenomena. However, the concentration regions are different for different incident directions. Figure 5b,d present the results for the maximum wave amplitude dependence on h0/h and r/a in the ranges of 2~16 and 0.1~0.3, respectively. For the ΓK direction, it is clear that the enhancement factor is only higher and limited in regions for h0/h and r/a, being from 14 to 16 and from 0.15 to 0.24, respectively. On the other hand, for the ΓM direction, the enhancement factor increases smoothly with the values of h0/h and r/a.
3.1.4. Optimization
For realistic ocean engineering applications, the lattice constant a and the water depth h are usually on the order of several meters and these parameters can be converted to the real water wave conditions when the wave velocity, the wavelength and the water level are known. For example, for the square lattice structure, when h0/h = 9 and r/a = 0.25, the maximum amplitude H is predicted to be 3.86, at which point the normalized frequency is 0.46. If the wave velocity extends from 0.78 to 1.05 m/s, the wavelength is from 4.05 to 5.46 m and the water level is about 20 m. With this design h is 2.22 m, a is 0.46 × (4.05 + 5.46)/2 = 2.19 m and r is 0.55 m. Table 6 lists the recommended geometric parameters and the corresponding frequencies with which the best enhancement factor can be realized in normal sea conditions. It should be pointed out, that the range of r/a of the square structure is appreciably larger compared to those of the other two. However, notice that the above enhancement factor may be inaccessible when r/a is too large because of geometry limit and/or frequency constraint.
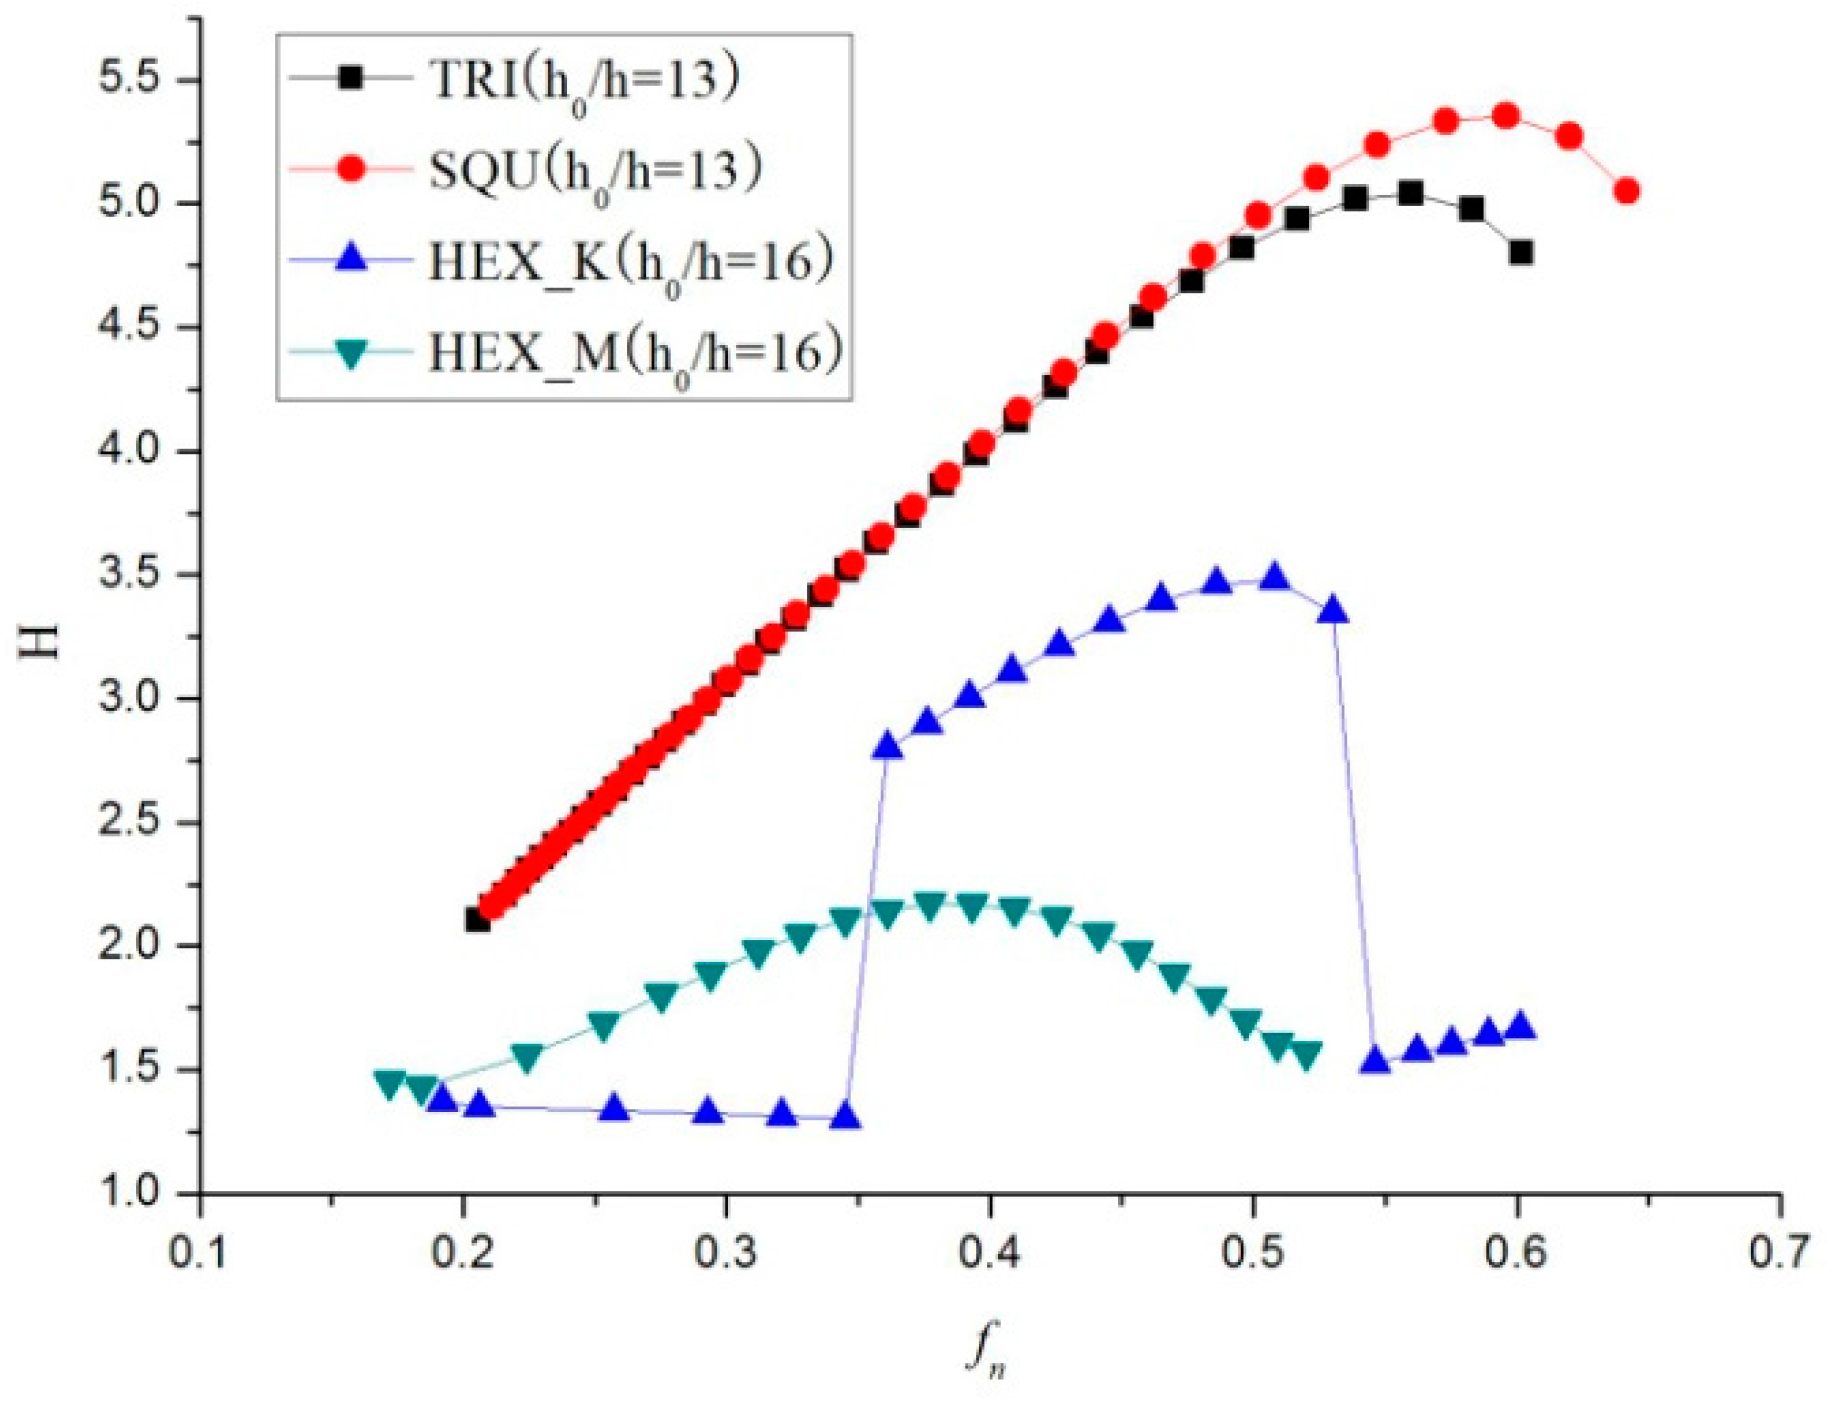
Next, the dependence of H on fn for the three lattice types is displayed in Figure 6. The four curves correspond to different lattice types with different values of h0/h. We can see that the largest H of 5.3 occurs at fn = 0.6 in the square structure. At low frequencies, the wave interference is not obvious for any given lattice type so the enhancement is not significant. It can be seen, that larger H appears when fn is larger than 0.32. Overall, the H for the hexagonal lattice type is appreciably less as compared to the other two.
3.2. Laboratory Demonstration
To demonstrate the predicted enhancement of water wave amplitude, we have designed and conducted a reduced-scale laboratory experiment. All the experiments were performed in a rectangular water tank with side and bottom walls made of transparent glass. The experimental set-up and the home-designed under-water periodic structure are shown in Figure 7. The water tank is 5 m in length, 0.8 m in width and 1.2 m in height mounted on the laboratory ground (Figure 7a). The principal facilities include a wave generating system, a back-wave absorber, and an image recording system. Incident plane waves are generated by a self-designed displacement piston wave-maker, which can be used stably and effectively in shallow water wave regions. The driving frequency of the wave-maker can be altered from 0.5 to 1.2 Hz. The back wave reflected from the other end of the water tank is damped by the wave-absorbing sponge beach. Both top-view and side-view images are recorded by a digital camera at running rates of 10~50 frames per second and exposure times 1~10 ms.
The wave elevations are estimated in the following way. A stick ruler is attached vertically on the side wall (Figure 7b) and is calibrated with respect to the right perspective of the camera lens. The contrasted videos are recorded before and after placing the structures in the water tank. The film images are analyzed through an image-extraction software and the wave heights are read from the images. The wave amplitude enhancement factor is then calculated from the obtained wave elevations with respect to the structure-free (control) results.
The under-water periodic structure consists of solid circular cylinders forming a triangular lattice mounted on the bottom of the water tank (Figure 7c,d). We arrange the cylinders with a lattice constant a = 4 cm in 35 × 35π cm2 circular area and set the ΓK direction of the structure parallel to the short side of the structure. The radius of cylinder r is 1 cm and the length of cylinder L is 24 cm. The structure is positioned on the central line of the wave-tank at a distance of 120 cm from the wave-maker and 300 cm from the wave absorbing area.
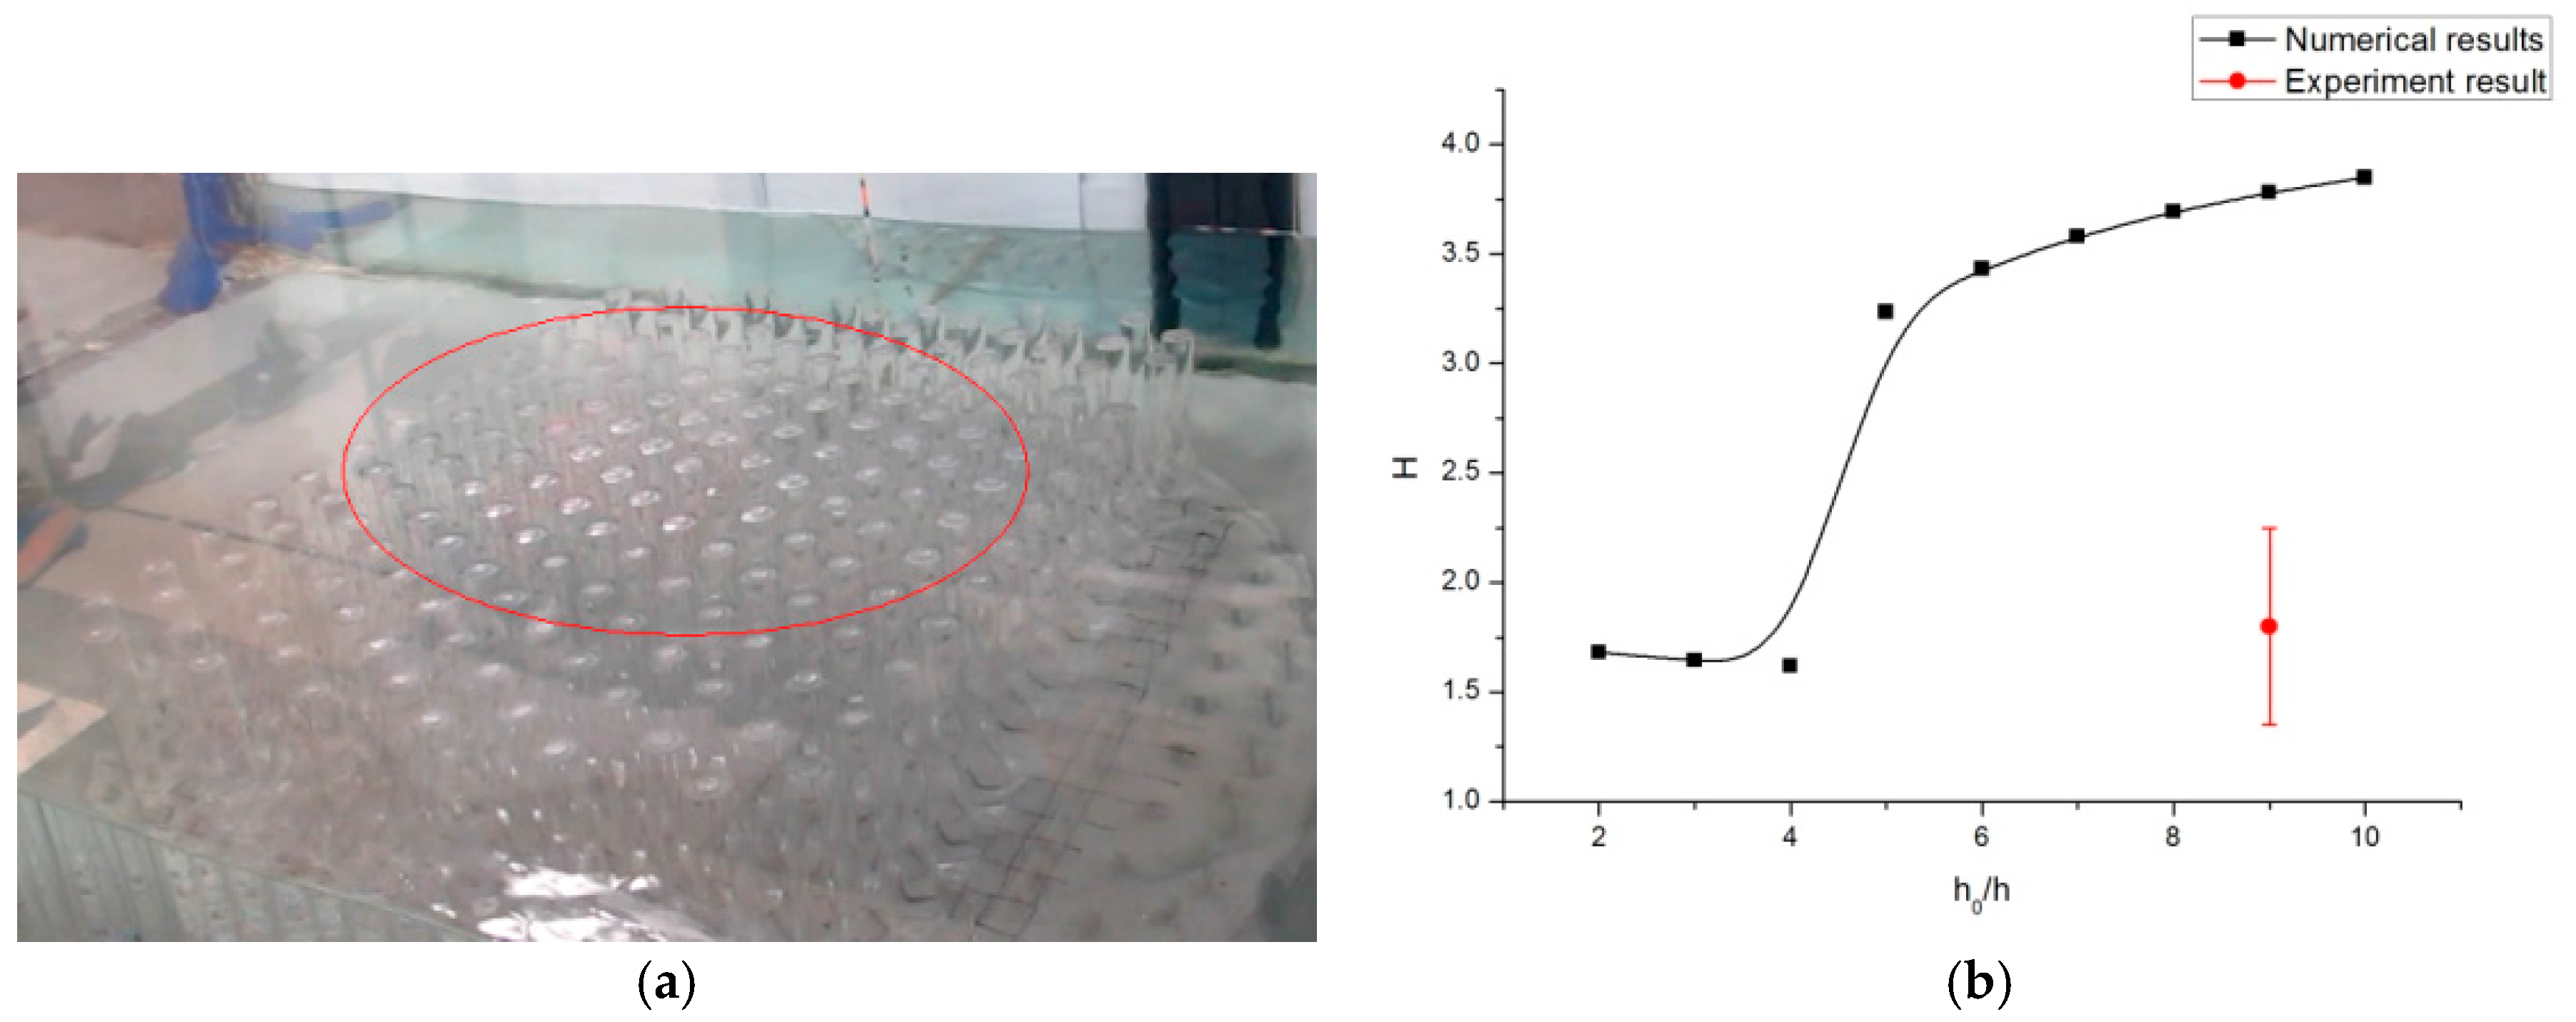
In Figure 8 we show one of the main experimental results by suitably adjusting the h0/h (ca. 9) and r/a (ca. 0.25) ratios to be closely similar to theoretical values. We can see obvious wave concentration on the central part of the structure (see the Supplementary Videos and the closer-up bird-view in Figure 8a). The amplitude of wave in the middle of the tank is clearly higher than that outside the structure area. By changing the driving frequency from 0.5 Hz with a step of 0.05 Hz, the amplitude enhancement does not appear until the frequency is tuned to 0.7 Hz. The enhancement factor is determined to be about 1.8 ± 0.3 (Figure 8b), which is about one half of the expected value 3.78. This enhancement effect disappears at the frequency of 0.75 Hz. The details can be seen in the Supplementary Videos. We continue to increase the frequency up to 0.9 Hz but do not see any re-occurrence of such phenomena. The same event occurs when tuning the frequency backwards. Therefore, it is a certain physical effect that the wave amplitude is enhanced, although not as high as expected.
Two factors may contribute to the discrepancy between the experimental observation and the theoretical prediction. Froude scaling was used to coordinate the results from our reduced-scale experiments and the prototype observations under real-scale sea conditions. With a Froude scaling factor s (~100 in our experiment), the spatial dimension (water depth, wave height, etc.) scales as 1/s and temporal dimension (wave period) scales as 1/√s. Therefore, velocity scales as 1/√s while gravity is in the same scale of the prototype observation. However, surface tension and viscosity (dissipation) are much too large in the reduced-scale experiment, thus diminishing the observed wave amplitude enhancement. Therefore, it is well expected that the theoretical prediction would overestimate the wave amplitude enhancement.
Before concluding our work, we would like to emphasize that it is crucial to perform a reduced-scale physical test like the one presented here because the investment on a real-scale test without careful evaluation can be very risky. A lab test can help validate the theoretical predictions and minimize the unexpected physical factors that would complicate the on-site deployment. Our reduced-scale test demonstrates the feasibility of the proposed solution to energy enhancement, which provides a faithful basis toward the real-scale test.
4. Conclusions
In summary, we have calculated and discussed the sea water wave propagation over under-sea structures with periodically arranged cylinders deployed on the sea bottom with parametric excitations. Only two dimensionless geometric parameters are required to be adjusted to enhance the wave amplitude. Numerical results show that for each lattice structure, the wave amplitude can be enhanced by changing both the orientation of the incident wave and the geometric parameters of the lattice array. Among the triangular, square and hexagonal lattice structures, triangular and square lattice types can induce larger wave amplitude than the hexagonal one. The predicted wave amplitude enhancement is clearly seen in the reduced-scale water tank experiment. It is very promising that the phenomena can be utilized to extract the sea wave energy. Therefore, we call for an actual-scale nearshore test, which may require a cross-disciplinary collaboration, but no technical difficulty is foreseen. The phenomena can be utilized to extract the sea surface wave potential energy and a real-scale nearshore test is highly desirable.
Supplementary Materials
The following are available online at https://www.mdpi.com/2076-3417/7/8/782/s1. Videos S1a and S1b: experimental result (0.7 Hz); Video S2: experimental result (0.75 Hz).
Acknowledgments
The authors would like to thank Chin-Chou Chu for many useful suggestions and discussions. This work was partially supported by the MOST of Taiwan, ROC (MOST 104-2221-E-002-032-MY3) and the National Taiwan University (CQSE 104-R891401).
Author Contributions
Sheng D. Chao conceived and designed the simulations and experiments; all authors performed the study and analyzed the data; Shuo-Feng Chiu wrote the paper.
Conflicts of Interest
The authors declare no conflict of interest.
References
- Ghosh, T.K.; Prelas, M.A. Energy Resources and System; Springer: New York, NY, USA, 2011; Volume 2, pp. 267–320. [Google Scholar]
- Esteban, M.; Leary, D. Current developments and future prospects of offshore wind and ocean energy. Appl. Energy 2012, 90, 128–136. [Google Scholar] [CrossRef]
- Antonio, F.D.O. Wave energy utilization: A review of the technologies. Renew. Sust. Energy Rev. 2010, 14, 899–918. [Google Scholar]
- Chen, F.L.; Lu, S.M.; Tseng, K.T.; Lee, S.C.; Wang, E. Assessment of renewable energy reserves in Taiwan. Renew. Sust. Energy Rev. 2010, 14, 2511–2528. [Google Scholar] [CrossRef]
- Tsai, C.P.; Hwang, C.H.; Hwa, C.; Chang, H.Y. Study on the wave climate variation to the renewable wave energy assessment. Renew. Energy 2012, 38, 50–61. [Google Scholar]
- Silva, D.; Rusu, E.; Guedes-Soares, C. High-resolution wave energy assessment in shallow water accounting for tides. Energies 2016, 9, 761. [Google Scholar] [CrossRef]
- Tollefson, J. Blue energy. Nature 2014, 508, 302–304. [Google Scholar] [CrossRef] [PubMed]
- Yemm, R.; Pizer, D.; Retzler, C.; Henderson, R. Pelamis: Experience from concept to connection. Philos. Trans. R. Soc. A-Math. Phys. Eng. Sci. 2012, 370, 365–380. [Google Scholar] [CrossRef] [PubMed]
- Iuppa, C.; Contestabile, P.; Cavallaro, L.; Foti, E.; Vicinanza, D. Hydraulic Performance of an Innovative Breakwater for Overtopping Wave Energy Conversion. Sustainability 2016, 8, 1226. [Google Scholar] [CrossRef]
- Naty, S.; Viviano, A.; Foti, E. Wave Energy Exploitation System Integrated in the Coastal Structure of a Mediterranean Port. Sustainability 2016, 8, 1342. [Google Scholar] [CrossRef]
- Vicinanza, D.; Margheritini, L.; Kofoed, J.P.; Buccino, M. The SSG Wave Energy Converter: Performance, Status and Recent Developments. Energies 2012, 5, 193–226. [Google Scholar] [CrossRef]
- Belibassakis, K.A.; Gerostathis, T.P.; Athanassoulis, G.A. A coupled-mode model for water wave scattering by horizontal, non-homogeneous current in general bottom topography. Appl. Ocean Res. 2011, 33, 384–397. [Google Scholar] [CrossRef]
- Ardhuin, F.; Magne, R. Scattering of surface gravity waves by bottom topography with a current. J. Fluid Mech. 2007, 576, 235–264. [Google Scholar] [CrossRef]
- Reikard, G.; Robertson, B.; Buckham, B.; Bidlot, J.R.; Hiles, C. Simulating and forecasting ocean wave energy in western Canada. Ocean Eng. 2015, 103, 223–236. [Google Scholar] [CrossRef]
- Molin, B.; Remy, F.; Arnaud, G.; Rey, V.; Touboul, J.; Sous, D. On the dispersion equation for linear waves traveling through or over dense arrays of vertical cylinders. Appl. Ocean Res. 2016, 61, 148–155. [Google Scholar] [CrossRef]
- Mei, C.C.; Chan, I.C.; Liu, P.L.F. Waves of intermediate length through an array of vertical cylinders. Environ. Fluid Mech. 2014, 14, 235–261. [Google Scholar] [CrossRef]
- Carter, B.G.; Mclver, P. Water-wave propagation through an infinite array of floating structures. J. Eng. Math. 2013, 81, 9–45. [Google Scholar] [CrossRef]
- Brule, S.; Javelaud, E.H.; Enoch, S.; Guenneau, S. Experiments on Seismic Metamaterials: Molding Surface Waves. Phys. Rev. Lett. 2014, 112, 133901. [Google Scholar] [CrossRef] [PubMed]
- Hu, X.; Yang, J.; Zi, J.; Chan, C.T.; Ho, K.M. Experimental Observation of Negative Effective Gravity in Water Waves. Sci. Rep. 2013, 3, 1916. [Google Scholar] [CrossRef] [PubMed]
- Zhang, Y.; Li, Y.; Shao, H.; Zhong, Y.Z.; Zhang, S.; Zhao, Z.X. Band gaps and localization of surface water waves over large-scale sand waves with random fluctuations. Phys. Rev. E 2012, 85, 066319. [Google Scholar] [CrossRef] [PubMed]
- Reyes-Ayona, E.; Torrent, D.; Sanchez-Dehesa, J. Homogenization theory for periodic distributions of elastic cylinders embedded in a viscous fluid. J. Acoust. Soc. Am. 2012, 132, 2896–2908. [Google Scholar] [CrossRef] [PubMed]
- Liu, X.; Wei, Y.; Li, S.; Xu, Y.; Lu, D.; Yu, B. Propagation of liquid surface waves over finite graphene structured arrays of cylinders. Theor. Appl. Mech. Lett. 2011, 1, 052007. [Google Scholar] [CrossRef]
- Flocard, F.; Finnigan, T.D. Laboratory experiments on the power capture of pitching vertical cylinders in waves. Ocean. Eng. 2010, 37, 989–997. [Google Scholar] [CrossRef]
- Yang, J.; Tang, Y.F.; Ouyang, C.F.; Liu, X.H.; Hu, X.H.; Zi, J. Observation of the focusing of liquid surface waves. App. Phys. Lett. 2009, 95, 094106. [Google Scholar] [CrossRef]
- Erselcan, İ.Ö.; Kükner, A. A numerical analysis of several wave energy converter arrays deployed in the Black Sea. Ocean Eng. 2017, 131, 68–79. [Google Scholar] [CrossRef]
- Chao, S.D.; Chiu, S.F.; Huang, Y.H.; Wang, C.C.; Wang, S.C.; Chu, C.C. Wave Energy Gathering and Enhancing Device. U.S. Patent 20140300110 A1, 9 October 2014. [Google Scholar]
- Yu, D.J.; Kim, K. Influence of bottom topography on the propagation of linear shallow water waves: An exact approach based on the invariant imbedding method. Waves Random Complex Media 2008, 18, 325–341. [Google Scholar] [CrossRef]
- Henderson, R. Design, simulation, and testing of a novel hydraulic power take-off system for the Pelamis wave energy converter. Renew. Energy 2006, 31, 271–283. [Google Scholar] [CrossRef]
- Johnson, S.G.; Joannopoulos, J.D. Block-iterative frequency-domain methods for Maxwell’s equations in a planewave basis. Opt. Express 2001, 8, 173–190. [Google Scholar] [CrossRef] [PubMed]
Figure 1.
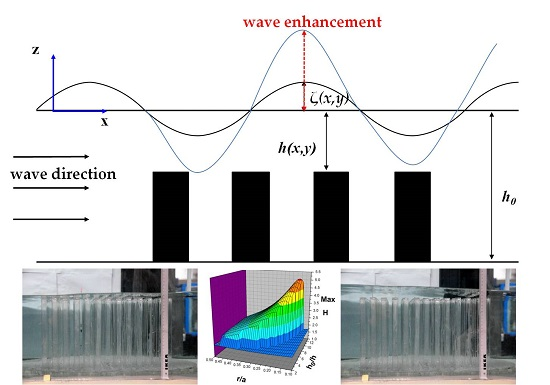
Schematic plot of a triangular lattice of identical, vertical, rigid circular cylinders standing in a sea bottom. The lattice constant is a and the cylinder radius is r. (a) The x-z side-view. (b) The x-y top-view. An example of the Pelamis sea wave energy conversion (SWEC) device is depicted to show the intended deployment.
Figure 1.
Schematic plot of a triangular lattice of identical, vertical, rigid circular cylinders standing in a sea bottom. The lattice constant is a and the cylinder radius is r. (a) The x-z side-view. (b) The x-y top-view. An example of the Pelamis sea wave energy conversion (SWEC) device is depicted to show the intended deployment.
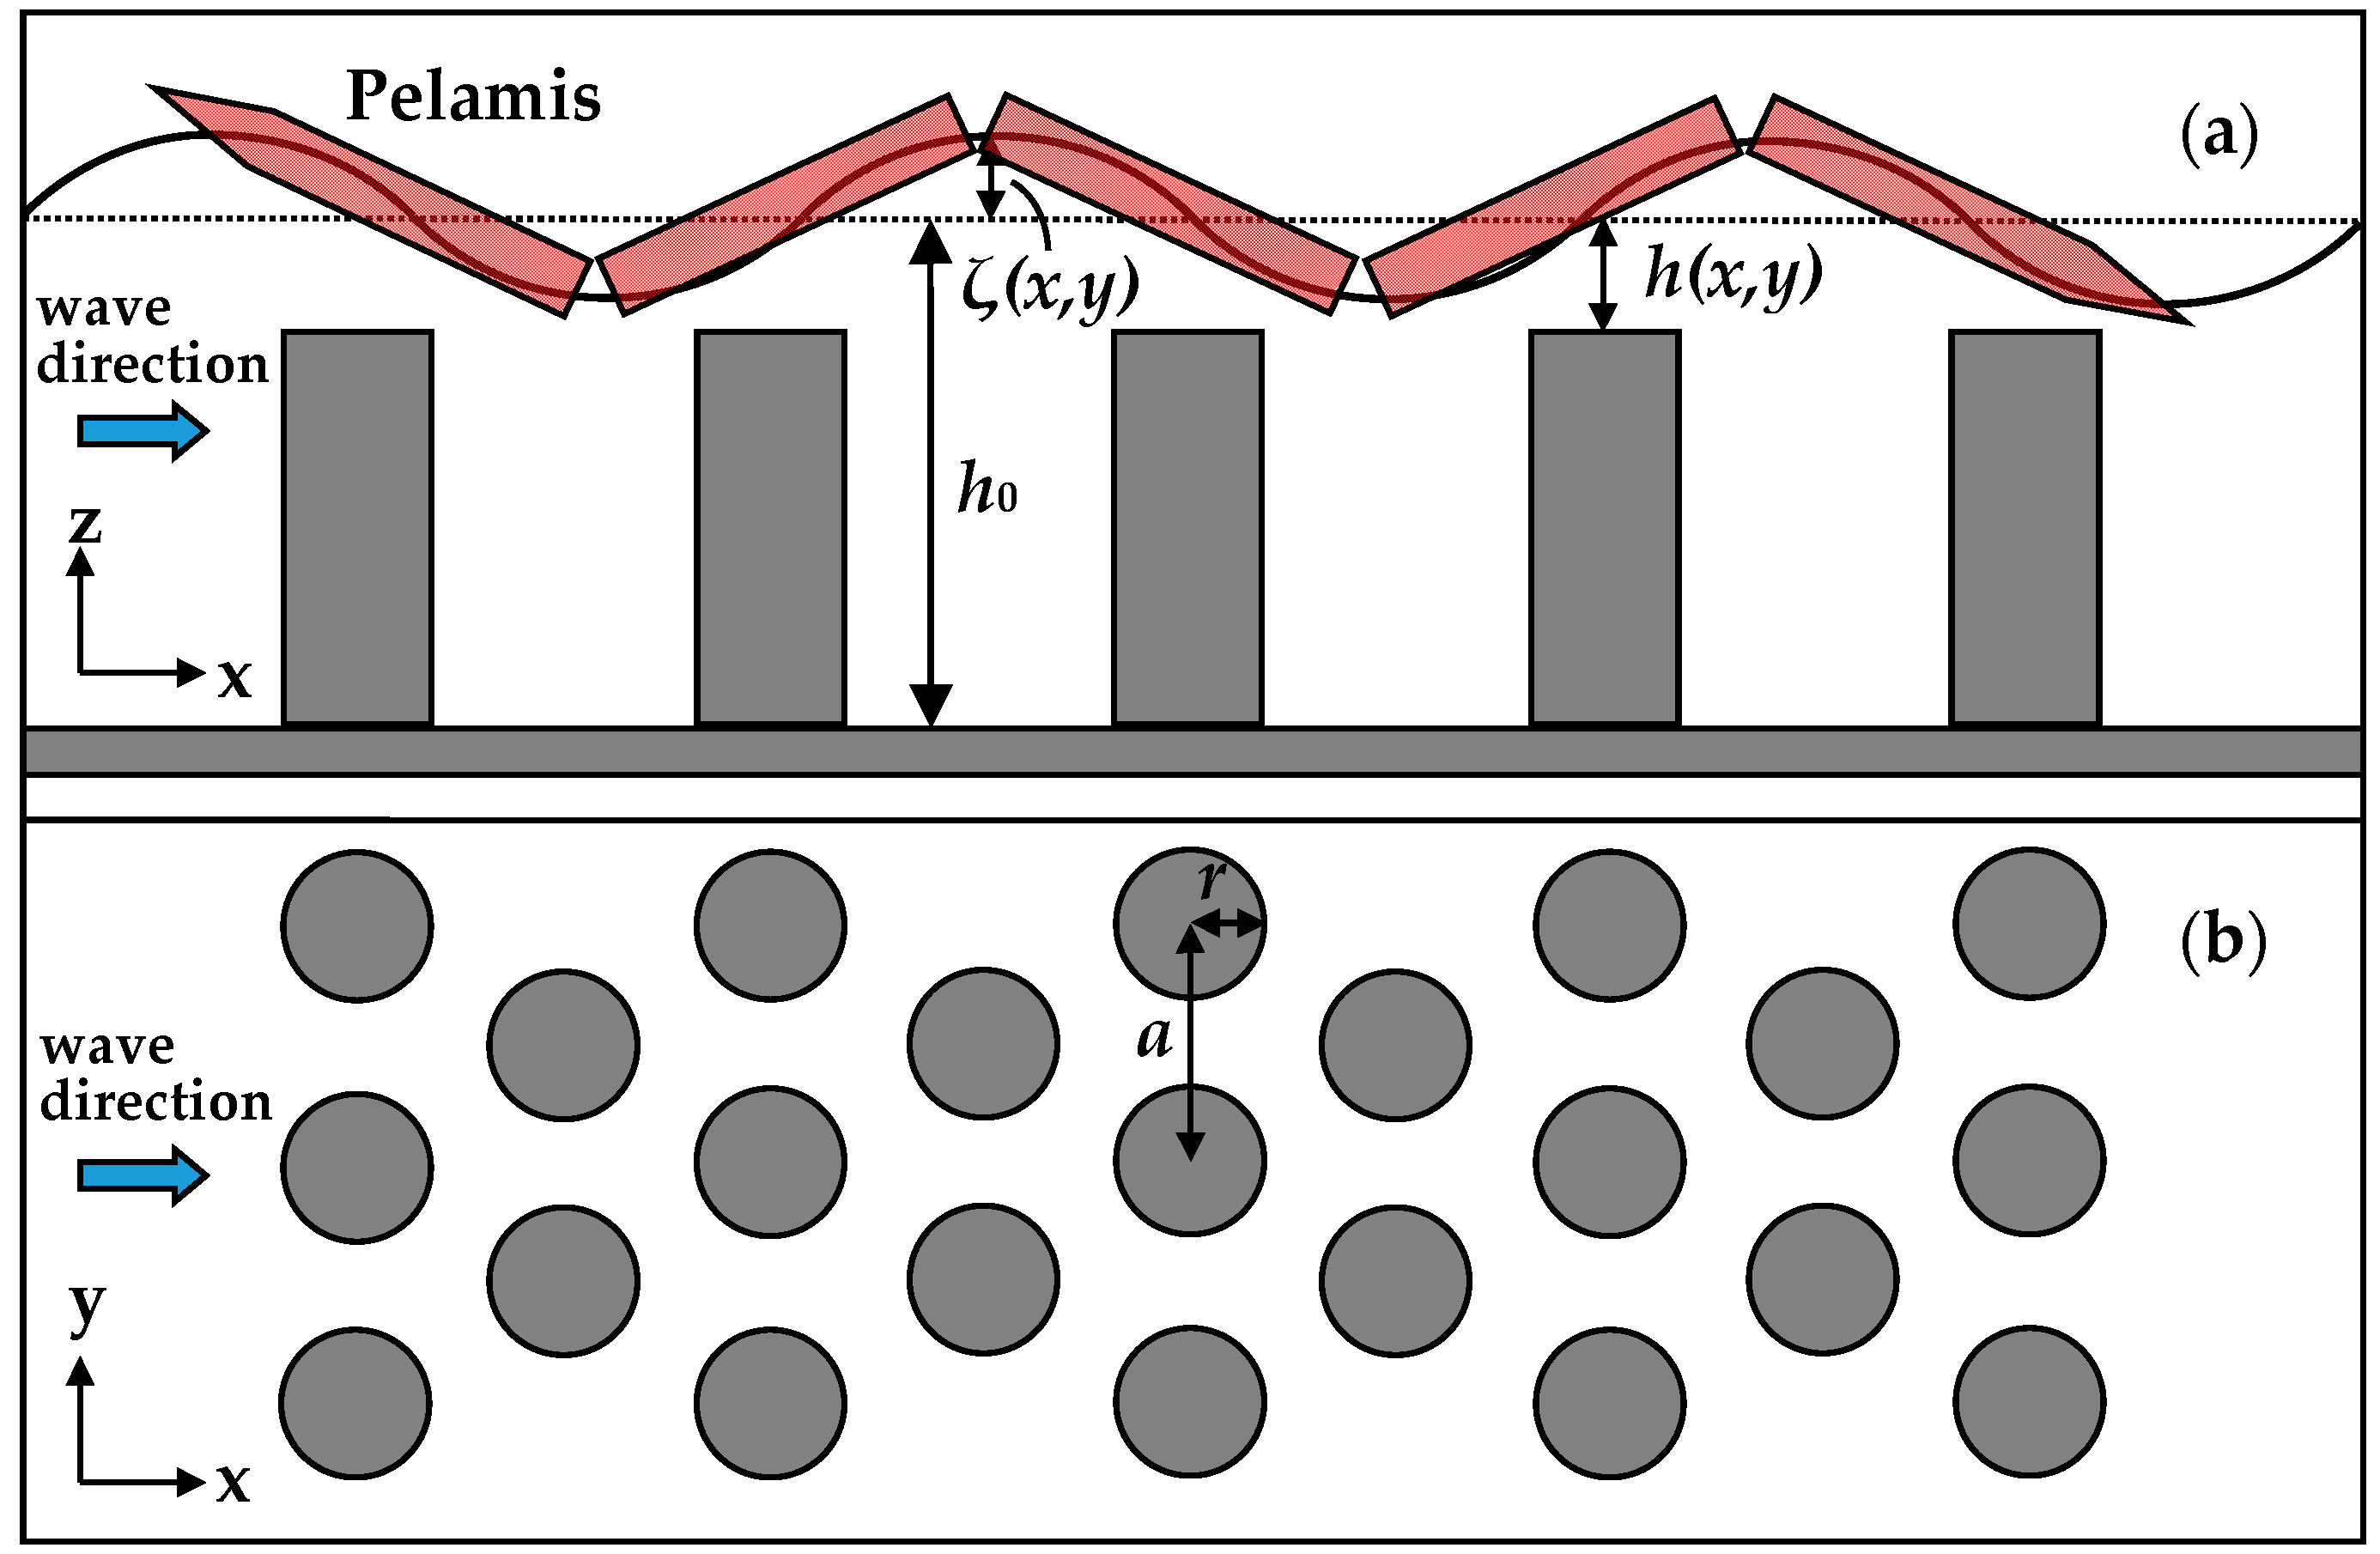
Figure 2.
First Brillouin zones, irreducible Brillouin zones (red region) and unit cells of the (a) triangular; (b) square; and (c) hexagonal lattice structures.
Figure 2.
First Brillouin zones, irreducible Brillouin zones (red region) and unit cells of the (a) triangular; (b) square; and (c) hexagonal lattice structures.

Figure 3.
Triangular structure: (a) The spatial distributions of the wave amplitude in the ΓK direction. (b) The maximum wave amplitude as functions of the ratio h0/h and the ratio r/a.
Figure 3.
Triangular structure: (a) The spatial distributions of the wave amplitude in the ΓK direction. (b) The maximum wave amplitude as functions of the ratio h0/h and the ratio r/a.
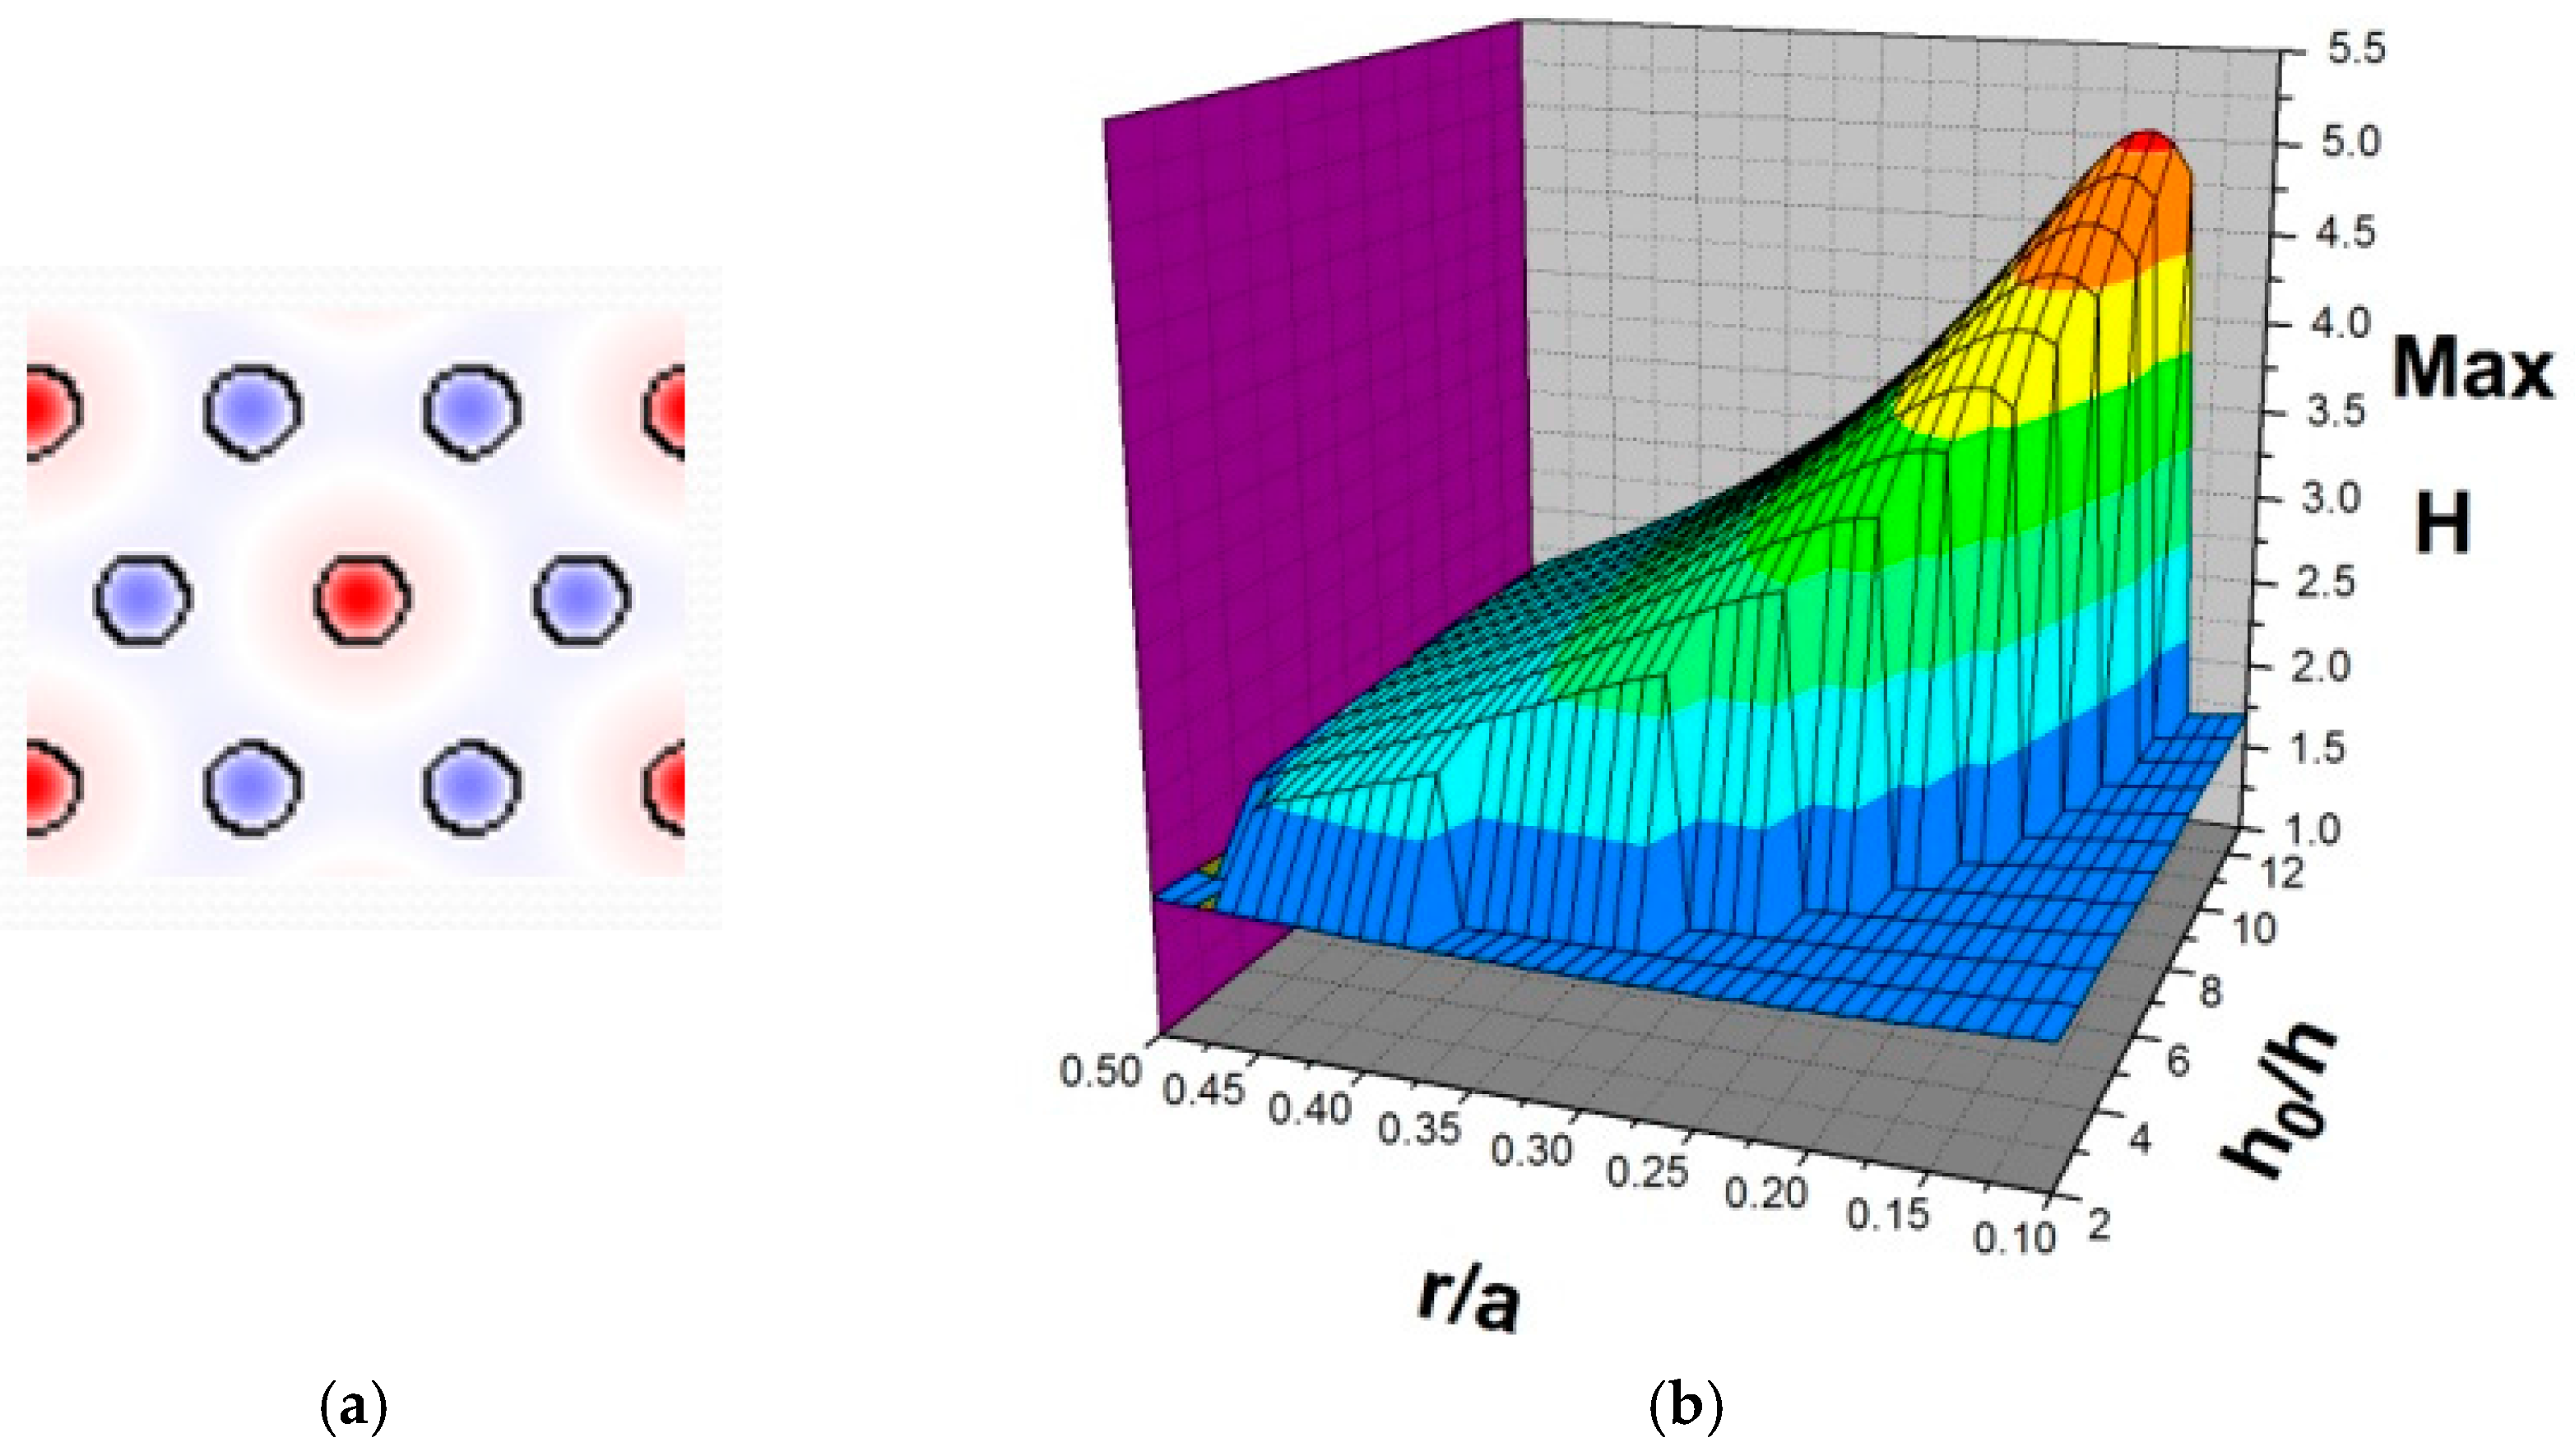
Figure 4.
Square structure: (a) The spatial distributions of the wave amplitude in the ΓM direction; (b) The maximum wave amplitude as functions of the ratio h0/h and the ratio r/a.
Figure 4.
Square structure: (a) The spatial distributions of the wave amplitude in the ΓM direction; (b) The maximum wave amplitude as functions of the ratio h0/h and the ratio r/a.
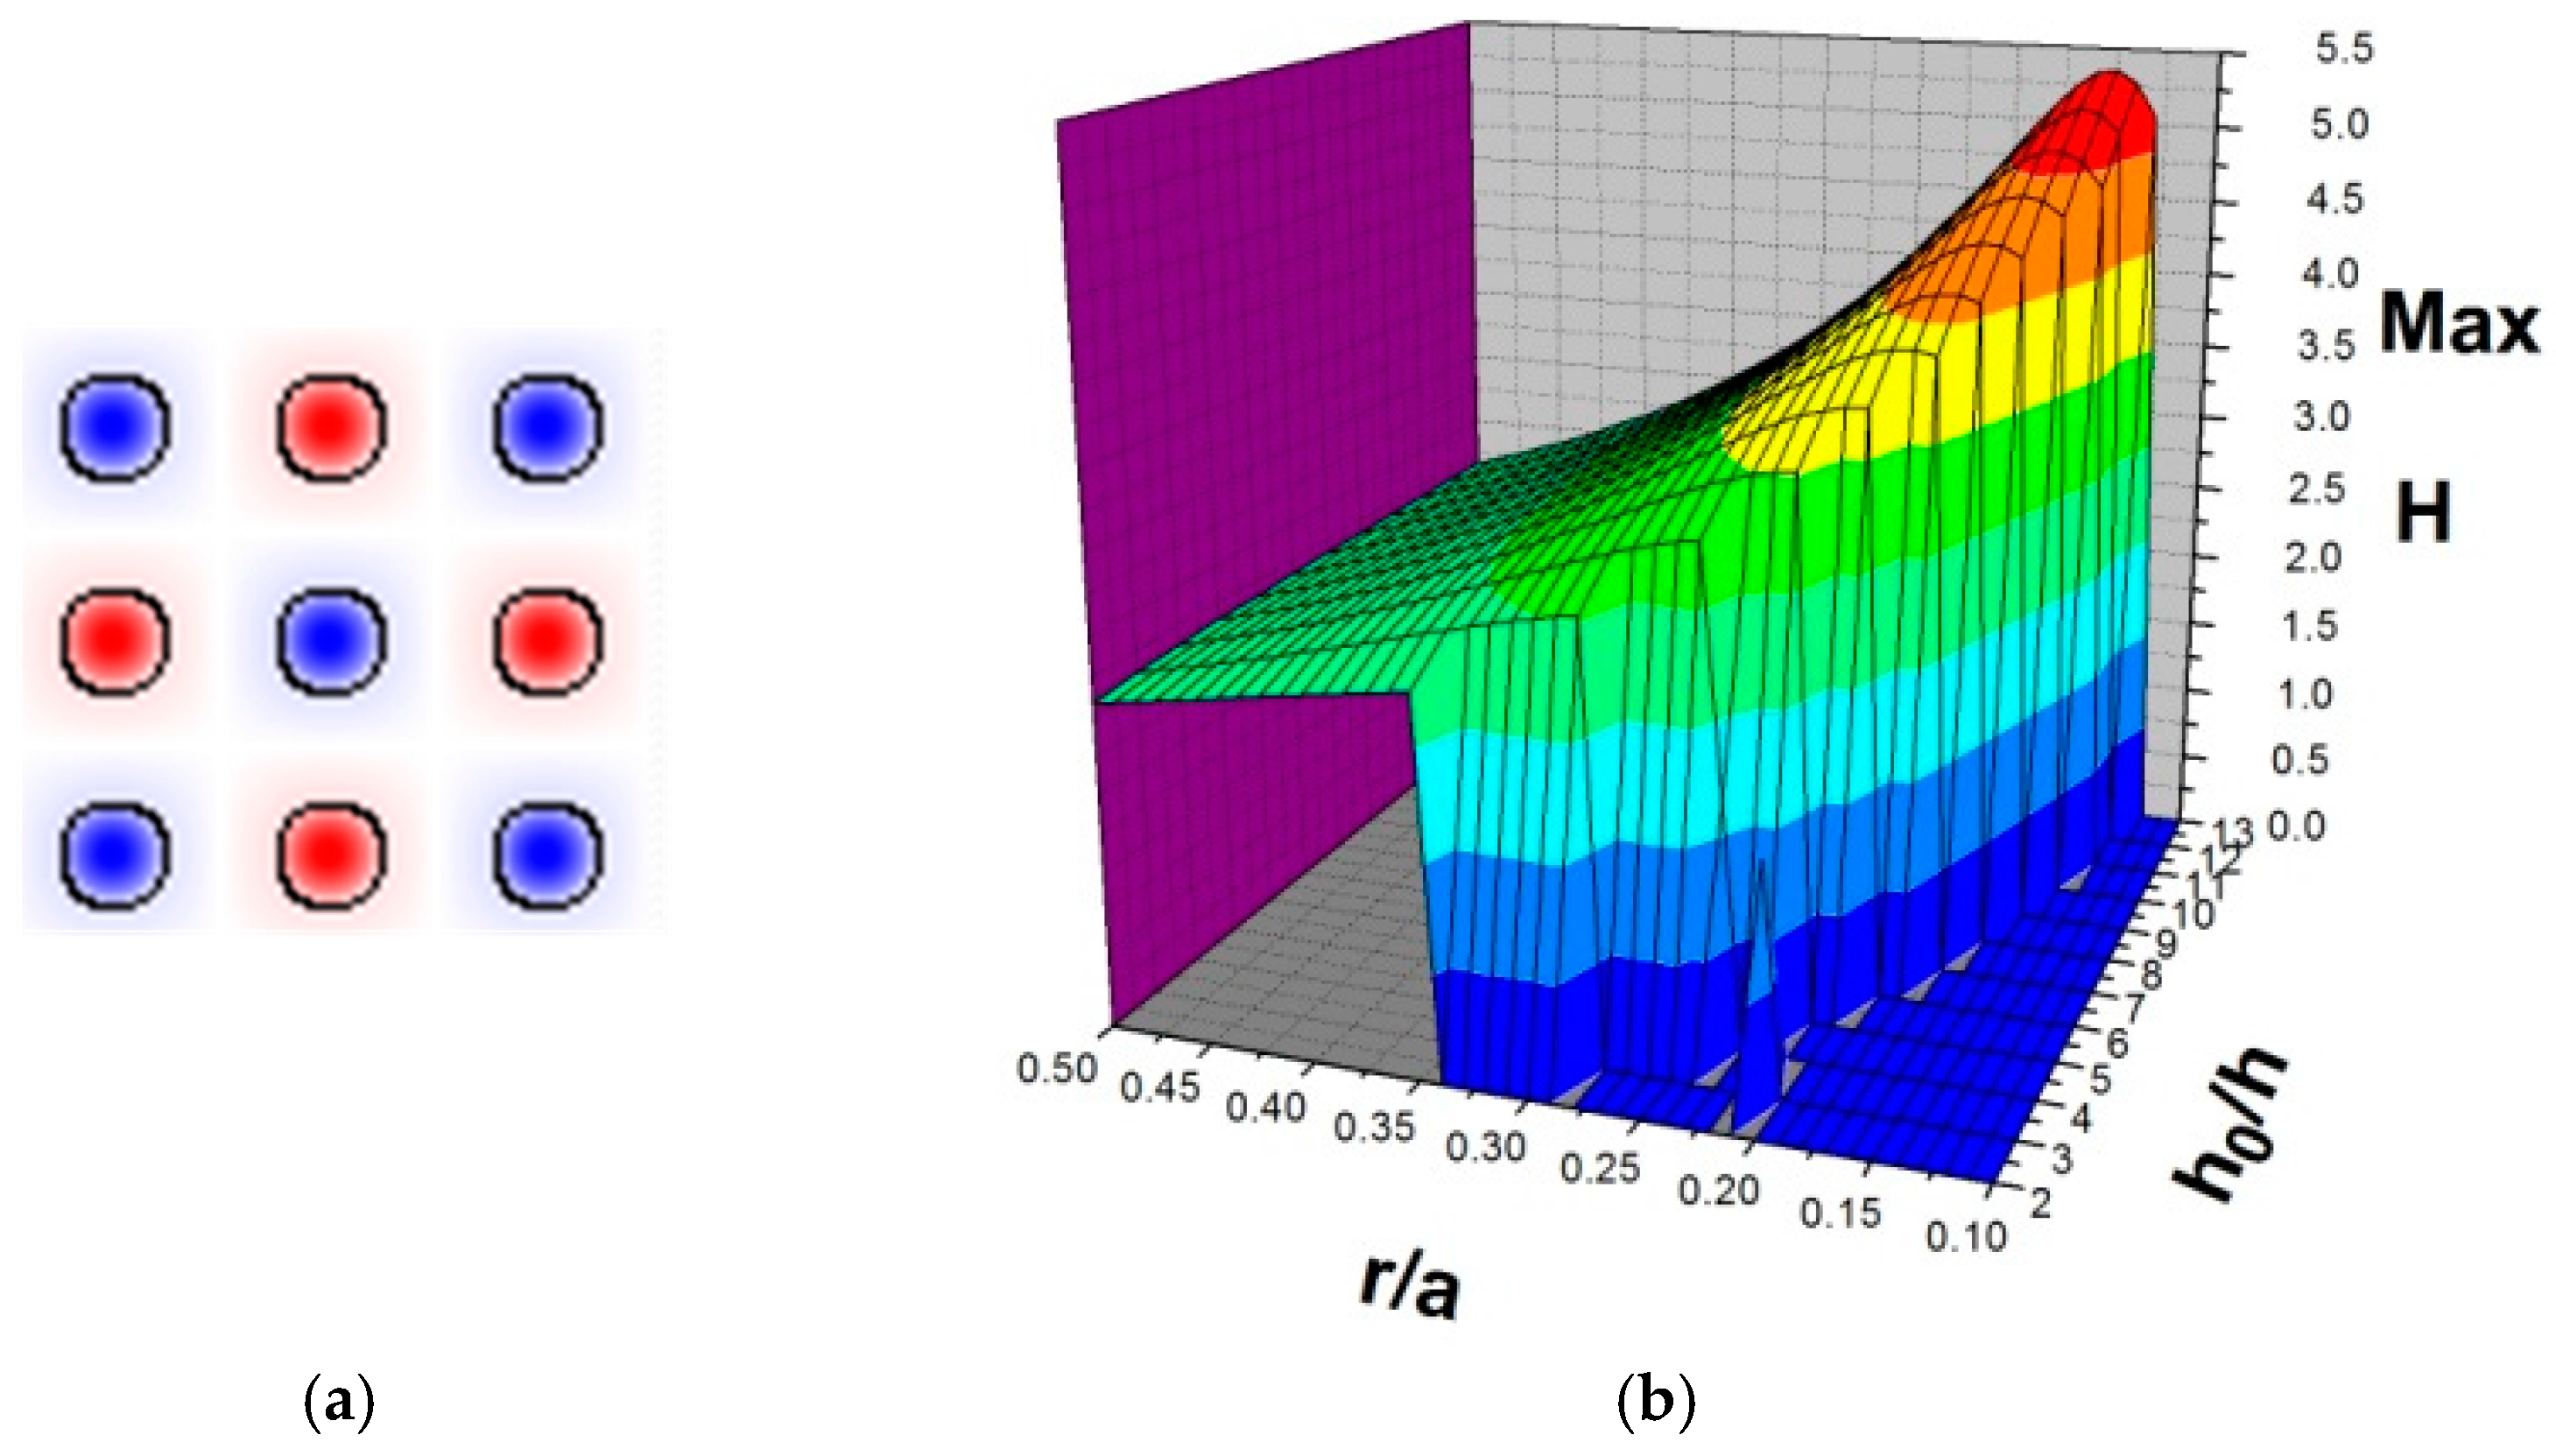
Figure 5.
Hexagonal structure: The spatial distributions of the amplitude and the enhancement factor (H) in the ΓK direction (a,b) and the ΓM direction (c,d), respectively.
Figure 5.
Hexagonal structure: The spatial distributions of the amplitude and the enhancement factor (H) in the ΓK direction (a,b) and the ΓM direction (c,d), respectively.

Figure 6.
Enhancement factor of the surface water waves over the triangular, square and hexagonal structured arrays of cylinders as a function of the normalized frequency.
Figure 6.
Enhancement factor of the surface water waves over the triangular, square and hexagonal structured arrays of cylinders as a function of the normalized frequency.

Figure 7.
The under-water periodic structure and the experimental set-up in the water tank. (a) The bird-view and (b) the side-view of the wave amplitude enhancement. (c) The three-dimensional view of the triangular lattice of 13 × 13 cylinders with lattice constant a = 4 cm in (d) the 35 × 35π cm2 circular area.
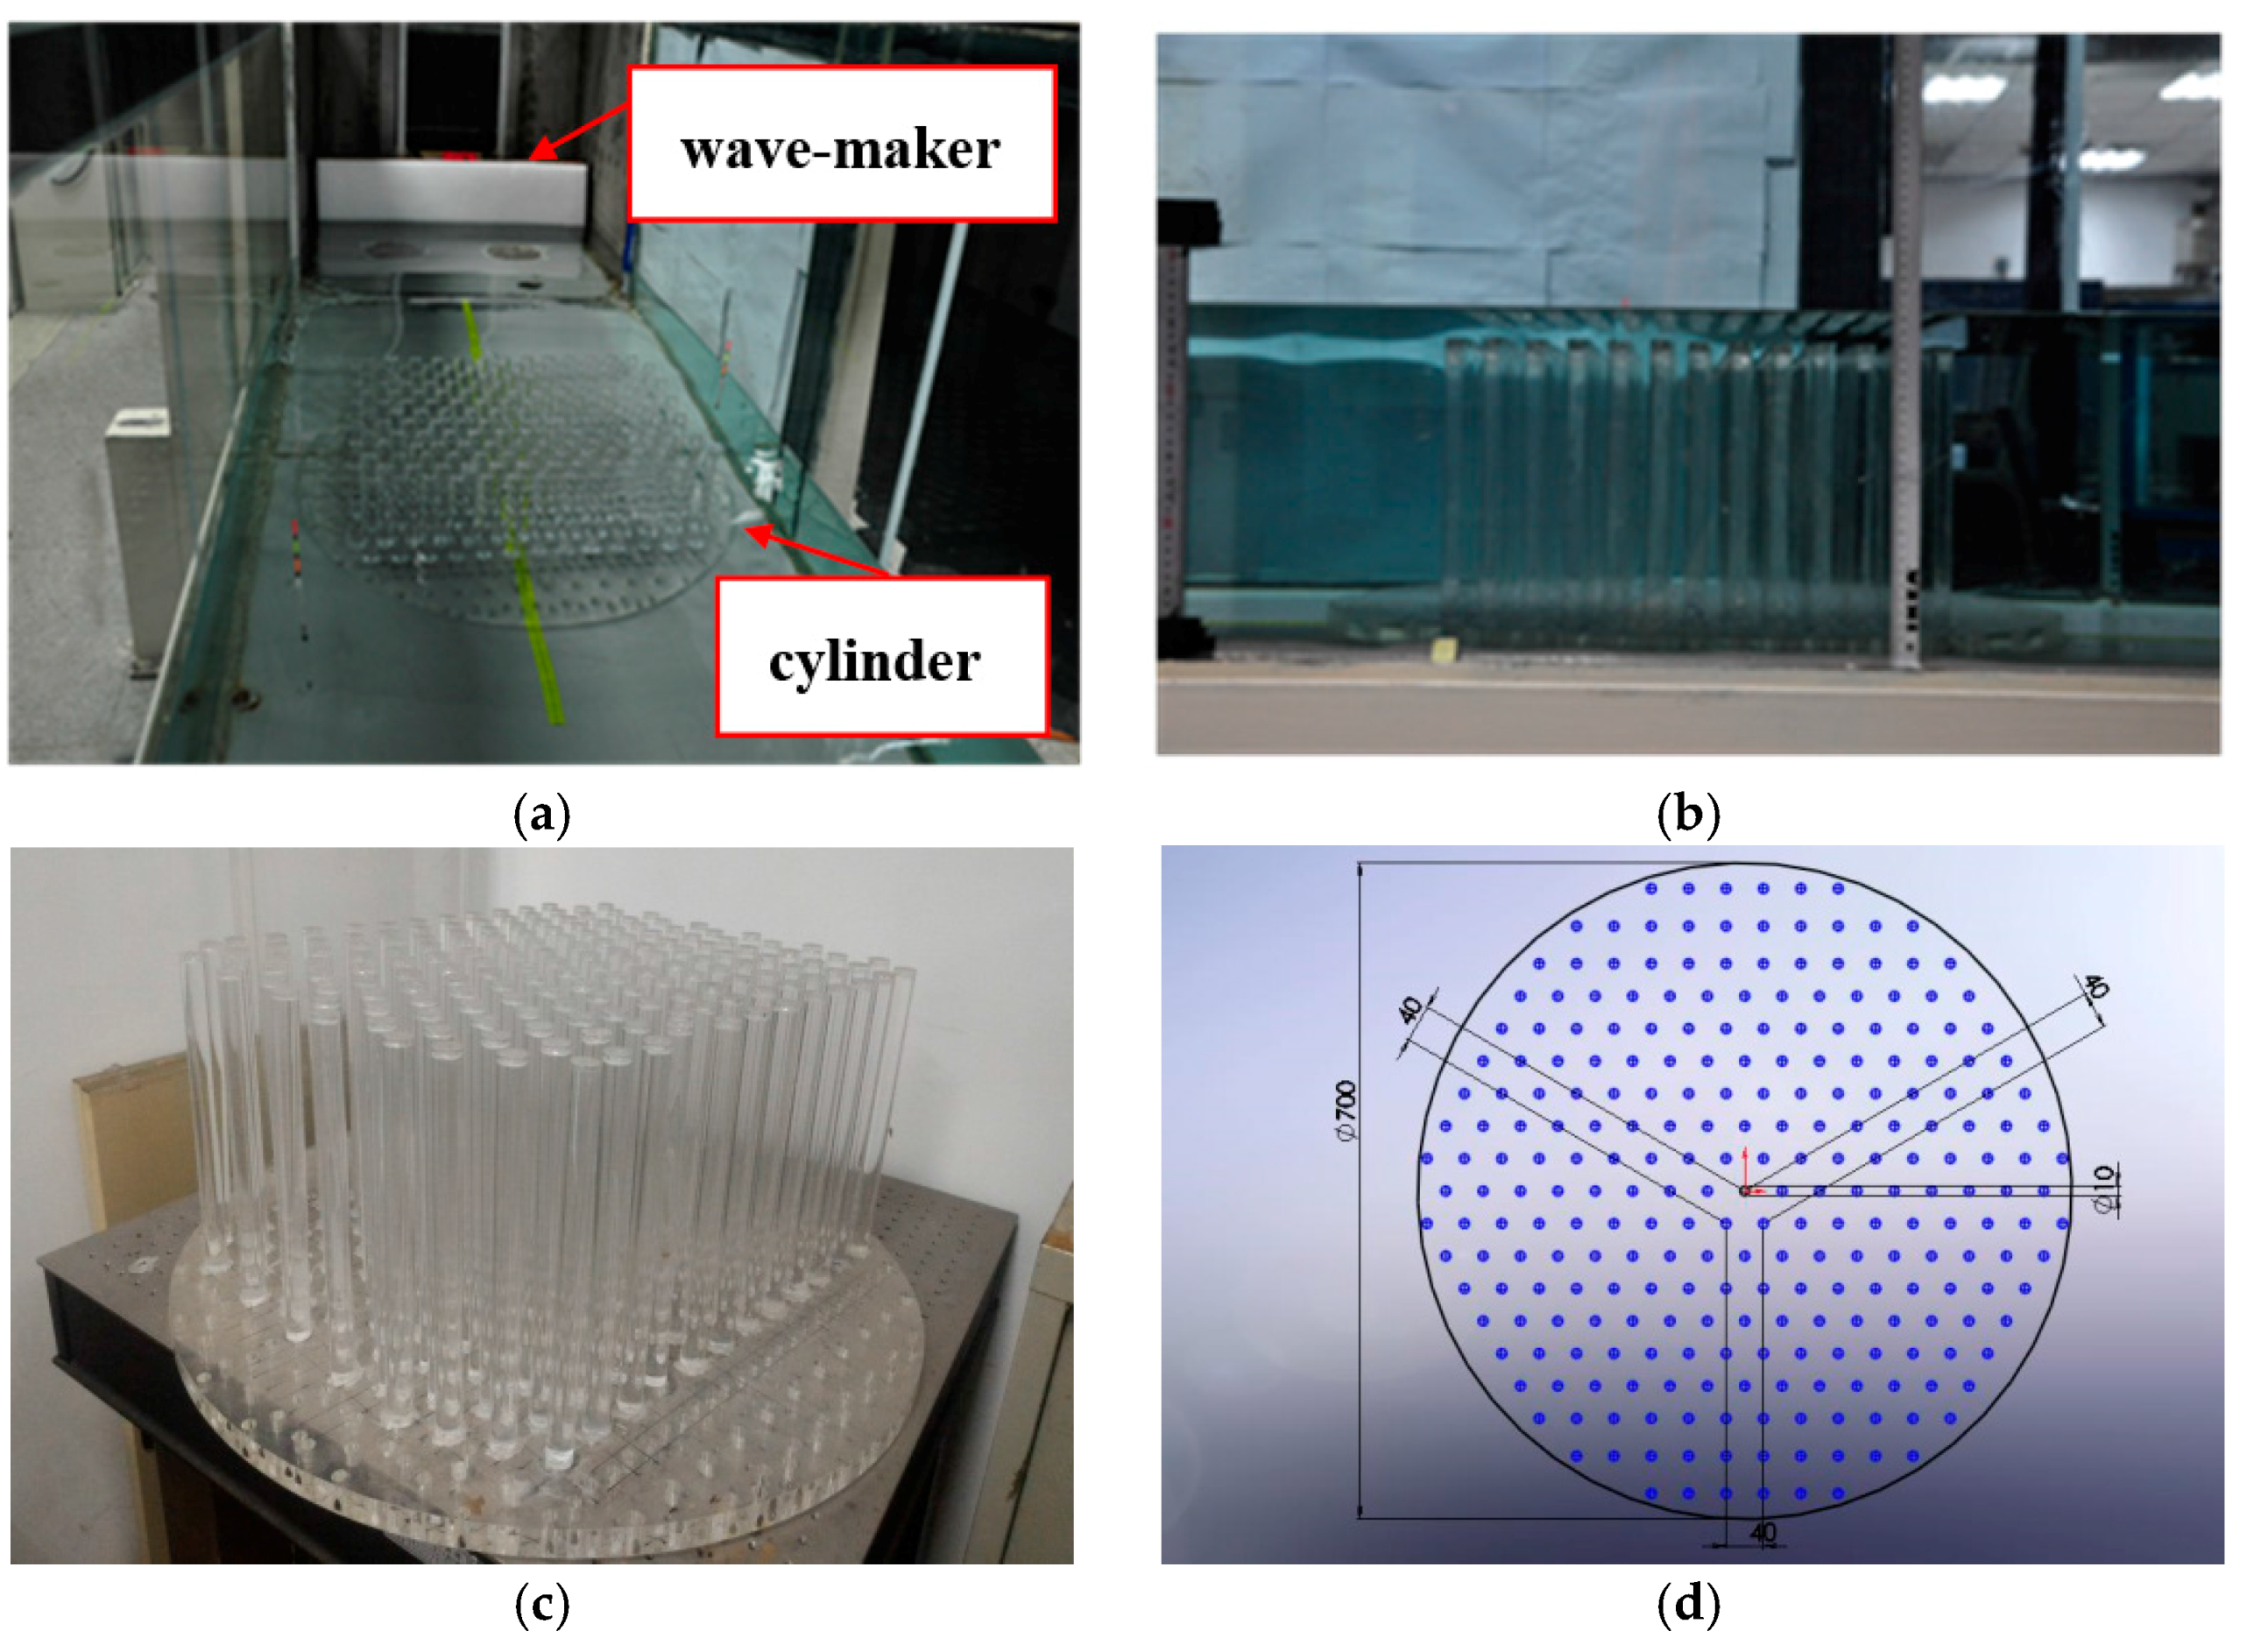
Figure 8.
(a) Water wave amplitude enhancement of the surface wave; (b) Comparison of the observed enhancement factor with theoretical results at the driving frequency 0.7 Hz.
Figure 8.
(a) Water wave amplitude enhancement of the surface wave; (b) Comparison of the observed enhancement factor with theoretical results at the driving frequency 0.7 Hz.


Table 1.
List of notations and units of the physical quantities used in this work.
| Notation | Definition | Units |
|---|---|---|
| r | Radius of cylinder | m |
| L | Length of cylinder | m |
| h0 | Mean water level | m |
| h | Water depth | m |
| v | Velocity vector | m·s−1 |
| p | Fluid pressure | kg·m−1·s−2 |
| ρ | Fluid density | kg·m3 |
| g | Gravitational acceleration | m·s−2 |
| ζ | Vertical displacement from the mean water level | m |
| pa | Atmospheric pressure | kg·m−1·s−2 |
| A | Cross-sectional area | m2 |
| H | Enhancement factor | none |
| a | Lattice constant | m |
| λ | Wavelength | m |
| c | Wave velocity | m·s−1 |
| fn | Normalized frequency | none |
| N | Number of grid | none |
Table 2.
Enhancement factor in triangular lattice.
| r/a | |||||||||||
|---|---|---|---|---|---|---|---|---|---|---|---|
| h0/h | 0.14 | 0.15 | 0.16 | 0.17 | 0.18 | 0.19 | 0.20 | 0.21 | 0.22 | 0.23 | 0.24 |
| 8 | 1.658 | 0.167 | 1.637 | 1.625 | 3.906 | 4.003 | 4.004 | 3.974 | 3.923 | 3.855 | 3.78 |
| 9 | 1.654 | 1.643 | 1.631 | 4.16 | 4.221 | 4.229 | 4.199 | 4.139 | 4.063 | 3.975 | 3.882 |
| 10 | 1.65 | 1.638 | 4.331 | 4.419 | 4.445 | 4.419 | 4.358 | 4.272 | 4.175 | 4.069 | 3.963 |
| 11 | 1.647 | 4.45 | 4.594 | 4.648 | 4.637 | 4.578 | 4.489 | 4.38 | 4.265 | 4.145 | 4.028 |
| 12 | 1.635 | 4.723 | 4.831 | 4.847 | 4.799 | 4.709 | 4.596 | 4.468 | 4.338 | 4.207 | 4.08 |
| 13 | 4.799 | 4.974 | 5.041 | 5.017 | 4.935 | 4.818 | 4.684 | 4.54 | 4.399 | 4.257 | 4.123 |
Table 3.
Enhancement factor in square lattice.
| r/a | |||||||||||
|---|---|---|---|---|---|---|---|---|---|---|---|
| h0/h | 0.14 | 0.15 | 0.16 | 0.17 | 0.18 | 0.19 | 0.20 | 0.21 | 0.22 | 0.23 | 0.24 |
| 8 | 0 | 0 | 0 | 4.219 | 4.257 | 4.252 | 4.211 | 4.144 | 4.065 | 3.976 | 3.876 |
| 9 | 0 | 0 | 4.42 | 4.488 | 4.492 | 4.452 | 4.379 | 4.284 | 4.183 | 4.077 | 3.962 |
| 10 | 0 | 4.597 | 4.694 | 4.722 | 4.689 | 4.615 | 4.514 | 4.396 | 4.277 | 4.157 | 4.029 |
| 11 | 4.712 | 4.876 | 4.937 | 4.923 | 4.853 | 4.75 | 4.624 | 4.487 | 4.353 | 4.221 | 4.084 |
| 12 | 5.001 | 5.129 | 5.149 | 5.092 | 4.99 | 4.86 | 4.713 | 4.56 | 4.414 | 4.273 | 4.128 |
| 13 | 5.271 | 5.354 | 5.332 | 5.235 | 5.104 | 4.951 | 4.787 | 4.621 | 4.465 | 4.316 | 4.164 |
Table 4.
Enhancement factor in hexagonal (K point) lattice.
| r/a | ||||||||||||
|---|---|---|---|---|---|---|---|---|---|---|---|---|
| h0/h | 0.14 | 0.15 | 0.16 | 0.17 | 0.18 | 0.19 | 0.20 | 0.21 | 0.22 | 0.23 | 0.24 | 0.25 |
| 13 | 1.552 | 1.525 | 1.495 | 1.469 | 1.44 | 1.411 | 1.376 | 1.369 | 1.363 | 1.354 | 1.347 | 1.343 |
| 14 | 1.547 | 1.519 | 1.485 | 1.417 | 3.128 | 3.131 | 3.07 | 2.984 | 2.894 | 1.652 | 1.335 | 1.332 |
| 15 | 1.541 | 1.511 | 2.72 | 3.346 | 3.301 | 3.232 | 3.148 | 3.053 | 2.958 | 2.853 | 2.649 | 1.322 |
| 16 | 1.529 | 3.349 | 3.482 | 3.462 | 3.394 | 3.308 | 3.211 | 3.107 | 3.004 | 2.897 | 2.798 | 1.304 |
Table 5.
Enhancement factor in hexagonal (M point) lattice.
| r/a | ||||||||||||
|---|---|---|---|---|---|---|---|---|---|---|---|---|
| h0/h | 0.14 | 0.15 | 0.16 | 0.17 | 0.18 | 0.19 | 0.20 | 0.21 | 0.22 | 0.23 | 0.24 | 0.25 |
| 13 | 1.718 | 1.776 | 1.829 | 1.873 | 1.905 | 1.923 | 1.935 | 1.922 | 1.906 | 1.868 | 1.828 | 1.769 |
| 14 | 1.767 | 1.834 | 1.894 | 1.944 | 1.98 | 1.998 | 2.008 | 1.991 | 1.969 | 1.923 | 1.877 | 1.807 |
| 15 | 1.823 | 1.901 | 1.968 | 2.026 | 2.064 | 2.08 | 2.087 | 2.065 | 2.036 | 1.982 | 1.928 | 1.847 |
| 16 | 1.885 | 1.975 | 2.05 | 2.114 | 2.153 | 2.169 | 2.174 | 2.142 | 2.109 | 2.043 | 1.981 | 1.89 |
Table 6.
List of optimization parameters and their ranges with enhancement factor of global maxima.
| Lattice | r/a | h0/h | fn |
|---|---|---|---|
| Triangular | 0.2~0.32 | 5~13 | 0.32~0.60 |
| Square | 0.14~0.34 | 4~13 | 0.33~0.64 |
| Hexagonal (K point) | 0.15~0.24 | 14~16 | 0.36~0.53 |
| Hexagonal (M point) | 0.16~0.23 | 14~16 | 0.33~0.44 |
© 2017 by the authors. Licensee MDPI, Basel, Switzerland. This article is an open access article distributed under the terms and conditions of the Creative Commons Attribution (CC BY) license (http://creativecommons.org/licenses/by/4.0/).
Share and Cite
MDPI and ACS Style
Chiu, S.-F.; Wang, J.-J.; Wang, S.-C.; Chao, S.D. Enhancement of Sea Wave Potential Energy with Under-Sea Periodic Structures: A Simulation and Laboratory Study. Appl. Sci. 2017, 7, 782. https://doi.org/10.3390/app7080782
AMA Style
Chiu S-F, Wang J-J, Wang S-C, Chao SD. Enhancement of Sea Wave Potential Energy with Under-Sea Periodic Structures: A Simulation and Laboratory Study. Applied Sciences. 2017; 7(8):782. https://doi.org/10.3390/app7080782
Chicago/Turabian StyleChiu, Shuo-Feng, Jyun-Jie Wang, Ssu-Che Wang, and Sheng D. Chao. 2017. "Enhancement of Sea Wave Potential Energy with Under-Sea Periodic Structures: A Simulation and Laboratory Study" Applied Sciences 7, no. 8: 782. https://doi.org/10.3390/app7080782
Note that from the first issue of 2016, this journal uses article numbers instead of page numbers. See further details here.