An Innovative Dual-Column System for Heavy Metallic Ion Sorption by Natural Zeolite


Department of Civil Engineering, Faculty of Engineering and Architectural Science, Ryerson University, Toronto, ON M5B 2K3, Canada
*
Author to whom correspondence should be addressed.
Appl. Sci. 2017, 7(8), 795; https://doi.org/10.3390/app7080795
Submission received: 7 July 2017
/
Revised: 1 August 2017
/
Accepted: 2 August 2017
/
Published: 5 August 2017
(This article belongs to the Special Issue Wastewater Treatment and Reuse Technologies)
Abstract
:This study investigates the design and performance of a novel sorption system containing natural zeolite. The apparatus consists of packed, fixed-bed, dual-columns with custom automated controls and sampling chambers, connected in series and stock fed by a metering pump at a controlled adjustable distribution. The purpose of the system is to remove heavy metallic ions predominately found in acid mine drainage, including lead (Pb2+), copper (Cu2+), iron (Fe3+), nickel (Ni2+) and zinc (Zn2+), combined in equal equivalence to form an acidified total 10 meq/L aqueous solution. Reported trends on the zeolite’s preference to these heavy metallic ions is established in the system breakthrough curve, as Pb2+ >> Fe3+ > Cu2+ > Zn2+ >> Ni2+. Within a 3-h contact period, Pb2+ is completely removed from both columns. Insufficient Ni2+ removal is achieved by either column with the promptest breakthrough attained, as zeolite demonstrates the least affinity towards it; however, a 48.97% removal is observed in the cumulative collection at the completion of the analysis period. The empty bed contact times for the first and second columns are 20 and 30 min, respectively; indicating a higher bed capacity at breakthrough and a lower usage rate of the zeolite mineral in the second column. This sorption system experimentally demonstrates the potential for industrial wastewater treatment technology development.
1. Introduction
Acid mine drainage (AMD) generated by industrial mines contains highly acidic wastewater and toxic heavy metallic ions (HMIs). These HMIs are a serious threat to human health and the environment [1,2,3,4,5], with their high solubility [6], as well as non-biodegradable and bio-accumulative properties [7,8]. If mines are abandoned, there is a risk of AMD contamination to both surface and groundwater, causing catastrophic damage to the ecosystem [4,9]. Therefore, the HMIs must be removed by advanced treatment methods prior to discharge [10,11,12], to abide by the effluent maximum allowable limits [7,8]. Due to the high site-to-site variability present in mines, mitigation feasibility can become a challenge [3], and a simple, resilient and cost-effective strategy must be developed [1].
Various industrial wastewater treatment methods include precipitation, electro-chemical remediation, oxidation and hydrolysis, neutralization, ion-exchange and solvent extraction, ion-exchange and precipitation, titration, bio-sorption, adsorption, reverse osmosis [4,9], and ultrafiltration [13]. Among these, sorption is a simple but promising treatment method [5,14], based on demonstrated industrial viability and effectiveness, cost efficiency and environmental sustainability [15,16]. The removal of HMIs is attributed to the mechanisms of both adsorption (on the surface of the sorbents’ micropores) and ion-exchange (through the sorbents’ framework pores and channels) [17]; and culminate in the unified process of sorption [18,19].
Zeolites hold great potential as naturally occurring minerals [1], and are recognized as effective materials for the removal of HMIs from industrial wastewater by sorption [20]. They have attracted a lot of researchers’ interests [11], due to its coexisting molecular sieve action, ion-exchange and catalytic properties [14,21]. The mineral zeolite is a hydro-aluminosilicate with a crystalline structure comprised of SiO4 and AlO4 tetrahedras linked by oxygen atoms, which form an open, homogeneous microporous three-dimensional framework creating voids and channels [21]. Clinoptilolite, a globally abundant and well-documented form of zeolite [13,20,22,23], is used in this research. Two of the most significant properties of zeolite are its high cation exchange capacity [23], and its selectivity of certain metals [24]. In addition to wide deposit distribution and low exploitation costs [7,25], zeolite is considered as a strong candidate for the removal of wastewater contaminants [26], especially those containing high HMIs from mine waste.
Currently, there is limited comprehension of the sorption by zeolite for waste with multi-component HMIs [24,27], in order to fully benefit from using it in tertiary treatment processes [1]. In particular, the composition of AMD waste contains numerous contaminants, which include HMIs and other pollutants, and the presence of these in solution affect the overall removal potential [3,18]. Research is needed on the simultaneous sorption of the multi-metallic components that are prevalent in industrial effluent, and to quantify uptake interference of these HMIs in combination [16]. Helfferich [18] (p. 201) points out that for multi-component systems, the exchange rate may vary for the various counter-ions of HMIs in solution, with the possibility that the concentrations of certain species in either the sorbent or solution may fluctuate prior to attaining its balanced state. The performance of columns or fixed-bed reactors (FBR) is convenient for industrial scale applications [7], which requires less investment and operational costs, and is more economically feasible than its discontinuous batch mode counterparts [8]. FBR columns have demonstrated performance efficiency in treating large volumes, and are frequently implemented in sorption studies. However, the removal of multi-component solutions of HMIs is complex due to ion competition, different affinity sequences, and zeolite selectivity. Its operations are affected by equilibrium (isotherm and capacity), kinetic (diffusion and convection coefficients) and hydraulic (liquid holdup, geometric analogies and mal-distribution) factors [28]. In practice, the influence of operative conditions on the overall system performance is not experimentally verified [17,29,30], but they are extremely important to large-scale development. Although the FBR system is highly valuable, its analysis is unpredictably multi-faceted [28,31] and even more so with the presence of numerous interfering ions. Complications due to ion competition and solute-surface interactions [4], as well as the unique affinity sequences and sorbent material selectivity [25], have been reported.
The authors have conducted a four-phase research project, consisting of the analysis of: (1) the effects of preliminary parameters and operative conditions (particle size, sorbent-to-sorbate dosage, influent concentration, contact time, set-temperature, heat pre-treatment), (2) heavy metallic ions component system combinations and selectivity order [32], (3) kinetic modelling trends [33], and finally in this current study, (4) the design of a packed fixed-bed, dual-column sorption system. The first three phases are conducted in batch mode, to which reveal a key trend among the HMIs selected as lead (Pb2+) >> iron (Fe3+) > copper (Cu2+) > zinc (Zn2+) > nickel (Ni2+). The findings of these preliminary phases have established a platform for the design of the sorption system in continuous mode, presented in this paper.
Existing column experimental designs involve various limitations, including:
- The evaluation of predominantly single- or dual-component HMI system combinations;
- The implementation of primarily slender column aspect ratios (i.e., bed depth/particle diameter, column height/diameter), causing a challenge to eventual scale-up design;
- The use of inconsistent and/or vague sorbent compaction techniques, and;
- The application of simple, idealized flow patterns (i.e., set single and continuous flow rate).
The objective of this paper is to develop a novel dual-column sorption system to overcome some of these shortcomings. Important design factors such as the zeolite compaction, column dimensions and aspect ratios, flow control, sampling and analytical procedure, will be taken into consideration. The exclusivity of this prototype is attributed to an automated, variable-flow configuration with a custom sampling technique. In contrast to most previous single-component sorption set-ups, this study evaluates the simultaneous sorption process by natural zeolite of the five most commonly occurring HMIs found in AMD, including Pb2+, Cu2+, Fe3+, Ni2+ and Zn2+. This paper will demonstrate the effectiveness and the removal efficiency in a continuous-flow FBR system over a 3-h duration from the dual columns, providing insights on HMIs selectivity and treatment system breakthroughs. It is envisaged that this research will provide much-needed information to the wastewater treatment industry for the design and implementation of innovative sorption technologies.
2. Experimental Design
2.1. Packed Fixed-Bed Column Design Considerations
When the concentration of the effluent reaches 5%–10% of the influent, this point on a typical S-shaped breakthrough curve is commonly referred to as the ‘breakthrough point’ or ‘breakpoint’ (BP). The point of column exhaustion (EP) is when the effluent reaches maximum capacity to 90%–95% of its influent value [12,34]. The efficiency of the column performance is related to the bed capacity at breakthrough and at exhaustion, represented by the following relationship [12,34]:
where is the column efficiency (degree of saturation), is the breakthrough capacity of the bed (in meq/g), and is the maximum capacity at exhaustion of the bed, defined by the total amount of HMI ions bound in the zeolite (or exchanged in the packed fixed-bed) (in meq/g).
The breakthrough capacity and equilibrium capacity are further expressed in Equations (2) and (3), respectively [12,34]:
where is the effluent volume collected up to breakthrough point (BP) (in L), is the effluent volume at which the exhaustion point (EP) is reached in the zeolite bed (in L), is the influent concentration (in meq/L), is the effluent concentration (in meq/L), is the packing density of the bed (in g/cm3), is the bed depth (in cm), is the bed cross-sectional area (in cm2), is the zeolite mass (in g); where and is the total amount of HMI ions removed up to BP and EP (in meq), respectively.
Empty bed contact time (EBCT) is the residence time (in min) a fluid element is in contact with the bed, and is related to the systems’ removal kinetics [35]. This is represented by the relationship between the bed depth () in the column and the feed solution velocity () [25,34], as given by:
Research conducted by Vukojevic Medvidovic et al. [34] demonstrates that the breakthrough curve results reveal that the flow through the column determines the EBCT; with the same initial concentration, the increase in flow rate decreases the contact time and increases the mass transfer zone (MTZ) height. The MTZ is the restricted area where the exchange process occurs, and is defined as the zeolite layer height between the equilibrium zone and the unused bed zone [34]; where the effluent concentration varies from 5% to 95% of the influent concentration [25]. As the HMI solution is fed through the packed fixed-bed, the MTZ moves in the direction of flow and eventually reaches the exit [12,34]. Peric et al. [36] distinctly demonstrates the importance of the column bed depth on the removal of lead from aqueous solutions. The results show that as the bed depth increases, a delay in breakthrough and exhaustion occurs, with an increase of the MTZ height. The higher the bed depth, the longer the service time at various breakthrough points due to the increase in binding sites on the sorbent material (zeolite mineral) [9]. Adequate wetting of the zeolite, and ideal contact time between the zeolite and solution interface are important for mass transfer and equilibrium conditions based on the selection of the flow rate and particle size. To minimize possible wall and axial dispersion effects in the fixed-bed column, the bed depth-to-particle diameter ratio (H/dp) must be greater than 20. At a higher H/dp ratio, the breakthrough point appears later and the curve is steeper.
The usage rate (, in g/L) determines the rate at which the sorbent would be exhausted and how often it must be replaced or regenerated, and is expressed in the following relationship [4,25]:
where is the zeolite mass in the bed (in g) and is the volume of the effluent treated at breakthrough (BP) (in L) [25]. Inglezakis [28] states that it is extremely difficult to model multi-component system interactions, as numerous time-consuming data are required and the process involves significant mathematical complexity. Breakthrough and exhaustion thresholds of specific HMIs within a fixed-bed are important for experimental specific conditions. In order to optimize the liquid-solid contact time and removal capacity, it is necessary to develop these relationships, between EBCT and usage rate [28].
2.2. Natural Zeolite Mineral
This study employs a natural zeolite mineral sample composed primarily of 85%–95% clinoptilolite (CAS No. 12173-10-3) and is sourced from a deposit located in Preston, Idaho [37]. The natural zeolite sample specifications are provided in Table 1, where typical elemental analysis indicates the presence of various elements, including Na+, Ca2+, Mg2+ and K+, as well as lead, copper, iron, and zinc. No significant concentrations of toxic trace elements are present in its composition, nor are trace metal elements water soluble. The low-clay content unique to this sample ensures good hydraulic conductivity, low dust content, and a harder and more resistant structure [37]. The zeolite mineral sample is applied in its natural state, without any chemical modifications, to minimize all associated costs and environmental impacts of this study. As suggested by the laboratory-scale packed bed system investigations by Inglezakis et al. [38], a zeolite fraction of 0.8 mm to 1 mm nominal diameter is recommended for the columns to ensure the full exploitation of the material but also to prevent considerable pressure drop during the analysis period. Therefore, the zeolite sample used for this research is obtained from standard mechanical mesh sieves set to a range of 0.841 mm to 1.19 mm (standard mesh −16 + 20) [27], resulting in a geometric mean diameter of 1.00 mm [39]. The sieved zeolite is exposed to a cleaning cycle, which involves rinsing in deionized distilled water to remove residual debris and dust, and drying at 80 ± 3°C for 24 h to remove any residual moisture [30].
2.3. Heavy Metallic Ion Solution
Due to a greater presence in various Ontario mine waste streams as presented by Wilson [40] and the strict limitations required by the Canadian Government [41], this study focuses on the presence of the heavy metallic ions of Pb2+, Cu2+, Fe3+, Ni2+ and Zn2+ [32,42]. The cations present in the sorbent have valences that differ from those in solution. Consequently, as the dilution increases, the selectivity of the adsorbent for the ion with a higher valence also increases. Accordingly, comparative analysis of various metal ions should be conducted at the same normality and temperature, in order to minimize the changes observed in isotherm configuration with dilution [43]. The synthetic metallic ion solutions are prepared from analytical grade nitrate salts in deionized distilled water, namely Pb(NO3)2 (CAS No. 10099-74-8), Cu(NO3)2·3H2O (CAS No. 10031-43-3), Fe(NO3)3·9H2O (CAS No. 7782-61-8), Ni(NO3)2·6H2O (CAS No. 13478-00-7), and Zn(NO3)2·6H2O (CAS No. 10196-18-6), respectively, and combined equally to maintain a total normality of 0.01 N (10 meq/L). The five metals in a multi-component system of 2.0 meq/L per metal correspond to concentrations of approximately 207 mg/L for Pb2+, 64 mg/L for Cu2+, 37 mg/L for Fe3+, 59 mg/L for Ni2+, and 65 mg/L for Zn2+, respectively. The NO3– anions in the aqueous solution do not influence the ion-exchange process, since they do not form any metal-anion complexes and do not hydrolyze in solution [13,44].
The uptake of multiple HMIs from aqueous solutions on natural zeolite is a complex process consisting of predominately ion-exchange and adsorption. At high initial concentrations, this process could be accompanied by precipitation and the metal ion hydroxo-complexes formed can be sorbed on zeolite surface sites that encompass different sorption affinity [13]. Research has demonstrated [26,43,45] that the sorbate solution acidity level affects the uptake of metals, and this is particularly the case for the HMIs that have low preference by zeolite. Such factors include the metal ion speciation and natural stability, as well as the electro-kinetic properties of zeolite in aqueous solutions. At a low pH level, the hydrogen cation (H+) is considered as a competitive ion to the HMI during the ion-exchange process [43]; evidently, the process is preferred at higher pH levels, which should be lower than the minimum pH of precipitation [10]. The pH level of the effluent solution decreases, depending on the metal removed. Therefore, the pH range under which sorption takes place should be specified [11].
The Canada-Wide Survey of Acid Mine Drainage [40] reports a seasonal average of a majority of the mines surveyed to have documented pH values ranging from 2 to 5. This present study is conducted in the conservative end of this range, with the influent stock acidified to a pH level of around 2 with concentrated nitric (HNO3) acid (CAS No. 7697-37-2) [46], to prevent precipitation of the metal ions [14,43]. With this low pH, however, the H+ ion competition is significant, and so the removals obtained are on the conservative side and are lower than would normally be expected in field installations.
2.4. Analytical Procedure and Quality Control
There are various atomic spectrometry techniques, which include Flame Atomic Adsorption (AA), Graphite Furnace AA, and Inductively Coupled Plasma Mass Spectrometry (ICP-MS). In particular, the Inductively Coupled Plasma—Atomic Emission Spectroscopy (ICP-AES) technique permits the complete atomization of the elements in a sample. This feature minimizes the potential for chemical interferences. It is considered as a true multi-element technique with exceptional sample throughput, and with a very wide range of analytical signal intensity [47]. Therefore, the HMIs are analyzed in their aqueous phase by ICP-AES technology (Optima 7300 DV, Part No. N0770796, Serial No. 077C8071802, Firmware Version 1.0.1.0079; Perkin Elmer Inc.; Waltham, MA, USA); with corresponding WinLab32 Software (Version 4.0.0.0305). The analyte primary wavelengths of each HMI element targeted were selected as 327.393 for Cu, 238.204 for Fe, 231.604 for Ni, 220.353 for Pb, and 206.200 for Zn, respectively; on the basis that these wavelengths have the strongest emission and provide the best quantifiable detection limits (QDL). Analysis is conducted with a plasma setting in radial view (to concentrations of greater than 1 mg/L), with QDLs of 0.05 µg/mL for Cu, Fe, Ni, and Zn, and 0.10 µg/mL for Pb. The spectrometer settings involve auto sampling of 45 s normal time at a rate of 1.5 mL/min, and a processing setting of 3 to 5 points per peak with 2 point spectral corrections. The calibration curve is generated ‘through zero’ by applying a stock blank and a multi-element Quality Control Standard 4 with 1, 10, 50, 90, and 100 mg/L concentrations (as per Standard Methods Part 3000) [46]. In comparison to the ‘linear calculated intercept’ calibration method, only a 0.15 mg/L (or 0.66%) maximum discrepancy is observed among all average concentration values, demonstrating an accurate overall calibration. In addition, the median 50 mg/L calibration standard is applied as a check parameter, with the intent to ensure a higher accuracy of all experimental measurements. Triplicate readings and their mean concentrations in calibration units are generated in mg/L by the corresponding WinLab32 Software. The sorbed amount of HMI is calculated from the difference between the starting concentration and its concentration in the 0.45 µm filtered samples’ supernatant.
During every ICP-AES analytical session, several quality control methods are applied, and evaluated by three check parameters to assess the calibration quality [48]. Firstly, the percent relative standard deviation (%RSD) reports an average of 0.433%, which is well within the <3% limit recommended. The triplicate concentration of the median standard has an average value of 49.26 mg/L, and is within 5% of the known value. Finally, the correlation coefficient of each HMI analyte primary wavelength reports an average of 0.999977, which is very close to unity. Therefore, the data is relatively accurate, highly reproducible, and the experimental replicates are reliable based on the calibration relationship established.
The multi-component stock is created by diluting the respective HMI nitrate salts of three 1-L stock solutions, acidified to a pH of 2.0 ± 0.1, and then re-combined. These 3 stocks (denoted as X, Y, Z) are diluted by one 50% step to be within the 0–100 mg/L calibration range, analyzing each separately and combined (denoted as M). The consistency in stock preparation is demonstrated in Table 2. The average diluted concentrations of the X, Y, and Z influent stocks for Cu2+, Fe3+, Ni2+, Pb2+, and Zn2+ are 70.15, 39.25, 61.18, 216.02, and 66.54 mg/L, respectively. The diluted concentration of the M influent stock for Cu2+, Fe3+, Ni2+, Pb2+, and Zn2+ are 70.22, 39.21, 60.48, 213.22, and 65.98 mg/L, respectively. A maximum difference of 2.80 mg/L, equivalent to 1.3%, is detected for the Pb2+ stock. Also, the corresponding HMI concentrations in mg/L are comparable to the theoretically expected values, based on the selected total 10 meq/L initial concentration; only a 0.05% difference between the average of all initial concentrations of the theoretical and combined M stock is detected. Overall, this demonstrates that strong quality control has been implemented.
2.5. Sorption System Design
Based on qualitative observations, the uptake of counter-ions in a continuous column system is favoured by various factors, including: a strong preference of the zeolite for the HMI counter-ions in solution, low concentration of HMI counter-ions, small and uniform particle size, high volume capacity and low degree of cross-linking, elevated temperature and low flow rate, as well as a high column height or aspect ratio [18] (p. 427). With this is mind, the apparatus development considers an extensive material and equipment selection process, with numerous stages of optimization in order to maintain flow continuity and repeatability. The final design was adopted in consideration of the following factors:
- Zeolite Compaction Technique
- ○
- Regulated Layers of Dry Mass
- ○
- Systematic Tampered Compaction
- Column Dimensions
- ○
- Modular Design
- ○
- Internal Diameter (1 in)
- ○
- Sorption Column Height (1 ft)
- Flow Configuration
- ○
- Upflow Distribution
- ○
- Dual-Column Series Connection
- ○
- Methodical Flow Rate Variability
- Pump Type
- ○
- Diaphragm Metering
- Sampling Method
- ○
- Automated Mode Controls
- ○
- Customized Sampling Chambers
- ○
- Modes’ Interchange in Five (5)-minute Intervals
- Analysis Period
- ○
- Three (3)-hour Contact Period
Based on these critical parameters, the sorption system design is finalized. Figure 1 is a schematic representation of the constructed prototype, detailing the flow paths through the system. The fundamental components include:
- HMI Multi-Component Influent Stock
- Metering Pump
- Silicon Tubing and Polyvinyl chloride (PVC) Connections
- Check Valves
- Automatable Solenoid Valves (symbol S)
- Packed Fixed-Bed Sorption Columns
- Custom Sampling Chambers
- Sampling Ports
- Effluent Collection Basin
2.5.1. Column Dimensions
The column is made of a circular section of clear PVC SCH-40 pipe (Part No. r4-1000; Fabco Plastics; Maple, ONT, Canada), 30.48 cm in height with 2.61 cm internal diameter. In order to minimize potential effects of wall and axial dispersion in the columns, the bed depth-to-particle diameter ratio should be kept greater than 20 [36]. Using the average nominal zeolite diameter of 1.00 mm as a reference, this ratio works out to be over 300 for the design. The cleaned and dry zeolite particles are added to the column at nine layers applied at 20-mL or 16.9 g amounts. Each layer is compacted with medium force, pounding six times with a customized PVC plunger of a diameter equal to the internal diameter of the column; such that the column height and the zeolite bed depth are equivalent. Inert plastic mesh with a smaller size than the minimum zeolite particle gradation of 0.841 mm is used to contain the zeolite material, and to permit sample flow through the columns. This mesh is set at each end of the column, within the two halves of a PVC SCH-80 socket union fitting incorporating a viton o-ring (Part No. 897010; Fabco Plastics; Maple, ONT, Canada), connected to a nominal 1 × 1/2-inch PVC SCH-40 reducer bushing (Part No. 438130 (slip × FPT); Fabco Plastics; Maple, ONT, Canada). All components are connected to 1/4-inch silicon tubing and with corresponding adapters and nipples fittings.
2.5.2. Flow Rate and Configuration
As a dual-stage system, the two columns are connected in a serial-flow arrangement, such that the first column receives the original stock with a higher HMI concentration and the second column receives the effluent from the first column. The upflow configuration ensures an overall better quality of flow, with a low liquid hold-up and a good stock feed distribution across the column cross sectional area. In contrast, for the downflow mode, an increase in pressure drop and flooding of the column bed is more probable [28]. Consequently, the stock is fed in an upflow direction to ensure proper and thorough distribution to the column beds and to minimize the need for backwashing and head loss effects.
A critical parameter in the design process is the flow rate. Existing research demonstrates that lower flow rates result in high detention times in the column, which is needed due to the relatively slow uptake rate of zeolite [24,27]. The HMI solution volume element is in contact with a given zeolite bed layer for only a limited period of time. Consequently, equilibrium is not usually achieved and thereby results in a lower overall uptake of HMIs from the influent stock solution. Preliminary testing involved a peristaltic pump, using the corresponding silicon rubber tubing. Significant back pressure was observed and the capacity of the peristaltic pump was hindered. Consequently, the required flow rate was unachievable; the rotational speed and strength decreased for the feed to completely traverse through the entire system. Subsequently a diaphragm-type metering pump (No. 950218125-C Plus, max 45-LPD, 80-psi, 125-AC, 50/60-Hz; PULSAtron; Punta Gorda, FL, USA) is employed in the final design, which mechanically facilitates the desired stock feeding rate. Based on the 45-LPD (31.25 mL/min) capacity of the metering pump, preliminary flow rate testing of the pump set to 100% stroke (mechanically pumped volume) and 50% rate established an initial, repeatable, point-of-reference flow rate of 6.36 ± 0.32 mL/min. This stroke-rate setting is maintained and is comparable to the lower end of the 6–18 mL/min range recommended by Inglezakis et al. [24,27], to provide sufficient detention time in the system.
2.5.3. Sampling Method
Another critical component to the design is the sampling method, and how to maintain continuous flow through the system while sampling the effluent of both columns. Due to the relatively slow feeding rate, the time to collect the desired sample volume for dilution and ICP-AES analysis would require residual sample volume and minutes of valuable contact time. Three-way solenoid valves (No. 00457979, 0124-C, 1/8-FKM-PP, NPT-1/4, max 145-psi, 24-V, 60-Hz, 8-W, 38-mL; burkert; Ingelfingen, Germany) are implemented to ensure that while a sample volume is collected at the desired sampling time, both columns would still be fed continuously. The MODE valves and custom fabricated rotating 30-mL sampling chambers are attached to the top exit of each sorption column, with accessible sampling ports. A second three-way solenoid VENT valve is included at the exit of each sampling chamber to introduce an air vent to assist in rapid sample extraction by preventing vacuum pockets within the sample chamber and discharge tubing. A multi-turn valve is included at the exit of the vent for the first column to introduce minor back pressure similar to that of the second column, so as not to alter the flow characteristics through the first column. Check valves are placed at critical locations throughout the hydraulic circuit to prevent back flows.
2.5.4. System Modes of Operation
The sorption system presented in this paper is comprised of three distinct modes of operation that are controlled by the MODE valves for each column:
- Mode-I
- ○
- Sorption System Activation
- ○
- Fill Sorption Column 1 and Sample Chamber 1
- Mode-II
- ○
- Flow Circulation through Sorption Columns 1 (C1) and 2 (C2)
- ○
- Detour of flow to Sampling Chambers 1 (SC1) and 2 (SC2)
- ○
- VENT Valve Activation for Sample Collection
- Mode-III
- ○
- Flow Rate Division
- ○
- Concurrently ‘Pulse’ Fill Sampling Chambers 1 and 2
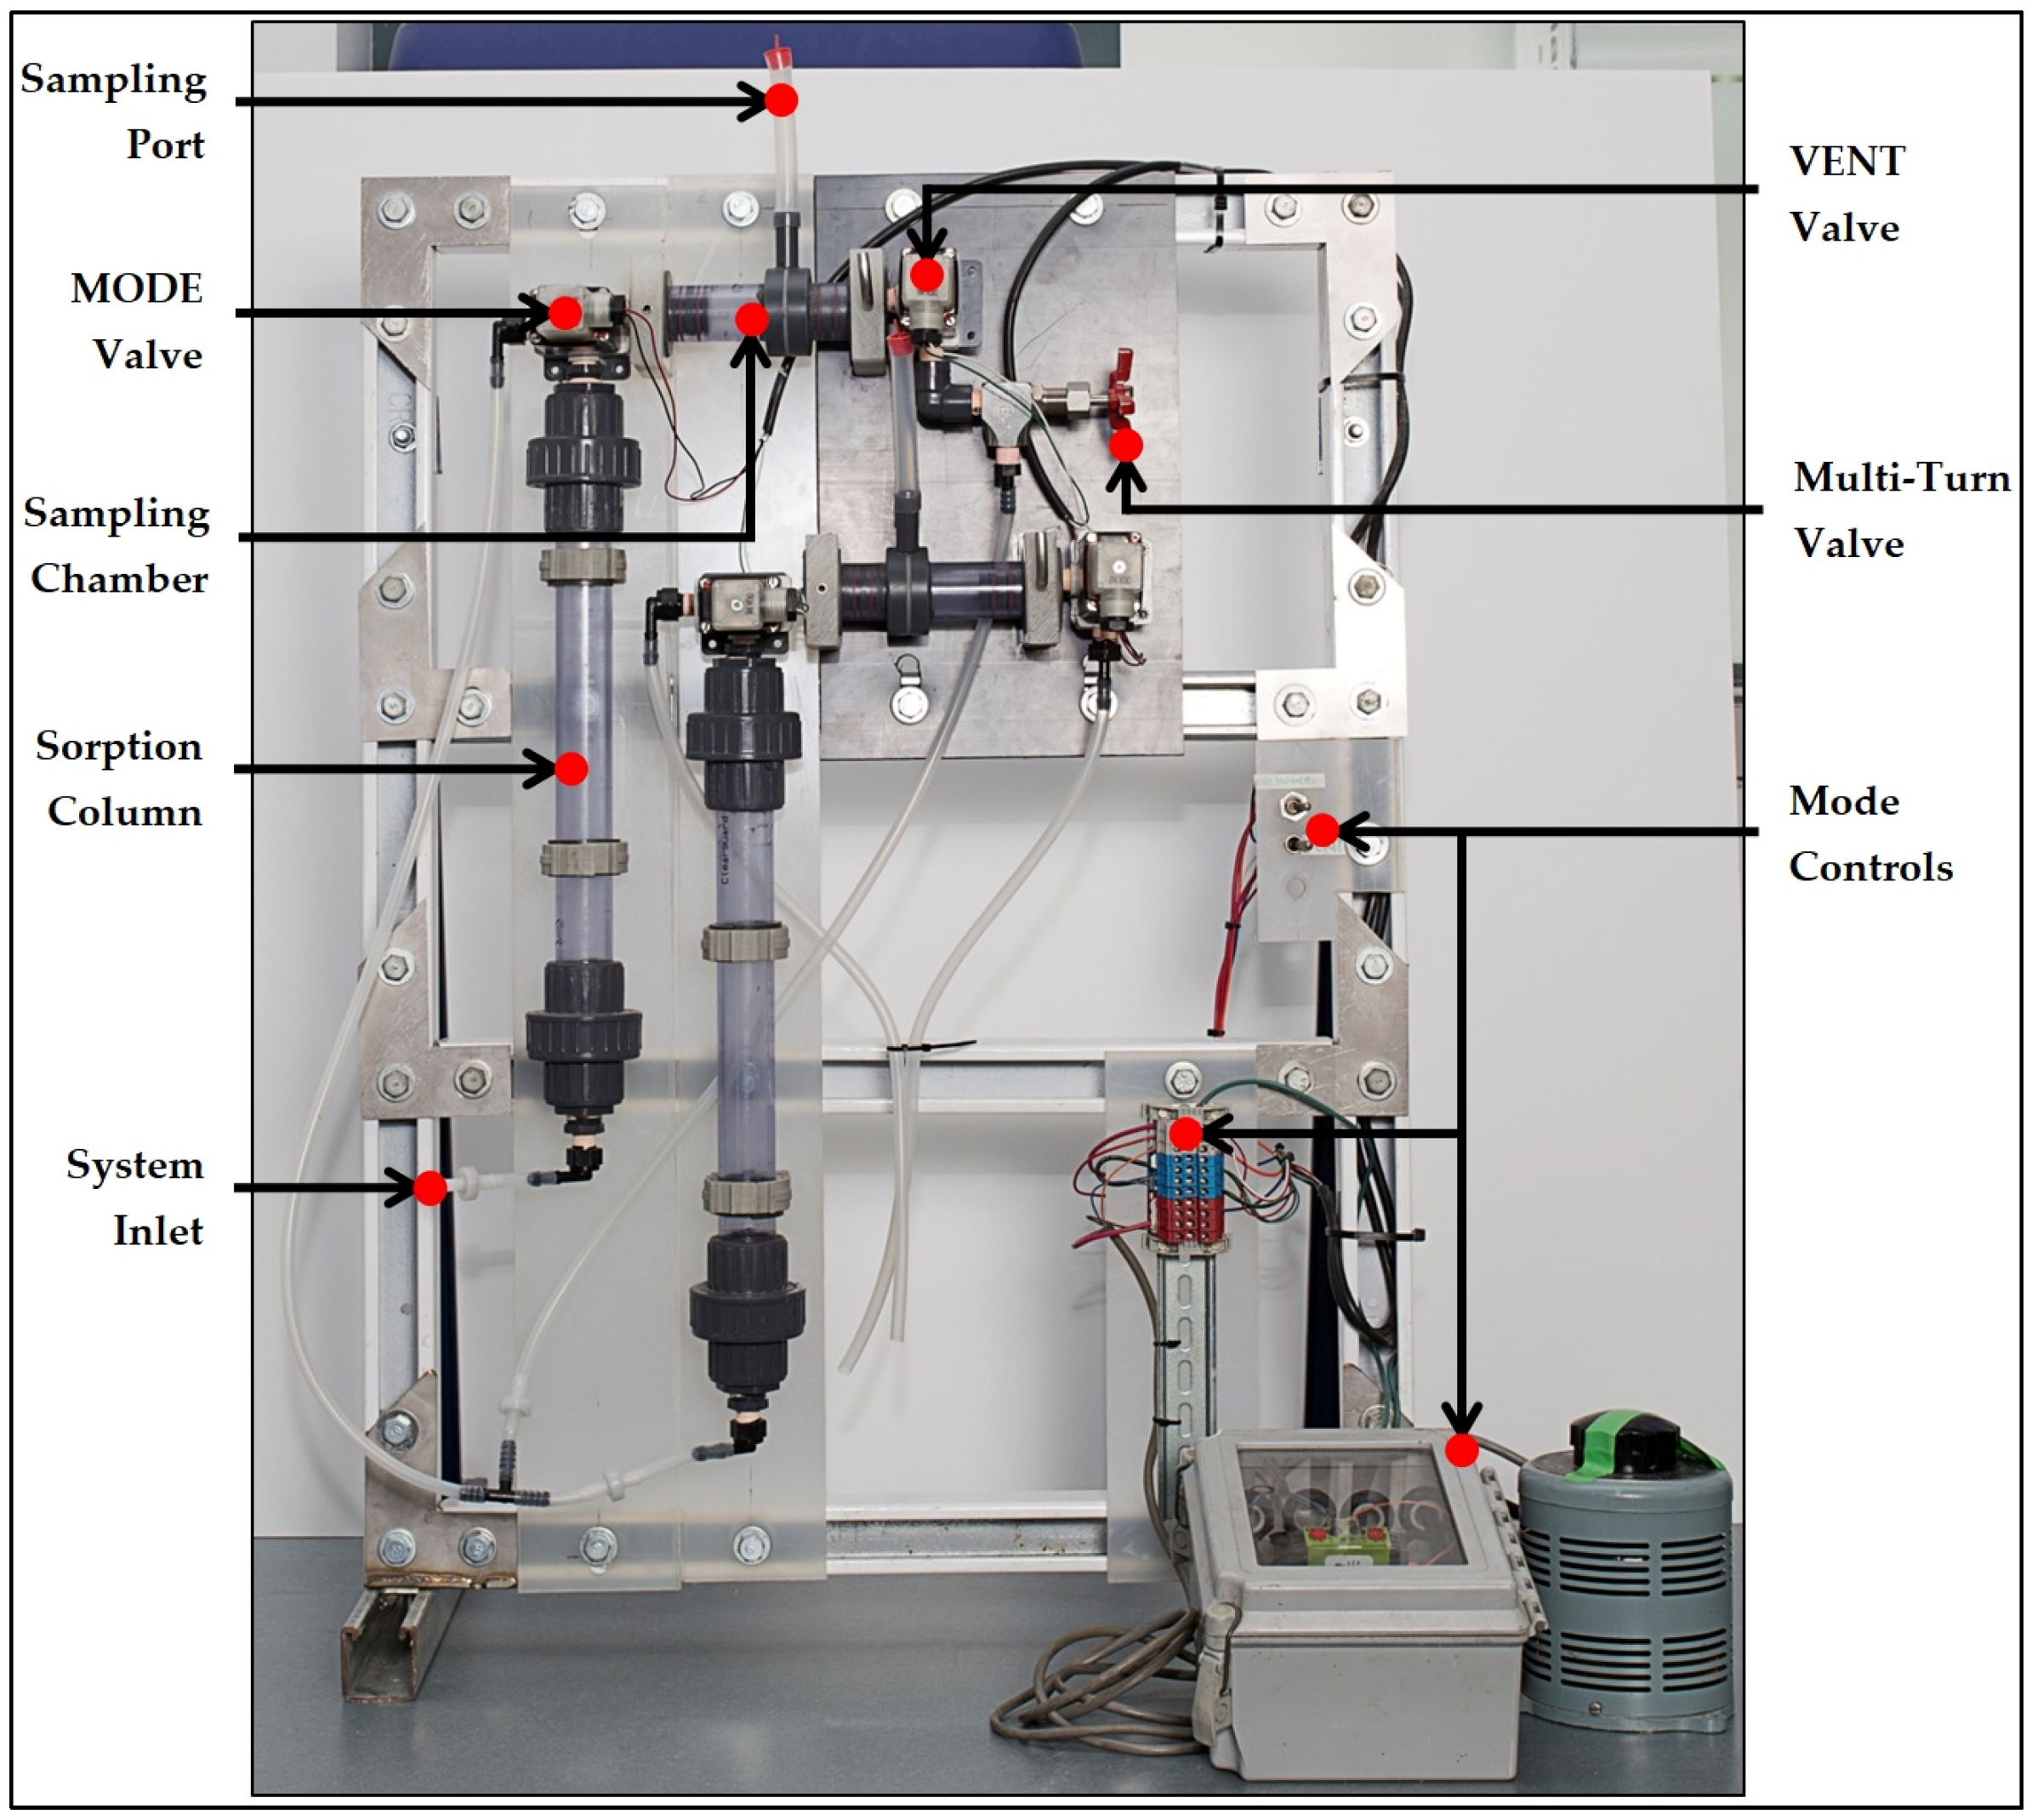
Figure 2 presents the arrangement of the prototype components, including an adjustable bi-stable timer which determines the time division modulation of the MODE and VENT solenoid valves.
Activating the process in Mode-I, the fluid element is mechanically pumped from the acidified 3-L multi-component influent stock. Once the pump is turned on, the inlet tubing is primed with the influent stock and passes the column check valve at the system inlet. The fluid element passes through the mesh-union fitting and reaches the base of the first column (C1), and traverses up through the sample chamber entry solenoid valve to the first sampling chamber. Once the 30-mL sample chamber is filled, the fluid element begins to drip at its exit against the multi-turn valve, which is an indication to switch the sample chamber entry solenoid MODE valves to Mode-II using the automated mode controls.
In Mode-II, the fluid element by-passes the first sampling chamber (SC1), continues to traverse through column 1 (C1) and begins to fill column 2 (C2). The fluid element does not cross-circuit back towards the exits of first column, due to the additional check valves connection located at the entry of the second column. While the fluid element traverses up both columns C1 and C2, the sampling chamber exit solenoid VENT valve is switched from closed to open. The sampling port tube is uncapped, twisted using the custom rotating handle and inverted to draw a 30-mL sample. The VENT valve is then turned off (closed from atmosphere). It is important to note that the inlet-outlet offset of the sampling chambers guarantees a highly repeatable sample volume. It is designed to minimize cross-contamination, for when the chamber is rotated from the vertical upward (sample collection in Mode-III) to downward (sample dispense in Mode-II and VENT) position, the chamber contents are completely void.
Once C2 is filled, both MODE valves of the sampling chambers are switched from Mode-II to Mode-III. The fluid element now simultaneously traverses through C1 and C2, while filling SC1 and SC2, dividing the flow rate and maintaining a continuous flow through the system. Once both sampling chambers are filled, the MODE valves are switched from Mode-III back to Mode-II, such that the fluid element by-passes the sample chambers and only traverses through the columns. At this time, the VENT valves are switched from closed to open, and the samples are taken from the sampling ports of both SC1 and SC2. Once both samples are collected, the VENT valves are closed and the MODE valves are once again switched back to pulse in Mode-III until SC1 and SC2 are filled. This sequence is repeated at approximate 5-min increments between Mode-II and Mode-III, for a total analysis period of just over 3-h. The prototype is secured to a sturdy, level frame that includes supporting clamps for the packed fixed-bed columns and a removable sampling chamber lock mechanism for maintenance accessibility.
It is important to note that the sample chambers are fabricated to a 30-mL capacity, to ensure that the 25-mL required volume is attained, to be filtered for dilution in preparation of ICP-AES analysis. This influences the time to collect the sample volume, based on the selected pump flow rate of this study. Also, the spacing of the prototype components influences the tubing connection lengths. The dual-column sorption system design presented in Figure 1 and Figure 2 provides the opportunity to analyse higher flow rates and/or prolonged sample collection in Mode-III in future research endeavours.
3. Results and Discussion
3.1. Preliminary Batch Mode Results
Detailed analysis on the selected HMIs of this study was conducted by Ciosek and Luk [32,33] in batch-mode configuration, consisting of a synthetic nitrate salt solution at 10 meq/L total concentration, acidified to a pH of 2 by concentration HNO3 acid, with a zeolite dosage of 4 g per 100-mL HMI solution. The aqueous solution is agitated within a contact period 180 min by means of a triple-eccentric drive orbital shaker operating at 400 r/min set to 22°C. The five (5) HMIs were methodically combined in single-, dual-, triple-, and multi-component systems. Elemental analysis by ICP-AES concludes that after 3 contact h, a total HMI uptake of 0.0986 meq/g is achieved the multi-component system. The percent removal of Pb2+, Cu2+, Fe3+, Ni2+ and Zn2+ are 94.0%, 21.9%, 56.2%, 9.10%, and 16.5%, respectively. The zeolite’s preference among the HMIs is demonstrated by the selectivity series, which is established as Pb2+ >> Fe3+ > Cu2+ > Zn2+ > Ni2+. One of the objectives of this current study is to investigate how these HMIs interact and affect the removal uptake in a continuous flow, dual-column settling.
3.2. Automated Column Sorption System
3.2.1. Sampling Sequence and Flow Rate
Table 3 provides the timeline of modes in the system set-up sequence. Once the inlet tubing and check valve are primed, the pump starts to fill the inlet connection cavity. At full flow rate in Mode-I, it requires approximately 8:39 min:s to travel from the base to the top of column 1 (C1). After approximately 3:40 min:s, sample chamber 1 (SC1) is filled, and Mode-II (circulation) is initiated while the first sample (C1-A) is collected. In the continuous flow of Mode-II, and it requires approximately 8:27 min:s for the flow to travel from the base to the top of column 2 (C2). The flow is then switched to Mode-III (pulse), which divides the flow to fill both sample chambers SC1 and SC2. Once the 30-mL volumes are filled, Mode-III is switched back to Mode-II and the samples C1-B and C2-B are collected at 42:50 min:s.
Once the system is set-up, there is an orderly switch between Mode-II (circulation) and Mode-III (pulse). Table 4 summarizes this sampling sequence. Altogether, there are twenty-nine 30-mL samples collected throughout the analysis period. During the system set-up, the collection of the first sample (C1-A) is followed by the second column 1 sample (C1-B) and first column 2 sample (C2-B). The orderly sequence begins at the collection of Cx-1 (48:04 min:s), for a total of two samples for each of the thirteen (13) runs. A total waste (TW) sample in the collection basin of the sorption system is also collected half-way through sampling (115:45 min:s) and at the end of the analysis period (195:00 min:s). The final influent stock and total effluent volumes are approximately 1.45-L and 550-mL, respectively.
The flow patterns are continuous and methodically kept consistent throughout the analysis period. Once samples C1-B and C2-B are collected, an average time of 6:26 min:s passes to switch from Mode-III to Mode-II, and 5:05 min:s from Mode-II to Mode-III. When the flow is divided in Mode-III, the average sampling acquisition time of 6:19 min:s is required to fill the 30-mL chambers, which is then collected for the filtering and dilution of the 25-mL sub-sample. The adjustable bi-stable timer at an approximate 50% duty setting automatically toggles the pulsing in Mode-III, to maintain a relatively consistent division of flow between the two columns, creating partial diversion to the two sampling chambers. This is demonstrated in relation to the start and end times of the sampling sequence.
It is important to note that the first sorption column (C1) receives a continuous inlet flow rate, as observed by the Mode-I filling rate of 8.18 mL/min for SC1 sample C1-A. Immediately after SC1 is filled and before 30-mL collection, the switch to Mode-II diverts the flow to begin filling the second sorption column (C2). Once both columns are filled, the flow is divided in Mode-III at the top outlet of C1, between SC1 and SC2, while maintaining consistent contact throughout the system. Again, during Mode-III, C1 receives the same inlet flow rate, but the sampling chambers SC1 and SC2 receives this division of flow. It is column C2 that receives a variable flow rate during the analysis period, set by the adjustable division timer. Based on the filling start time (36:40 min:s) of C1-B and C2-B, and the end time of collection (192:36 min:s) for C1-13 and C2-13, a geometric mean flow rate between Mode-II and Mode-III in C2 is established as 5.39 mL/min. With these unique flow rates recognized for both columns, their corresponding EBCTs are established by Equation (4) to yield:
Due to the relatively slow kinetics of zeolites, long residence times are required. Any solution volume-element in contact with a given zeolite bed layer is for only a limited time period, which is usually insufficient to reach the equilibrium state. The failure of zeolite to attain local equilibrium causes a lower uptake of HMIs from solution [11]. The detention time that the fluid element is in contact with the fixed-bed per sorption column is a result of the flow rate selected in this present study. This trend between the columns provides insight into the overall treatment availability of the zeolite material in this very unique configuration.
3.2.2. Acidity Levels
Natural zeolites are known to raise the pH level in acidic aqueous solutions, which is due to: (1) the ion-exchange of H+ ions, (2) the binding of H+ ions to the Lewis basic sites linked to the oxygen atoms in the zeolite framework, and (3) the OH− ions in solution deriving from hydrolysis of some species present in the zeolite [11]. The pH level of the aqueous solution controls the overall sorption process; adsorption of the HMI at the solid–water interfaces as well as the ion-exchange of cations within the zeolite structure. Stylianou et al. [10] points out that for all minerals, a decrease in the ion-exchange capacity of HMIs occurs for a pH range of 1 to 2. However, very low pH levels may positively influence the sorption process with the hydrolysis of the HMIs in solution [10]. Table 5 presents the pH levels of the effluent for both columns, of equally distributed selected time-step checkpoints of Cx-3, Cx-6, Cx-9, and Cx-13. When the acidified influent stock is combined to a 3-L volume, the average multi-component MM pH level has a value of 1.90. By maintaining a very low initial pH level and the use of highly soluble nitrate salts, the precipitation of the HMIs is avoided. Additional trials verified that the filtered and unfiltered HMI influent stock concentrations are the same, indicating both effective dilution practices and complete solubility.
As the sample traverses through the first column C1, the H+ ions are captured by the zeolite, resulting in an increase in the pH level to 6.34 from the first sample C1-A. There is an interesting observation between the columns’ pH levels, which is a direct reflection of the zeolite’s removal capacity for both the HMIs of interest and the competitive H+ ions in solution. The pH level gradually decreases in both columns, with the levels of C2 being slightly greater than that of C1. The total waste (TW) collects in the effluent basin throughout the analysis period, and its pH level decreases from the half-way check point of 6.05 (115:45 min:s) to 5.44 at the final collection (195:00 min:s). This is a clear indication that the zeolite capacity is becoming exhausted for the competing H+ ions, as well as hindering the sorption process of the HMIs.
Research conducted by Vukojevic Medvidovic et al. [34] also demonstrated that the pH values changed during the uptake process, following the opposite shape of the typical breakthrough curves. At breakpoint, a drastic change in the pH value occurred, which corresponded with a rapid Pb2+ concentration increase. The maximum pH level is reached at the breakthrough point, due to the absence of HMIs in the effluent. The minimum pH level is reached at the exhaustion point, due to the increase of the concentration of HMIs in the effluent and due to their hydrolysis in solution. After the exhaustion point, the pH level is constant [12]. These findings suggest that the continuous monitoring of pH levels is important and considerably contributes to the prediction of breakthrough and exhaustion points [11,12,34]; in order to monitor the progress of the service life and inevitably regeneration (adsorption/desorption cycles), both of which are very significant for practical industrial applications [34].
Also, the pH level may influence the ionization degree of the sorbate (HMI solution) and the surface property of the sorbent (zeolite mineral) [44]. The structural stability of the sorbent should not be compromised; for once the pH level reaches below 1, the structure of clinoptilolite breaks down in a process termed ‘dealumination’. Precipitation should be avoided, for once the ions of interest have precipitated they cannot be sorbed [43]. It should be noted that while low pH levels prevent precipitation, the competitive H+ ions present would hinder the sorption of HMIs. Therefore, it is to be expected that future field installations for the treatment of AMD (with typical pH range of 2 to 5 [40]) should potentially demonstrate even higher removal efficiencies. However, care should be taken in the design of industrial applications to incorporate pre-treatment processes to reduce particulates prior to applying the waste to any sorption system, to avoid flow obstruction in the sorption columns.
3.2.3. Hydraulic Conductivity Considerations
Following HMI uptake analysis, the columns are drained to sit overnight. The standard test method for permeability of granular soils (constant head) (ASTM 2434-68) [49] is adopted to determine the variance in the overall hydraulic conductivity between the sorption columns. The hydraulic coefficient of permeability is given by adapting the standard test in the following relationship:
where (in cm/s) is the coefficient of permeability, (in cm3) is the quantity of water that has discharged from the column and collected, L (in cm) is the column height, A (in cm2) is the column cross-sectional area, (in cm) is the constant head of water on the column or the vertical distance between the feed head level and the column overflow level, and (in s) is the time required to collect the volume. With a plumb tank clamp support system, the water is fed in upflow mode from its base. The collection volume () is set to 50-mL by a graduated cylinder, with a column height (zeolite bed depth) and cross-sectional area of 30.48 cm and 5.37 cm2, respectively. Based on an 18 °C detected water temperature, the viscosity correction factor of is applied to reveal the hydraulic conductivity of columns C1 and C2 as 4.08 × 10⁻⁴ m/s and 3.89 × 10⁻⁴ m/s, respectively. With a 4.84% difference to the average between the columns, this demonstrates a consistency in the overall executed compaction method.
3.2.4. Heavy Metallic Ion Concentration Analysis
Table 6 provides the results of the HMI concentrations () in both sorption columns based on triplicate readings obtained by the ICP-AES software. The percent removal (%R) values are presented with respect to the 2.0 meq/L influent concentrations of each HMI. During the experimental sequence of sample collection, C2-11 is lost due to improper handling when transferring from the sampling port to filtration at 169:45 min:s. However, this sample is of a lower HMI concentration and the overall removal trend has been well-established by the time this sample is collected. The first major observation is that throughout the analysis period, Pb2+ is not detected in both column effluents as well as the total waste, indicating a complete removal of the ion. The C1-13 sample for Cu2+, Fe3+, and Zn2+ reports a removal of 18.09%, 82.54%, and 10.71%, respectively, from the first column. The dual-column configuration provides a substantial improvement on the removal as observed with the second pass in sample C2-13, to achieve a final removal of Cu2+, Fe3+, and Zn2+ of 80.07%, 99.98%, and 51.53%, respectively. This improvement is also attributed to the unique feeding rate and design of the second column C2; the additional EBCT of approximately 10-minutes is available for the sorption process to occur as well as the slightly higher pH levels (and therefore lower presence of competitive H+ ions). The final total waste (TW2) effluent concentrations report very good removal for all ions except for Ni2+, with a removal of 48.97%. This removal trend is also consistent with the batch analyses conducted by Ciosek and Luk [32,33]. This is significant, as it proves that results from complex experimental batch studies, which are in high abundance, are useful in providing information on the sorption performance (i.e., removal efficiency, selectivity, and kinetics) in industrial applications where the process is run in a continuous flow-feeding configuration. In summary, the results demonstrate for the first time the effectiveness of multiple HMIs sorption by zeolite in a dual-column system with continuous flow.
3.2.5. Breakthrough Curve, Capacity and Usage Rate Analysis
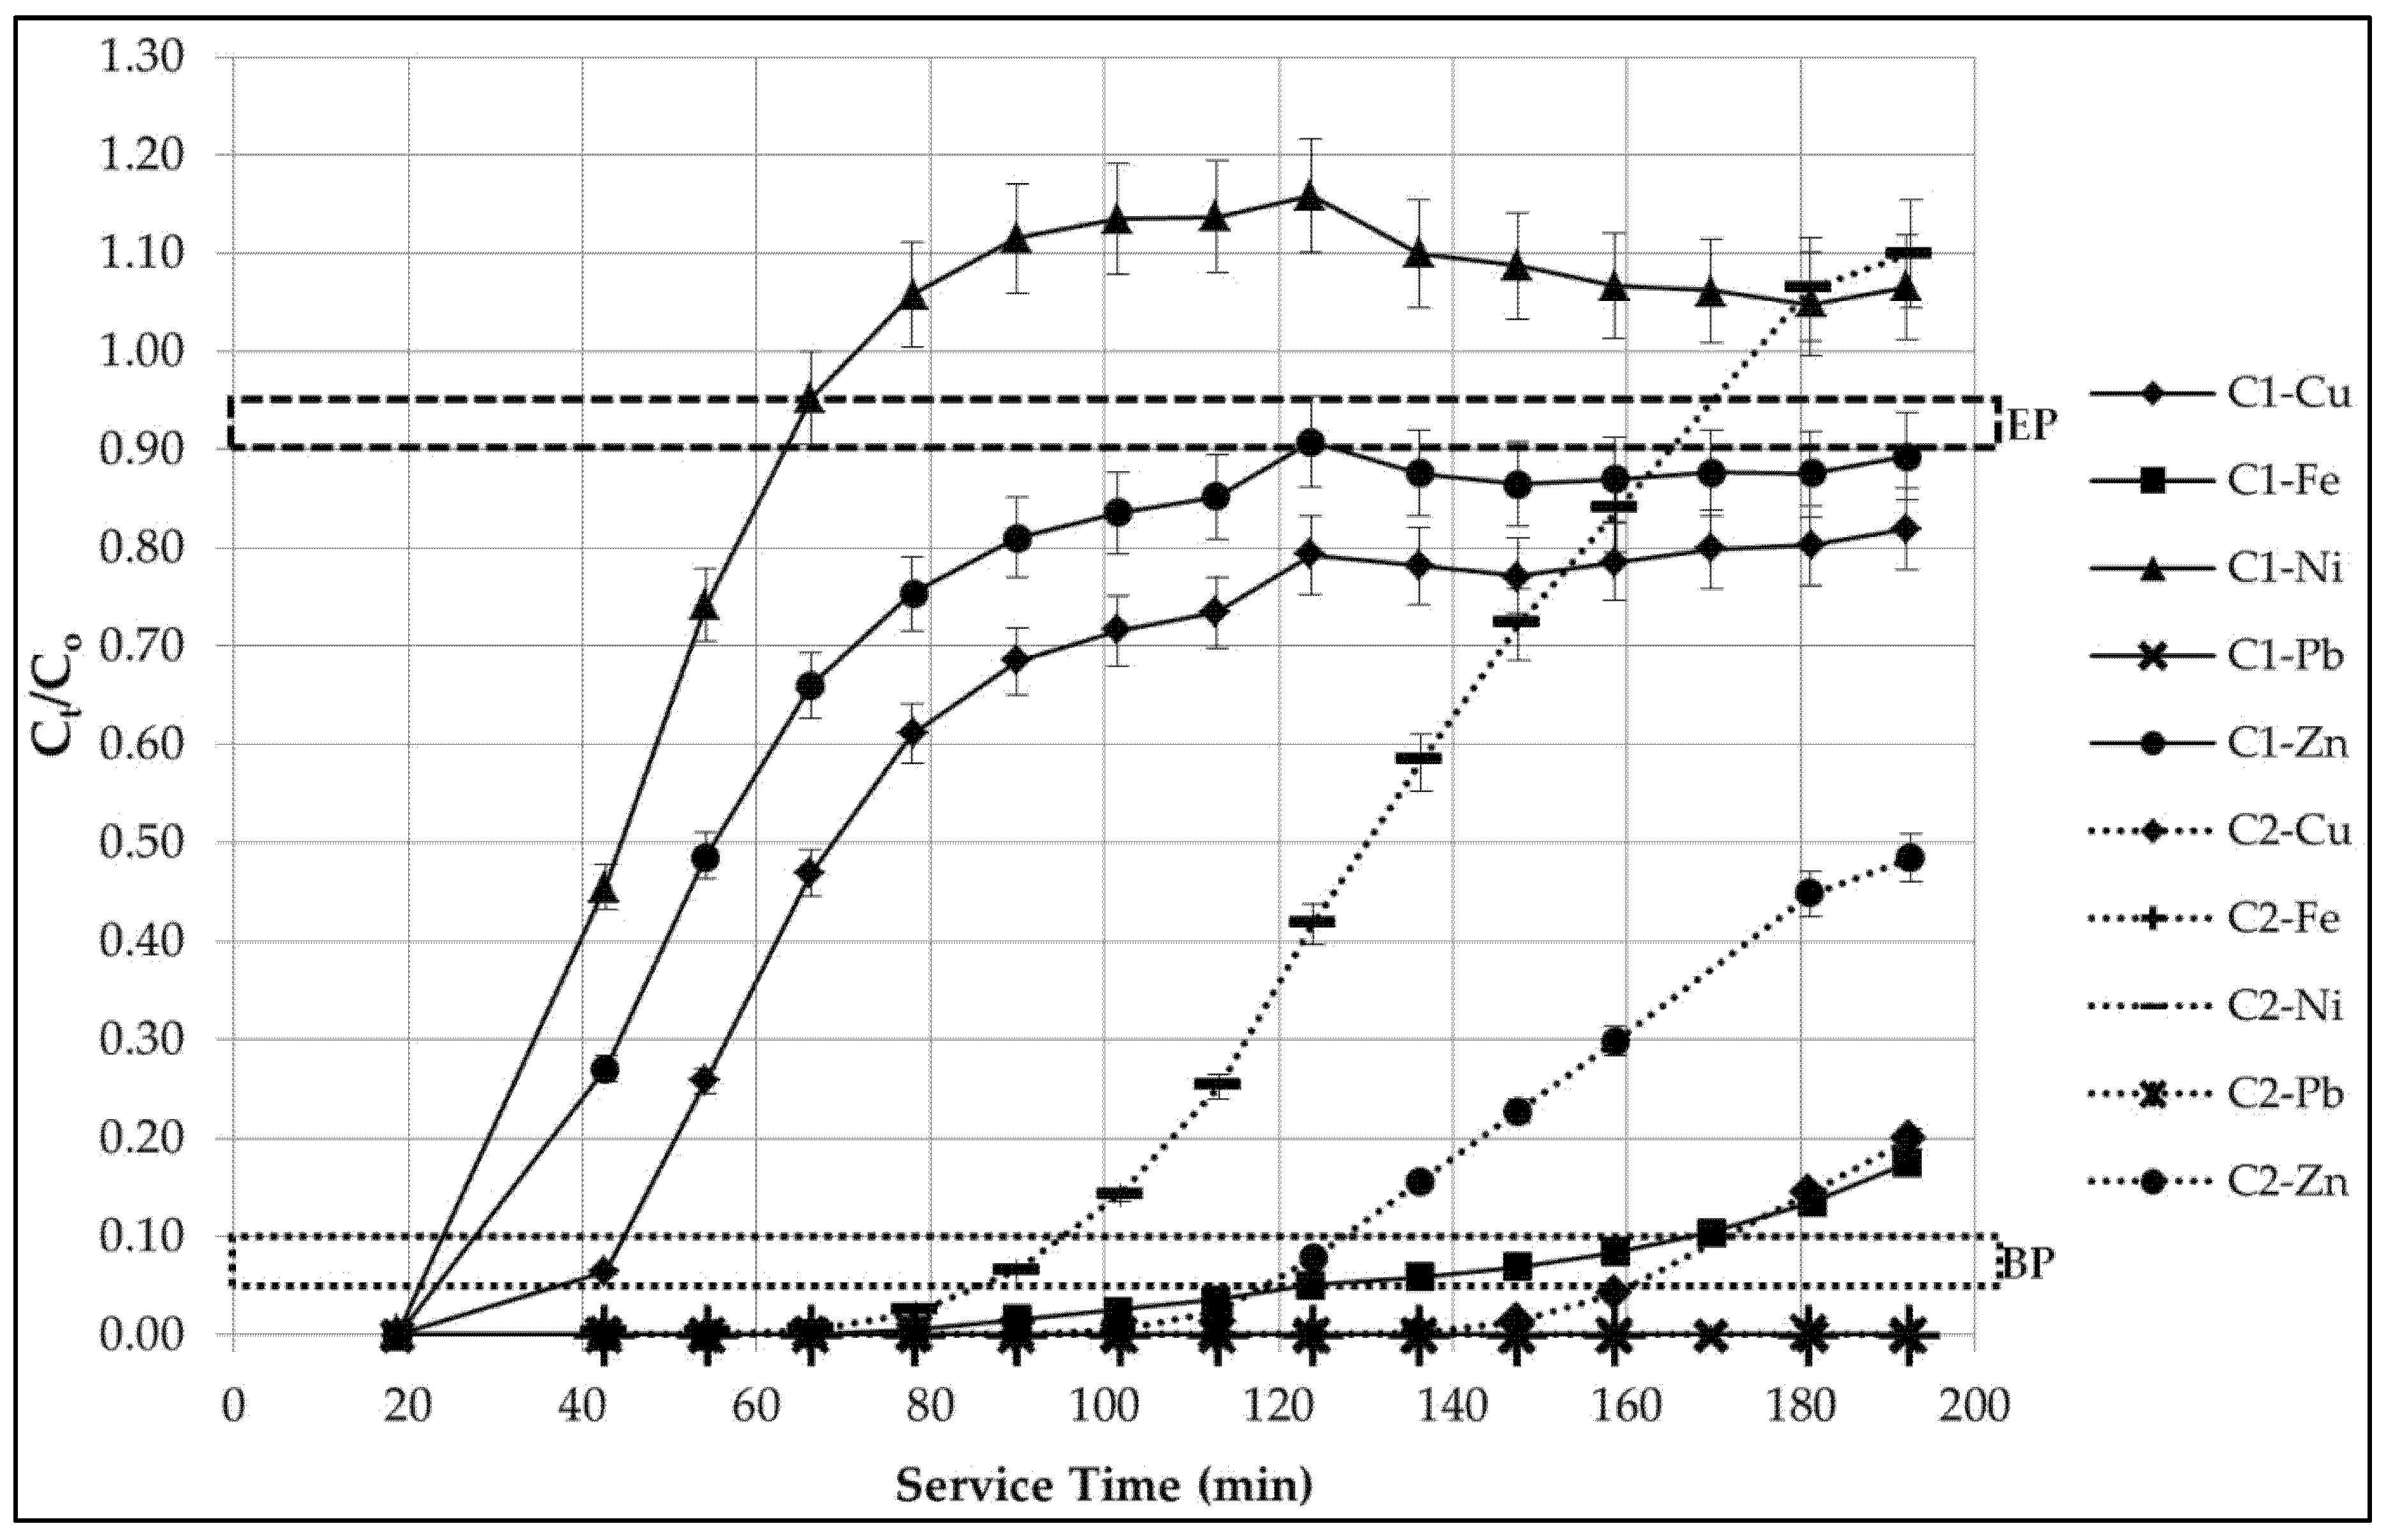
The breakthrough curve is displayed in Figure 3, as a plot of the solute outlet concentration () from Table 6 normalized to the inlet concentration () [34]. This normalized ratio trend over the service time of analysis [12,25] at which the sampling chambers (SC1, SC2) are extracted is presented for each of the five (5) HMIs combined in the multi-component solution; for both the first sorption column (C1) and second sorption column (C2). The breakthrough point (BP) and exhaustion point (EP) of each HMI in each column are indicated. The first observation to be had is that the breakthrough curves of the first column C1 do not have a defined S-shape. However, in the second sorption column C2, the curves take on this typical shape. Vukojevic Medvidovic et al. [34] points out that the shape-change may be attributed to an improved solid-solution phase contact for sorption to take place.
The influent stock concentration of the Ni2+ ion is exceeded in the effluent solution, where the normalized ratio surpasses 1 to reach an approximate maximum of 1.16 at 125 min and 1.10 at 190 min of service time, in sorption columns C1 and C2, respectively. The final ratio readings plateau at the end of service to approximately 5%–10% of the value of 1, given the nature of this experimental investigation. The effluent concentration that overshoots the influent concentration translates to concentration wave extremes inside the column [50]. Nuic et al. [12] investigates the breakthrough curves of Pb2+ and Zn2+ ions in dual-component solutions by natural zeolite; a similar trend is observed compared to this present study, where the ratio even reaches a value of 2 for one set of operation conditions. This is attributed to the displacement of the bound Zn2+ by the Pb2+ from the influent, which is supported by a lower breakthrough capacity and higher exhaustion capacity in favour of the Pb2+ ion, specifically [12]. It is important to note that the ion-exchange mechanism that attributes to the sorption process of HMIs transpires through the zeolite’s framework of pores and channels. The presence of stronger binding HMIs, such as Pb2+, weaken the chemical bonds between the functional group on the surface of zeolite and the weaker HMIs, such as Ni2+ ions [9]. Given that zeolite demonstrates its highest preference towards Pb2+, sorption site availability has reached its threshold, which may cause the leaching out of ions that zeolite holds a lower preference towards during this process. Therefore, careful screening on the selectivity of HMIs by zeolite should be conducted prior to adaptation.
In summary, the major trends observed from the breakthrough curves are as follows:
- The zeolite holds the greatest preference towards to Pb2+ ion, based on its complete removal throughout the analysis period;
- The zeolite demonstrates the least preference towards the Ni2+ ion;
- A more sudden breakpoint occurring after just 25 min and 90 min of service time in columns C1 and C2, respectively;
- An approximate exhaustion point after just 65 min and 165 min of service time in columns C1 and C2, respectively;
- The Fe3+ ion is removed entirely and sustained throughout the analysis period in C2, and;
- The removal of both the Cu2+ and Zn2+ ions begin to plateau at 120 min of service time in C1, acting in parallel and do not reach the lower threshold of the exhaustion point in both columns throughout the analysis period.
The breakthrough curves provide significant information from a perspective of sorption process performance, feasibility and optimization, which are vital for scaling-up the sorption system for industrial applications [28,50].
The overall column performance efficiency and its relationship between breakthrough capacity () and exhaustion capacity () of each sorption column are unique to the individual HMIs selected. As observed in the data displayed Table 6 and the trends visualized in Figure 3, the EP is only attained by Ni2+; the remaining four HMIs have yet to reach this point due to the constraints of the 3-h analysis period. Evidently, the optimization of future works would be to prolong the service time in order to quantify the overall columns’ performance efficiency. Qualitatively speaking, for both columns’ effluent and total waste (TW), the Pb2+ ion is completely removed throughout the analysis period, demonstrating the utmost efficiency; neither BP nor EP are attained. On the opposite end of the spectrum, the Ni2+ ion reaches exhaustion quite rapidly.
The volume of the effluent treated at breakthrough () is determined with the use of the mean flow rates of 8.18 mL/min () and 5.39 mL/min () for the sorption columns C1 and C2, respectively. These flow rates are applied to the time data of Table 4, at which BP (approximately 95% removal or 5% of the 2.0 meq/L influent concentration per HMI) is observed; as indicated by the superscript in Table 6. The 2:26 min:s time required for inlet priming to the base of C1 as well as the 24:08 min:s time observed for solute contact to the base of C2 are deducted from these BP times. As summarized in Table 7, the approximate effluent volumes treated at BP () are provided for both sorption columns and each HMI selected; based on the zeolite mass in each bed (m) of 152.10 g, Equations (2) and (5) are employed to determine the corresponding breakthrough capacity () and usage rate (), respectively.
The Pb2+ and Fe3+ ions are completely removed in sorption column C2, which essentially transforms the influent stock of a five HMI multi-component solution to a triple-component solution containing Cu2+, Ni2+, and Zn2+ ions within the 3-h analysis period. The zeolite does not have to address the competition of the two preferred HMIs, which provides greater sorption site availability for the three HMIs remaining in solution. It is important to develop a relationship between the EBCT and usage rate. The time that the fluid element is in contact with the zeolite bed in sorption column C2 is ten minutes greater than the detention time in C1. This thereby demonstrates a stronger overall treatment availability in C2; reflected in the average 195.2% increase of bed capacity at breakthrough and the average 63.94% decrease in usage rate of the zeolite between the columns; based on the trends observed for the Cu2+, Ni2+ and Zn2+ ions detected in solution.
Evidently, the columns’ usage rate provides significant insight into the operation and management required for this unique sorption system. It has a direct impact on the financial viability of performing either replacement (disposal) or regeneration (on- or off-site), and is affected by factors that include HMI influent concentration, zeolite bed depth, and flow rate. Research into other sorbent materials demonstrates that the order of usage rate is consistent with the sorption capacity [51]. Due to the unique automated variable influent feeding rate and sampling technique proposed in this study, the usage rate and performance efficiency are very complex [28]. However, the major removal trend of Pb2+ >> Fe3+ > Cu2+ > Zn2+ >> Ni2+ is well-established and supports previous results [22,27,32,33,38,42,43], providing significant validation of this design.
The use of natural zeolites as sorbents in industrial wastewater treatment and environmental management is motivated by the non-toxicity of these minerals, their abundant global availability, and economic feasibility. The removal and recovery processes of HMIs from aqueous solutions by natural zeolites take into consideration the regeneration potential of the zeolite bed to be reused in multiple cycles, as well as the use of the recovered metals [52] in applicable industrial applications. Metal processing effluents contain high concentrations of recoverable metals, triggering a movement towards technologies to recover these metals from AMD waste [53]. The removal-regeneration-recovery process has the potential to generate additional revenue streams with the use of metals of value [54]; such as the HMIs investigated in this innovative study.
4. Conclusions
This research has demonstrated the performance of natural zeolite (clinoptilolite) to remove multiple heavy metallic ions (HMIs) commonly found in acid mine drainage. With the design and development of a novel dual-column sorption system, the lead (Pb2+) ion is removed completely and sustained throughout the analysis period. The relationships between empty bed contact time (EBCT), breakthrough capacity, and usage rate are evident. The additional ten minutes of EBCT in the second sorption column contributes to an enhancement in overall removal for Cu2+, Fe3+, and Zn2+ by 75.67%, 99.90%, and 45.72%, respectively, from the first sorption column. This improvement is also apparent in the greater breakthrough capacity and lower usage rate in the second column, and visualized in an improved S-shape to the characteristic breakthrough curve. Based on the multi-component influent stock of 10 meq/L total concentration, the second column demonstrates a removal of 99.98%, 99.98%, 80.07%, 51.53%, and 0.00%, for Pb2+, Fe3+, Cu2+, Zn2+, and Ni2+, respectively; and the final cumulative collection of effluent reports a removal of 100.00%, 99.72%, 91.71%, 79.56% and 48.97%, for Pb2+, Fe3+, Cu2+, Zn2+, and Ni2+, respectively at the completion of the analysis period. These HMI sorption removal trends confirm the consistency between batch and continuous mode operations.
The modular design inventively incorporated a ‘circulation-pulse’ method to distribute the flow, rather than operating on a more commonly implemented fixed flow rate. With the consideration of this unique stock feed method, the findings of the service time and flow rate with respect to the removal trends are both interesting and significant. Forthcoming works in this research project include the advancement of service life and regeneration cycles, with further design development and optimization. The potential for variable flow rate operation and automatic adjustable sampling in a packed fixed-bed dual-column sorption design reveals practicality for treatment applications. This study has provided greater insight into the immense potential that the natural mineral zeolite holds for the future of industrial wastewater treatment.
Acknowledgments
This research was conducted with the financial support of a Natural Sciences and Engineering Research Council of Canada (NSERC) Discovery Grant to Grace K. Luk.
Author Contributions
Amanda L. Ciosek and Grace K. Luk conceived and designed the experiments; Amanda L. Ciosek constructed the prototype, performed the experiments and analytical simulations, and analyzed the data; Amanda L. Ciosek and Grace K. Luk wrote the paper.
Conflicts of Interest
The authors declare no conflict of interest. The founding sponsors had no role in the design of the study; in the collection, analyses, or interpretation of data; in the writing of the manuscript, and in the decision to publish the results.
References
- Vaca-Mier, M.; Lopez-Callejas, R.; Gehr, R.; Jimenez-Cisneros, B.E.; Alvarez, P.J.J. Heavy metal removal with mexican clinoptilolite: multi-component ionic exchange. Wat. Res. 2001, 35, 373–378. [Google Scholar] [CrossRef]
- Johnson, D.B.; Hallberg, K.B. Acid mine drainage remediation options—A review. Sci. Total Environ. 2005, 338, 3–14. [Google Scholar] [CrossRef] [PubMed]
- Akcil, A.; Koldas, S. Acid Mine Drainage (AMD): Causes, treatment and case studies. J. Clean. Prod. 2006, 14, 1139–1145. [Google Scholar] [CrossRef]
- Mohan, D.; Chander, S. Removal and recovery of metal ions from acid mine drainage using lignite—A low cost sorbent. J. Hazard. Mater. 2006, B137, 1545–1553. [Google Scholar] [CrossRef] [PubMed]
- Motsi, T.; Rowson, N.A.; Simmons, M.J.H. Kinetic studies of the removal of heavy metals from acid mine drainage by natural zeolite. Int. J. Miner. Process. 2011, 101, 42–49. [Google Scholar] [CrossRef]
- Baraket, M.A. New trends in removing heavy metals from industrial wastewater. Arab. J. Chem. 2011, 4, 276–282. [Google Scholar] [CrossRef]
- Vukojevic Medvidovic, N.; Peric, J.; Trgo, M.; Nuic, I.; Ugrina, M. Design of fixed bed column for lead removal on natural zeolite based on batch Studies. Chem. Biochem. Eng. Q. 2013, 27, 21–28. [Google Scholar]
- Nuic, I.; Trgo, M.; Vukojevic Medvidovic, N. The application of the packed bed reactor theory to Pb and Zn uptake from the binary solution onto the fixed bed of natural zeolite. Chem. Eng. J. 2016, 295, 347–357. [Google Scholar] [CrossRef]
- Han, R.; Zou, W.; Li, H.; Li, Y.; Shi, J. Copper(II) and lead(II) removal from aqueous solution in fixed-bed columns by manganese oxide coated zeolite. J. Hazard. Mater. 2006, 137, 934–942. [Google Scholar] [CrossRef] [PubMed]
- Stylianou, M.A.; Inglezakis, V.J.; Moustakas, K.G.; Malamis, S.P.; Loizidou, M.D. Removal of Cu(II) in fixed bed and batch reactors using natural zeolite and exfoliated vermiculite as adsorbents. Desalination 2007, 215, 133–142. [Google Scholar] [CrossRef]
- Stylianou, M.A.; Hadjiconstantinou, M.P.; Inglezakis, V.J.; Moustakas, K.G.; Loizidou, M.D. Use of natural clinoptilolite for the removal of lead, copper and zinc in fixed bed column. J. Hazard. Mater. 2007, 143, 575–581. [Google Scholar] [CrossRef] [PubMed]
- Nuic, M.; Trgo, J.; Peric, N.; Vukojevic Medvidovic, N. Analysis of breakthrough curves of Pb and Zn sorption from binary solutions on natural clinoptilolite. Micropor. Mesopor. Mater. 2013, 167, 55–61. [Google Scholar] [CrossRef]
- Peric, J.; Trgo, M.; Vukojevic Medvidovic, N. Removal of zinc, copper and lead by natural zeolite—A comparison of adsorption isotherms. Water Res. 2004, 38, 1893–1899. [Google Scholar] [CrossRef] [PubMed]
- Wang, C.; Li, J.; Sun, X.; Wang, L.; Sun, X. Evaluation of zeolites synthesized from fly ash as potential adsorbents for wastewater containing heavy metals. J. Environ. Sci. 2009, 21, 127–136. [Google Scholar] [CrossRef]
- Anari-Anaraki, M.; Nezamzadeh-Ejhieh, A. Modification of an Iranian clinoptilolite nano-particles by hexadecyltrimethyl ammonium cationic surfactant and dithizone for removal of Pb(II) from aqueous solution. J. Colloid Interf. Sci. 2015, 440, 272–281. [Google Scholar] [CrossRef] [PubMed]
- Borandegi, M.; Nezamzadeh-Ejhieh, A. Enhanced removal efficiency of clinoptilolite nano-particles toward Co(II) from aqueous solution by modification with glutamic acid. Colloids Surf. A Physicochem. Eng. Asp. 2015, 479, 35–45. [Google Scholar] [CrossRef]
- Curkovic, L.; Cerjan-Stefanovic, S.; Filipan, T. Metal ion exchange by natural and modified zeolites. Water. Res. 1997, 31, 1379–1382. [Google Scholar] [CrossRef]
- Helfferich, F. Equilibria; Kinetics; Ion-Exchange in Columns. In Ion Exchange; Series in Advanced Chemistry; McGraw-Hill Book Company: New York, NY, USA, 1962; pp. 95–322, 421–506. [Google Scholar]
- Inglezakis, V.J.; Poulopoulos, S.G. Chapter 4—Adsorption and Ion-Exchange (Kinetics). In Adsorption, Ion Exchange and Catalysis—Design of Operations and Environmental Applications, 1st ed.; Elsevier Science: Amsterdam, The Netherlands, 2006; pp. 262–266. ISBN 13 978-0-444-52783-7. [Google Scholar]
- Trgo, M.; Peric, J.; Vukojevic Medvidovic, N. A comparative study of ion exchange kinetics in zinc/lead—Modified zeolite-clinoptilolite systems. J. Hazard. Mater. 2006, 136, 938–945. [Google Scholar] [CrossRef] [PubMed]
- Tsitsishvili, G.V. Perspectives of Natural Zeolite Applications. Occurrence. In Properties and Utilization of Natural Zeolites—2nd International Conference 1985; Akademiai Kiado: Budapest, Hungary, 1988; pp. 367–393. [Google Scholar]
- Wang, S.; Peng, Y. Natural zeolites as effective adsorbents in water and wastewater treatment. Chem. Eng. J. 2010, 156, 11–24. [Google Scholar] [CrossRef]
- Nezamzadeh-Ejhieh, A.; Shirzadi, A. Enhancement of the photocatalytic activity of Ferrous Oxide by doping onto the nano-clinoptilolite particles towards photodegradation of tetracycline. Chemosphere 2014, 107, 136–144. [Google Scholar] [CrossRef] [PubMed]
- Inglezakis, V.J.; Loizidou, M.D.; Grigoropoulou, H.P. Equilibrium and kinetic ion exchange studies of Pb2+, Cr3+, Fe3+ and Cu2+ on natural clinoptilolite. Water Res. 2002, 36, 2784–2792. [Google Scholar] [CrossRef]
- Nuic, I.; Trgo, M.; Peric, J.; Vukojevic Medvidovic, N. Uptake of Pb and Zn from a binary solution onto different fixed bed depths of natural zeolite—The BDST model approach. Clay Miner. 2015, 50, 91–101. [Google Scholar] [CrossRef]
- Ersoy, B.; Celik, M.S. Electrokinetic properties of clinoptilolite with mono- and multivalent electrolytes. Micropor. Mesopor. Mater. 2002, 55, 305–312. [Google Scholar] [CrossRef]
- Inglezakis, V.J.; Grigoropoulou, H. Effects of operating conditions on the removal of heavy metals by zeolite in fixed bed reactors. J. Hazard. Mater. 2004, 112, 37–43. [Google Scholar] [CrossRef] [PubMed]
- Inglezakis, V.J. Ion exchange and adsorption fixed bed operations for wastewater treatment—Part I: Modelling fundamentals and hydraulics analysis. J. Eng. Stud. Res. 2010, 16, 29–41. [Google Scholar]
- Erdol Aydin, N.; Nasun Saygili, G. Column experiments to remove copper from wastewaters using natural zeolite. Int. J. Environ. Waste Manag. 2009, 3, 319–326. [Google Scholar] [CrossRef]
- Inglezakis, V.J.; Papadeas, C.D.; Loizidou, M.D.; Grigoropoulou, H.P. Effects of pretreatment on physical and ion exchange properties of natural clinoptilolite. Environ. Technol. 2001, 22, 75–82. [Google Scholar] [CrossRef] [PubMed]
- Inglezakis, V.J. Ion exchange and adsorption fixed bed operations for wastewater treatment—Part II: scale-up and approximate design methods. J. Eng. Stud. Res. 2010, 16, 42–50. [Google Scholar]
- Ciosek, A.L.; Luk, G.K. Lead Removal from mine tailings with multiple metallic ions. Int. J. Water Wastewater Treat. 2017, 3, 1–9. [Google Scholar] [CrossRef]
- Ciosek, A.L.; Luk, G.K. Kinetic modelling of the removal of multiple heavy metallic ions in mine waste by natural zeolite sorption. Water 2017, 9, 482. [Google Scholar] [CrossRef]
- Vukojevic Medvidovic, N.; Peric, J.; Trgo, M. Column performance in lead removal from aqueous solutions by fixed bed of natural zeolite–clinoptilolite. Sep. Purif. Technol. 2006, 49, 237–244. [Google Scholar] [CrossRef]
- Reed, B.E.; Jamil, M.; Thomas, B. Effect of pH, empty bed contact time and hydraulic loading rate on lead removal by granular activated carbon columns. Water Environ. Res. 1996, 68, 877–882. [Google Scholar] [CrossRef]
- Peric, J.; Trgo, M.; Vukojevic Medvidovic, N.; Nuic, I. The Effect of Zeolite Fixed Bed Depth on Lead Removal from Aqueous Solutions. Sep. Sci. Technol. 2009, 44, 3113–3127. [Google Scholar] [CrossRef]
- Bear River Zeolite Co. Inc. Zeolite—Specifications and MSDS. Available online: http://www.bearriverzeolite.com (accessed on 1 September 2012 and 1 April 2017).
- Inglezakis, V.J.; Hadjiandreou, K.J.; Loizidou, M.D.; Grigoropoulou, H.P. Pretreatment of natural clinoptilolite in a laboratory-scale ion exchange packed bed. Water Res. 2001, 35, 2161–2166. [Google Scholar] [CrossRef]
- Mullin, J. Physical and thermal properties. In Crystallization, 4th ed.; Read Educational and Professional Publishing Ltd: Woburn, MA, USA, 2001; pp. 76–77, IBSN 0-7506-4833-3. [Google Scholar]
- Wilson, L.J. Canada-Wide Survey of Acid Mine Drainage Characteristics. Project Report 3.22.1—Job No. 50788. Mineral Sciences Laboratories Division Report MSL 94–32 (CR). Ontario Ministry of Northern Development and Mines. Mine Environment Neutral Drainage (MEND) Program. Canada, 1994. Available online: http://mend-nedem.org/wp-content/uploads/2013/01/3.22.1.pdf (accessed on 30 October 2014).
- Canadian Minister of Justice—Metal Mining Effluent Regulations. Consolidation SOR/2002-222. Justice Laws—Government of Canada. Available online: http://laws-lois.justice.gc.ca (accessed on 1 September 2014).
- Wingenfelder, U.; Hansen, C.; Furrer, G.; Schulin, R. Removal of Heavy Metals from Mine Waters from Natural Zeolites. Environ. Sci. Technol. 2005, 39, 4606–4613. [Google Scholar] [CrossRef] [PubMed]
- Inglezakis, V.J.; Loizidou, M.D.; Grigoropoulou, H.P. Ion exchange of Pb2+, Cu2+, Fe3+, and Cr3+ on natural clinoptilolite: Selectivity determination and influence of acidity on metal uptake. J. Colloid Interface Sci. 2003, 261, 49–54. [Google Scholar] [CrossRef]
- Minceva, M.; Fajgar, R.; Markovska, L.; Meshko, V. Comparative Study of Zn2+, Cd2+, and Pb2+ Removal From Water Solution Using Natural Clinoptilolitic Zeolite and Commercial Granulated Activated Carbon: Equilibrium of Adsorption. Sep. Sci. Technol. 2008, 43, 2117–2143. [Google Scholar] [CrossRef]
- Ouki, S.K.; Kavannagh, M. Treatment of metals-contaminated wastewaters by use of natural zeolites. Water. Sci. Tech. 1999, 39, 115–122. [Google Scholar] [CrossRef]
- Rice, E.W.; Baird, R.B.; Eaton, A.D.; Clesceri, L.S. Part 1000-Introduction, Part 3000-METALS. In Standard Methods for the Examination of Water and Wastewater, 22nd ed.; The American Public Health Association (APHA): Washington, DC, USA; The American Water Works Association (AWWA): Denver, CO, USA; The Water Environment Federation (WEF): Alexandria, VA, USA, 2012; pp. 1.1–68, 3.1–112, ISSN 978-087553-013-0. [Google Scholar]
- Perkin Elmer Inc. Atomic Spectroscopy—A Guide to Selecting the Appropriate Technique and System: World Leader in AA, ICP-OES, and ICP-MS; Perkin Elmer Inc.: Waltham, MA, USA, 2011. [Google Scholar]
- Perkin Elmer Inc. WinLab32 for ICP—Instrument Control Software, Version 5.0; Perkin Elmer Inc.: Waltham, MA, USA, 2010. [Google Scholar]
- ASTM D2434–68. Standard Test Method for Permeability of Granular Soils (Constant Head). ASTM International, West Conshohocken, PA. 2000. Available online: www.astm.org (accessed on 1 March 2016).
- Naja, G.; Volesky, B. Multi-metal biosorption in a fixed-bed flow-through column. Colloid. Surf. 2006, 281, 194–201. [Google Scholar] [CrossRef]
- Othman, M.Z.; Roddick, F.A.; Snow, R. Removal of Dissolved Organic Compounds in Fixed-Bed Columns: Evaluation of Low-Rank Coal Adsorbents. Water Res. 2001, 35, 2943–2949. [Google Scholar] [CrossRef]
- Sprynskyy, M.; Buszewski, B.; Terzyk, A.P.; Namiesnik, J. Study of the selection mechanism of heavy metal (Pb2+, Cu2+, Ni2+, and Cd2+) adsorption on clinoptilolite. J. Colloid Interface Sci. 2006, 304, 21–28. [Google Scholar] [CrossRef] [PubMed]
- Zinck, J. Review of Disposal, Reprocessing and Reuse Options for Acidic Drainage Treatment Sludge. Report 3.42.3. Mine Environment Neutral Drainage (MEND) Program. Mining Association of Canada. CANMET Mining and Mineral Sciences Laboratories. Canada, 2005. Available online: http://mend-nedem.org/wp-content/uploads/2013/01/3.42.3.pdf (accessed on 30 October 2014).
- Dinardo, O.; Kondos, P.D.; MacKinnon, D.J.; McCready, R.G.L.; Riveros, P.A.; Skaff, M. Study on Metals Recovery/Recycling from Acid Mine Drainage Phase IA: Literature Survey. Report 3.21.1a. Mine Environment Neutral Drainage (MEND) Program. CANMET, Energy, Mines and Resources Canada and WTC, Environment Canada. 1991. Available online: http://mend-nedem.org/wp-content/uploads/2013/01/3.21.1a.pdf (accessed on 30 October 2014).
Figure 1.
Schematic representation of automated sorption system prototype flow path layout.
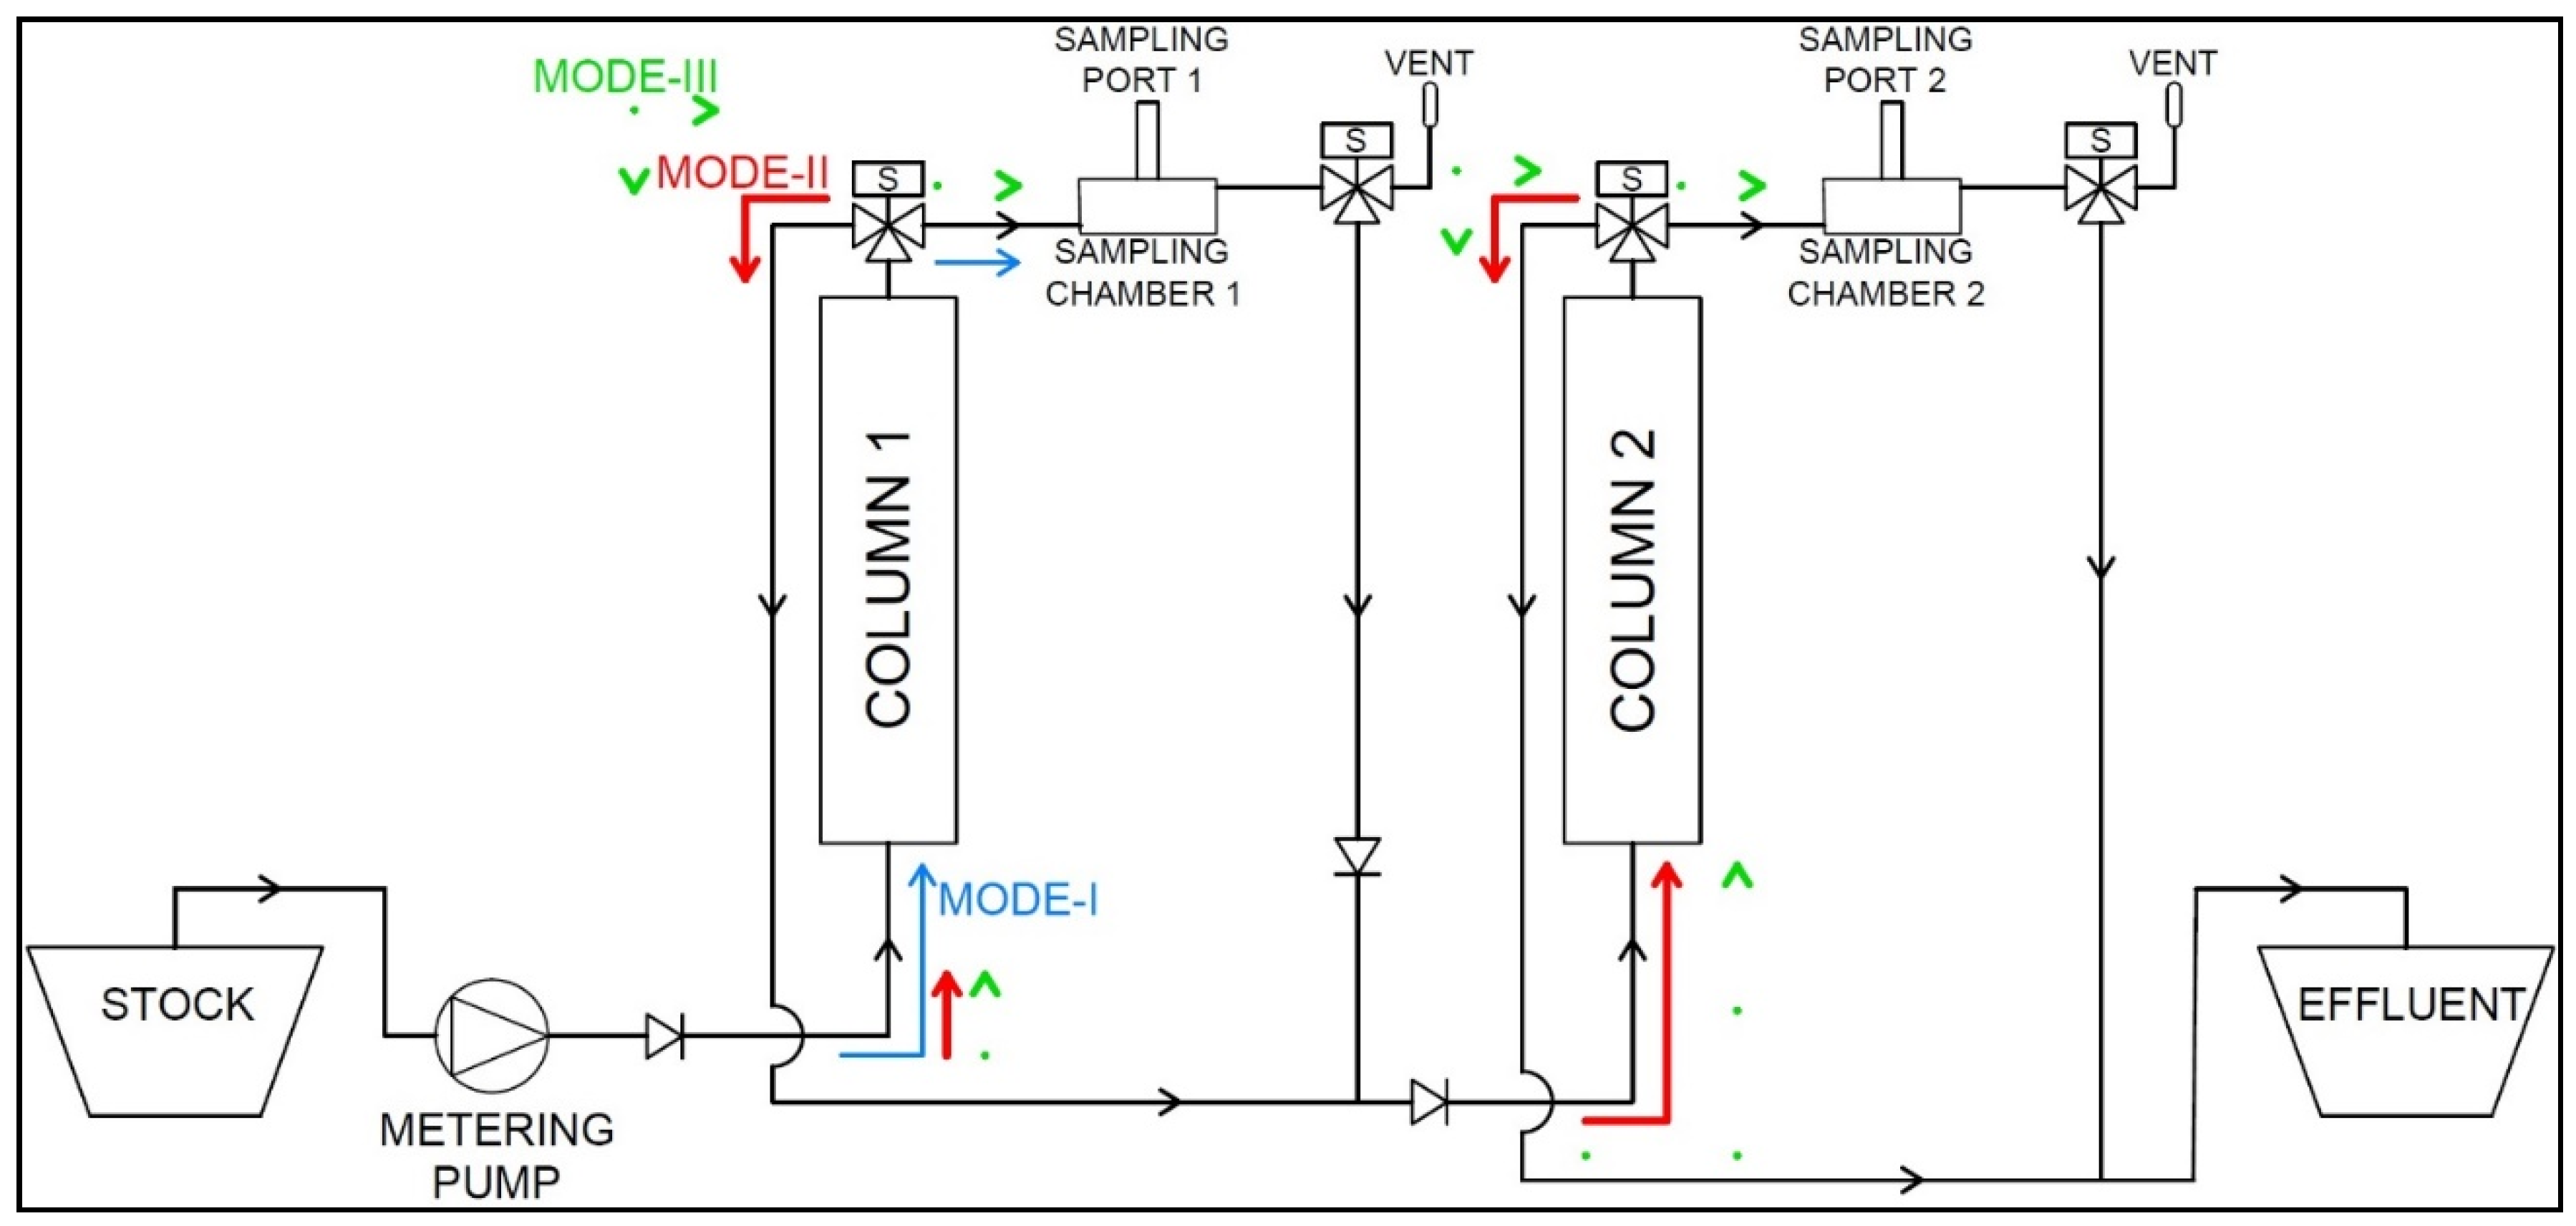
Figure 2.
Image of automated sorption system prototype design.

Figure 3.
The multi-component system breakthrough curve.


| Chemical Composition | Mineral Component | 85%–95% Clinoptilolite (non-crystalline silica opaline balance) | ||
| Cation Exchange Capacity (CEC) | 180–220 meq/100 g (as ammonium, -N) (high) | |||
| Maximum Water Retention | >55 wt % (hydrophilic) | |||
| Overall Surface Area | 24.9 m2/g (large) | |||
| Bulk Density | approx. 55–60 lb/f3 | |||
| Hardness | Moh’s No. 4 (high) | |||
| pH | 7–8.64 | |||
| Colour | Pale Green | |||
| MSDS Composition Information | Chemical | wt % | CAS No. | |
| Clinoptilolite | 90–97 | 12173-10-3 | ||
| Water | 3–10 | 7732-18-5 | ||
| Analytical Rock Data | SiO2 | 67.4% | ||
| Al2O3 | 10.6% | |||
| MgO | 0.45% | |||
| K2O | 4.19% | |||
| MnO | <0.01% | |||
| CaO | 2.23% | |||
| TiO2 | 0.27% | |||
| Fe2O3 | 1.70% | |||
| Na2O | 0.59% | |||
| P2O5 | 0.10% | |||
| Loss-On-Ignition (LOI) 925 °C | 11.40% | |||
| Major Cation Range | Ca | 1.60%–2.0% | ||
| K | 2.93%-3.47% | |||
| Na | <0.5% | |||
Table 2.
Inductively Coupled Plasma—Atomic Emission Spectroscopy (ICP-AES) generated multi-component stock concentration.
Table 2.
Inductively Coupled Plasma—Atomic Emission Spectroscopy (ICP-AES) generated multi-component stock concentration.
| Sample ID | Analyte | Int (Corr) | RSD (Corr Int) | Conc (Calib) (mg/L) |
|---|---|---|---|---|
| M-X | Cu 327.393 | 188,070.71 | 0.27 | 34.26 |
| Fe 238.204 | 79,641.94 | 0.39 | 19.18 | |
| Ni 231.604 | 41,071.22 | 0.50 | 29.81 | |
| Pb 220.353 | 32,330.16 | 0.52 | 105.28 | |
| Zn 206.200 | 55,015.91 | 0.38 | 32.31 | |
| M-Y | Cu 327.393 | 186,885.03 | 0.74 | 34.04 |
| Fe 238.204 | 79,083.95 | 0.90 | 19.04 | |
| Ni 231.604 | 40,721.53 | 0.48 | 29.55 | |
| Pb 220.353 | 31,973.87 | 0.31 | 104.12 | |
| Zn 206.200 | 54,758.60 | 1.09 | 32.16 | |
| M-Z | Cu 327.393 | 202,742.71 | 0.91 | 36.93 |
| Fe 238.204 | 85,771.53 | 1.02 | 20.65 | |
| Ni 231.604 | 44,652.28 | 3.73 | 32.41 | |
| Pb 220.353 | 35,199.76 | 3.77 | 114.63 | |
| Zn 206.200 | 60,176.84 | 4.12 | 35.34 | |
| MM | Cu 327.393 | 192,776.82 | 0.63 | 35.11 |
| Fe 238.204 | 81,419.80 | 0.80 | 19.60 | |
| Ni 231.604 | 41,667.28 | 0.38 | 30.24 | |
| Pb 220.353 | 32,738.45 | 0.40 | 106.61 | |
| Zn 206.200 | 56,170.16 | 0.94 | 32.99 |
Table 3.
Sorption system set-up sequence.
| MODE | Function | Flow Description | Time (min:s) |
|---|---|---|---|
| I | Fill C1 | Primed Inlet to C1 Base | 2:26 |
| C1 Base to C1 Top | 11:05 | ||
| C1 Top to SC1 Drip | 15:10 | ||
| Fill SC1 | |||
| II | Sample C1-A | 18:50 | |
| Fill C2 | C2 Inlet to C2 Base | 24:08 | |
| C2 Base to C2 Top | 32:35 | ||
| C2 Top to SC2 Drip | 36:14 | ||
| III | Fill SC1 and SC2 | ||
| II | Sample C1-B and C2-B | 42:50 | |
| III | Fill SC1 and SC2 | 48:04 | |
| II | Sample C1-1 and C2-1 | 54:27 |
Table 4.
Sorption system sampling sequence.
| Sample | MODE | Start Time (min:s) | End Time (min:s) | |
|---|---|---|---|---|
| SC1 | SC2 | |||
| C1-A | I | 15:10 | 18:50 | - |
| II | 18:50 | |||
| Cx-B | III | 36:40 | 42:42 | 42:49 |
| II | 42:50 | |||
| Cx-1 | III | 48:04 | 54:10 | 54:27 |
| II | 54:27 | |||
| Cx-2 | III | 59:39 | 66:15 | 66:34 |
| II | 66:34 | |||
| Cx-3 | III | 71:37 | 77:55 | 78:19 |
| II | 78:20 | |||
| Cx-4 | III | 83:24 | 89:56 | 89:56 |
| II | 89:57 | |||
| Cx-5 | III | 95:05 | 101:32 | 101:45 |
| II | 101:46 | |||
| Cx-6 | III | 106:52 | 112:53 | 113:10 |
| II | 113:11 | |||
| TW1 | 115:45 | |||
| Cx-7 | III | 118:10 | 123:45 | 123:56 |
| II | 123:57 | |||
| Cx-8 | III | 129:00 | 136:07 | 136:19 |
| II | 136:20 | |||
| Cx-9 | III | 141:22 | 147:29 | 147:34 |
| II | 147:35 | |||
| Cx-10 | III | 152:40 | 158:35 | 158:45 |
| II | 158:46 | |||
| Cx-11 | III | 163:45 | 169:40 | 169:45 |
| II | 169:46 | |||
| Cx-12 | III | 174:50 | 181:06 | 181:04 |
| II | 181:10 | |||
| Cx-13 | III | 186:11 | 192:08 | 192:36 |
| II | PUMP OFF | |||
| TW2 | 195:00 | |||
Table 5.
The pH levels of selected sorption column samples.
| Sample | pH Level | |
|---|---|---|
| SC1 | SC2 | |
| C1-A | 6.34 | - |
| Cx-3 | 4.79 | 6.84 |
| Cx-6 | 3.99 | 6.72 |
| TW1 | 6.05 | |
| Cx-9 | 3.86 | 6.33 |
| Cx-13 | 3.60 | 5.76 |
| TW2 | 5.44 | |
Table 6.
The heavy metallic ion (HMI) concentration (meq/L) and percent removal (%R) in the sorption columns.
Table 6.
The heavy metallic ion (HMI) concentration (meq/L) and percent removal (%R) in the sorption columns.
| Sample | HMI | ||||||||||
|---|---|---|---|---|---|---|---|---|---|---|---|
| Cu2+ | Fe3+ | Ni2+ | Pb2+ | Zn2+ | |||||||
| meq/L | %R | meq/L | %R | meq/L | %R | meq/L | %R | meq/L | %R | ||
| C1 | C1-A | 0.000 | 100.00 | 0.000 | 99.98 | 0.007 | 99.67 BP | 0.0003 | 99.98 | 0.002 | 99.92 BP |
| C1-B | 0.129 | 93.55 BP | 0.000 | 99.99 | 0.911 | 54.47 | 0.0006 | 99.97 | 0.541 | 72.96 | |
| C1-1 | 0.517 | 74.17 | 0.000 | 99.99 | 1.483 | 25.85 | 0.0004 | 99.98 | 0.974 | 51.30 | |
| C1-2 | 0.938 | 53.09 | 0.001 | 99.93 | 1.906 | 4.71 | 0.0006 | 99.97 | 1.320 | 34.02 | |
| C1-3 | 1.221 | 38.93 | 0.011 | 99.46 | 2.116 | 0.00 | 0.0003 | 99.98 | 1.507 | 24.66 | |
| C1-4 | 1.369 | 31.54 | 0.030 | 98.49 | 2.231 | 0.00 | 0.0006 | 99.97 | 1.622 | 18.91 | |
| C1-5 | 1.431 | 28.47 | 0.052 | 97.42 | 2.269 | 0.00 | 0.0004 | 99.98 | 1.671 | 16.43 | |
| C1-6 | 1.468 | 26.60 | 0.072 | 96.40 | 2.273 | 0.00 | 0.0005 | 99.97 | 1.703 | 14.83 | |
| C1-7 | 1.584 | 20.78 | 0.102 | 94.90 BP | 2.316 | 0.00 | 0.0005 | 99.98 | 1.816 | 9.20 | |
| C1-8 | 1.563 | 21.86 | 0.118 | 94.08 | 2.199 | 0.00 | 0.0005 | 99.98 | 1.751 | 12.43 | |
| C1-9 | 1.543 | 22.84 | 0.138 | 93.11 | 2.174 | 0.00 | 0.0004 | 99.98 | 1.730 | 13.51 | |
| C1-10 | 1.571 | 21.44 | 0.167 | 91.64 | 2.134 | 0.00 | 0.0004 | 99.98 | 1.739 | 13.04 | |
| C1-11 | 1.598 | 20.12 | 0.209 | 89.55 | 2.123 | 0.00 | 0.0004 | 99.98 | 1.752 | 12.38 | |
| C1-12 | 1.604 | 19.79 | 0.268 | 86.59 | 2.096 | 0.00 | 0.0001 | 100.00 | 1.750 | 12.49 | |
| C1-13 | 1.638 | 18.09 | 0.349 | 82.54 | 2.130 | 0.00 | 0.0002 | 99.99 | 1.786 | 10.71 | |
| C2 | C2-B | 0.00 | 100.00 | 0.0004 | 99.98 | 0.002 | 99.90 | 0.0003 | 99.99 | 0.002 | 99.88 |
| C2-1 | 0.00 | 100.00 | 0.0003 | 99.98 | 0.002 | 99.88 | 0.0003 | 99.99 | 0.001 | 99.94 | |
| C2-2 | 0.00 | 100.00 | 0.0003 | 99.98 | 0.012 | 99.42 | 0.0004 | 99.98 | 0.001 | 99.95 | |
| C2-3 | 0.00 | 100.00 | 0.0002 | 99.99 | 0.046 | 97.68 | 0.0006 | 99.97 | 0.001 | 99.96 | |
| C2-4 | 0.00 | 100.00 | 0.0002 | 99.99 | 0.131 | 93.43 BP | 0.0002 | 99.99 | 0.001 | 99.93 | |
| C2-5 | 0.00 | 100.00 | 0.0002 | 99.99 | 0.285 | 85.75 | 0.0002 | 99.99 | 0.009 | 99.55 | |
| C2-6 | 0.00 | 100.00 | 0.0003 | 99.98 | 0.505 | 74.77 | 0.0003 | 99.99 | 0.049 | 97.56 | |
| C2-7 | 0.00 | 100.00 | 0.0002 | 99.99 | 0.835 | 58.26 | 0.0003 | 99.98 | 0.155 | 92.23 BP | |
| C2-8 | 0.004 | 99.80 | 0.0002 | 99.99 | 1.163 | 41.85 | 0.0003 | 99.99 | 0.312 | 84.39 | |
| C2-9 | 0.029 | 98.57 | 0.0002 | 99.99 | 1.444 | 27.82 | 0.0004 | 99.98 | 0.455 | 77.24 | |
| C2-10 | 0.085 | 95.77 BP | 0.0003 | 99.99 | 1.675 | 16.26 | 0.0004 | 99.98 | 0.597 | 70.17 | |
| C2-12 | 0.289 | 85.57 | 0.0002 | 99.99 | 2.126 | 0.00 | 0.0006 | 99.97 | 0.895 | 55.23 | |
| C2-13 | 0.399 | 80.07 | 0.0003 | 99.98 | 2.198 | 0.00 | 0.0004 | 99.98 | 0.969 | 51.53 | |
| TW1 | 0.0514 | 97.43 | 0.0004 | 99.98 | 0.3077 | 84.61 | 0.0004 | 99.98 | 0.1107 | 94.46 | |
| TW2 | 0.1659 | 91.71 | 0.0057 | 99.72 | 1.0207 | 48.97 | 0.0000 | 100.00 | 0.4088 | 79.56 | |
Table 7.
System breakthrough point performance.
| HMI | Sorption Column 1 | Sorption Column 2 | ||||
|---|---|---|---|---|---|---|
| (L) | (meq/g) | (g/L) | (L) | (meq/g) | (g/L) | |
| Cu2+ | 0.3295 | 0.00433 | 461.67 | 0.7257 | 0.00954 | 209.59 |
| Fe3+ | 0.9926 | 0.01305 | 153.24 | - | - | - |
| Ni2+ | 0.1342 | 0.00176 | 1133.54 | 0.3547 | 0.00466 | 428.80 |
| Pb2+ | - | - | - | - | - | - |
| Zn2+ | 0.1342 | 0.00176 | 1133.54 | 0.5380 | 0.00707 | 282.71 |
© 2017 by the authors. Licensee MDPI, Basel, Switzerland. This article is an open access article distributed under the terms and conditions of the Creative Commons Attribution (CC BY) license (http://creativecommons.org/licenses/by/4.0/).
Share and Cite
MDPI and ACS Style
Ciosek, A.L.; Luk, G.K. An Innovative Dual-Column System for Heavy Metallic Ion Sorption by Natural Zeolite. Appl. Sci. 2017, 7, 795. https://doi.org/10.3390/app7080795
AMA Style
Ciosek AL, Luk GK. An Innovative Dual-Column System for Heavy Metallic Ion Sorption by Natural Zeolite. Applied Sciences. 2017; 7(8):795. https://doi.org/10.3390/app7080795
Chicago/Turabian StyleCiosek, Amanda L., and Grace K. Luk. 2017. "An Innovative Dual-Column System for Heavy Metallic Ion Sorption by Natural Zeolite" Applied Sciences 7, no. 8: 795. https://doi.org/10.3390/app7080795
Note that from the first issue of 2016, this journal uses article numbers instead of page numbers. See further details here.