Research on Performance of a Dense Graded Ultra-Thin Wearing Course Mixture


1
Jiangsu Sinoroad Engineering Research Institute Co. LTD., 19 Lanhua Road, Nanjing 211800, China
2
School of Transportation, Southeast University, 2 Sipailou, Nanjing 210096, China
3
State Engineering Laboratory of Highway Maintenance Technology, Changsha University of Science and Technology, Changsha 410114, China
*
Author to whom correspondence should be addressed.
Appl. Sci. 2017, 7(8), 800; https://doi.org/10.3390/app7080800
Submission received: 7 July 2017
/
Revised: 31 July 2017
/
Accepted: 2 August 2017
/
Published: 7 August 2017
(This article belongs to the Special Issue Advanced Asphalt Materials and Paving Technologies)
Abstract
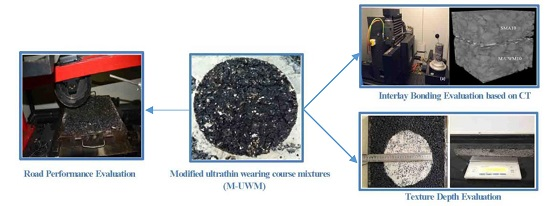
:This paper focused on the design and performance characterization of a modified ultra-thin wearing course mixture (M-UWM). A dense graded ultra-thin wearing course mixture with nominal maximum aggregate size of 10 mm was designed and named as UWM10. A multi-chain polyolefin modifier was used to modify the performance of UWM10 to get M-UWM10. Based on different laboratory performance tests including wheel tracking tests, low-temperature bending beam tests, immersion Marshall tests and freeze-thaw splitting tests, the high temperature rutting resistance, low-temperature cracking resistance and moisture resistance of the designed M-UWM10 were evaluated. The texture depth tests and wheel tracking tests were combined to characterize the degradation behaviour of the surface texture depth of M-UWM10. Based on test roads, the bonding conditions between the wearing course layer that consisted of M-UWM10 and its sublayer were evaluated by computed tomography (CT) scanning test and pull out test. Filed texture depth tests were also conducted on the test roads. It is proved that the designed wearing course mixture M-UWM10 shows excellent pavement performance as well as better wearing resistance and interlayer bonding than the traditional wearing course mixture.

1. Introduction
An ultra-thin paving technique, usually with 1.5 to 2.5 centimetres pavement thickness, namely Novachip, originated from France in the late 1970s [1]. It has several advantages like short construction time, good anti-skid performance and good water permeability [1,2,3,4]. These distinctive features have been gradually gaining popularity, as ultra-thin wearing layers are being frequently applied in old highway maintenance as well as serving as wearing layers in new constructed highways [2,3,5,6]. Apart from the excellent functional performance, the ultra-thin paving technique is also cost-effective, environmental-friendly and a sustainable construction method [7,8,9], which is attracting more and more attention from researchers.
Kandhal and Lockett [8] examined the road performance of two Novachip projects in Alabama, USA. After 4.5 years of service, both two Novachip projects showed no significant ravelling, concluding that the cohesion between the ultra-thin wearing layer and underlying asphalt layer is good. However, the ultra-thin wearing layer presents more surface friction than the hot mixture asphalt (HMA) wearing layer.
In order to identify appropriate evaluation indexes for ultra-thin wearing layers, Tan, Yao, Wang, Bian and Yu-Xiang [5] conducted several experiments (thermal stress restrained sample tests, permeability tests, skid resistance tests, and indoor abrasion tests) on asphalt mixture with three different surface layers—stone mastic asphalt mixture with a nominal maximum aggregate size of 10 mm (SMA10), ultra-thin asphalt concrete with a nominal maximum aggregate size of 10 mm (UTAC10) and Novachip Type C. The result shows that frozen broken temperature and frozen broken strength could be regarded as appropriate evaluation indexes for low temperature performance of ultra-thin surface layers. Moreover, sliding attenuation degree and initial British Pendulum Number (BPN) value are proposed to measure the anti-skid performance of the ultra-thin surface layer. Furthermore, the author indicates that the freeze-thaw splitting strength ratio and freeze-thaw splitting strength should be combined to evaluate resistance of water damage performance.
Zeng et al. [10] studied the anti-skid performance, permeability and texture depth of three different asphalt mixtures—dense-graded asphalt mixture with a nominal maximum aggregate size of 13.2 mm (AC13), open graded friction course with a nominal maximum aggregate size of 13.2 mm (OGFC13) and semi-open gradation Novachip Type C. Results show that Novachip Type C as an ultra-thin wearing layer has better overall performance in terms of skid resistance, permeability and texture depth. Furthermore, Novachip Type C was proven to have better shear capability than other types of asphalt mixture, under the same tack coat material and dosage. Moreover, Yang, et al. [11] investigated the moisture stability, high temperature stability and low temperature cracking resistance of the same three types of asphalt mixture (AC-13, OGFC-13 and semi-open gradation Novachip Type C). The result shows that Novachip Type C has better high temperature stability than the other two types of asphalt mixture. However, the low temperature cracking resistance and moisture stability performance of Novachip Type C is worse than the AC-13 asphalt mixture but better than the OGFC-13 asphalt mixture.
Yang, Shen and Gao [4] argue that the current design specification in China [12] does not take temperature into consideration and the interlayer contact is presumed as completely continuous. The actual environmental condition subjected to pavement structure is not sufficiently considered in the specification. Thus, the author conducted an experiment to investigate the shear stress between the ultra-thin wearing layer and the underlying asphalt layer under different temperatures and interlayer contact situations. The result shows that maximum interlayer shear stress is negatively correlated with temperature and interlayer sliding coefficient.
The cohesiveness between the thin surface layer and underlying asphalt layer is proven to be an important factor that influences the performance and durability of the thin surface layer [13]. Thus, Wu [14] proposed a modified pull test method to test cohesiveness between the ultra-thin wearing layer and underlying asphalt layer. Three types of ultra-thin wearing layers (Epoxy modified bitumen, Resin and Cement) were selected. The experiment was conducted under three different temperatures (0, 10 and 20 °C) with a loading speed of 0.025 MPa/s. The result demonstrates the feasibility of the proposed modified test method, provided that the interface of the two layers is the weakest area. Moreover, the author also demonstrated that the Epoxy modified bitumen-based surface layer has better cohesiveness than the other two types of layers.
Pavement performance decreases over time, and thus needs to be rehabilitated once the existing pavement is unable to satisfy the traffic demand. Several researchers also focused on ultra-thin wearing layer recycling since high quality materials are used in the ultra-thin wearing layer. Both environment protection and cost reduction could be achieved by recycling high-quality used materials. Rahaman et al. [15] conducted research to investigate if the reclaimed ultra-thin wearing layer material could be used in the chip seal or Superpave mixtures. Sweep test based on the American Society for Testing and Materials (ASTM) D7000-04 was conducted to observe the chip retention of ultra-thin wearing layer millings. Different percentages (0%, 10%, and 20%) of ultra-thin wearing layer millings were added to the Superpave mixture. Rutting, stripping and moisture sensitivity tests were conducted to evaluate the performance of the Superpave mixture. The sweep test indicates that reclaimed ultra-thin wearing layer millings do not contribute to chip retention. However, an ultra-thin wearing layer milling addition was proven to have a positive effect on the performance of Superpave mixture.
The ultra-thin paving technique has been extensively used in China [16], since its first adoption in the 1990s [17]. However, several drawbacks of the ultra-thin paving technique occurred in engineering practices such as low degree of compaction, moisture damage and rapid attenuation of sliding resistance at a later stage. As to open-graded ultra-thin paving material, the situation could be even worse. Because of the high void ratio of open-graded ultra-thin paving material, water could easily permeate into the pavement structure. It would lower the bonding strength between pavement layers, causing raveling and reducing the durability of ultra-thin paving materials.
In view of the existing problems of the current ultra-thin technique, a dense-graded ultra-thin wearing mixture was designed and then further modified by a multi-chain polyolefin modifier to get the modified ultra-thin wearing mixture in this study. Both laboratory and field tests were conducted to fully evaluate the road performances, wearing resistance and bonding conditions with sub-layers of the modified ultra-thin wearing mixture.
2. Experimental
2.1. Mix Design for Different Asphalt Mixtures
Styrene-butadiene-styrene (SBS) modified asphalt with penetration grade of PG-70, basalt aggregate and limestone powders were used for all of the asphalt mixtures prepared in this study. According to the recommendation by Chinese specification and previous studies, the polyester fibre was used for SMA mixtures. To improve the rutting resistance and the anti-wearing performance of ultra-thin wearing course mixture (UWM), a multi-chain polyolefin modifier was added to the SBS modified asphalt to prepare modified ultrathin wearing course mixtures (M-UWM).
Five different asphalt mixtures were studied including an SMA mixture with nominal maximum aggregate size of 13.2 mm (SMA13), dense-graded asphalt mixture with nominal maximum aggregate size of 13.2 mm (AC13), SMA mixture with nominal maximum aggregate size of 9.5 mm (SMA10), ultrathin wearing course mixture with nominal maximum aggregate size of 9.5 mm (UWM10), and a modified ultrathin wearing course mixture with a nominal maximum aggregate size of 9.5 mm (M-UWM10). The SMA13 and AC13 are commonly used in the pavement surface layer while SMA10, UWM10 and M-UWM10 are mainly used in the wearing course above the pavement surface layer [18]. While the SMA10 is a traditional wearing course mixture, the UWM10 and M-UWM10 are newly developed wearing course mixtures. Based on Marshall mix design, the gradations for different asphalt mixtures are shown in Figure 1 and the Marshall design parameters for different asphalt mixtures are listed in Table 1.
Based on the designed asphalt mixtures, two test roads were paved. One was paved with AC13 used in the surface layer and M-UWM10 used in the wearing course above the AC13 layer. The other was paved with SMA13 used in the surface layer and SMA10 used in the wearing course above the SMA13 layer.
2.2. Test Procedures
2.2.1. Road Performance Evaluation
Since the designed ultra-thin wearing course mixtures are mainly used in the top surface layer or the wearing course layer of pavement to improve the surface functions instead of structure capacity of asphalt pavement, they should have good road performance, especially excellent rutting resistance and water stability to bear the environment conditioning and wheel loading. Thus, based on the standard test specifications of China, the road performances including permeability, high-temperature rutting resistance, low-temperature cracking resistance, moisture resistance were evaluated by permeability tests, wheel tracking tests, low-temperature bending beam tests, immersion Marshall tests and freeze-thaw splitting tests [19,20]. The wheel tracking test was conducted at 60 °C to get the dynamic stability to describe and compare the high-temperature rutting resistance of different asphalt mixtures. The low-temperature bending beam test was conducted at −10 °C to get the failure strain to describe and compare the low-temperature cracking resistance of different asphalt mixtures. Both immersion Marshall tests and freeze-thaw splitting tests were conducted to get the Marshall strength ratio and tensile strength ratio, separately, in order to describe and compare the moisture resistance of different asphalt mixtures.
2.2.2. Texture Depth Evaluation
To guarantee the driving safety, high-quality skidding resistance is an important characteristic for asphalt mixtures used in the top surface layer or the wearing course layer of pavement. Thus, the surface texture depth (TD) of asphalt mixture and pavement is usually used to describe the skidding resistance. However, the texture depth (TD) test that followed the standard protocol of Chinese specification cannot reveal the wearing resistance of asphalt mixtures, which is another important characteristic for asphalt mixtures used in the top surface layer or the wearing course layer of pavement. Thus, to reveal the degradation behaviour of surface texture of different asphalt mixtures that can represent their wearing resistance, the texture depth test was combined with the wheel tracking test in this study. The designed test processes were summarized as follows:
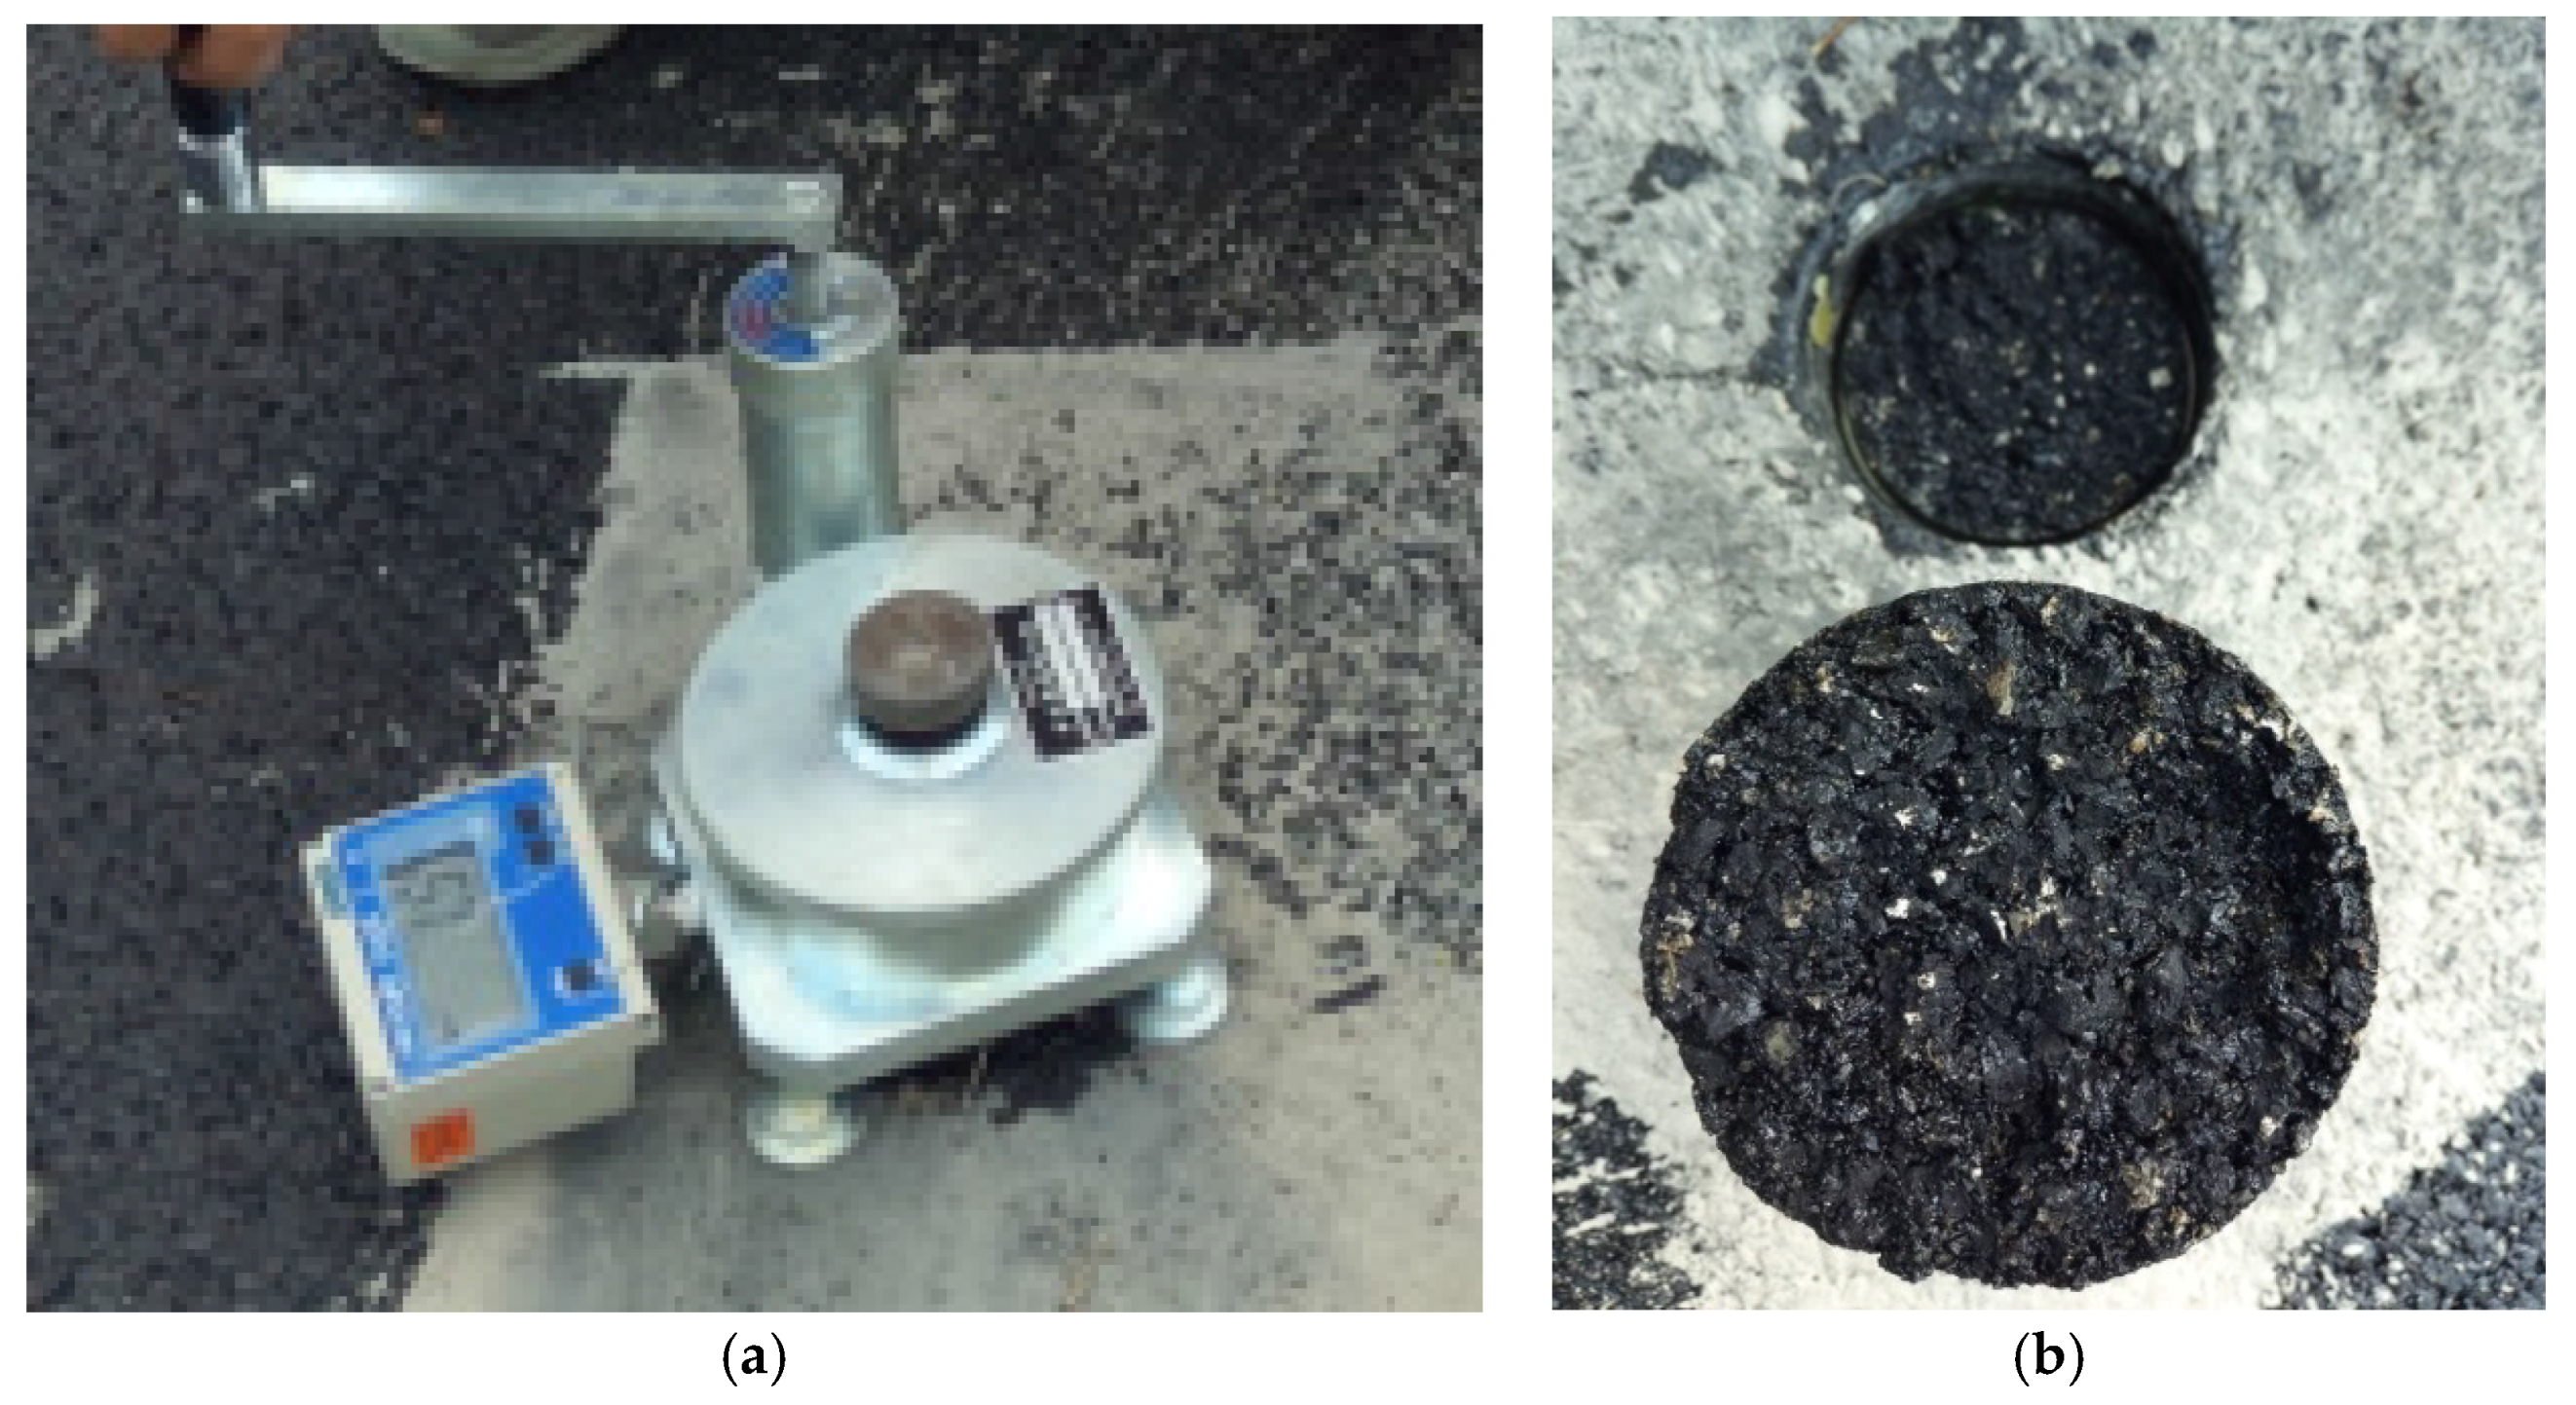
- After the rectangular specimen with dimensions of 300 × 300 × 50 mm was prepared for the wheel tracking test, its original texture depth (TD) named K0 was measured, as shown in Figure 2a.
- After the silica sands on the specimen surface were washed away, the specimen was submitted to the wheel tracking test for 180 minutes.
- After the wheel tracking test, the rutting area right underneath the wheel loading positions was cut from the tested specimen and then weighed to get its mass m1, as shown in Figure 2b.
- The texture depth K1 for the cut strip specimen, which represents the rutting area under the wheel loading positions after the wheel tracking test, was determined by Equation (1):where s is the top surface area of the cut strip specimen, and is the density of the silica sands.
- By comparing K0 and K1, the degradation degree of the surface texture depth caused by wheel loading can be obtained.
2.2.3. Interlay Bonding Evaluation
The interlayer bonding between the wearing course layer and its sublayer has important influences on its long-term durability. Thus, both the CT scanning test and the pull-out test were used to evaluate the interlayer bonding conditions.
The CT scanning test was conducted to evaluate the air voids within the wearing course mixture and between the wearing course layer and its sublayer. The basic principle for the 3D CT scanning technique was explained in Figure 3a and the basic parameters were shown in Table 2. Firstly, the specimen was scanned by transmitted X-rays from multiple directions, and then attenuated X-rays after transmission were gathered by the detector to rebuild 2D or 3D grey level images. The scanned specimen was a standard cylindrical sample cored from pavement and was cut flat at each side by the cutting machine. The test conditions were: voltage 200 kV, current 0.43 mA, and integration time of 300 ms.
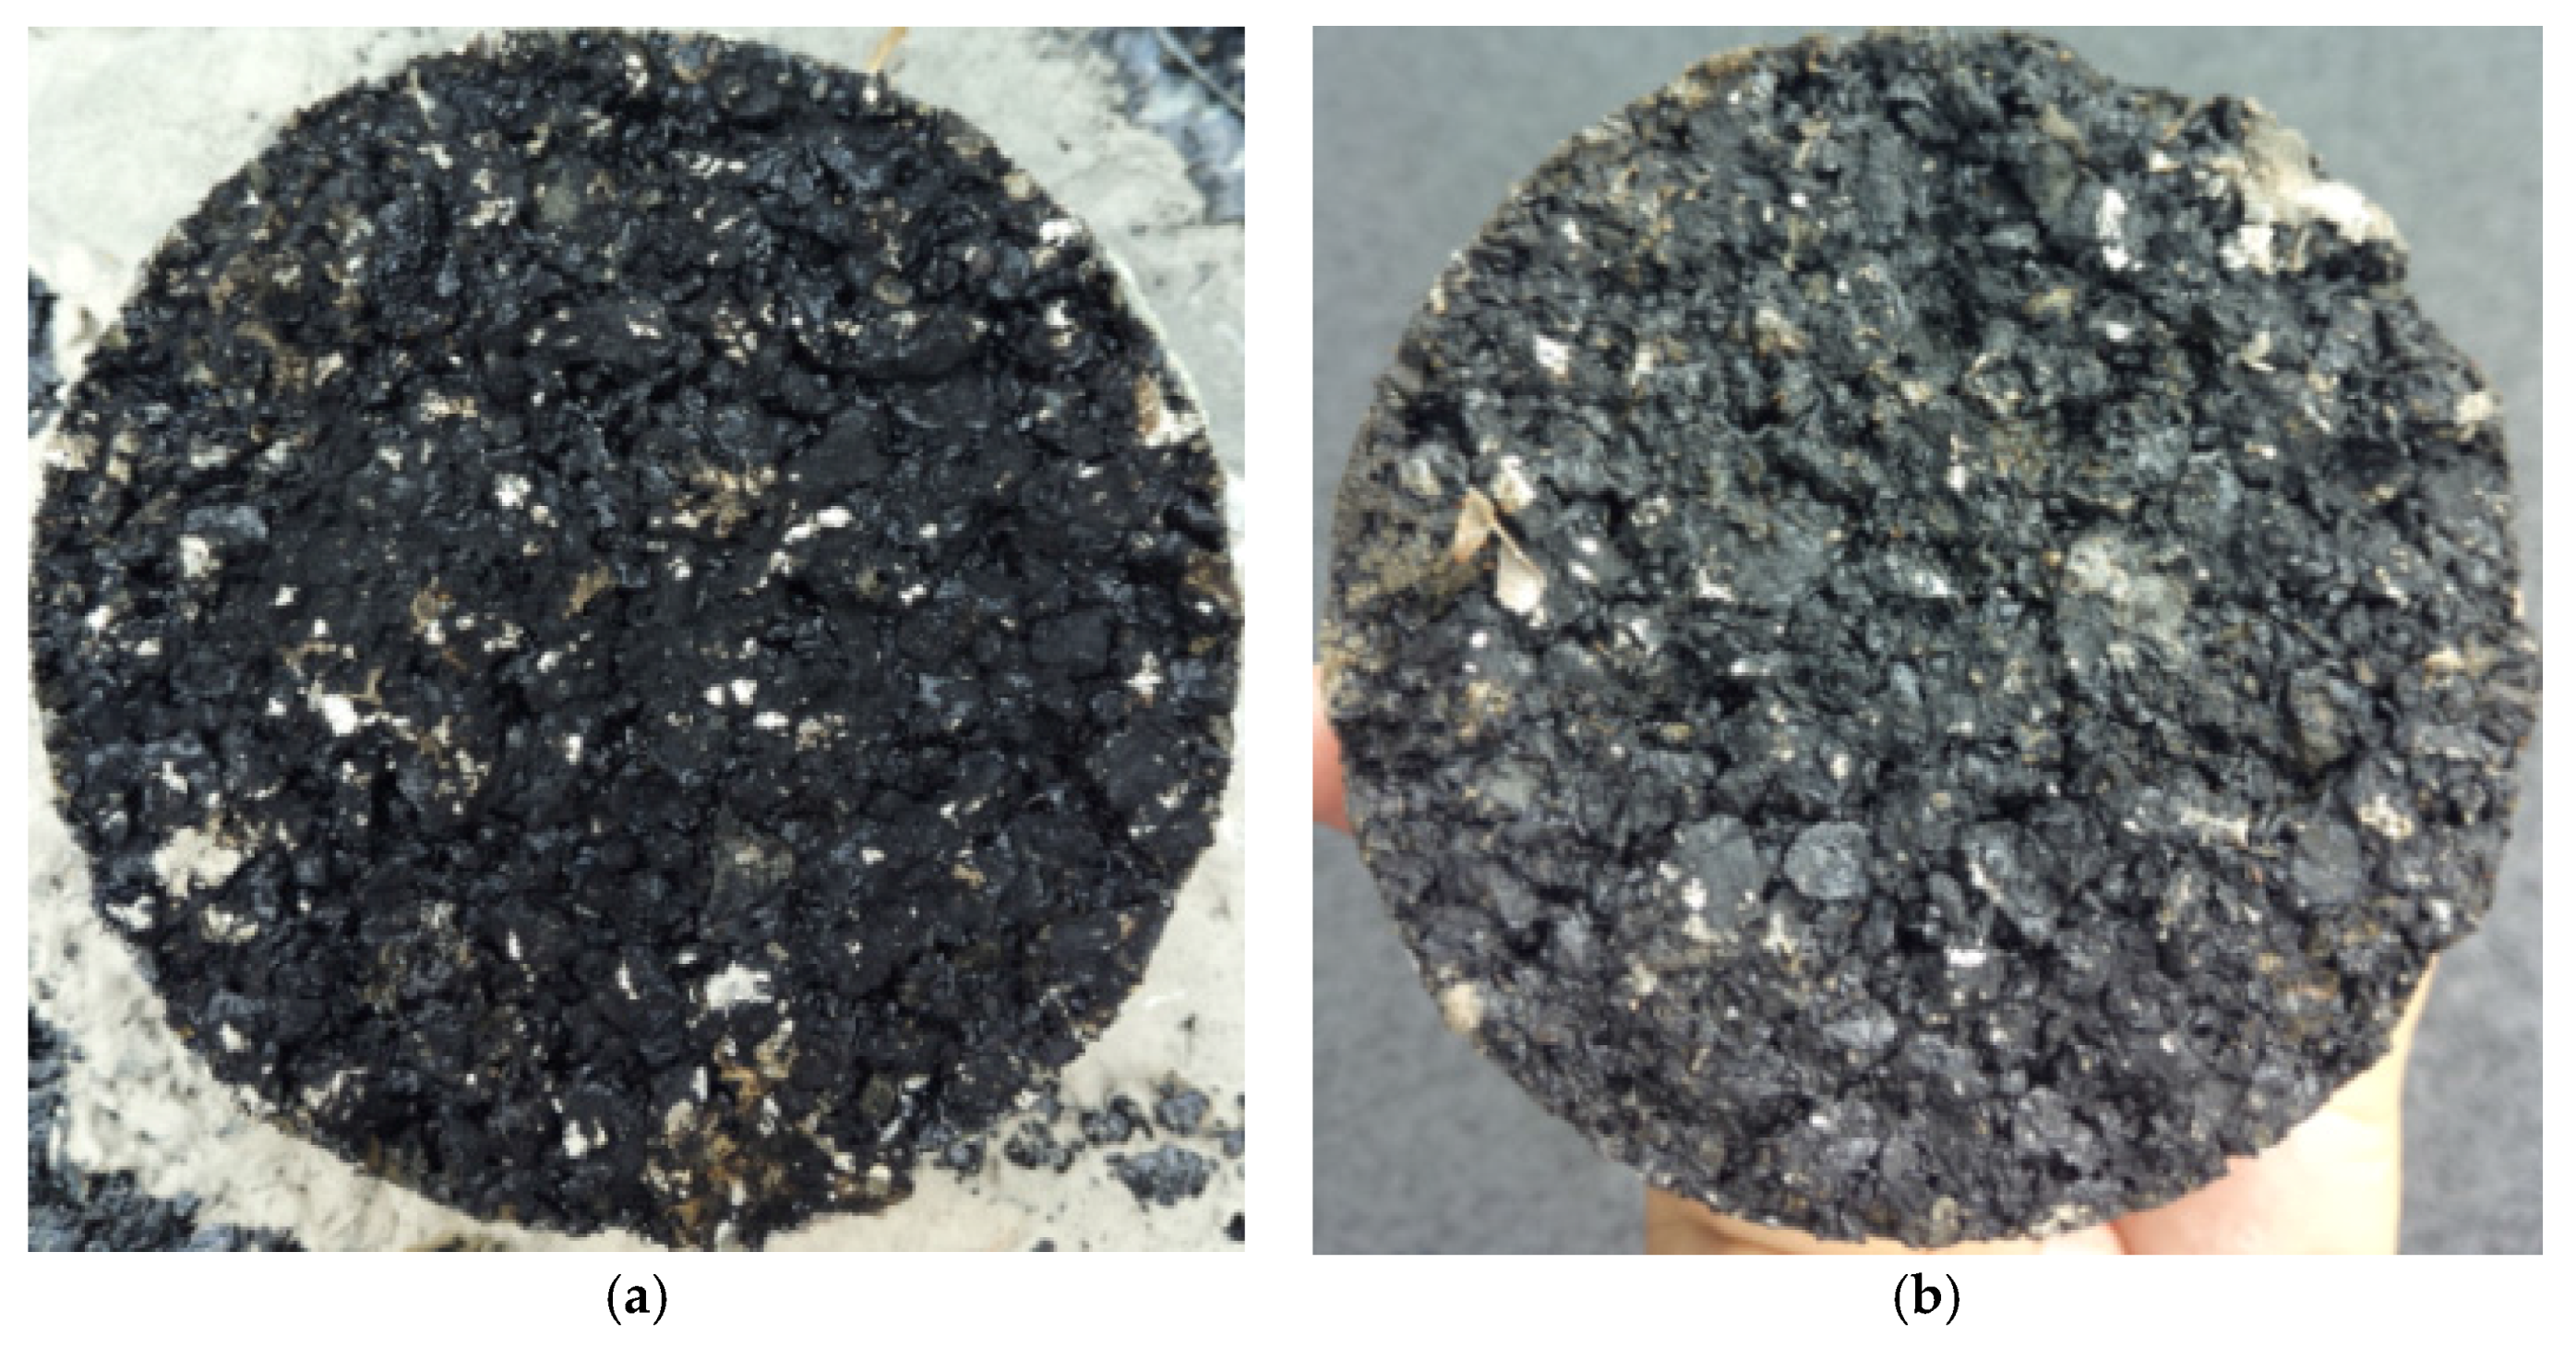
As shown in Figure 4, the pull-out tests were conducted on the field pavements with M-UWM10 wearing course and SMA10 wearing course. The bonding strength between the wearing course layer and its sublayer can be measured.
3. Result and Discussions
3.1. Road Performance Evaluation
Road performance evaluation were conducted for all of the five designed asphalt mixtures including M-UWM10, UWM10, SMA10, SMA13 and AC13. The test results of dynamic stability from the wheel tracking test, failure strain from the low-temperature bending beam test, the Marshall stability ratio from the immersion Marshall test and the tensile strength ratio from a freeze-thaw splitting test were shown in Figure 5, respectively. The requirements for a different road performance index from the Chinese specifications [21,22] were shown in Table 3.
First of all, from Figure 5 and Table 3, it can be seen that all of the designed asphalt mixtures can well meet the basic specification requirements. Based on Figure 5a, it can be seen that the M-UWM10 has much higher dynamic stability than the other asphalt mixtures. It proves that the multi-chain polyolefin modifier can well improve the high-temperature rutting resistance of the wearing course. From Figure 5b, it can be seen that the M-UWM10 has a similar failure strain to the other asphalt mixtures. It indicates that the multi-chain polyolefin modifier shows few influences on the low-temperature cracking resistance of the wearing course. From Figure 5c,d, it is clearly seen that the M-UWM10 has the highest Marshall stability ratio and tensile strength ratio. It means that the multi-chain polyolefin modifier can well improve the moisture resistance of the wearing course. Thus, the M-UWM10 has a better high-temperature rutting resistance and moisture resistance than other asphalt mixtures, which are beneficial for the wearing course to bear heavy traffic loading.
3.2. Texture Depth Evaluation
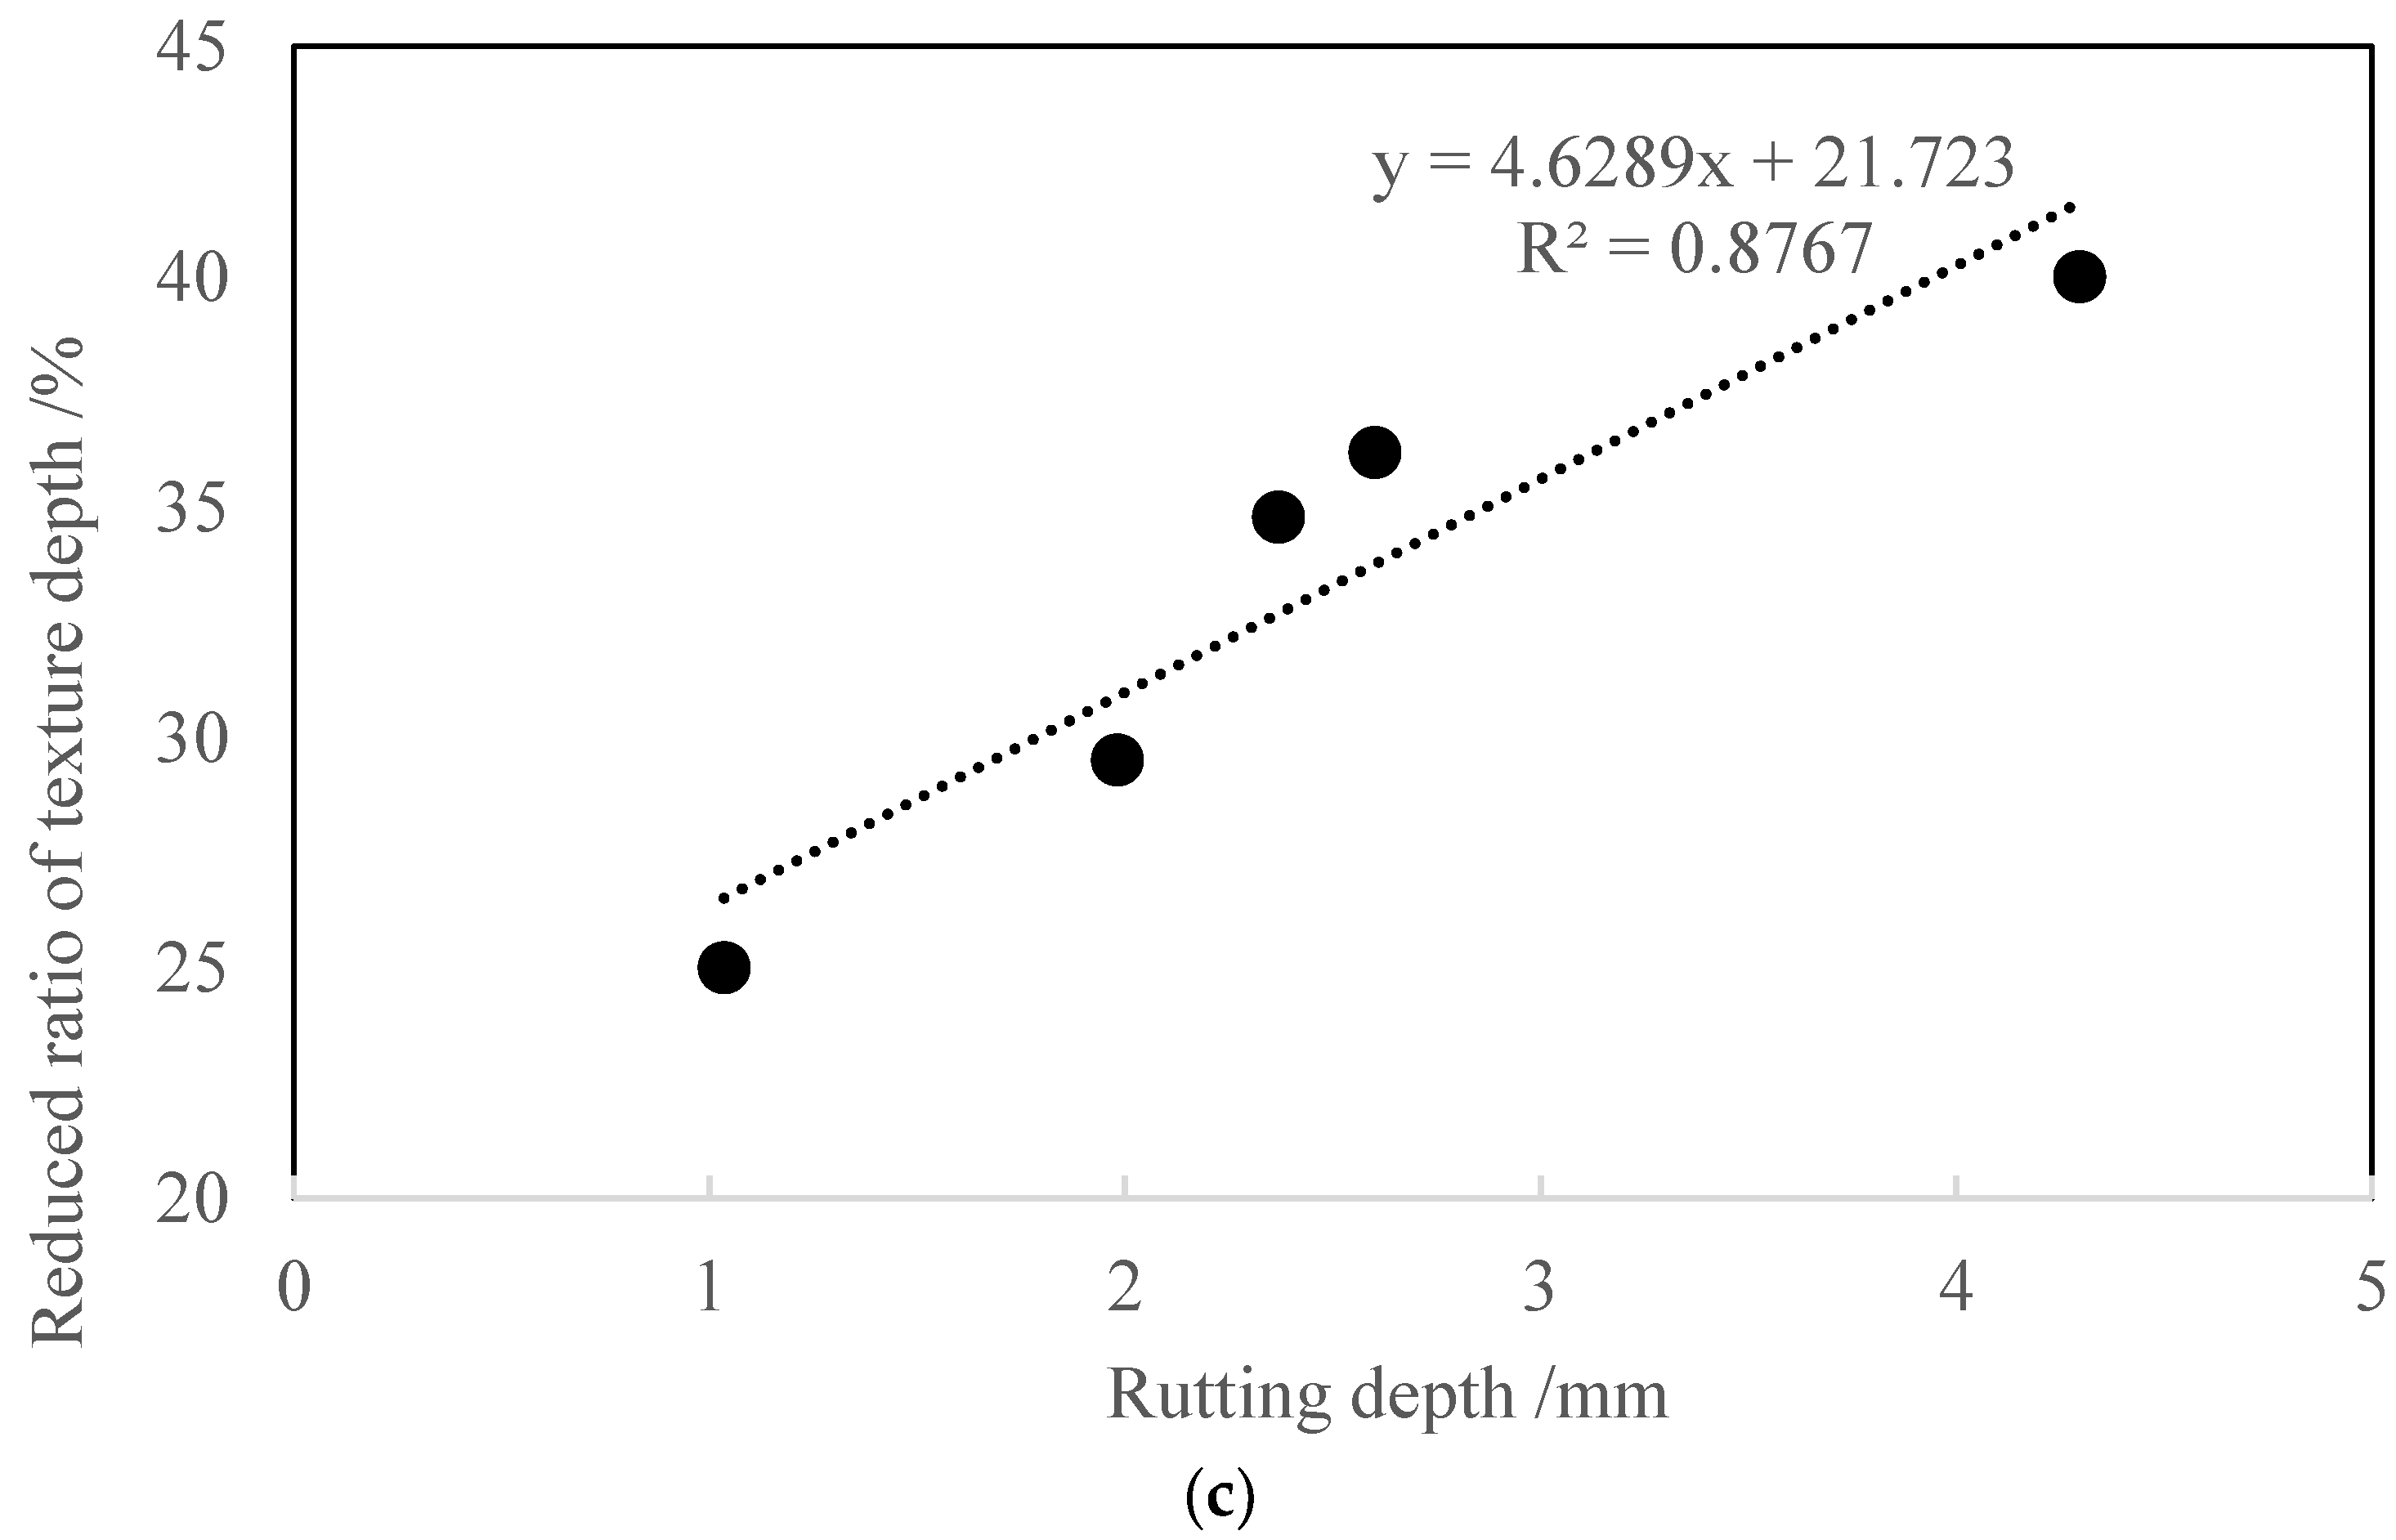
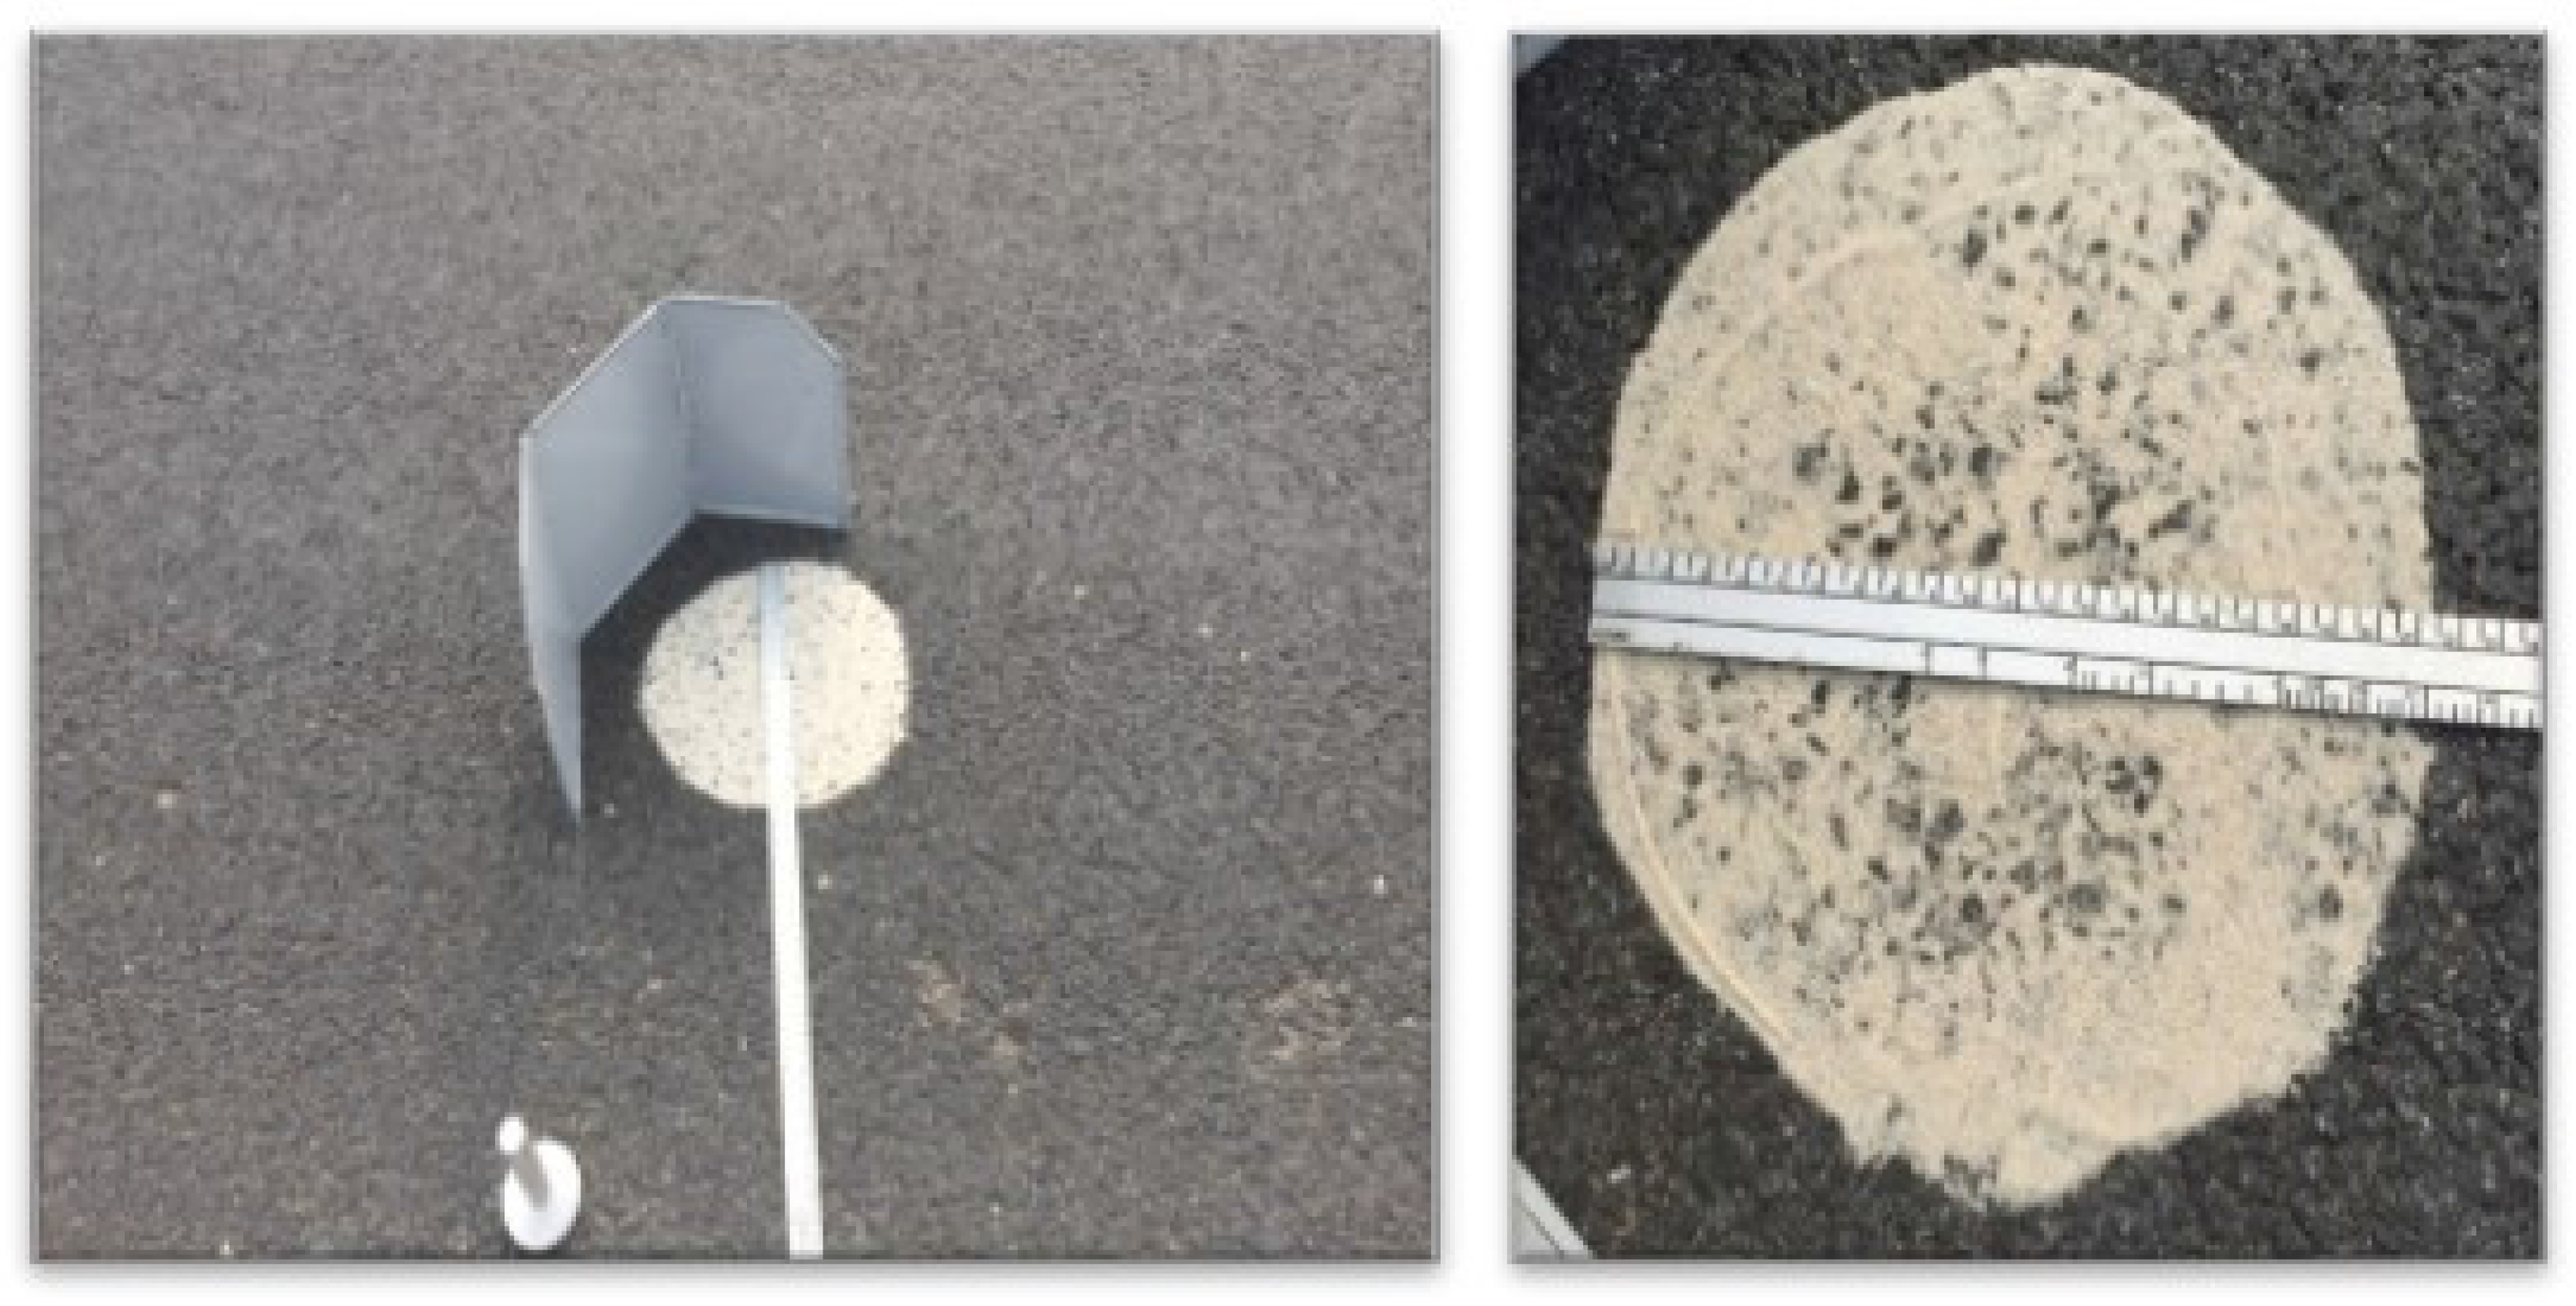
According to the previous test plan, all of the designed asphalt mixtures including M-UWM10, UWM10, SMA10, SMA13, and AC13 were submitted to the combination of the texture depth test and the wheel tracking test. The measured texture depth for different asphalt mixtures before and after the wheel tracking test are shown in Figure 6a, and the loss ratios defined as the texture depth after the wheel tracking test compared to the texture depth before the wheel tracking test are shown in Figure 6b. The rutting depth, for all of the five asphalt mixtures after the wheel tracking test are also shown in Figure 6b, and the correlation between the reduced ratio of texture depth and the rutting depth after the wheel tracking test is shown in Figure 6c. As shown in Figure 7, field texture depth tests were also conducted for the two test roads. Table 4 shows the field measured values of the original texture depth and the texture depth after one year of traffic loading for the two test roads with the M-UWM10 wearing course and the SMA10 wearing course, respectively.
From Figure 6a, it can be seen that the SMA mixtures have higher texture depth than the other three asphalt mixtures, which have similar texture depth. It is mainly because the SMA mixtures use gap gradation while the other three asphalt mixtures use dense gradation. From the data after the wheel tracking test shown in Figure 6a, it can be seen that, due to its original high texture depth, SMA13 still have the highest texture depth, the M-UWM10 and SMA10 have similar texture depth, and the UWM10 and AC13 show a similar texture depth, which are the lowest. From Figure 6b, it can be further seen that the UWM10 has the biggest reduced ratio of texture depth, SMA10 and AC13 show a similar reduced ratio, which are lower than that of UMW10, while M-UWM10 and SMA13 have a similar reduced ratio, which are lower than the other three mixtures. Furthermore, the M-UWM10 shows a lower reduced ratio than SMA13.
From Figure 6c, it could be observed that the reduced ratio of texture depth increases with the growing of rutting depth. It indicates that the degradation behaviour of texture depth has a good correlation with the rutting resistance of asphalt mixture, and higher rutting resistance leads to less degradation of texture depth during the wheel tracking test.
The field test results confirm well with the laboratory test analysis. From Table 4, it can be seen that, although the SMA10 has a bigger texture depth than the M-UWM10 before traffic loading, after one year of traffic loading, the SMA10 shows a higher reduced ratio of texture depth than the M-UWM10, and the texture depth of the two mixtures becomes similar to each other.
Thus, the M- UWM10 has similar skidding resistance with other dense graded asphalt mixtures such as AC13 but better wearing resistance than other asphalt mixtures including both the dense graded asphalt mixture and the gap graded asphalt mixture.
3.3. Interlay Bonding Evaluation
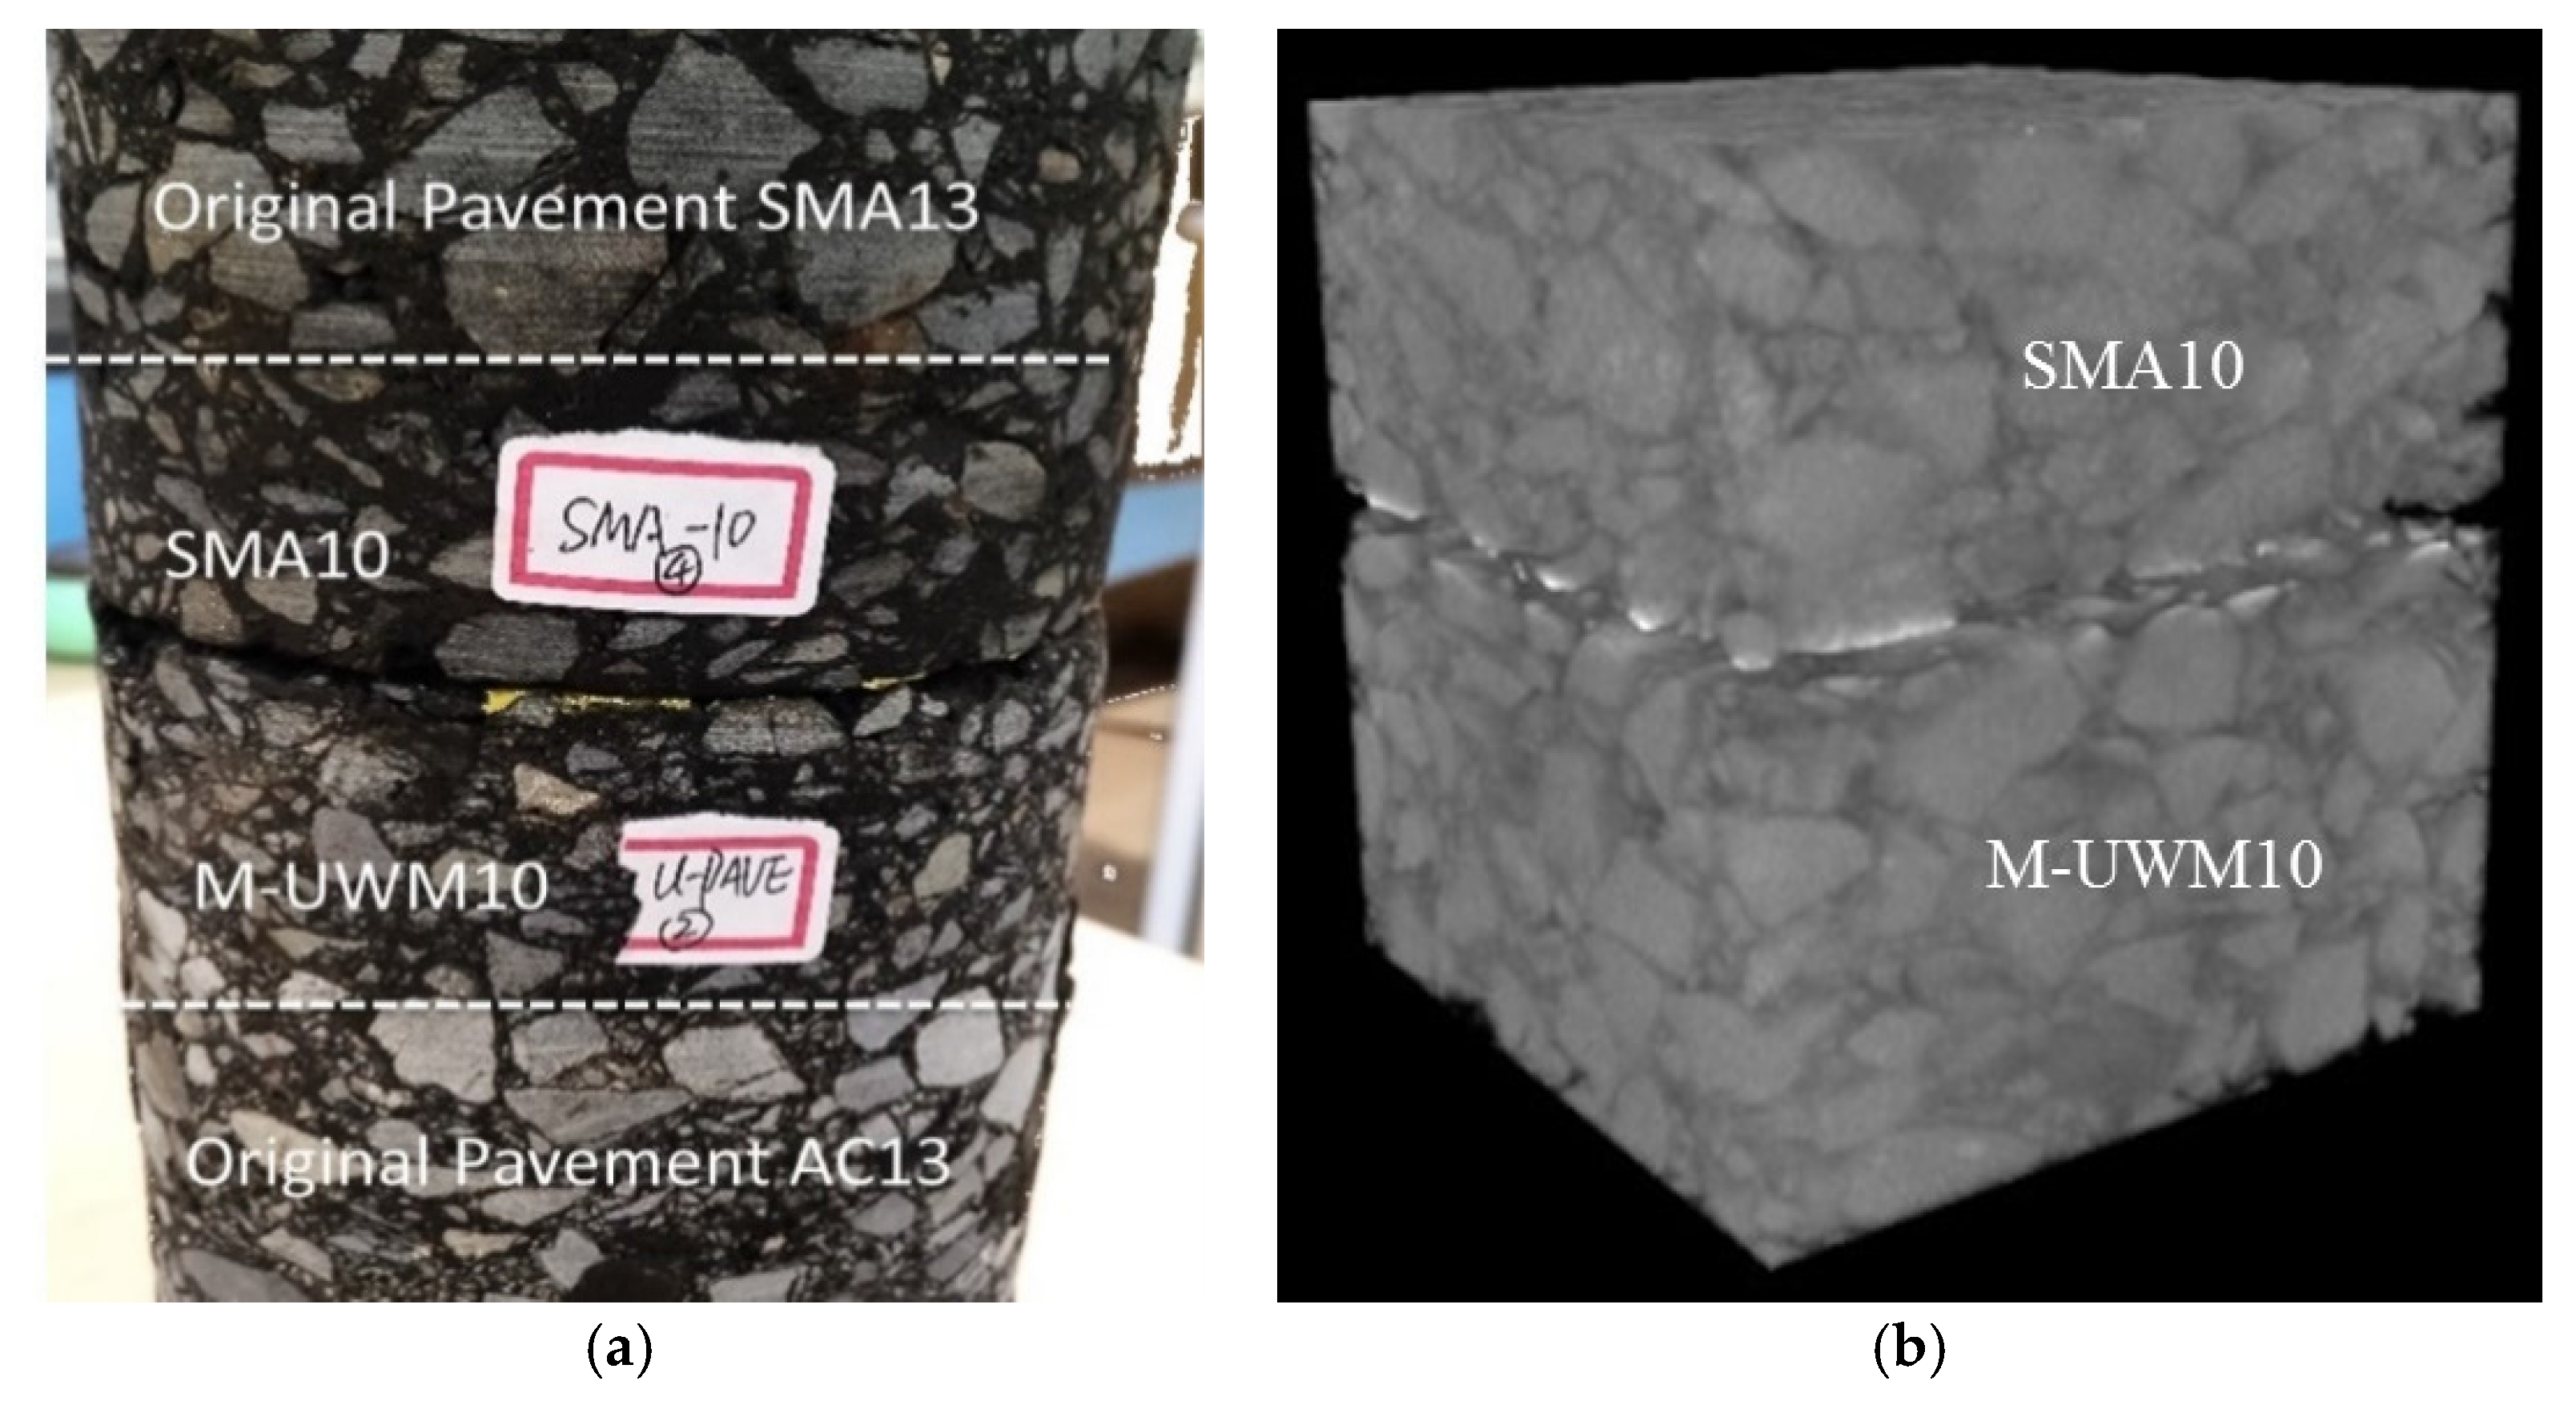
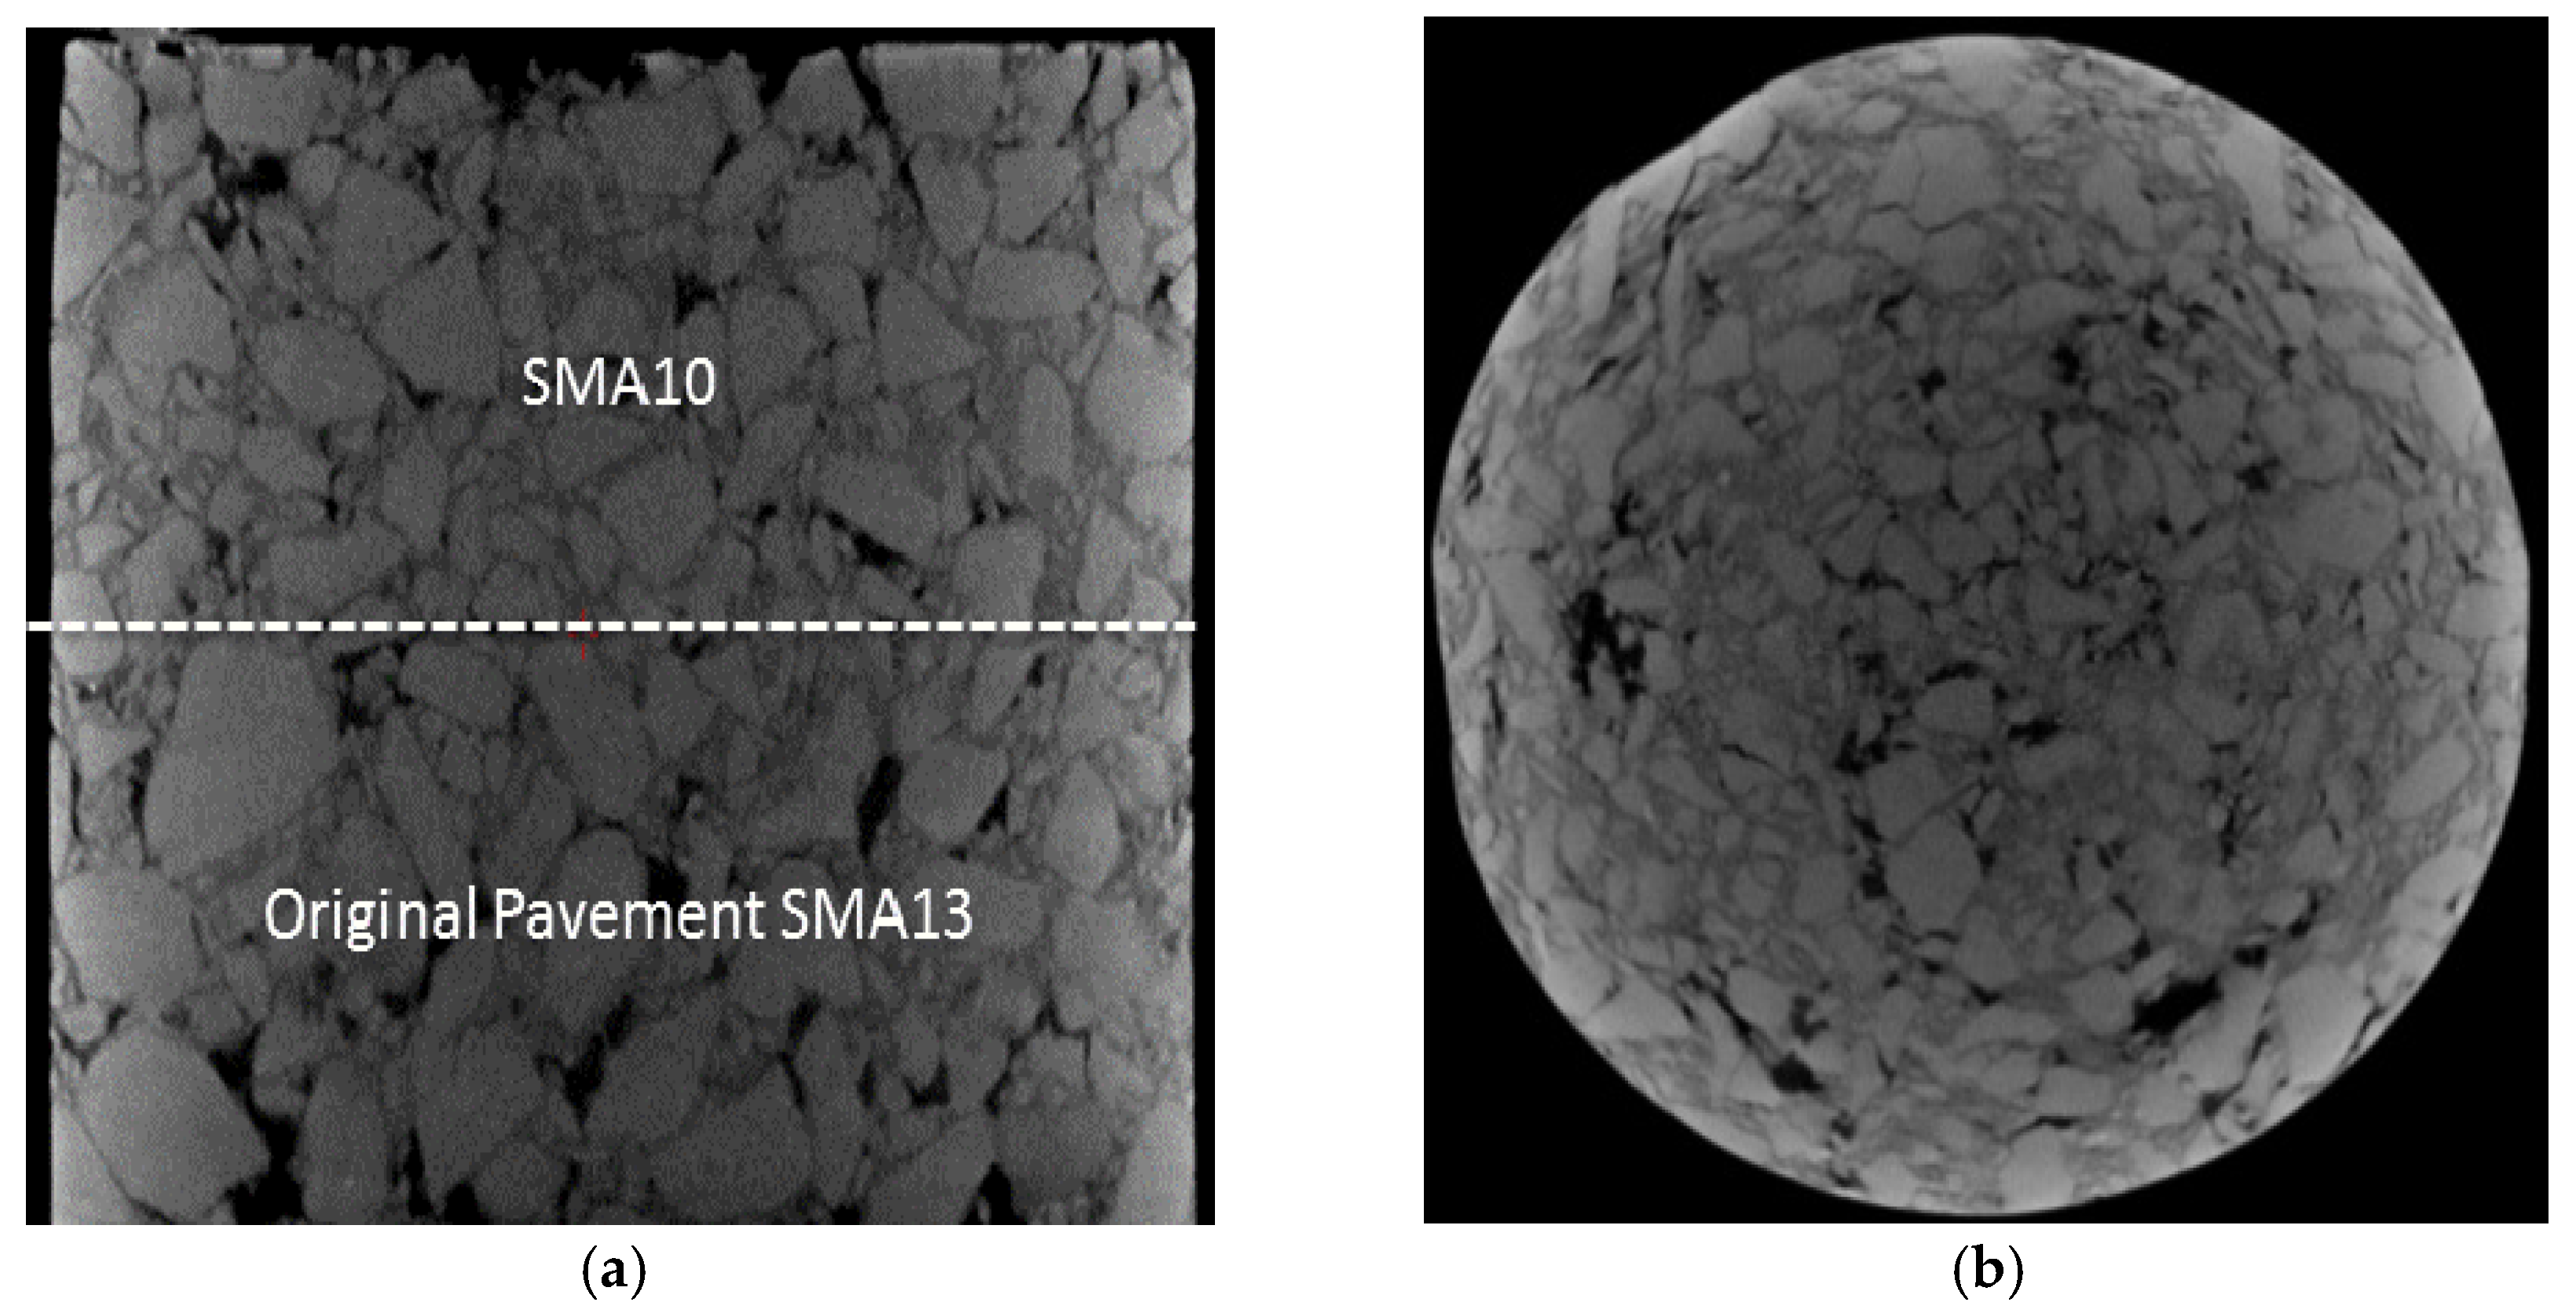
Samples consisted of the wearing course mixture and the top surface layer mixture was cored from the two test roads and submitted to CT scanning tests. Examples of the cored samples and the 3D rebuilt images for the two wearing course mixtures including M-UWM10 and SMA10 based on the CT scanning were shown in Figure 8. The CT scanning results for the M-UWM10 sample and the SMA10 sample are shown in Figure 9 and Figure 10, respectively.
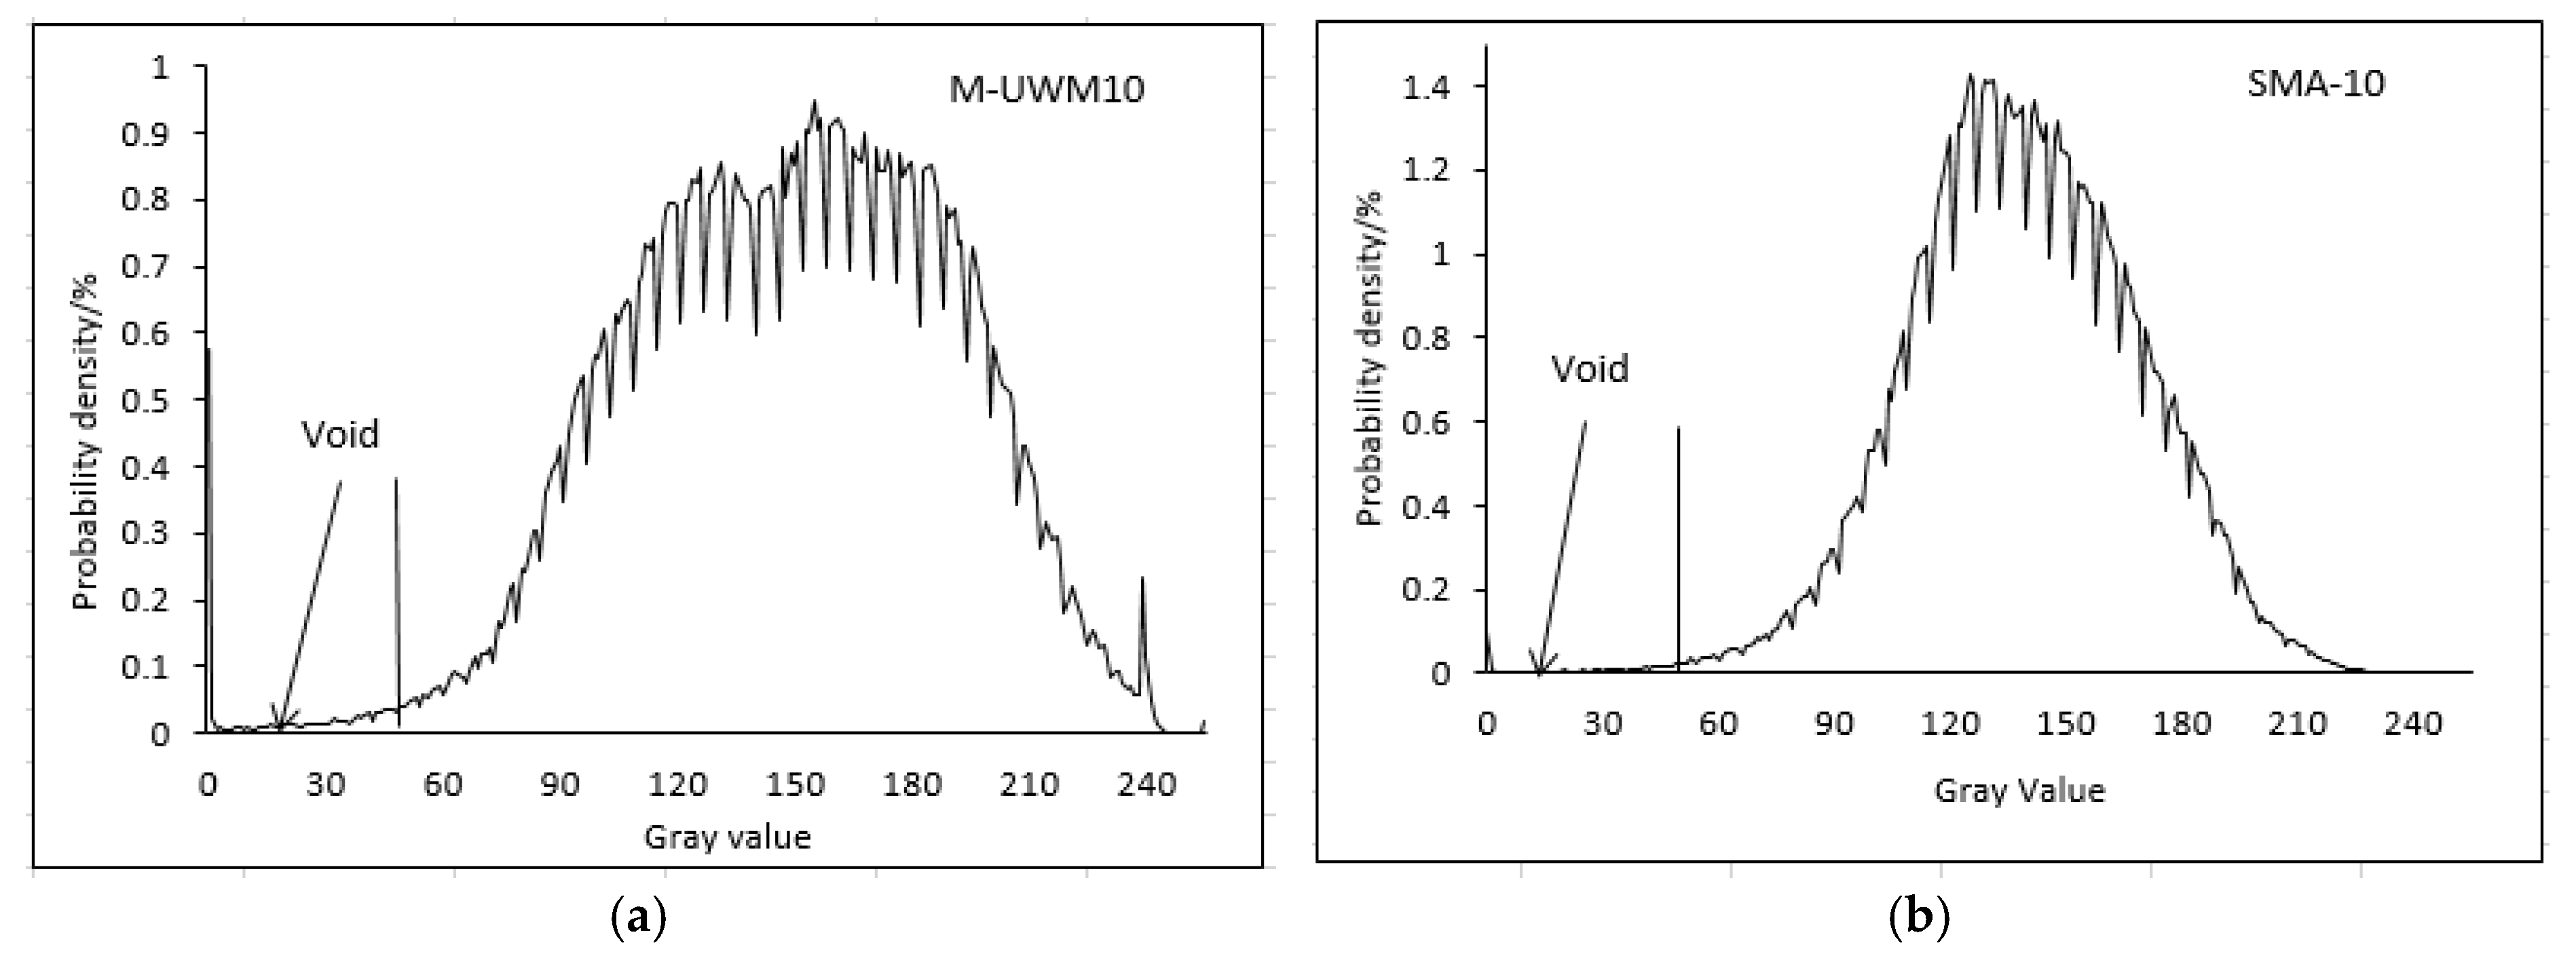
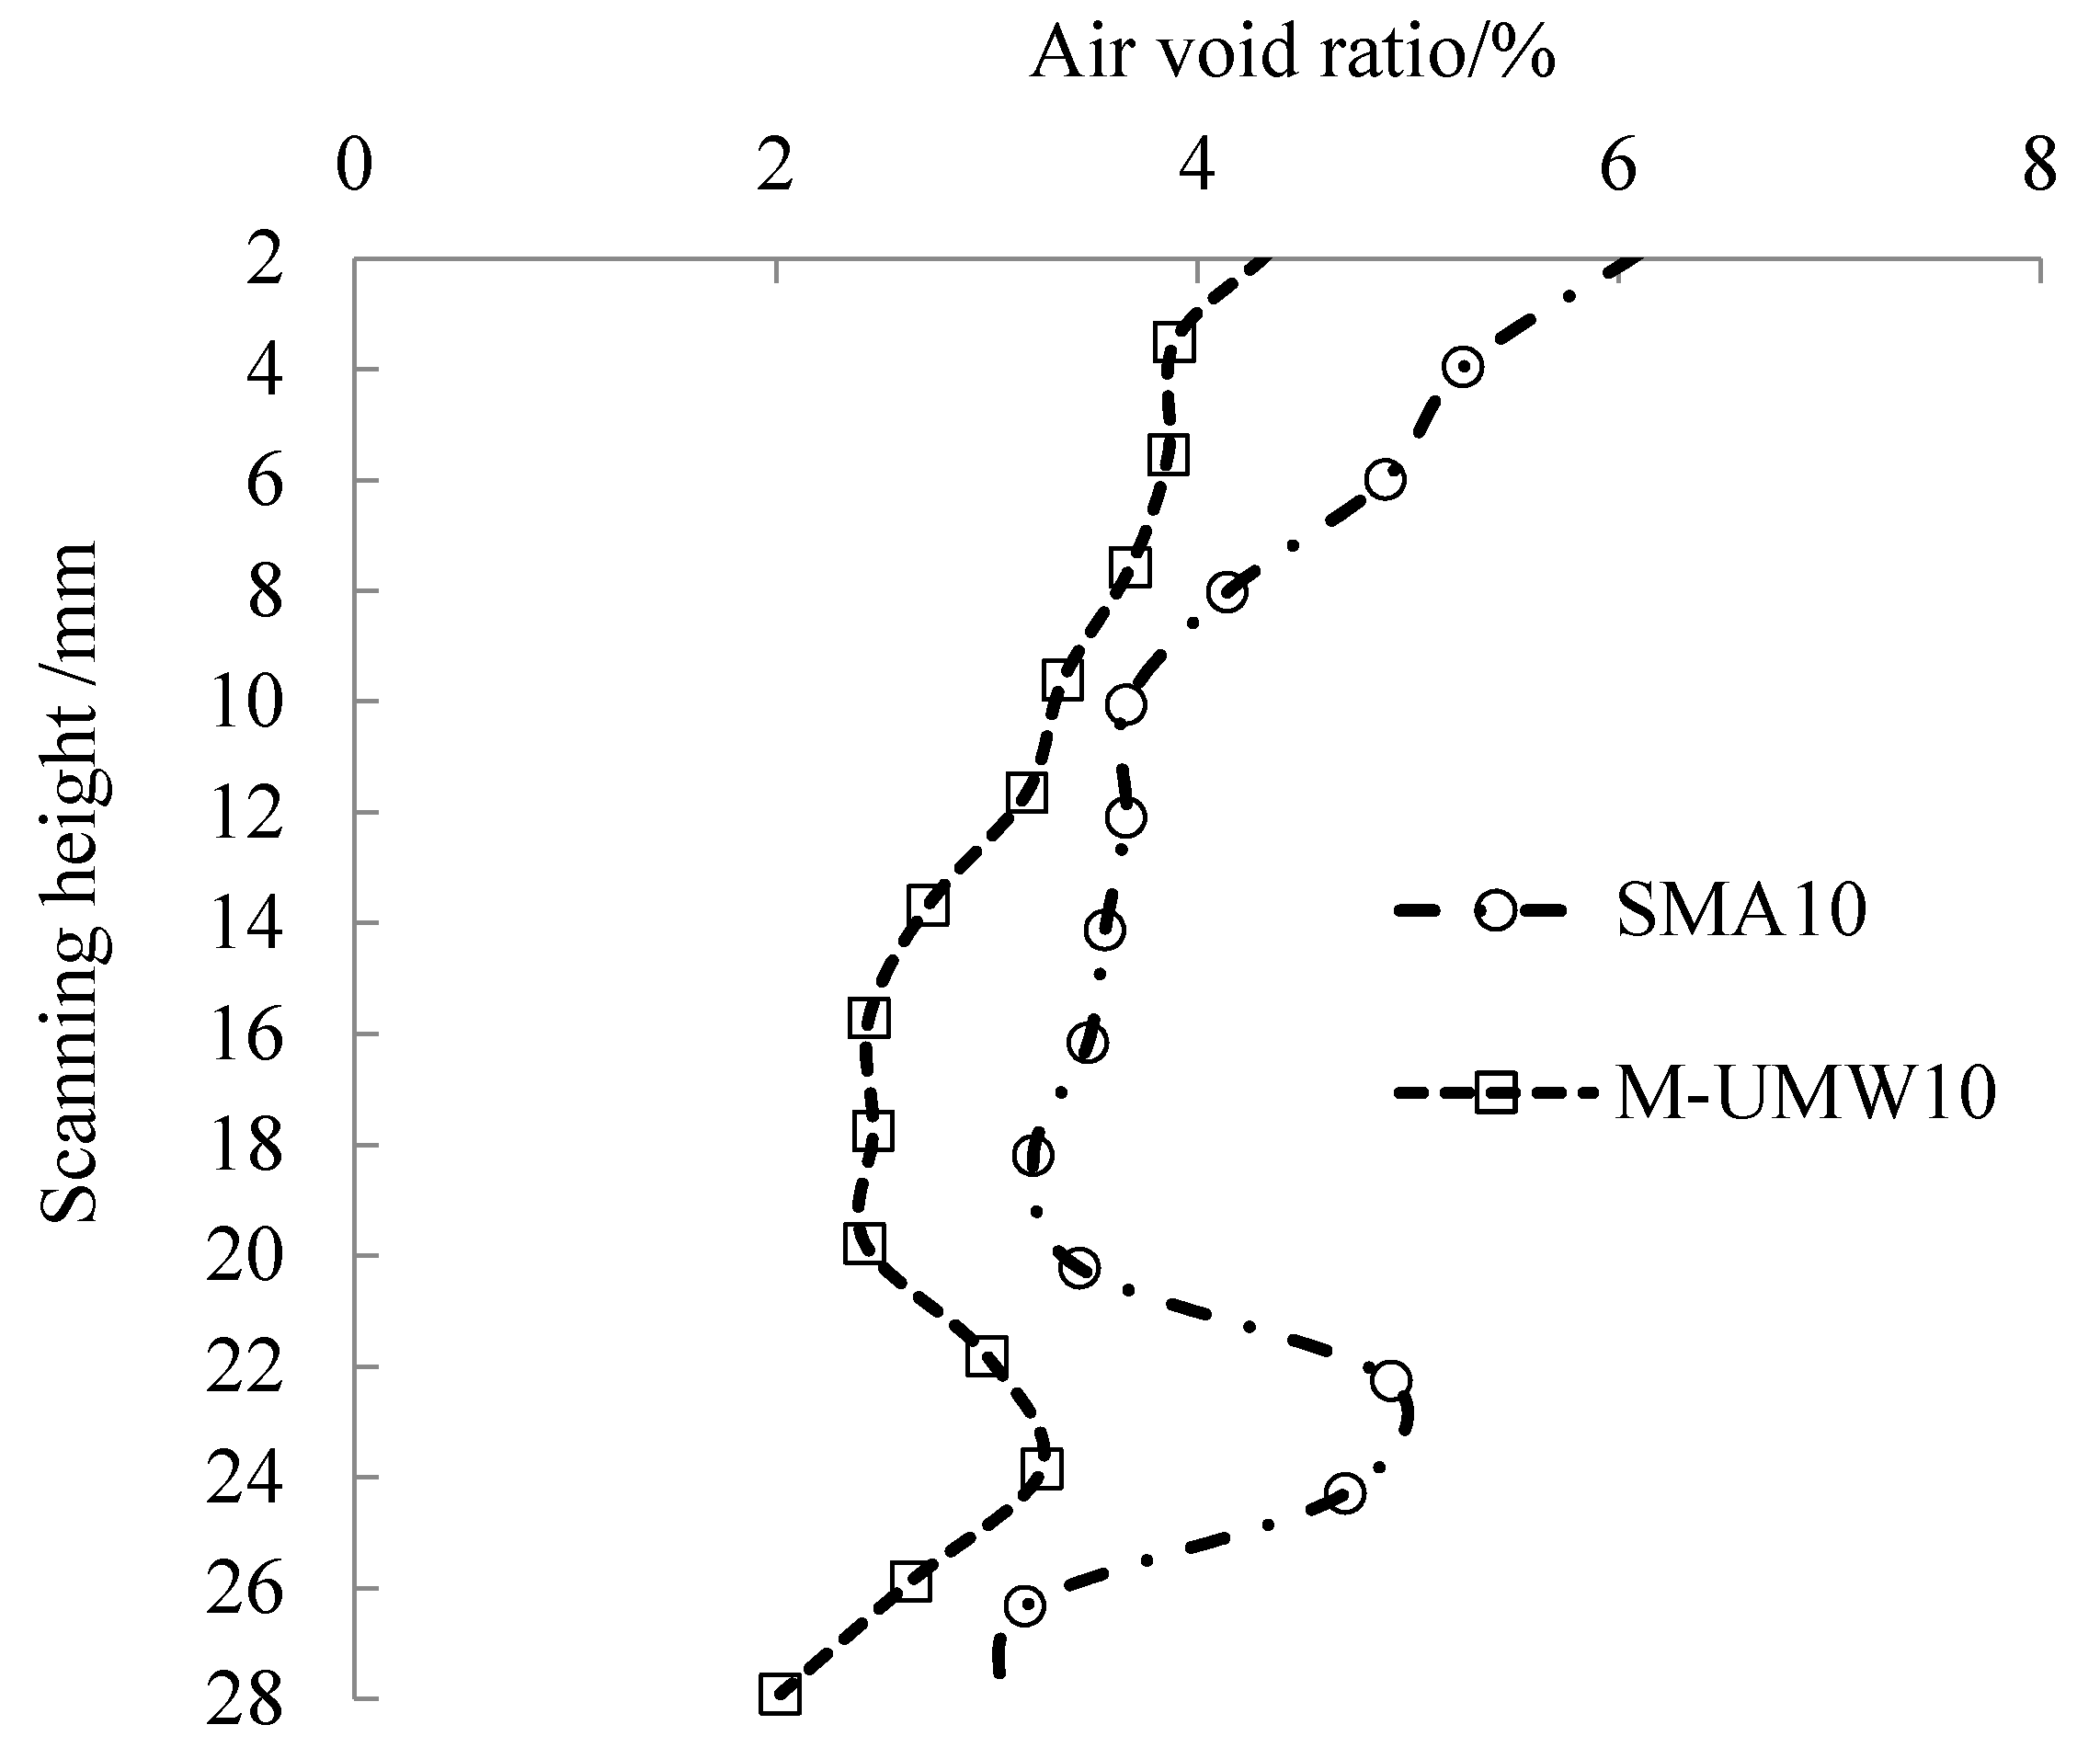
Based on the CT scanning images of the cored samples, grey processing of the images was conducted and Origin software (version, Manufacturer, City, US State abbrev. if applicable, Country) was used to calculate the air void ratios. The grey level versus probability density distribution curve was depicted in Figure 11. Since the grey level value for air voids was usually less than 30, the air void ratio was calculated by integrating from 0 to 30. The distribution of the air void ratios along the scanning height of the cored samples for the two different wearing course mixtures are shown in Figure 12. The average air void ratio within the wearing course mixture and the average air void ration on the interface between the wearing course mixture and the sub-layer mixture were also calculated. The calculate results for the two different cored samples were shown in Figure 13.
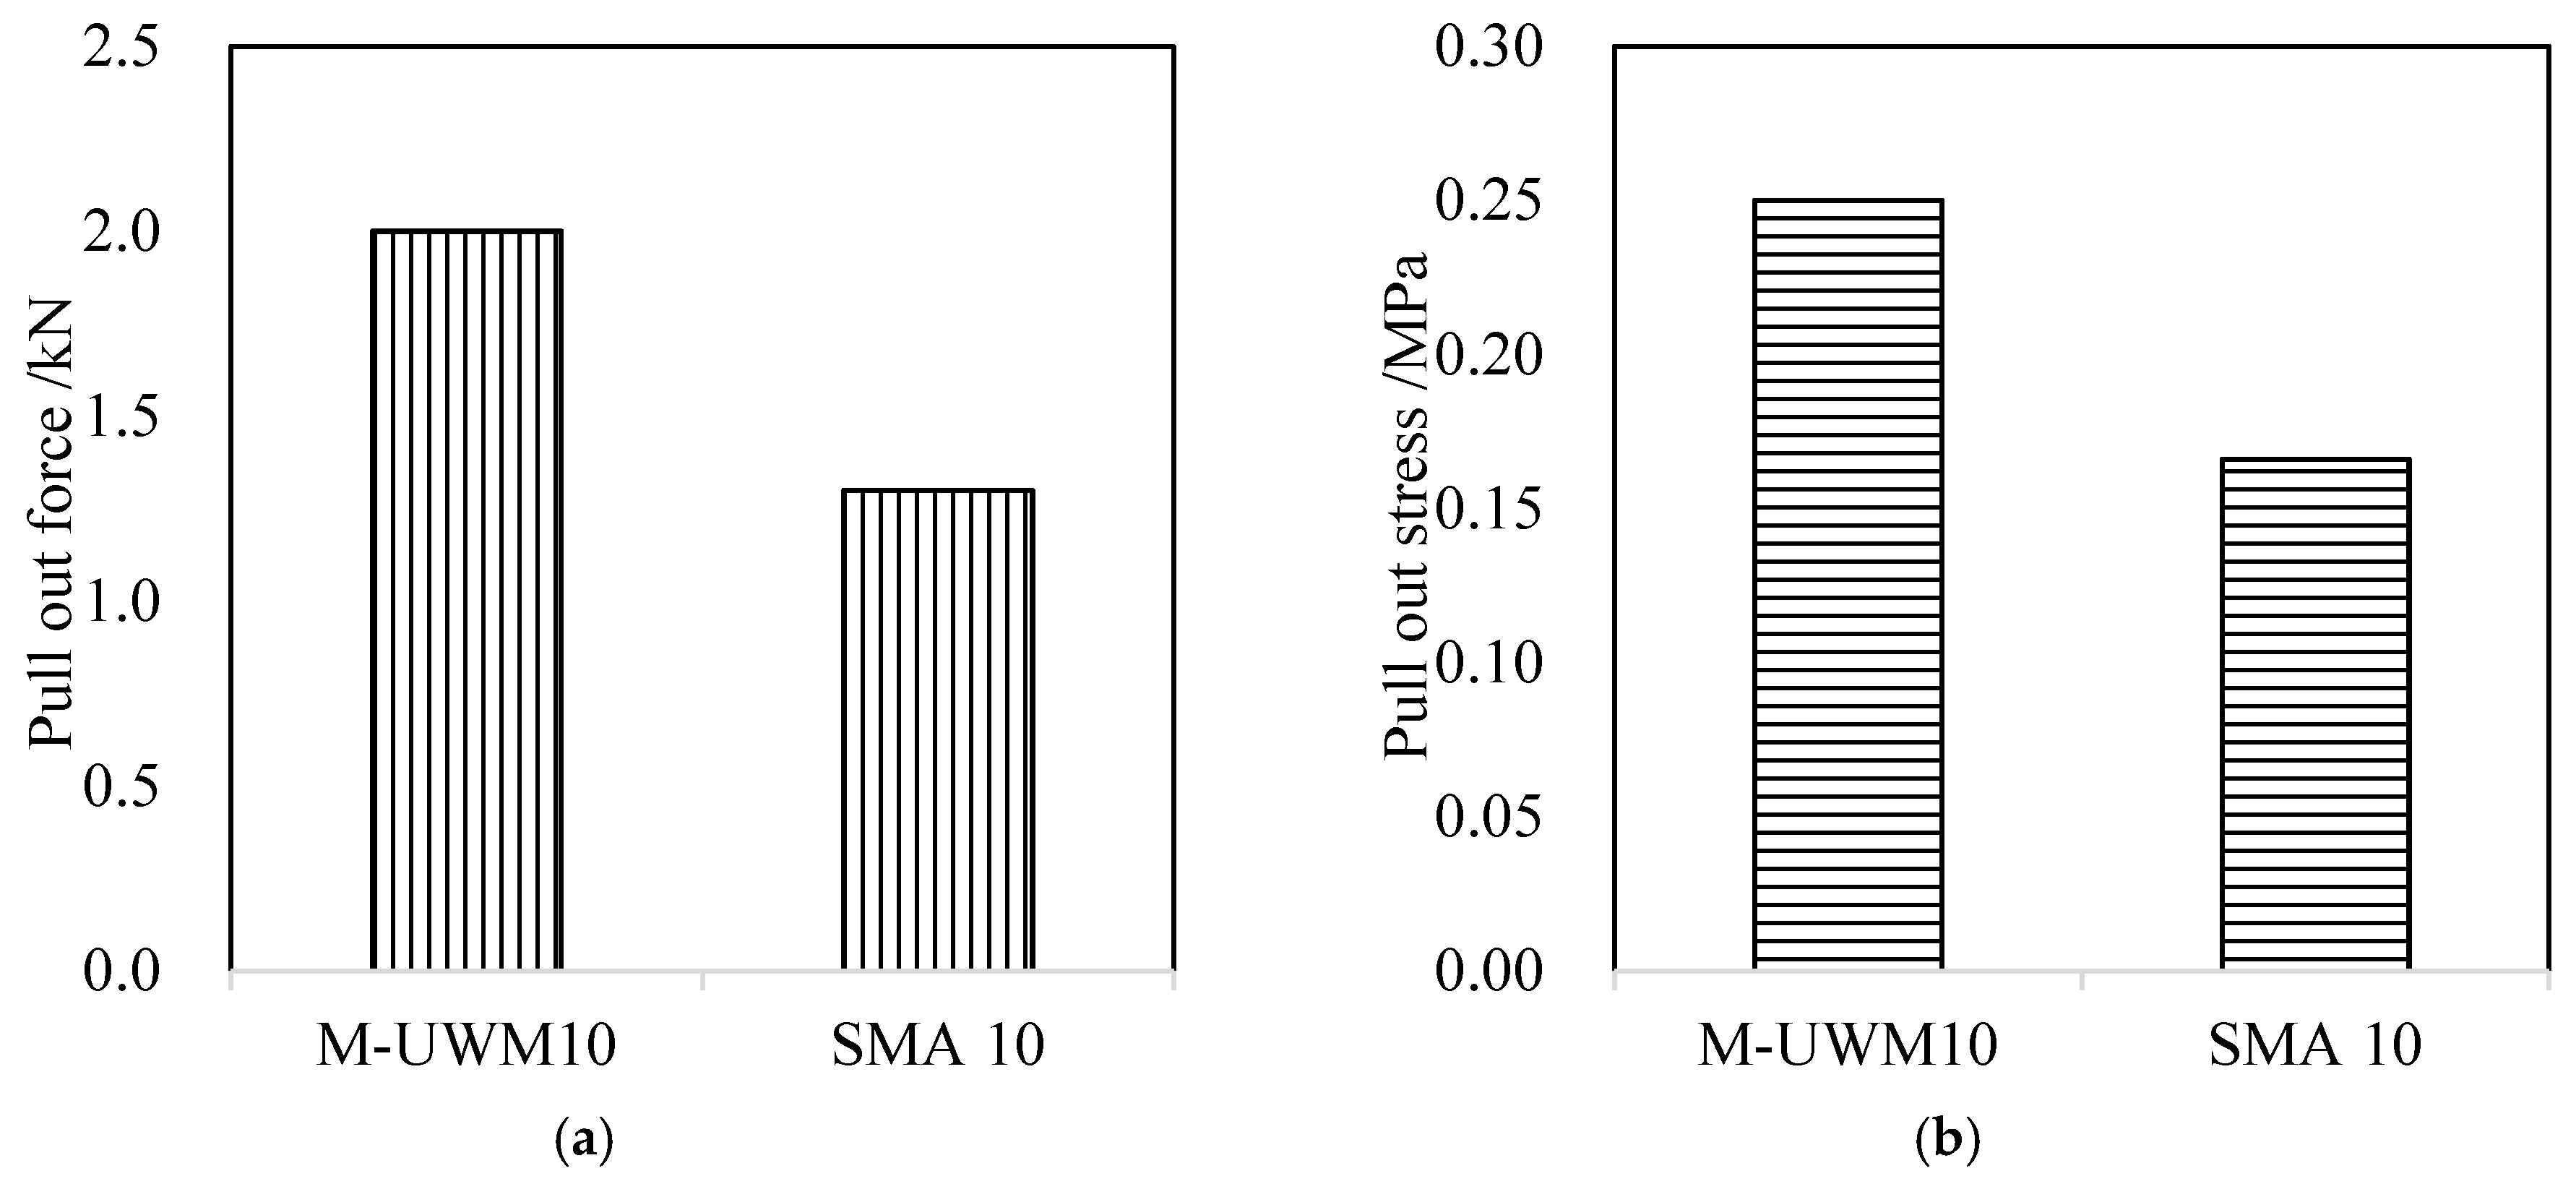
From Figure 12 and Figure 13, it can be seen that, no matter for the air void at the same height or for the average air void, the air void ratios of the M-UWM10 are lower than that of the SMA10. It could be attributed to better construction workability of M-UWM10 than SMA10. Meanwhile, it can be seen from Figure 13 that the interface air void ratio of M-UWM10 pavement is lower than that of the SMA10 pavement. Both the smaller average air void ratio and interface air void ratio are helpful to improve the bonding effect between the wearing course and the sub-layer. It is well confirmed by the test results from the field pull out test. Figure 14 shows the pull-out samples from field pavements for M-UWM10 and SMA10. The pull-out force and pull-out stress for the two wearing course mixtures are shown in Figure 15. It can be seen, that the bonding strength between M-UWM10 and its sublayer is much better than that between SMA10 and its sublayer. Thus, the wearing course consisted of M-UWM10 shows better structural integrity with the underneath pavement surface than the wearing course consisted of SMA10.
4. Conclusions
Based on the laboratory and field tests, the following conclusions can be drawn:
- A dense-graded ultra-thin wearing course mixture with multi-chain polyolefin modifier and SBS modified asphalt was prepared in this paper. It is proved that the designed asphalt mixture has satisfied high-temperature rutting resistance, low-temperature cracking resistance and moisture resistance to bear the traffic loading and environment effects.
- The test results from combined tests of the wheel tracking test and the texture depth test proved that the designed wearing course mixture shows satisfied skidding resistance and wearing resistance. Field texture depth test results confirmed that the designed wearing course mixture is promising to keep long-term skidding resistance during traffic loading.
- Laboratory and field tests based on the test road indicated that the wearing course paved with the designed ultra-thin wearing course mixture can provide satisfied water-proof and interlayer bonding effects, which are helpful to improve the pavement durability.
- Future work will focus on the fatigue resistance of the ultra-thin wearing course mixture.
Acknowledgments
This work is financially supported by the Natural Science Foundation of China (No. 51378006 and No. 51378123), the Natural Science Foundation of Jiangsu (BK20161421), the Fundamental Research Funds for the Central Universities (No. 2242015R30027), and the Open Fund of the State Engineering Laboratory of Highway Maintenance Technology (Changsha University of Science and Technology, kfj160104). The author would like to thank his collaborators and support from the Jiangsu Sinoroad Engineering Research Institute Co., Ltd and Southeast University.
Author Contributions
Tao Ma conceived and designed the experiments; Pengsen Hu performed the experiments; Junhui Zhang analyzed the data; Xiaoming Huang contributed materials and apparatus; Lei Geng wrote the paper.
Conflicts of Interest
The founding sponsors had no role in the design of the study; in the collection, analyses, or interpretation of data; in the writing of the manuscript, and in the decision to publish the results.
References
- Luo, Y.L. Brief introduction to application of maintenance technology on ultra-thin wearing course for asphalt pavement of expressway. Guangdong Highway Commun. 2011. [Google Scholar] [CrossRef]
- Pei, P.; Peng, G.J. Application of ultra-thin wear layer technology in expressway maintenance. W. China Commun. Sci. Technol. 2015, 12, 23–26. [Google Scholar] [CrossRef]
- Qiao, X.L. Application of novachip ultra-thin wearing layer in highway maintenance. Transport. Standard. 2013, 18. Available online: http://xueshu.baidu.com/s?wd=paperuri%3A%2832b4e61b2b25b0508cfc06e363ef4551%29&filter=sc_long_sign&tn=SE_xueshusource_2kduw22v&sc_vurl=http%3A%2F%2Fen.cnki.com.cn%2FArticle_en%2FCJFDTOTAL-JTBH201318005.htm&ie=utf-8&sc_us=14205075173698836325 (accessed on 6 August 2017).
- Yang, Y.H.; Shen, Y.; Gao, X.X. Analysis interlayer shear stress of ultra-thin wearing course considering temperature and different interlayer contact conditions. Appl. Mech. Mater. 2014, 505–506, 102–105. [Google Scholar] [CrossRef]
- Tan, Y.Q.; Yao, L.; Wang, H.P.; Bian, X.; Yu-Xiang, Q.I. Performance evaluation indicator of ultra-thin wearing course asphalt mixture. J. Harbin Inst. Tech. 2012, 44, 73–77. [Google Scholar]
- Zhi-Tao, H.U.; Niu, X.X. Application of novachip ultra-thin wearing layer of asphalt pavement on the preventive maintenance engineering of expressways. Guangdong Highway Commun. 2009, 3. Available online: http://xueshu.baidu.com/s?wd=paperuri%3A%2817fe1a1403e497837a8ed55c1959682d%29&filter=sc_long_sign&tn=SE_xueshusource_2kduw22v&sc_vurl=http%3A%2F%2Fen.cnki.com.cn%2FArticle_en%2FCJFDTOTAL-GDGT200903003.htm&ie=utf-8&sc_us=6153204051113523490 (accessed on 6 August 2017).
- Chan, S.; Lane, B.; Kazmierowski, T. Pavement preservation—a solution for sustainability. Transport. Res. Rec. 2011, 47, 36–42. [Google Scholar] [CrossRef]
- Kandhal, P.S.; Lockett, L. Construction and performance of ultrathin asphalt friction course; NCAT Report No. 97-5; National Center for Asphalt Technology of Auburn University: Auburn, AL, USA, September 1997. [Google Scholar]
- Pretorius, F.J.; Wise, J.C.; Henderson, M. Development of application differentiated ultra-thin asphalt friction courses for southern african application. In Proceedings of the 8th Conference on Asphalt Pavements for Southern Africa, Sun City, South Africa, 12–16 September 2004. [Google Scholar]
- Zeng, M.L.; Peng, L.Q.; Chao-Fan, W.U.; Tan, B.Y. Experimental study of the performance of ultrathin asphalt friction course. J. Wuhan Univ. Technol. 2012, 4. U414. [Google Scholar]
- Yang, X.; Ling, J.; Chaofan, W.U.; Zeng, Z. Evaluation of performance of novachip ultrathin asphalt friction course. Highway Eng. 2013, 1. Available online: http://en.cnki.com.cn/Article_en/CJFDTOTAL-ZNGL201301004.htm (accessed on 6 August 2017).
- Ministry of Transport of the People′s Republic of China. Specifications for design of highway asphalt; China Communications Press: Beijing, China, 2006.
- Xiao, F.; Amirkhanian, S.N. Effects of liquid antistrip additives on rheology and moisture susceptibility of water bearing warm mixtures. Constr. Build. Mater. 2010, 24, 1649–1655. [Google Scholar] [CrossRef]
- Wu, S. Assessment of bonding behaviours between ultrathin surface layer and asphalt mixture layer using modified pull test. J. Adhes. Sci. Technol. 2015, 29, 1508–1521. [Google Scholar]
- Rahaman, F.; Musty, H.Y.; Hossain, M. Evaluation of recycled asphalt pavement materials from ultra-thin bonded bituminous surface. In Proceedings of the GeoCongress 2012, Oakland, CA, USA, 25–29 March 2012. [Google Scholar] [CrossRef]
- Yang, Y.H.; Liu, Z.; Gao, J.X.; Zhu, G.S. Bonding characteristics analysis of ultra-thin overlay of asphalt pavement layer. Appl. Mech. Mater. 2012, 178–181, 1245–1249. [Google Scholar] [CrossRef]
- Weidong, C.; Jianrong, S.; Hengchun, H. Introduction of Technology of Ultra-thin Asphalt Friction Course. Petrol. Asphalt 2005, 19, 56–59. [Google Scholar]
- Pasetto, M.; Baldo, N. Influence of the aggregate skeleton design method on the permanent deformation resistance of stone mastic asphalt. Mater. Res. Innovations 2014, 18, S3-96–S3-101. [Google Scholar] [CrossRef]
- Ministry of Transport of the People′s Republic of China. Standard test methods of bitumen and bituminous mixtures for highway engineering; China Communications Press: Beijing, China, 2011.
- Ma, T.; Geng, L.; Ding, X.; Zhang, D.; Huang, X. Experimental study of deicing asphalt mixture with anti-icing additives. Constr. Build. Mater. 2016, 127, 653–662. [Google Scholar] [CrossRef]
- Ministry of Transport of the People′s Republic of China. Standard specification for construction of highway asphalt pavements; China Communications Press: Beijing, China, 2004.
- Ma, T.; Wang, H.; He, L.; Zhao, Y.; Huang, X.; Chen, J. Property characterization of asphalt binders and mixtures modified by different crumb rubbers. J. Mater. Civil Eng. 2017, 29. [Google Scholar] [CrossRef]
Figure 1.
The designed gradation for different asphalt mixtures: (a) SMA13; (b) AC13; (c) SMA10; (d) UWM10 and M-UWM10.
Figure 1.
The designed gradation for different asphalt mixtures: (a) SMA13; (b) AC13; (c) SMA10; (d) UWM10 and M-UWM10.
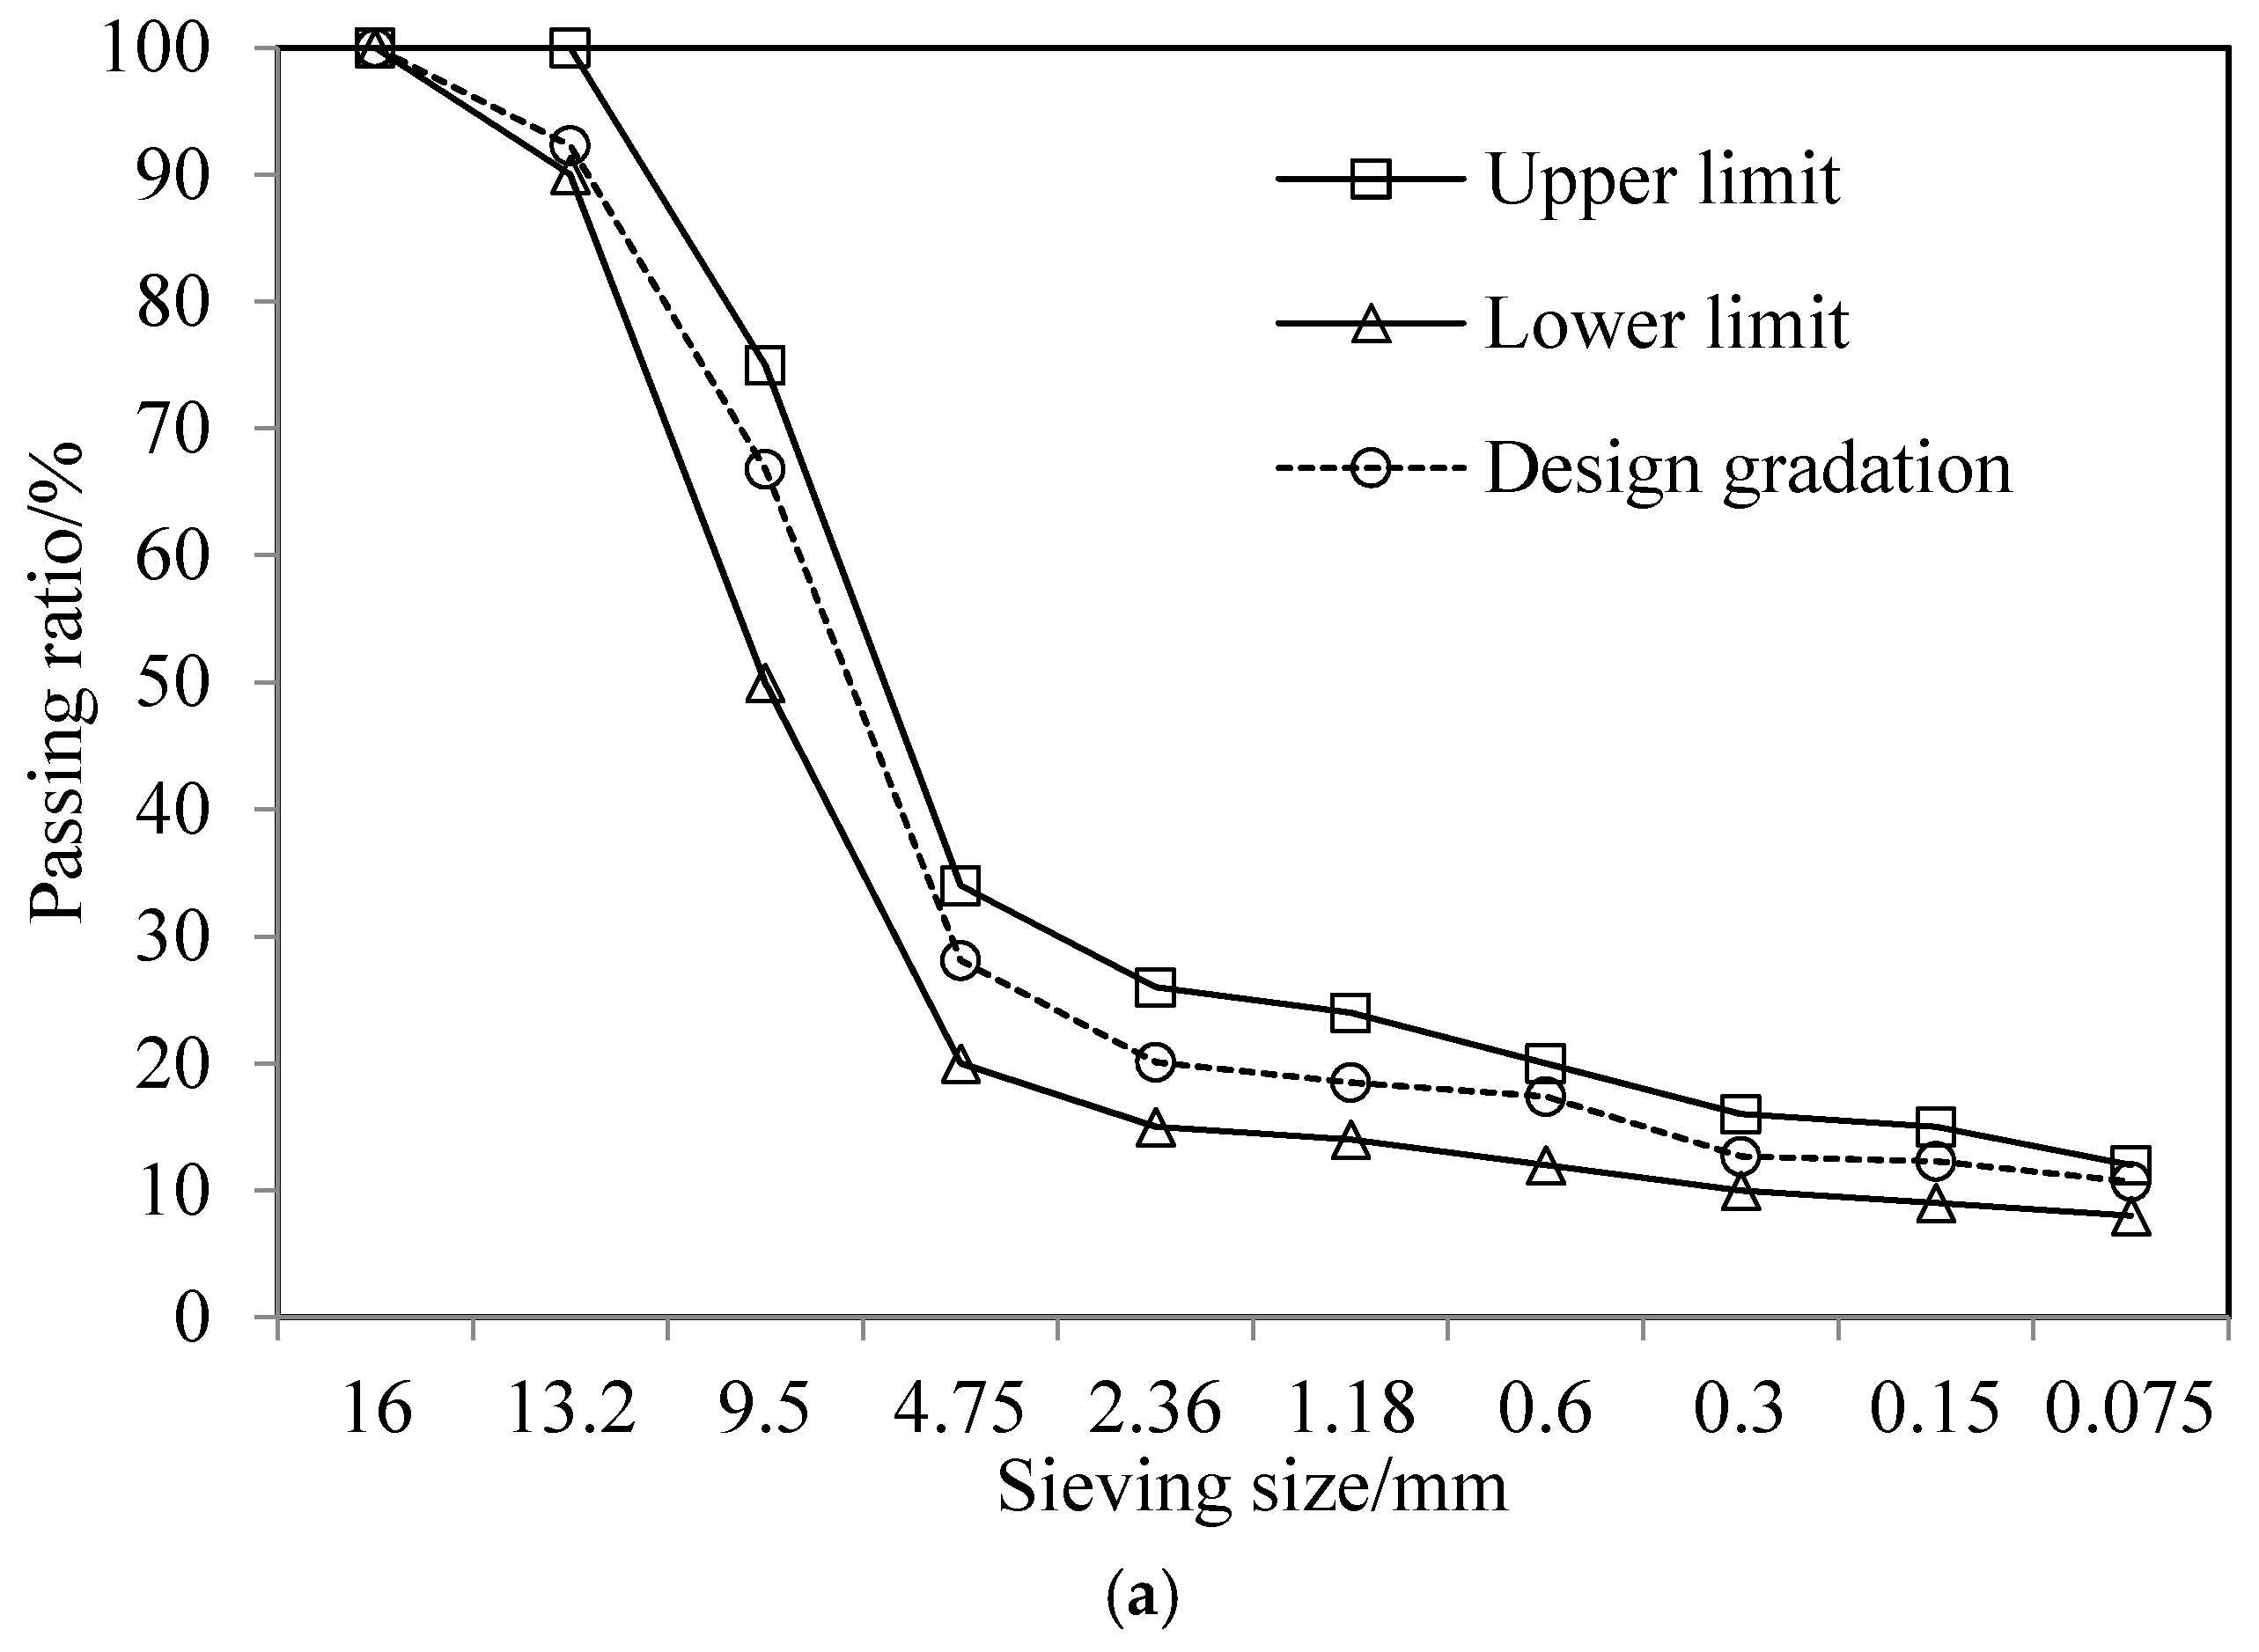
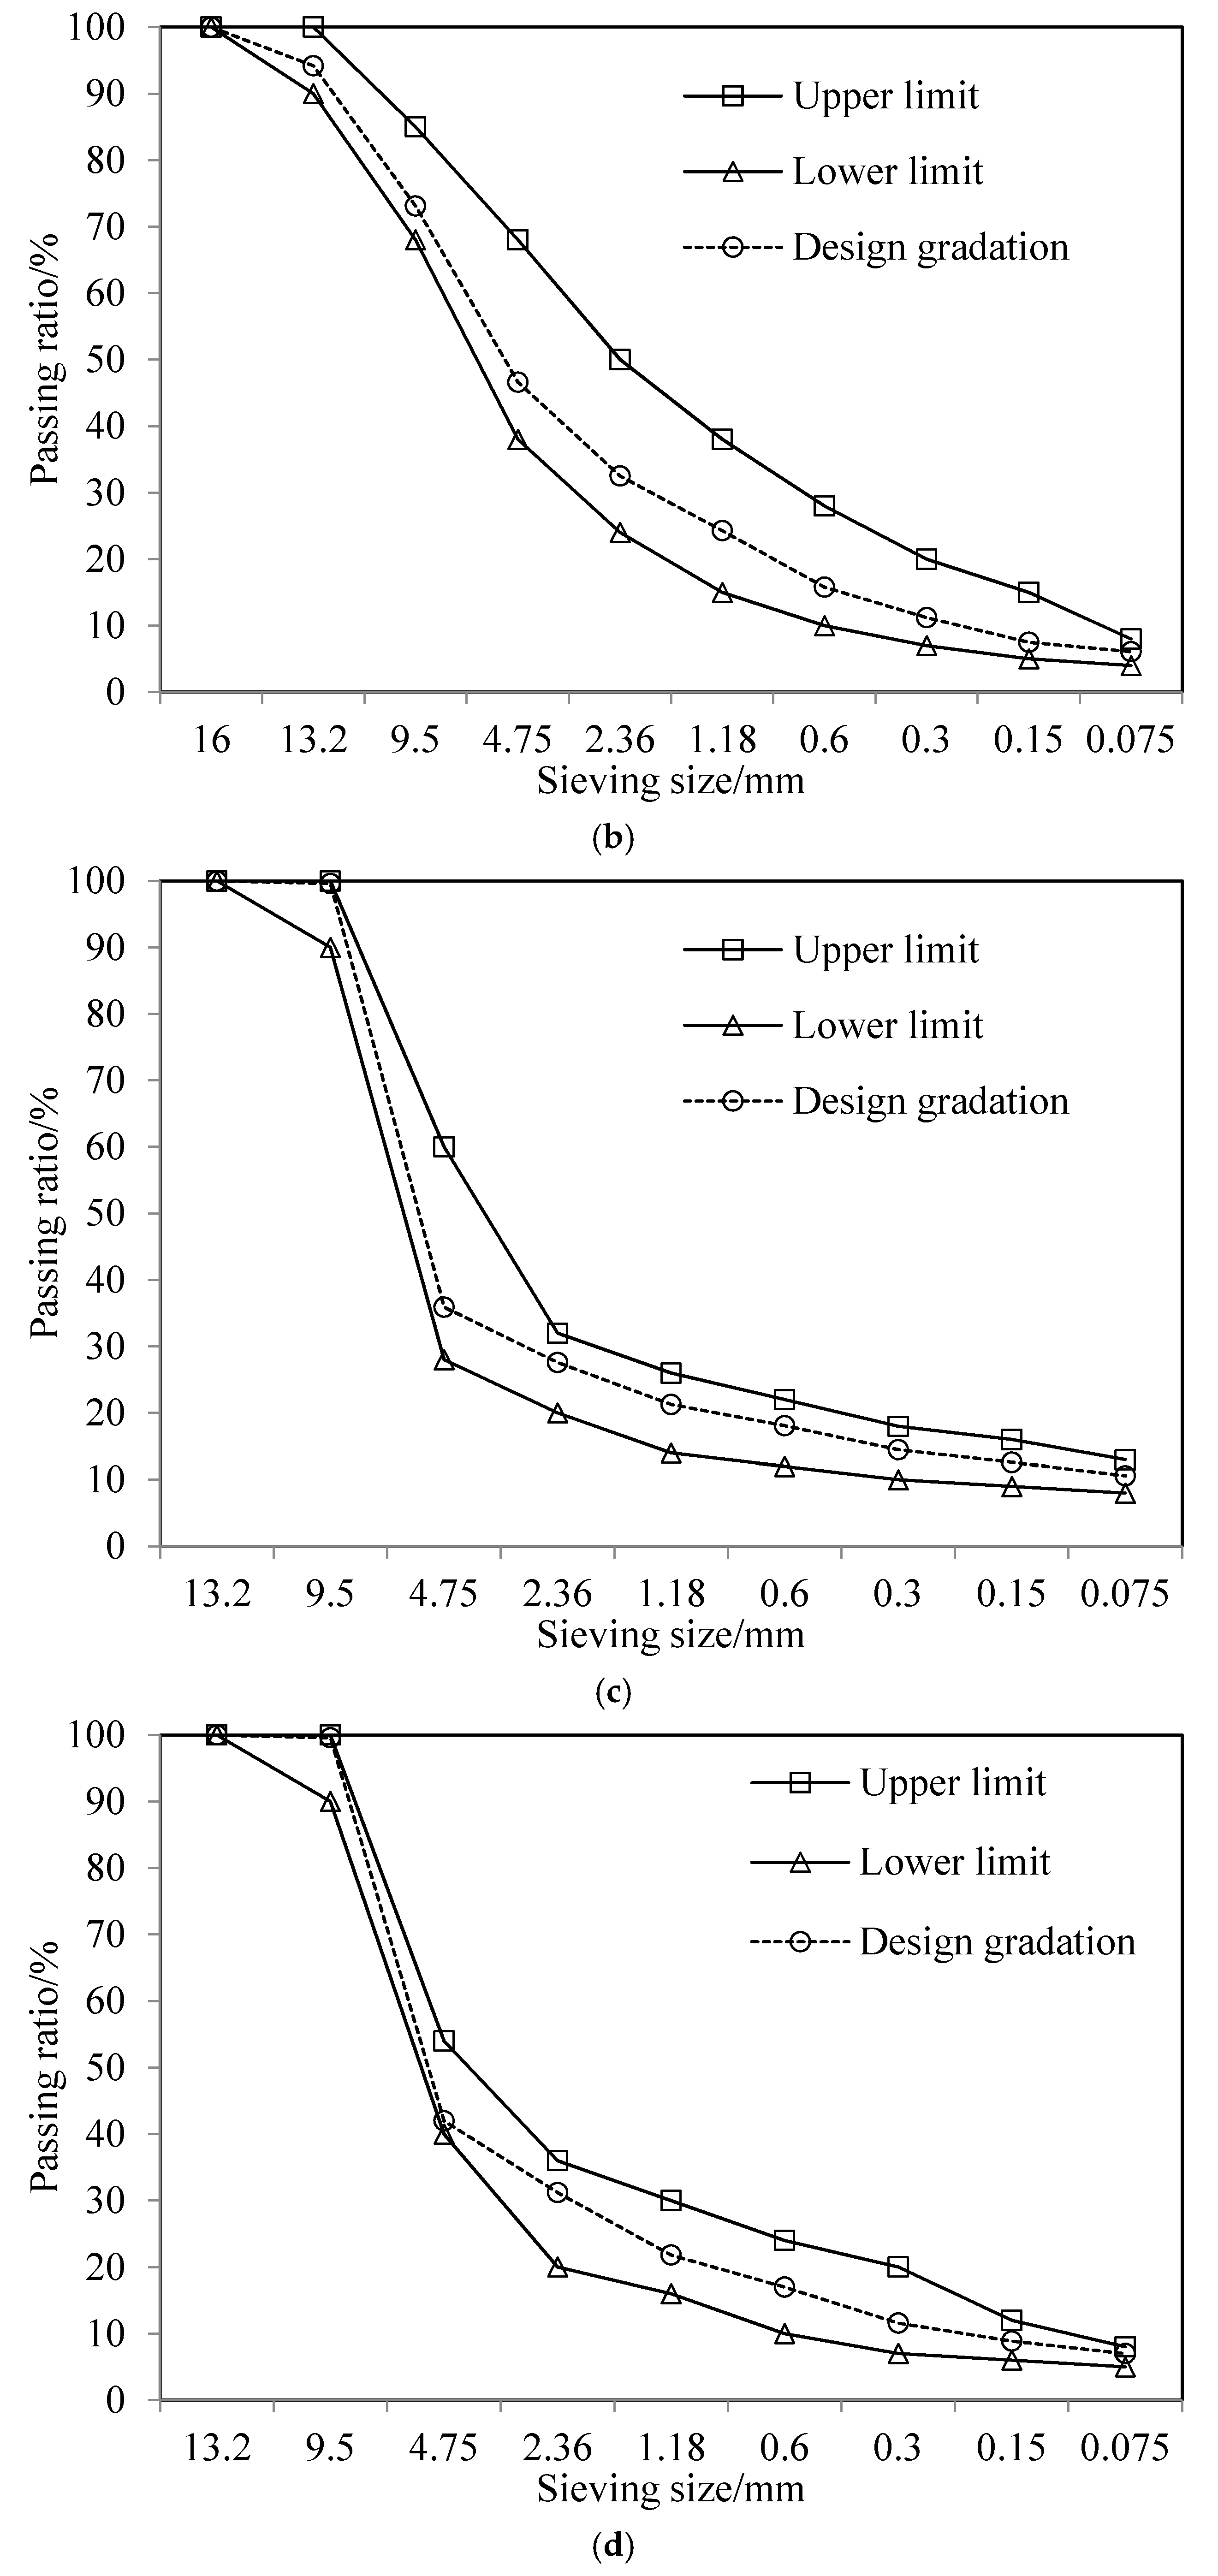
Figure 2.
Test processes for combined texture depth test and wheel loading test: (a) measuring K0 for the specimen of wheel loading test; (b) measuring m1 for the cut strip specimen; (c) laying sands on the top surface of the strip specimen; (d) measuring m2 for the strip specimen with sands.
Figure 2.
Test processes for combined texture depth test and wheel loading test: (a) measuring K0 for the specimen of wheel loading test; (b) measuring m1 for the cut strip specimen; (c) laying sands on the top surface of the strip specimen; (d) measuring m2 for the strip specimen with sands.
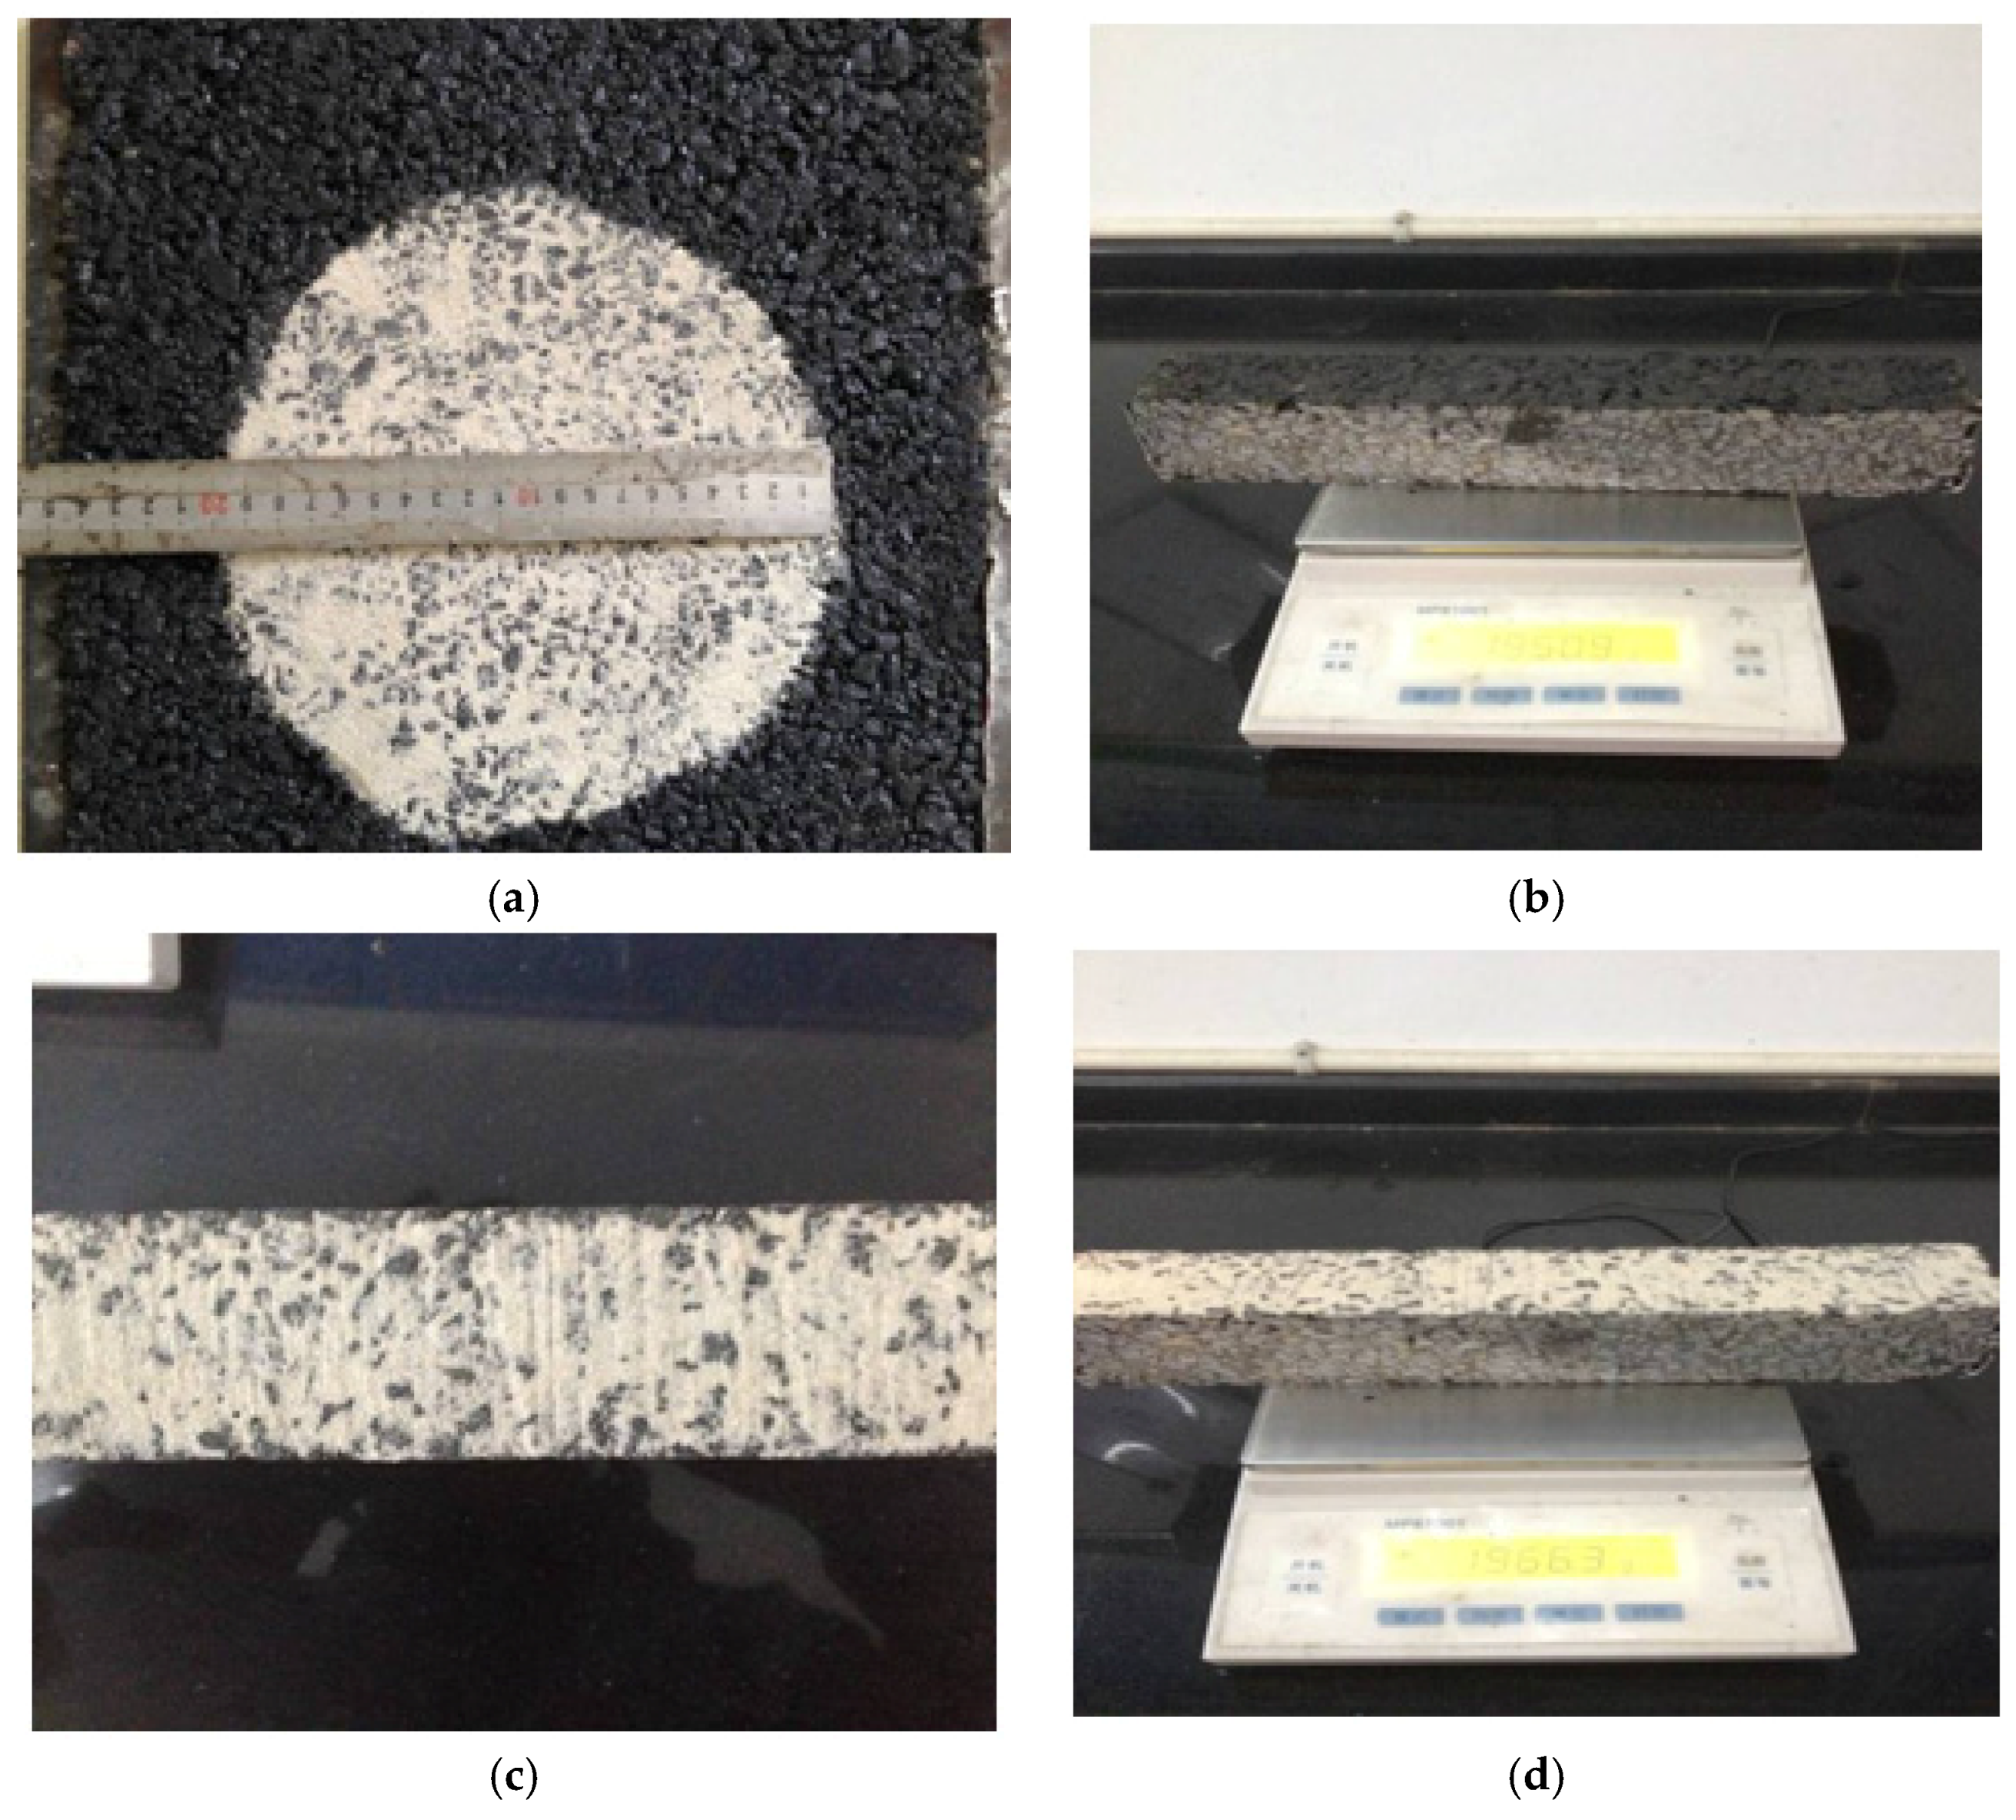
Figure 3.
The basic principle and equipment for a computed tomography (CT) scanning test.
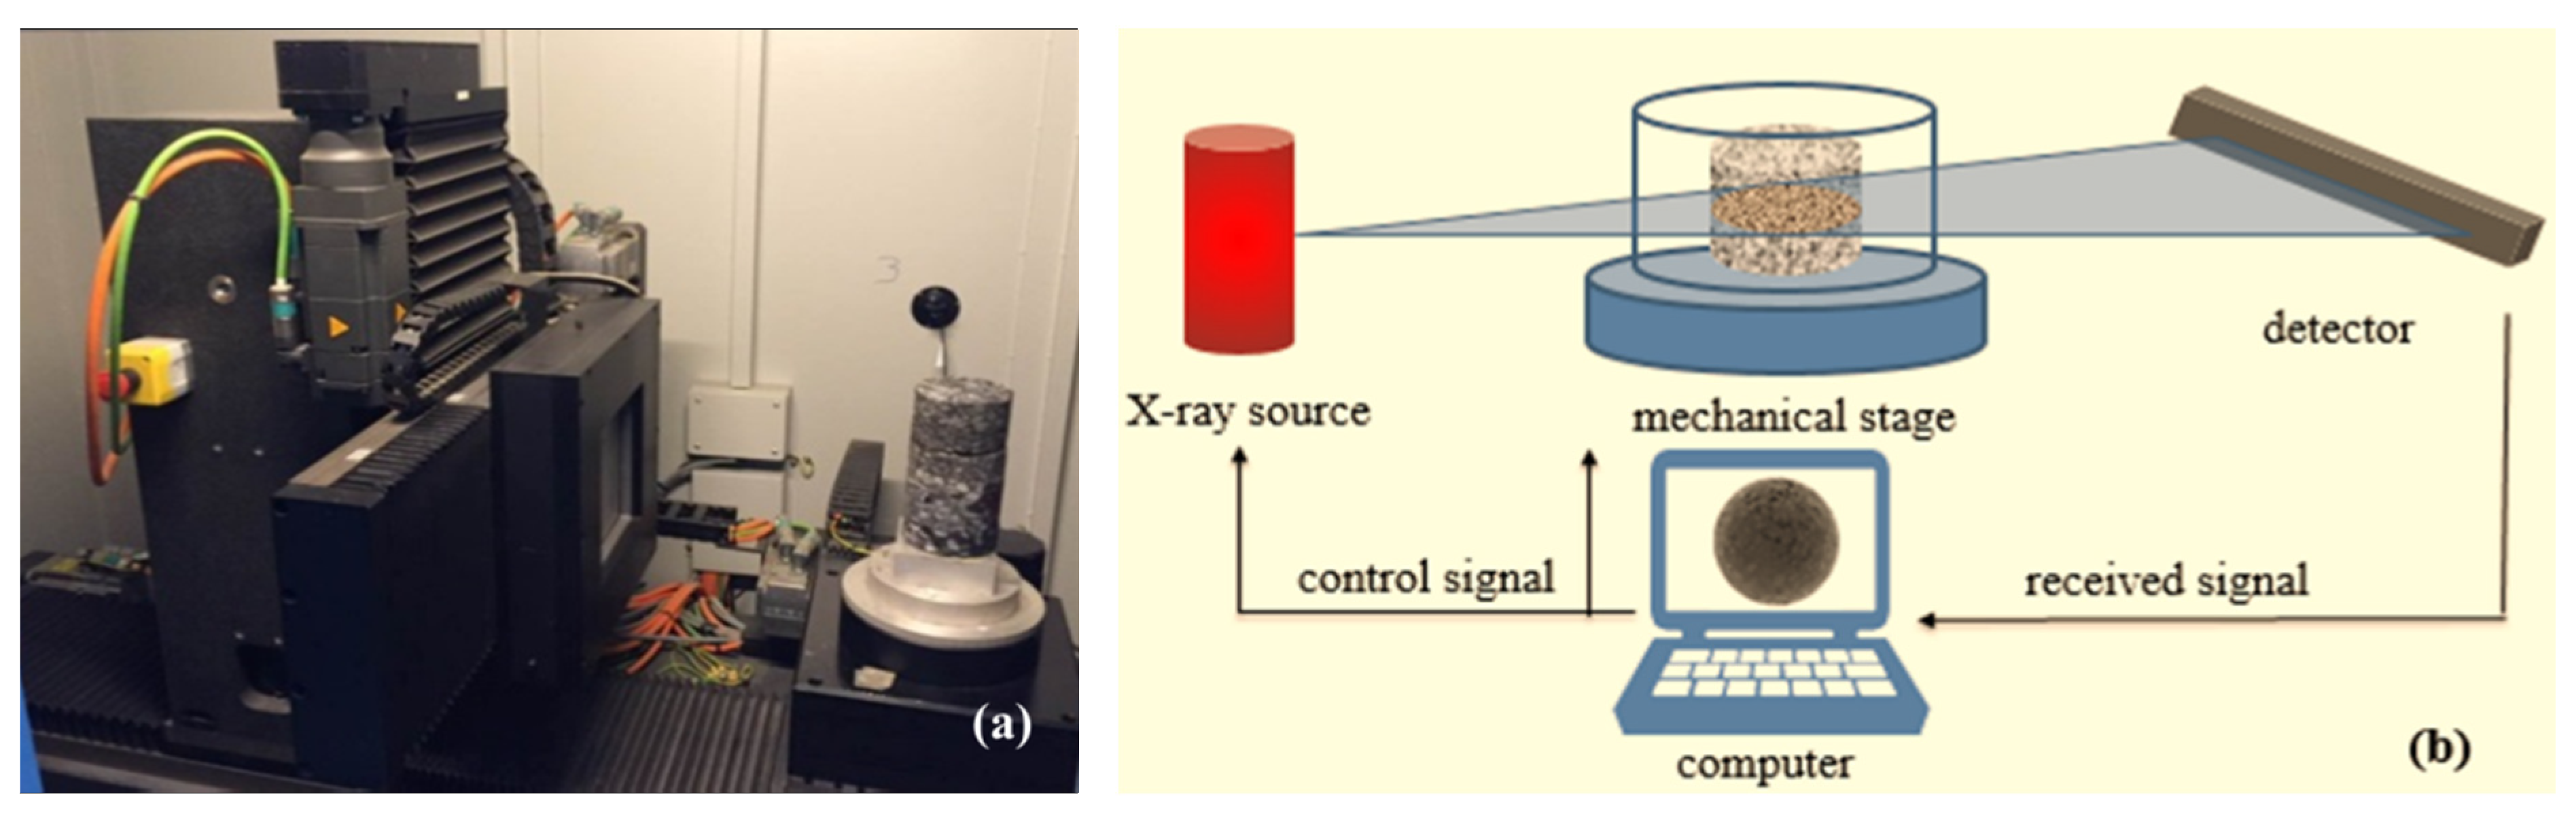
Figure 4.
Field pull out test.

Figure 5.
Test results for road performance evaluation: (a) dynamic stability; (b) failure strain; (c) Marshall stability ratio; (d) tensile strength ratio.
Figure 5.
Test results for road performance evaluation: (a) dynamic stability; (b) failure strain; (c) Marshall stability ratio; (d) tensile strength ratio.
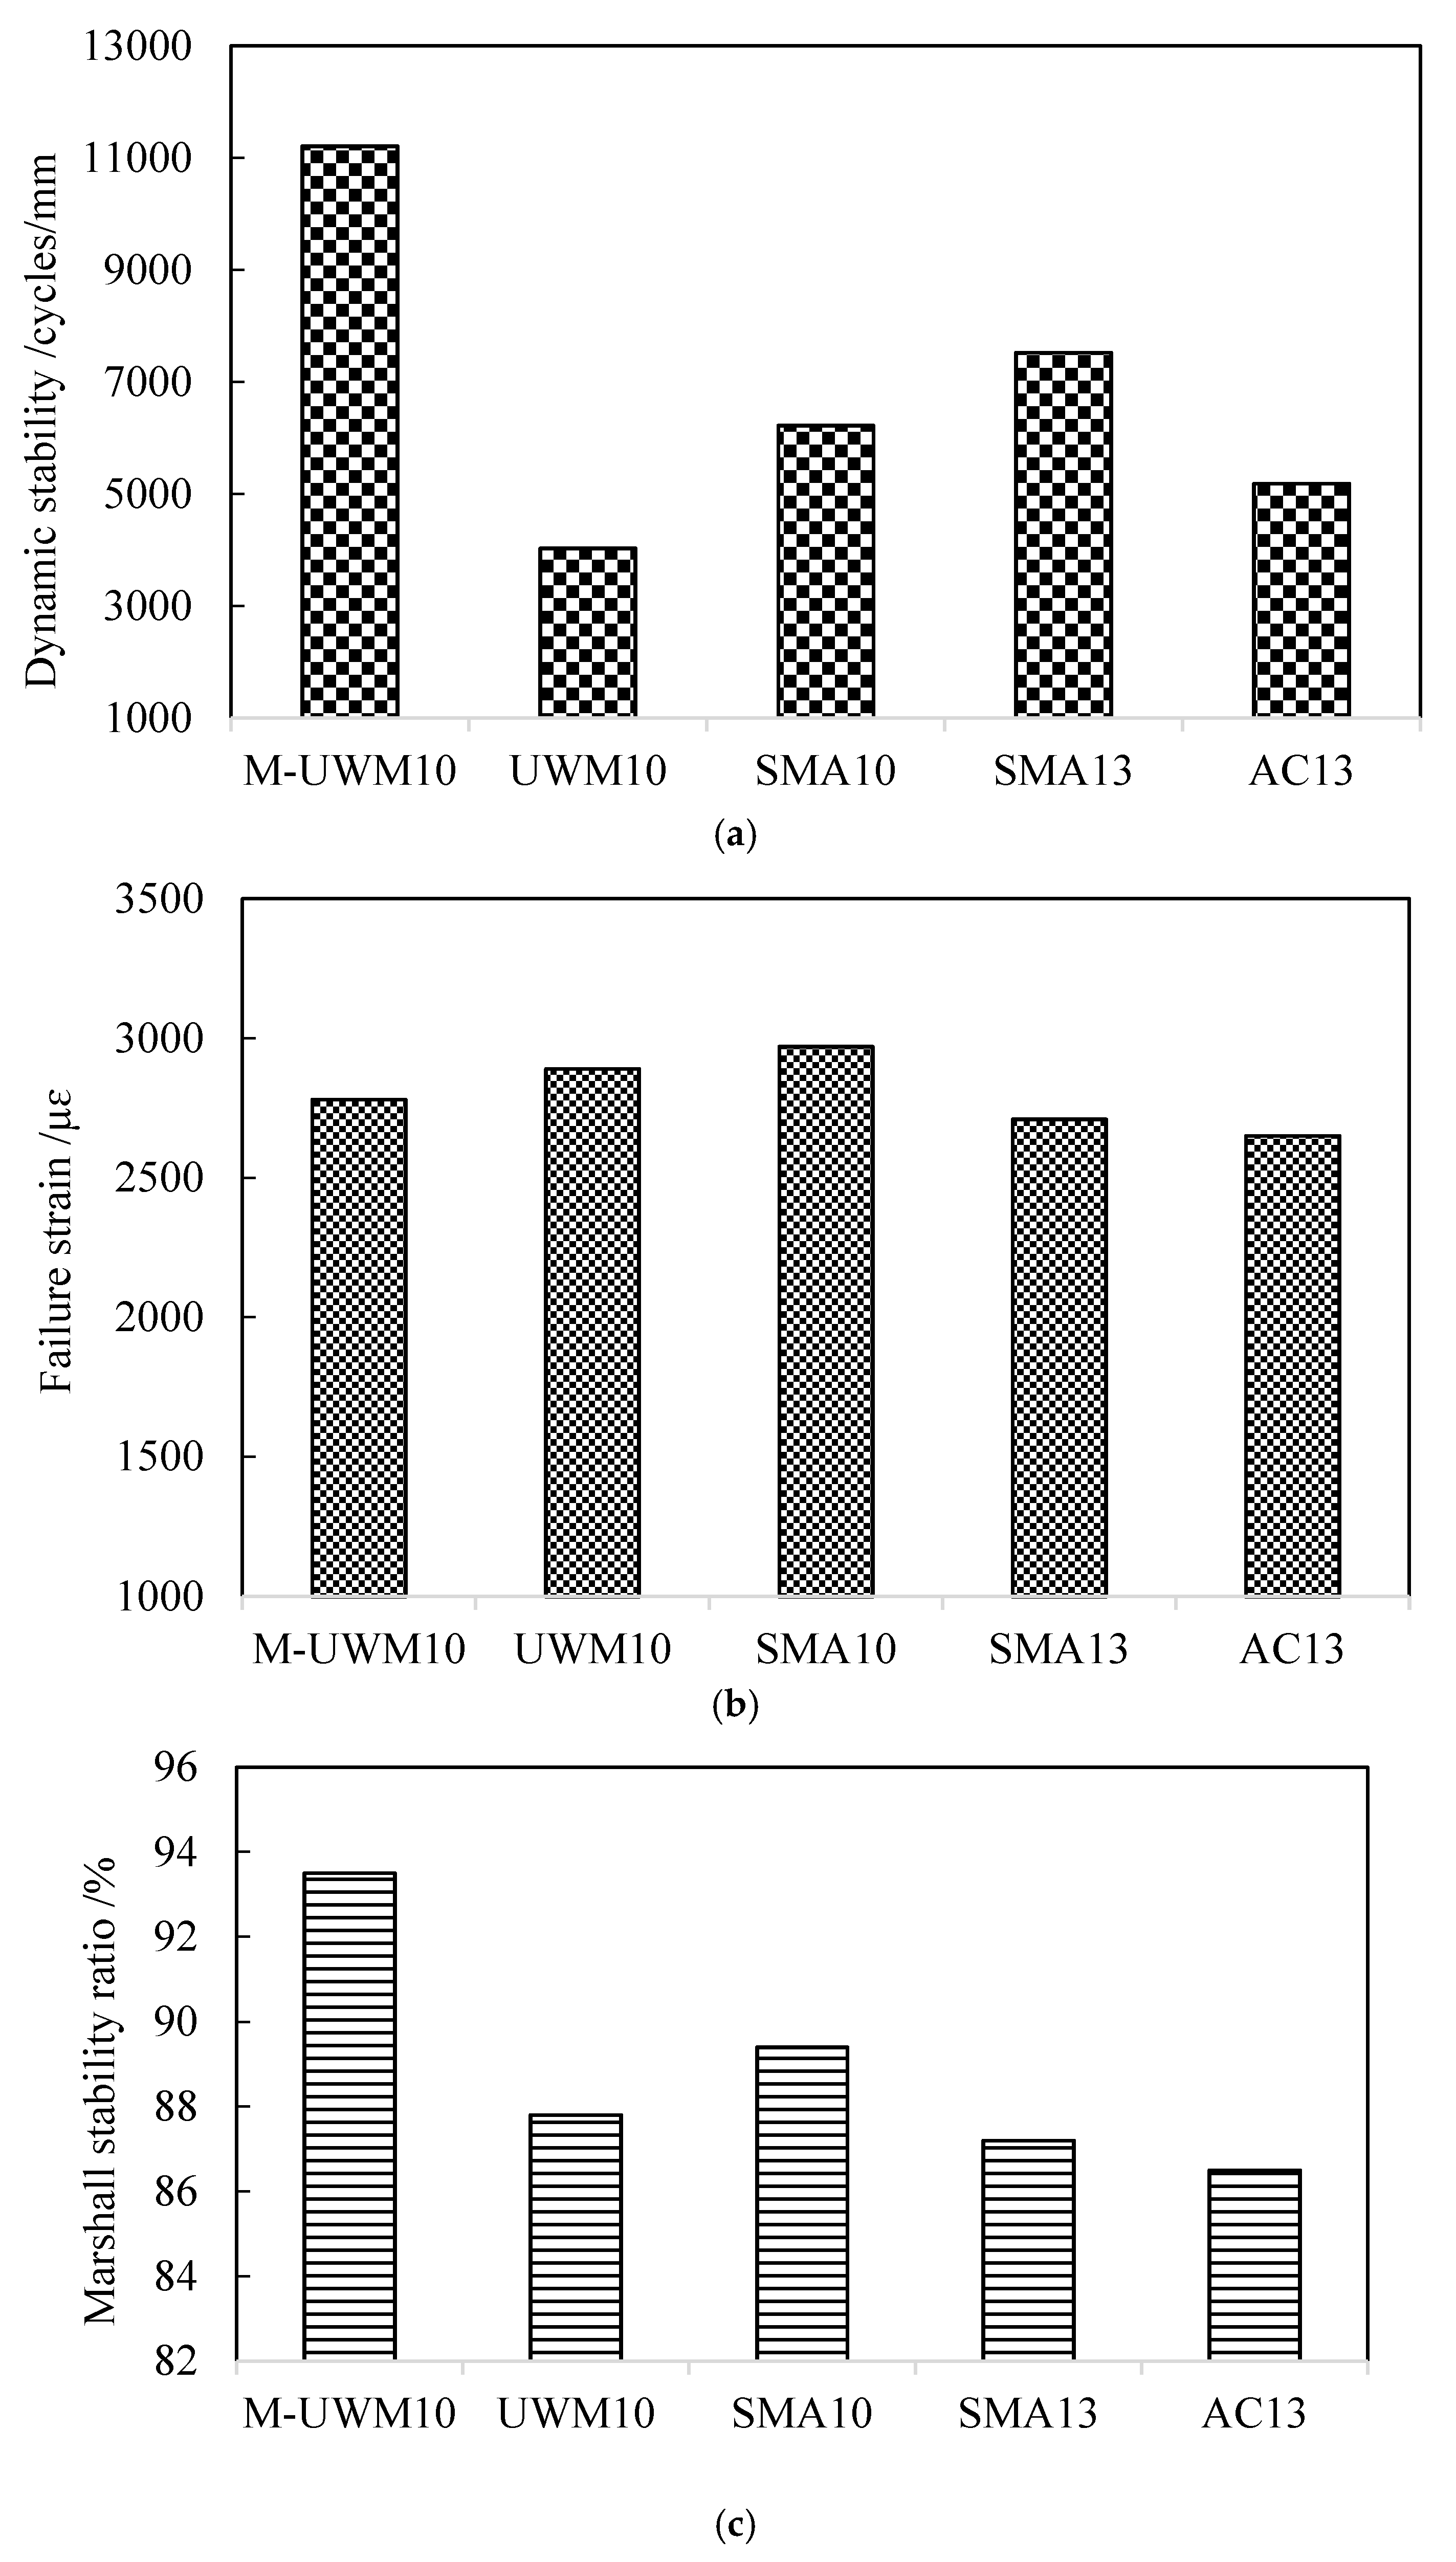
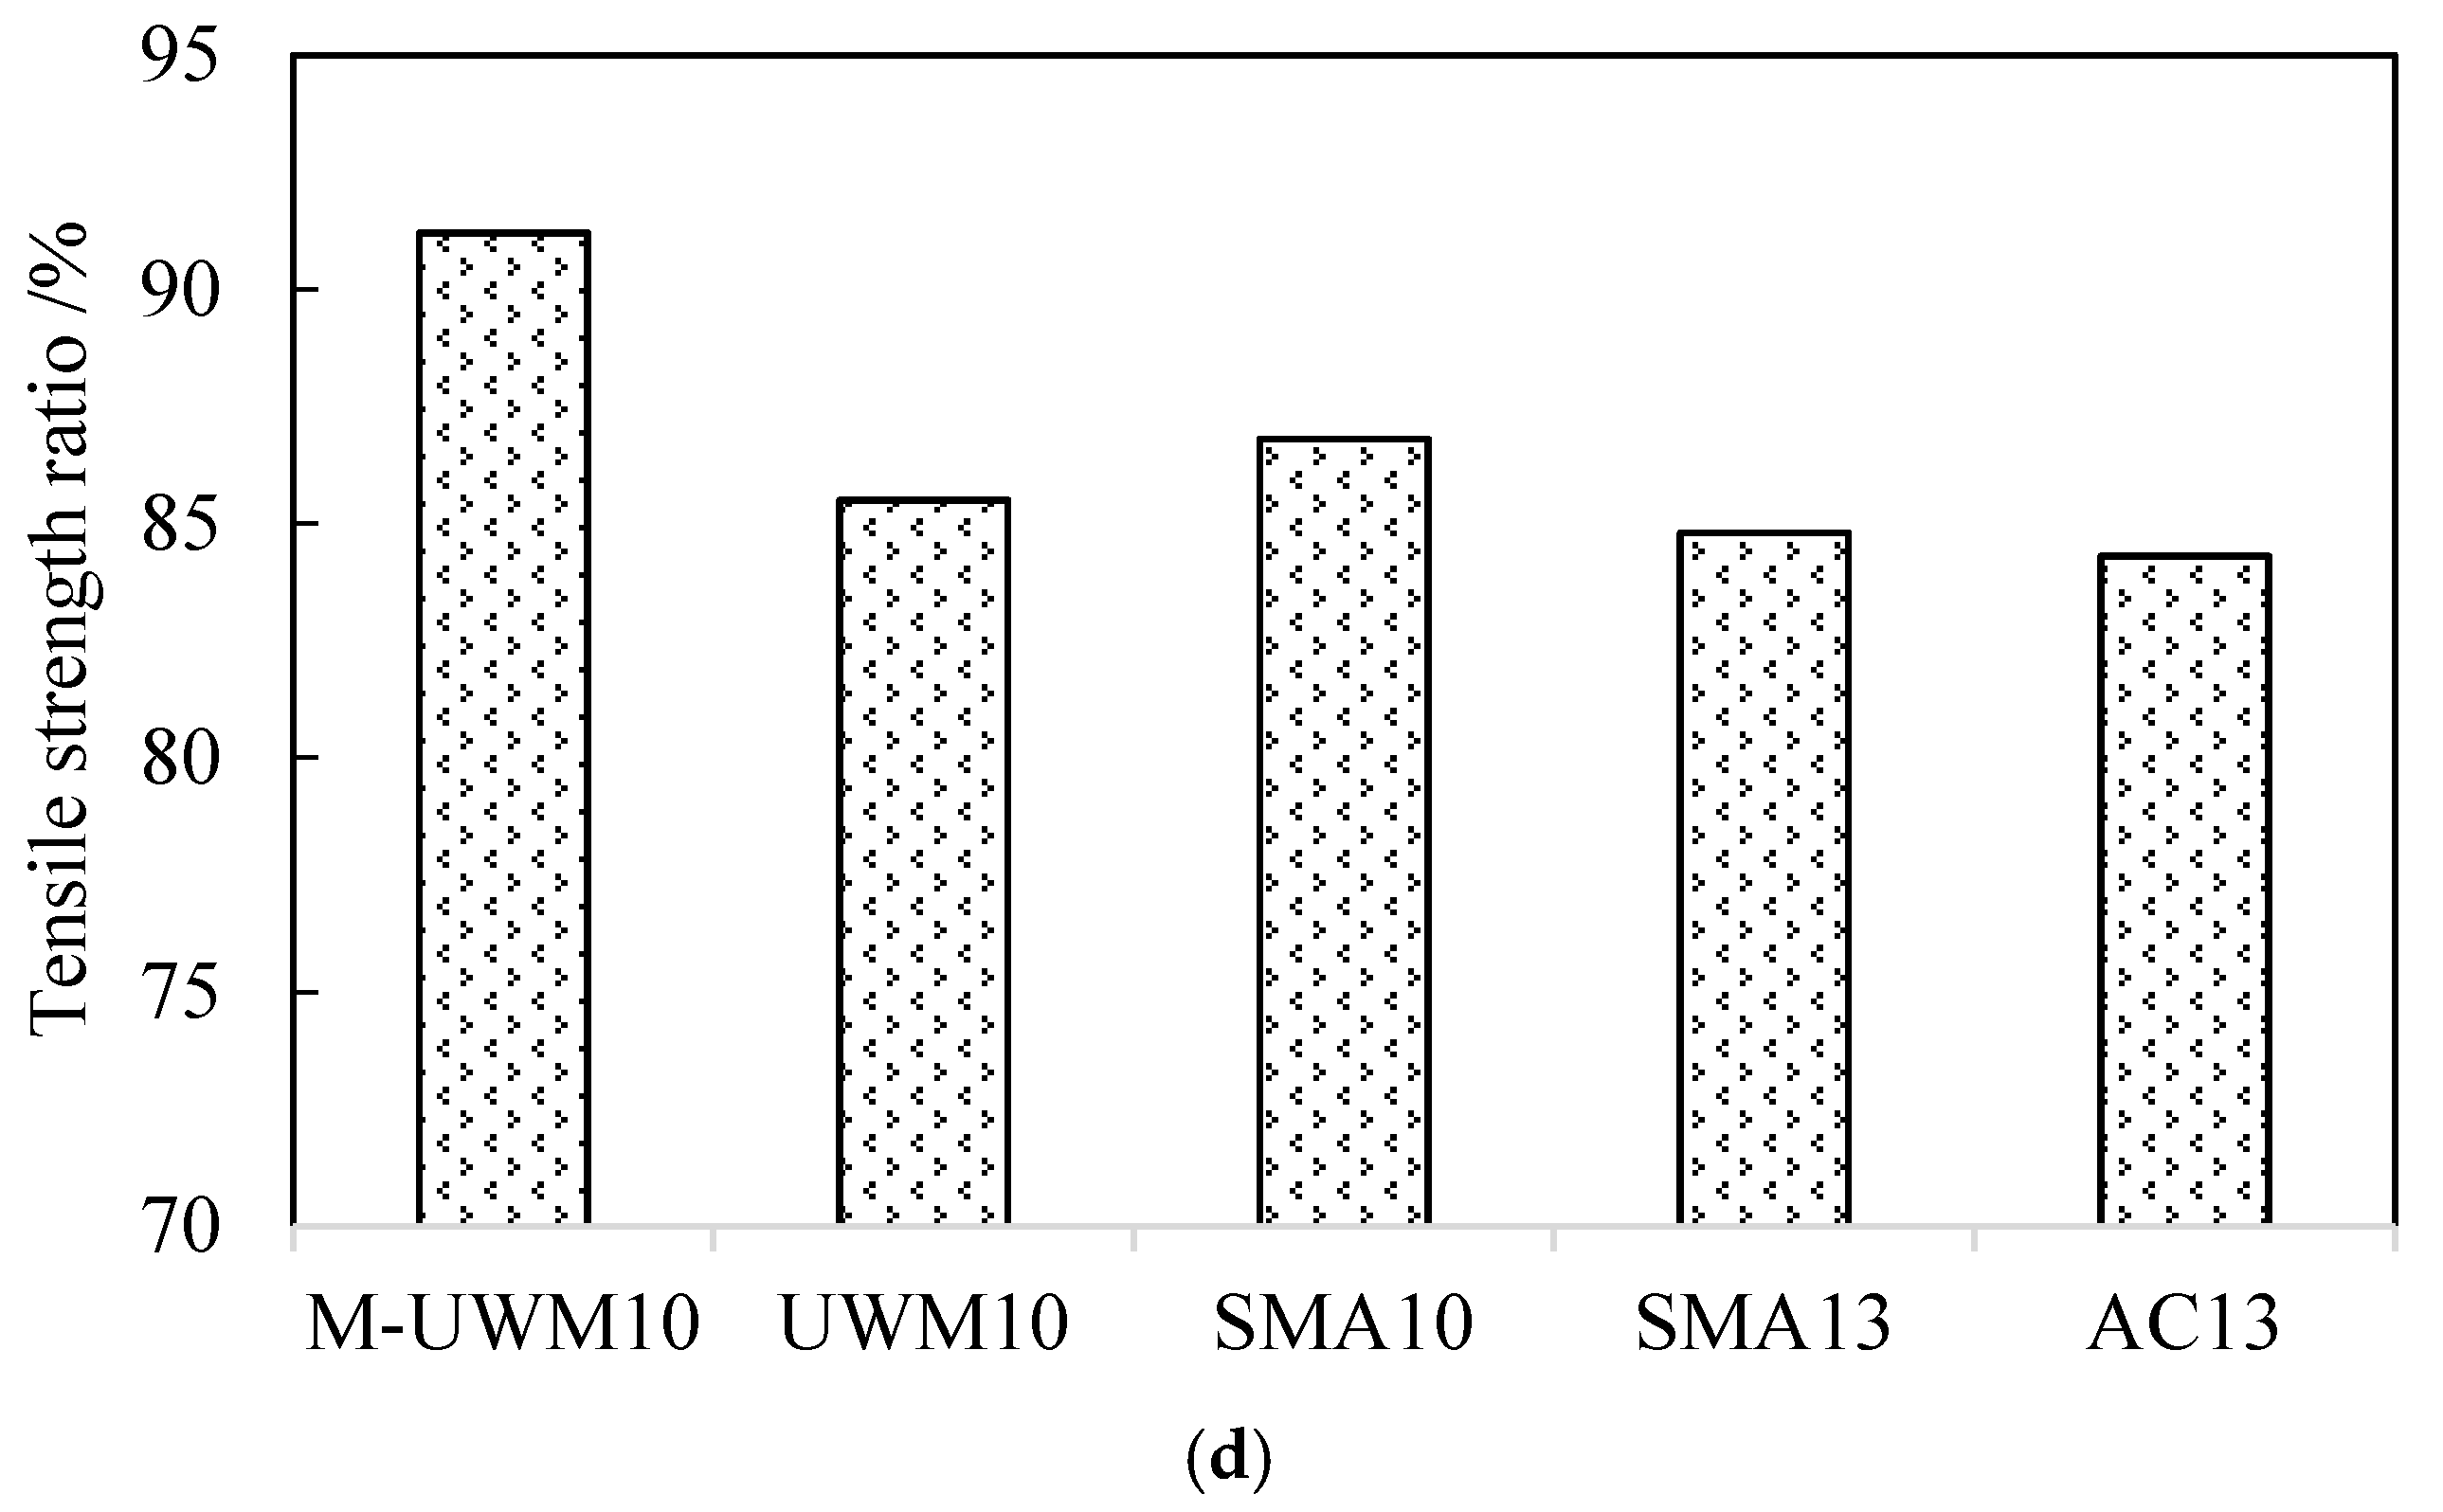
Figure 6.
Test results from the combination of the texture depth test and the wheel tracking test: (a) texture depth before and after wheel tracking test; (b) loss ratio of texture depth after wheel loading; (c) correlation between the reduced ratio of texture depth and the rutting depth after the wheel tracking test.


Figure 7.
Field texture depth test.

Figure 8.
Examples of the cored samples from test roads and the restructuring graphs of wearing course mixtures: (a) cored samples; (b) restructuring graphs for M-UWM10 and SMA10.
Figure 8.
Examples of the cored samples from test roads and the restructuring graphs of wearing course mixtures: (a) cored samples; (b) restructuring graphs for M-UWM10 and SMA10.

Figure 9.
The scanning images for cored sample from M-UWM10 pavement: (a) front view for cored sample; (b) the interface between wearing course with M-UWM10 and sub-layer with AC13.
Figure 9.
The scanning images for cored sample from M-UWM10 pavement: (a) front view for cored sample; (b) the interface between wearing course with M-UWM10 and sub-layer with AC13.

Figure 10.
The scanning images for the cored sample from SMA10 pavement: (a) front view for cored sample; (b) the interface between wearing course with SMA10 and sub-layer with SMA13.
Figure 10.
The scanning images for the cored sample from SMA10 pavement: (a) front view for cored sample; (b) the interface between wearing course with SMA10 and sub-layer with SMA13.

Figure 11.
Grey level- probability density distribution curves: (a) M-UWM10; (b) SMA10.

Figure 12.
Distribution of air void ratios along the scanning height of the cored samples.

Figure 13.
Average air void ratios and interface air void ratios for different cored asphalt mixtures.
Figure 13.
Average air void ratios and interface air void ratios for different cored asphalt mixtures.
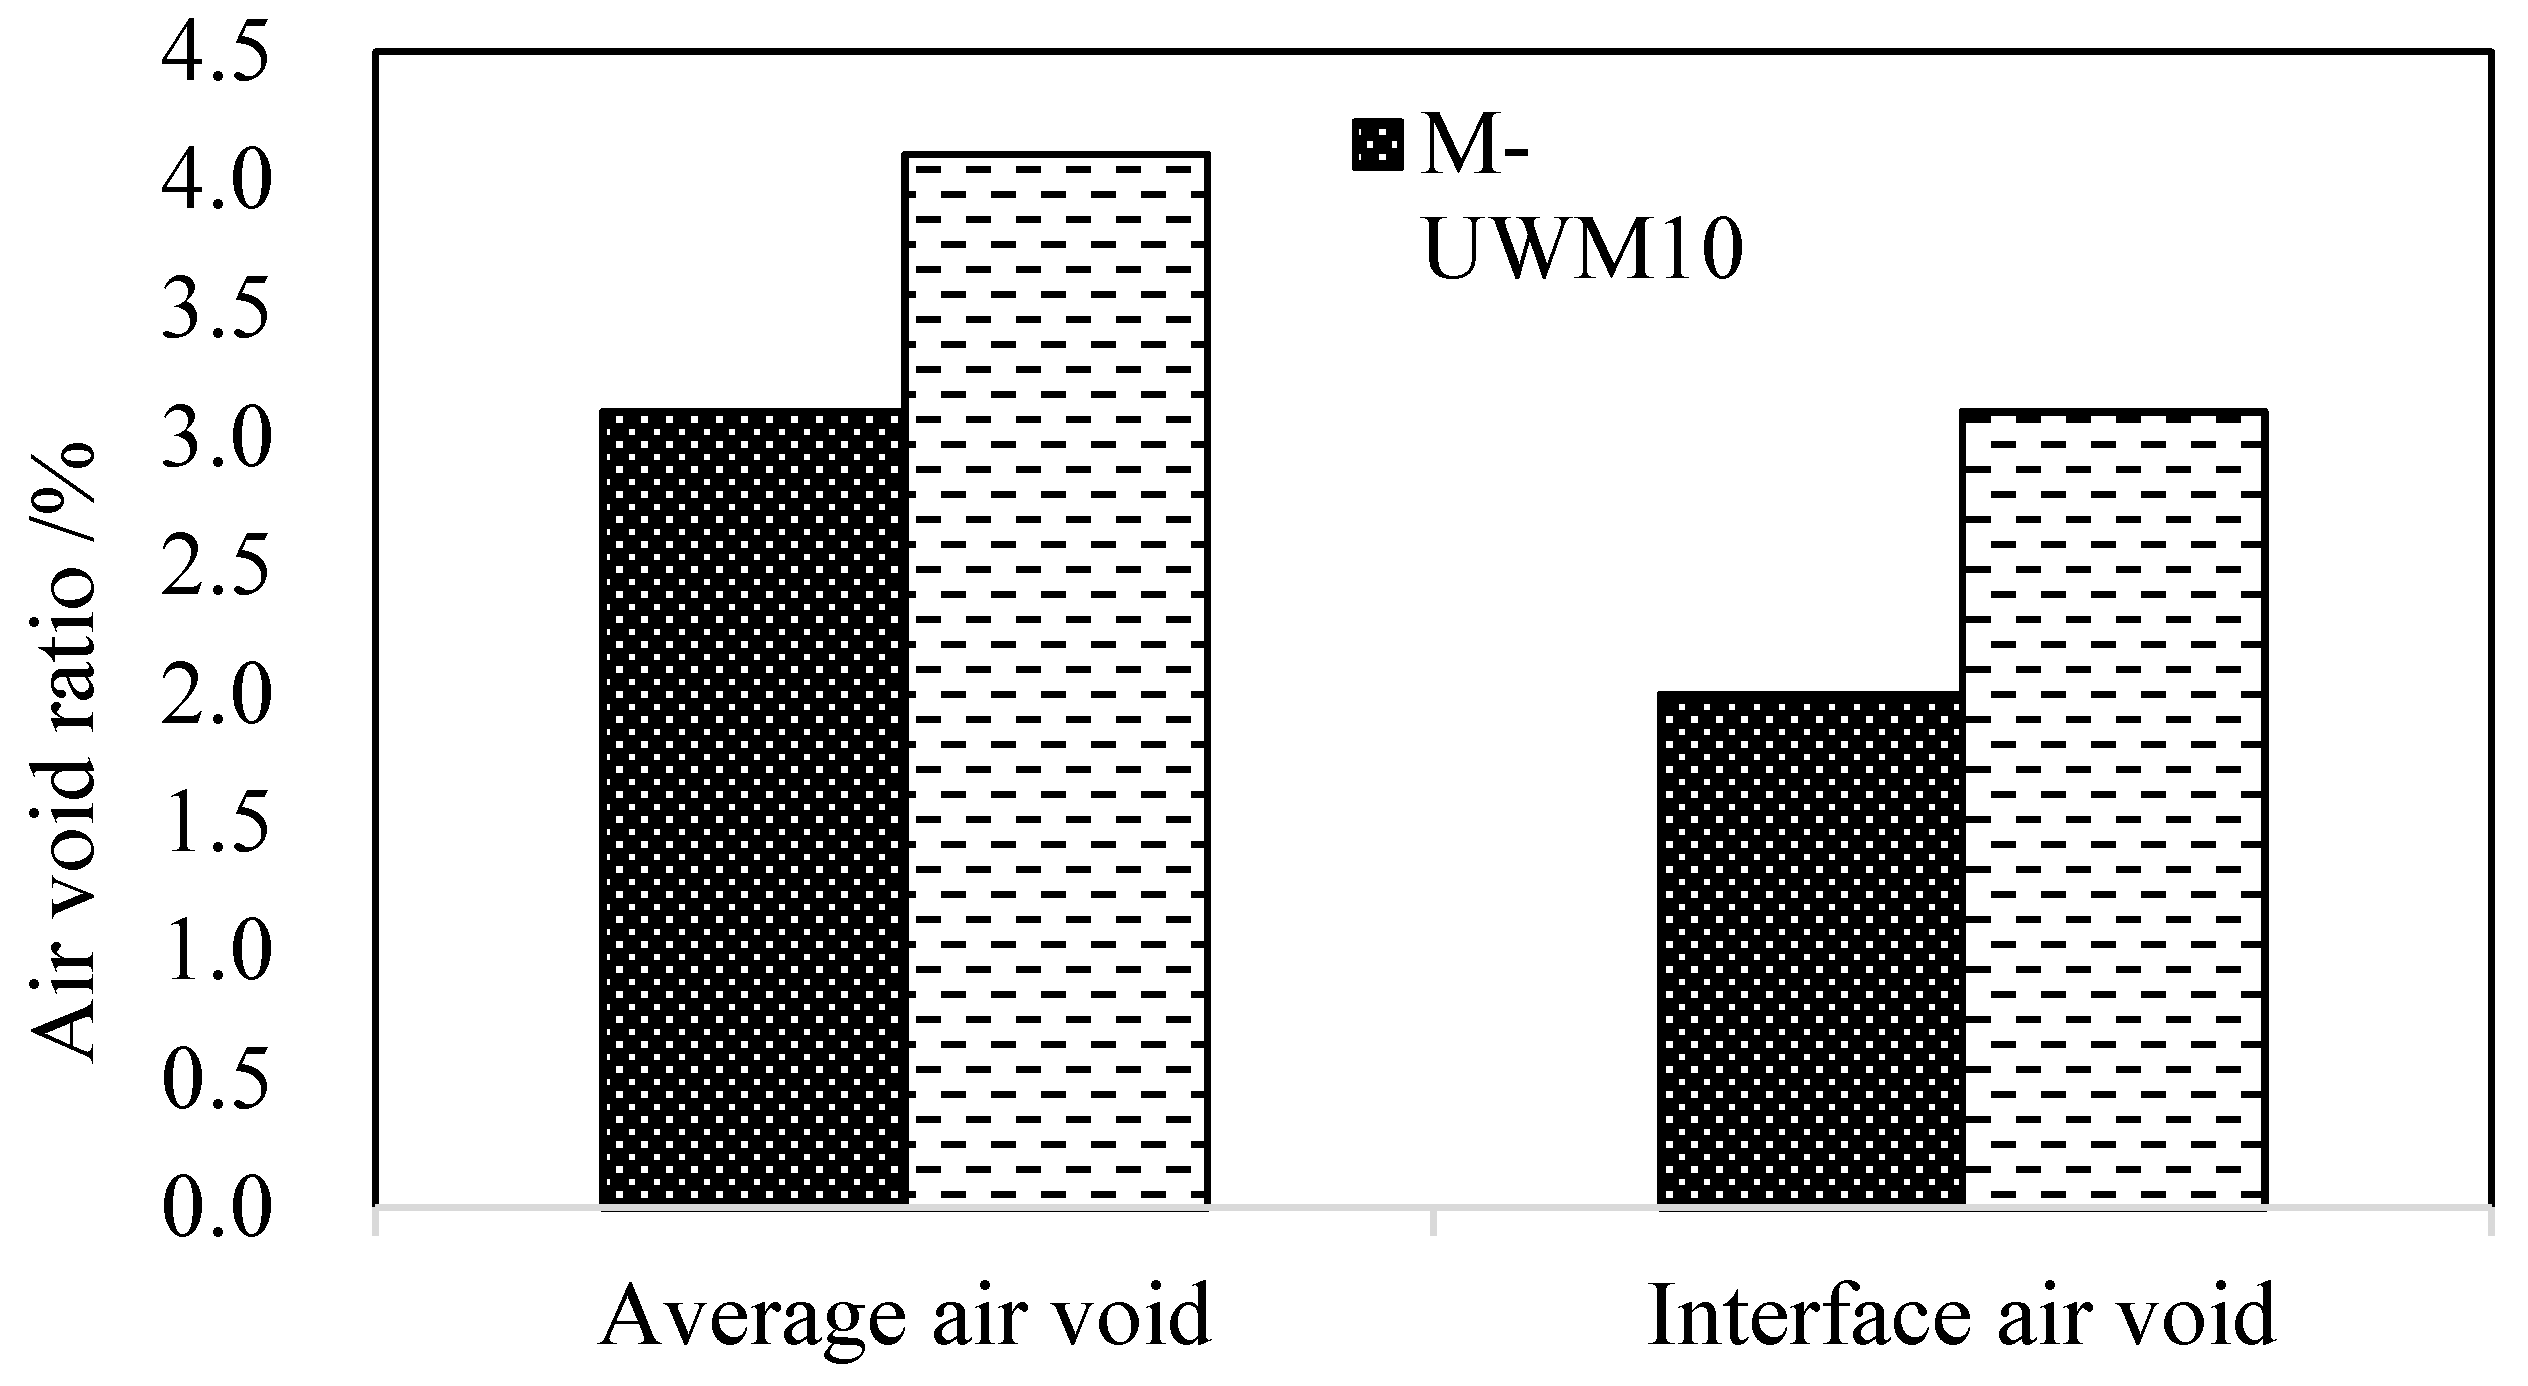
Figure 14.
Field pull out test samples: (a) M-UWM10; (b) SMA10.

Figure 15.
Pull out test results: (a) pull out force; (b) pull out stress.

Table 1.
Marshall design parameters for different asphalt mixtures.
| Mixture Type | Asphalt Content (%) | VV (%) | VMA (%) | VFA (%) | Marshall Stability (kN) | Flow Value (0.1 mm) |
|---|---|---|---|---|---|---|
| SMA13 | 6.0 | 4.3 | 18.28 | 76.7 | 8.9 | 26.8 |
| AC13 | 5.1 | 4.8 | 19.90 | 75.9 | 8.52 | 27.4 |
| SMA10 | 6.3 | 4.2 | 18.53 | 77.5 | 10.54 | 28.9 |
| UWM10 | 5.2 | 5.1 | 16.0 | 68.0 | 9.83 | 26 |
| M-UWM10 | 5.2 | 4.7 | 15.6 | 70.1 | 12.00 | 24 |
VV: percent air voids in bituminous mixtures; VMA: percent voids in mineral aggregate in bituminous mixtures; VFA: percent voids in mineral aggregate that are filled with asphalt in bituminous mixtures.
Table 2.
Basic parameters of the computed tomography (CT) technique.
| Type | x-axis (mm) | y-axis (mm) | z-axis (mm) | 3D-xy-Pixel Size, 3D-z-Pixel Size (mm) |
|---|---|---|---|---|
| Specification | 200 | 420 | 630 | 0.113 |
Table 3.
Pavement performance verification for the M-UWM10 mixture
| Performance Index | Dynamic Stability (cycles/mm) | Failure Strain (µε) | Marshall Stability Ratio (%) | Tensile Strength Ratio (%) |
|---|---|---|---|---|
| Requirements | ≥3000 | ≥2500 | ≥85 | ≥80 |
| Test method | T0719-2011 | T0715-2011 | T0709-2011 | T0729-2000 |
Table 4.
Field test results of texture depth test on different test roads.
| Type of Wearing Course Mixtures | Original Texture Depth (mm) | Texture Depth after One Year (mm) | Reduced Ratio (%) |
|---|---|---|---|
| M-UWM10 | 0.85 | 0.78 | 8.2 |
| SMA10 | 0.92 | 0.8 | 13.0 |
© 2017 by the authors. Licensee MDPI, Basel, Switzerland. This article is an open access article distributed under the terms and conditions of the Creative Commons Attribution (CC BY) license (http://creativecommons.org/licenses/by/4.0/).
Share and Cite
MDPI and ACS Style
Geng, L.; Ma, T.; Zhang, J.; Huang, X.; Hu, P. Research on Performance of a Dense Graded Ultra-Thin Wearing Course Mixture. Appl. Sci. 2017, 7, 800. https://doi.org/10.3390/app7080800
AMA Style
Geng L, Ma T, Zhang J, Huang X, Hu P. Research on Performance of a Dense Graded Ultra-Thin Wearing Course Mixture. Applied Sciences. 2017; 7(8):800. https://doi.org/10.3390/app7080800
Chicago/Turabian StyleGeng, Lei, Tao Ma, Junhui Zhang, Xiaoming Huang, and Pengsen Hu. 2017. "Research on Performance of a Dense Graded Ultra-Thin Wearing Course Mixture" Applied Sciences 7, no. 8: 800. https://doi.org/10.3390/app7080800
Note that from the first issue of 2016, this journal uses article numbers instead of page numbers. See further details here.