Accelerated Sine-on-Random Vibration Test Method of Ground Vehicle Components over Conventional Single Mode Excitation


Department of Mechanical Design Engineering, Pukyong National University, Busan 48547, Korea
Appl. Sci. 2017, 7(8), 805; https://doi.org/10.3390/app7080805
Submission received: 10 July 2017
/
Revised: 29 July 2017
/
Accepted: 31 July 2017
/
Published: 7 August 2017
(This article belongs to the Section Mechanical Engineering)
Abstract
:Automotive manufacturers typically assess the mechanical durability performance of ground vehicle components for vibration excitation using either random or harmonic spectral loading patterns, such as the loading patterns suggested in international standards (e.g., ISO-16750-3). Selection of the correct excitation profile is dependent on the service condition of the component of interest. However, in the instance where the vehicle component is exposed to both harmonic excitations and background noise, the severity of impact of the in-service environment cannot be satisfied via a single random or harmonic test alone. In this case, the optimal test strategy is to evaluate the vehicle component under a sine-on-random excitation. Within this study, a uniaxial excitation test was conducted for a notched simple specimen under three spectral loading cases (harmonic, random, and sine-on-random), and the test severity was determined based on two kinds of fatigue damage: the physical damage from measured strain and the calculated pseudo-damage from acceleration measurements, as indicated in ISO-16750-3. Based on this comparison of accumulated fatigue damage, the efficiency of the proposed sine-on random vibration was proved against conventional single spectral pattern test methods.
1. Introduction
When a conventional ground vehicle is driven over numerous ground conditions, such as a highway, a country road, an unpaved road, or a cobble stone road [1], the vibration spectrum from the road loading is determined by the surface roughness and the speed of the vehicle. In this instance, the spectral pattern is typical of a random noise distribution [2,3,4]. Alternatively, the powertrain of a vehicle system, which is comprised of a combustion engine and transmission, will produce harmonic excitation due to the rotating speed of the engine system [5,6,7]. Thus, vehicle components near the powertrain may be exposed to a harmonic excitation condition, whereas vehicle components isolated from the harmonic excitation of the combustion engine are primarily exposed to the road load that shows non-stationary random patterns. In addition, vehicle components may be exposed to a shock loading cases owing to abnormal service tracks, such as bump load, and those transient excitations show different spectral loading patterns as compared to previous cases, random or harmonic.
Vibration tests or high cyclic loading test specifications can be derived from measured test data or the results of a virtual simulation that allows the severity of the test system to be determined according to the accumulated fatigue damage during rated normal operation. The target level of fatigue damage is typically derived from data measured from test vehicles operating in the field, while accelerated test results are obtained from vehicle measurements performed in a combination of proven ground test tracks [1,2,3,4]. Typically, the vibration resilience of a component is evaluated using an exciter, with the application of fatigue damage measured using a random power spectral density (PSD) function in the frequency domain [8,9,10,11].
Acceleration is the most prevalent measured signal in high cyclic loading cases because of its high signal-to-noise ratio compared to other physical signals such as strain or stress. An accelerometer has several advantages compared to a strain gauge [12,13,14,15]. The strain or stress data from a strain gauge provides suitable information to calculate the fatigue damage directly, but the measured data is very sensitive to the attachment quality or the shape of the attached structure; however, the acceleration data from an accelerometer is robust for attachment situations, and the repeatability of the measured response can be guaranteed with similar measurement locations. A critical drawback of using an accelerometer is that no direct information can be obtained for the calculation of fatigue damage. Several previous studies on vibration fatigue issues have attempted to calculate the fatigue damage or strain using only the acceleration. In the case of a simple specimen such as a beam or slender member, the direct identification of strain data from a displacement is possible using analytic equations [16,17,18]. The concept of pseudo-damage is one practical method for comparing test severities using a virtual S-N curve, and this method is precisely explained by ISO-16750-3 [19]. Although the pseudo-damage derived from the acceleration response data is not a physical value, a direct damage comparison between vibration tests is possible using this technique. Recently, a method for predicting the fatigue damage from acceleration data was suggested using an energy isocline function in a case where the frequency relationship between the response acceleration and the strain in a hot spot can be pre-determined reliably [12,13,14,15]. In this instance, a hot spot means the most fragile location of a structure with a localized concentrated strain or stress. The damage comparison for different spectral loading patterns were performed using the same notched simple specimen in reference [20]. However, the previous study was focused on developing damage counting methods for different spectral loading patterns, and the accuracy of the proposed counting methods was compared with the zero-crossing peak counting in a time domain. The pseudo-damage considered in Ref. [20] was counted in a time domain, and the indirect spectral damage using acceleration data was calculated to verify the accuracy of energy isocline functions. In this study, the damage counting was calculated in a frequency domain for two response data points, acceleration and strain, and the damage level represents the severity of vibration tests for three different loading cases. Thus, the claimed originality of this study, focused on the accelerated sine-on-random vibration test of vehicle components, is different from previous studies.
Due to increasing customer expectations and intense competition in the automotive marketplace, the reliability of vehicle components is critical to guarantee high quality of a given vehicle and good reputation of the manufacturer. Prior to beginning a new vehicle development program, the majority of test processes are rigorously reviewed to minimize the failure rate of vehicle components and to maintain the good reputation of the manufacturer. Subsequently, vibration test specifications have become more stringent over time. Moreover, due to an increased focus on robust design policy, vibration test requirements have become intensive. Thus, the vibration profile is designed with an increased safety margin. Vibration test specifications designed for the evaluation of mechanical systems (such as ISO 16750-3) generally stipulate either random or harmonic test modes [19]. However, some vehicle components are mounted at a location that may be exposed to both random and harmonic excitations simultaneously. Therefore, one spectral excitation pattern may not replicate the required test severity of these components from the perspective of fatigue damage. Hence, current testing standards, such as ISO 16750-3, have some limitations in coping with such multi-spectral pattern cases. An advanced vibration test method is presented by the defense industry in MIL-810G, where the sine-on-random excitation profile is defined for the evaluation of sub-components within defense systems and military equipment [21]. For transient spectral loading cases, such as shock response, a shock loading analysis may be necessary to carry out the fatigue analysis of vehicle components, but this transient loading issue is not included in this study.
In this paper, the necessity of a sine-on-random test for a ground vehicle component is investigated for the case where the component of interest is exposed to multi-pattern excitation that includes both harmonic and random patterns. Several vehicle components belonging to those spectral loading cases, such as electronic devices on a combustion engine, powertrain, and chassis frame, are sub-components of the driving motor system for hybrid vehicles. Three different excitation modes were applied in the uniaxial excitation test of a notched simple specimen: the conventional random test, harmonic test, and sine-on-random test. The damage counting was performed using only the acceleration data for two different methods: the pseudo-damage counting explained in ISO-16750-3 and the physical damage derived using the energy isocline function. We verified the necessity of the sine-on-random test through a comparison of the accumulated fatigue damage values over three different spectral loading spectra. Finally, the vibration test guidelines were constructed for vehicle components based on these results.
2. Damage Counting with Acceleration Data Only
2.1. Pseudo-Damage Counting
The basic concept of damage counting in an elastic system is a stress-life approach using an S-N curve, and this counting method is valid for an elastic loading condition that is less than the yield stress of the test specimen [22,23]. A vehicle component in a vibration test is generally exposed to fully reversible (R = −1) and high cyclic loading sources, both the combustion engine and the road, and the accumulated fatigue is within the elastic region that is suitable for the stress–life approach. If the response stress and response acceleration are given in Equations (1) and (2), respectively, the fatigue damage of a test specimen during can be calculated as shown in Equation (3) [12,13,14,15]:
where and are the magnitudes of the stress and acceleration, and and are the phases of the stress and acceleration, respectively. In addition, and are the fatigue strength exponent and stress range intercepts at the location of interest, respectively. However, the vibration response is widely measured in an acceleration form, and direct information about the fatigue damage over the excitation input is impossible to obtain from the previous formula in Equation (3). Thus, quantification of the severity of the service test can be indexed using another damage concept that is derived directly from acceleration data as shown in Equation (4):
where is a slope related to the fatigue damage. The new damage expression in Equation (4) does not carry any physical meaning because the calculation result does not directly relate to the creation of a crack in the responsible test specimen. Instead, the fatigue value is the test severity index of excitation calculated from the measured acceleration response by assuming that the level of response acceleration is proportional to the fatigue damage of the service system. Therefore, the fatigue damage in Equation (4) is only valid for comparing the severity values of vibration tests, and it is defined as pseudo-damage [19]. The spectral loading can be extended to every possible frequency, and the total pseudo-damage can be derived as the summation of the pseudo-damages from single spectral loadings. The final form of the fatigue summation with duration can be expressed as follows:
where is the discretization number of the input spectrum.
2.2. Physical Damage Counting with Energy Isocline Function
The fatigue damage of a linear system can be derived from acceleration data using an energy isocline function, and the calculated fatigue damage has the physical value of a hot spot, which is an important difference compared to the previous pseudo-damage. The energy isocline function recalls the stress information of the location of interest by using the response acceleration [12,13,14,15]. The energy isocline function can be explained using the frequency response function between the stress and the response acceleration, as shown in Equation (6):
In Equation (6), the stress and acceleration are variables from Equations (1) and (2), respectively, and is the magnitude of the frequency response function between and . The direct calculation of the fatigue damage from the measured acceleration in Equation (2) can be formulated using both the damage counting in Equation (4) and the spectral relationship in Equation (6) during , as shown in Equation (7):
Conversely, the measured acceleration response can be converted into the spectral energy using the power spectral density (PSD) [24,25,26]. Given the acceleration signal in Equation (2), the energy of excitation can be expressed in a frequency domain as shown in Equation (8):
From Equations (7) and (8), both the spectral damage and the vibration energy can be derived using only the acceleration where the variable plays a key role in these equations. If the spectral damage is assumed to be proportionally related to the excitation energy with a certain gain , the spectral damage in Equation (7) can be reformulated as Equations (9) and (10) below [12,13,20]:
The proportional gain is the normalized spectral damage over the scaled excitation energy , and it is defined as the energy isocline function [12,13,14,15]. The spectral damage in Equation (9) can be extended to the full frequency range available if the test system is a time-invariant one. The summation of the spectral damage over the entire frequency range becomes a scalar value that should be equal to the counted fatigue damage in a time domain. The fatigue damage during the vibration test is defined as . The corresponding formulation is shown in Equation (11), where the test duration is fixed as [12,13,20]:
where is the discretization number of the input spectrum. The summation of the fatigue damage in Equation (11) contains the material property of the test specimen with coefficients and , such that it is a different physical value from the previous pseudo-damage, which is useful only for comparing the severity values of test events.
3. Damage Comparison with a Uniaxial Vibration Test
3.1. Uniaxial Vibration Test with a Notched Simple Specimen
A notched simple specimen was introduced in this study to conduct the uniaxial excitation test for different spectral loading cases. The simple specimen was assumed to be a linear system, as well as a time-invariant system, over a high cyclic excitation with a low amplitude. Thus, the two damage calculation methods in Equations (5) and (9) were still valid for the notched simple specimen.
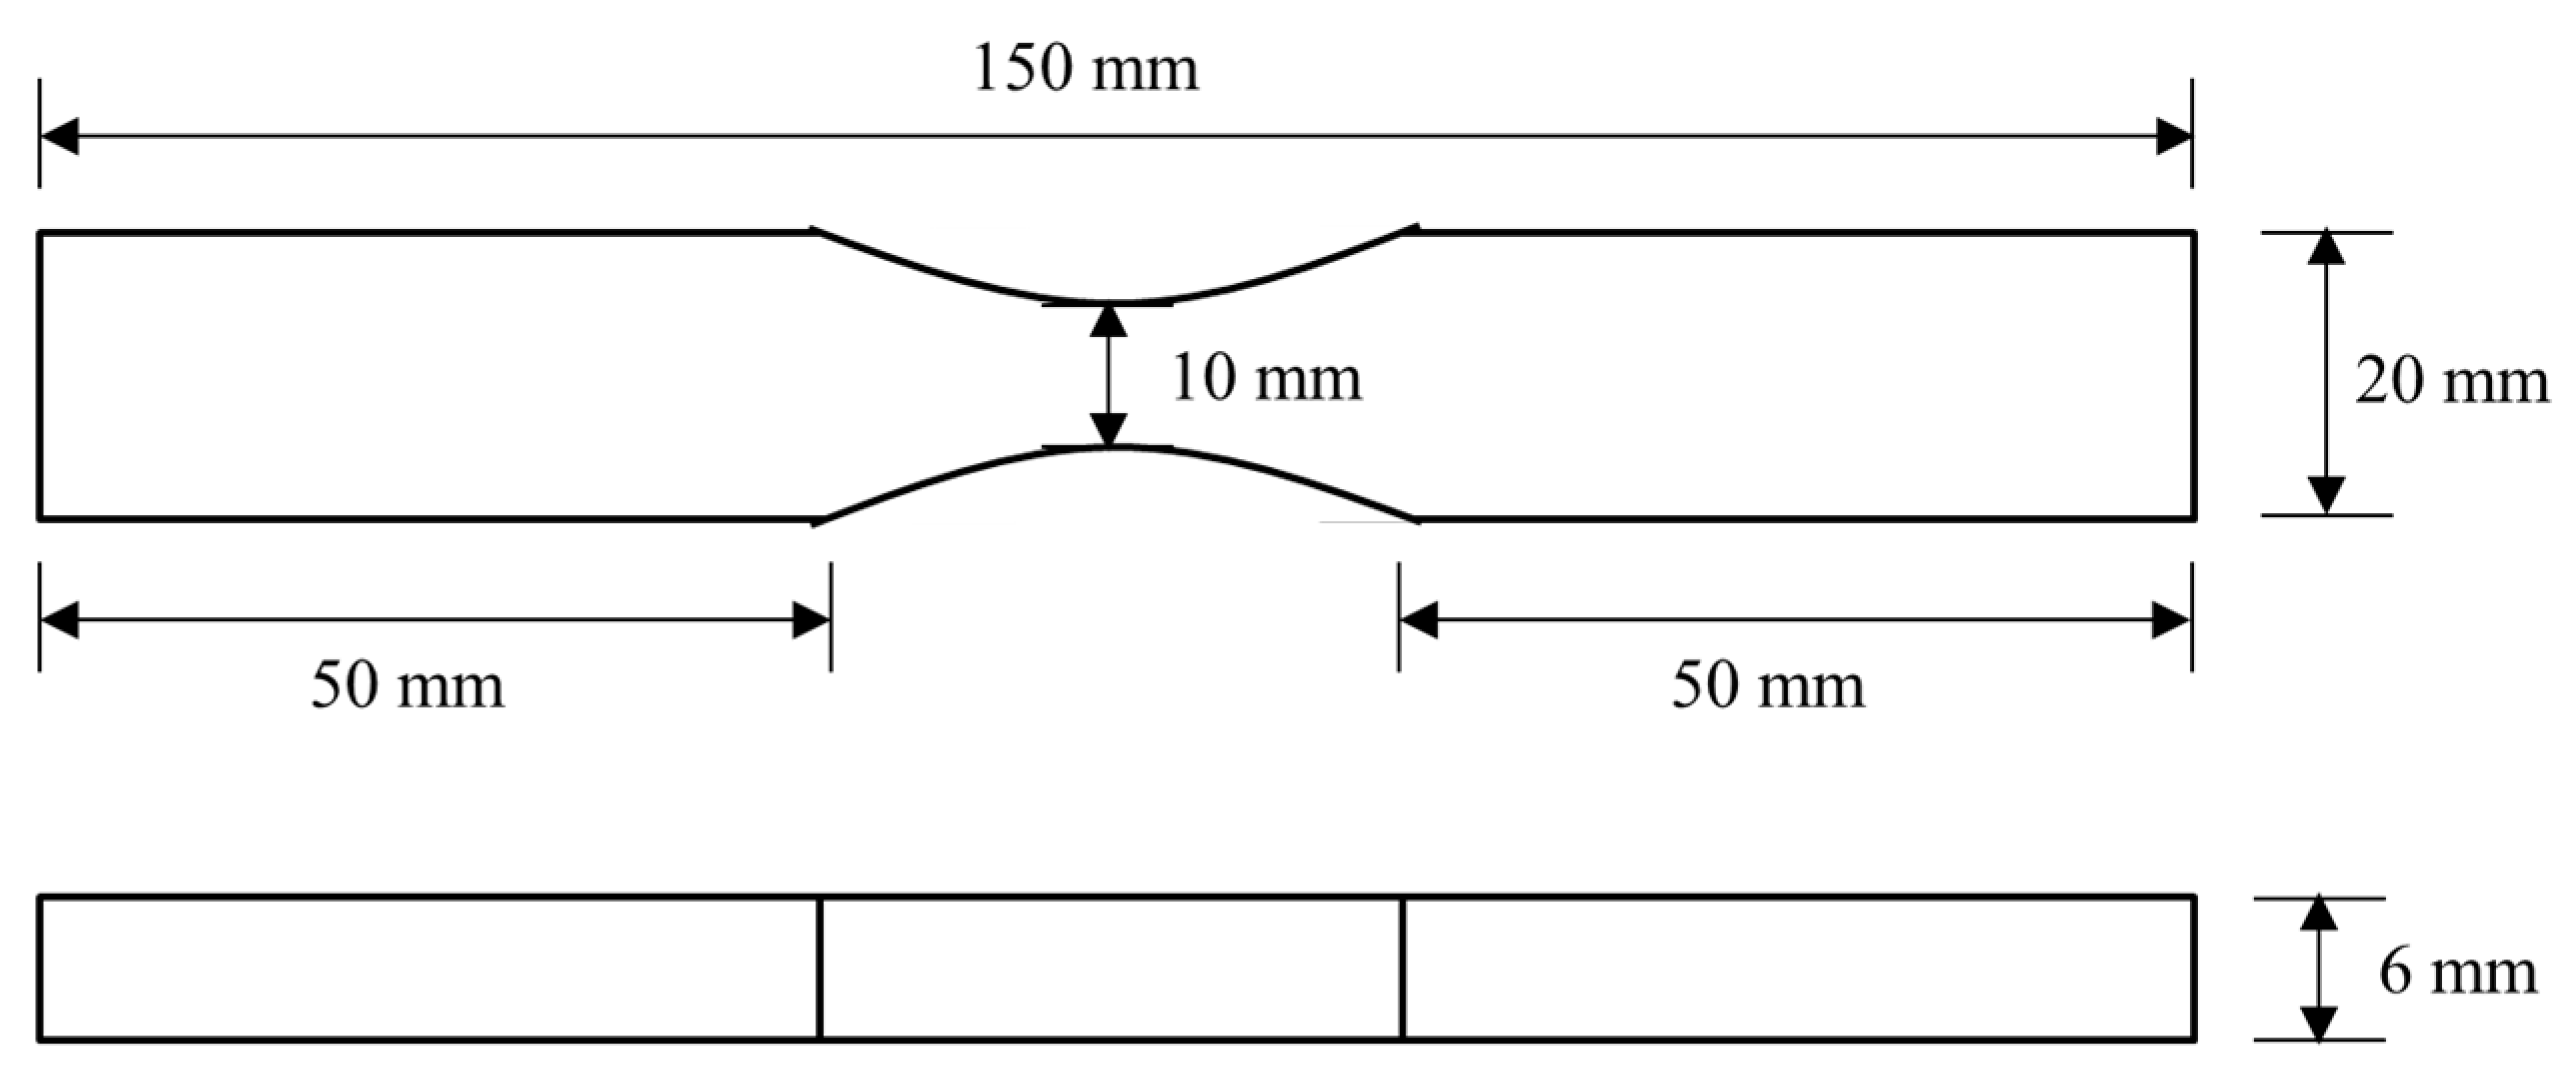
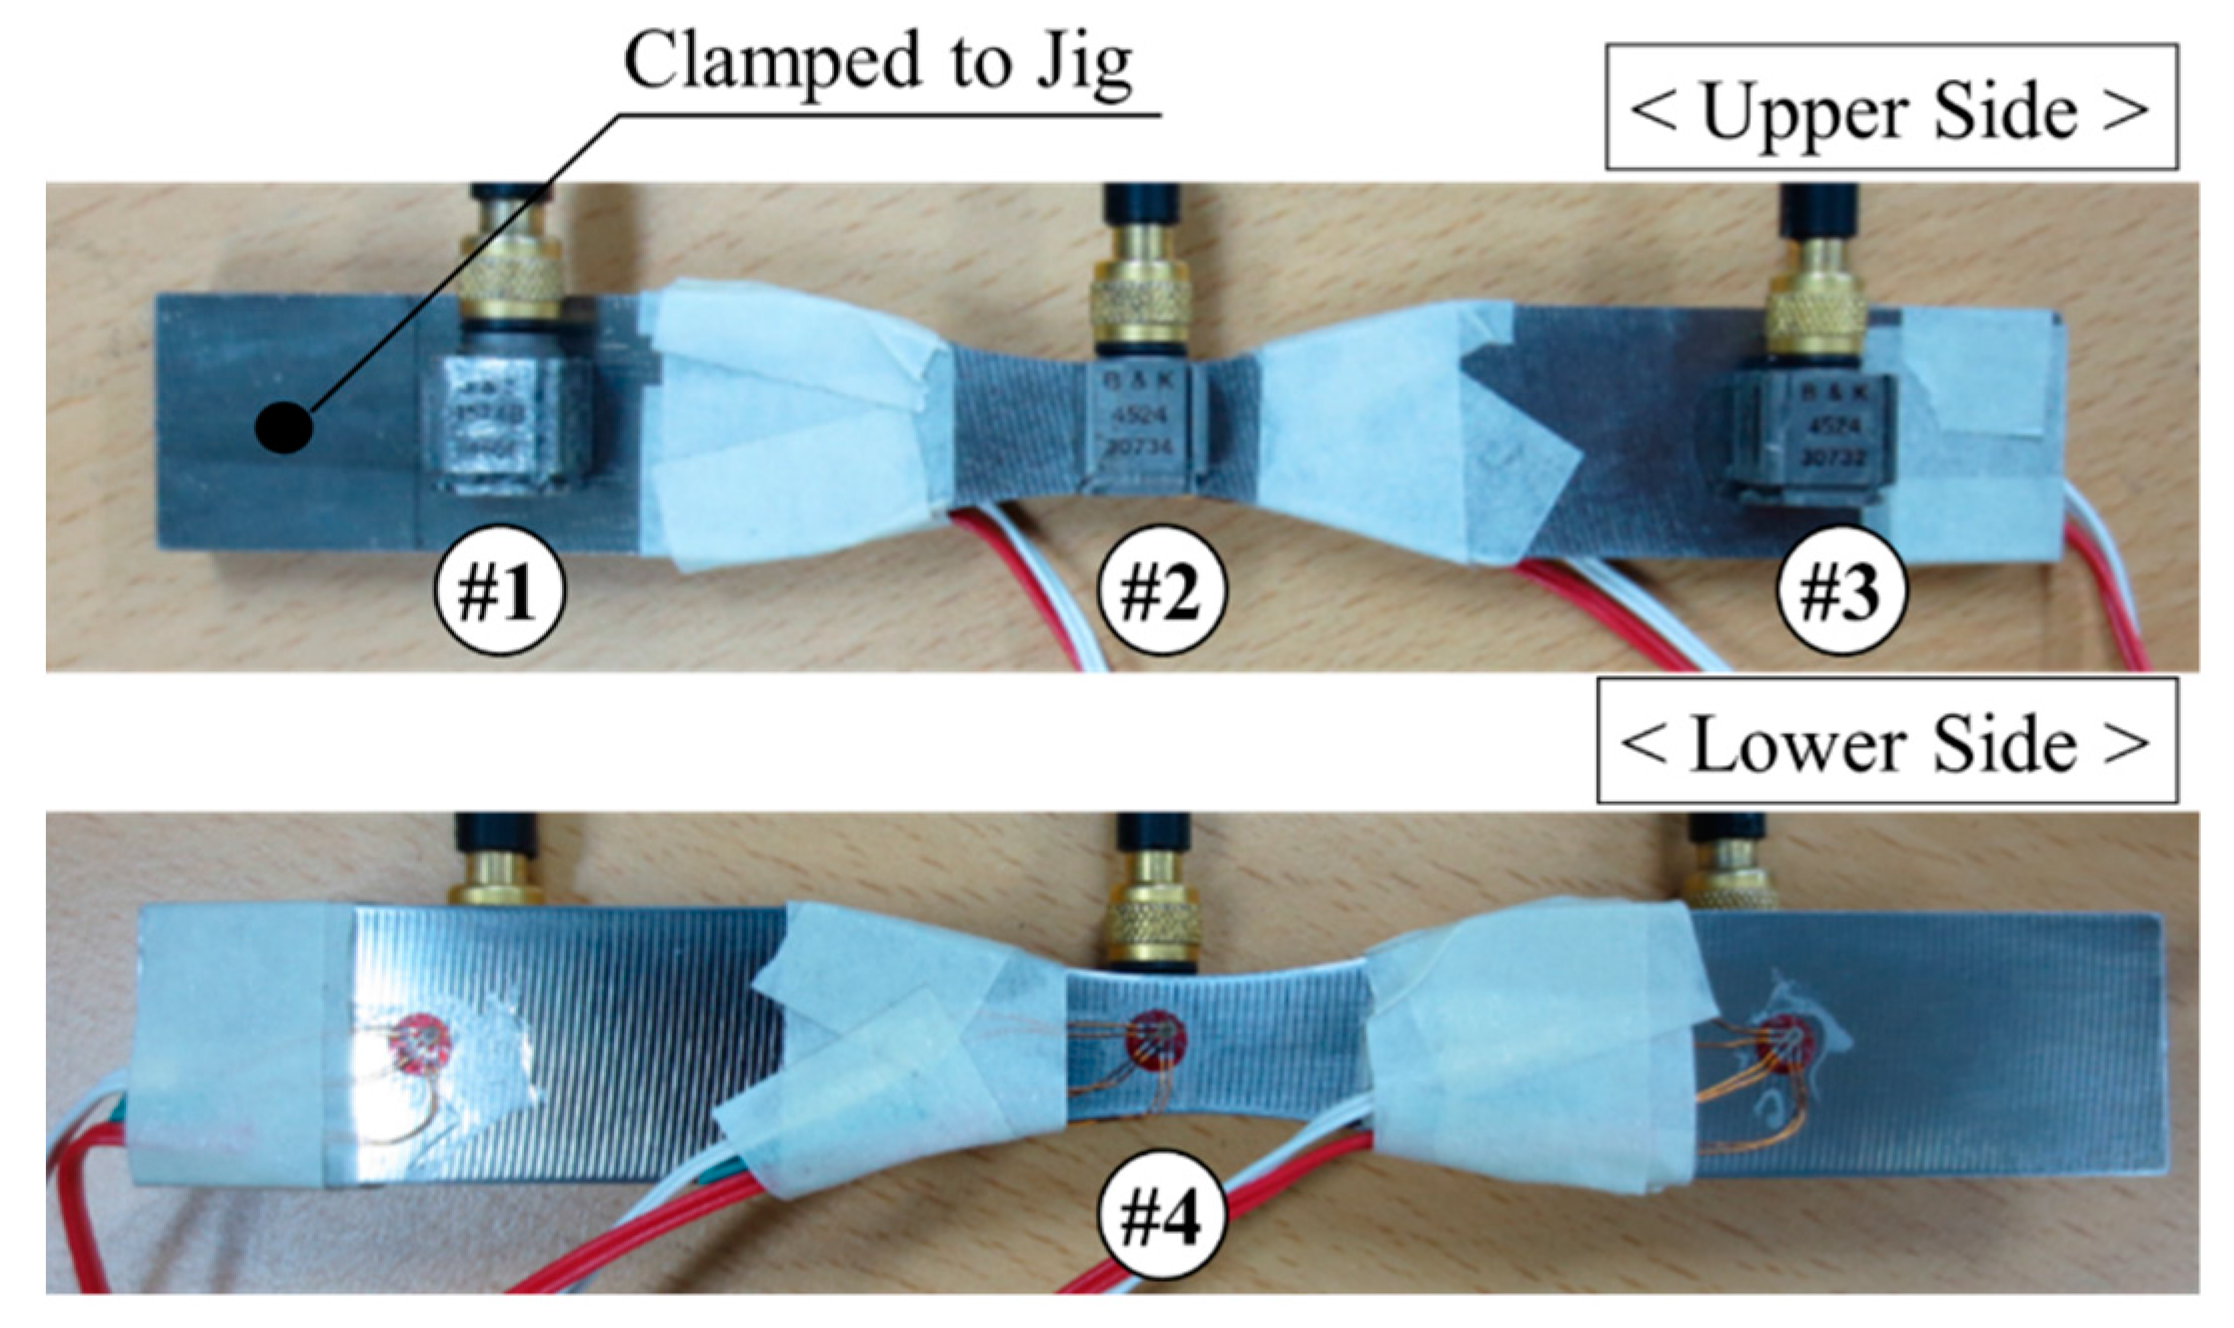
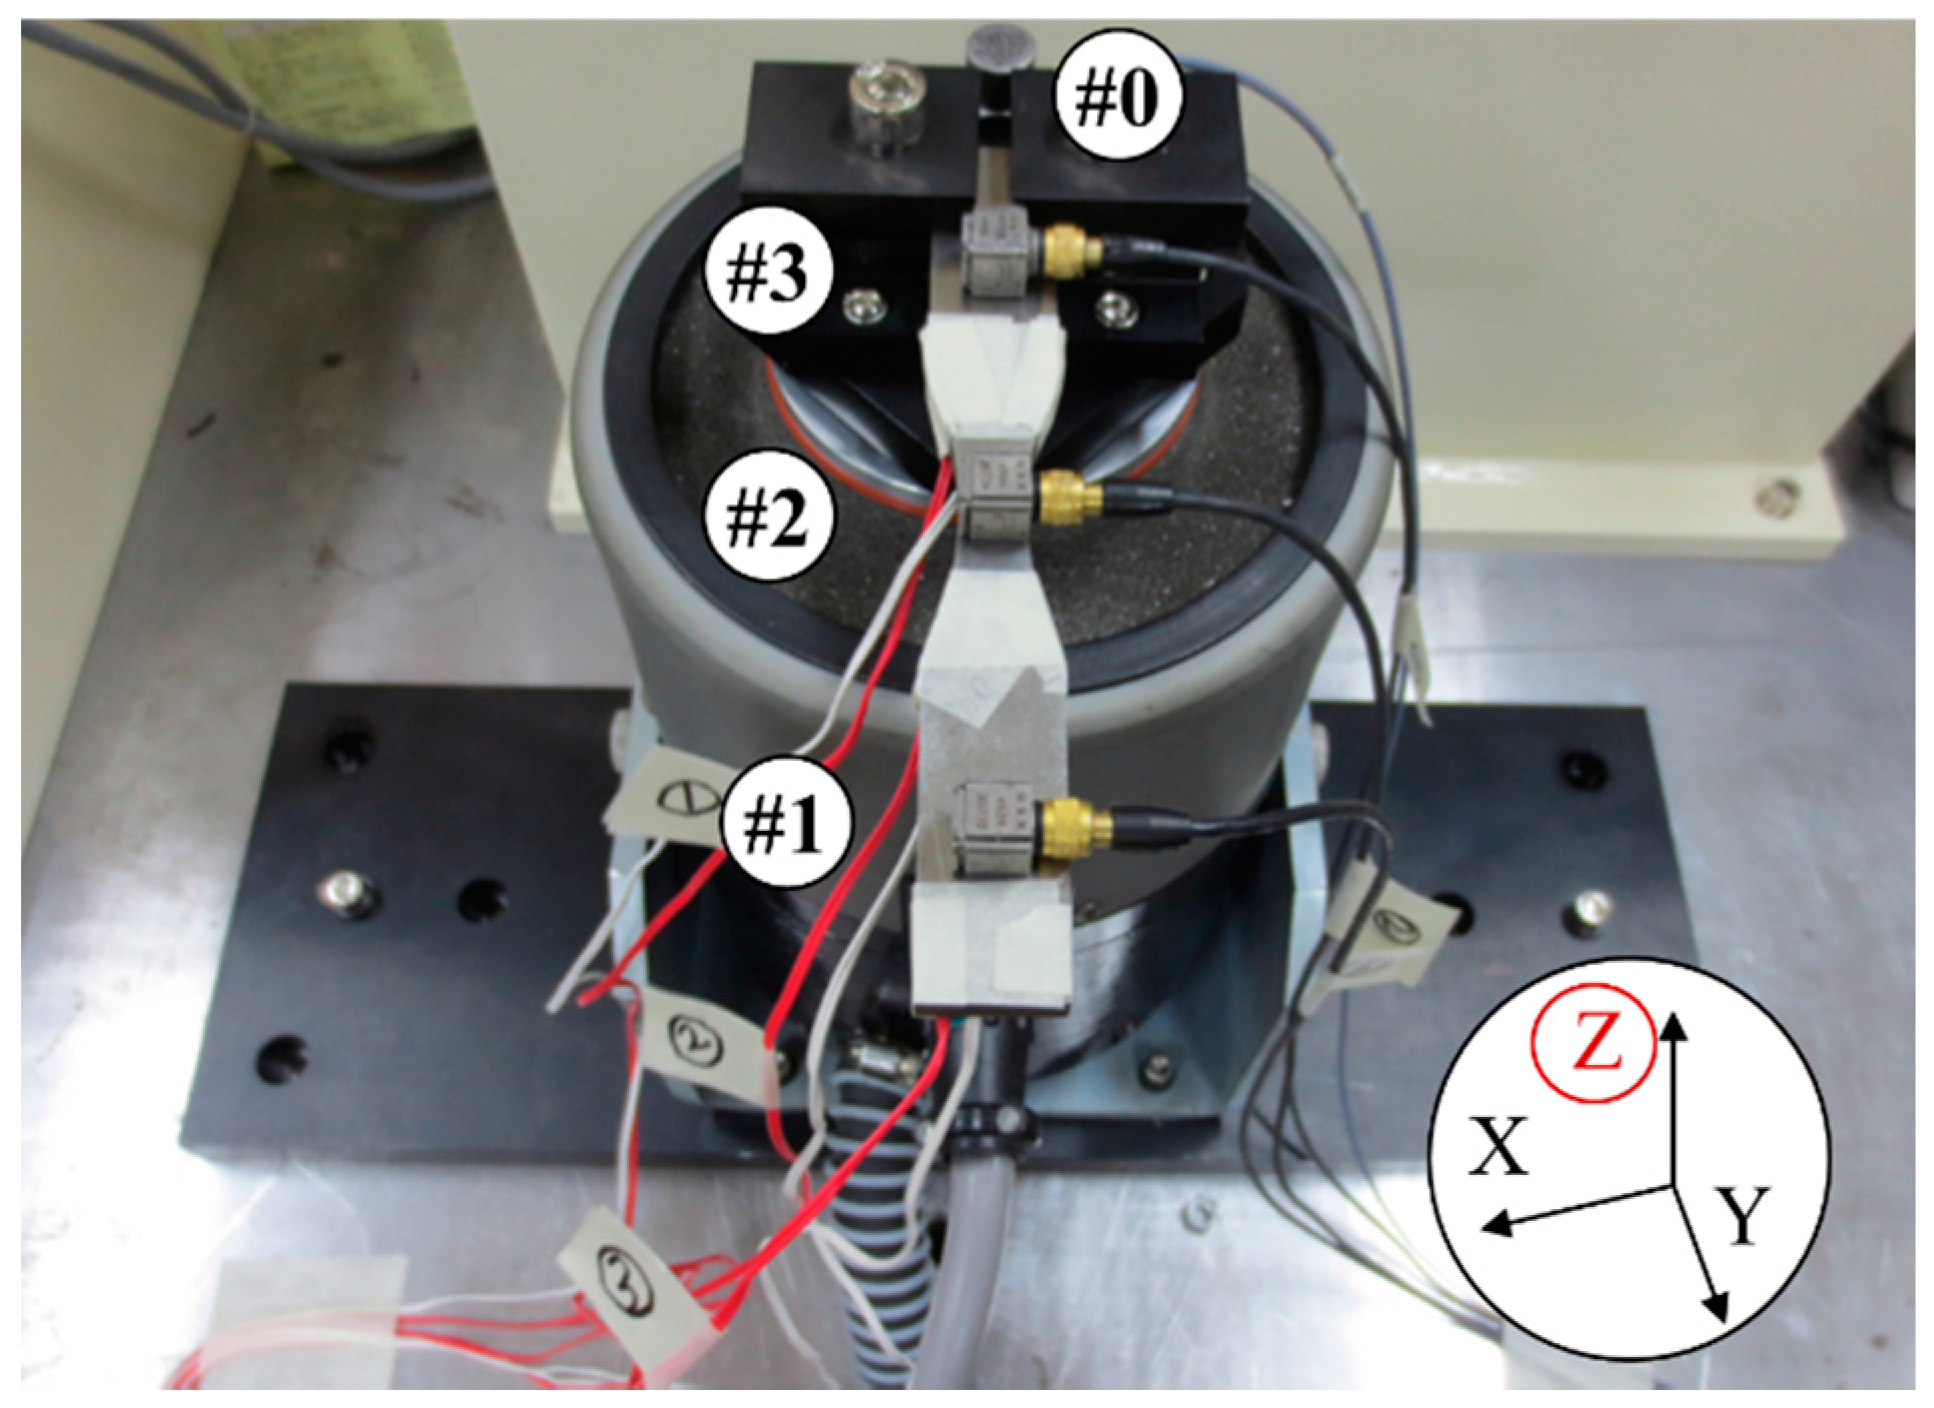
The specimen was designed by considering several test requirements, including the capability of the exciter, definite position of a hot spot, and existence of a resonance peak during excitation. The configuration of the test specimen is illustrated in Figure 1 [15]. A uniaxial shaker (MODAL 110 Exciter/MB dynamics, Cleveland, OH, USA) was used for the source of excitation, which ranged from 20 Hz to 4000 Hz. The modal parameters were identified using a modal algorithm (Test.Lab, SIEMENS, Munich, Germany) with an impact hammer (8204/B&K) under a free–free boundary condition for the test specimen, as listed in Table 1 [15]. During the impact testing, the specimen was suspended by foam blocks. The first resonance frequency of the beam was at 1162.7 Hz (with a 0.55% damping ratio), and the second resonance frequency was greater than 4000 Hz in the vertical direction with respect to the plane of the specimen. Consequently, the first resonance peak may be expected during excitation. The response of the notched simple specimen was measured during excitation using three accelerometers (#1–#3, Model 3246/B&K) and one strain gauge (#4, Model K-XY33-3/350/HBM). The configuration of the attached instrumentation is illustrated in Figure 2 [15]. The test specimen was firmly clamped with a jig at one end of the beam to prevent a fretting effect, and the clamping jig was directly connected to the exciter, which generated only z-directional vibration, as shown in Figure 3 [15].
The main purpose of locating the strain gauge at #4 was to identify the frequency response between the stress and the response acceleration in Equation (6). To minimize the non-linearity of the test specimen during excitation, a sine sweep with a flat magnitude of 0.1 g (where g = 0.98 m/s2) was selected as the preliminary test mode, and a spectral range of 20–4000 Hz was selected as the preliminary excitation mode. The response acceleration at #1–#3 and the strain at #4 were measured during the sine sweep excitation, and the response relation between the three accelerations and one strain gauge was obtained from the measured data before the main test procedure. The response acceleration at #2 was selected for calculating the fatigue damage in this study because the magnitude of this acceleration was larger than those at the other two positions.
The test setup shown in Figure 3 was used to measure the response acceleration of the notched simple specimen when subjected to different spectral loading cases. The conventional test modes of vehicle components are well defined in ISO 16750-3 and are dependent on the mounting location of the vehicle component. These test modes are divided into two categories: sinusoidal and random vibrations [19]. Therefore, two representative spectral loading patterns were suggested for the uniaxial vibration test: harmonic excitation and random excitation, based on the ISO standard. The spectrum range was determined based on a conventional vehicle system. The principle spectrum from a road load is less than 100 Hz, and the critical harmonic excitation at the maximum engine speed (approximately 6000 rev/min) was more than 100 Hz [27,28,29]. In addition, the maximum frequency input range of the shaker was less than 5000 Hz under the payload of the test setup. Thus, three test modes were used for the uniaxial vibration test: random vibration, harmonic vibration, and sine-on-random vibration, which was a mixture of the previous two spectrum patterns. The specific maximum magnitude versus frequency values for the three spectrum patterns are plotted in Figure 4. The response accelerations at the three different locations (#1–#3) were then measured for the three spectral loading cases. This step was the main test procedure to compare the severity levels of the fatigue damage for the different spectral loading cases. Every test schedule was performed three times to eliminate experimental errors during the excitation.
3.2. Fatigue Damage of a Notched Simple Specimen
The measured acceleration data was obtained simultaneously during the uniaxial excitation, and the responses for the different spectral loading patterns are plotted in Figure 5. The sampling frequency of all measured signals was set for 8192 Hz, and the frequency range in Figure 4 was selected up to 2000 Hz because a majority of fatigue damage was accumulated at a resonance frequency of 1530 Hz. The first peak at approximately 290 Hz originated from the rigid mode of the notched simple specimen, which was shifted to 290 Hz from DC (direct current) by the clamped boundary condition. The second resonance at approximately 1530 Hz was shifted from 1162.7 Hz (see the modal test result in Table 1) for the same reason. Therefore, the shifted resonance frequencies, 290 Hz and 1530 Hz, are the most contributed responses during excitation as seen in Figure 4. The transformed acceleration data was used to count the fatigue damage using the formulations in Equations (5) and (7) for the three test modes illustrated in Figure 4. The coefficient required in Equation (5) was set at −1/7 based on a consideration of the suggested slope range of −1/3.5 to −1/10 in ISO 16750-3. Because the notched simple specimen was constructed of S45C (mild steel), and were selected for the fatigue-related material properties used in Equation (7). The fatigue damage found in the vibration test of the notched simple specimen is summarized in Table 2. In addition, the test severity values of different spectral loading cases were compared using the damage ratio between the sine-on-random case and other single spectral pattern cases. These fatigue ratio results are summarized in Table 3 as percentages.
3.3. Discussion
The calculated fatigue damages listed in Table 2 show that the repeatability of the test results was effectively guaranteed for the same test mode, except for the sine-on-random case. In the case of the random test, the deviation of the three physical damages was partially visible because the amplitude of the strain was low enough to be damaged by unexpected noises. The damage variation was larger in the sine-on-random test case compared to the other test modes: the harmonic and random. This was a result of the multi-spectral pattern source, making it difficult to control the phase of the response data compared to a conventional single-spectral pattern source. Thus, the maximum spectral peak of the response data could have changed slightly during the test, which explains the significant variation in the fatigue damage.
The severity of the fatigue damage was more visible in the pseudo-damage than the physical damage. In Table 3, the damage ratios for the two spectral cases, random and harmonic, are 0.02% and 43.3%, respectively, for the pseudo-damage, whereas these damage ratios are less than 0.01% and 79.3%, respectively, for the physical damage. Therefore, no single spectral pattern test (random or harmonic only) can supersede the severity of a sine-on-random test. Even a series of tests under a single spectrum input, random after harmonic or in reverse order, is not sufficient to supplant the sine-on-random test in regard to fatigue damage. In addition, the fatigue damage from a noise source is considerably less than that from a harmonic one because even the single peak response from harmonic excitation leads to critical damage to the test specimen compared to the numerous spectral responses from a noise source.
The pseudo-damage referenced in ISO 16750-3 is only a criterion for grading the severity of a test mode. In contrast, the accumulated damage derived from Equation (7) is a real damage value related to crack initiation, and is a good match for the failure mode of a vibration test. Thus, the physical fatigue damage results were used to compare the test severities over different spectral loading patterns, where the physical damage ratio from random excitation was less than 0.01% and the harmonic excitation was 79.3%, as listed in Table 3. The random excitation alone had little impact on the fatigue damage of the notched simple specimen. Thus, the test mode corresponding to the random source appeared to be redundant. However, the random excitation became a critical source and accelerated the severity of the fatigue result from 79.3% to 100% when the random source was mixed with a harmonic excitation. Therefore, if the notched simple specimen was exposed to harmonic excitation with background noise, one of the single spectral patterns, random or harmonic, would not be sufficient to compensate for the target level of fatigue damage. Thus, the sine-on-random test is the best alternative process to satisfy the required test severity.
The alternative plan involves scaling the magnitude of the spectral loading profile such that the increased response acceleration increases the severity of the test condition [2,3,4]. In Table 3, the current fatigue ratio from harmonic excitation alone is 79.3%, and the fatigue damage can be increased if the acceleration response is multiplied by a specified scaling value. For example, the fatigue damage ratio can be changed to 87.3% and 95.2% if the magnitude of the original acceleration response is increased virtually by 10% and 20%, respectively, over the entire frequency range. However, the modified fatigue damage from scaling of the input profile is dependent on the characteristics of the test specimen. Thus, the selection of the scaling value should be updated when the target system is changed.
4. Vibration Test Guideline for Ground Vehicle Components
If the vehicle component is mounted near a location where the excitation is governed by a single spectral loading pattern, i.e., harmonic excitation from a combustion engine or random excitation from a driving wheel, the two conventional vibration profiles may be reliable test solutions for the vibration tests of vehicle components. However, in the case where the vehicle component of interest is mounted at a location that is subjected to both random and harmonic spectral loading patterns, a uniaxial vibration test should be conducted under the sine-on-random spectral pattern with regards to fatigue damage. If the sine-on-random test of a vehicle component is not suitable for the prepared facilities, it can be superseded by the single spectral patterns, harmonic and random, after increasing the magnitude of the original vibration profile. However, this alternative method has some technical limitations. The first is the increase in the magnitude of excitation that can exceed the capability limit of the exciter. The second is the selection of the optimal scaling value, which changes due to the nature of the test specimen. Some automotive companies have performed vibration tests in series, random after harmonic or harmonic after random, to accelerate the severity of the fatigue damage. This method is not recommended because the duration of the excitation is doubled, while the level of test severity is not increased. A comparison of several vibration test methods is summarized in Table 4. If a ground vehicle component is mounted at a location exposed to both types of excitation sources, random and harmonic, the sine-on-random test is the best test method to satisfy the required fatigue damage with a small test duration.
5. Conclusions
The test severity was verified using a uniaxial excitation test of a notched simple specimen with three different loading patterns: harmonic, random, and sine-on-random. Two fatigue damage levels for the test specimen, the physical damage and pseudo-damage, were calculated using the acceleration responses as followed ISO-16750-3. First, the accumulated physical fatigue damage showed that the test severity from the sine-on-random input was greater than that in the other cases evaluated within this study (harmonic, random, and sequential excitation with both harmonic and random). Moreover, the severity of the pseudo damage from sine-on-random case is considerably higher than other cases derived from single input modes. The sensitivity of fatigue damage is greater for physical damage than the pseudo damage such that the evaluation of the test severity is more efficient when using physical damage. In particular, the sine-on-random test can achieve the required fatigue damage level under very short test durations, whereas conventional cases, (including in-series and random plus harmonic test processes) cannot satisfy the required test severity under long test durations. Therefore, selecting an excitation spectral pattern for vehicle components is crucial in order to satisfy the required damage severity and to minimize the test duration under uniaxial excitation test. In addition, sine-on-random tests must be applied in the event that the component of interest is exposed to both harmonic excitations with background noise in service.
Acknowledgments
This work was sponsored by National Research Foundation of Korea (Grant No. 2017R1D1A1B03034510).
Conflicts of Interest
The author declares no conflict of interest.
References
- Kim, C.J.; Kang, Y.J.; Lee, B.H. Generation of driving profile on a multi-axial vibration table for vibration fatigue damage. Mech. Syst. Signal Process. 2012, 26, 244–253. [Google Scholar] [CrossRef]
- Morill, J.; Achatz, T.; Khosrovaneh, A. An application for fatigue damage analysis using power spectral density from road durability events. SAE Tech. Pap. 1998, 55–62. [Google Scholar] [CrossRef]
- Lin, J.S.; Yim, K.S. Application of random vibration test methods for automotive subsystems using power spectral density (PSD). SAE Tech. Pap. 2000. [Google Scholar] [CrossRef]
- Su, H. Vibration test specification for automotive products based on measured vehicle load data. SAE Tech. Pap. 2006. [Google Scholar] [CrossRef]
- Seba, B.; Nedeljkovic, N.; Paschedag, J.; Lohmann, B. H∞ feedback control and Fx-LMS feedforward control for car engine vibration attenuation. Appl. Acoust. 2005, 66, 277–296. [Google Scholar] [CrossRef]
- Lanchester, F.W. Engine balancing. Proc. Inst. Automob. Eng. 1914, 8, 195–278. [Google Scholar] [CrossRef]
- Kim, C.J.; Kang, Y.J.; Lee, B.H.; Ahn, H.J. Determination of optimal position for both support bearing and unbalance mass of balance shaft. Mech. Mach. Theory 2012, 50, 150–158. [Google Scholar] [CrossRef]
- Bishop, N.W.M.; Sherratt, F. Fatigue life prediction from power spectral density data. Part 1: Traditional approaches. Environ. Eng. 1989, 2, 11–14. [Google Scholar]
- Bishop, N.W.M.; Sherratt, F. Fatigue life prediction from power spectral density data. Part 2: Recent developments. Environ. Eng. 1989, 2, 11–19. [Google Scholar]
- Wirsching, P.H.; Shehata, A.M. Fatigue under wide band random stresses using the rain-flow method. J. Eng. Mater. Technol. 1977, 99, 205–211. [Google Scholar] [CrossRef]
- Liou, H.Y.; Wu, W.F.; Shin, C.S. A modified model for the estimation of fatigue life derived from random vibration theory. Probab. Eng. Mech. 1999, 14, 281–288. [Google Scholar] [CrossRef]
- Kim, C.J.; Kang, Y.J.; Lee, B.H. Experimental spectral damage prediction of a linear elastic system using acceleration response. Mech. Syst. Signal Process. 2011, 25, 2538–2548. [Google Scholar] [CrossRef]
- Kim, C.J.; Lee, B.H.; Kang, Y.J.; Ahn, H.J. Accuracy enhancement of fatigue damage counting using design sensitivity analysis. J. Sound Vib. 2014, 333, 2971–2982. [Google Scholar] [CrossRef]
- Kim, C.J.; Lee, B.H.; Kang, Y.J. Accelerated slam testing of vehicle door plate module using vibration exciter. J. Test. Eval. 2013, 41, 659–666. [Google Scholar] [CrossRef]
- Shin, S.Y.; Kim, C.J. Analysis of spectral fatigue damage of linear elastic systems with different high cyclic loading cases using energy isocline. Trans. Korean Soc. Noise Vib. Eng. 2014, 24, 845–850. [Google Scholar] [CrossRef]
- Koss, L.L.; Karczub, D. Euler beam bending wave solution predictions of dynamic strain using frequency response functions. J. Sound Vib. 1995, 184, 229–244. [Google Scholar] [CrossRef]
- Karczub, D.G.; Norton, M.P. Finite differencing methods for the measurement of dynamic bending strain. J. Sound Vib. 1999, 226, 675–700. [Google Scholar] [CrossRef]
- Lee, G.M. Prediction of strain responses from the measurements of displacement responses. Mech. Syst. Signal Process. 2007, 21, 1143–1152. [Google Scholar] [CrossRef]
- Technical Committee ISO/TC 22. ISO 16750-3(E), Road Vehicles—Environmental Conditions and Testing for Electrical and Electronic Equipment—Part 3: Mechanical Loads; ISO copyright office: Geneva, Switzerland, 2007. [Google Scholar]
- Kim, C.J. Damage count method using acceleration response for vibration test over multi-spectral loading pattern. Trans. Korean Soc. Noise Vib. Eng. 2015, 25, 739–746. [Google Scholar] [CrossRef]
- MIL-STD-810G Committee. Environmental engineering considerations and laboratory tests. In MIL-STD-810G, Department of Defense Test Method Standard; Department of Defense: Washington, DC, USA, 2008. [Google Scholar]
- Stephens, R.I.; Fatemi, A.; Stephens, R.R.; Fuchs, H.O. Metal Fatigue in Engineering; Willey Interscience: Singapore, 2001. [Google Scholar]
- Suresh, S. Fatigue of Materials; Cambridge University Press: Cambridge, UK, 1998. [Google Scholar]
- Davenport, W.B., Jr.; Root, W.L. An Introduction to the Theory of Random Signals and Noise; Wiley Interscience: New York, NY, USA, 1987. [Google Scholar]
- Newland, D.E. An Introduction to Random Vibrations, Spectral and Wavelet Analysis; Longman Scientific and Technical: Essex, UK, 1994. [Google Scholar]
- Bendat, J.S.; Piersol, A.G. Random Data Analysis and Measurement Procedures; Wiley Interscience: New York, NY, USA, 2000. [Google Scholar]
- Harrison, M. Vehicle Refinement, Controlling Noise and Vibration in Road Vehicles; SAE International: Warrendale, PA, USA, 2004. [Google Scholar]
- Hurd, A. Combining accelerated laboratory durability with squeak and rattle evaluation. SAE Tech. Pap. 1991. [Google Scholar] [CrossRef]
- Wan, D.; Kim, H. Evaluation of MAST transfer function in the vehicle exhaust system full system durability test. SAE Tech. Pap. 2002. [Google Scholar] [CrossRef]
Figure 1.
Configuration of notched simple specimen [12,20]. Reproduced with permission from Chan-Jung Kim, Trans. Korean Soc. Noise Vib. Eng., Korean Society of Noise and Vibration Engineering, 2015.

Figure 2.
Sensor locations on the test specimen: three accelerometers at #1–#3 and one strain gauge at #4 [20]. Reproduced with permission from Chan-Jung Kim, Trans. Korean Soc. Noise Vib. Eng., Korean Society of Noise and Vibration Engineering, 2015.
Figure 2.
Sensor locations on the test specimen: three accelerometers at #1–#3 and one strain gauge at #4 [20]. Reproduced with permission from Chan-Jung Kim, Trans. Korean Soc. Noise Vib. Eng., Korean Society of Noise and Vibration Engineering, 2015.

Figure 3.
Configuration of test setup for uniaxial excitation: excitation conducted only in the z-direction and accelerometer at #0 used for exciter controller [20]. Reproduced with permission from Chan-Jung Kim, Trans. Korean Soc. Noise Vib. Eng., Korean Society of Noise and Vibration Engineering, 2015.

Figure 4.
Vibration test modes for three different spectral excitations (1 g = 9.8 m/s2): (a) random; (b) harmonic; (a) + (b) sine-on-random.
Figure 4.
Vibration test modes for three different spectral excitations (1 g = 9.8 m/s2): (a) random; (b) harmonic; (a) + (b) sine-on-random.
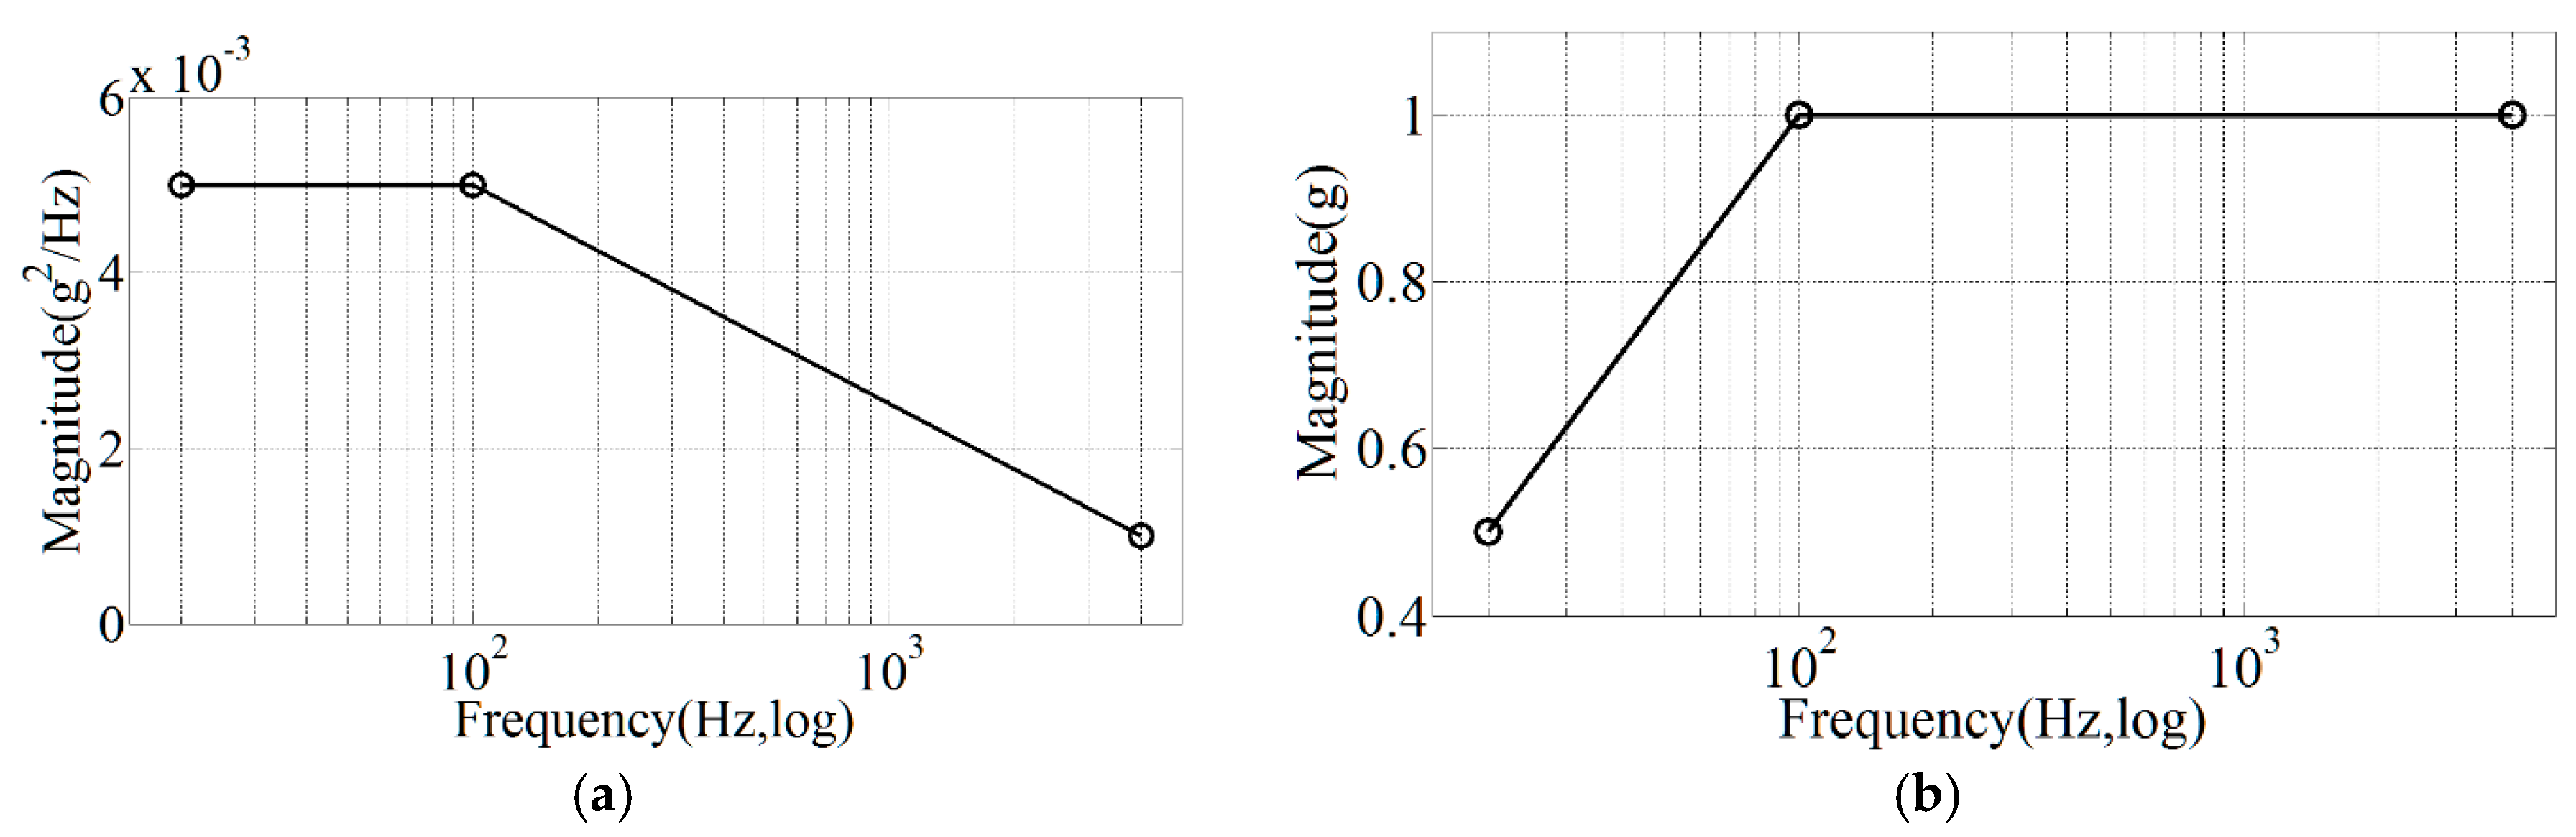
Figure 5.
Acceleration responses of notched simple specimen at #2: ![Applsci 07 00805 i001]() : sine-on-random excitation;
: sine-on-random excitation; ![Applsci 07 00805 i002]() : harmonic excitation; and
: harmonic excitation; and ![Applsci 07 00805 i003]() : random excitation.
: random excitation.
 : sine-on-random excitation;
  : harmonic excitation; and
  : random excitation.
Figure 5.
Acceleration responses of notched simple specimen at #2: ![Applsci 07 00805 i001]() : sine-on-random excitation;
: sine-on-random excitation; ![Applsci 07 00805 i002]() : harmonic excitation; and
: harmonic excitation; and ![Applsci 07 00805 i003]() : random excitation.
: random excitation.
: sine-on-random excitation; : harmonic excitation; and : random excitation.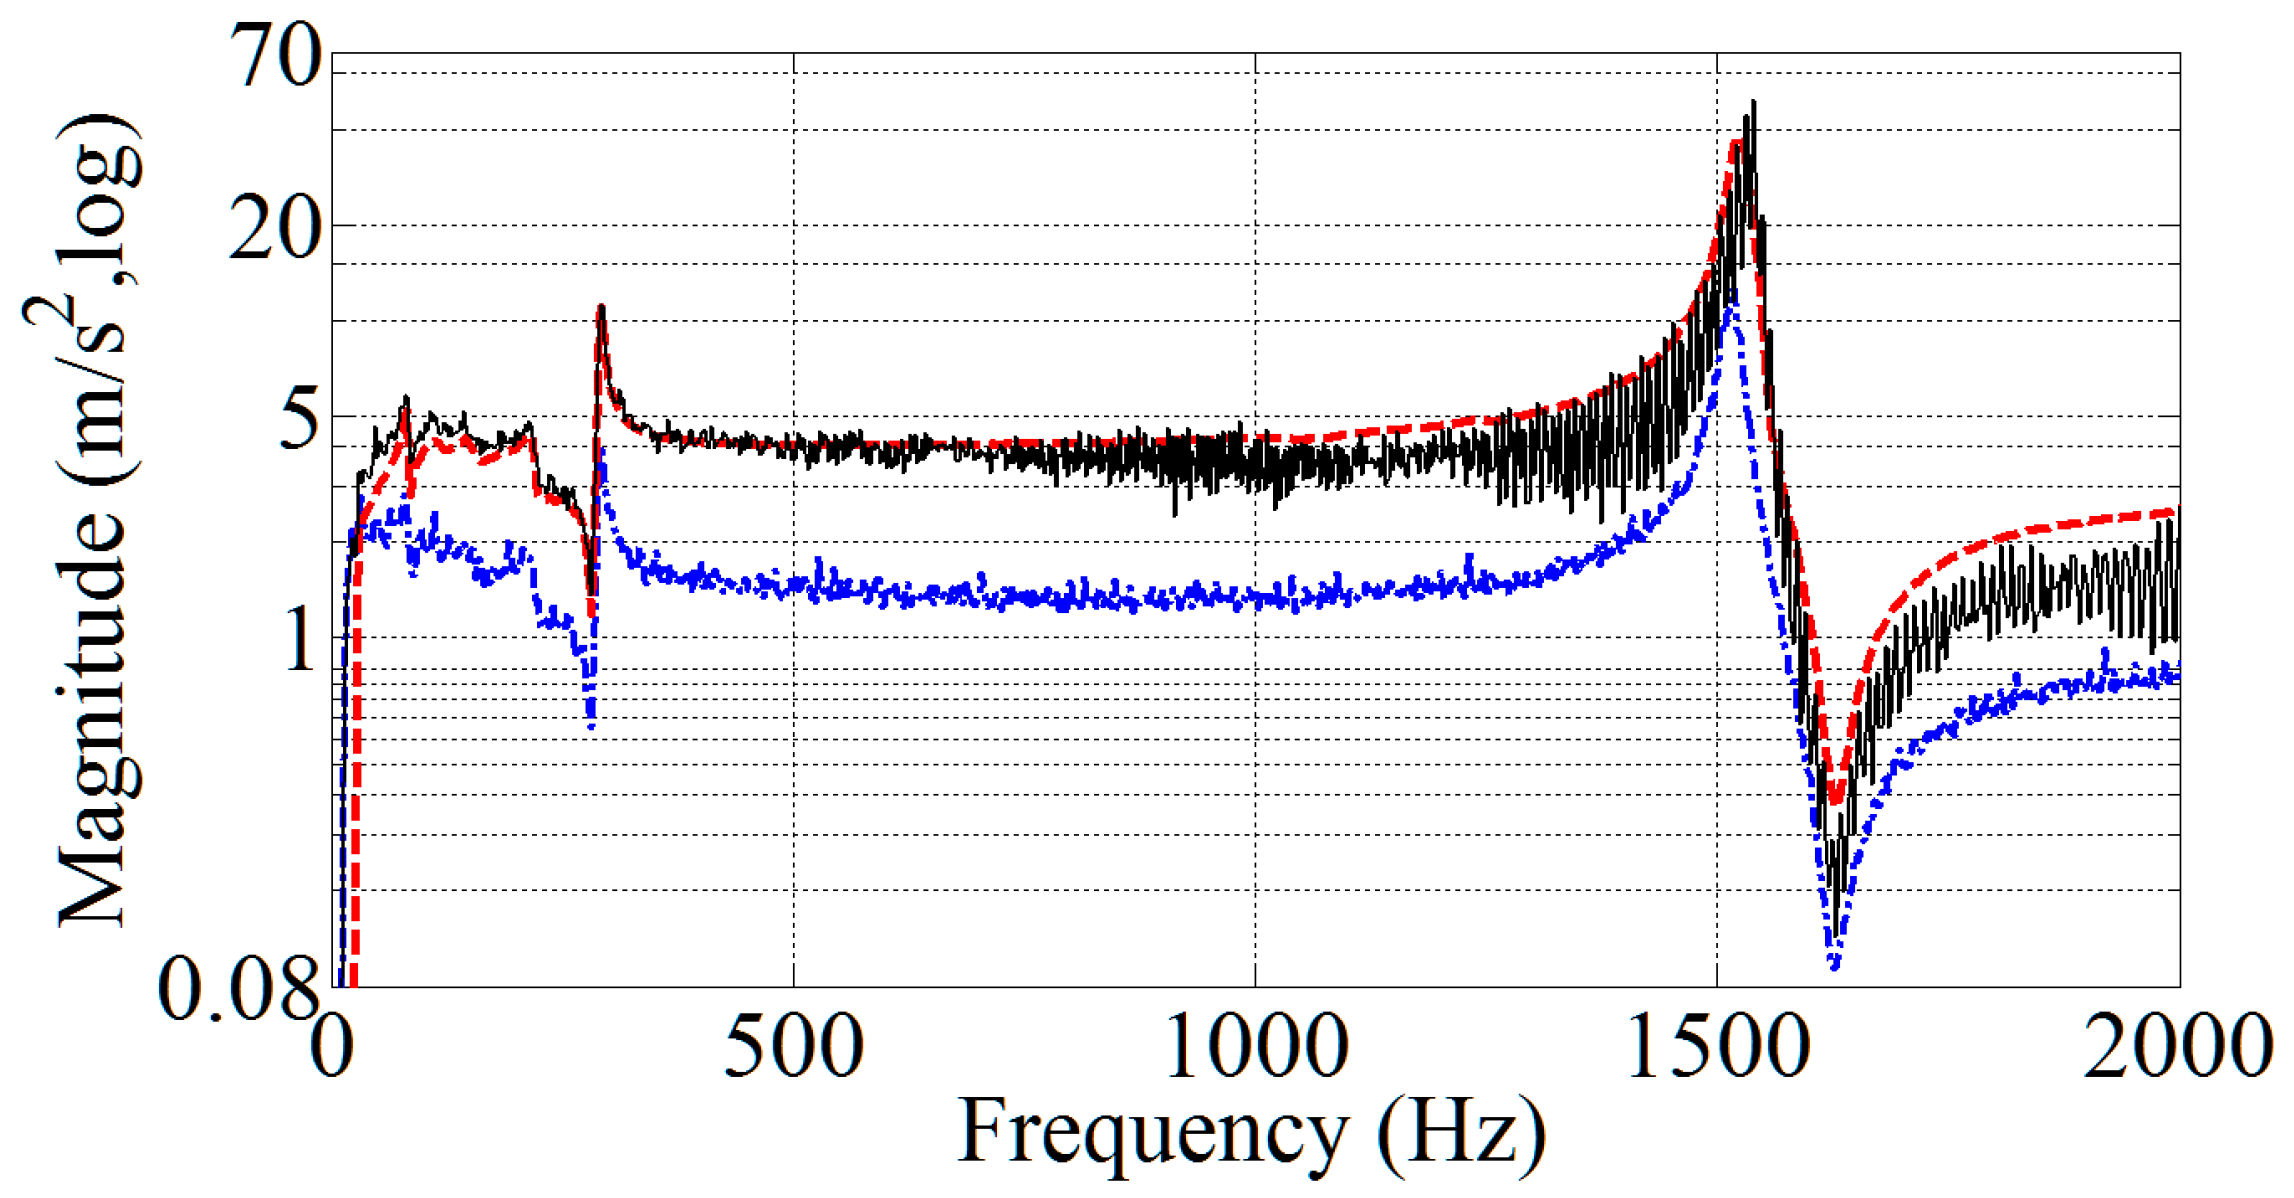

Table 1.
Modal parameters of simple notched specimen.
| # | Frequency (Hz) | Damping (%) | Shape Type |
| 1 | 1162.7 | 0.55 | Bending |
Table 2.
Accumulated spectral fatigue damage over different spectral loading patterns and damages.
| Mode | # | Pseudo Damage | # | Physical Damage |
|---|---|---|---|---|
| Random | 1 | 1.10 × 10⁻⁴ | 1 | 1.70 × 10⁻¹⁰ |
| 2 | 1.55 × 10⁻⁴ | 2 | 9.95 × 10⁻¹⁰ | |
| 3 | 1.08 × 10⁻⁴ | 3 | 3.23 × 10⁻¹⁰ | |
| Avg. | 1.24 × 10⁻⁴ | Avg. | 4.96 × 10⁻¹⁰ | |
| Harmonic | 1 | 2.92 × 10⁻¹ | 1 | 5.97 × 10⁻⁵ |
| 2 | 3.00 × 10⁻¹ | 2 | 6.01 × 10⁻⁵ | |
| 3 | 2.93 × 10⁻¹ | 3 | 6.28 × 10⁻⁵ | |
| Avg. | 2.95 × 10⁻¹ | Avg. | 6.09 × 10⁻⁵ | |
| Sine-on-Random | 1 | 7.48 × 10⁻¹ | 1 | 1.02 × 10⁻⁴ |
| 2 | 7.47 × 10⁻¹ | 2 | 7.03 × 10⁻⁵ | |
| 3 | 5.52 × 10⁻¹ | 3 | 5.76 × 10⁻⁵ | |
| Avg. | 6.82 × 10⁻¹ | Avg. | 7.67 × 10⁻⁵ |
Table 3.
Damage ratios between single spectra and sine-on-random.
| Mode | Pseudo Damage | Physical Damage |
|---|---|---|
| Random | 0.02 (%) | Less than 0.01 (%) |
| Harmonic | 43.3 (%) | 79.3 (%) |
Table 4.
Comparison of vibration test methods over different spectral loading patterns.
| Mode | Duration | Physical Damage |
|---|---|---|
| Random | short | very small |
| Harmonic | short | Small |
| Sine → Harmonic or Harmonic → Sine | long | Small |
| Sine-on-random | short | Large |
© 2017 by the author. Licensee MDPI, Basel, Switzerland. This article is an open access article distributed under the terms and conditions of the Creative Commons Attribution (CC BY) license (http://creativecommons.org/licenses/by/4.0/).
Share and Cite
MDPI and ACS Style
Kim, C.-J. Accelerated Sine-on-Random Vibration Test Method of Ground Vehicle Components over Conventional Single Mode Excitation. Appl. Sci. 2017, 7, 805. https://doi.org/10.3390/app7080805
AMA Style
Kim C-J. Accelerated Sine-on-Random Vibration Test Method of Ground Vehicle Components over Conventional Single Mode Excitation. Applied Sciences. 2017; 7(8):805. https://doi.org/10.3390/app7080805
Chicago/Turabian StyleKim, Chan-Jung. 2017. "Accelerated Sine-on-Random Vibration Test Method of Ground Vehicle Components over Conventional Single Mode Excitation" Applied Sciences 7, no. 8: 805. https://doi.org/10.3390/app7080805
Note that from the first issue of 2016, this journal uses article numbers instead of page numbers. See further details here.