Effect of Prestress Levels and Jacking Methods on Friction Losses in Curved Prestressed Tendons

College of Engineering, Sungkyunkwan University, Natural Sciences Campus, (16419) 2066 Seobu-Ro, Jangan-Gu, Suwon-Si, Gyeonggi-Do, Korea
Appl. Sci. 2017, 7(8), 824; https://doi.org/10.3390/app7080824
Submission received: 21 June 2017
/
Revised: 28 July 2017
/
Accepted: 8 August 2017
/
Published: 11 August 2017
Abstract
:The effects of prestressing methods and prestress levels on the friction losses of prestressed tendons were evaluated in this study. Two full-scale prestressed concrete girders were fabricated and used for the friction loss experiment. The prestress level was varied from 13% to 45% of the ultimate tensile strength of the prestressing tendon, and prestressing was performed by jacking one or both ends. The test results indicated that the actual friction loss measured at low prestress levels was up to 4.3 times higher than the theoretical friction loss. As the prestress level increased, the difference between the measured and theoretical friction losses gradually decreased, and the two eventually converged. On average, the ratio of the prestress force at the jacking end to the prestress force measured at midspan was 85.4% with jacking at both ends, and 81.1% with jacking at one end.
1. Introduction
Prestressed concrete (PSC) is used extensively in bridges, multistory buildings, and many other important parts of today’s modern infrastructure. In particular, prestressing systems are essential for long-span bridges that use concrete as the main material. Prestressing systems are generally divided into pre- and post-tensioning methods [1]. In the post-tensioning methods, prestressing tendons pre-mounted in a sheath are extended using tensioning devices and fixed to anchorages pre-installed at the ends of the concrete members. Then, the prestress force is transferred to the concrete. However, the tensioning force at the prestressing tendon inevitably decreases during or after prestressing, i.e., a prestress loss occurs. The losses at the prestressing tendon can be divided into instantaneous losses that occur during prestressing and time-dependent losses after prestressing [2].
The instantaneous losses that occur in PSC girders manufactured by the post-tensioning method are caused by three factors: creep and shrinkage of concrete, and relaxation of the prestressing steel. An exact determination of the magnitude of the time-dependent losses is not feasible because they depend on a multiplicity of interrelated factors. Thus, many empirical methods are used to estimate time-dependent losses. The instantaneous lossesare caused by three factors: anchorage slip, friction between the prestressing tendon and sheath, and elastic shortening of concrete [3]. Among these factors, the friction loss has the greatest effect on the initial prestress force of the tendon [4]. The friction loss can affect even the midspan of the girder, whereas the loss resulting from anchorage slip is limited to the vicinity of the end anchorage. The elastic shortening of concrete may cause substantial losses. In a post-tensioning system, concrete is elastically shortened during the jacking process, but this is compensated for because the prestressing tendon is tensioned until the required prestress force is obtained. Therefore, there are almost no losses from elastic shortening to be allowed for at jacking. Owing to these instantaneous losses, the prestress force of the tendon is not constant and is smallest at midspan.
It is critical to determine the initial force of the prestressing tendon accurately in order to achieve initial usability and stability of PSC structures. The service load capacity of the structure may not be sufficient if the introduced prestress force is greatly reduced by instantaneous losses, particularly the friction loss at midspan, which has the greatest bending moment. Therefore, the friction loss has higher importance than the other instantaneous losses, and the improved accuracy of friction loss models will assist structural engineers designing PSC structures.
Many researchers have studied the instantaneous losses of steel tendons, but most of them have focused on the anchorage slip [5] and elastic shortening of concrete [6]. Furthermore, almost all of the test specimens used in the previous studies were limited to small-scale concrete members [7,8,9]. There are a few reports on friction loss tests using full-scale concrete girders. Tran [10] and Davis [11] conducted friction tests using 22.3 m concrete beams, and eight 54 mm galvanized steel ducts were used in each beam. The beams used by Tran weremonolithically fabricated, whereas those used by Davis were segmentally fabricated. Tran’s tests were conducted using unoiled tendons and tendons oiled with four emulsifiable oils for corrosion protection and lubrication, selected from a preliminary test performed by Kittleman et al. [12]. Davis’ tests, on the other hand, were conducted using unoiled tendons and tendons oiled with Wright 502 (a type of emulsifiable oil). Based on the results of these tests, both researchers reported that the unoiled tendons showed almost no increase or decrease in friction coefficient, whereas the oiled tendons showed an 8–25% decrease. Lüthi et al. [13] published a summary of a study conducted at Pennsylvania State University and the University of Texas at Austin regarding the effects of unflushed emulsifiable oils on corrosion, bond, and friction losses. The friction tests in the study showed that if the tendon was stressed when the oil was fresh, the lubrication decreased the friction coefficient by approximately 15% in the rigid steel pipes and high-density polyethylene (HDPE) ducts. Furthermore, the friction coefficient for the HDPE ducts was significantly lower than the value recommended by the American Association of State Highway and Transportation Officials (AASTHO) [14]. Previous studies have mainly investigated the effects of both duct material and emulsifiable oilson friction losses in post-tensioned concrete.
Structural engineers use the wobble and friction coefficients, which are typically presented as constant values in the design codes, to evaluate friction losses [15,16], even though the friction between a prestressing tendon and its sheath can be greatly affected by the prestress levels and prestressing methods. Therefore, more studies pertaining to the evaluation of friction losses using full-scale PSC girders are required in order to design the PSC girder and evaluate its flexural behavior accurately.
This study evaluated the effects of the prestressing methods and prestress levels on the friction losses of a curved prestressing tendon. Two 30-m long full-scale PSC girders were fabricated and used for the friction loss tests. The tests evaluated the effects of varying the prestress levels from 13% to 45% of the ultimate tensile strength of a prestressing tendon with jacking at one end or at both ends. The test results were used to analyze the effects of the experimental variables on the friction losses of prestressing tendons mounted in a sheath tube of a full-scale PSC girder.
2. Theoretical Background of Friction Loss (Friction Losses in Prestressing Tendon)
The force generated along the length of a prestressing tendon tensioned by a hydraulic jack in a PSC structure is not uniform because of the tension between the sheath tube and tendons. This phenomenon is caused by the friction losses. The friction losses consist of two elements: curvature and wobble.
For more efficient load resistance, in PSC, the tendons are embedded in a curved rather than a straight shape. The curvature friction loss is caused by the intended angular change of the tendon profile. If the tendon direction changes by the angle along the tendon length , a vertical force equal to is generated as shown in Figure 1. Furthermore, if the friction coefficient between the tendon and sheath tube is , the friction loss at the infinitesimal length is . It is possible to replace with because the related angles are generally very small. Thus, the friction loss generated by the tendon’s curvature becomes .
The prestress force is not decreased by the friction loss if the prestressing tendon and sheath tube are perfectly linear. However, the tendon and sheath in the actual construction cannot be perfectly linear. Furthermore, the sheath tube cannot avoid small wobbles during the actual construction, even if it is placed linearly, as shown in Figure 1. The same applies to tendons arranged in a curved line. Therefore, angular changes occur regardless of whether the tendons are arranged linearly or in a curved line. As a result, the prestress force introduced to the tendons is inevitably reduced. This type of loss is called the loss by the length effect or wobbling effect of the tendon. The size of this loss depends on the tendon type, size and type of the sheath, and rigidity. The wobble loss along the infinitesimal length of the tendon is expressed as , where is the empirically determined wobble coefficient.
The total friction loss along the infinitesimal length is as follows:
The change in the tendon force between points A and B in Figure 1 can be expressed as follows:
when Equation (2) is integrated, it becomes
Finally, the friction loss can be expressed as follows:
where = tendon force at location A, = tendon force at location B, = friction loss in the prestressing tendon, = friction coefficient, = total intended cumulative angle change between A and B in radians, = wobble friction coefficient per meter of tendon, and = tendon length between A and B in m.
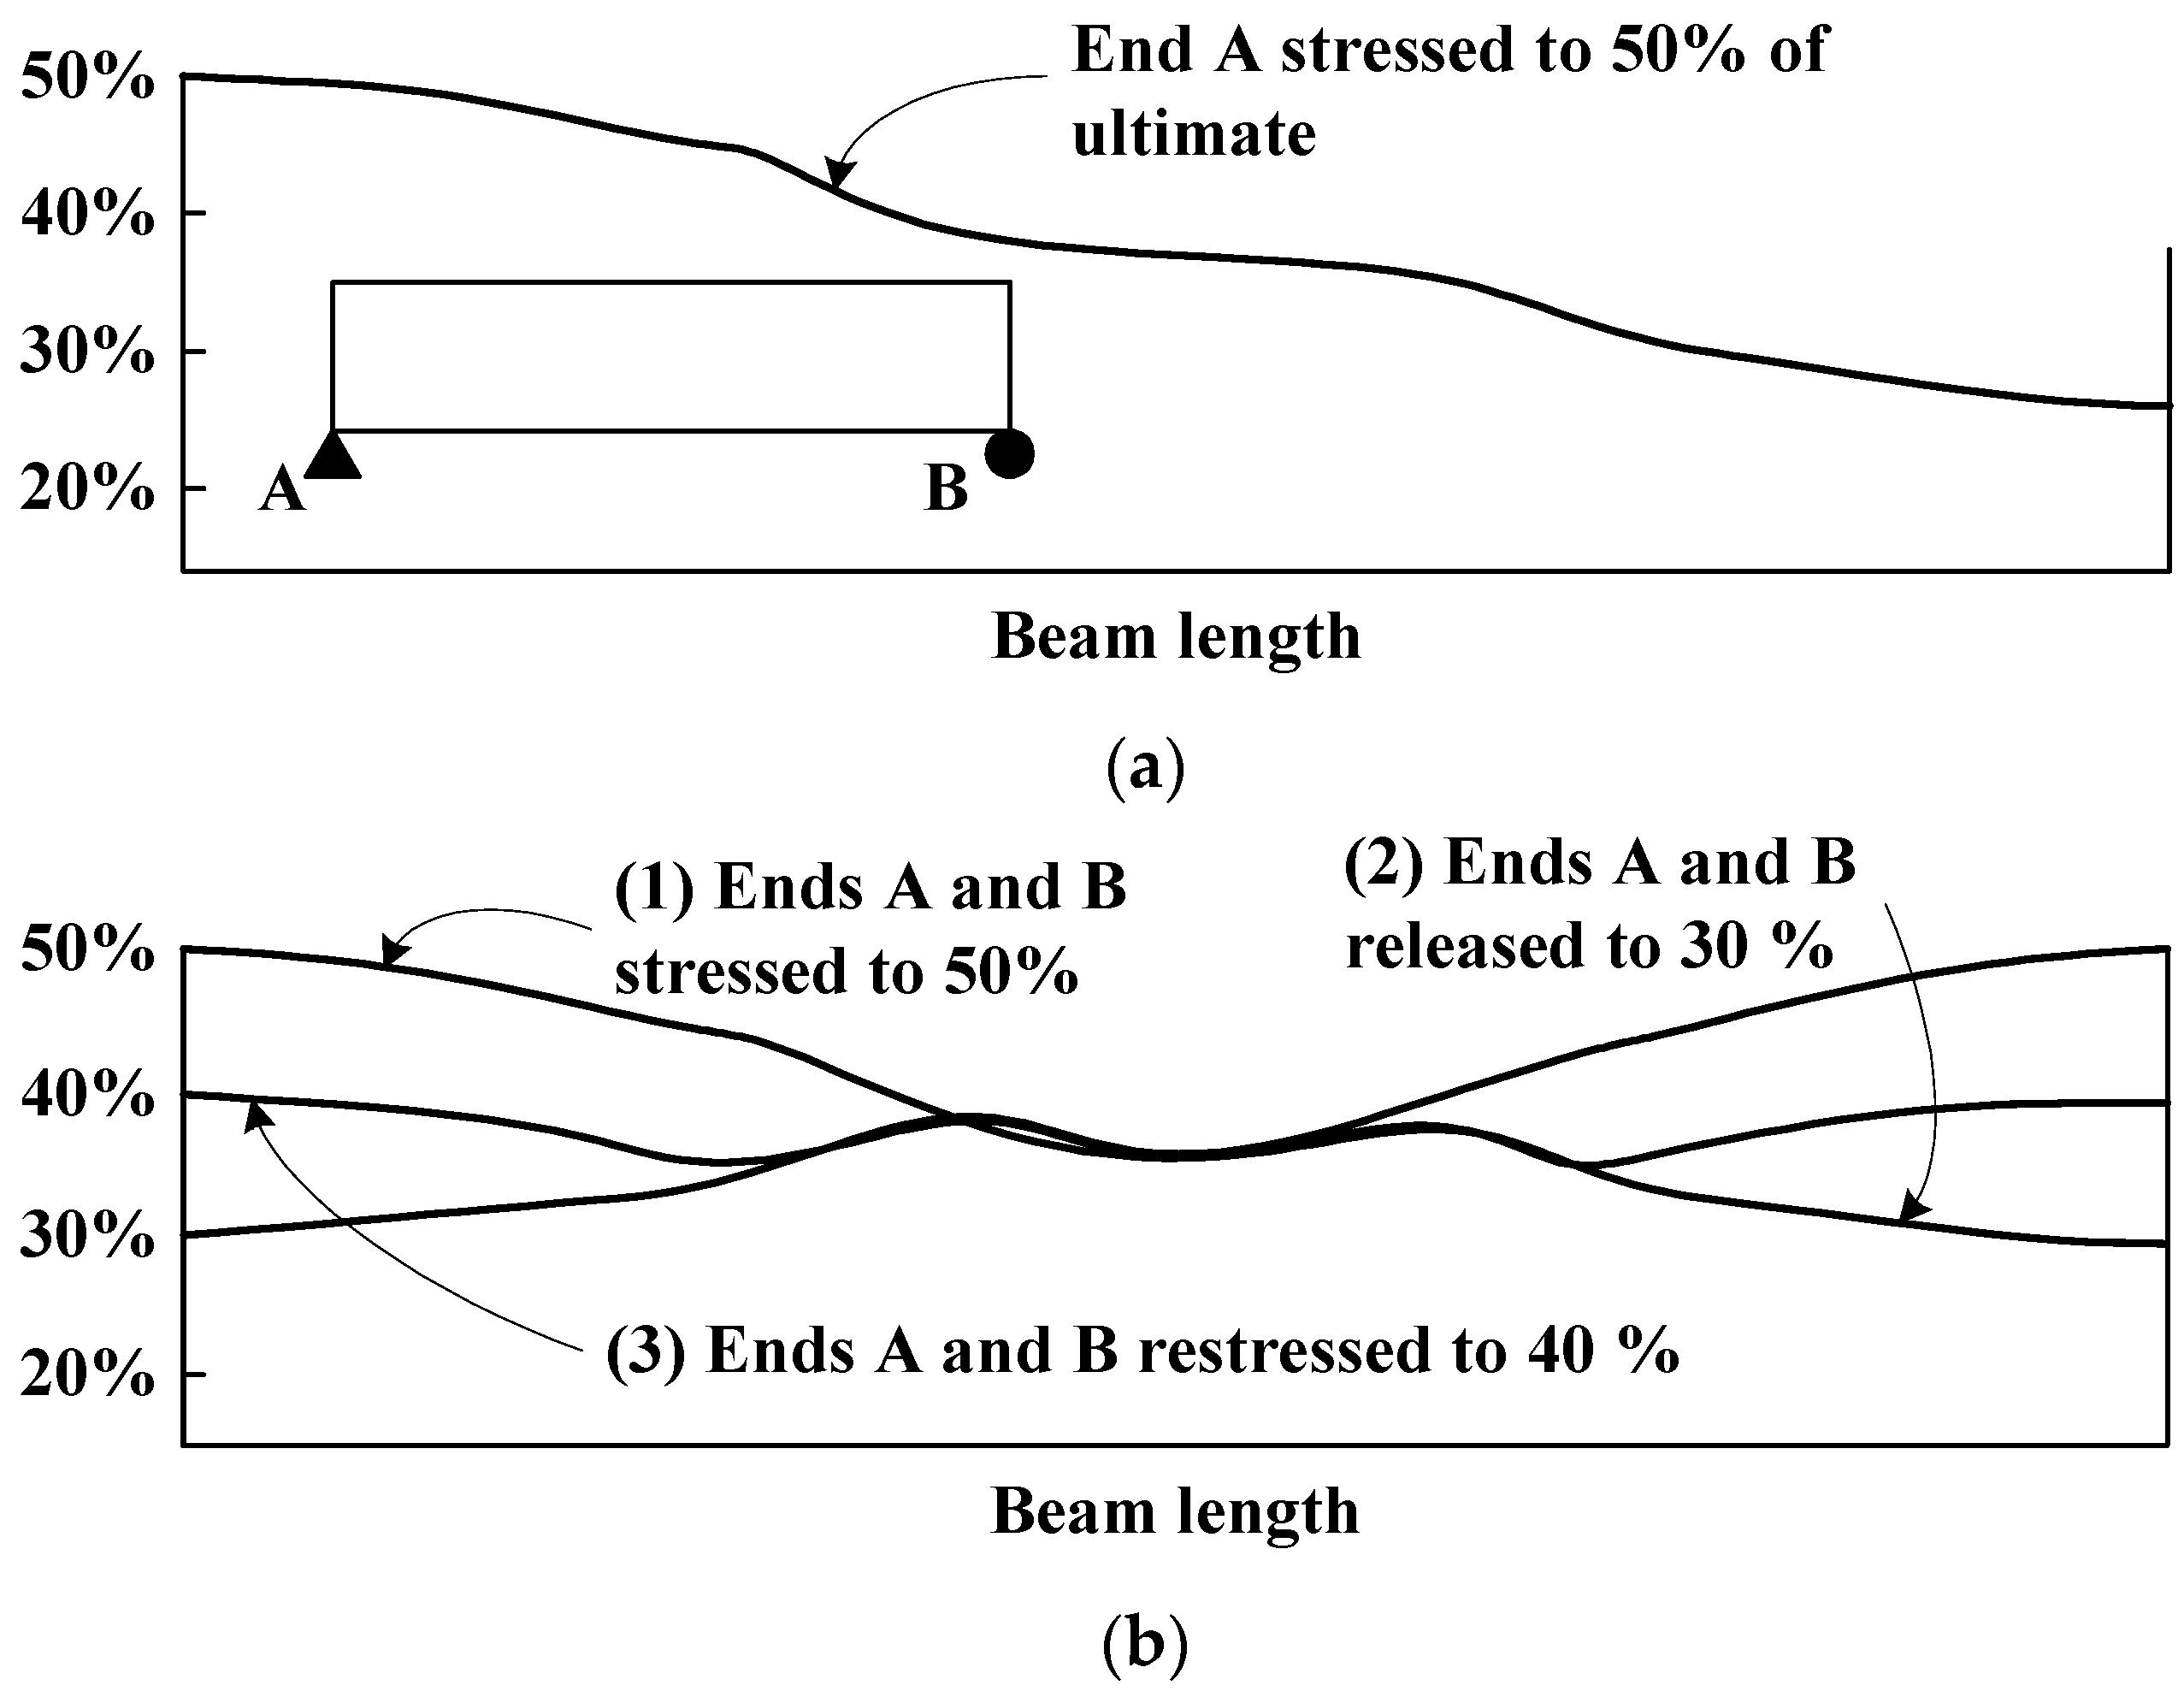
Figure 2 shows that the friction loss affects the prestress force of a tendon along the length of the beam. Figure 2a clearly indicates that the prestress force changes when the tendon is tensioned to 50% of its tensile strength at the left end A of the beam. A considerable friction loss occurs along the length of the beam when a tendon with an appropriate length is prestressed at only one end. Figure 2b shows the change in the prestress force when the tendon is tensioned to 50% of the tendon’s tensile strength at both ends A and B of the beam. The friction loss decreases considerably when the tendon is prestressed at both ends of the beam. However, few studies have been conducted on friction losses. In particular, there are almost no reports of experiments on the effects of prestress levels and the methods for determining the friction losses. Therefore, a study on the friction losses is required to calculate the initial prestress force accurately, which is crucial for the design and analysis of PSC structures.
3. Experimental Program
3.1. Test Variables
The experimental program focused on the friction loss in steel tendons pre-mounted in a sheath. The prestress force and friction loss were measured using two full-scale girders and then compared with the values obtained using Equation (3) and taken from the Korea Society of Civil Engineering (KSCE) and Korea Concrete Institute (KCI) design codes [15,16]. One of the girders (GOE) was jacked at one end and the other (GBE) was jacked at both ends in order to evaluate the effects of the prestressing methods on the friction loss. Various prestress levels were considered to evaluate the effects of the prestress force on the friction loss. Table 1 outlines the experimental variables.
3.2. Specimen Configuration
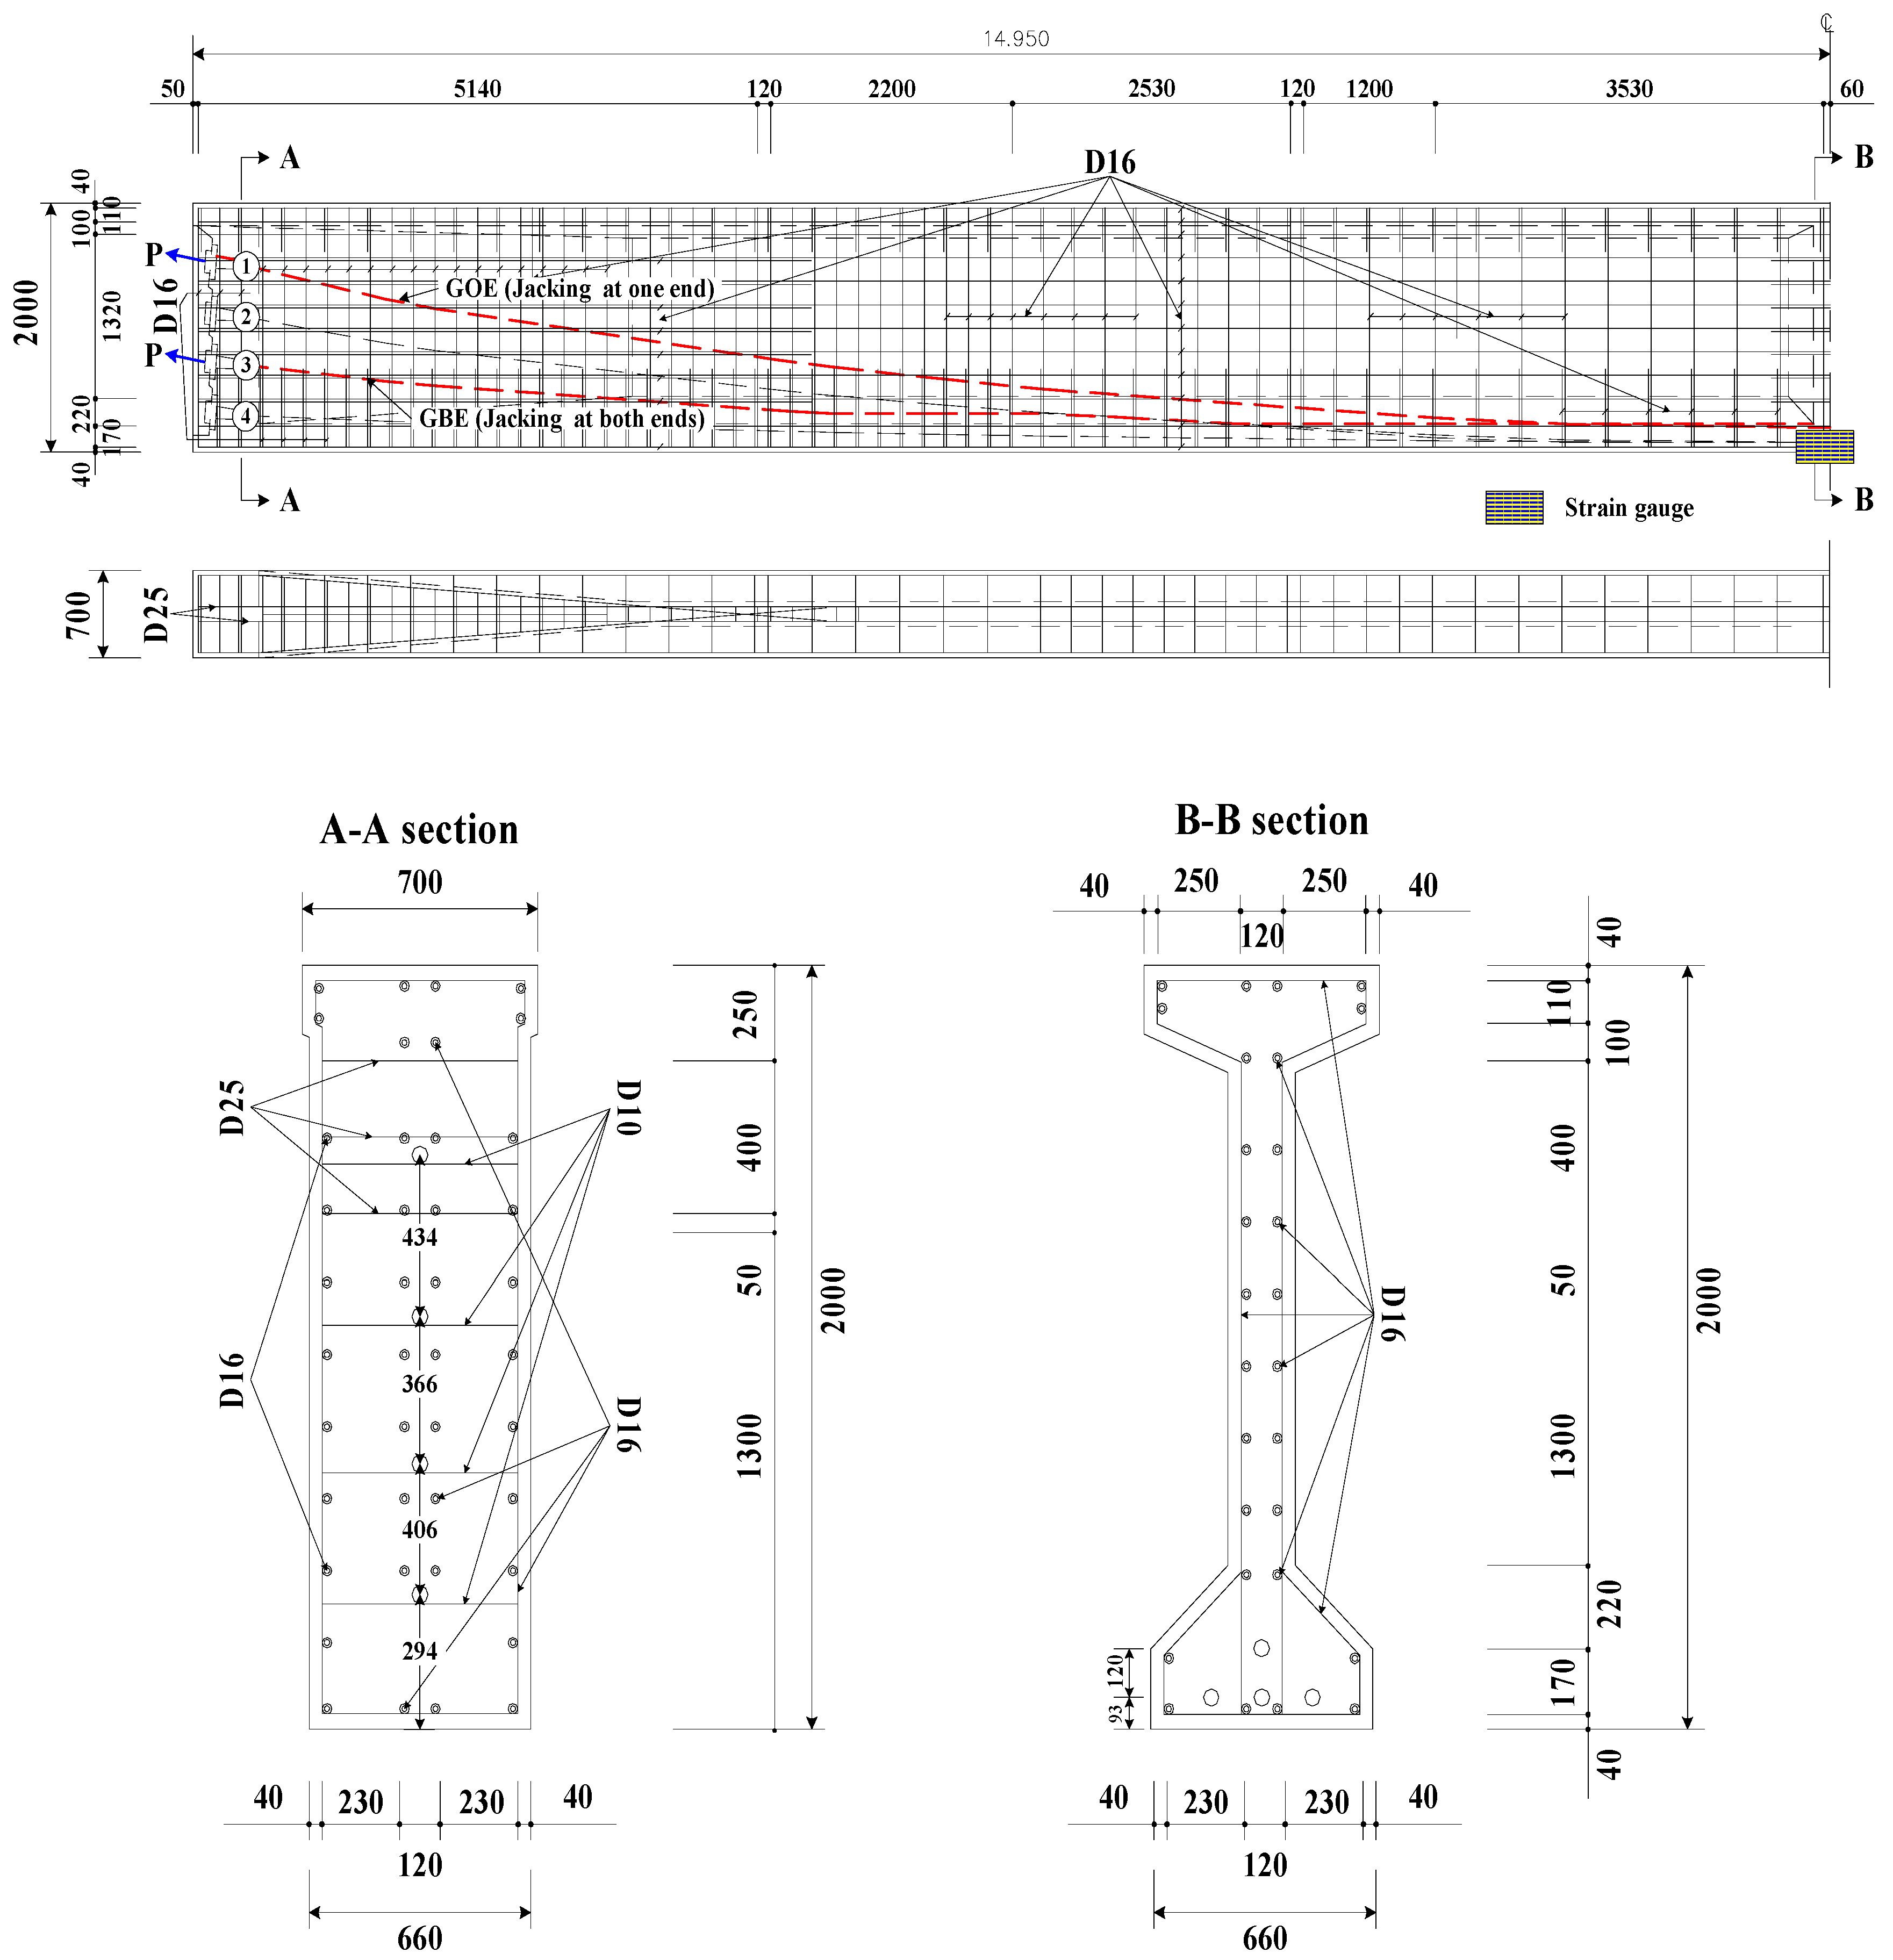
Two full-scale PSC girders were constructed to measure the friction losses. These girders had approximately identical spans, material properties, cross-sectional shapes, and reinforcement details. However, only tendon 1 was used in the GOE girder for jacking at one end, and only tendon 3 was used for jacking at both ends in the GBE girder. Table 2 outlines the main design conditions of the girders and the loading conditions. In this table, HS20 is a hypothetical truck applied to the design of bridges. This truck has a three-axle semitrailer combination, weighing 36 tons, with 4 tons on its steering axle, 16 tons on its drive axle, and 16 tons on the semitrailer axle. Table 3 outlines the profiles of the prestressing tendons. The girders have an I-shaped cross section, which is the most widely used shape for bridge construction. The section dimensions and reinforcements were determined according to the KSCE design code [15]. Figure 3 illustrates the cross-sections of the girder at the midspan and at the ends, the reinforcement, and the geometric shapes of the sheaths.
Concrete with a compressive strength of 40.0 MPa was used to fabricate the girder. Furthermore, a prefabricated Styrofoam box with dimensions of 20 cm × 20 cm × 60 cm was mounted to provide space for attaching strain gauges at the midspan bottom of the girders before concrete placement. The girders were steam-cured for 12 h after casting to minimize the shrinkage effect. Table 4 summarizes the material properties of the steel rebar, prestressing tendon, and sheath, which were provided by the manufacturer.
3.3. Prestressing
Figure 4 shows the systems used to prestress the steel tendons. In general, the load cells are installed between the hydraulic jack and anchorage to measure the prestress force at the jacking end. However, in this experiment, the prestress force was calculated from the strains, which were measured using strain gauges installed at the center of the tendon and at one end (jacking end). The reason is that it can be difficult to determine the prestress force accurately when using a load cell because of the unpredictable stresses in the cell itself.
Only one among the four tendons of each girder was tensioned twice to measure the friction losses accurately, and the tendons were not fixed after the stretching was complete. There was a 1-h difference between the first and second measurements. In the case of jacking at both ends, the prestressing devices had to be moved and set for jacking at the other end after the jacking at one end was completed, and this task required about 1 h to complete. In the case of jacking at one end, the prestressing devices did not need to be moved and set, but jacking was performed with 1-h intervals to maintain the same experimental conditions as those for jacking at both ends.
The KSCE design code [15] recommends that the smaller value between and be chosen for the maximum jacking stress of the prestressing tendon, where and denote the yield stress and ultimate stress of the prestressing tendon, respectively. There was a concern, however, that the tendon may be broken if the tension work was performed using one of these values, owing to various factors, such as fabrication error of the tendon or corrosion from exposure to the external environment. Therefore, to achieve stability in the jacking work, the maximum prestress level was determined based on the serviceability limit state in this experiment. The KSCE design code [15] recommends that the maximum jacking stress of the tendon at the serviceability limit state should not exceed (≈). Prestress forces corresponding to 13%, 18%, 24%, 29%, 34%, 39%, and 45% of the ultimate tensile strength of the prestressing tendon were applied to each of the two girders. These prestress forces ranged from 303.9 to 1033.3 kN. Strain gauges were installed on the surface of the tendons, embedded at the midspan bottom of the girder. All of the strain data were recorded using the data-logger EDX-1500A (Kyowa, Chofu, Japan).
4. Test Results and Discussion
4.1. Theoretical Friction Loss
Table 5 lists the friction coefficients recommended by KSCE and KCI design codes [15,16]. The KCI design code indicates that the curvature friction coefficient depends on the tendon type and sheath surface characteristics, and varies between 0.05 and 0.30 per meter. The wobble friction coefficient is a function of both the sheath strength and the curvature friction coefficient , and it varies between 0.0003 and 0.0066 per radian. Information on the prestressing system used is required to calculate the friction losses accurately because these friction coefficients may vary within the tolerance. In principle, the friction coefficients for the selected prestressing tendon must be obtained empirically. However, it is economically unreasonable and even not feasible to conduct experiments to acquire the friction coefficients of all the tendons used to design the PSC girders. Consequently, structural engineers determine the friction loss based on the friction coefficients presented in the design codes, and, typically, the simpler friction coefficients given in the KSCE design code are preferred to those in the KCI design code. Therefore, the theoretical friction loss was calculated using the curvature coefficient = 0.005 and wobble coefficient = 0.25 based on the recommendation of the KSCE design code, considering that seven-wire strands and a galvanized metal sheath were used for the PSC girders.
Table 3 lists the information about the longitudinal positions of the tendons in the girders depicted in Figure 3; the height of each tendon is presented according to the distance from midspan. Each tendon was assumed as parabolic in shape. The derived quadratic equations of each tendon and the corresponding first-order differential equations are outlined in Table 6.
Table 7 lists the variations in the angle with the distance of the tendon from midspan, based on the differential equations in Table 6.
Table 8 lists the theoretical friction losses of tendon 3 in the GBE girder and tendon 1 in the GOE girder at the midspan for the virtual prestress forces, based on the variation in angle as given in Table 7 and the friction loss coefficients ( = 0.005, = 0.25) in the KSCE design code [15]. The theoretical friction losses were calculated by Equation (3). The values in this table reveal that the theoretical friction losses have a linear relationship with the prestress forces, which is already well known. Furthermore, there was a difference in the friction losses between tendon 1 in the GOE girder and tendon 3 in the GBE girder because the tendons had different profiles.
4.2. Measured Prestress Force
The friction losses at the tendons from prestressing only one tendon in one girder were accurately measured in the experiment. The prestress forces were calculated at the girder end and midspan by using the strains of the prestressing tendon recorded from the strain gauges attached to one end and the center of the prestressing tendon, respectively. The difference between these prestress forces was the friction loss. Table 9 lists the prestress forces and friction losses measured in each experimental girder. The theoretical prestress forces and friction losses in this table were calculated by using Equations (3) and (4). The experimental results indicate that considerable friction losses occur when steel tendons are used to prestress PSC girders. The difference between the measured and theoretical losses was smaller when the prestress level was higher and both ends were jacked, compared to the difference obtained when only one end was jacked.
4.3. Comparison of Theoretical and Measured Prestress Forces
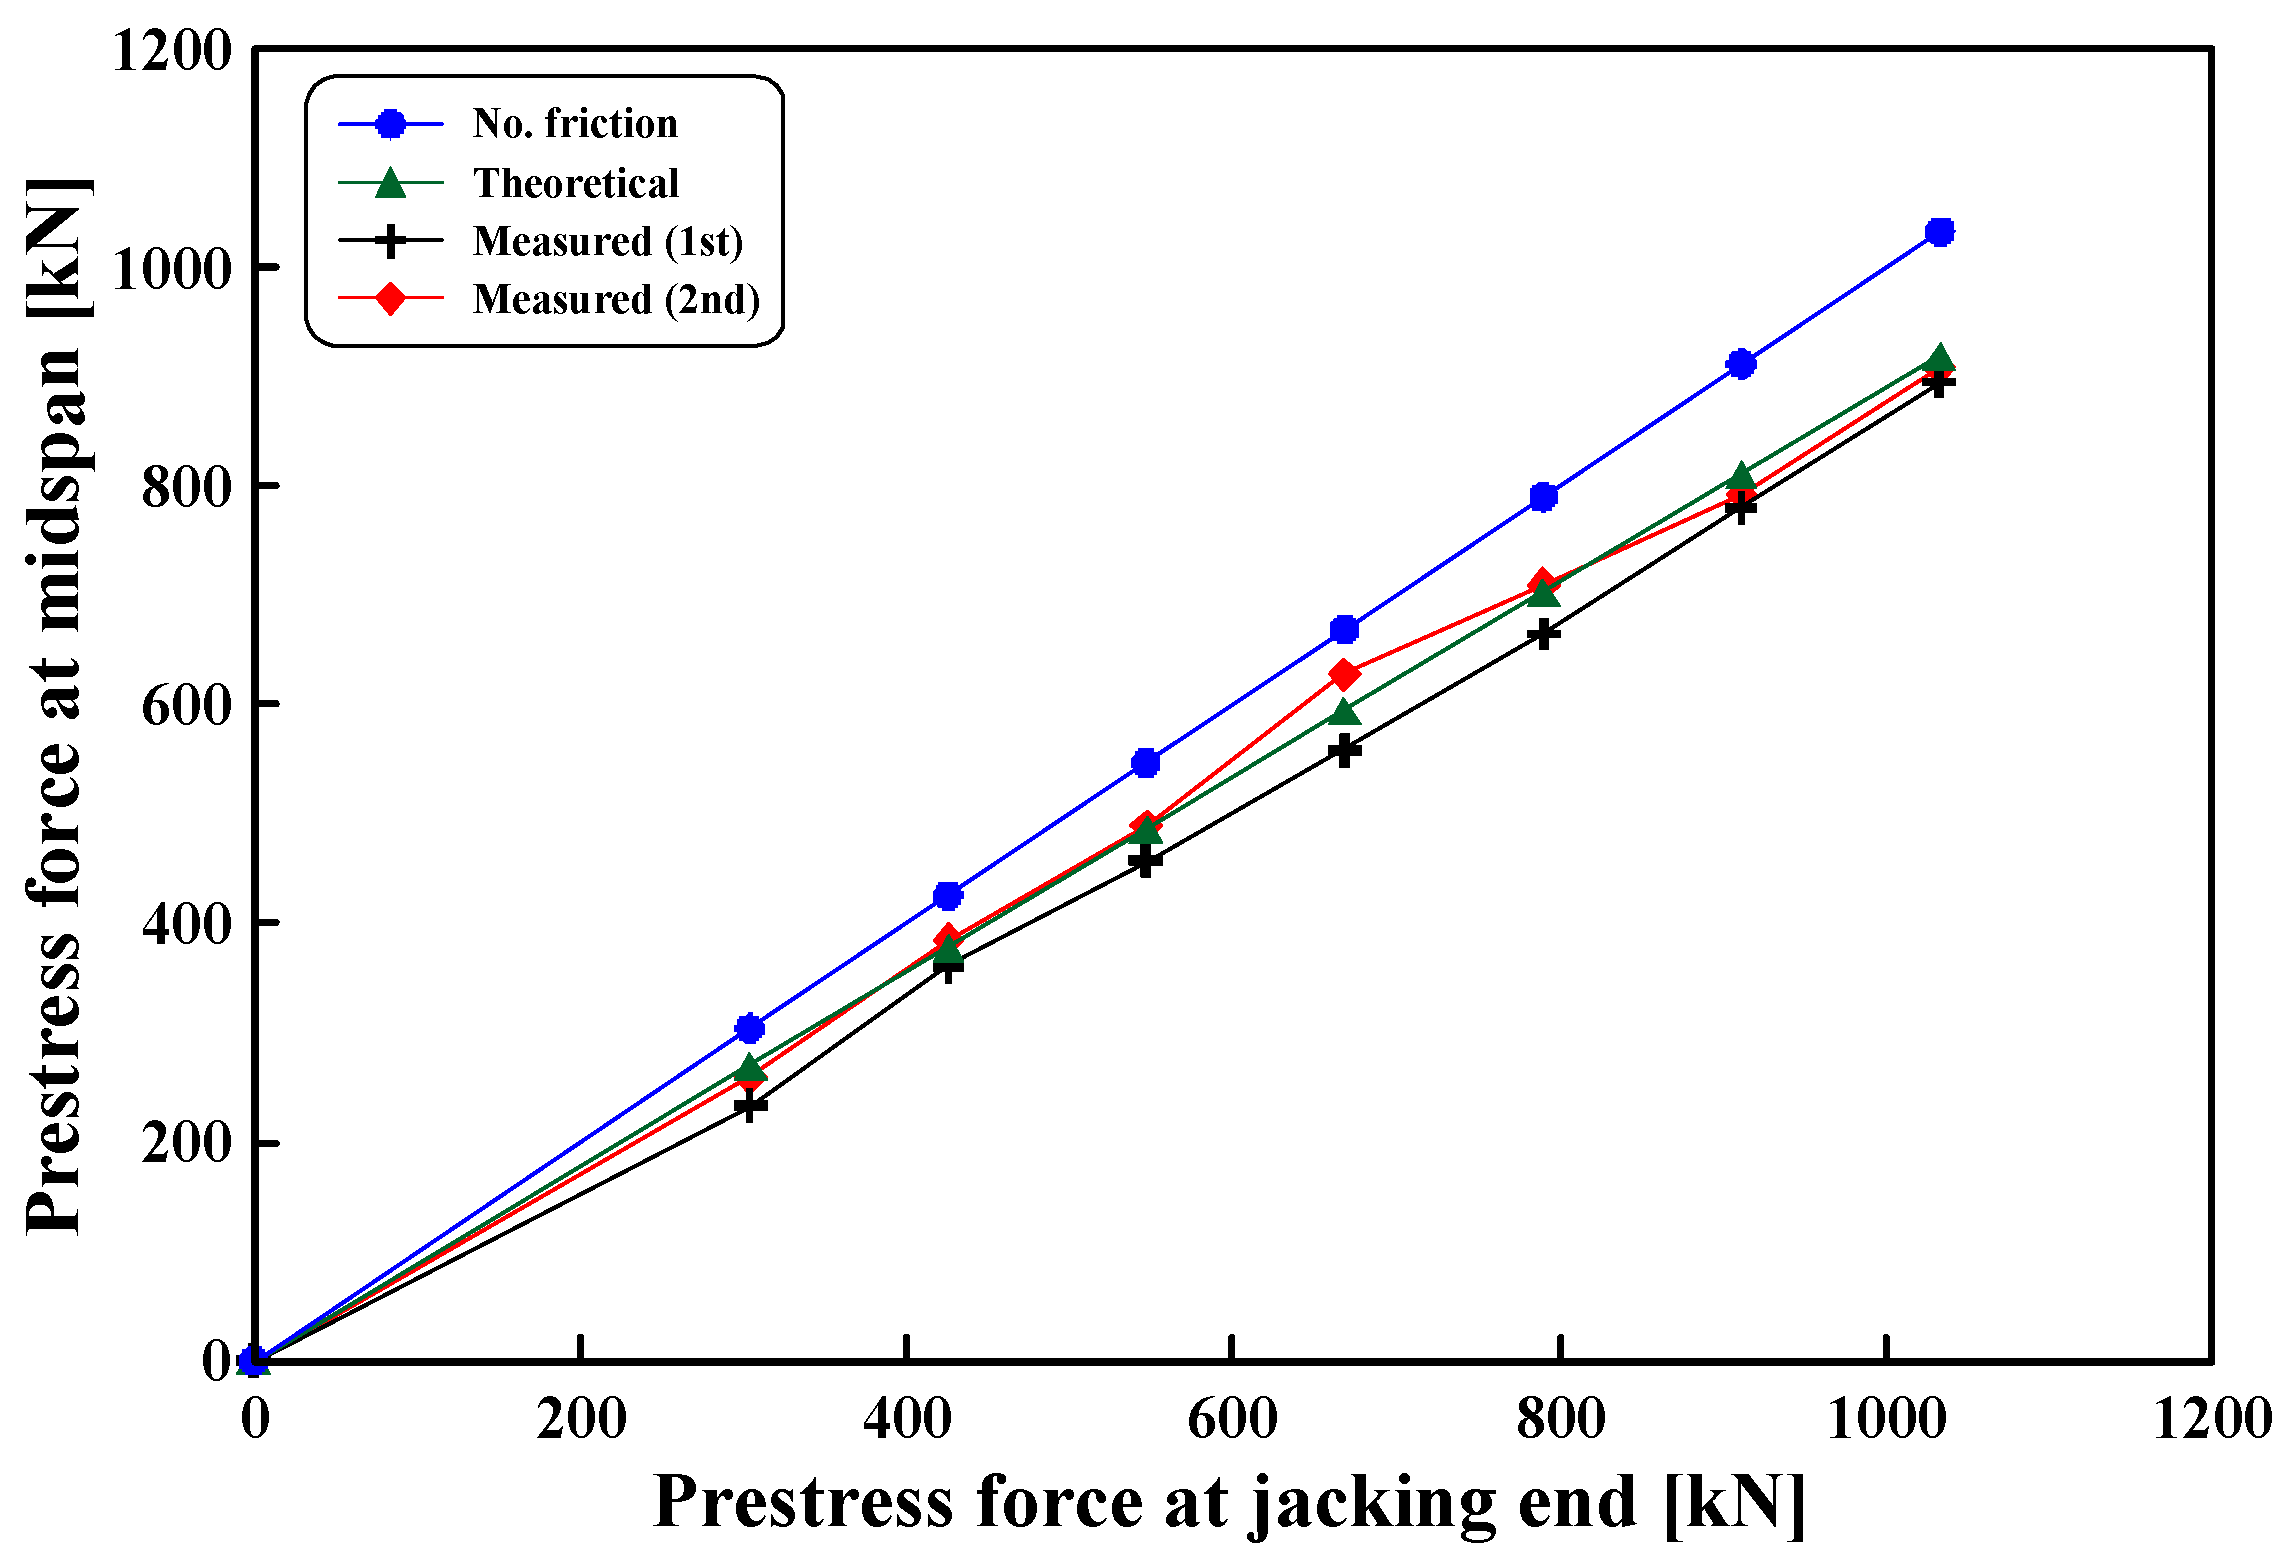
Figure 5 and Figure 6 compare the prestress forces at the jacking end and midspan when there was no friction loss, when only the theoretical friction loss was considered, and when two measured friction losses were considered. The first and second prestress forces for tendon 3 in the GBE girder jacked at both ends measured at the midspan were 83.7% and 89.2% of the prestress forces measured at the jacking ends on average, and the theoretical prestress forces corresponded to 88.9% of the actually introduced prestress force on average.
The first and second prestress forces measured for tendon 1in the GOE girder jacked at one end at the midspan were 79.5% and 82.8% of the prestress forces measured at the jacking end on average, and the theoretical prestress force was identical to that obtained when both ends were jacked. In the same girder, the second measured prestress force was greater than the first one, and greater prestress forces were observed with tension applied at both ends compared with that obtained when tension was applied only at one end. This phenomenon occurred because the friction between the sheath and the prestressing tendon was changed by the prestressing order and method. In other words, the contact surface between the sheath and the tendon was very rough in the first prestressing, but in the second prestressing, the contact surface became smooth due to the first prestressing. The changed contact surface generated smaller friction in the second prestressing than in the first prestressing. Furthermore, greater prestress forces were observed in the case of jacking at both ends than when jacking at only one end. This occurs because prestressing at both ends of the beam results in more and smoother contact surfaces between the sheath and prestressing tendons, compared to the situation when prestressing at only one end.
4.4. Normalized Friction Loss
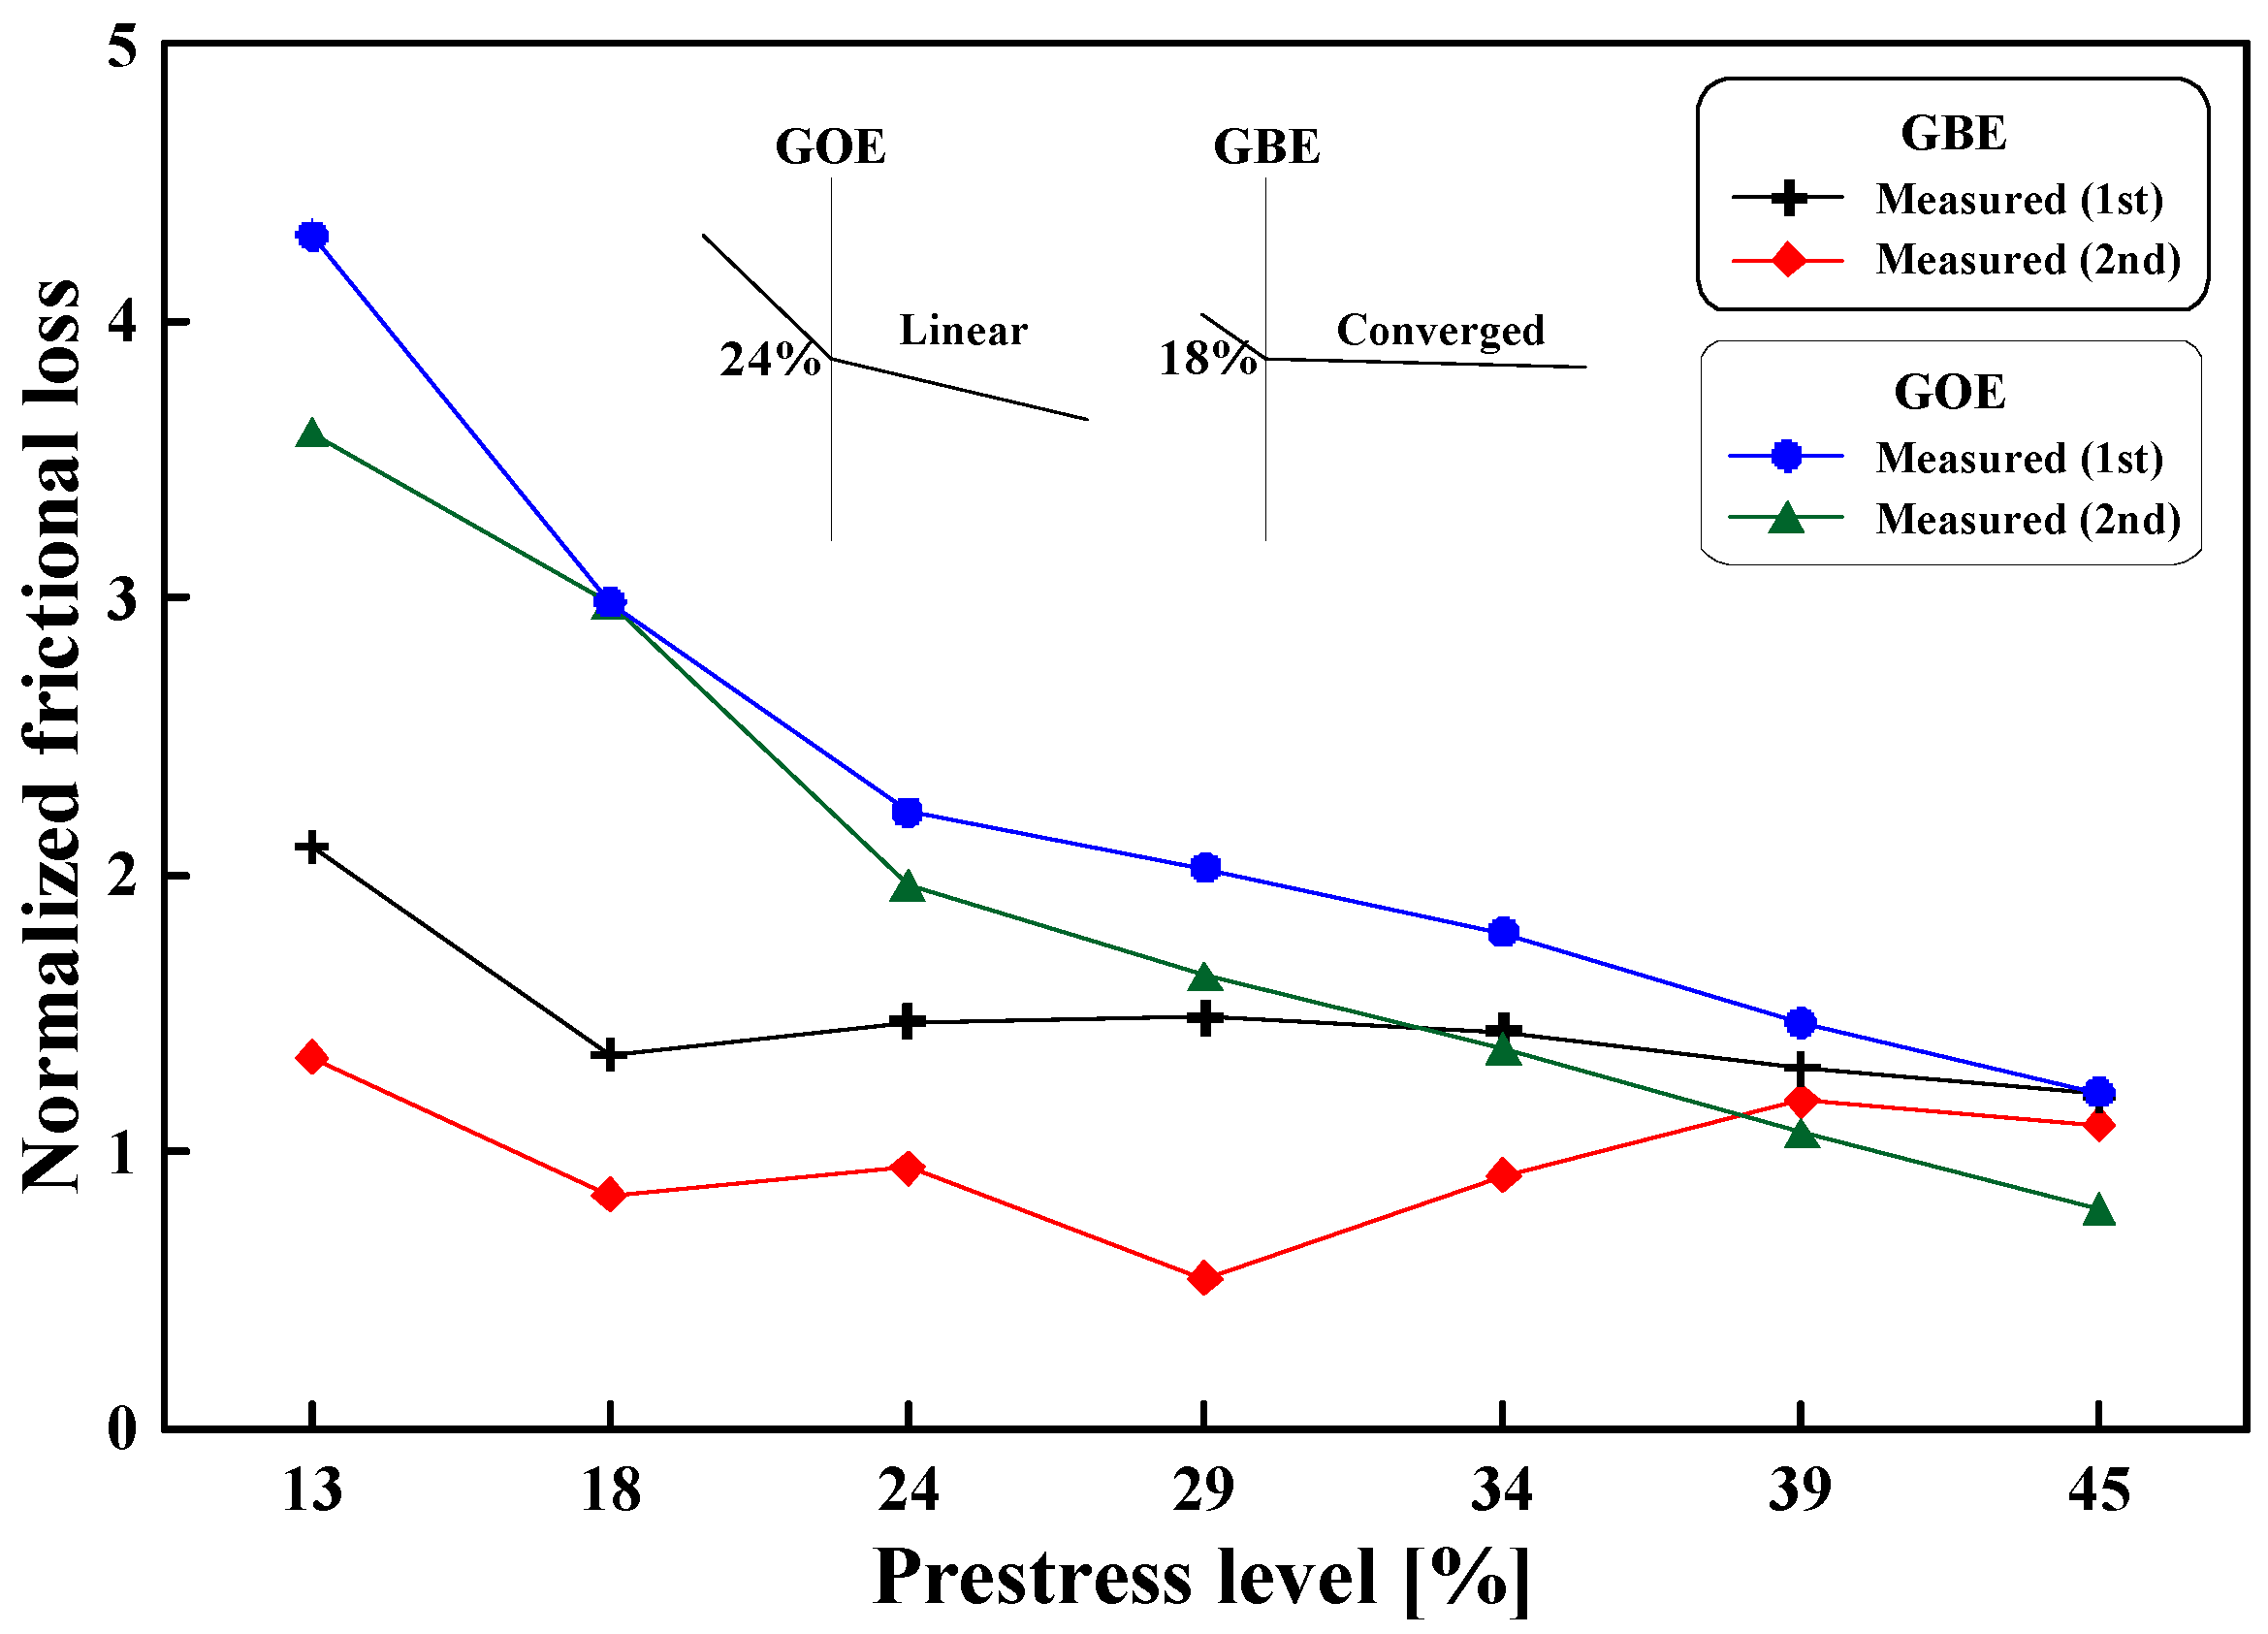
Figure 7 shows the measured friction losses normalized by those calculated using the model of Equation (4). The friction losses in the prestressing tendon continuously decreased as the prestress level was increased. Furthermore, the difference between the measured and theoretical friction losses tended to decrease from a certain prestress level regardless of the profile of the prestressing tendon. These prestress levels were 24% and 18% for tendon 3 in the GBE girder and tendon 1 in the GOE girder, respectively. However, the decrease in the prestress levels in tendon 3 was proportional to the decrease in the normalized friction losses when the prestress level was 24% or higher. The normalized friction losses in tendon 1 converged to one value, regardless of the prestress level, when the prestress was 18% or higher. These results were probably greatly influenced by the profiles of the prestressing tendon. Tendon 1 had a greater curvature compared with tendon 3. This greater curvature probably caused and maintained greater friction effects (curvature and wobble) between the prestressing tendon and sheath. On the other hand, the prestressing tendons in the GBE girder were arranged almost linearly, which resulted in very small friction effects. These friction effects probably disappear if a prestress force above a certain level is applied to the tendon.
As shown in Figure 7 and Table 9, the lower the prestress level was, the greater the friction loss became, regardless of the prestressing method. At the time of jacking, the contact surface between the tendons is very rough. The lower the prestress level is, the less smooth this contact surface becomes and vice versa. Therefore, a greater friction loss must have occurred at a lower prestress level because the contact surface was less smooth.
In PSC structures, the friction caused by the interaction between a tendon and a sheath during tension has a crucial effect on the prestress force and the elongation of the tendon. In particular, the underestimation or overestimation of the friction coefficient can cause unexpected structural behavior in relation to the camber, deflection, and stress distribution. Structural engineers obtain the friction coefficient from friction loss models specified in various design standards to evaluate the friction between a prestressing tendon and a sheath. Therefore, the accuracy of a friction loss model leads to an accurate decrease of prestress force caused by friction loss. A successful design requires accurate prediction of the prestress loss by friction. In this study, the friction losses were predicted using the theoretical model in Equation (4), and the predicted values were compared with the experiment results. The most important finding in this study is that the friction loss model provided a theoretical value that is very close to the experimental value at a high prestress level, but the theoretical values showed greater errors compared to the experimental values at the lower prestress levels. Therefore, the designer should take special care when applying a low prestress level to PSC structures.
5. Conclusions
The initial prestress force has a dominant effect on the member force of a PSC girder, and the friction loss between the prestressing tendon and sheath tube strongly affects this prestress force. In this study, friction loss experiments were conducted using full-scale 30-m long PSC girders. Some of the findings derived from the experimental results are as follows:
- (1)
- The prestress force measured at midspan corresponded to 86.4% and 81.1% of the prestress force at the jacking end with both ends jacked and one end jacked, respectively.
- (2)
- The friction losses in the prestressing tendon continuously decreased as the prestress level increased. The measured friction loss was much greater than the theoretical friction loss at low prestress levels, but it approached the theoretical friction loss at high prestress levels.
- (3)
- Jacking at both ends is recommended for the prestressing method because it generates a much lower friction loss compared with the loss obtained with jacking at only one end.
- (4)
- In the design codes, the friction loss is evaluated solely by the curvature friction coefficient and wobble friction coefficient, with no regard to the prestressing method and prestress level. However, the experimental results in this study showed that the prestressing method and prestress level strongly affect the friction losses. Therefore, further studies are required to confirm this observation.
Acknowledgments
This research was supported by the Basic Science Research Program through the National Research Foundation of Korea (NRF) and funded by the Ministry of Education (2016R1A6A3A11931804).
Conflicts of Interest
The authors declare no conflict of interest.
References
- Nawy, E.G. Prestressed Concrete: A Fundamental Approach, 5th ed.; Prentice-Hall: Upper Saddle River, NJ, USA, 2009. [Google Scholar]
- Shin, H.M. Prestressed Concrete, 10th ed.; Dongmyeong Publishers: Paju, Korea, 2008. [Google Scholar]
- Collins, M.P.; Mitchell, D. Prestressed Concrete Structures; Prentice-Hall: Upper Saddle River, NJ, USA, 1991. [Google Scholar]
- Moon, J.K.; Lee, J.-H. A study on the determination of prestressing force considering frictional loss in PS concrete structures. Korea Soc. Civ. Eng. 1997, 17, 89–99. [Google Scholar]
- Huang, T. Anchorage take-up loss in post-tensioned members. PCI J. 1969, 14, 30–35. [Google Scholar] [CrossRef]
- Cole, H. Direct solution for elastic prestress loss in pretensioned concrete girders. Pract. Period. Struct. Des. Constr. 2000, 5, 27–31. [Google Scholar] [CrossRef]
- Naaman, A.E.; Hamza, A.M. Prestress losses in partially prestressed high strength concrete beams. PCI J. 1993, 38, 98–113. [Google Scholar] [CrossRef]
- Rao, K.B.; Anoop, M.B.; Sreeshylam, P.; Sridhar, S.; Kesavan, K.; Ravisankar, K. Assessment of pre-stress losses in instrumented pre-stressed concrete beams using stochastic analysis. Strain 2011, 47, 175–188. [Google Scholar]
- Caro, L.A.; Martí-Vargas, J.R.; Serna, P. Prestress losses evaluation in prestressed concrete prismatic specimens. Eng. Struct. 2013, 48, 704–715. [Google Scholar] [CrossRef]
- Tran, T.T. Reducing Friction Loss for Post-Tensioned Tendons in Monolithic Girders. Master’s Thesis, The University of Texas at Austin, Austin, TX, USA, 1992. [Google Scholar]
- Davis, R.T. Friction Losses in Segmental Bridge Tendon. Master’s Thesis, The University of Texas at Austin, Austin, TX, USA, 1993. [Google Scholar]
- Kittleman, W.M.; Davis, R.T.; Hamilton, H.R.; Frank, K.H.; Breen, J.E. Evaluation of Agents for Lubrication and Temporary Corrosion Protection of Post-Tension Tendons; Technical Report; Centre for Transportation Research at The University of Texas at Austin: Austin, TX, USA, 1993. [Google Scholar]
- Lüthi, T.; Diephuis, J.; Icaza, J.J.; Breen, J.E.; Kreger, M.E. Factors Affecting Bond and Friction Losses in Multi-Strand Post-Tensioning Tendons Including the Effect of Emulsifiable Oil; Technical Report; Centre for Transportation Research at The University of Texas at Austin: Austin, TX, USA, 2005. [Google Scholar]
- American Association of State Highway and Transportation Officials (AASHTO). Standard Specification for Highway Bridges, 17th ed.; American Association of State Highway and Transportation Officials: Washington, DC, USA, 2002. [Google Scholar]
- Korea Society of Civil Engineering (KSCE). The Korea Highway Standard Specification; Korea Society of Civil Engineering: Seoul, Korea, 2012. [Google Scholar]
- Korea Concrete Institute (KCI). Structural Concrete Design Code; Korea Concrete Institute: Seoul, Korea, 2012. [Google Scholar]
Figure 1.
Curvature and wobble friction losses.
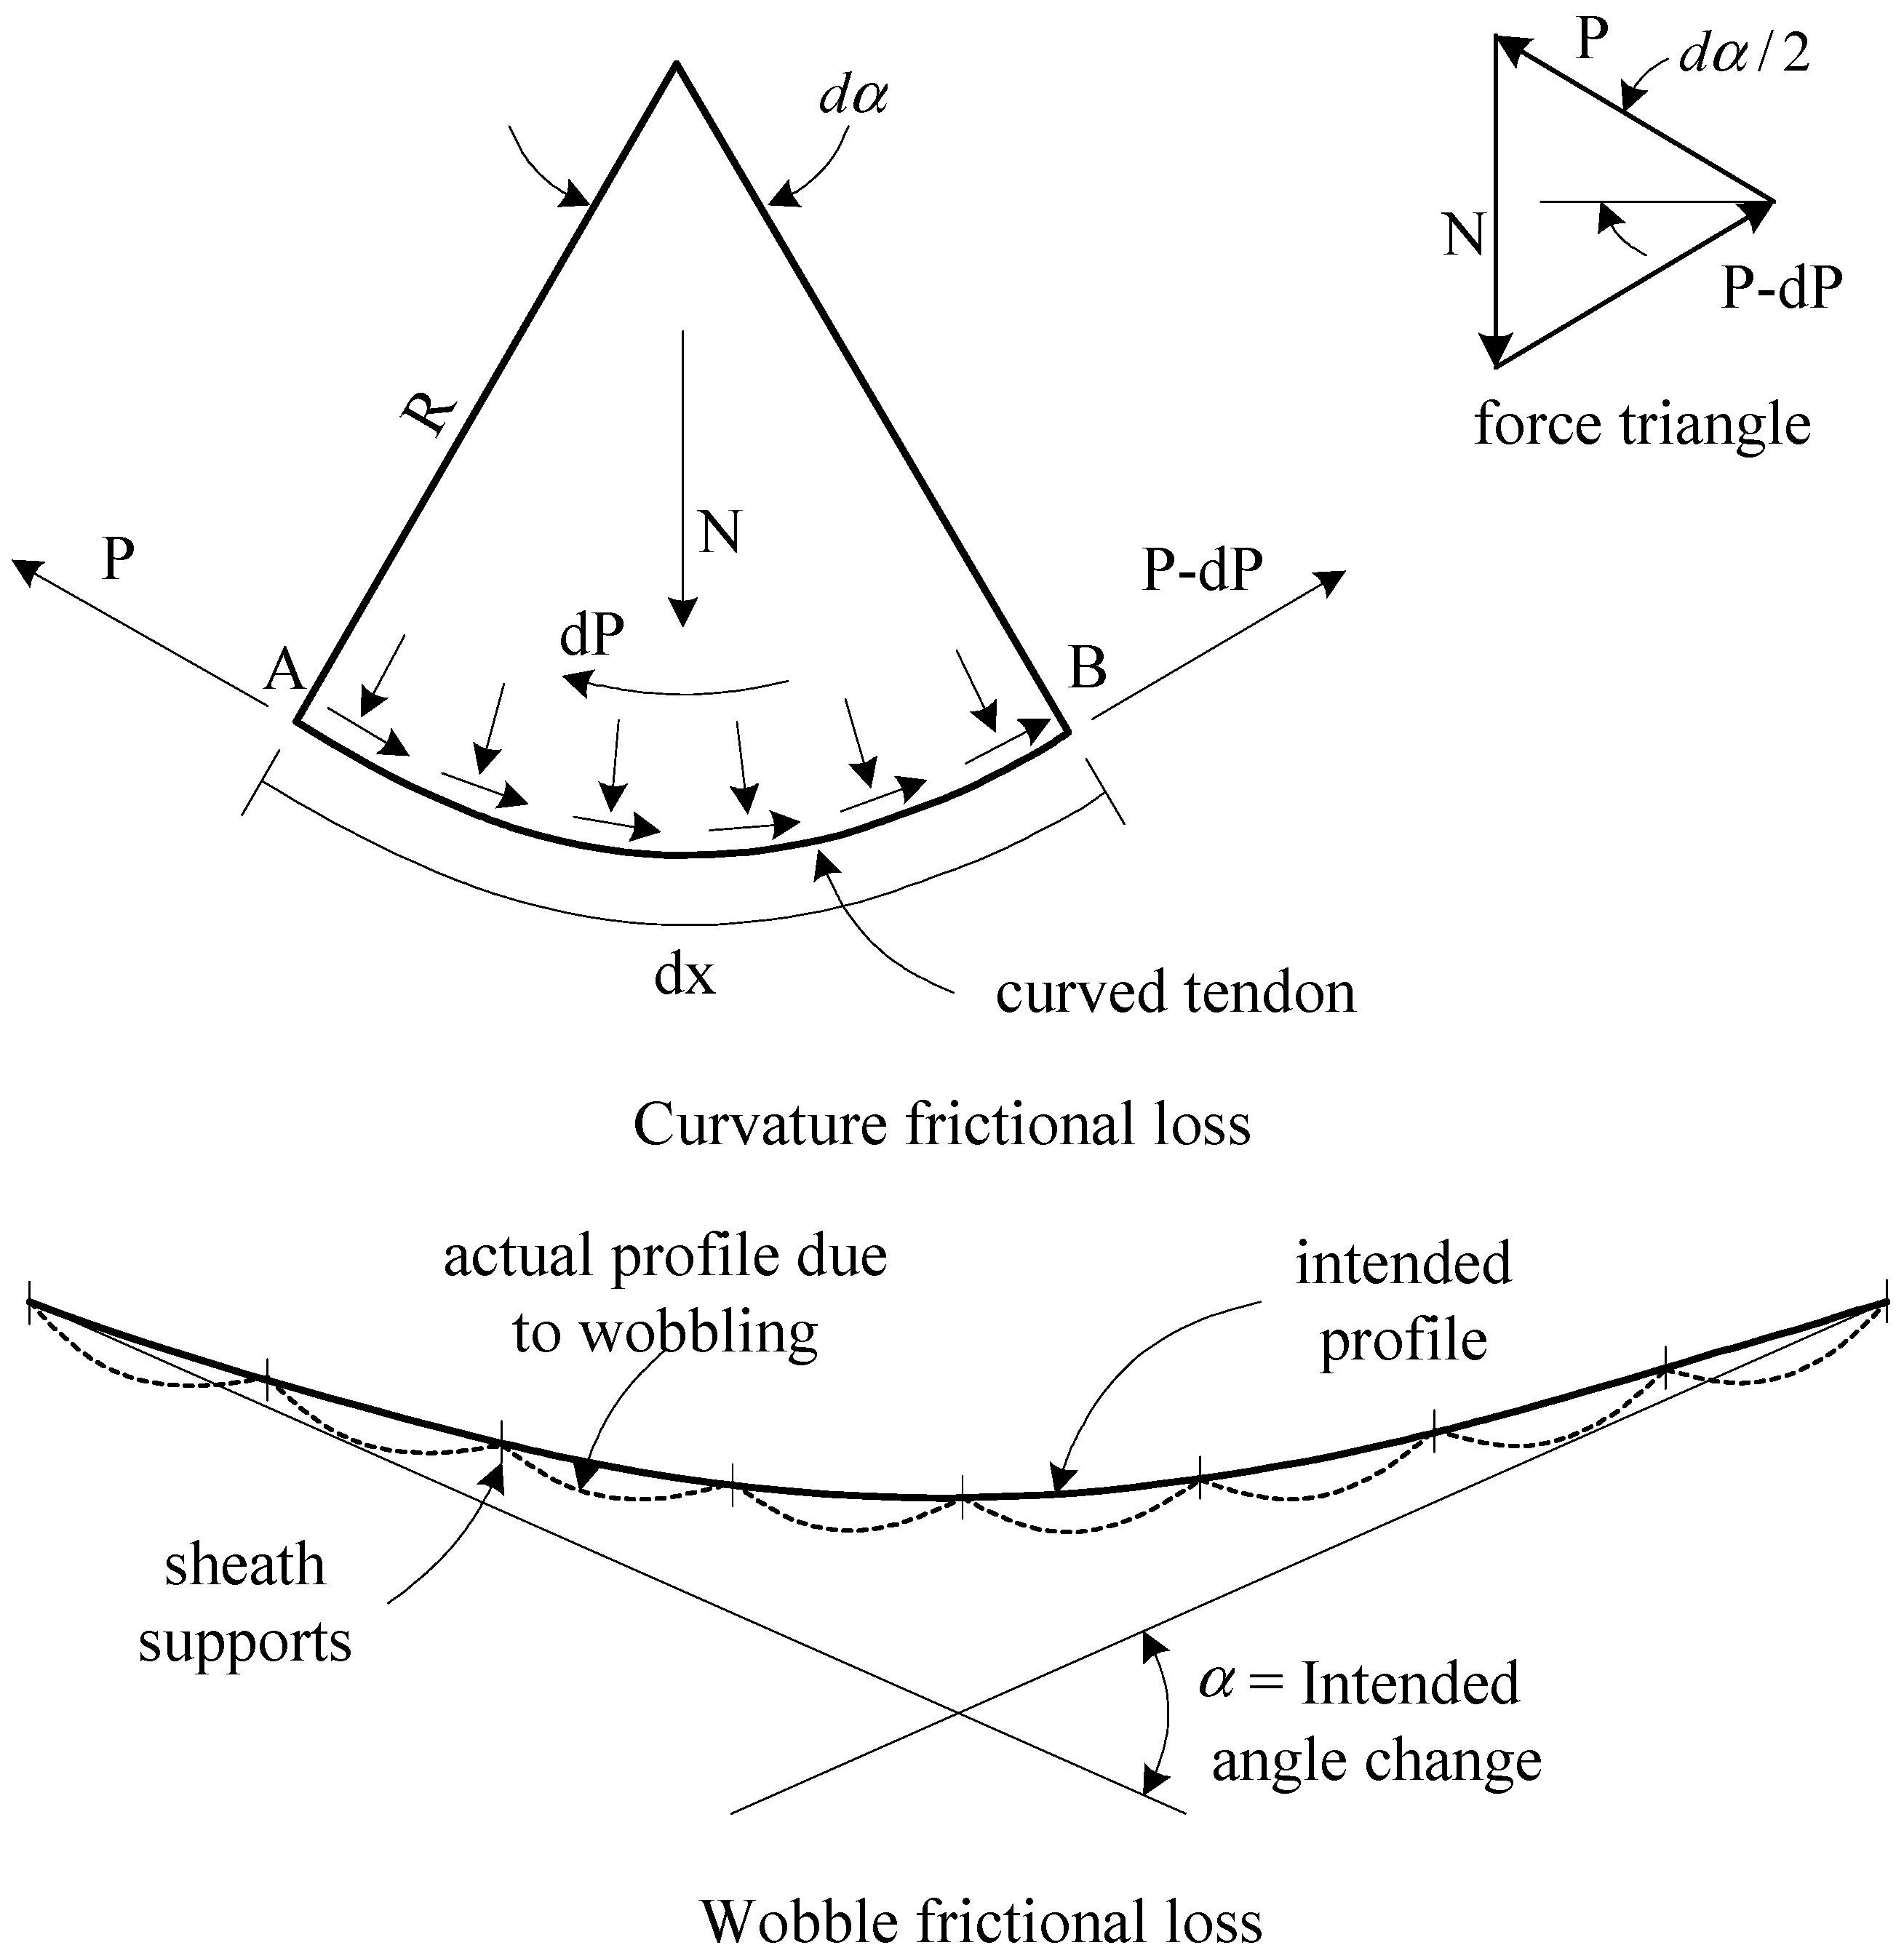
Figure 2.
Tendon force variation owing to friction losses (a) tendon prestressed from end A only; (b) tendon prestressed from both ends.
Figure 2.
Tendon force variation owing to friction losses (a) tendon prestressed from end A only; (b) tendon prestressed from both ends.

Figure 3.
Details of full-scale prestressed concrete (PSC) girder.

Figure 4.
Prestressing systems (a) prestressing jack; (b) anchorage; (c) hydraulic pump.
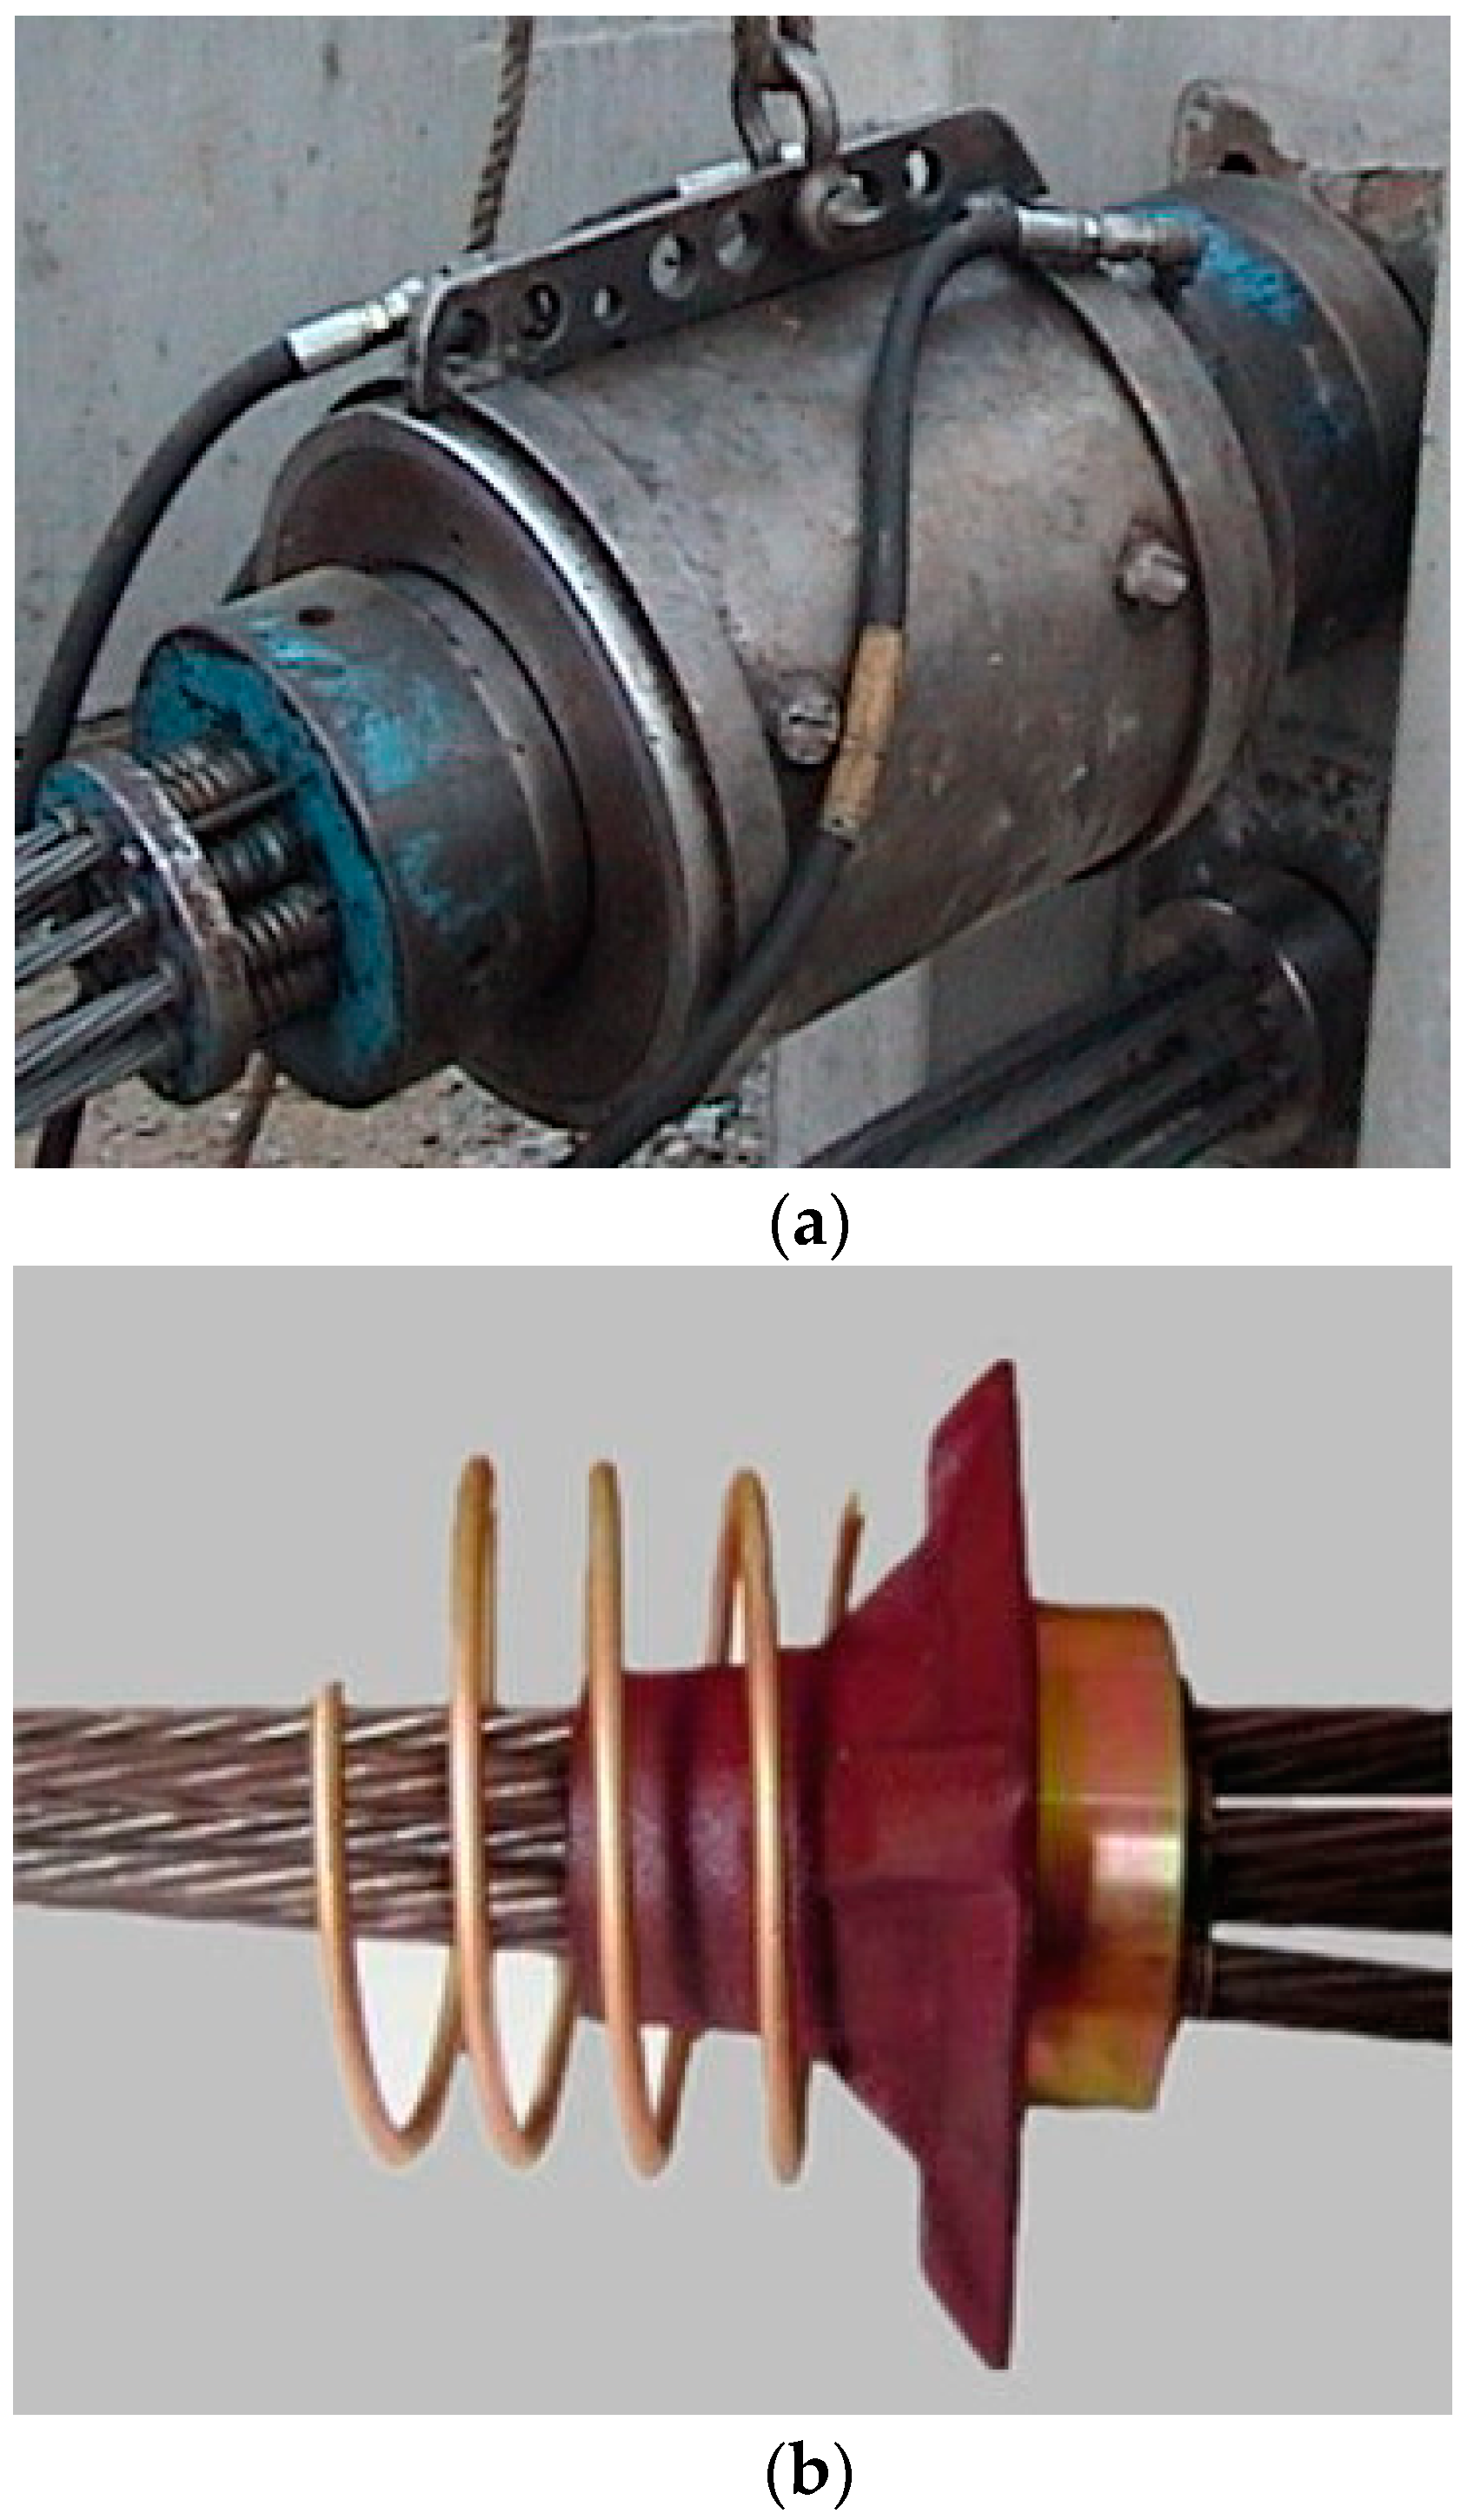
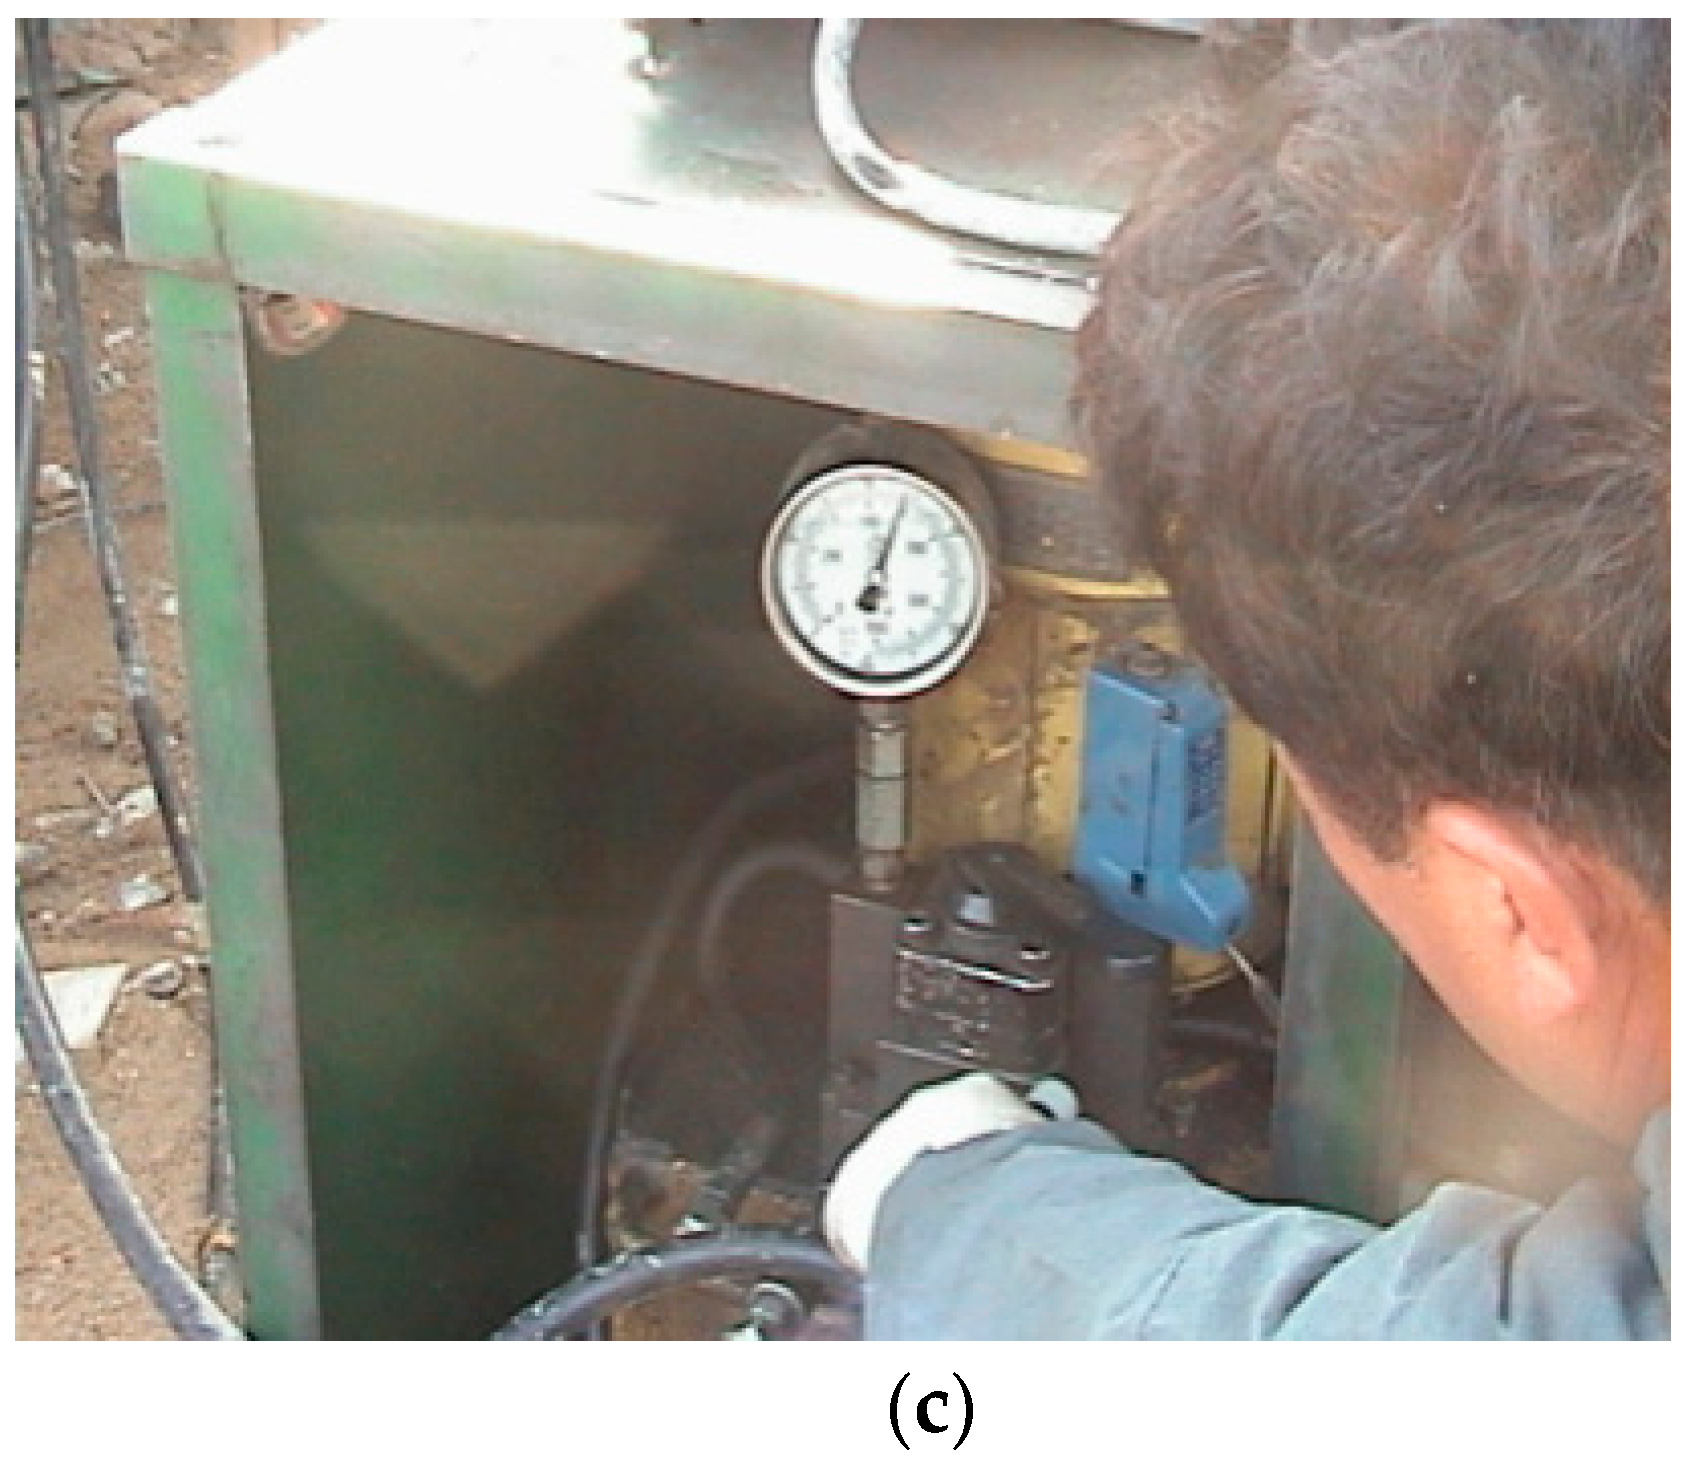
Figure 5.
Prestress forces between jacking end and midspan: GBE.

Figure 6.
Prestress forces between jacking end and midspan: GOE.
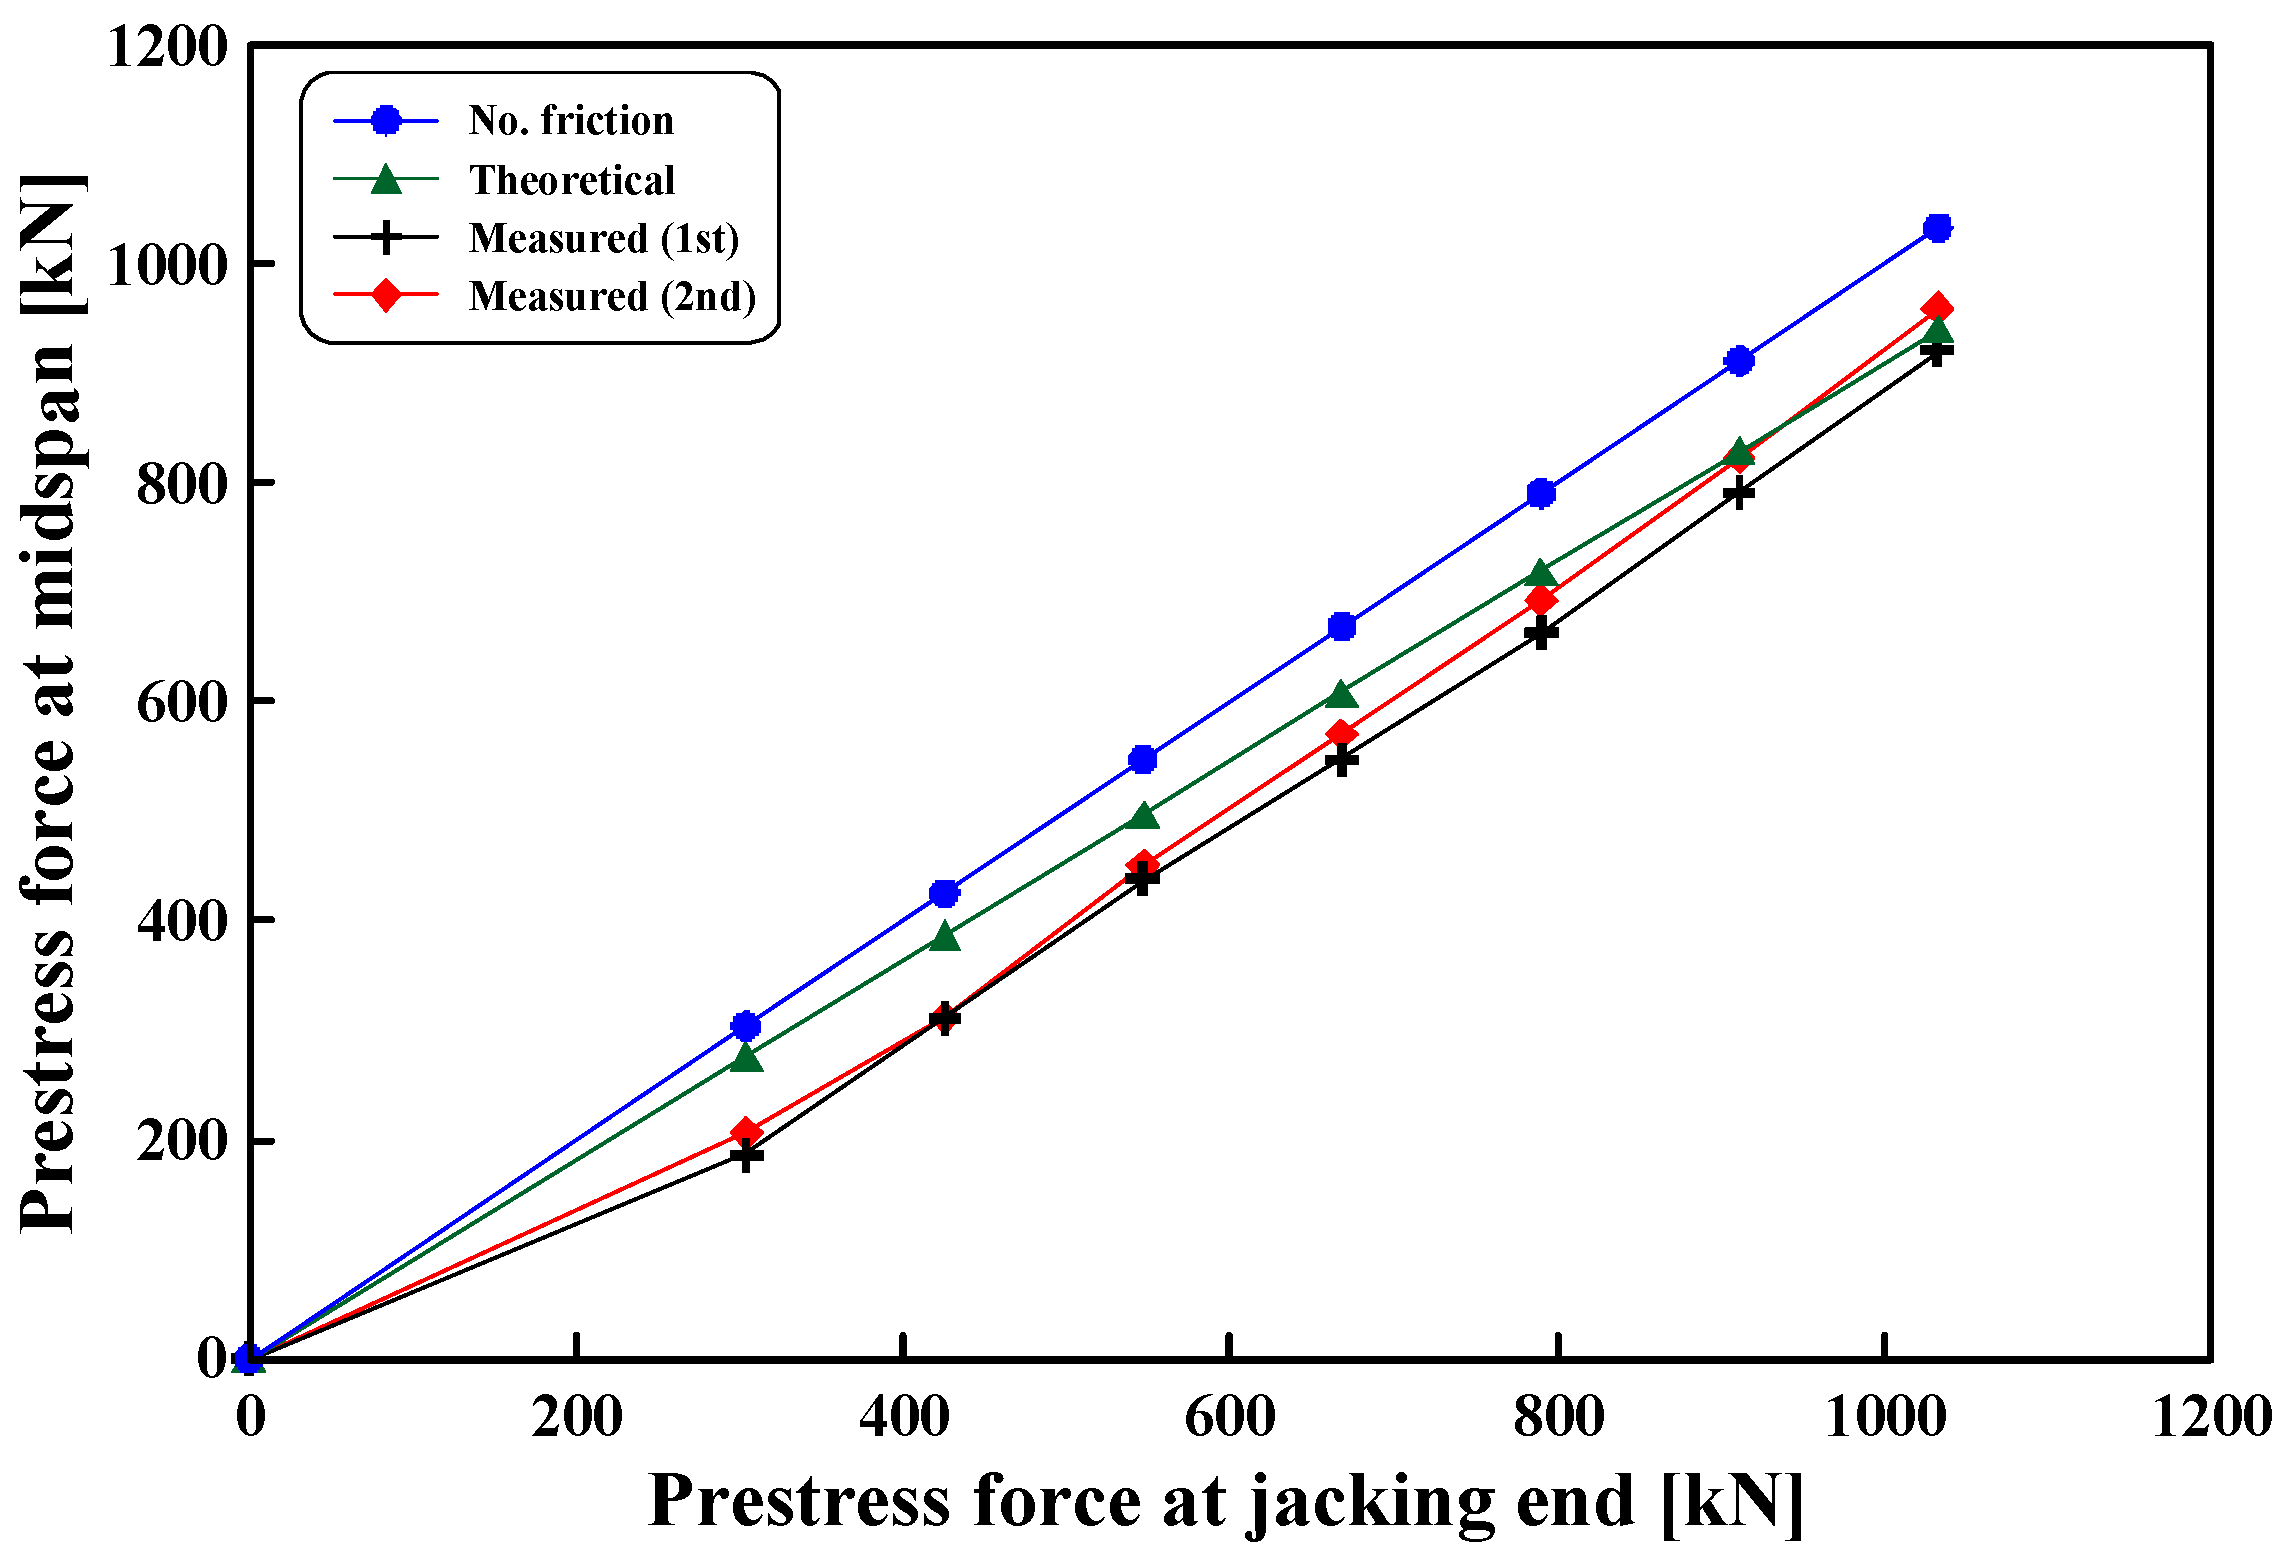
Figure 7.
Effect of prestress levels on normalized friction losses.

Table 1.
Variables of tested girders.
| Specimens | Support Type | Span Length | Jacking Method | Jacking Prestress | Prestress Level | Remarks |
|---|---|---|---|---|---|---|
| (m) | (kN) | (%) | ||||
| Girder jacked at one end (GOE) | Simple | 30 | One end | 0.0 | 0 | Ultimate tensile strength of prestressing tendon = 2314 kN |
| 303.9 | 13 | |||||
| 425.5 | 18 | |||||
| 547.0 | 24 | |||||
| 668.6 | 29 | |||||
| 790.1 | 34 | |||||
| 911.7 | 39 | |||||
| 1033.3 | 45 | |||||
| Girder jacked at both ends (GBE) | Both ends | 0.0 | 0 | |||
| 303.9 | 13 | |||||
| 425.5 | 18 | |||||
| 547.0 | 24 | |||||
| 668.6 | 29 | |||||
| 790.1 | 34 | |||||
| 911.7 | 39 | |||||
| 1033.3 | 45 |
Table 2.
Design conditions for tested girders.
| Design Compressive Strength of Concrete | Strand Diameter | LiveLoad | Allowable Stress for Concrete | |||
|---|---|---|---|---|---|---|
| Initial Load Stage | Service Load Stage | |||||
| (MPa) | (mm) | Compression | Tension | Compression | Tension | |
| 40 | 12.7 (0.5 in) low relaxation | HS20 | ||||
Table 3.
Tendon profiles.
| Distance from Midspan | Height According to Tendon Number | |||
|---|---|---|---|---|
| 1 | 2 | 3 | 4 | |
| (cm) | (cm) | (cm) | (cm) | (cm) |
| 0.00 | 21.3 | 9.3 | 9.3 | 9.3 |
| 300 | 26.6 | 13.4 | 11.6 | 10.1 |
| 600 | 42.5 | 25.6 | 19.3 | 12.6 |
| 900 | 68.9 | 46.0 | 31.6 | 16.7 |
| 1200 | 105.9 | 74.6 | 49.2 | 22.5 |
| 1480 | 150.0 | 106.6 | 70.0 | 29.4 |
Table 4.
Properties of reinforcing steel, prestressing tendon, and sheath.
| Prestressing Strand | ||||||||||
| Duct | No. | Type | Diameter | Yield Strength | Ultimate Strength | |||||
| (mm) | (MPa) | (MPa) | ||||||||
| 1 | 10 | Seven-wire strand | 12.7 | 1659 | 1828 | |||||
| 3 | 10 | |||||||||
| Steel rebar | ||||||||||
| Type | Diameter | Yield strength | Tensile strength | Modulus of elasticity | Elongation | |||||
| (mm) | (MPa) | (MPa) | (MPa) | (%) | ||||||
| D-10 | 9.53 | 475 | 766 | 2.01 × 10⁵ | 14.4 | |||||
| D-16 | 15.9 | 466 | 679 | 2.11 × 10⁵ | 17.2 | |||||
| D-25 | 25.4 | 471 | 723 | 2.06 × 10⁵ | 15.8 | |||||
| Sheath | ||||||||||
| Diameter | Thread | Profile height | Profile width | Wall thickness |  | |||||
| Inside: d1 | Outside: d2 | e | a | b | s | |||||
| (mm) | (mm) | (mm) | (mm) | (mm) | (mm) | |||||
| 65 | 72 | 20 | 3.5 | 12.5 | 0.3 | |||||
| Weight | Bending behavior | Relative volume of profile | Bending radius | |||||||
| (kg/m) | (N) | (cm3/cm3) | (m) | |||||||
| 0.59 | 222 | 0.12 | 0.75 | |||||||
Table 5.
Wobble () and curvature friction () coefficients: Korea Society of Civil Engineering (KSCE); Korea Concrete Institute (KCI).
Table 5.
Wobble () and curvature friction () coefficients: Korea Society of Civil Engineering (KSCE); Korea Concrete Institute (KCI).
| KCI Design Code | KSCE Design Code | |||||||
|---|---|---|---|---|---|---|---|---|
| Type of Tendon | Coefficient | Type of Tendon | Type of Duct | Coefficient | ||||
| Wobble | Curvature | Wobble | Curvature | |||||
| (k/m) | (μ/rad) | (k/m) | (μ/rad) | |||||
| Bonded tendons in metal duct | Wire tendons | 0.0033–0.0050 | 0.15–0.25 | Wire or strand | Metal sheath | 0.0066 | 0.30 | |
| 7-wire strand | 0.0003–0.0020 | 0.08–0.30 | ||||||
| Galvanized metal sheath | 0.0050 | 0.25 | ||||||
| High-strength bars | 0.0015–0.0066 | 0.15–0.25 | ||||||
| Galvanized rigid duct | 0.0007 | 0.25 | ||||||
| Unbonded tendons in metal duct | Mastic-coated | Wire tendons | 0.0033–0.0066 | 0.05–0.15 | ||||
| 7-wire strand | 0.0033–0.0066 | 0.05–0.15 | High strength bars | Metal duct | 0.0010 | 0.20 | ||
| Pregreased | Wire tendons | 0.0010–0.0066 | 0.05–0.15 | |||||
| Galvanized metal sheath | 0.0007 | 0.15 | ||||||
| 7-wire strand | 0.0010–0.0066 | 0.05–0.15 | ||||||
Table 6.
Quadratic equations of each tendon and corresponding first-order differential equations.
| Tendon Number | Quadratic Equation | Differential Equation | Remark |
|---|---|---|---|
| 1 | : height from bottom of PSC girder to tendon. : height from bottom of PSC girder to tendon. : distance from midspan | ||
| 2 | |||
| 3 | |||
| 4 |
Table 7.
Variation in angle with distance of tendons.
| Tendon Number | Distance from Midspan (m) | ||||||
|---|---|---|---|---|---|---|---|
| 14.8 | 12.0 | 9.0 | 6.0 | 3.0 | |||
| 1 | Degree | 957′53′′ | 804′51′′ | 603′35′′ | 402′22′′ | 201′12′′ | 957′53′′ |
| Radian | 0.1739 | 0.1410 | 0.1057 | 0.0705 | 0.03525 | 0.1739 | |
| 2 | Degree | 741′18′′ | 614′02′′ | 440′31′′ | 307′01′′ | 133′30′′ | 741′18′′ |
| Radian | 0.1341 | 0.1088 | 0.0816 | 0.0544 | 0.0272 | 0.1341 | |
| 3 | Degree | 435′55′′ | 343′43′′ | 247′47′′ | 151′51′′ | 055′56′′ | 435′55′′ |
| Radian | 0.0802 | 0.0650 | 0.0488 | 0.0325 | 0.0167 | 0.0802 | |
| 4 | Degree | 133′23′′ | 115′43′′ | 056′47′′ | 037′51′′ | 018′56′′ | 133′23′′ |
| Radian | 0.0272 | 0.022 | 0.0165 | 0.011 | 0.005 | 0.0272 | |
Table 8.
Initial prestress force and friction loss.
| Tendon 1 in GOE | Tendon 3 in GBE | ||||
|---|---|---|---|---|---|
| Prestress Force | Frictional Loss | Prestress Force | Frictional Loss | ||
| Live End | Midspan | Live End | Midspan | ||
| (kN) | (kN) | (kN) | (kN) | (kN) | (kN) |
| 100 | 88.9 | 11.1 | 100 | 91 | 9 |
| 200 | 177.8 | 22.2 | 200 | 182 | 18 |
| 300 | 266.7 | 33.3 | 300 | 273.1 | 26.9 |
| 400 | 355.7 | 44.3 | 400 | 364.1 | 35.9 |
| 500 | 444.6 | 55.4 | 500 | 455.1 | 44.9 |
| 600 | 533.5 | 66.5 | 600 | 546.1 | 53.9 |
| 700 | 622.4 | 77.6 | 700 | 637.2 | 62.8 |
| 800 | 711.3 | 88.7 | 800 | 728.2 | 71.8 |
| 900 | 800.2 | 99.8 | 900 | 819.2 | 80.8 |
| 1000 | 889.2 | 110.8 | 1000 | 910.2 | 89.8 |
Table 9.
Test results of GBE and GOE.
| Prestress Forceat Live End | Prestress Level | GBE (kN) | |||||
| Prestress Force | Friction Loss | ||||||
| Midspan | |||||||
| Theoretical | Measured | Theoretical | Measured | ||||
| (kN) | (%) | 1st | 2nd | 1st | 2nd | ||
| 303.9 | 13 | 270.3 | 233.3 | 258.9 | 33.6 | 70.6 | 45.0 |
| 425.5 | 18 | 378.4 | 362.0 | 385.8 | 47.1 | 63.5 | 39.7 |
| 547.0 | 24 | 486.5 | 458.1 | 490.2 | 60.5 | 88.9 | 56.8 |
| 668.6 | 29 | 594.6 | 558.9 | 628.3 | 74.0 | 109.7 | 40.3 |
| 790.1 | 34 | 702.7 | 664.7 | 710.4 | 87.4 | 125.4 | 79.7 |
| 911.7 | 39 | 810.8 | 780.5 | 792.5 | 100.9 | 131.2 | 119.2 |
| 1033.3 | 45 | 918.9 | 895.3 | 908.0 | 114.3 | 138.0 | 125.3 |
| Prestress Forceat Live End | Prestress Level | GOE (kN) | |||||
| Prestress Force | Friction Loss | ||||||
| Midspan | |||||||
| Theoretical | Measured | Theoretical | Measured | ||||
| (kN) | (%) | 1st | 2nd | 1st | 2nd | ||
| 303.9 | 13 | 276.6 | 186.5 | 205.8 | 27.3 | 117.4 | 98.1 |
| 425.5 | 18 | 387.3 | 311.6 | 311.7 | 38.2 | 113.8 | 113.8 |
| 547.0 | 24 | 497.9 | 437.8 | 450.8 | 49.1 | 109.2 | 96.2 |
| 668.6 | 29 | 608.6 | 547.3 | 570.6 | 60.0 | 121.3 | 98.0 |
| 790.1 | 34 | 719.2 | 663.1 | 692.9 | 70.9 | 127.0 | 97.2 |
| 911.7 | 39 | 829.9 | 791.9 | 824.3 | 81.8 | 119.8 | 87.4 |
| 1033.3 | 45 | 940.5 | 920.7 | 959.5 | 92.7 | 112.6 | 73.7 |
© 2017 by the author. Licensee MDPI, Basel, Switzerland. This article is an open access article distributed under the terms and conditions of the Creative Commons Attribution (CC BY) license (http://creativecommons.org/licenses/by/4.0/).
Share and Cite
MDPI and ACS Style
Hong, S. Effect of Prestress Levels and Jacking Methods on Friction Losses in Curved Prestressed Tendons. Appl. Sci. 2017, 7, 824. https://doi.org/10.3390/app7080824
AMA Style
Hong S. Effect of Prestress Levels and Jacking Methods on Friction Losses in Curved Prestressed Tendons. Applied Sciences. 2017; 7(8):824. https://doi.org/10.3390/app7080824
Chicago/Turabian StyleHong, Sungnam. 2017. "Effect of Prestress Levels and Jacking Methods on Friction Losses in Curved Prestressed Tendons" Applied Sciences 7, no. 8: 824. https://doi.org/10.3390/app7080824
Note that from the first issue of 2016, this journal uses article numbers instead of page numbers. See further details here.