Axial Fan Blade Vibration Assessment under Inlet Cross-Flow Conditions Using Laser Scanning Vibrometry †

Institute of Process Machinery and Systems Engineering, University of Erlangen-Nuremberg, Cauerstr. 4, 91058 Erlangen, Germany
*
Author to whom correspondence should be addressed.
†
This paper is an extended version of our paper published in 17th International Symposium on Applications of Laser Techniques to Fluid Mechanics, Lisbon, Portugal, 6–10 July 2014.
Appl. Sci. 2017, 7(8), 862; https://doi.org/10.3390/app7080862
Submission received: 4 July 2017
/
Revised: 13 August 2017
/
Accepted: 14 August 2017
/
Published: 22 August 2017
(This article belongs to the Special Issue Laser Scanning)
Abstract
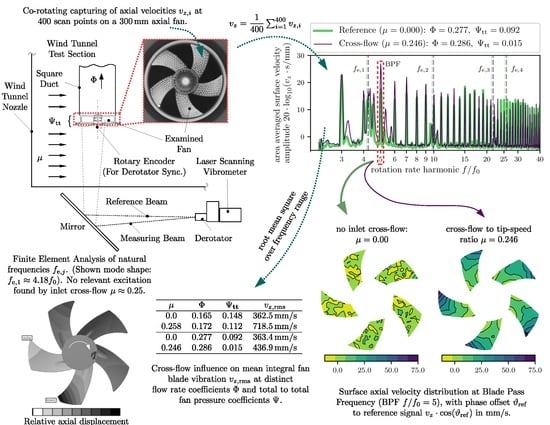
:In thermal power plants equipped with air-cooled condensers (ACCs), axial cooling fans operate under the influence of ambient flow fields. Under inlet cross-flow conditions, the resultant asymmetric flow field is known to introduce additional harmonic forces to the fan blades. This effect has previously only been studied numerically or by using blade-mounted strain gauges. For this study, laser scanning vibrometry (LSV) was used to assess fan blade vibration under inlet cross-flow conditions in an adapted fan test rig inside a wind tunnel test section. Two co-rotating laser beams scanned a low-pressure axial fan, resulting in spectral, phase-resolved surface vibration patterns of the fan blades. Two distinct operating points with flow coefficients of 0.17 and 0.28 were examined, with and without inlet cross-flow influence. While almost identical fan vibration patterns were found for both reference operating points, the overall blade vibration increased by 100% at the low fan flow rate as a result of cross-flow, and by 20% at the high fan flow rate. While numerically predicted natural frequency modes could be confirmed from experimental data as minor peaks in the vibration amplitude spectrum, they were not excited significantly by cross-flow. Instead, primarily higher rotation-rate harmonics were amplified; that is, a synchronous blade-tip flapping was strongly excited at the blade-pass frequency.
1. Introduction
In arid regions, ecologic and economic purposes increasingly demand the application of air-cooled condensers (ACCs) in thermal power plants [1]. Traditional “A-frame” designs consist of large diameter, low-pressure axial fans mounted horizontally below bundles of heat-exchanger tubes where the condensate is cooled by the fans’ draft [2]. At the fans’ inlets, the influence of cross-flow induced by neighboring fans and natural ambient winds, which typically reach magnitudes of 5 to or greater [3,4], is a major issue; it reduces the volumetric effectiveness of the cooling fans discernibly [5,6,7,8,9,10].
In this work, cross-flow denotes a transverse inlet flow field perpendicular to the fan axis and the main operating direction (). The cross-flow introduces asymmetric effects in the inlet flow field of the fans and causes an azimuthal dependence of the flow’s angle of attack at the fan blades. This affects the pressure and velocity distribution at the rotor outlet, as well as the blade loads. The strong asymmetry of the flow field was investigated early on for a wall-mounted fan by Thiart and von Backström [11], who indicated the mechanisms behind the reduction of volumetric effectiveness. For the shrouded peripheral fans in an array of cooling fans of an ACC, the inlet cross-draft additionally causes a flow detachment at the windward edge of the nozzle or condenser bank edge. This introduces additional asymmetric effects to the inlet flow field, as shown by Meyer [12] using numerical investigations, and shown from experimental and numerical data by van der Spuy et al. [13,14].
Along with its negative aerodynamic influence on fan cooling performance, inlet cross-flow is also known to increase blade load and vibration. Depending on its lateral position, the relative blade motion is advancing or retreating to the ambient cross-flow, which respectively results in a greater or smaller angle of attack of the relative flow at the fan blade. This harmonic excitation can lead to considerable stall effects [15] and can increase the overall blade load. In the direction of the cross-flow, the upwind inlet shroud detachment can affect the load distribution decisively [16].
Hotchkiss et al. [15] found a strong azimuthal dependence of the blade load as a result of between the inflow angle and fan axis in a pipe-inlet free-outlet computation. Compared to an axial pipe inlet (), Hotchkiss et al. found variations in torque and thrust of more than 20% caused by this inclined pipe-inlet flow. Maximum loads were detected around the blades’ upwind zenith, and minima were detected around the downwind zenith.
Similar results were found from simulations performed by Bredell et al. [16], who computed significant bending moment variations of ACC periphery fans under the influence of induced inlet cross-flow. The azimuthal variation of the load distribution was similar to the findings of Hotchkiss et al.; that is, the maximum bending moment was found at the upwind position, within the last quarter of the blades’ advancing semicircle. It was shown that the nature and magnitude of the amplification caused by induced cross-flow at the periphery fan depend strongly on the ACC platform height and fan geometry. Despite being under smaller maximum stresses because of a shorter blade span, larger hub-to-tip-ratio fans ( vs. 0.153) experienced similar relative bending moment variations.
From measurements with strain gauges on an operating on-site periphery fan in a power plant ACC, Muiyser et al. [17] computed the azimuthal load distribution. Their experimental findings agreed with the computations mentioned above. The blade load was increased dominantly by magnitudes of around 20% at the upwind side of the periphery fan; moderately higher loads were observed at the advancing blade side compared to the retreating blade side. Earlier potential flow computations by Muiyser et al. [18] had already identified the sensitivity of the blade vibration to distorted inlet-flow conditions.
Inlet cross-flow can clearly cause great amplifications in fan vibration and respective blade loads. As a result of blade-span leverage, this is more relevant to the effective maximum stress in the large-diameter cantilever style fans used in conventional ACCs. Nevertheless, it may also be of concern for larger hub-to-tip-ratio fans, especially when cross-flow excites the blade vibration in proximity to natural frequencies of the blade.
Rather than determining the azimuthal load distribution, this study aims to gain more spatially resolved information in the frequency domain and under the influence of inlet cross-flow on the blade vibration of axial fans. For this, the blade motion was captured using laser scanning vibrometry (LSV) in a wind tunnel fan test rig, as described below. Natural frequencies and mode shapes of the industrial fan were computed using a finite element method (FEM), and the findings are used to assess the motion patterns of peak amplitude frequencies from the measurements.
2. Materials and Methods
LSV measurements were performed on an axial fan, using a fan test rig mounted inside a wind tunnel test section. Natural modes and frequencies were computed from a FEM eigenvalue computation of the fan under centripetal load.
2.1. Wind Tunnel Fan Test Rig
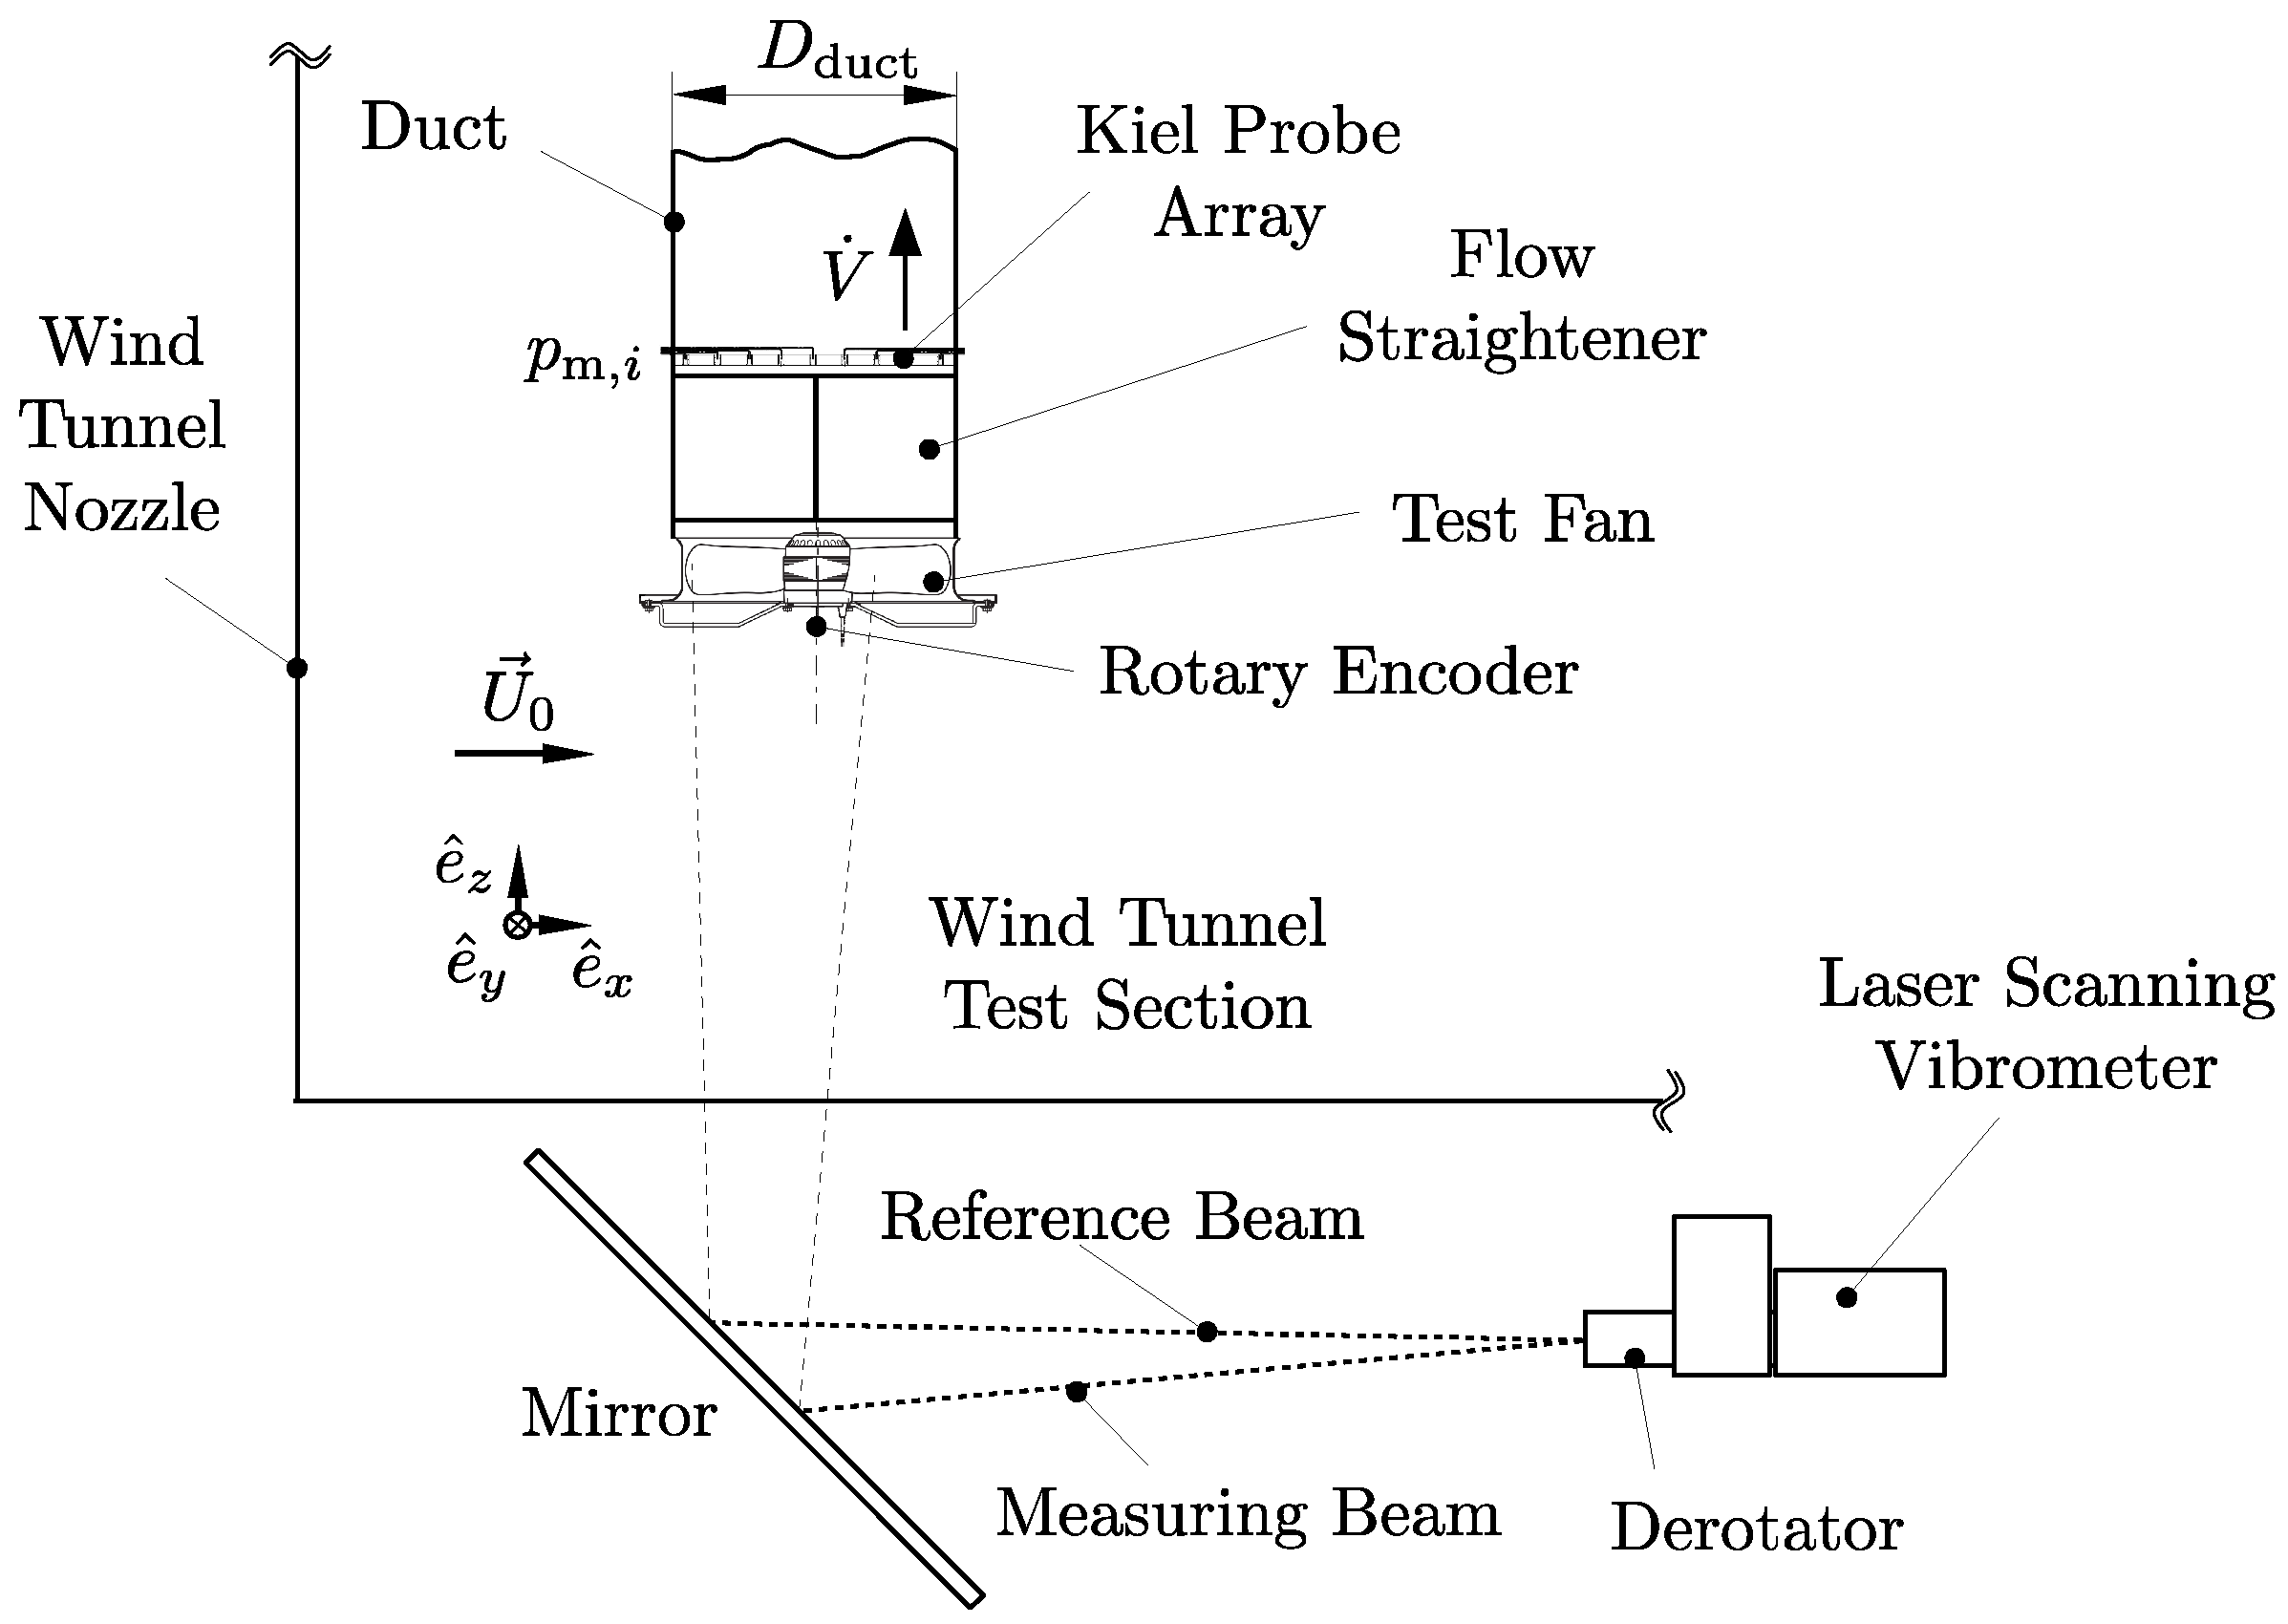
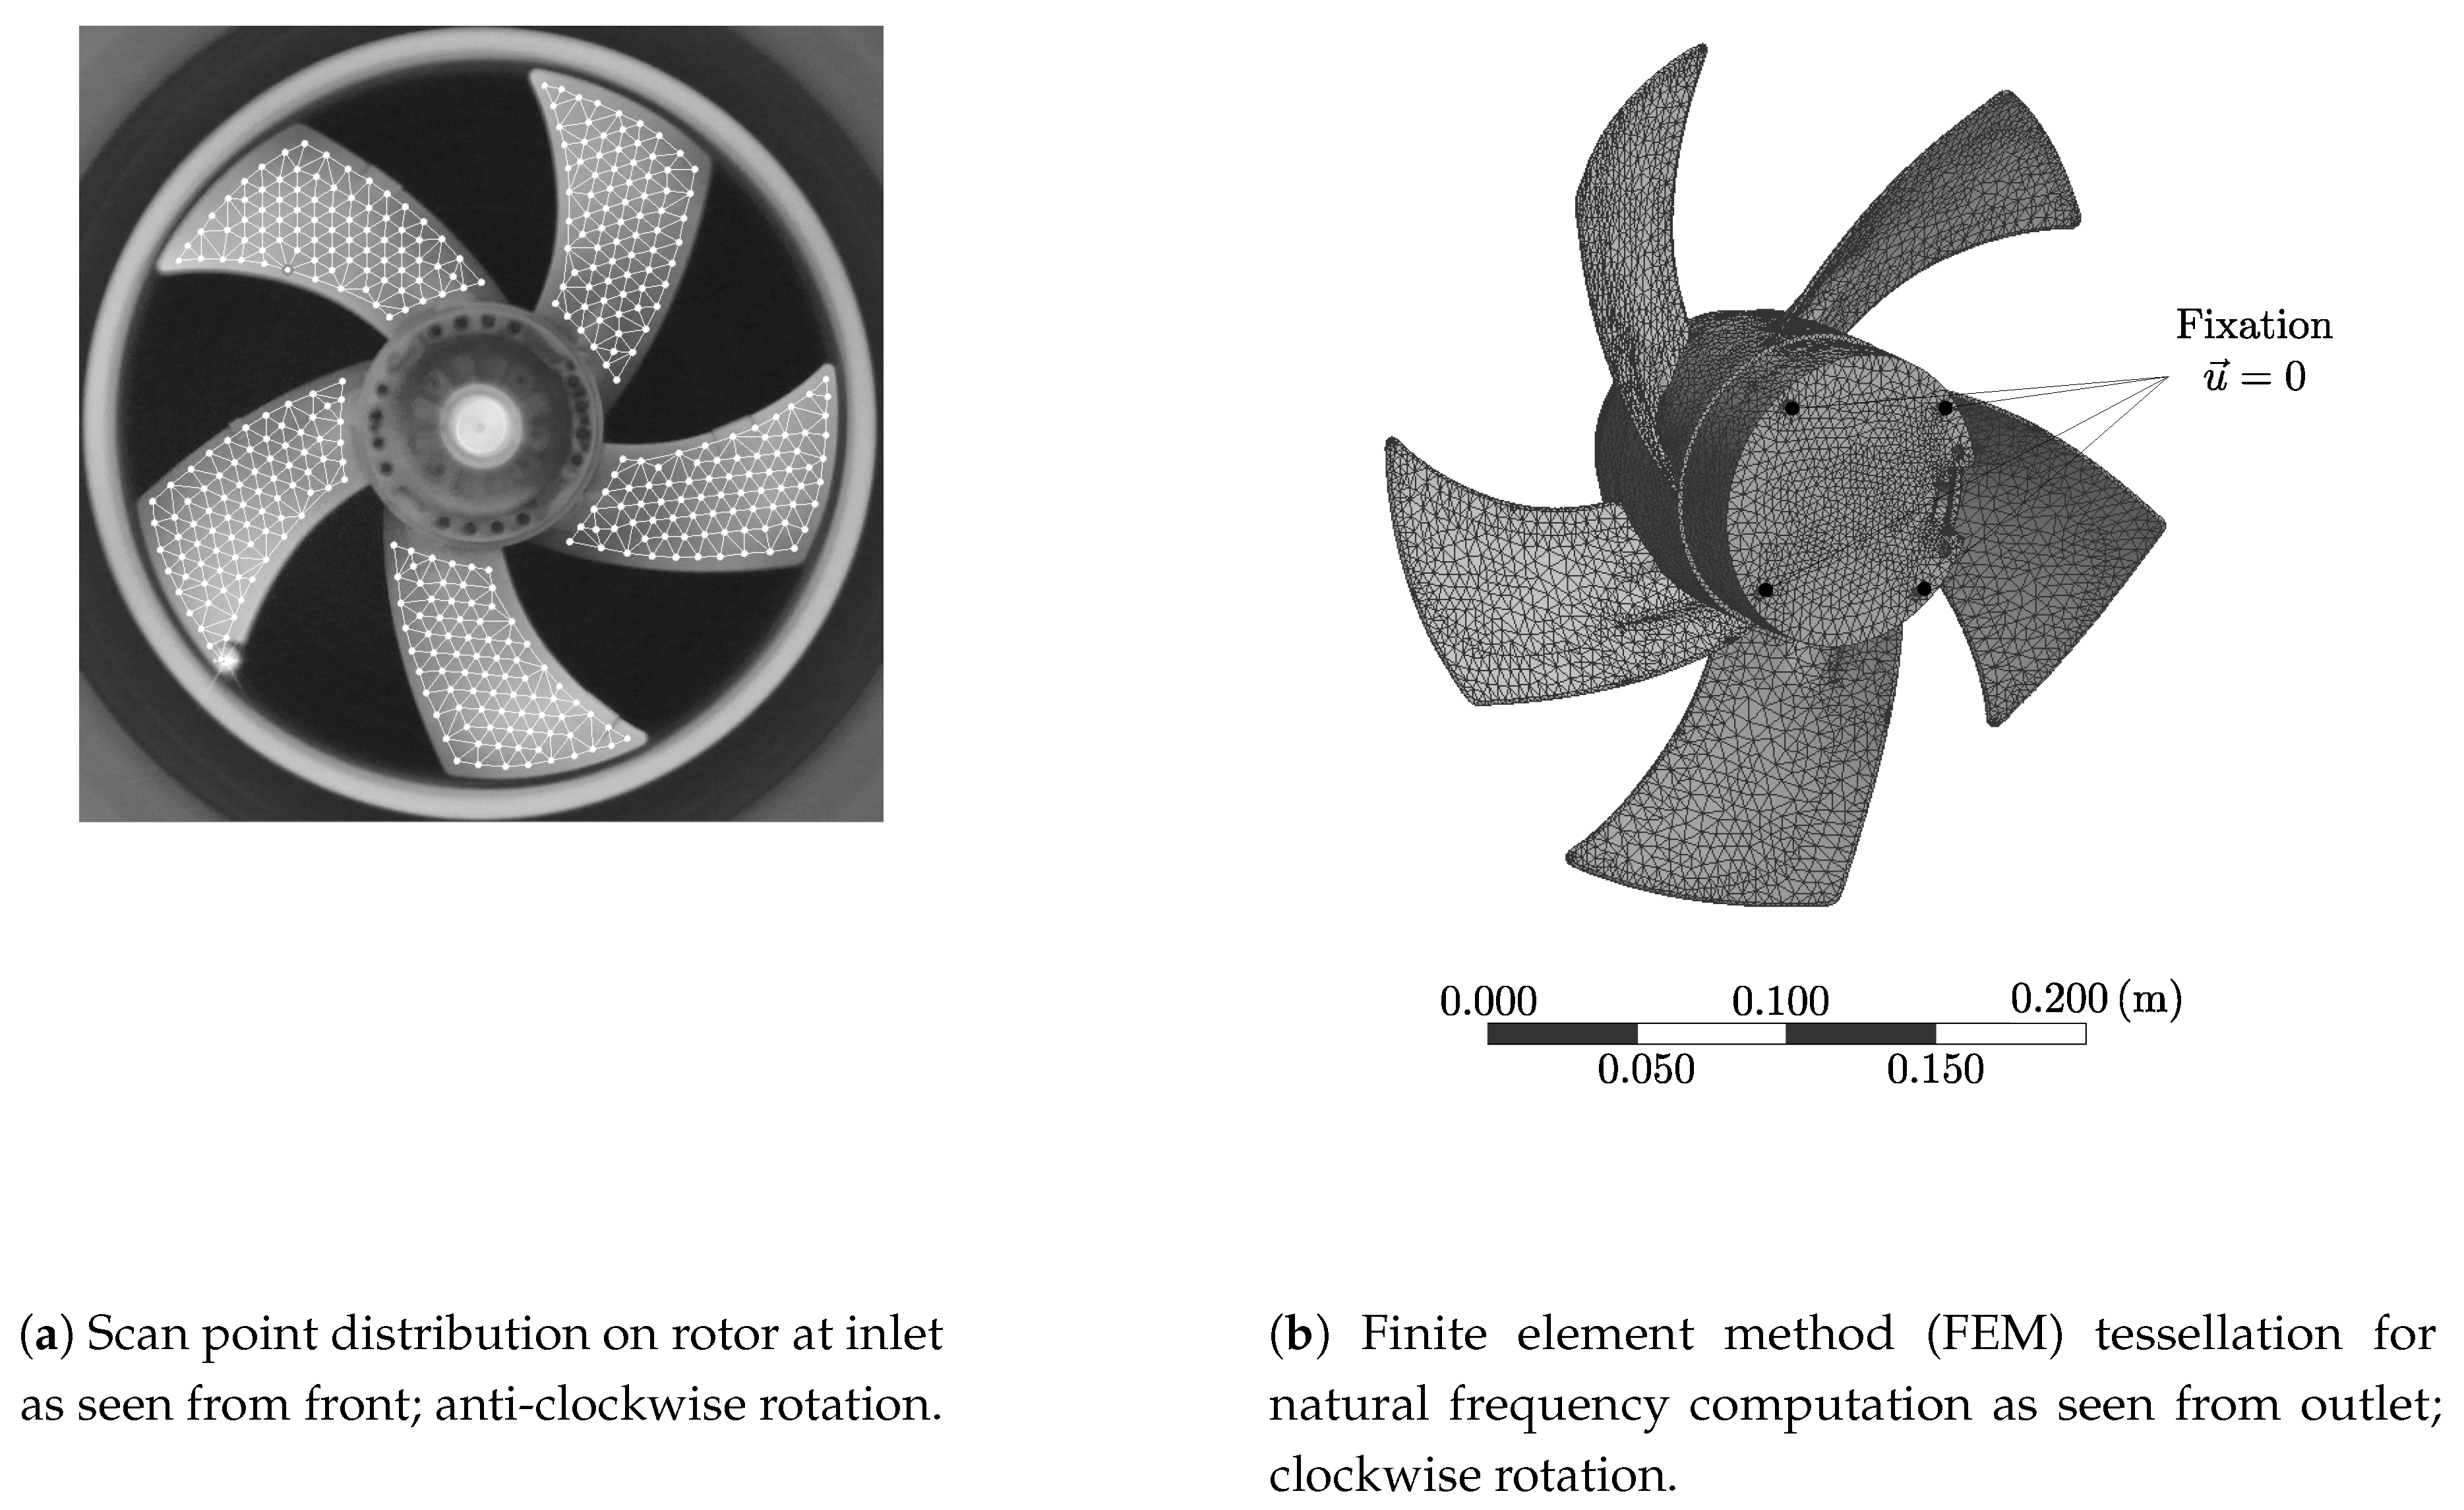
The influence of an inlet cross-flow on the fan blade vibration was measured using LSV inside a customized fan test rig inside a Göttinger-type wind tunnel with a long open test section and an exit nozzle of . A commercial low-pressure axial fan ( diameter) with five forward-skewed blades and a hub-to-tip ratio of , operating with its axis perpendicular to a uniform ambient velocity , was examined. Figure 1 shows the experimental setup, while the fan design is illustrated in Figure 2.
The test fan was examined, operating in its standard shroud without a guard grille and held in place by four thin struts with its outlet mounted to a square duct section, above the wind tunnel test section’s floor. Behind a short flow-straightening device, the stagnation pressure was captured relative to the wind tunnel ambient pressure with 81 Kiel-type stagnation pressure probes, and was surface averaged to the total-to-total fan pressure . The equally spaced grid of pressure probes inside the square duct () is described in [19]. The fan flow rate was computed from static pressure loss over five standard nozzles inside a settling chamber at the end of the outlet duct, in accordance to the fan test rig standard ISO 5801 (not displayed in Figure 1). The experimental setup was previously used to investigate the integral inlet flow field influence on the characteristic fan curve, as shown in [20].
To measure the fan rotation rate and to synchronize the test fan with the co-rotating LSV’s derotator, a rotary encoder was mounted directly to the fan axis at its center. With the wind tunnel either turned off or operating at a wind velocity, the characteristic cross-flow coefficient
differed slightly around 0.25, depending on the rotation rate of the commercial fan.
At one low flow rate () called operating point 1 (OP1), and at a higher flow rate, OP2 (), with similar flow-rate coefficients
a total of four operating points were measured with (OP10 and OP20) and (OP11 and OP21), as listed in Table 1 along with the respective total fan pressure coefficients
Table 1 and Table 2 list the expanded combined uncertainties of the quantities x for a 95% level of confidence, as defined by
in [21] with the measured quantities and their expanded uncertainties . The measured quantities were the pressure measurements of the total fan pressure , the wind tunnel velocity stagnation pressure used for , and the multi-nozzle pressure loss for flow rate ; the density , the rotation rate , the fan dimensions and , and the coefficient uncertainties for the computation of with multi-nozzles listed in ISO 5801. Because the fan dimensions were a dominant source of uncertainty in the computation of , and but did not change between data sets, the combined uncertainties of Table 2 provide a better estimate of possible uncertainties caused by random error.
2.2. Laser Scanning Vibrometry
The axial blade-surface velocity distribution was captured using a PSV-500 Scanning Vibrometer coupled with a PSV-A-400 derotator (Polytec GmbH, Waldbronn, Germany). The method is also known as tracking laser (scanning) vibrometry, and has been applied to rotating machinery over the recent years in helicopter or automotive research; see for example, [22,23]. The method facilitates the comparatively fast capturing of a rotating object’s surface velocity at many probe locations. In comparison to accelerometers, this non-intrusive method also has the advantage of not imposing additional weight or aerodynamic obstacles in the form of sensors and wiring onto the measuring object.
The fan blades were sprayed with a reflective coating, such that their local surface velocity could be computed from the Doppler frequency shift of the reflection of a continuous-wave HeNe laser beam. Successively, equally distributed probe locations () with a typical spacing of between them, as shown in Figure 2a, were measured by the co-rotating beam at a sampling rate of . On each scanning point, 30 samples with velocity signals (around 27 full fan rotations) were successively captured and transferred to the frequency domain.
Hanning windows with 70% overlap were used to average the 30 samples, resulting in frequency domain data sets with a bandwidth of resolved to discrete frequencies , where and integer values k are defined as in Equation (6). With the respective fan rotation rate , discrete dimensionless frequency coefficients
result for . Plain kinematic effects were observed at rotation rate , caused by the uncertainty in the parallel alignment of the laser beam and fan axis. To exclude such rigid-body rotation effects from the blade vibration analysis, the frequency domain was filtered to a minimum integer above the second rotation-rate harmonic, such that
The scanning laser was accompanied by a reference beam signal , which remained fixed on one probe location for phase reference to the individual measured velocities (for scan points). Using the recorded cross-spectral density between the two signals , a phase offset of point i at ,
could be computed. This allowed for the reconstruction of a relative motion pattern:
The magnitude of total fan vibration was analyzed with the surface-averaged axial velocity as a function of the frequency,
Using this, the integral level of the overall fan blade vibration could be expressed by the root mean square value over all the frequencies , where is from Equation (6); that is,
The velocity amplitude full-scale range was limited to a maximum of . For this range, the manufacturer states the noise-limited resolution of , at which the signal amplitude equals the noise level. Because this value depends strongly on the surface reflection quality and ambient conditions, a higher noise level was expected for the measurement of the rotating fan. As it will be shown below, the base noise level was ; that is, .
2.3. Numerical Setup for Natural Frequency Computation
To interpret the measured vibration shapes at dominant frequencies, the natural frequencies of the test fan were computed, along with the respective mode shapes. The finite element solver ANSYS Mechanical (version R17.1, ANSYS Inc., Canonsburg, PA, USA) was used to perform the modal analysis under typical centripetal loads.
Tetrahedral triangulation of the geometric fan model was performed with typical element sizes of , resulting in 206 802 nodes. The resulting mesh is shown in Figure 2b. A centripetal load was inflicted on the fan at , with rigid support in all degrees of freedom at the four bolt locations marked by in Figure 2b. This resulted in peak von Mises-equivalent stress levels of , located at the leading edge of the blades, at around one-third of the span between the hub and tip. This pre-strain of the blades had a considerable influence on the fan’s natural frequencies and mode shapes.
3. Results and Discussion
3.1. Reference Results and Computed Mode Shapes
3.1.1. Natural Frequencies
Natural frequency computation with the setup described above typically resulted in groups of five distinct frequencies in great proximity. These referred to the same natural mode for each individual blade, which differed numerically as a result of model and mesh asymmetries. The arithmetic mean over these sets of joint frequencies resulted in the first eight natural frequencies listed in Table 3, along with the respective frequency numbers , which differred for the different rotation rates of the four operating points. The five distinct frequencies averaged to are listed in Table 4 for to 4.
3.1.2. Spectral Decomposition of the Surface-Averaged Velocity Amplitude
Reference results show the response of the fan vibration without the presence of a uniform ambient cross-flow field at the fan inlet (). Dominant amplitude peaks could be determined, and a comparison of the two operating points OP10 and OP20 could be made. Selected frequencies n were examined more closely, and the respective reconstructed motion pattern could be compared to associated natural modes determined from a FEM simulation.
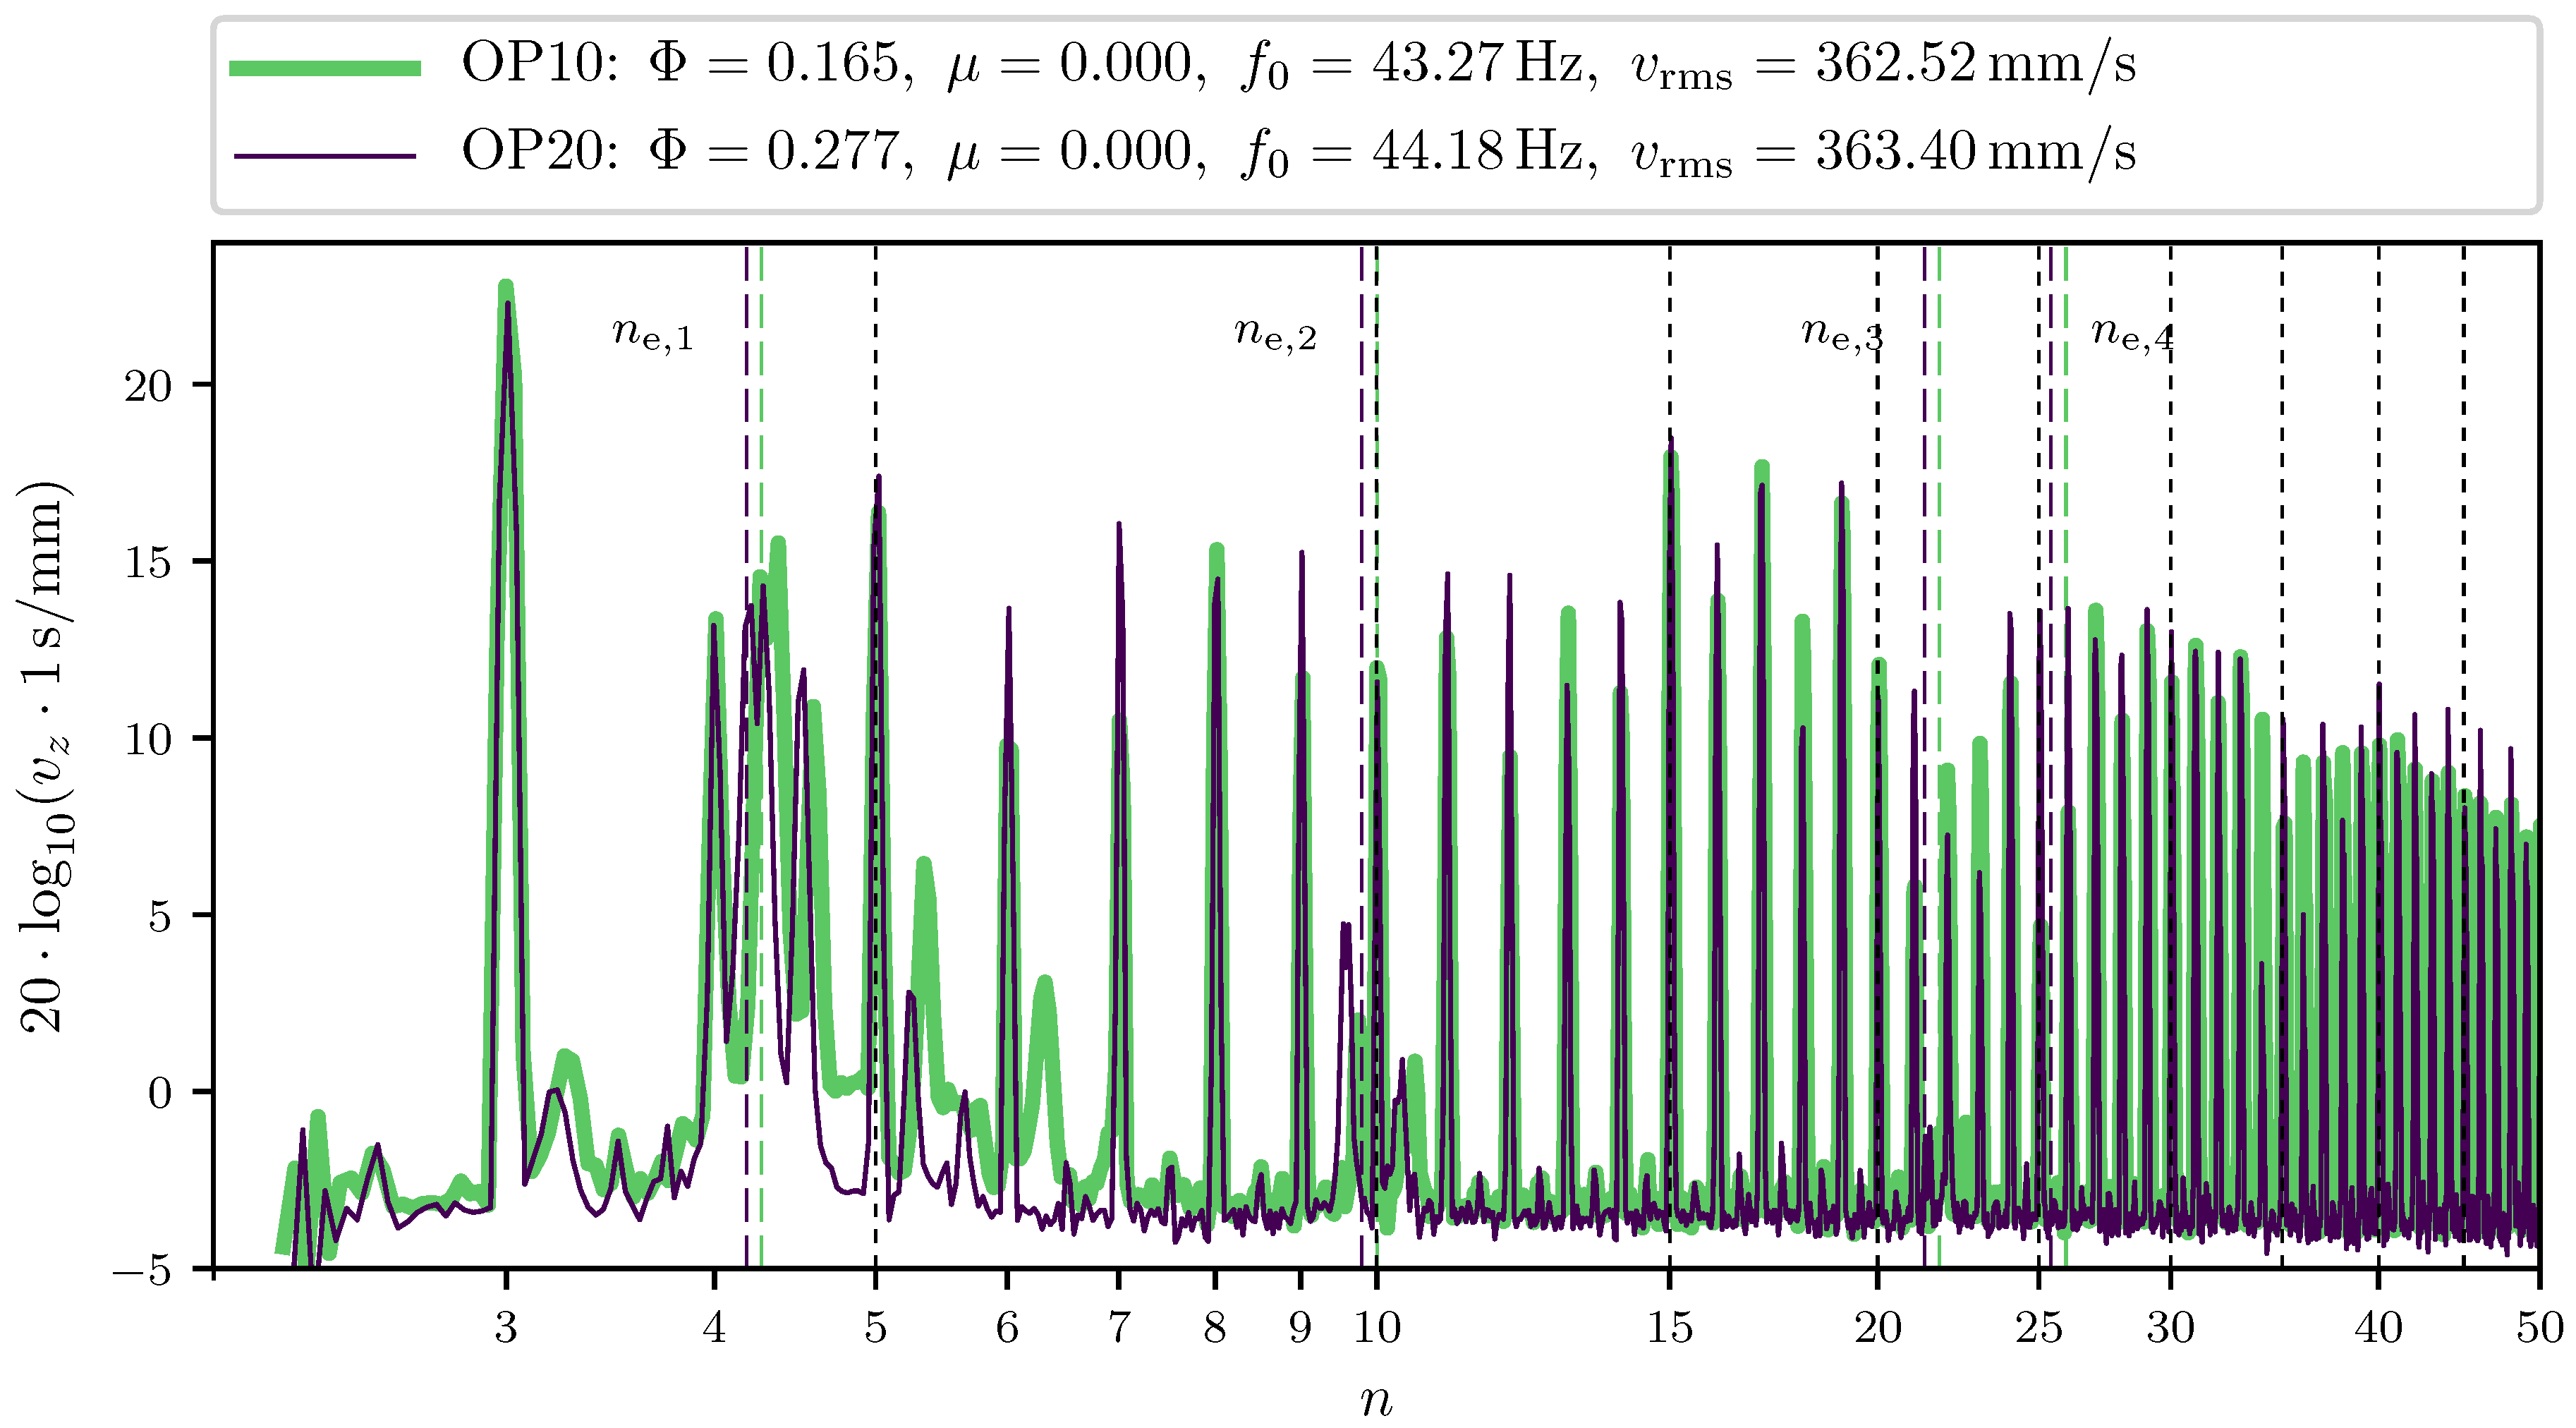
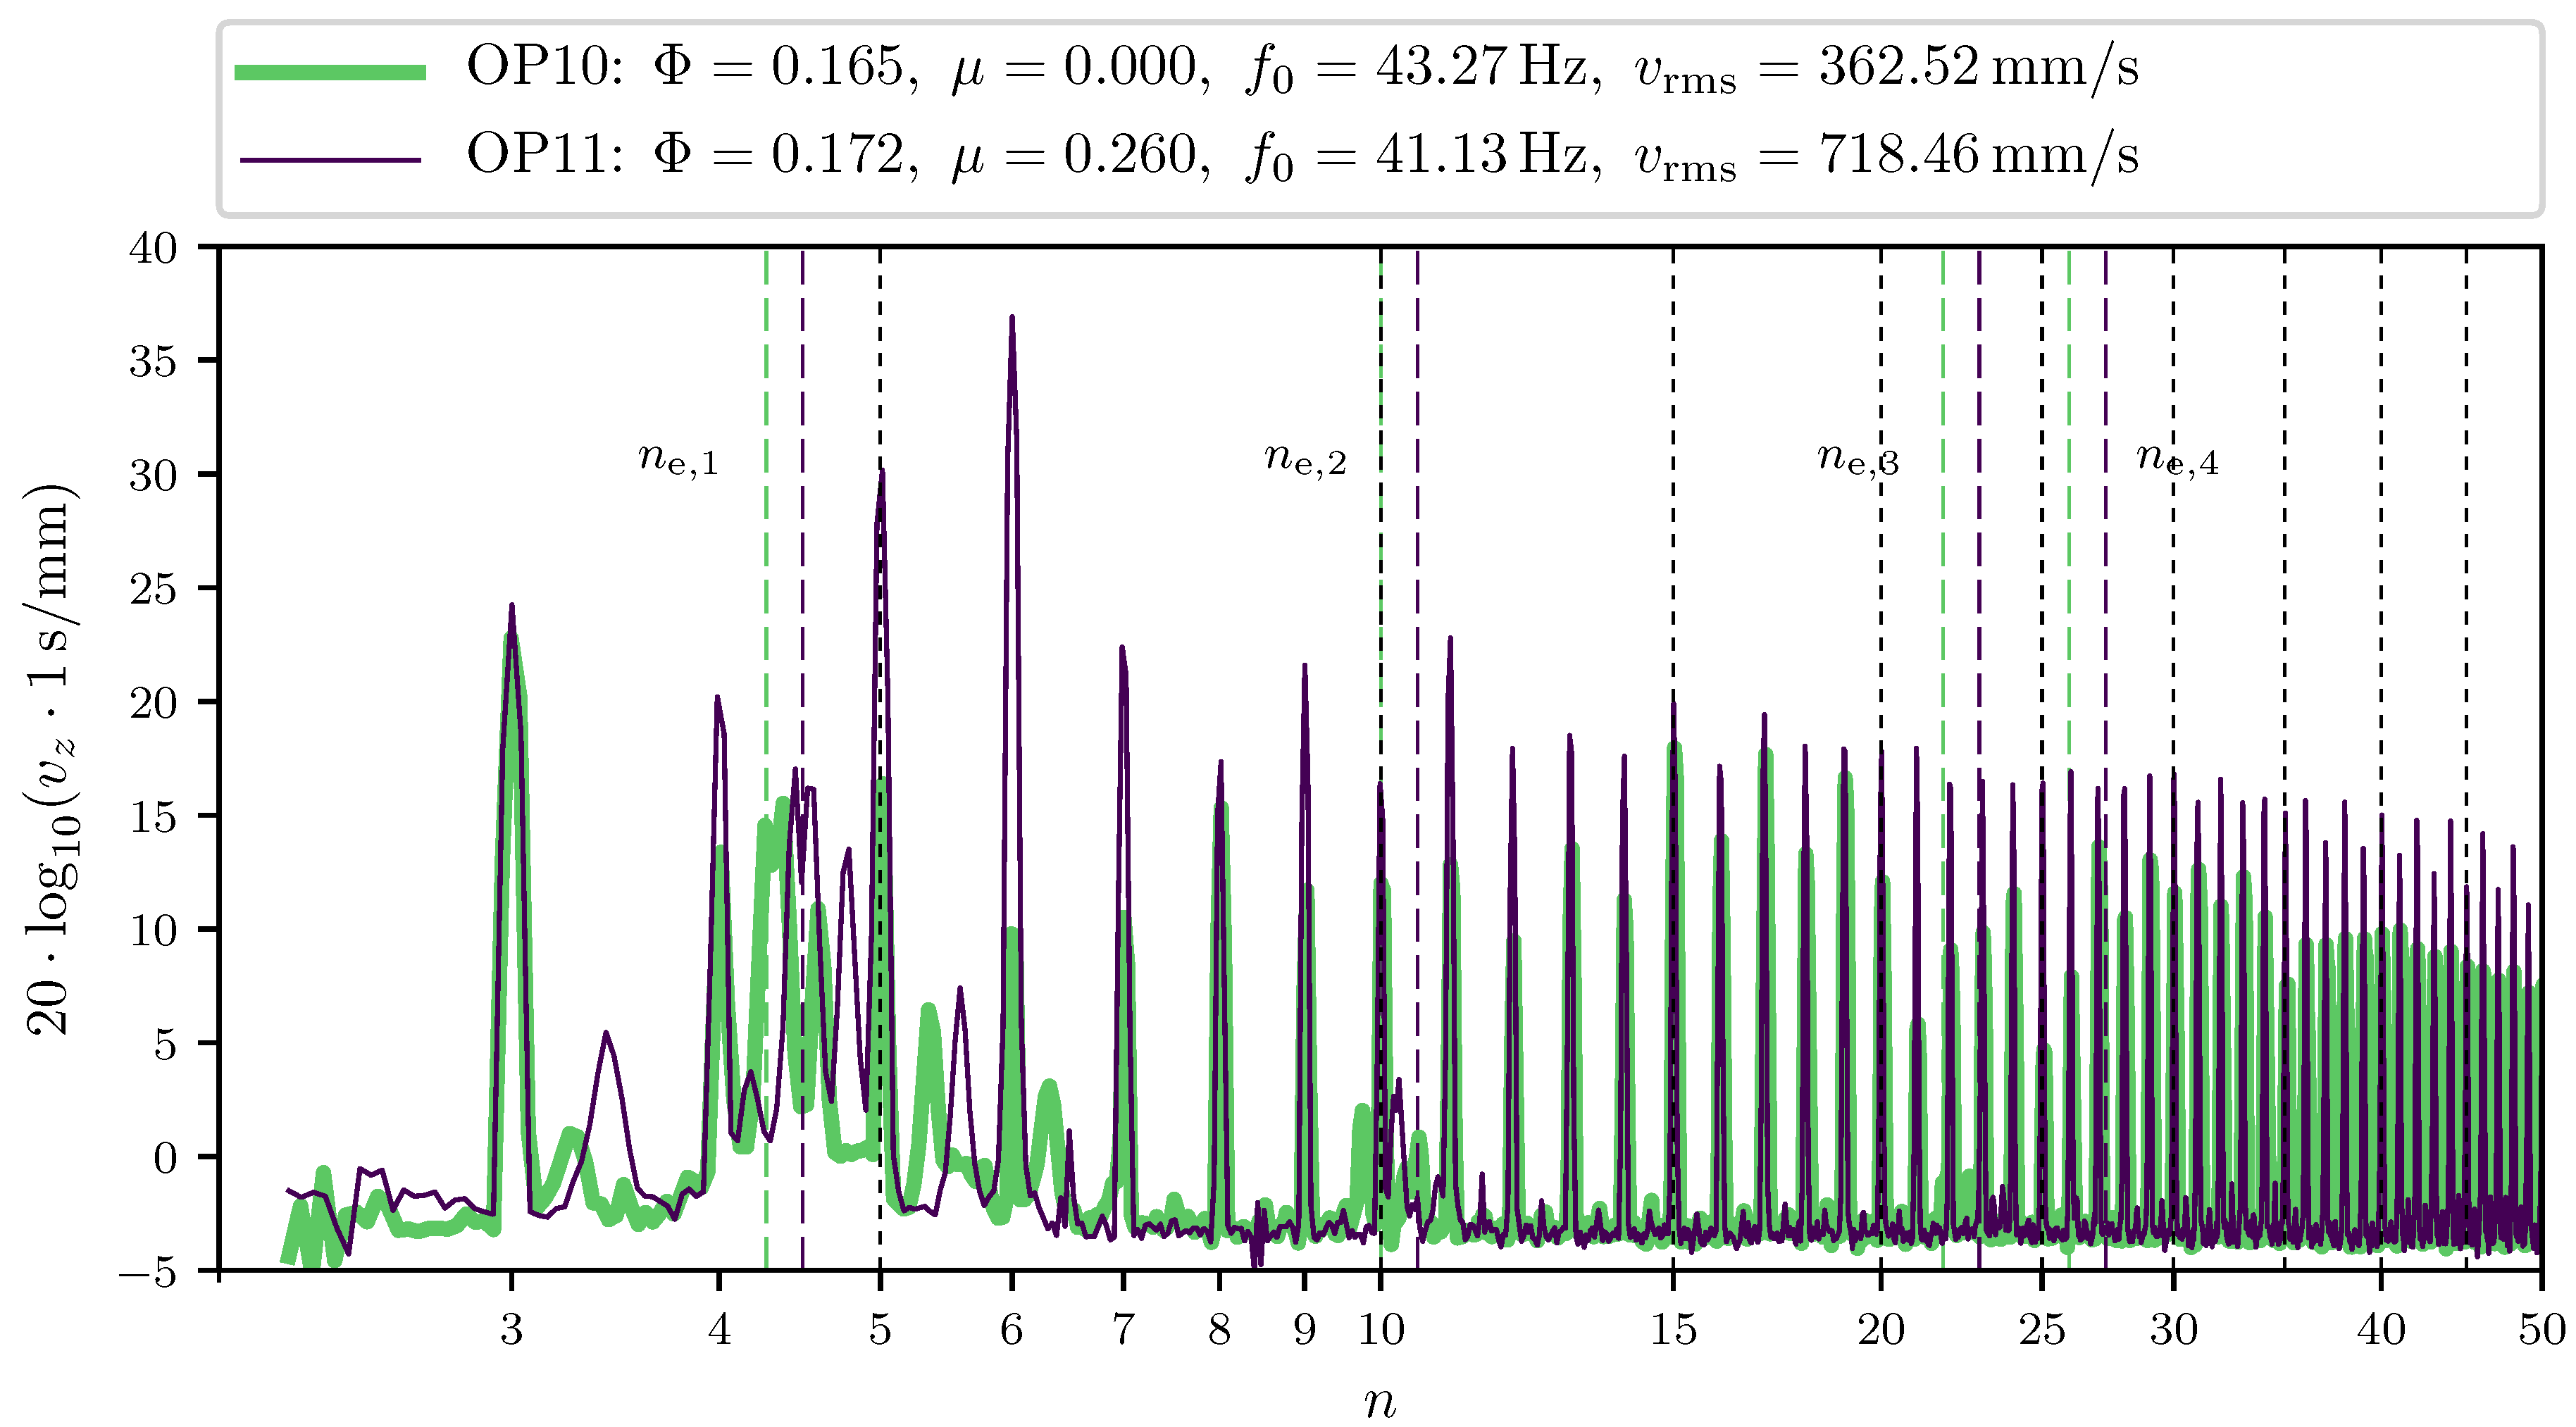
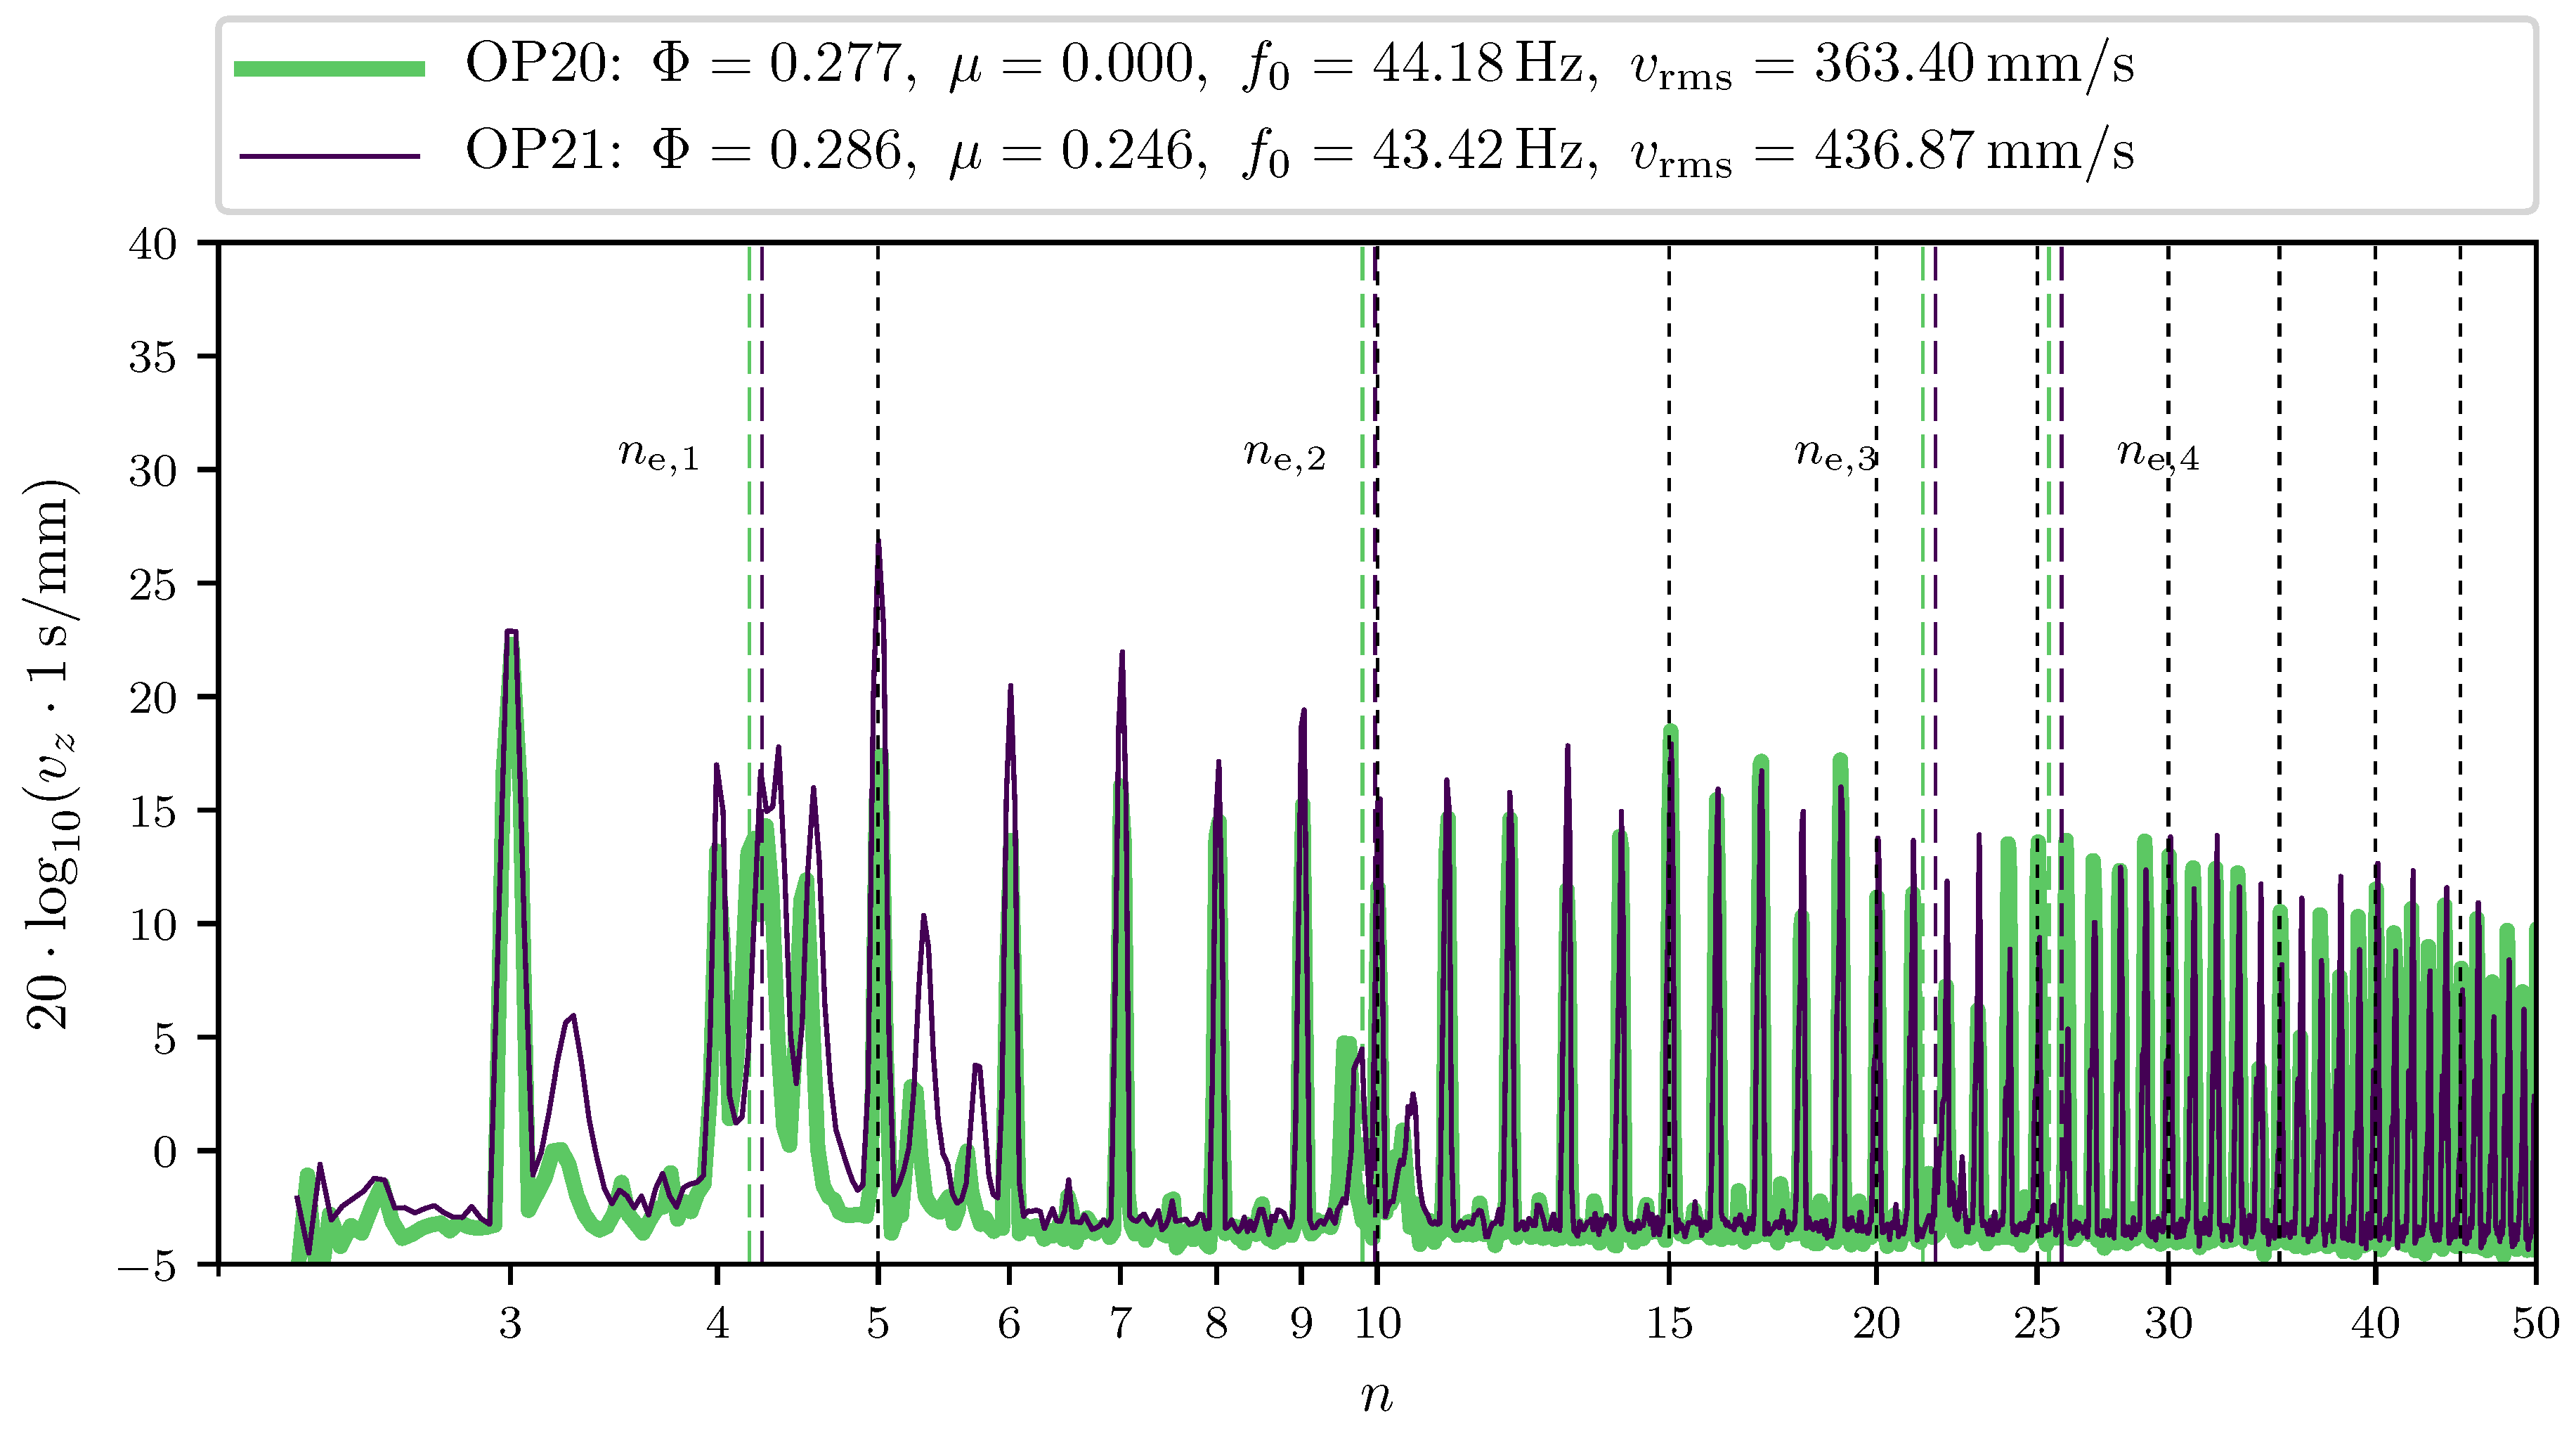
Figure 3 shows the spectral decomposition of the surface-averaged fan blade velocity amplitude from all scan points, as defined in Equation (9), for the frequency range . As annotated above, the first two rotation-rate harmonics and 2 are cut off because of distortion by kinematic effects. In Figure 3, black dotted vertical lines indicate the harmonics of the blade-pass frequency . The data sets’ natural frequencies are added in dashed vertical lines for to 4. Because of the different rotation rates of the operating points’ natural frequencies, these dashed lines do not coincide for the data sets. The base-level noise was detected at from the data.
It becomes clear from Figure 3 that the measured mean surface vibration was dominated by the rotation-rate harmonics, that is, where n had integer values, with amplitudes close to zero in between. Although operating at distinctly different flow rates , the reference spectra of OP10 and OP20 coincided intensely; they have almost identical integral vibration measures of and , respectively. The dominant peak for both operating points is , with similar velocity amplitudes, but the blade-pass frequency harmonics and 15 are also prominent. Noteworthy non-integer values n are located in the proximity of the first three natural frequencies, especially at .
3.1.3. Mode Shapes at Natural Frequencies
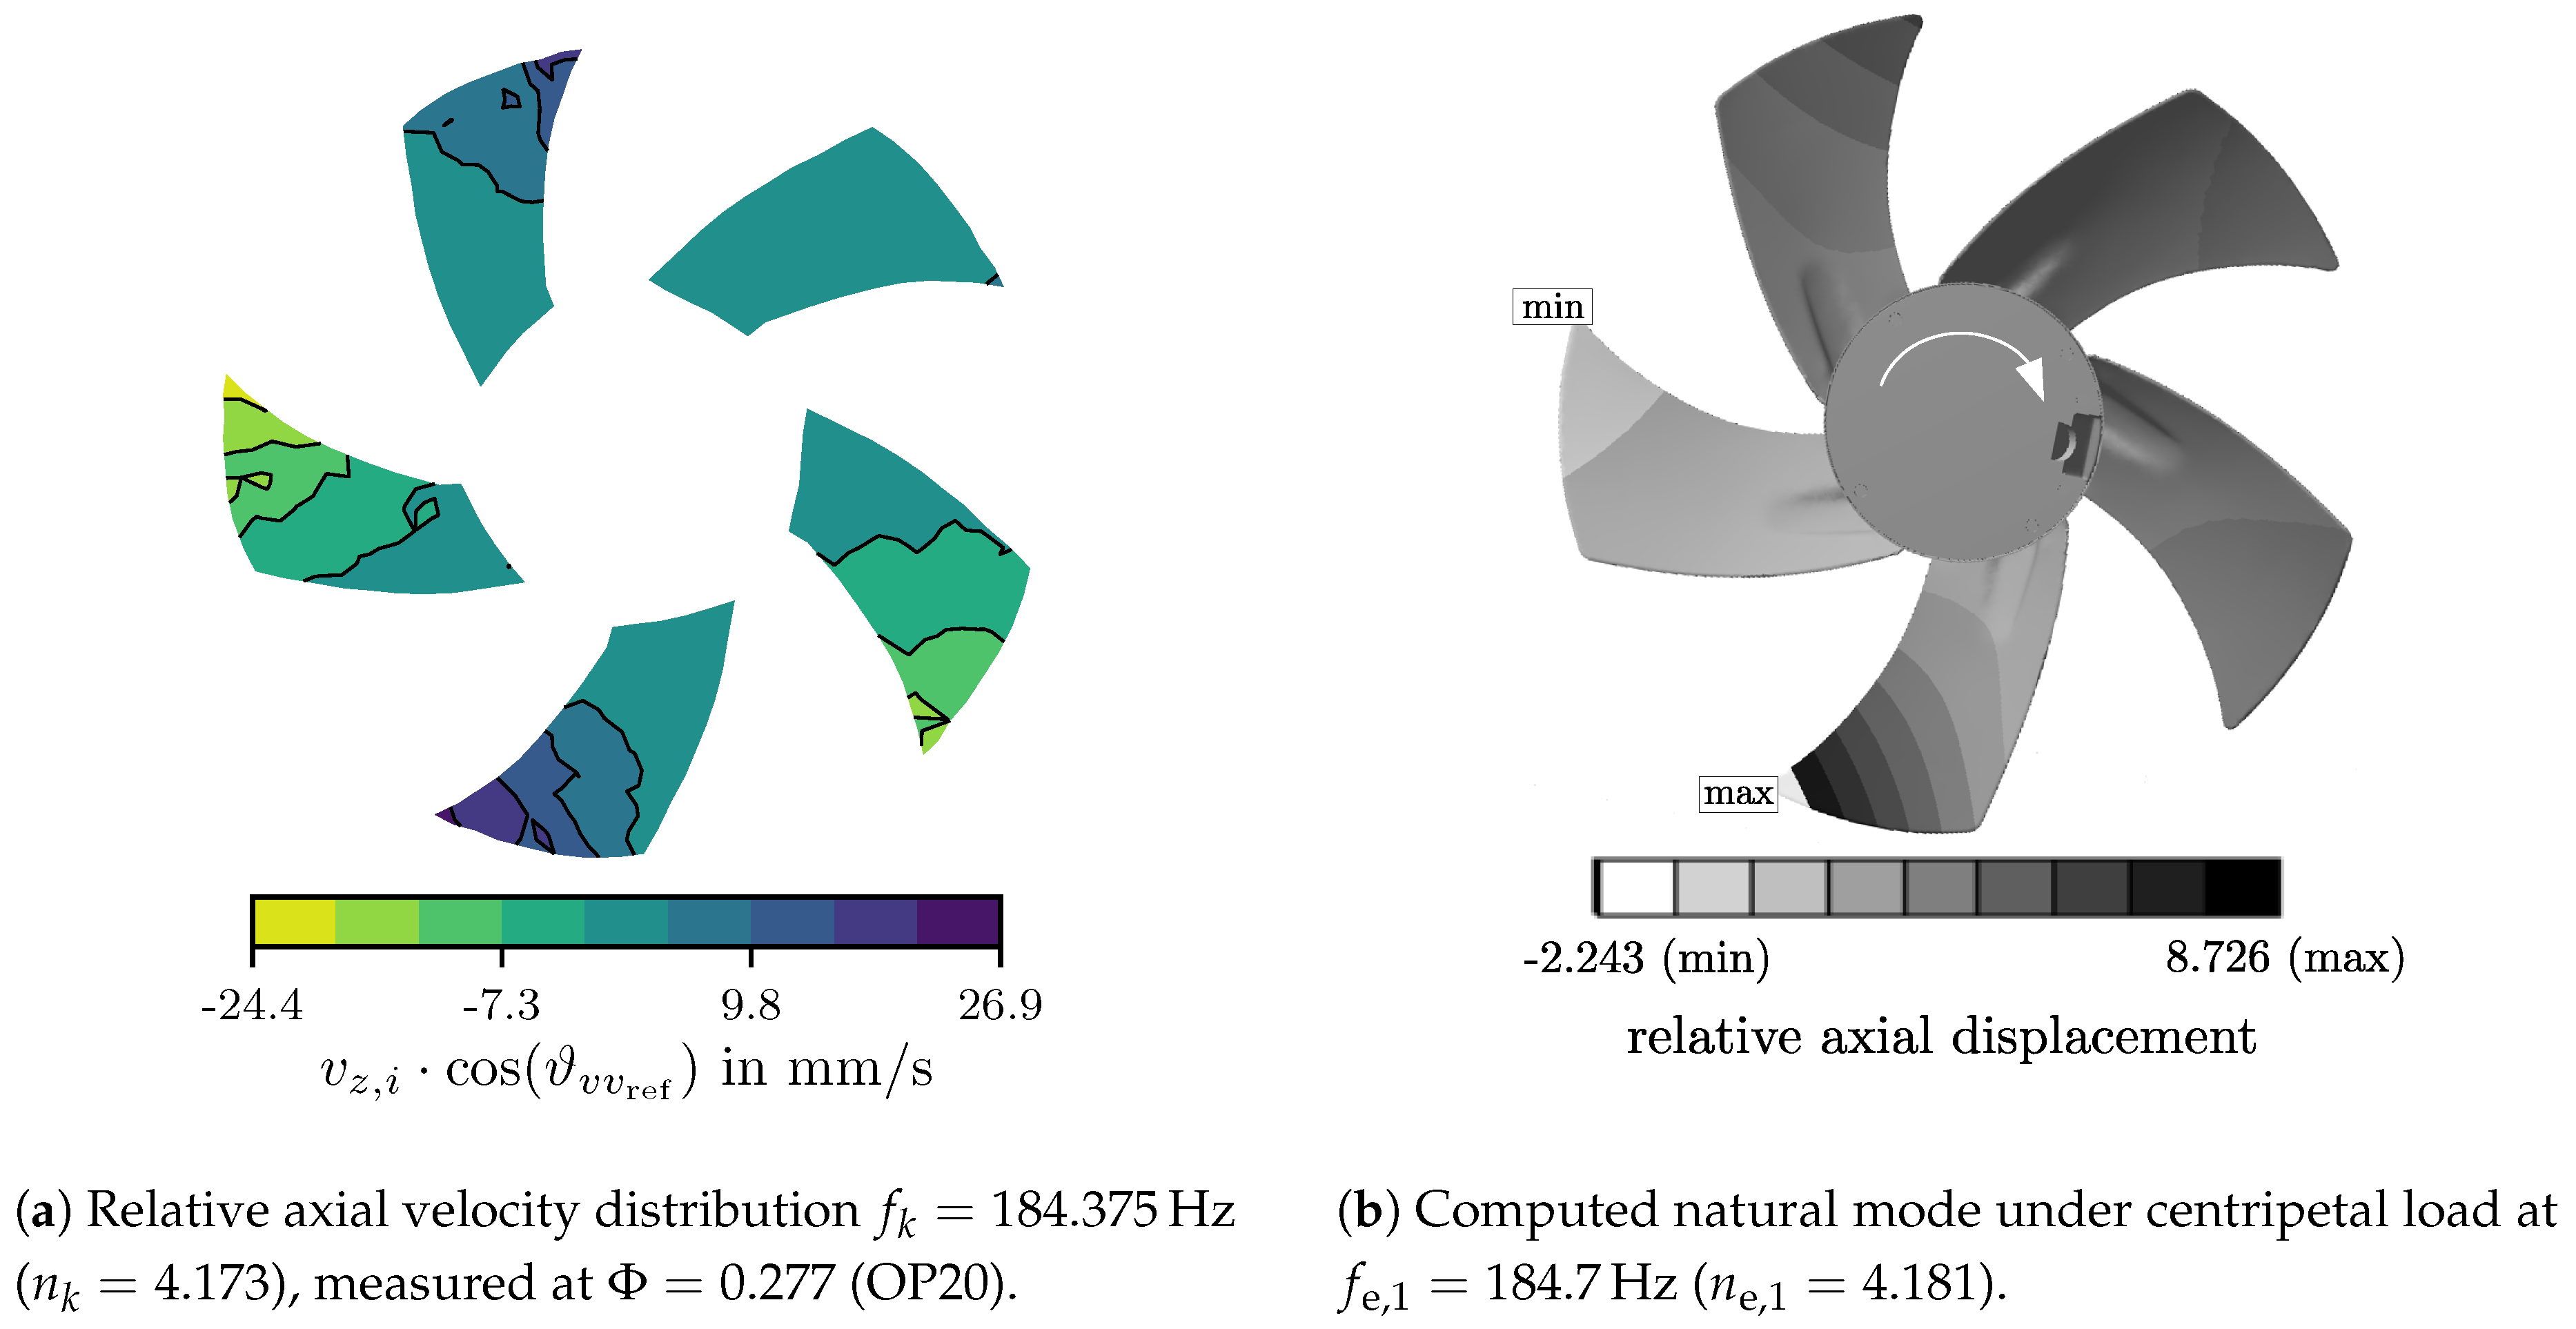
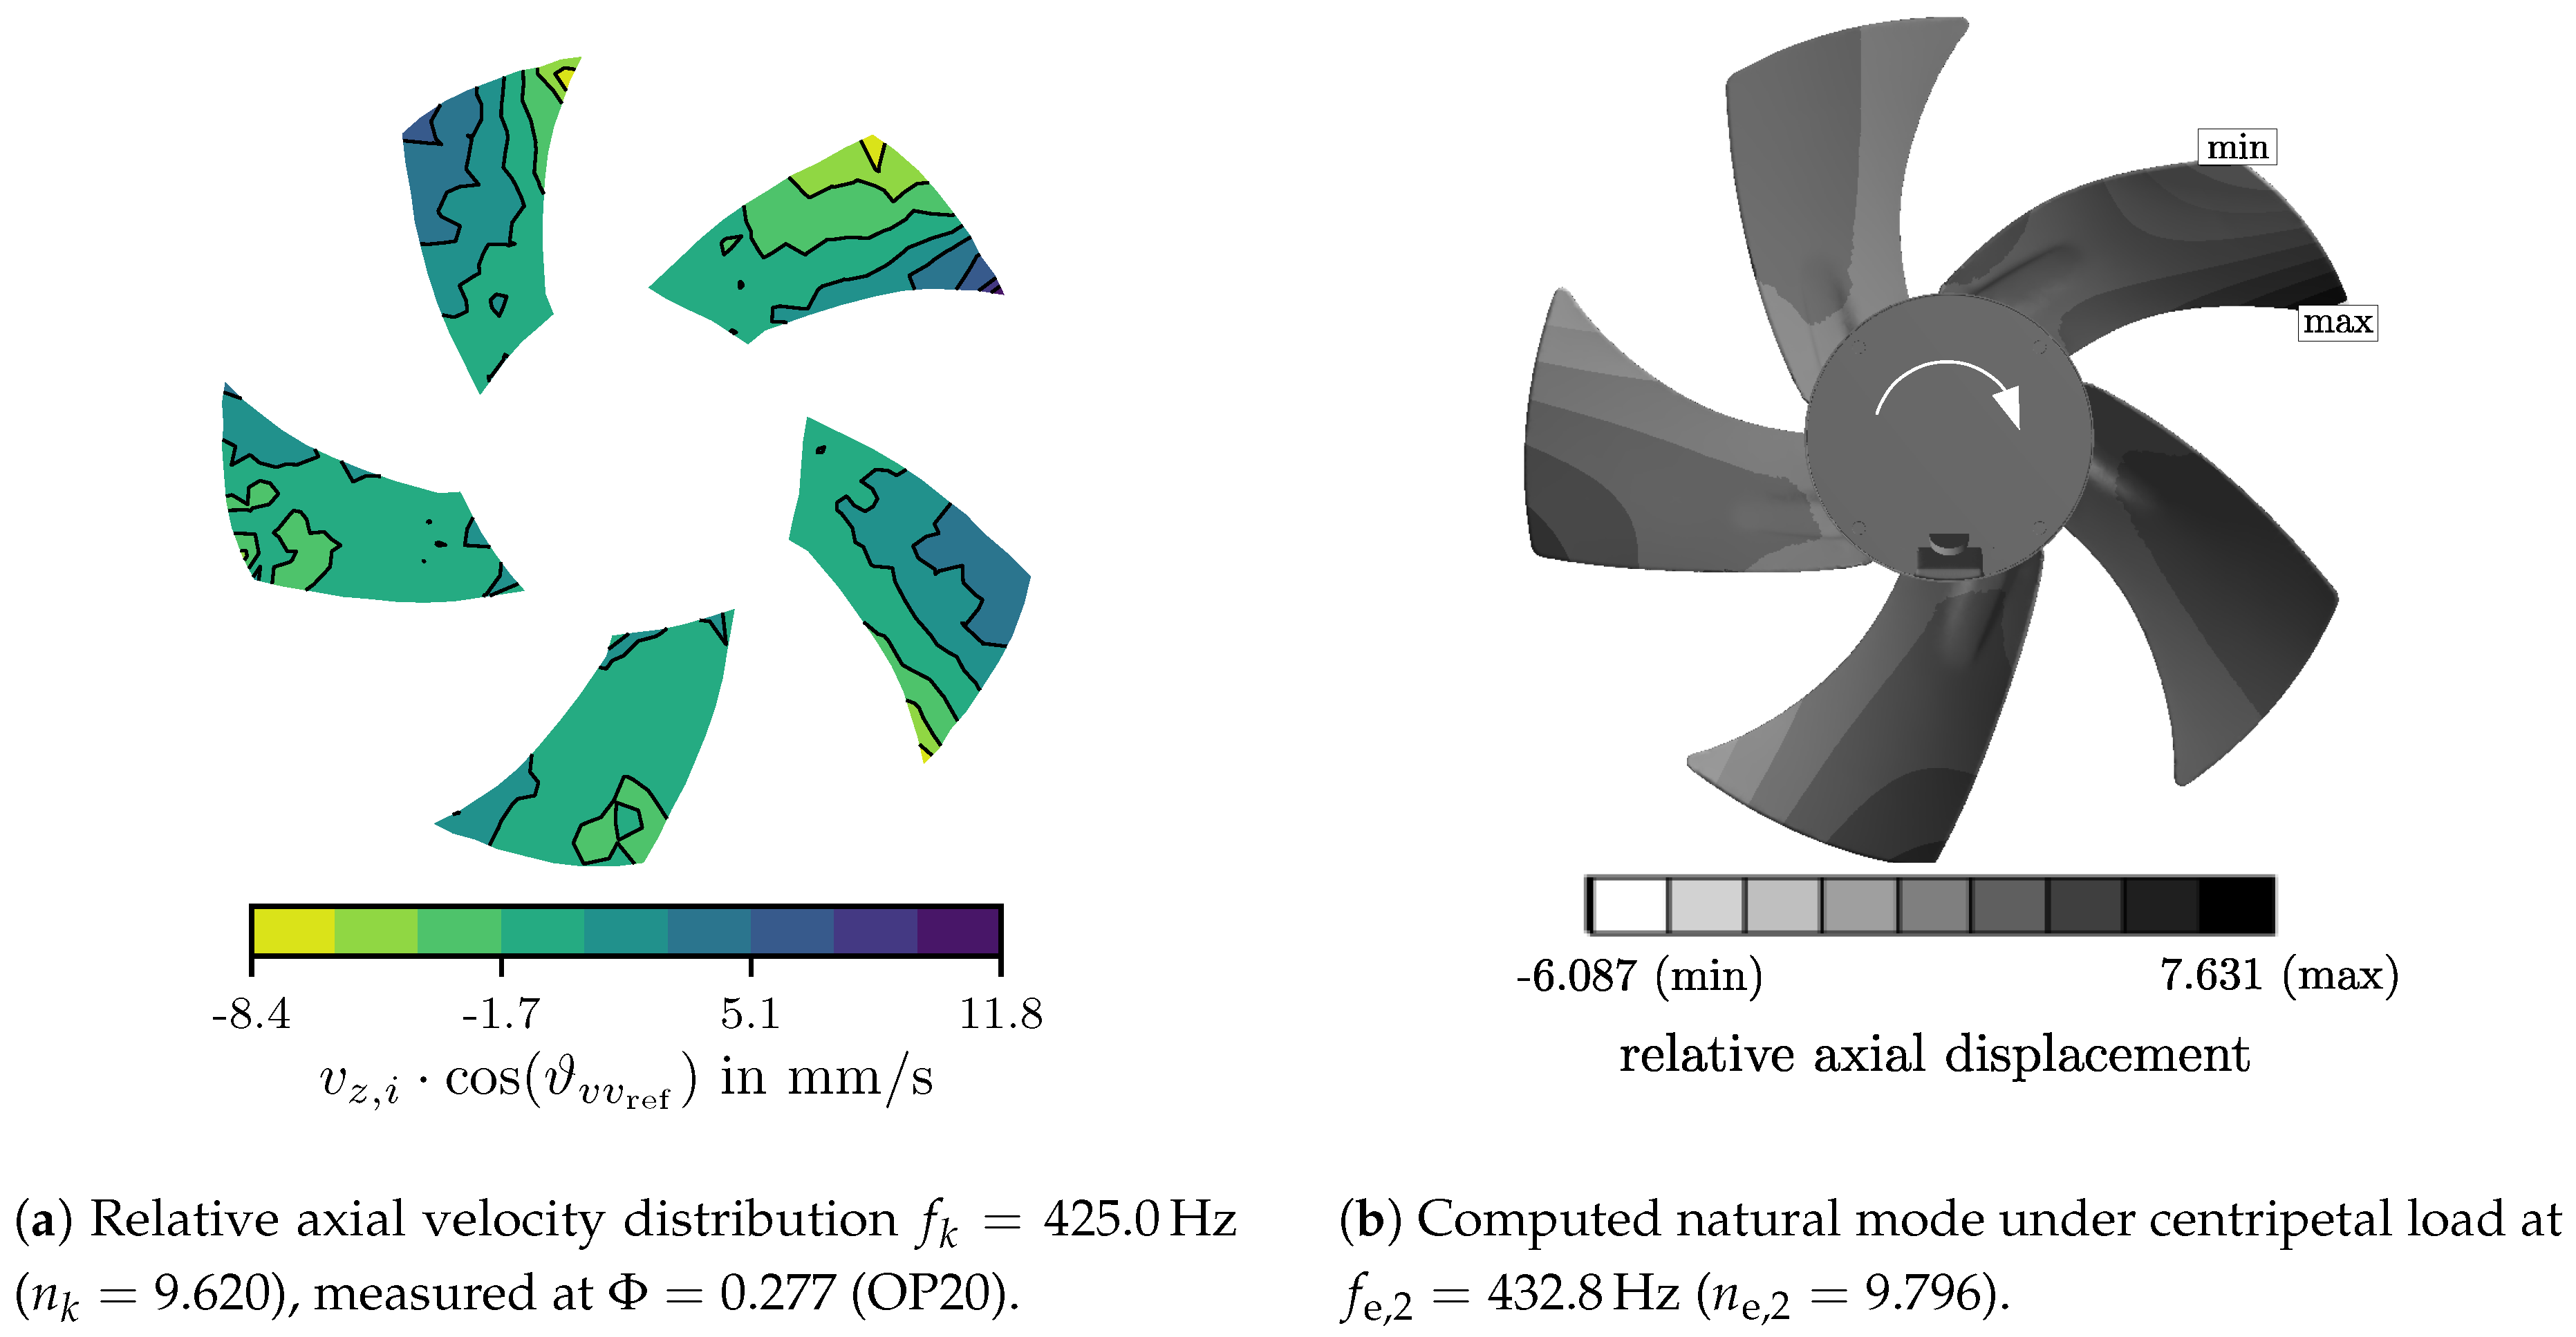
Before the motion patterns at the rotation-rate harmonics are analyzed, the experimental reference results () are compared with the natural frequency computation. The amplitude peaks of the surface-averaged axial velocities and from Figure 3 can be dissolved to a relative motion pattern using the phase offset to the reference signal, as defined by Equation (8). In Figure 4 and Figure 5, the measured reference distribution of at the discrete frequencies of the peaks in close proximity to the first two natural frequencies are displayed on the left. The representative sample velocity distributions presented in Figure 4a and Figure 5a belong to the higher flow-rate data set OP20. They are also representative for the findings of OP10, which gave very similar results.
The images on the right (Figure 4b and Figure 5b) illustrate the mode shapes of the natural frequencies computed by FEM, as a comparison. Here, axial displacement is displayed. Because absolute magnitudes are arbitrary for eigenvectors, the axial displacement values only indicate a relative motion pattern to compare the computed mode shape and measured response qualitatively.
First Natural Frequency Mode
The numerically predicted first natural mode is shown in Figure 4b. As stated above, five very close frequencies were found for , each with another maximum-attenuated blade (see Table 4). In Figure 4b, the bottom blade describes the maximum motion of the first mode. It consists of the flapping of one blade-tip leading edge, and a 180° counter-motion with a smaller amplitude at the neighboring blades. Two blades in advance (clockwise rotation) from the maximum-motion blade, an in-phase motion is detected again.
In the experimental realization of the commercial fan, natural frequencies of the distinct blades were expected to disperse more than in the numerical model, as a result of manufacturing and installation uncertainties. The combination of the five underlying discrete natural modes of the five blades yielded a range of high-amplitude values of around in Figure 3. For OP20, this resulted in the peak amplitude , which is dissolved to in Figure 4a. The same exact mode shape can be distinguished from the LSV data as predicted from FEM in Figure 4b. The maximum-amplitude blade (bottom position) is flanked by two counter-flapping blades, and one blade is in-phase, preceding it by two positions. The first natural frequency is visibly a dominant location of vibration, and attention should be paid not to operate the fan at rotation rates for which significant excitation would coincide with .
Second Natural Frequency Mode
Compared to , the second natural frequency range measurement was lower in amplitude , as shown in Figure 3. The respective predicted mode shape is shown in Figure 5b. Again, the image refers to one of the five associated distinct frequencies in great proximity, and the blade with maximum attenuation is located at the upper right. The mode bends around a spanwise axis in the blade centerline; the leading edge swings in counter-phase to the trailing edge and maximum values at the blade tips. The remaining four non-dominant blades describe a counter-motion to the blade at the upper right, and the most discernible motion patterns at the two blades oppose it (bottom and left in Figure 5b).
In reference to the associated amplitude peak in Figure 3, the relative axial motion is displayed in Figure 5a for OP20. Again, the mode shape resembles the computation very strongly, and the dominant blade is at the upper right. The single difference between the measured vibration response and computation may be discerned in the motion of the remaining four blades. The two opposing blades do not show a counter-motion to the upper-right blade. Instead, such motion is more strongly found in the blades flanking the dominant blade. This discrepancy between the measurement and computation may be attributed to the differences due to manufacturing and installation, as well as the interaction of presumably more distinct individual natural frequencies for each blade.
3.2. Inlet Cross-Flow Influence on Fan Blade Vibration
3.2.1. Spectral Decomposition of Surface-Averaged Vibration
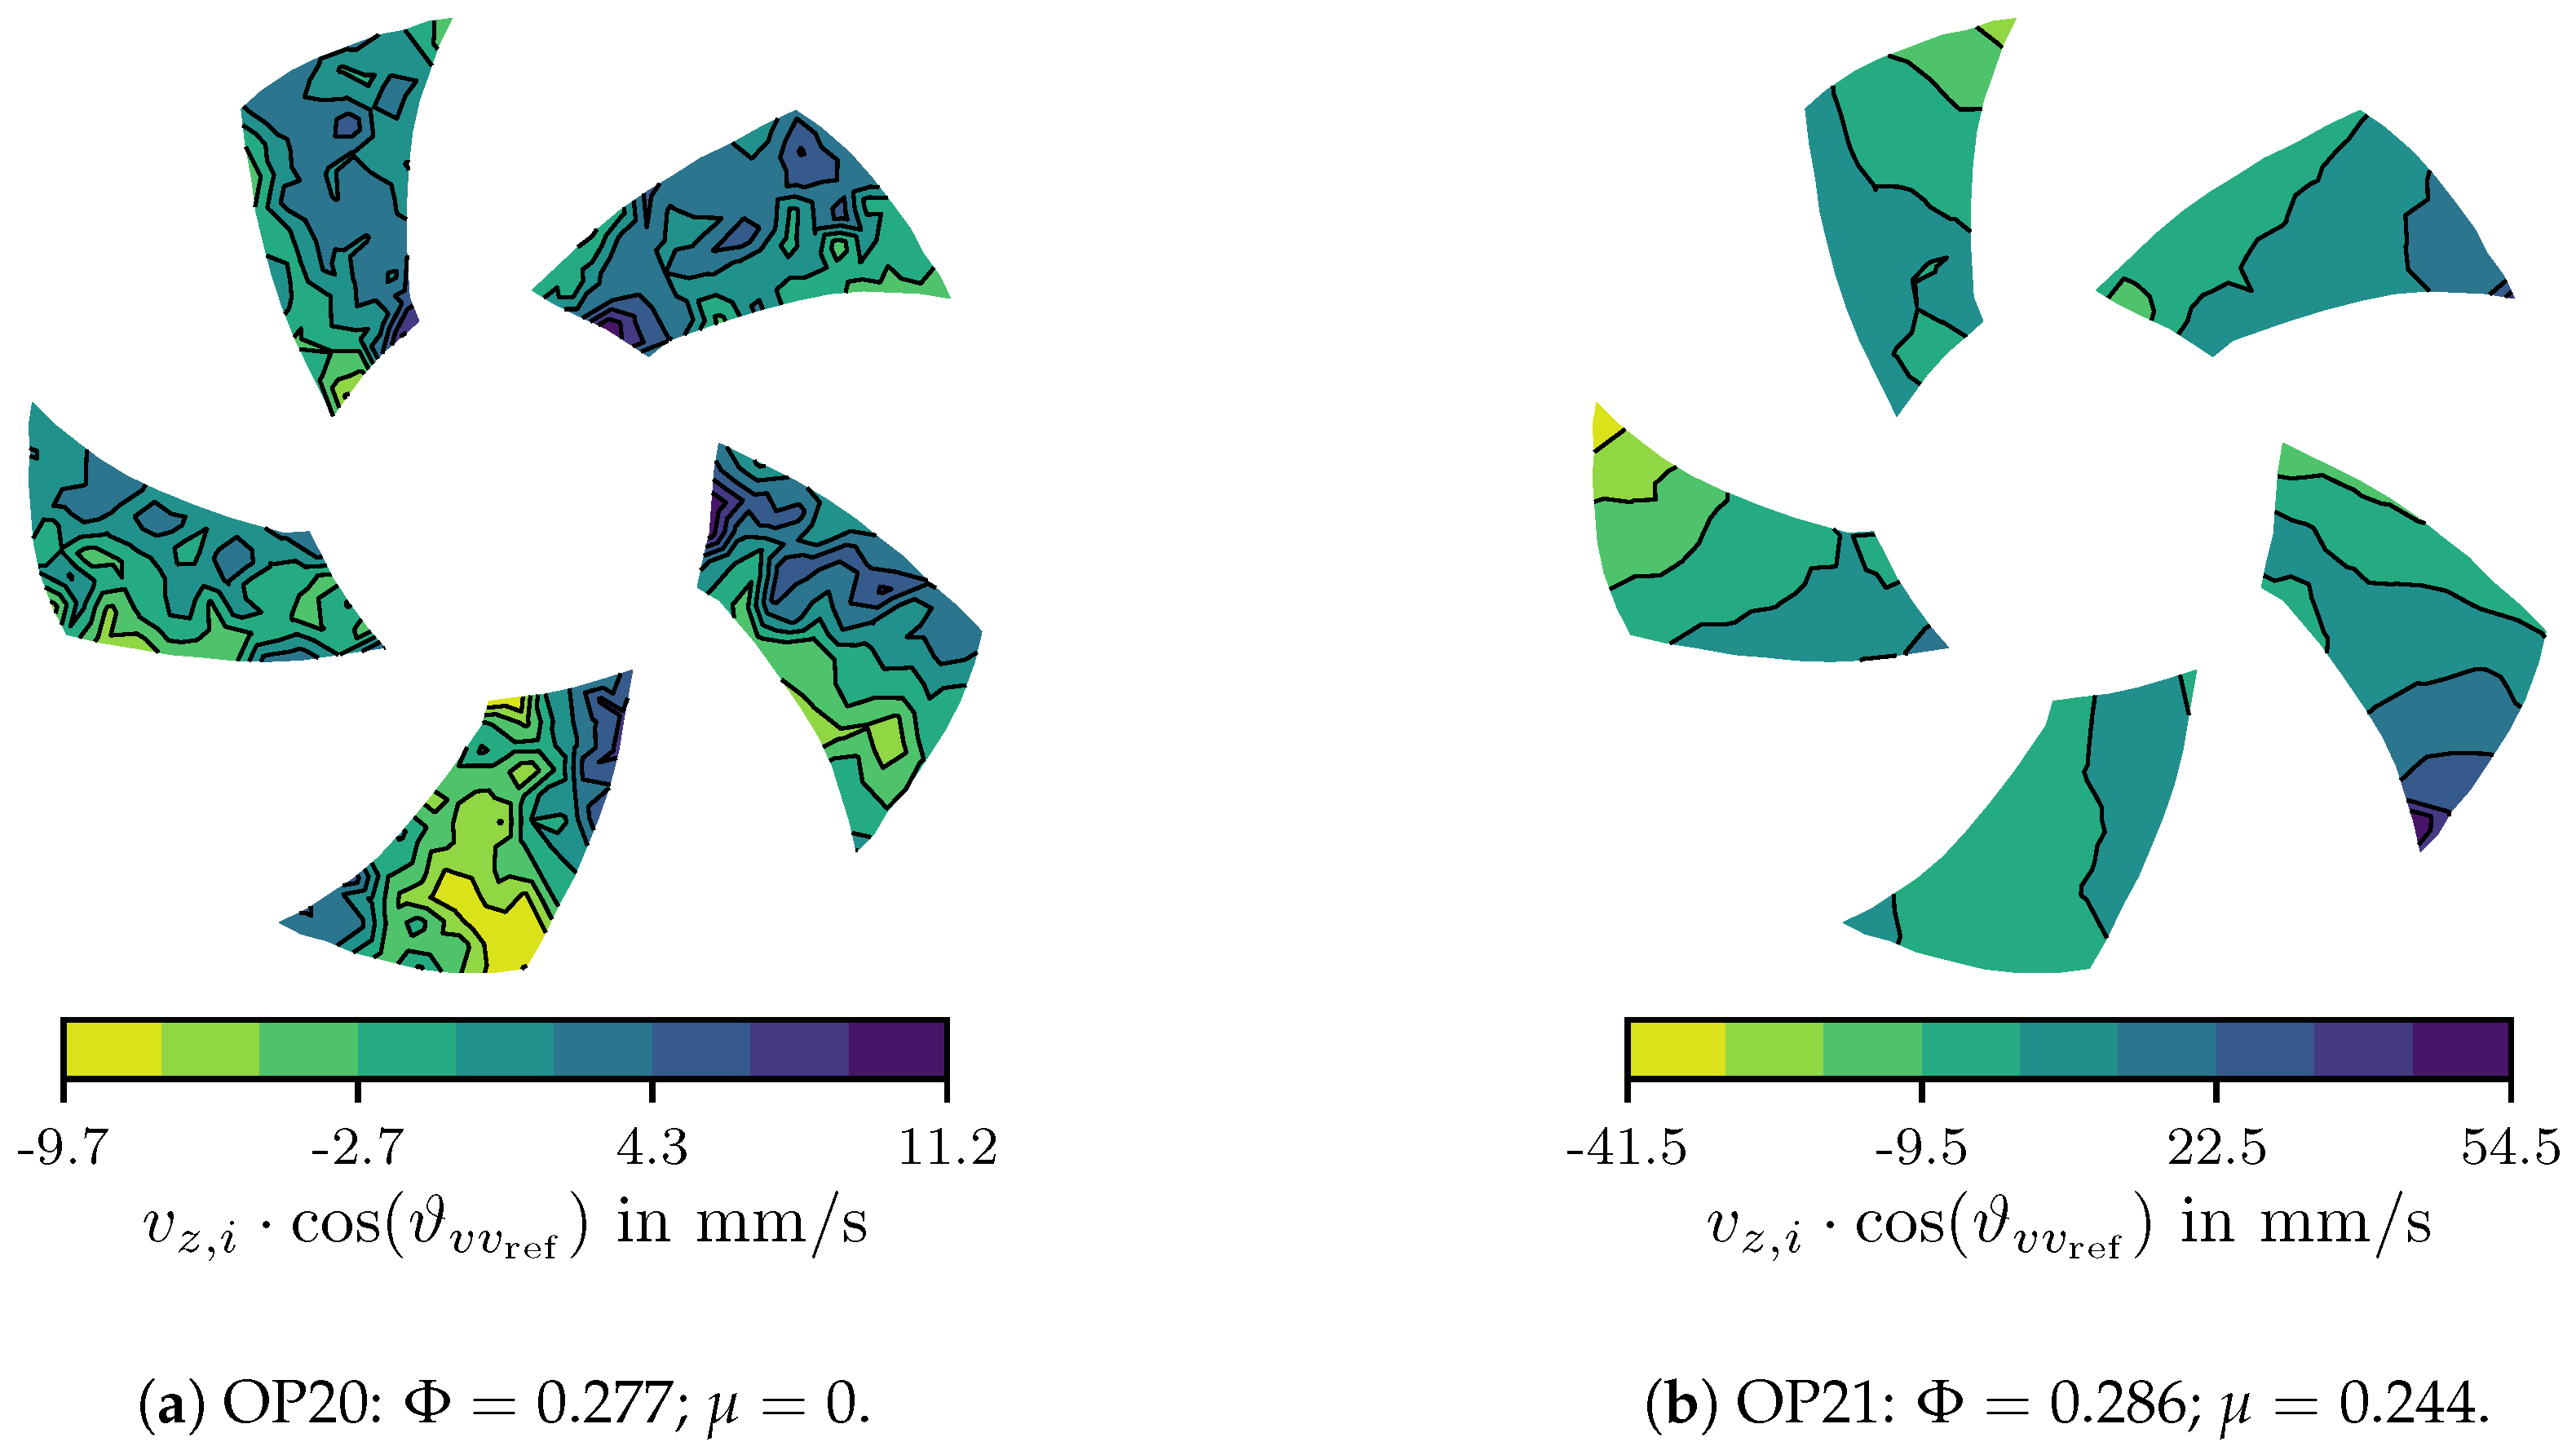
The measured response in the surface-averaged blade vibration to inlet cross-flow is shown by its spectral decomposition in Figure 6 for OP1 and in Figure 7 for OP2. The integral root mean square measures show a distinct increase in the overall blade vibration for OP1 from . With at OP11, was almost double the value of the reference configuration of OP10 (). For OP2, cross-flow increased by about 20% from (OP20) to (OP21).
The greater overall increase in was also reflected by the influence of cross-flow in the spectral decomposition of in Figure 6 and Figure 7. Amplitude gains are found for OP1 in Figure 6 for almost every integer value , but and are the rotation-rate harmonics that are excited dominantly. As a result of the influence of inlet cross-flow, the blade-pass frequency was also measured to become the dominant amplitude peak at the higher flow-rate operating point OP2, as visible in Figure 7. Amplification at was also found for OP21, but to a far lesser magnitude than for OP1 (Figure 6). The previously dominant frequency was not affected in amplitude by cross-flow at either operating point.
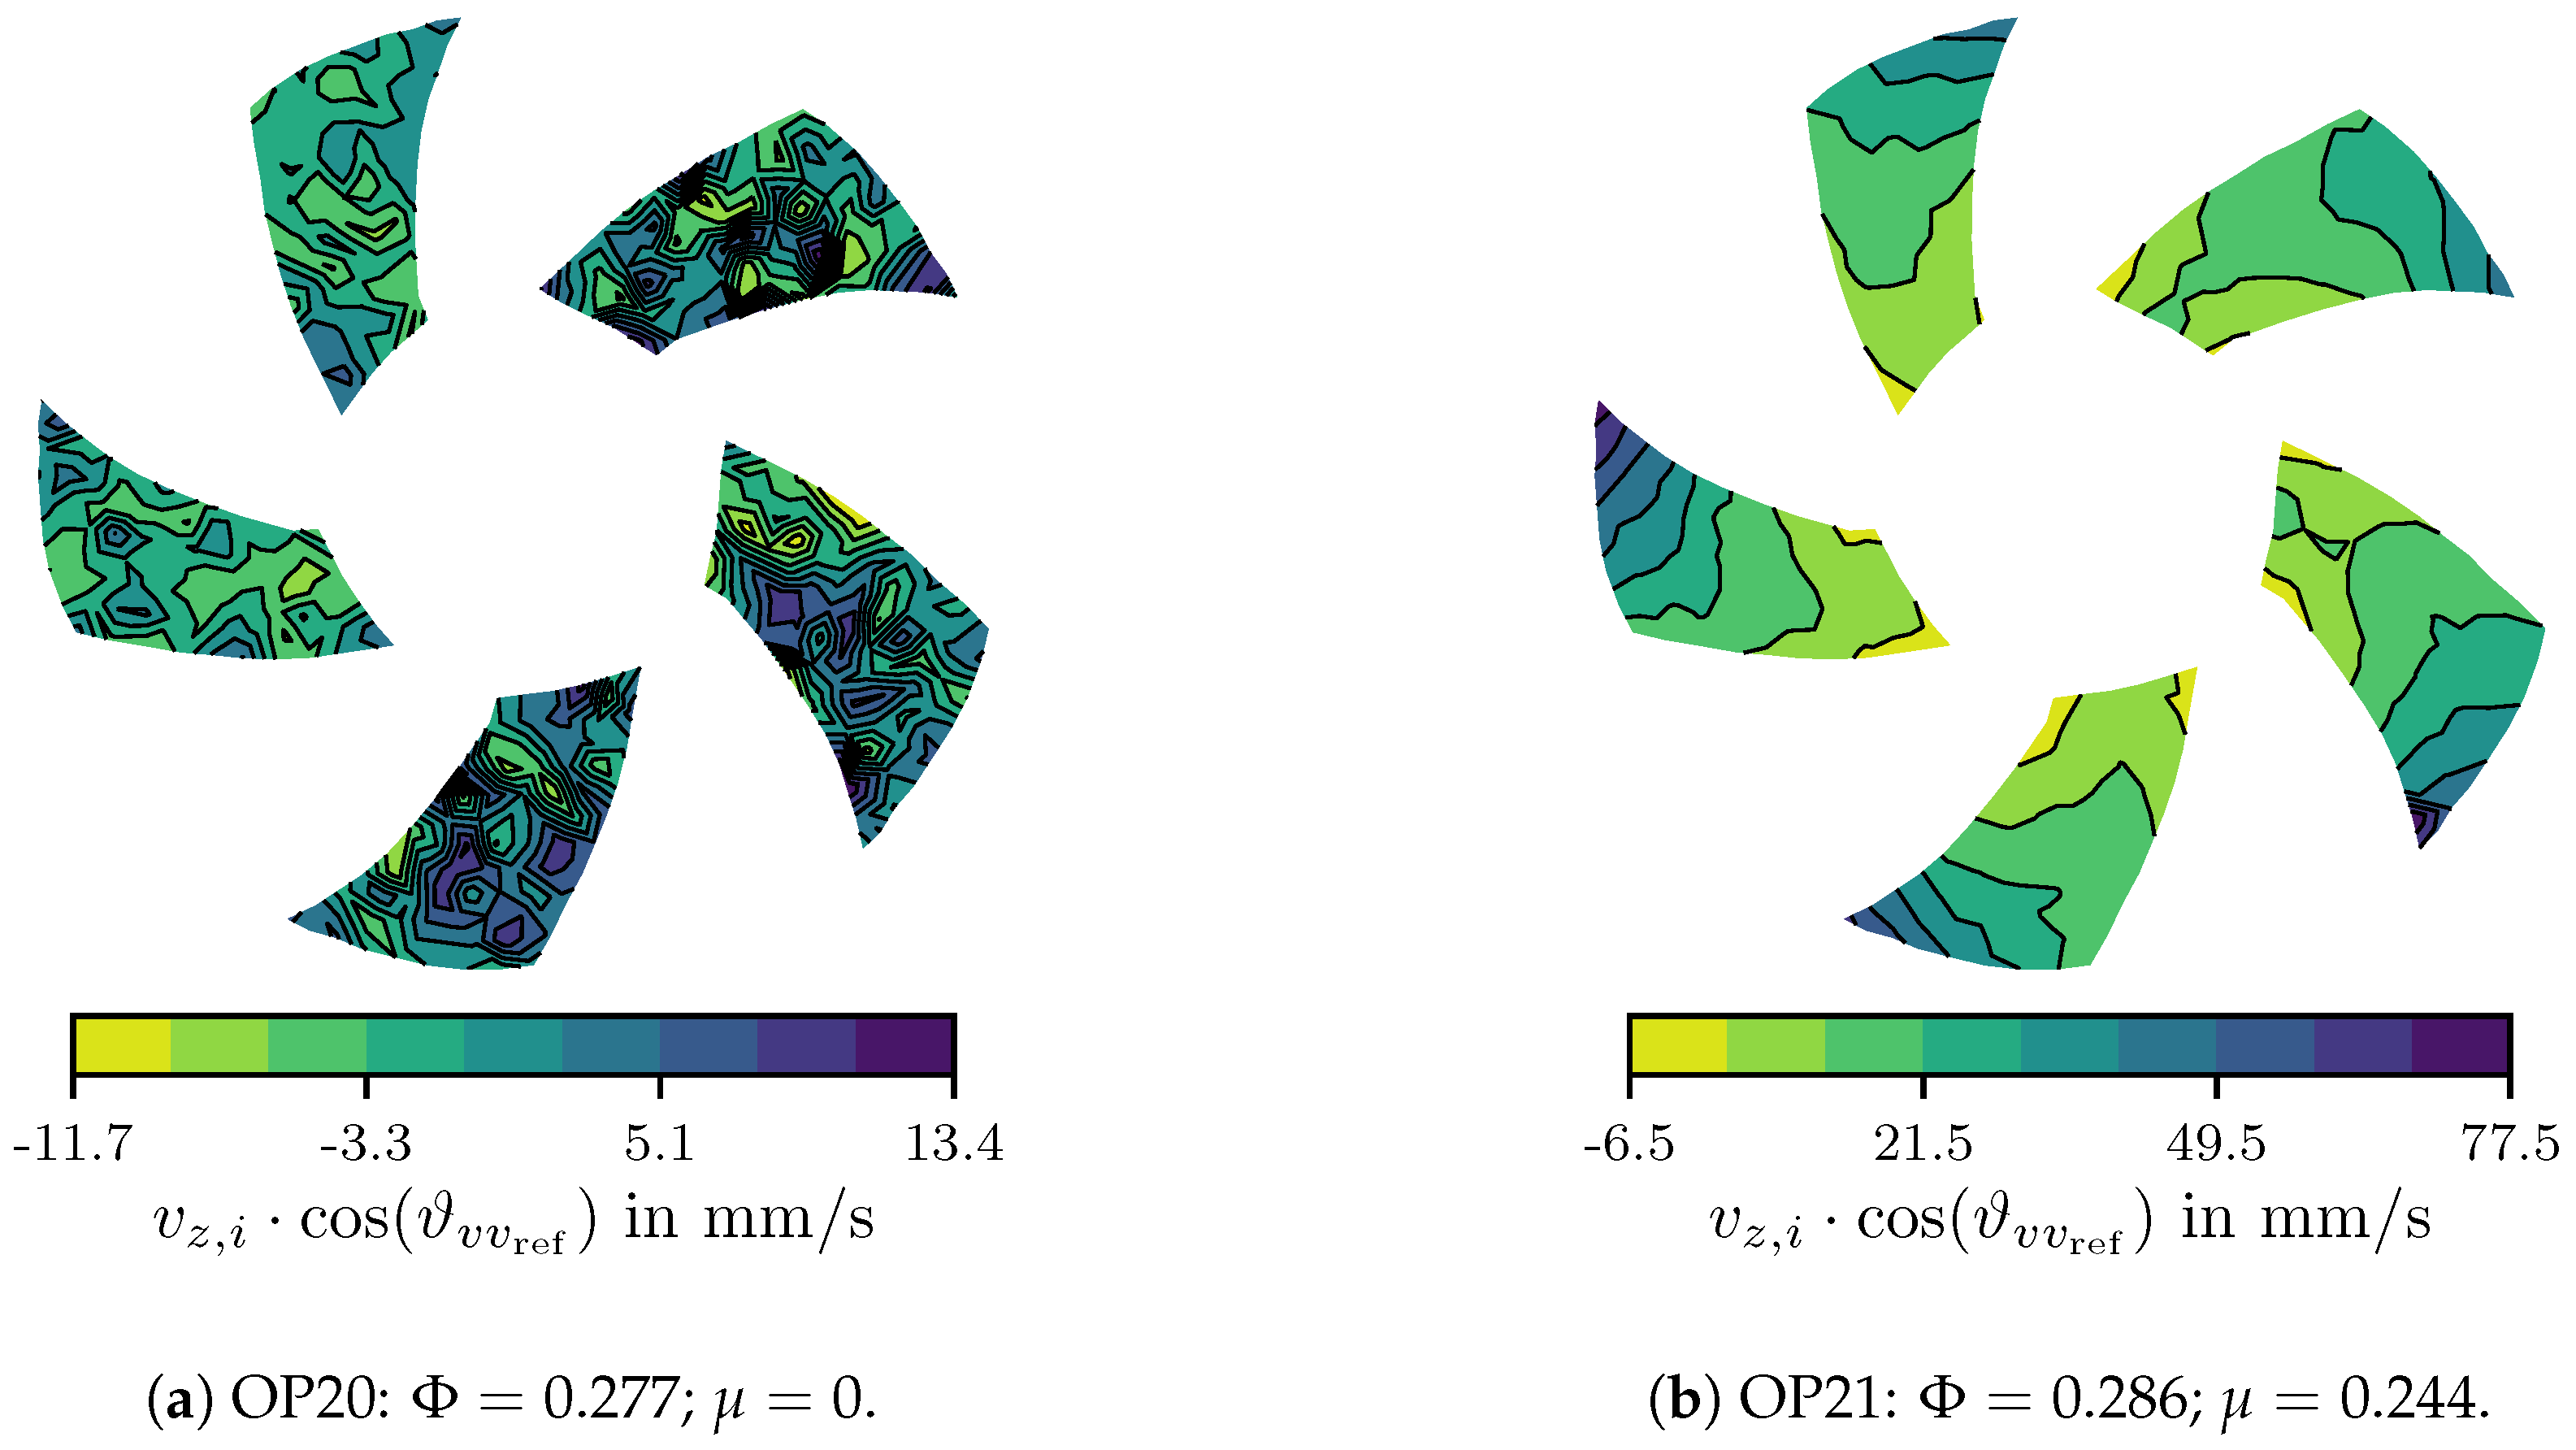
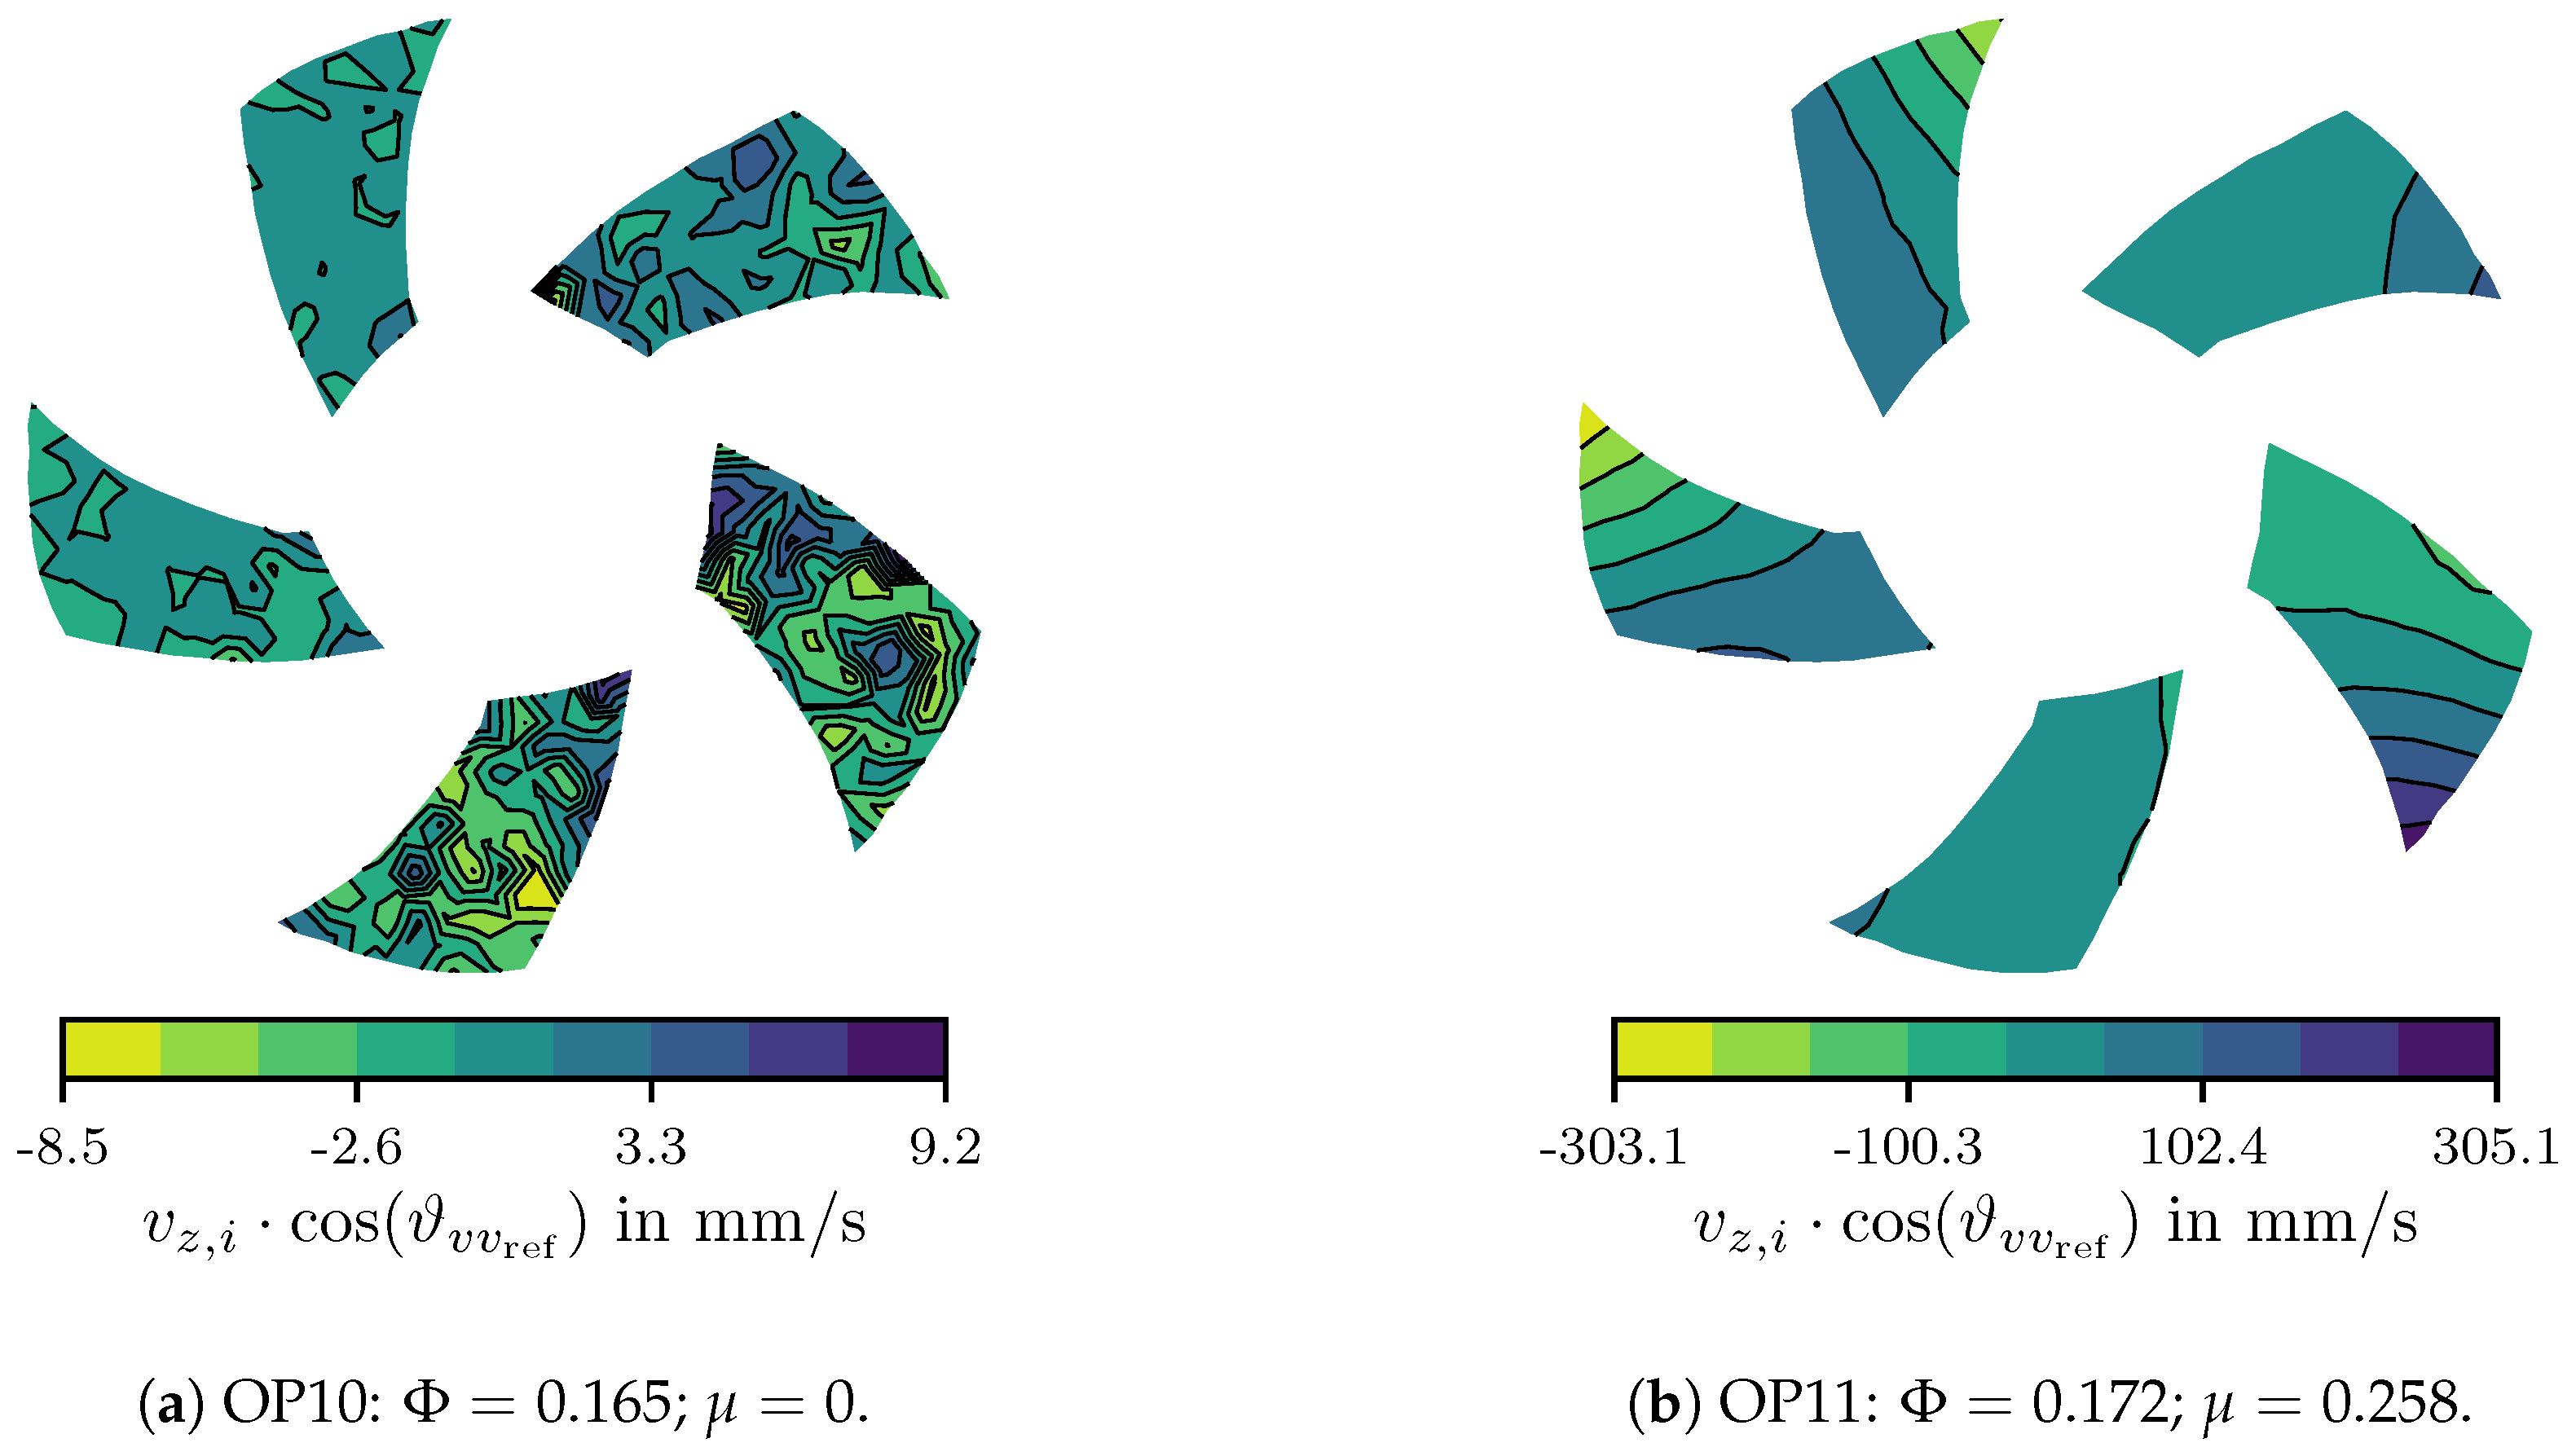
3.2.2. Motion Patterns at Dominant Peaks
The measured relative axial velocity distributions associated with the dominantly increased frequencies and 6 are compared to the reference results in Figure 8, Figure 9, Figure 10 and Figure 11.
In all reference results (on the left in Figure 8, Figure 9, Figure 10 and Figure 11), the distribution of forms no clear pattern, and the amplitude range is comparably low. Considering the logarithmic representation of Figure 6 and Figure 7, the low-amplitude peaks at and 6 are only a little above the base noise level for . In contrast to this, the right-hand graphics in Figure 8, Figure 9, Figure 10 and Figure 11 show very characteristic motion patterns of the fan blades under the influence of inlet cross-flow, and decisively larger amplitudes .
At the blade-pass frequency , both operating points OP11 (Figure 8b) and OP21 (Figure 9b) showed a synchronized blade-tip flapping motion caused by the influence of cross-flow. At the blade tips, large peak-velocity amplitudes can be found. The vibration increase at the blade-pass frequency is not surprising. Because is the frequency at which the fan blades passed the inlet cross-flow, it was also the excitation frequency of the resultant external harmonic forces, causing an in-phase motion of all the blades.
A blade-tip flapping motion was also detected from experimental LSV data at the sixth rotation-rate harmonic . The pattern can be seen especially clearly for the strong excitation for OP11 in Figure 10b, but it can also be seen in Figure 11b for OP21. However, while the single-blade motion with its peak at the leading edge tip resembles the first natural mode shown in Figure 4b, the dominant blade’s neighbors did not move in counter-phase to it. Instead, they have an offset of around 90°, which levels the otherwise similar amplitude at the bottom and upper-right blades in Figure 10b and Figure 11b.
For OP11, the blade root amplitudes are distinctly below zero where the blade tip is at a maximum (bottom-right blade in Figure 10b), and above zero where the blade-tip velocity is a minimum (left and top blades). This indicates a non-negligible stator-motion, that is, a motion of the entire fan at for OP11.
4. Conclusions
Using a co-rotating LSV setup, it was possible to measure the blade vibration of an axial fan with high spectral and spatial resolution. Additionally, the experiment was set up inside a wind tunnel test section to investigate the effect of a uniform inlet cross-flow on the fan blade vibration, which is known to introduce a significant axial asymmetry of the flow field in the rotor section [12,13,14].
Up to this point, similar investigations have only been made numerically [15,16,18] or by using strain gauges on larger-diameter fans [17,24]. Using LSV in this setup, it was possible to gain more insight into the spatial resolution of the fan blade vibration under cross-flow influence, and to compare the resulting motion distributions to numerical mode analysis.
Two distinct fan operating points were examined, with very similar spectral distributions of the surface-averaged blade vibration amplitude in the reference configuration, that is, without ambient flow field. The first and, to a lesser extent, the second natural frequency showed peaks in the vibration amplitude spectrum that fit the predicted natural mode very well in shape, but a stronger blade vibration was measured for the rotation-rate harmonics. Under the influence of inlet cross-flow, the blade-pass frequency and the sixth rotation-rate harmonic were excited strongly, while no significant amplification of the natural frequencies was measured. These findings agree with previously observed cross-flow excitation effects [17,18]. Integral fan blade vibration almost doubled at the low fan flow rate, and increased by 20% at the higher fan flow rate.
While a synchronous flapping of all five blades’ tips was observed to be instigated at the blade-pass frequency, the nature and cause of the sixth rotation rate harmonic’s excitation remains uncertain. It may have been attributed to an additional resonance effect of the combined elastic system, including the fan and its fixation to the duct section, which was not represented in the modal computation setup.
The experimental results help to identify the affected frequencies and respective mode shapes under cross-flow excitation. Measuring capacity restrictions allowed for a few configurations only; clearly it would be interesting to modify, for example, the fan blade-shape, the hub and shroud shape, and cross-flow coefficients. A generic fan is suggested with improved axial alignment to better eliminate perspective distortion. Attention has to be paid to realize a maximum rigid fan-axis fixation in the test rig. For future investigation, it is also advised to not only record the relative phase relation of the measured scanning points, but also to identify the azimuthal position in relation to the cross-flow. Such results could yield a better comparison to the findings of e.g., Muiyser et al. [17,18,24].
Acknowledgments
The research leading to these results received funding from the European Union’s Seventh Framework Programme (FP7/2007-2013) under grant agreement number 256797, within the “MACCSol” project. The authors thank Polytec Inc. for their support.
Author Contributions
Till Heinemann and Stefan Becker conceived and designed the experiments; Till Heinemann performed the experiments, analyzed the data and wrote the paper.
Conflicts of Interest
The authors declare no conflict of interest.
Abbreviations
The following abbreviations are used in this manuscript:
| ACC | Air-cooled condenser |
| LSV | Laser scanning vibrometry |
| FEM | Finite element method |
| OP | Operating point x with () or without () cross-flow |
References
- Maulbetsch, J.S. Cost/Performance Comparisons of Water Conserving Power Plant Cooling Systems. In Proceedings of the International Mechanical Engineering Congress and Exposition, Denver, CO, USA, 11–17 November 2011; pp. 385–390. [Google Scholar]
- Duvenhage, K.; Kröger, D. The influence of wind on the performance of forced draught air-cooled heat exchangers. J. Wind Eng. Industr. Aerodyn. 1996, 62, 259–277. [Google Scholar] [CrossRef]
- Owen, M.; Kröger, D.G. Contributors to increased fan inlet temperature at an air-cooled steam condenser. Appl. Therm. Eng. 2013, 50, 1149–1156. [Google Scholar] [CrossRef]
- Butler, C.; Grimes, R. The effect of wind on the optimal design and performance of a modular air-cooled condenser for a concentrated solar power plant. Energy 2014, 68, 886–895. [Google Scholar] [CrossRef]
- Salta, C.; Kröger, D. Effect of inlet flow distortions on fan performance in forced draught air-cooled heat exchangers. Heat Recovery Syst. CHP 1995, 15, 555–561. [Google Scholar] [CrossRef]
- Owen, M.T.F.; Kröger, D.G. An Investigation of Air-Cooled Steam Condenser Performance Under Windy Conditions Using Computational Fluid Dynamics. J. Eng. Gas. Turb. Power 2011, 133, 064502. [Google Scholar] [CrossRef]
- Borghei, L.; Khoshkho, R.H. Computational fluid dynamics simulation on a thermal power plant with air-cooled condenser. Proc. Inst. Mech. Eng. A J. Power Energy 2012, 226, 837–847. [Google Scholar] [CrossRef]
- Zhang, X.; Chen, H. Performance Forecast of Air-Cooled Steam Condenser under Windy Conditions. J. Energy Eng. 2015, 142, 04015010. [Google Scholar] [CrossRef]
- Xiao, L.; Ge, Z.; Du, X.; Yang, L.; Xu, Z. Operation of air-cooling CHP generating unit under the effect of natural wind. Appl. Therm. Eng. 2016, 107, 827–836. [Google Scholar] [CrossRef]
- Fourie, N.; van der Spuy, S.; von Backström, T. Simulating the effect of wind on the performance of axial flow fans in air-cooled steam condenser systems. J. Therm. Sci. Eng. Appl. 2015, 7, 021011. [Google Scholar] [CrossRef]
- Thiart, G.; von Backström, T. Numerical simulation of the flow field near an axial flow fan operating under distorted inflow conditions. J. Wind Eng. Industr. Aerodyn. 1993, 45, 189–214. [Google Scholar] [CrossRef]
- Meyer, C. Numerical investigation of the effect of inlet flow distortions on forced draught air-cooled heat exchanger performance. Appl. Therm. Eng. 2005, 25, 1634–1649. [Google Scholar] [CrossRef]
- Van der Spuy, S.; von Backström, T.; Kröger, D. Using computational fluid dynamics to simulate multiple axial flow fans in air-cooled steam condensers. In Proceedings of the ASME 2011 Power Conference Collocated with JSME ICOPE 2011, Denver, CO, USA, 12–14 July 2011; pp. 375–383. [Google Scholar]
- Van der Spuy, S.J.; von Backström, T.W. An evaluation of simplified CFD models applied to perimeter fans in air-cooled steam condensers. Proc. Inst. Mech. Eng. Part A J. Power Energy 2015, 229, 948–967. [Google Scholar] [CrossRef]
- Hotchkiss, P.; Meyer, C.; von Backström, T. Numerical investigation into the effect of cross-flow on the performance of axial flow fans in forced draught air-cooled heat exchangers. Appl. Therm. Eng. 2006, 26, 200–208. [Google Scholar] [CrossRef]
- Bredell, J.; Kröger, D.; Thiart, G. Numerical investigation into aerodynamic blade loading in large axial flow fans operating under distorted inflow conditions. R D J. SAIMechE 2006, 22, 11–17. [Google Scholar]
- Muiyser, J.; Els, D.N.; van der Spuy, S.J.; Zapke, A. The determination of fan blade aerodynamic loading from a measured response. In Proceedings of the ASME Turbo Expo 2015: Turbine Technical Conference and Exposition, Montreal, QC, Canada, 15–19 June 2015; Volume 1. [Google Scholar]
- Muiyser, J.; Els, D.N.; van der Spuy, S.J.; Zapke, A. Investigation of Large-Scale Cooling System Fan Blade Vibration. In Proceedings of the ASME Turbo Expo 2014: Turbine Technical Conference and Exposition, Düsseldorf, Germany, 16–20 June 2014. [Google Scholar]
- Heinemann, T.; Bakeberg, C.; Lienhart, H.; Becker, S. Total Pressure Measurements Behind an Axial Ventilator Using a Kiel Probe Array. In Notes on Num Fluid Mech & Multidisc Design; Dillmann, A., Heller, G., Krämer, E., Kreplin, H.P., Nitsche, W., Rist, U., Eds.; New Res in Num & Exp Fluid Mech IX; Springer: Berlin, Germany, 2014; Volume 124, pp. 573–581. [Google Scholar]
- Heinemann, T.; Becker, S. Experimental Investigation of Ambient Wind Influence on the Performance of Axial Fans. In Proceedings of the ASME Turbo Expo 2014: Turbine Technical Conference and Exposition, Düsseldorf, Germany, 16–20 June 2014. [Google Scholar]
- BIPM Joint Committee for Guides in Metrology. Evaluation of Measurement Data—Guide to the Expression of Uncertainty in Measurement JCGM 100: 2008. Available online: http://www.bipm.org/en/publications/guides/gum.html (accessed on 13 March 2017).
- Fioretti, A.; Di Maio, D.; Ewins, D.; Castellini, P.; Tomasini, E. Deflection Shape Reconstructions of a Rotating Five-blade Helicopter Rotor from TLDV Measurements. In AIP Conference Proceedings; AIP: Melville, NY, USA, 2010; Volume 1253, pp. 17–28. [Google Scholar]
- Johansmann, M.; Fritzsche, M.; Schell, J. A New Method for Measurement of Rotating Objects Utilizing Laser Doppler Vibrometry Combined with an Optical Derotator with Focus on Automotive Applications; SAE Technical Paper; SAE International: Troy, MI, USA, 2011. [Google Scholar]
- Muiyser, J.; Van der Spuy, S.; Els, D.; Zapke, A. Measurement of air flow and blade loading at a large-scale cooling system fan. R D J. S. Afr. Inst. Mech. Eng. 2014, 30, 30–38. [Google Scholar]
Figure 1.
Experimental setup in wind tunnel test section.

Figure 2.
Experimental subject axial fan with forward-skewed blades.

Figure 3.
Frequency domain decomposition of surface-averaged blade velocity amplitude over all scan points, without ambient flow. Dotted lines at blade-pass frequency harmonics. Dashed lines indicate the first four natural frequencies of the fan in relation to the respective data set’s rotation rate (matching colors).

Figure 4.
Computed modal shape of first natural frequency in comparison to measured vibration at associated frequency.
Figure 4.
Computed modal shape of first natural frequency in comparison to measured vibration at associated frequency.

Figure 5.
Computed modal shape of second natural frequency in comparison to measured vibration at associated frequency.
Figure 5.
Computed modal shape of second natural frequency in comparison to measured vibration at associated frequency.

Figure 6.
Frequency domain decomposition of cross-flow influence on measured mean surface velocity amplitude at OP1.
Figure 6.
Frequency domain decomposition of cross-flow influence on measured mean surface velocity amplitude at OP1.

Figure 7.
Frequency domain decomposition of cross-flow influence on measured mean surface velocity amplitude at OP2.
Figure 7.
Frequency domain decomposition of cross-flow influence on measured mean surface velocity amplitude at OP2.

Figure 8.
Cross-flow influence on blade vibration at blade-pass frequency ; OP1.
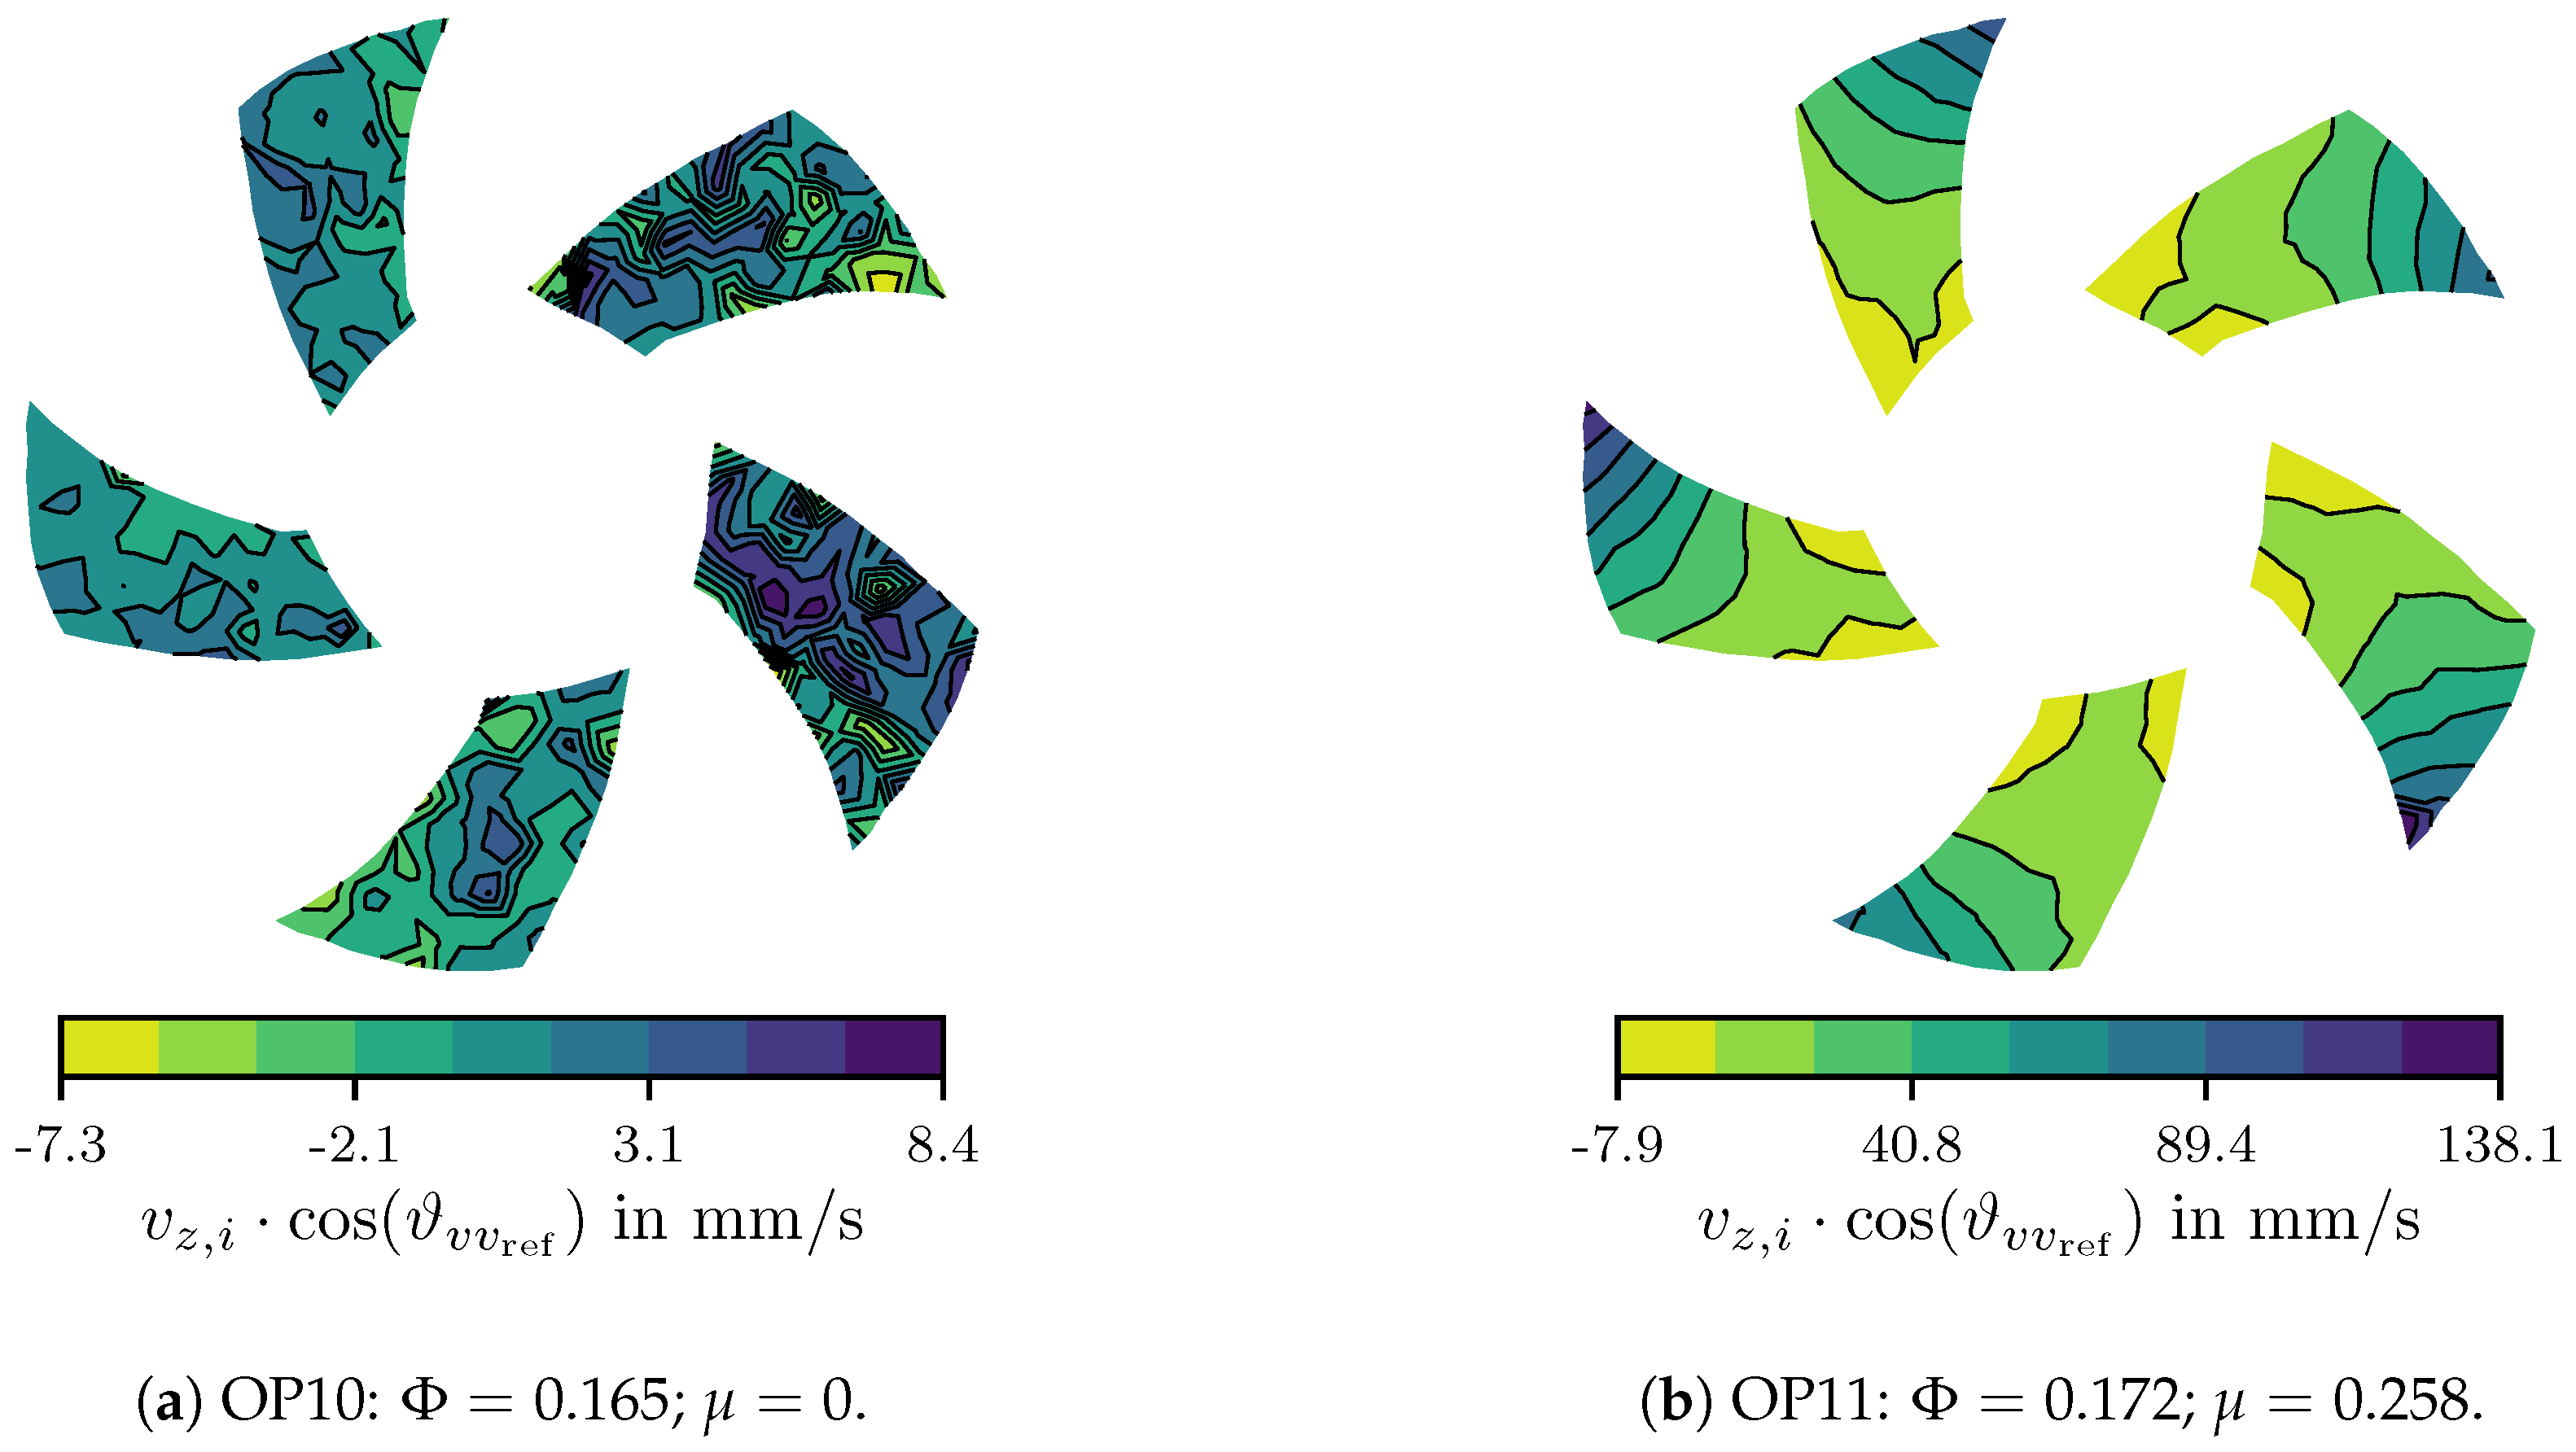
Figure 9.
Cross-flow influence on blade vibration at blade-pass frequency ; OP2.

Figure 10.
Cross-flow influence on blade vibration at ; OP1.

Figure 11.
Cross-flow influence on blade vibration at ; OP2.

Table 1.
Examined operating points (OP) with expanded combined uncertainties (non-dimensional).
| OP1 | OP10 | 0.0 | ||
| OP11 | ||||
| OP2 | OP20 | 0.0 | ||
| OP21 |
Table 2.
Examined operating points with expanded combined uncertainties (dimensional).
| in m/s | in Hz | in m3/s | in Pa | ||
|---|---|---|---|---|---|
| OP1 | OP10 | 0.0 | |||
| OP11 | |||||
| OP2 | OP20 | 0.0 | |||
| OP21 |
Table 3.
First eight mean natural frequencies computed under centripetal load from rotation at , including natural frequency numbers respective to the four operating points. FEM: Finite Element Method.
Table 3.
First eight mean natural frequencies computed under centripetal load from rotation at , including natural frequency numbers respective to the four operating points. FEM: Finite Element Method.
| j | 1 | 2 | 3 | 4 | 5 | 6 | 7 | 8 |
|---|---|---|---|---|---|---|---|---|
| in | 184.7 | 432.8 | 942.8 | 1123 | 1657 | 1948 | 2034 | 2190 |
| (FEM) | 4.181 | 9.796 | 21.34 | 25.42 | 37.51 | 44.09 | 46.04 | 49.57 |
| (OP10) | 4.269 | 10.00 | 21.79 | 25.95 | 38.29 | 45.02 | 47.01 | 50.61 |
| (OP11) | 4.491 | 10.52 | 22.92 | 27.30 | 40.29 | 47.36 | 49.45 | 53.25 |
| (OP20) | 4.181 | 9.796 | 21.34 | 25.42 | 37.51 | 44.09 | 46.04 | 49.57 |
| (OP21) | 4.254 | 9.968 | 21.71 | 25.86 | 38.16 | 44.86 | 46.85 | 50.44 |
Table 4.
First four blade-specific distinct natural frequencies.
| j | in Hz | Distinct Associated Frequency in Hz | ||||
|---|---|---|---|---|---|---|
| Blade 1 | Blade 2 | Blade 3 | Blade 4 | Blade 5 | ||
| 1 | 184.7 | 184.96 | 184.70 | 184.72 | 184.73 | 184.77 |
| 2 | 432.8 | 432.71 | 432.80 | 432.84 | 432.88 | 432.94 |
| 3 | 942.8 | 942.02 | 942.10 | 943.03 | 943.17 | 943.57 |
| 4 | 1123 | 1122.4 | 1122.5 | 1122.6 | 1123.6 | 1123.6 |
© 2017 by the authors. Licensee MDPI, Basel, Switzerland. This article is an open access article distributed under the terms and conditions of the Creative Commons Attribution (CC BY) license (http://creativecommons.org/licenses/by/4.0/).
Share and Cite
MDPI and ACS Style
Heinemann, T.; Becker, S. Axial Fan Blade Vibration Assessment under Inlet Cross-Flow Conditions Using Laser Scanning Vibrometry. Appl. Sci. 2017, 7, 862. https://doi.org/10.3390/app7080862
AMA Style
Heinemann T, Becker S. Axial Fan Blade Vibration Assessment under Inlet Cross-Flow Conditions Using Laser Scanning Vibrometry. Applied Sciences. 2017; 7(8):862. https://doi.org/10.3390/app7080862
Chicago/Turabian StyleHeinemann, Till, and Stefan Becker. 2017. "Axial Fan Blade Vibration Assessment under Inlet Cross-Flow Conditions Using Laser Scanning Vibrometry" Applied Sciences 7, no. 8: 862. https://doi.org/10.3390/app7080862
Note that from the first issue of 2016, this journal uses article numbers instead of page numbers. See further details here.