Effects of Using Different Sources of Remote Sensing and Geographic Information System Data on Urban Stormwater 2D–1D Modeling


1
LEESU, MA 102, École des Ponts, Agro Paris Tech, UPEC, UPE, 77455 Champs-sur-Marne, France
2
LASTIG MATIS, IGN, ENSG, University Paris-Est, F-94160 Saint-Mande, France
3
Faculté de Génie, Université Libanaise, Faculté de Génie, Campus Rafic Hariri 6573, Hadat, Lebanon
*
Author to whom correspondence should be addressed.
Appl. Sci. 2017, 7(9), 904; https://doi.org/10.3390/app7090904
Submission received: 29 July 2017
/
Revised: 29 August 2017
/
Accepted: 31 August 2017
/
Published: 5 September 2017
Abstract
:Remote sensing (RS) and geographic information system (GIS) data is increasingly used in urban stormwater modeling. The undirected use of such data may waste economic and human resources. In order to provide guidance for practitioners to efficiently use different data collection resources, as well as give a reference for future works, this paper aims to assess the effects of using free access GIS data and ad hoc RS data on urban 2D–1D stormwater modeling. The 2D-surface Two-dimensional Runoff, Erosion, and Export model (TREX) model was published in Science of the Total Environment in 2008. The 1D-sewer CANOE (Logiciel intégré de conception et de diagnostic des réseaux d’assainissement) model was published in Journal of Hydrology in 2004. The two models are integrated in the TRENOE (TREX-CANOE) platform. The modeling approach is applied to a small urban catchment near Paris (Le Perreux sur Marne, 0.12 km2). Simulation results reveal that the detailed land-use information derived from multiple data sources is a crucial factor for accurate simulations. Nevertheless, using the very high resolution LiDAR (light detection and ranging) data is not equally significant for the water flow simulations at sewage outlets. Finally, we suggest that using the free access GIS data accompanying the urban sewer network design might be an acceptable low-cost solution for accurate urban 2D–1D stormwater modeling during moderate rainfall events. Further studies of urban stormwater modeling could focus on the development of “suitable” models with “enough” input data, depending on the management/research objectives.
1. Introduction
Over the past 10 years, the increasing availability of distributed remote sensing data has led to a sudden shift of hydrological modeling from data-sparse to data-rich research [1,2]. For instance, high-resolution topographic data and high resolution multi-view aerial images are accessible by using airborne laser altimetry of LiDAR (light detection and ranging), flood extent maps are achievable by using satellites’ synthetic aperture radar (SAR), accurate information on land-use is available by analyzing digital orthophotos. Such data sources allowed a significant breakthrough in urban spatially distributed modeling [3,4,5].
Due to the high heterogeneity of urban surfaces, various city objects such as roads and buildings are hardly specified in urban hydrological models. Consequently, researchers often argue that more detailed remote sensing data should be considered for improving the accuracy of the simulation results [6,7]. Nevertheless, as for the operational modeling applications, the acquisition of such data usually requires expensive ad hoc instruments, ample data storage capacity, and post-treatment analysis [2,8]. Therefore, the efficiency of using highly detailed remote sensing (RS) data for common practices of urban hydrological modeling need to be discussed.
In order to support urban infrastructure design and to control urban non-point source pollutants, the integrated modeling of two-dimensional (2D) surface runoff and one-dimensional (1D) urban sewer network has received growing attention in recent years. Several research models [9,10,11,12] and commercial tools [13,14] have been developed and applied to various case studies. However, current applications of urban 2D/1D models focus on applying increasingly detailed remote sensing data [1,2]. Few studies have attempted to quantify the gains made by using high-resolution data compared with only using free access data sources (for example, low-resolution topographic data and coarse land-use information). A reference for the economical use of data collection efforts and human resources is required for urban stormwater governors and practitioners. Such work is crucial for recognizing the real needs of collecting remote sensing data for improving urban stormwater modeling.
In this study, the 2D-surface TREX (Two-dimensional Runoff, Erosion, and Export model) model [15] and the 1D-sewer CANOE (Logiciel intégré de conception et de diagnostic des réseaux d'assainissement) model [16] are integrated in TRENOE platform. TREX is an open source code, and both the TREX and CANOE models are well-documented, with robust numerical schemes. That makes these models suitable for modifications and adaptations in an urban context. The coupling between TREX and CANOE models is designed to be able to simulate the 2D overland flows and the 1D sewer network routing.
Four different types of remote sensing (RS) and geographic information system (GIS) data are applied to the modeling platform: (i) high resolution topographic data derived from LiDAR; (ii) low-resolution digital terrain model (DTM) data obtained from the free access database; (iii) detailed land-use data proceeded from multiple data sources; (iv) coarse land-use information extracted from the free access database. The influences of using such RS and GIS data on urban stormwater 2D–1D modeling are analyzed for a small urban catchment near Paris (Le Perreux sur Marne, Val de Marne, France). This paper provides the first rigorous discussion on the use of RS and GIS data from different sources for urban 2D–1D modeling.
2. Materials and Methods
2.1. Model Description
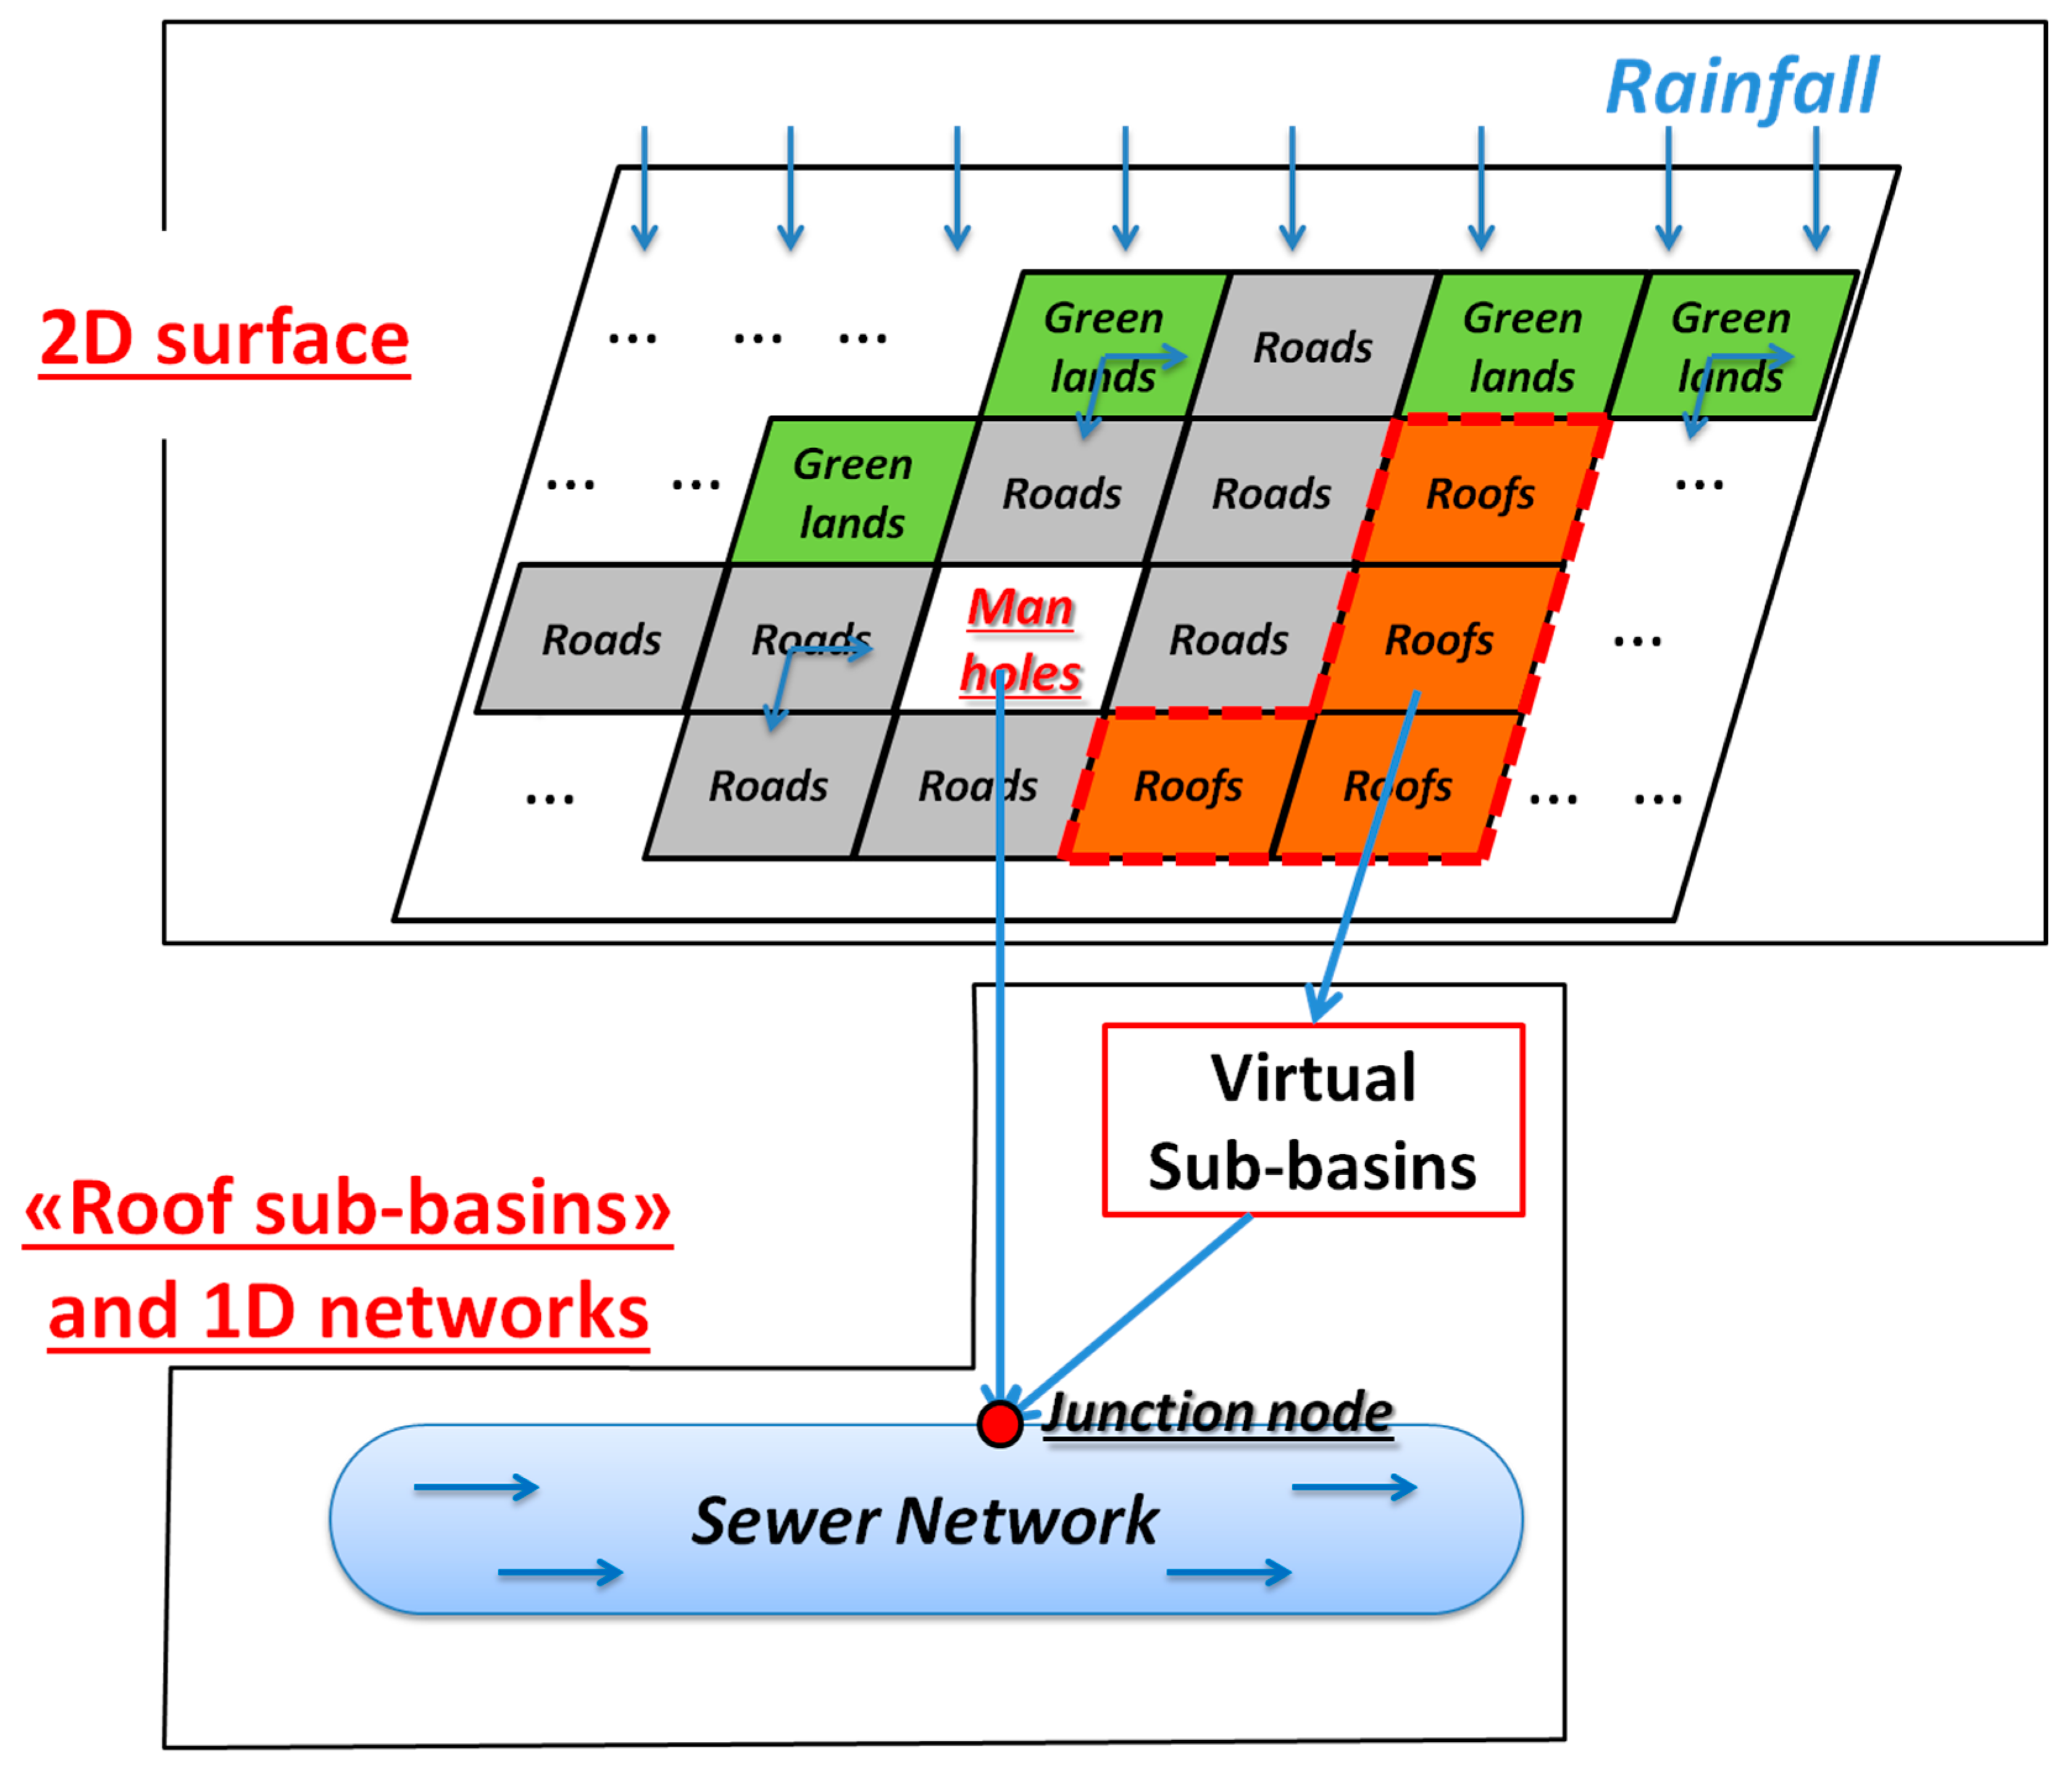
The physically-based 2D TREX model [15], the 1D pipe routing, and the sub-basin components of the CANOE model [16] are integrated in the TRENOE platform. As for the land-phase hydrology, TRENOE uses the diffusive wave approximation of shallow water equations (SW) for surface runoff modeling, the Green & Ampt method [17] for infiltration calculations, and the canopy storage for interception estimations. An explicit finite-difference scheme (Euler’s method) is applied for numerical solution. Otherwise, the building roofs are represented separately from the 2D surface model. Since the real elevation of roofs are generally not described in digital terrain model (DTM) data for urban areas, a realistic adaptation consists in raising the building elevations above the land surface at the step of input data pre-treatment. Besides, as most roofs are directly connected to the sewer network in the studied catchment, the grid cells of roofs that are linked to the same sewer node (the nearest) are assembled as virtual sub-basins in the CANOE model. The areas of these sub-basins are equal to the total area of the connected roof cells. The non-linear reservoir method is then applied to simulate the rainfall–runoff relations for each conceptual sub-basin. These sewer nodes are the connecting points between the 2D surface module and the 1D network module in the TRENOE platform, and are called “junction nodes”. At each time-step, TRENOE removes water from the grid cells of “manholes” (sewer inlets, sewer drain grills) and simultaneously makes it enter into the corresponding “junction nodes”. Additionally, the flow routing process in the sewer networks is computed by the 1D kinematic wave approximation of the shallow water equations and solved by a four-point implicit finite-difference scheme due to Preismann [18] (Equation (1)). The model scheme is illustrated in Figure 1.
With the discharge (), the cross section of the flow (), the infiltration () and the rainfall ().
2.2. Study Site
The study site is located in the eastern suburb of Paris (Le Perreux sur Marne, Val de Marne, France). This area is a typical residential zone in the Paris region, characterized by a busy main street in the Eastern Paris (more than 30,000 vehicles per day). The total area of this catchment is 12 ha, about 70% of the surface is impervious, and the roofs represent about 35% of the entire catchment. The western section has a higher incline than the eastern side, with an average slope of less than 2% (Figure 2).
The stormwater sewer system consists of 1156 m major pipes (vertical ellipse, 2.3 m × 1.3 m) along the main street, and nearly 1000 m minor pipes (circular, 0.3 m × 0.3 m) used to connect manholes to the major pipes. In total, there are 35 manholes in the studied catchment. The sewage outlet is located at the northeastern edge of the presented sewer network, where the flow is continuously monitored by a Nivus Flowmeter with 2-min time intervals.
2.3. Rainfall Event Data
A tipping-bucket rain gauge is installed on the roof of a building close to the urban catchment (see Figure 2). The rain gauge has a resolution of 0.1 mm. As the study area is quite small, rainfall is considered as homogeneous within the basin. The monitoring was performed between 20 September 2014 and 27 April 2015. In our previous work [19], 56 rainfall events were identified during this study period, in which more than 88% of the events had a rain depth of less than 8 mm, nearly 89% of the events had a mean intensity smaller than 3 mm/h, and 87% of the events had a duration shorter than 7 h.
In this study, six typical rainfall events were selected for model assessment. These rainfall events can be considered as representative of various hydrological situtations on the catchment. The characteristics of the six selected rainfall events are illustrated in Table 1.
2.4. LiDAR and Topographic Data
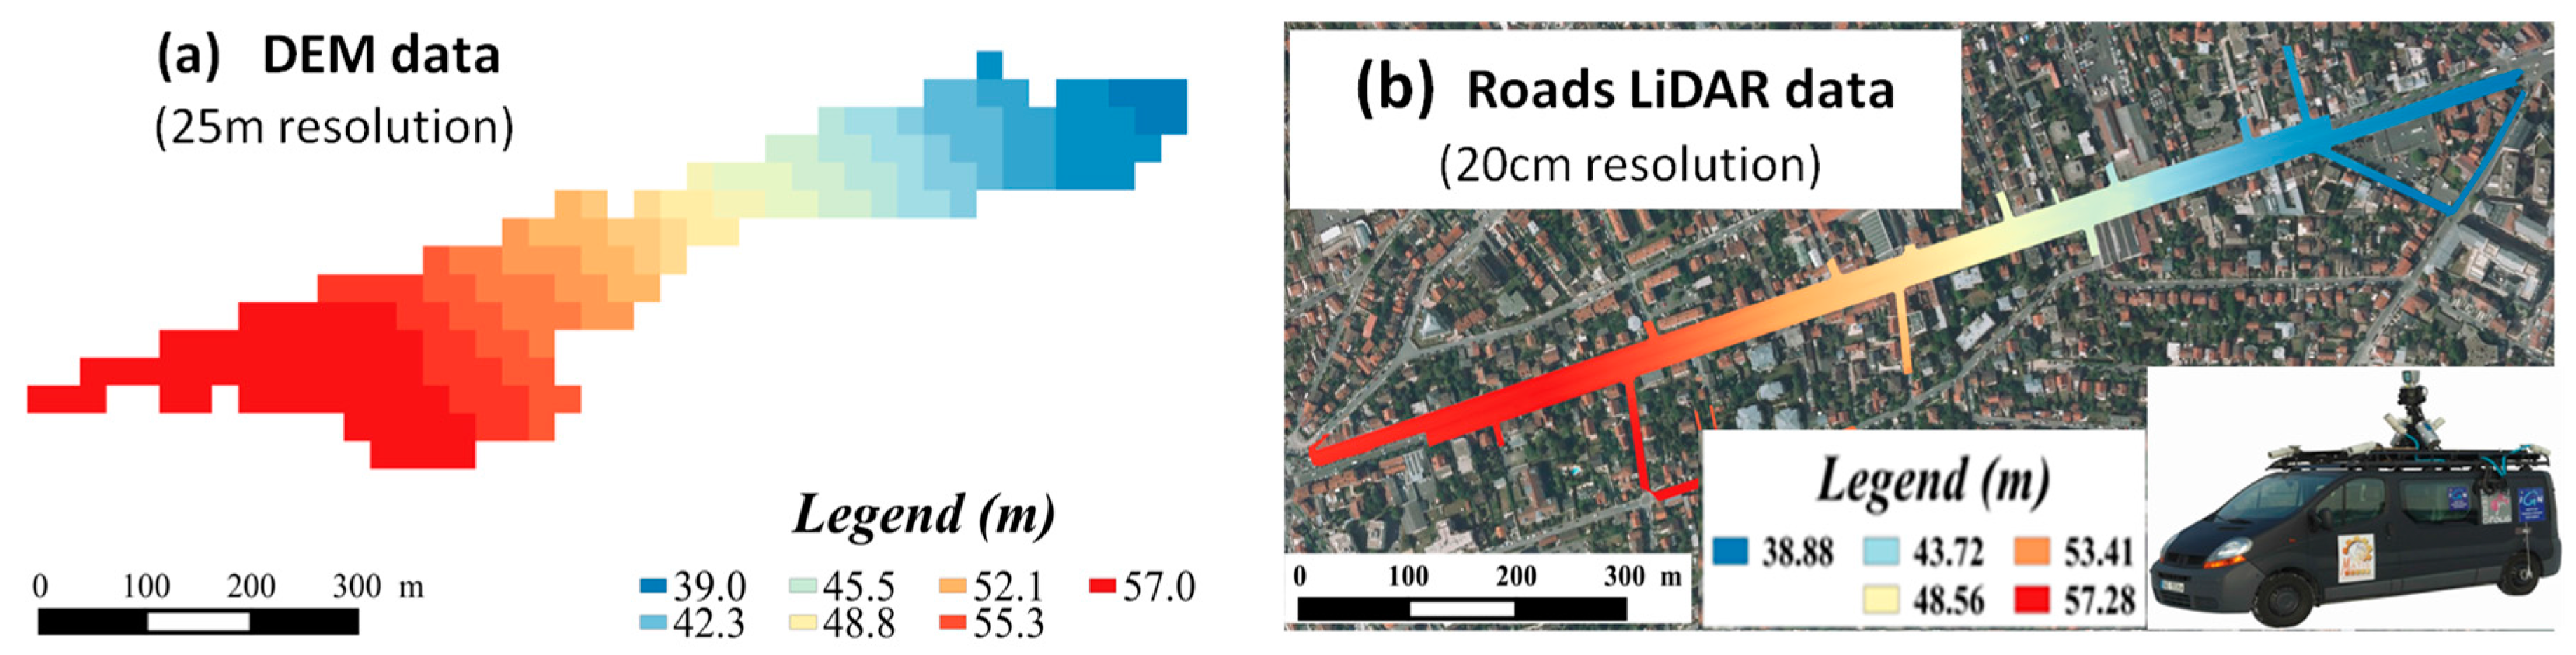
In Europe, the DTM databases are accessible for public research centres (Directive 2007/2/EC of the European Parliament and of the Council). As for France, the National Institute of Geographic and Forestry Information (IGN) provides the large-scale reference database (RGE®, http://professionnels.ign.fr/rge) that contains DTM data of 25 m resolution for the whole country. Figure 3a shows a part of this data on our study site. This dataset is easy to achieve and demands no extra cost, hence have evident value for operational purposes.
In addition to this available DTM data, a mobile mapping system (MMS) called Stereopolis [20] has been applied over the study area in order to produce a 3D point cloud of the road topography with centimetric resolution. Whereas the measured 3D cloud not only contains the topography, but also objects such as trees, urban furniture, and moving objects such as vehicles and pedestrians. A semi-automatic modeling approach was then developed in order to filter out the non-terrain point [21]. At the end, a 20 cm resolution topographic data of road and sidewalks was accomplished (Figure 3b).
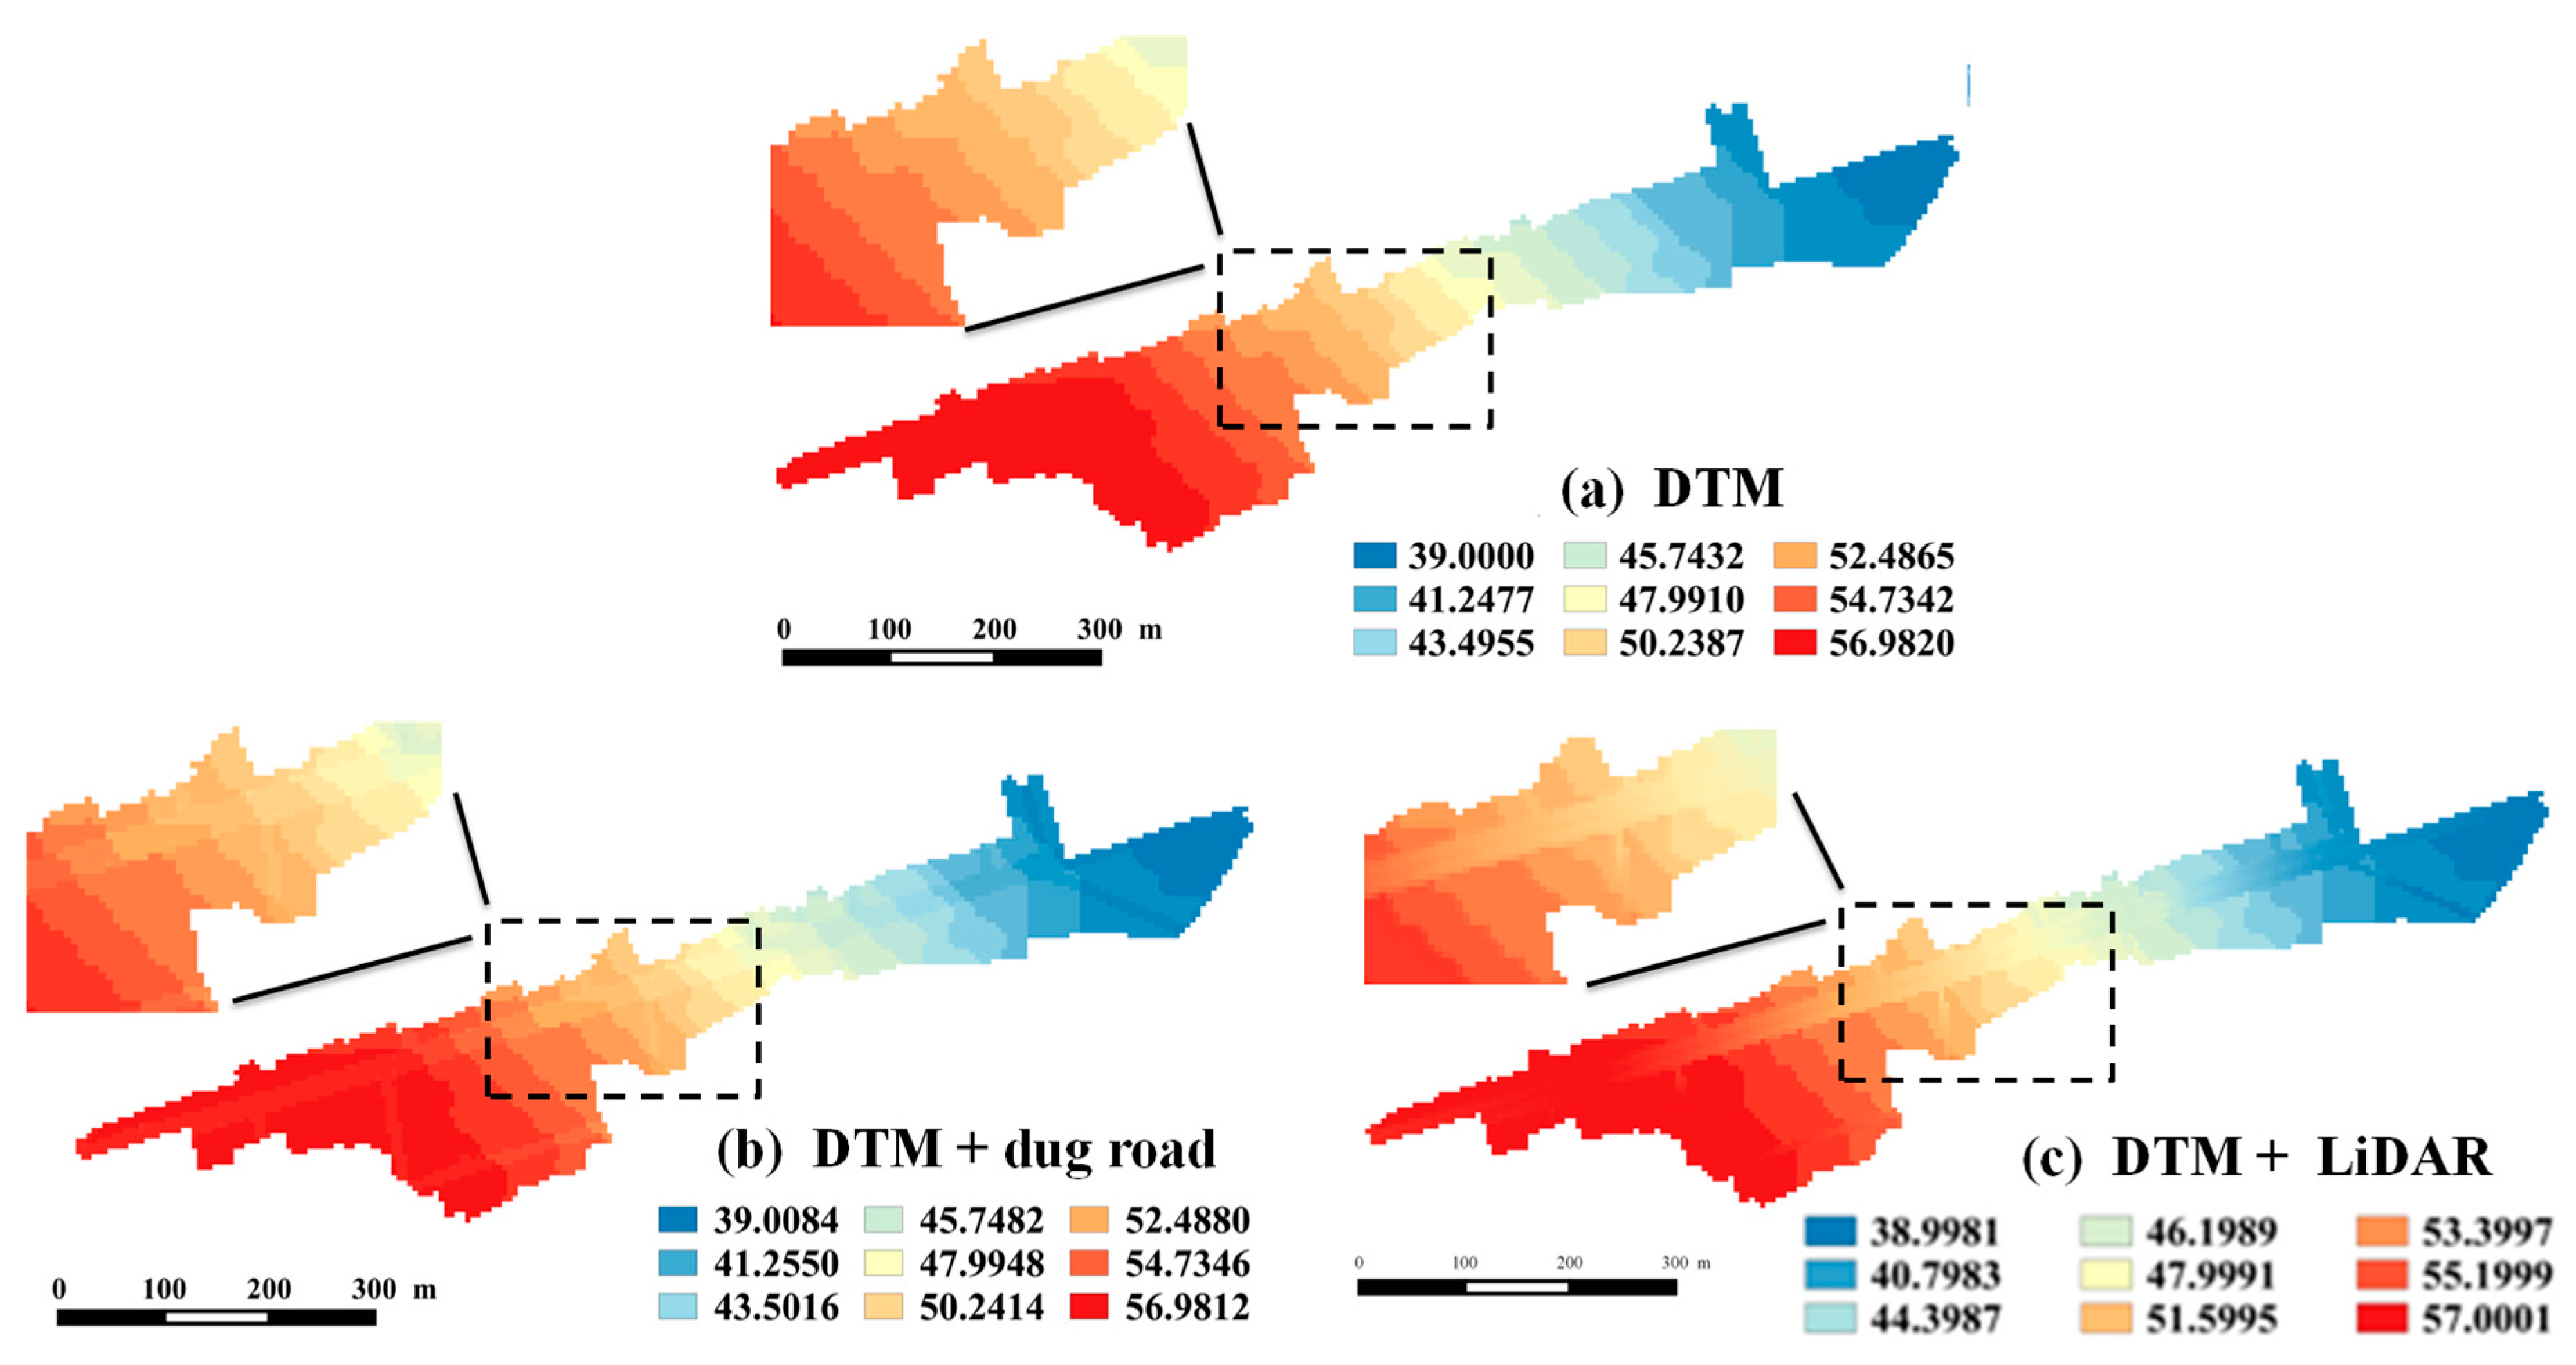
Following Gallegos et al. and Fewtrell et al. [4,8], the proper spatial resolution for 2D modeling of the urban surface can be set by considering the minimum distance between buildings and one third of the street width. For our case study, this distance can be estimated to 5 m. In order to assess the influence of high-resolution LiDAR data on urban 2D/1D modeling, three typical configurations are tested: (i) directly resampling the DTM data (25 m) to 5 m resolution, called “DTM”; (ii) resampling the DTM data (25 m) to 5 m resolution, and then lowering the identified road grid cells by 50 cm, called “DTM—dug road”; (iii) resampling the road LiDAR data (20 cm) and the DTM data (25 m) to 5 m resolution, then fusing the two types of data together, which will heretofore be called “DTM + LiDAR”. The three different topographic scenarios are illustrated in Figure 4.
2.5. Landuse Information
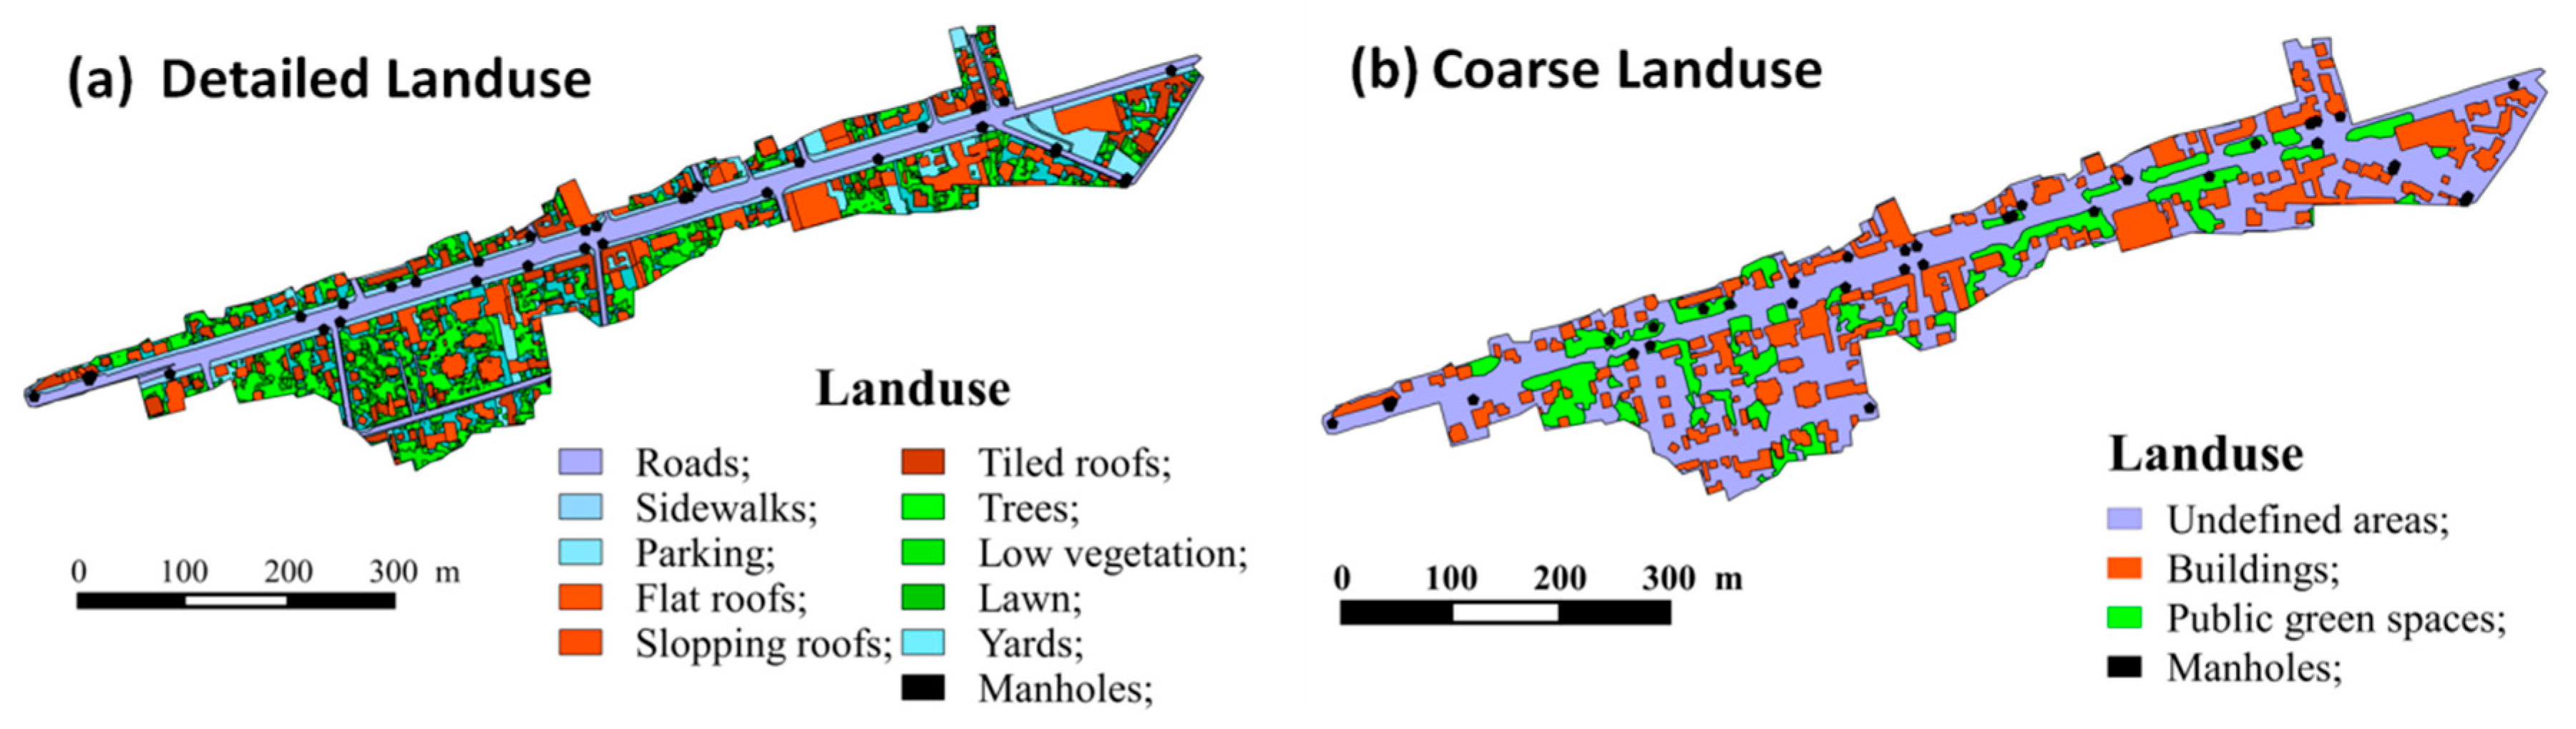
In order to obtain more finely detailed information regarding urban land-use, different land-use classes can be identified through combining multiple data sources such as aerial orthophotos, LiDAR data, and a publicly accessible database. This is the first configuration of the input land-use data for the TRENOE platform (Figure 5a), which is noted as “detailed land-use”. In detailed land-use, the road surfaces are traced by using aerial orthophotos; as a result, the sidewalks can be identified automatically as the areas between buildings and roads. Then, inside every cadastral plot, the complement of buildings was considered. Orthophoto identification was applied in order to classify those parts into different classes such as bituminous surface, lawn, and vegetation. LiDAR data was used for recognizing low vegetation from trees. Moreover, an automatic image segmentation tool [22] was applied to aerial orthophotos for recognizing different types building roofs, such as flat, slopping, and tiled roofs. As for the overlapped areas within different data sources, a specific priority order of land-uses is defined by considering the hydrologic connectivity in urban landscapes, followed by roads, sidewalks, parking lots, various types of roofs, trees, grass, and others. Additionally, since the manholes have a key role in the coupling between the 2D surface and 1D network models, they are represented as a specific class of land-use in the TRENOE model.
The second configuration of the input land-use data is simply extracted from the BD-TOPO® database, which is free access and much easier to achieve than the multiple data sources; this data is noted as “coarse land-use” (Figure 5b). The BD-TOPO® database only contains the information of buildings that are more than 20 m2, and the urban public green spaces. The undefined areas that are considered impermeable zones include roads, sidewalks, and parking lots.
2.6. Configuration of Parameters for Urban Areas
In order to reduce the calibration efforts, several parameter values are determined from bibliographic works. For instance, the initial loss for different urban land-uses are defined by considering the findings of Xiao et al. [23]; besides, in accordance with the propositions of Rossman [24], we fixed two parameters for the Green and Ampt method [17] (suction head at the wetting front and the residual soil moisture content), as well as three parameters used in the sewer network module, including the initial loss of roof wetting, the Manning’s N value for conduits, and virtual sub-basins. The trial and error procedure is performed for calibrating the Manning’s N value and the saturated conductivities (Ksat) by using the DTM + LiDAR topographic data and the detailed land-use information. Parameters are calibrated for the event of 15 November 2014, and then validated for the other studied rainfall events. The Nash–Sutcliffe coefficient (NSE) [25] are used to evaluate the model performance. The optimized Manning’s N is equal to 0.015 and 0.2 for the impervious and pervious surfaces, respectively. The calibrated Ksat is equal to 1.0 × 10⁻⁸ m/s and 1.0 × 10⁻⁵ m/s for the impervious and pervious surfaces, respectively. Comparing with the commonly used parameter values in literature [10,24,26], these parameter values are in agreement with typical values for such land-uses.
3. Results and Discussion
3.1. Parameter Values and Reference Simulations
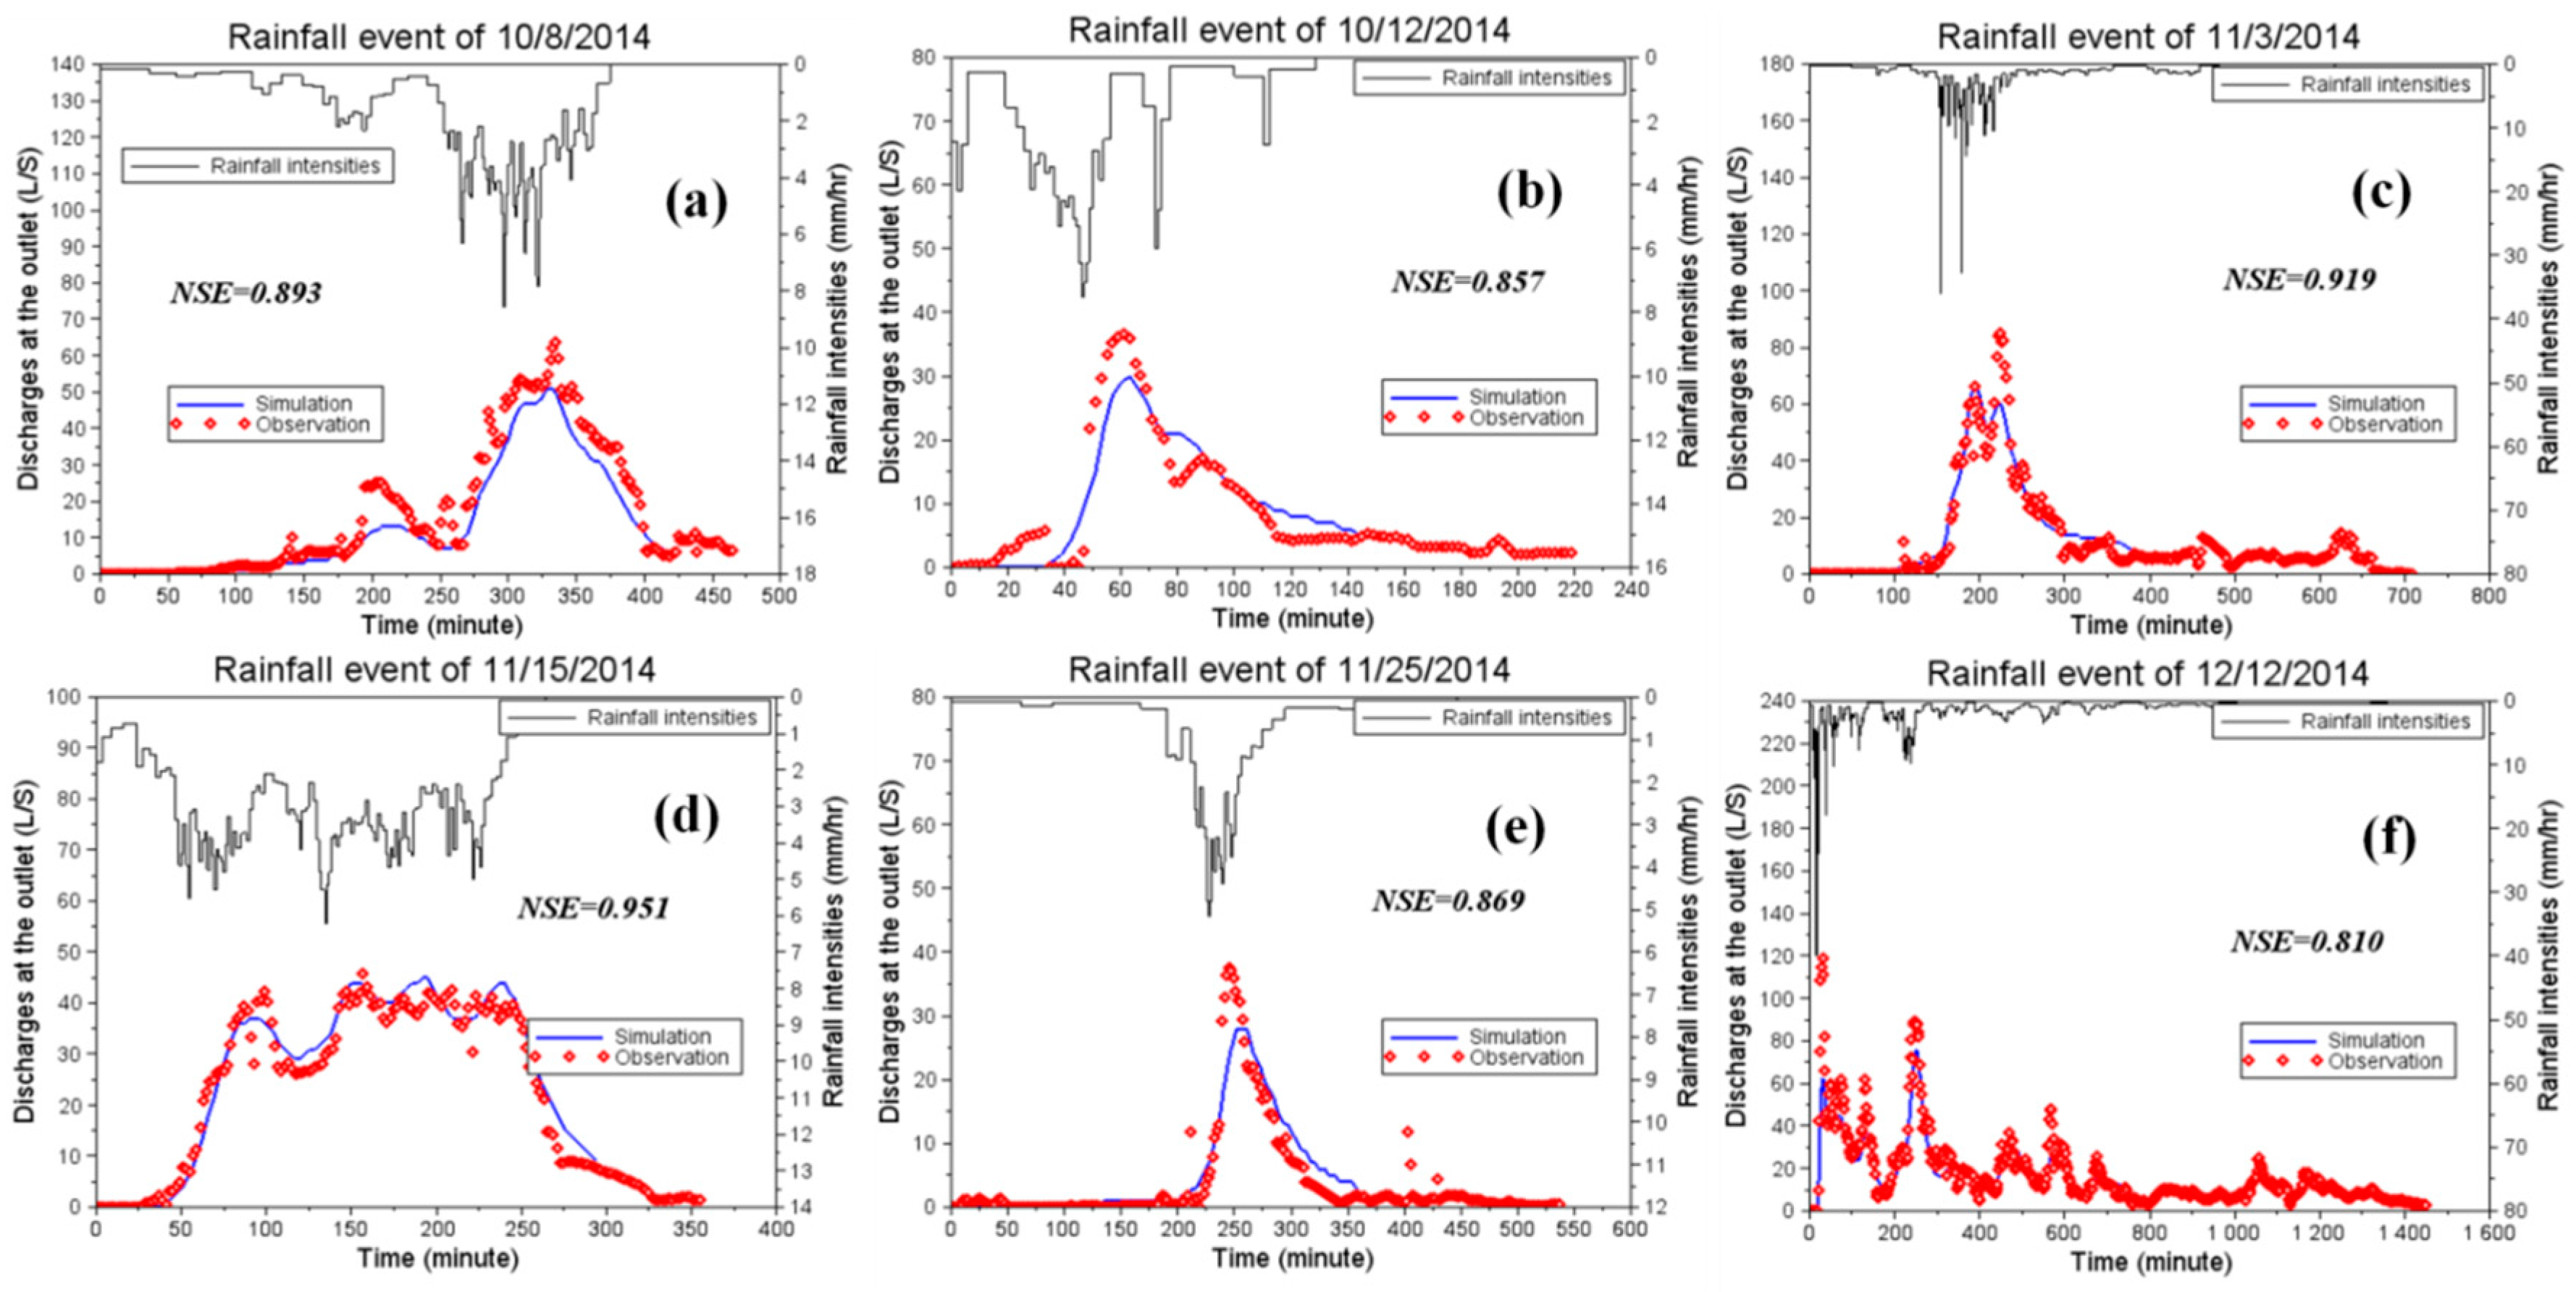
The optimized parameter values are listed in Table 2. Compared with the continuous measurements of water flow at the network outlet, the performance of the urban 2D/1D modeling can be assessed. The simulation results are illustrated in Figure 6.
According to the simulation results in Figure 6, the performance of the water flow simulation with the DTM + LiDAR topographic data and detailed land-use information is satisfying. The NSE values for all of the six studied rainfall events are greater than 0.8, which indicates a quite satisfactory modeling performance for the investigated urban catchment. This encouraging result confirms that the 2D-surface and 1D-sewer TRENOE model is a promising modeling approach for urban stormwater quantitative simulations.
3.2. Effects of Using Free Access Topographic and Landuse Data
Considering the simulations using “DTM + LiDAR topography” and detailed land-use (DTM_LiDAR + DL) as reference, the effects of applying free access topographic (DTM-derived) and land-use (extracted from BD-TOPO®) data on model outputs can be respectively evaluated by comparing the reference simulations with simulations using (i) DTM topography and detailed land-use (DTM + DL); (ii) DTM—dug road topography and detailed land-use (DTM_dug + DL); and (iii) DTM + LiDAR topography and coarse land-use (DTM_LiDAR + CL). The mean deviation (MD) and relative mean deviation (RMD) coefficients are used as performance indicators to quantify the differences between the references and the scenario simulations (Equations (2) and (3)):
where n is the total number of simulated discharges during the rainfall events, xi and xref,i are the ith output of the scenario and reference simulation, respectively, and is the mean discharge of the reference simulation.
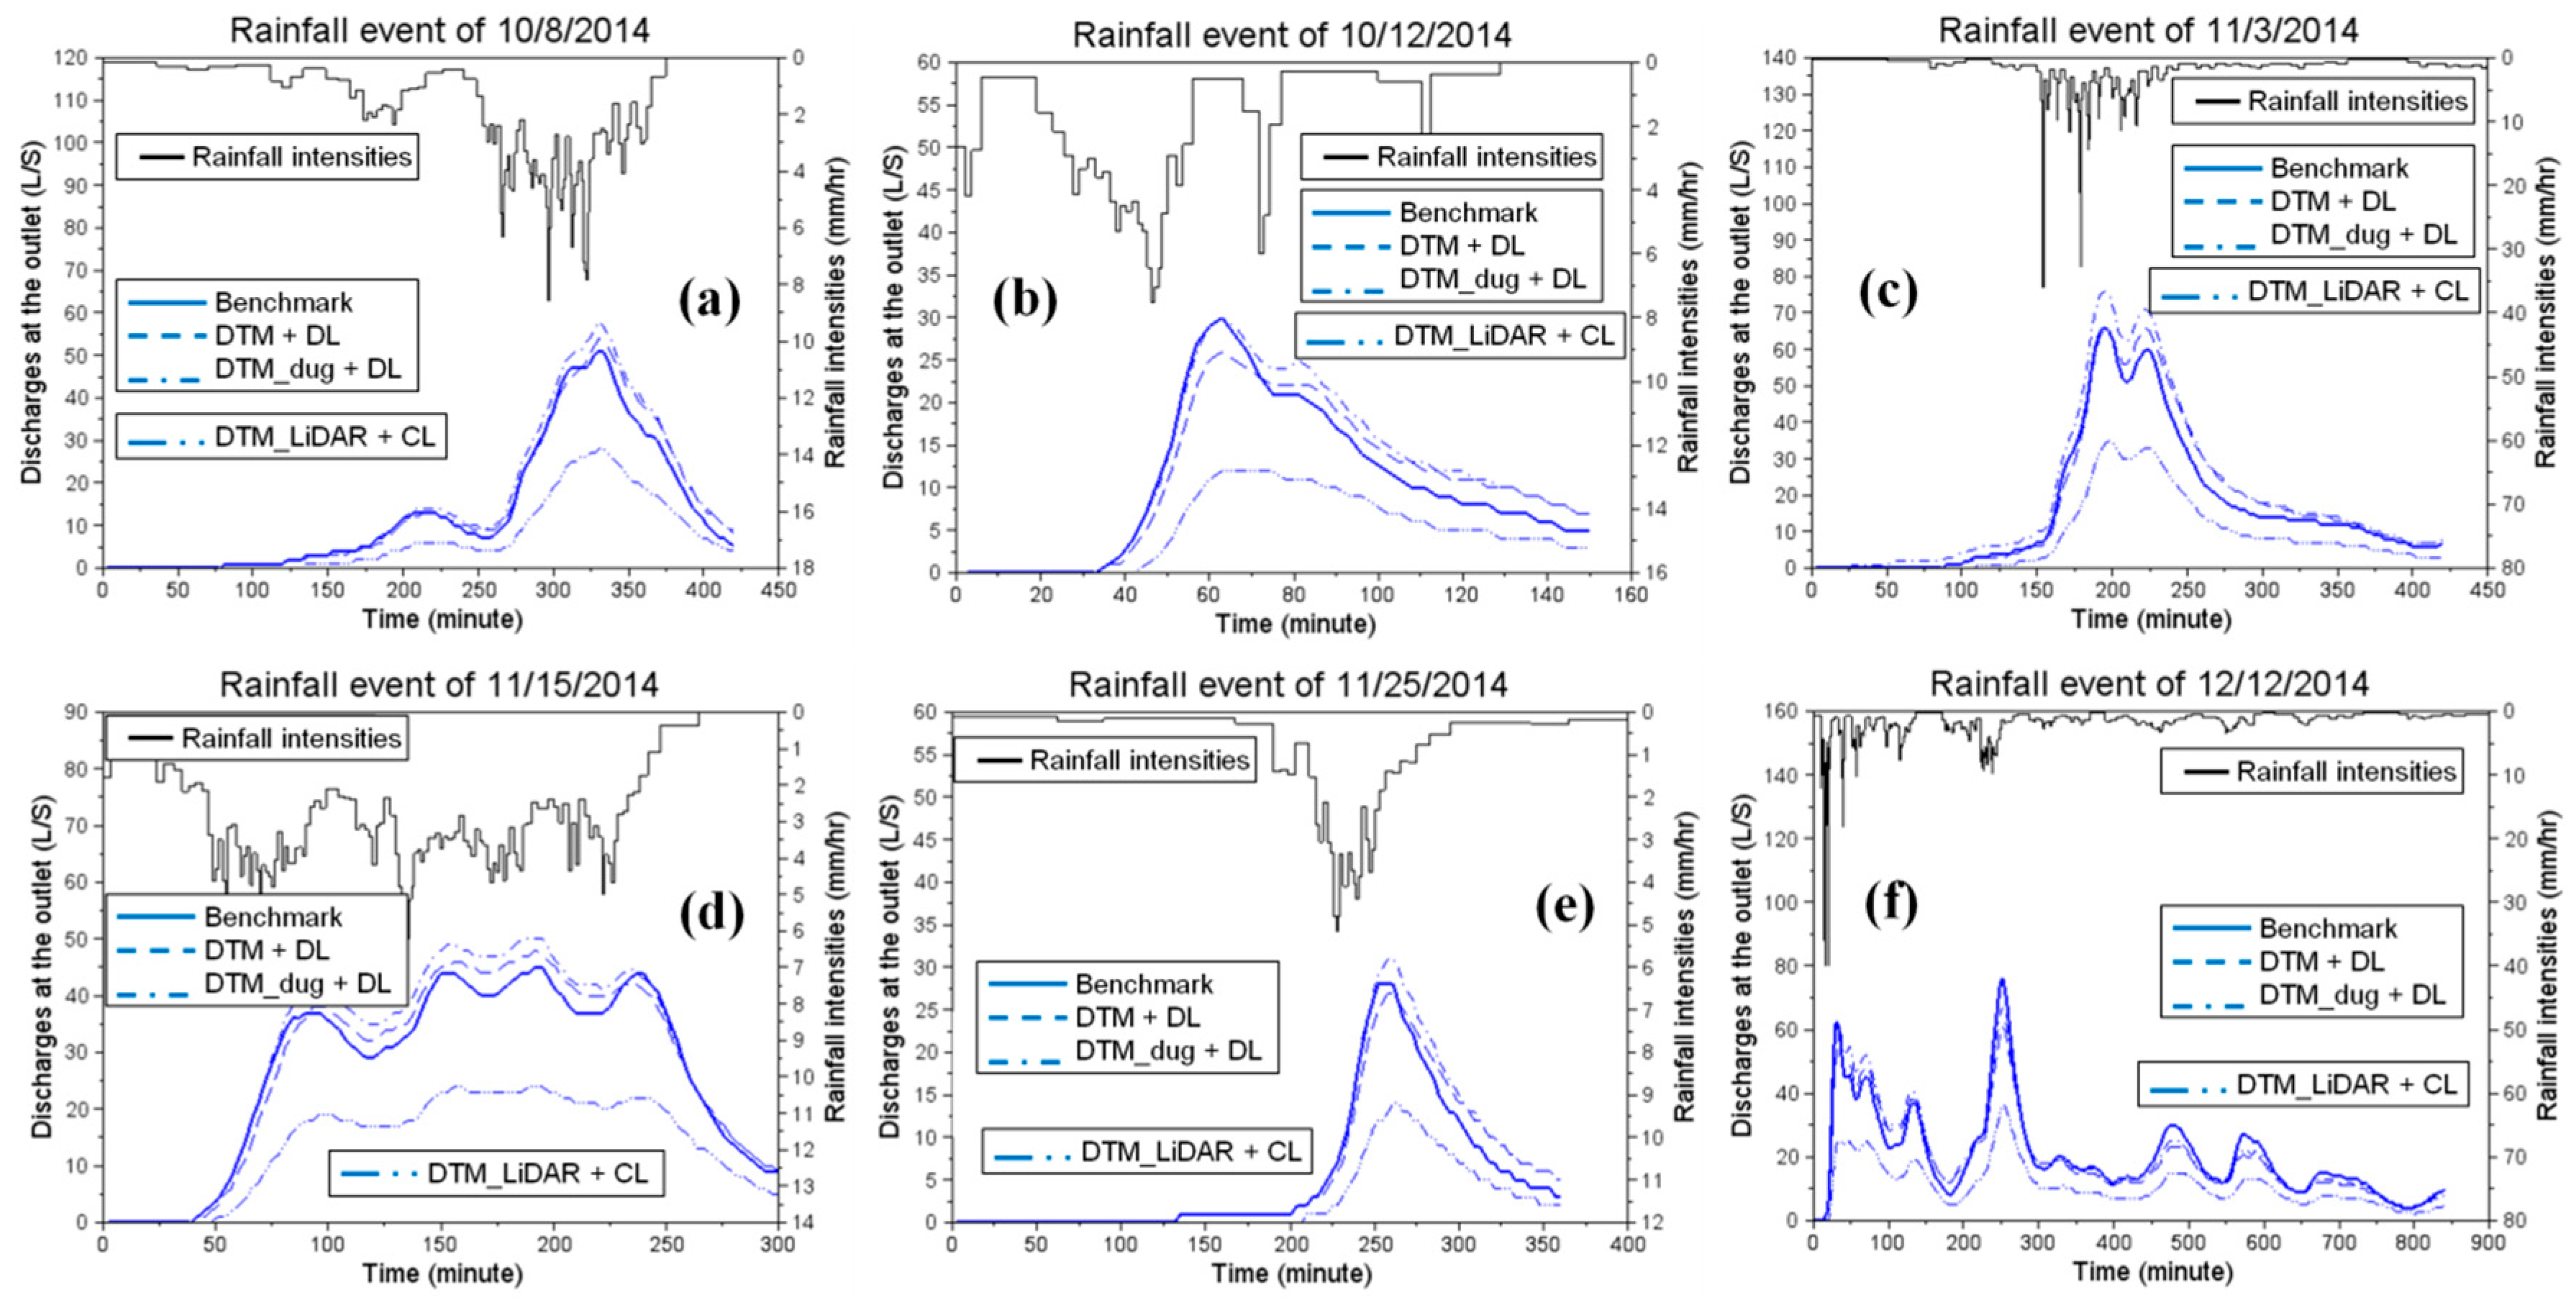
The simulated sewer network discharges for the six studied rainfall events are presented in Figure 7, and their RMD coefficients are displayed in Table 3:
As shown in Figure 7 and Table 3, simulations using coarse land-use data (CL) are quite different from that using detailed land-use information (DL), with RMD values around 50%. This result reveals that the present 2D/1D modeling approach is very sensitive to land-use data on the studied urban catchment. Compared with the simulations using DL, scenarios using CL underestimate water discharges at the sewage outlet. This phenomenon is mainly due to the underestimation of surface run-offs contributing to outlet discharges. The inappropriate description of the urban land-uses for the impervious areas and the adjoining areas of manholes in CL (Figure 5b) may be the major reason, since: (i) the inaccurate information of impervious areas can lead to the surface runoffs following paths that do not reach the manholes, and thus do not contribute to outlet discharge; and (ii) the presence of public green spaces surrounding the manholes can lead to an overestimation of infiltration.
On the other hand, the results surprisingly demonstrate that the gaps between the reference simulations and simulations using free access topographic data (DTM and DTM_dug) are not significant. The simulated water flows at the sewage outlet are hence not sensitive to the use of different resolutions of topographic data. This result is mainly related to the precisely defined and closely located manholes in the studied urban catchment. Since the distances between manholes are very short (generally less than 30 m), stormwater runoffs enter rapidly into the sewer networks. Thus, the precision of the road topography does not notably influence the transfer time, as this time is very short in any case. Moreover, as the building roofs are directly connected to the sewer networks in the TRENOE platform, the effects of using precise road topographic data has no effect on these land-uses. Of course, this result needs to be confirmed by applications of this modeling approach to other urban catchments with different shapes and slopes. It is important to notice that the resolution of road topographic data may not be a key factor for urban 2D/1D modeling (excepted urban flood modeling).
3.3. Is the Free Access GIS Data Sufficient for Urban 2D–1D Stormwater Modeling?
As presented in the above sections, by assessing the performance of the newly developed 2D/1D TRENOE platform on an urban catchment at the city district scale, detailed land-use information is required for accurate simulations of water flows at sewer outlets. On the contrary, it is not recommended for urban stormwater managers to apply ad hoc RS techniques for measuring high-resolution altimetry data. Using only easily achieved GIS topographic data with artificially dug streets seems to be a reasonable compromise to obtain acceptable simulations.
Nevertheless, the finding of this paper does not mean that the high-resolution topographic data is useless. In fact, detailed RS data can be used for developing and analyzing physically-based urban stormwater quality models. As the descriptions of spatially-variable processes can be supported by spatial measurements, researchers will be able to test new theories and gain a new understanding of the physical mechanisms with higher-resolution data, which will help improve the modeling techniques [19,27]. On the contrary, in the aspect of operational applications, lower-resolution images have the advantages of greater spatial and temporal coverage, lower costs, and a lack of copyright restrictions, hence, they are preferred by urban stormwater practitioners [1]. Besides, in order to achieve acceptable model performance with the free access GIS data, certain adaptations could be considered for further modeling applications.
In addition, based on the results of this paper, it can be noted that the precise description of manhole locations (sewer inlets, sewer drain grills, etc.) is also an important factor for urban 2D–1D modeling. As the roads are the major water pathways for stormwater runoffs at the city district scale, the main benefit of using high-resolution road LiDAR data is to accurately simulate the surface runoffs over roads, particularly for representing flow directions and velocities. However, this high-resolution data is no longer a key factor when manholes are close to one another, which implies that the runoff time from the road surface to the nearest manhole can be correctly simulated even with lower-resolution topography. Therefore, using the free access GIS data that accompanies the detailed urban sewer network design might be an acceptable low-cost solution for accurate urban 2D–1D stormwater modeling during moderate rainfall events. Moreover, perspectives of using advanced RS technologies on urban 2D–1D modeling can focus on (i) the identification of the manhole locations, in which an automatic manhole detection algorithm [28] can be an promising next step, and (ii) the detailed characterizations of land-uses close to manholes as well as on the adjoining urban surfaces. Meanwhile, new types of urban stormwater modeling tools, such as models based on manhole locations and the adjoining areas, can be tested for further studies.
4. Conclusions
In this paper, we presented for the first time a rigorous discussion on the use of free access GIS data and ad hoc RS data for urban 2D–1D stormwater modeling. The coupled 2D-surface and 1D-Sewer TRENOE model was applied to a small urban catchment near Paris (Le Perreux sur Marne, 0.12 km2). Four different types of RS and GIS data have been applied in the modeling platform, including (i) high-resolution topographic data derived from LiDAR; (ii) low-resolution DTM data obtained from the free access database; (iii) detailed land-use data proceeded from multiple data sources; and (iv) coarse land-use information extracted from the free access database. According to the results, the detailed land-use information derived from multiple data sources is a crucial factor for accurate simulations; however, using the very high resolution LiDAR data is not equally significant for water flow simulations at sewage outlets. Using only free access GIS topographic data with artificially dug streets seems to be a reasonable compromise to obtain acceptable simulations. Although this study resampled different types of data to the same resolution (5 m) for the model inputs, this paper provided a new approach trying to quantify the gains of using different sources of RS and GIS data on urban stormwater modeling. Moreover, the results of this study indicated that the precise description of manhole locations (sewer inlets, sewer drain grills, etc.) is also an important factor for the urban stormwater 2D–1D modeling. Consequently, using the free access GIS data accompanying the detailed urban sewer network design should be an acceptable low-cost solution for accurate urban 2D–1D stormwater modeling during moderate rainfall events. Depending on different management/research objectives, managers and decisionmakers are suggested to question the necessity of expensive ad hoc data before considering modeling applications. Further studies of urban stormwater modeling should focus on the development of “suitable” models with “enough” input data in order to solve operational/research issues in an efficient way.
Acknowledgments
The research work of student Yi Hong was financed by ANR-Trafipollu project (ANR-12-VBDU-0002) and Ecole des Ponts ParisTech. The authors would like to thank the experimental team of ANR Trafipollu project for all collected necessary for this work, in particular David Ramier (CEREMA), Mohamed Saad (LEESU) and Philippe Dubois (LEESU).
Author Contributions
This study was designed by Yi Hong, Céline Bonhomme, Bahman Soheilian and Ghassan Chebbo. The manuscript was prepared by Yi Hong and revised by Céline Bonhomme, Bahman Soheilian and Ghassan Chebbo.
Conflicts of Interest
The authors declare no conflict of interest.
References
- Di Baldassarre, G.; Uhlenbrook, S. Is the current flood of data enough? A treatise on research needs for the improvement of flood modelling. Hydrol. Process. 2012, 26, 153–158. [Google Scholar] [CrossRef]
- Bates, P.D. Integrating remote sensing data with flood inundation models: How far have we got? Hydrol. Process. 2012, 26, 2515–2521. [Google Scholar] [CrossRef]
- Veleda, S.; Martínez-Graña, A.; Santos-Francés, F.; Sánchez-SanRoman, J.; Criado, M. Analysis of the Hazard, Vulnerability, and Exposure to the Risk of Flooding (Alba de Yeltes, Salamanca, Spain). Appl. Sci. 2017, 7, 157. [Google Scholar] [CrossRef]
- Gallegos, H.A.; Schubert, J.E.; Sanders, B.F. Two-dimensional, high-resolution modeling of urban dam-break flooding: A case study of Baldwin Hills, California. Adv. Water Resour. 2009, 32, 1323–1335. [Google Scholar] [CrossRef]
- Horritt, M.S.; Di Baldassarre, G.; Bates, P.D.; Brath, A. Comparing the performance of a 2-D finite element and a 2-D finite volume model of floodplain inundation using airborne SAR imagery. Hydrol. Process. 2007, 21, 2745–2759. [Google Scholar] [CrossRef]
- Fletcher, T.D.; Andrieu, H.; Hamel, P. Understanding, management and modelling of urban hydrology and its consequences for receiving waters: A state of the art. Adv. Water Resour. 2013, 51, 261–279. [Google Scholar] [CrossRef]
- Salvadore, E.; Bronders, J.; Batelaan, O. Hydrological modelling of urbanized catchments: A review and future directions. J. Hydrol. 2015, 529 Pt 1, 62–81. [Google Scholar] [CrossRef]
- Fewtrell, T.J.; Duncan, A.; Sampson, C.C.; Neal, J.C.; Bates, P.D. Benchmarking urban flood models of varying complexity and scale using high resolution terrestrial LiDAR data. Phys. Chem. Earth Parts ABC 2011, 36, 281–291. [Google Scholar] [CrossRef]
- Djordjević, S.; Prodanović, D.; Maksimović, C.; Ivetić, M.; Savić, D. SIPSON—Simulation of interaction between pipe flow and surface overland flow in networks. Water Sci. Technol. J. Int. Assoc. Water Pollut. Res. 2005, 52, 275–283. [Google Scholar]
- Kidmose, J.; Troldborg, L.; Refsgaard, J.C.; Bischoff, N. Coupling of a distributed hydrological model with an urban storm water model for impact analysis of forced infiltration. J. Hydrol. 2015, 525, 506–520. [Google Scholar] [CrossRef]
- Sto Domingo, N.D.; Refsgaard, A.; Mark, O.; Paludan, B. Flood analysis in mixed-urban areas reflecting interactions with the complete water cycle through coupled hydrologic-hydraulic modelling. Water Sci. Technol. J. Int. Assoc. Water Pollut. Res. 2010, 62, 1386–1392. [Google Scholar] [CrossRef] [PubMed]
- Vojinovic, Z.; Tutulic, D. On the use of 1D and coupled 1D-2D modelling approaches for assessment of flood damage in urban areas. Urban Water J. 2009, 6, 183–199. [Google Scholar] [CrossRef]
- DHI MIKE by DHI Software. Reference Manuals for MIKE FLOOD 2008. Available online: https://www.mikepoweredbydhi.com/products/mike-flood (accessed on 31 August 2017).
- Innovyze Ltd InfoWorks 2D—Collection Systems Technical Review 2011. Available online: http://www.innovyze.com/products/infoworks_icm/ (accessed on 31 August 2017).
- Velleux, M.L.; England, J.F.; Julien, P.Y. TREX: Spatially distributed model to assess watershed contaminant transport and fate. Sci. Total Environ. 2008, 404, 113–128. [Google Scholar] [CrossRef] [PubMed]
- Lhomme, J.; Bouvier, C.; Perrin, J.-L. Applying a GIS-based geomorphological routing model in urban catchments. J. Hydrol. 2004, 299, 203–216. [Google Scholar] [CrossRef]
- Green, W.H.; Ampt, G.A. Studies on Soil Phyics. J. Agric. Sci. 1911, 4, 1–24. [Google Scholar] [CrossRef]
- Preismann, A. Propagation of translatory waves in channels and rivers. In Proceedings of the 1st Congress of French Association for Computation, Grenoble, France, 20 September 1961; pp. 432–443. [Google Scholar]
- Hong, Y.; Bonhomme, C.; Le, M.-H.; Chebbo, G. A new approach of monitoring and physically-based modelling to investigate urban wash-off process on a road catchment near Paris. Water Res. 2016, 102, 96–108. [Google Scholar] [CrossRef] [PubMed]
- Paparoditis, N.; Papelard, J.-P.; Cannelle, B.; Devaux, A.; Soheilian, B.; David, N.; Houzay, E. Stereopolis II: A multi-purpose and multi-sensor 3D mobile mapping system for street visualisation and 3D metrology. Rev. Fr. Photogramm. Télédétec. 2012, 200, 69–79. [Google Scholar]
- Hervieu, A.; Soheilian, B. Semi-Automatic Road/Pavement Modeling using Mobile Laser Scanning. ISPRS Ann. Photogramm. Remote Sens. Spat. Inf. Sci. 2013, II-3/W3, 31–36. [Google Scholar] [CrossRef]
- Guigues, L.; Cocquerez, J.P.; Men, H.L. Scale-Sets Image Analysis. Int. J. Comput. Vis. 2006, 68, 289–317. [Google Scholar] [CrossRef]
- Xiao, Q.; McPherson, E.G.; Simpson, J.R.; Ustin, S.L. Rainfall interception by Sacramento’s urban forest. J. Arboric. USA 1998, 24, 235–244. [Google Scholar]
- Rossman, L.A. Storm Water Management Model User’s Manual Version 5.0; National Risk Management Research and Development U.S. Environmental Protection Agency: Cincinnati, OH, USA, 2010; p. 45268.
- Nash, J.E.; Sutcliffe, J.V. River flow forecasting through conceptual models part I—A discussion of principles. J. Hydrol. 1970, 10, 282–290. [Google Scholar] [CrossRef]
- Tsihrintzis, V.A.; Hamid, R. Modeling and management of urban stormwater runoff quality: A review. Water Resour. Manag. 1997, 11, 136–164. [Google Scholar] [CrossRef]
- Hong, Y.; Bonhomme, C.; Le, M.-H.; Chebbo, G. New insights into the urban washoff process with detailed physical modelling. Sci. Total Environ. 2016, 573, 924–936. [Google Scholar] [CrossRef] [PubMed]
- Hervieu, A.; Soheilian, B.; Brédif, M. Road Marking Extraction Using a MODEL & DATA-DRIVEN Rj-Mcmc. ISPRS Ann. Photogramm. Remote Sens. Spat. Inf. Sci. 2015, 47–54. [Google Scholar] [CrossRef]
Figure 1.
Scheme of the 2D-surface and 1D-network modeling platform TRENOE.

Figure 2.
Study urban catchment in eastern Paris (12 ha, Le Perreux sur Marne, France). A rain gauge is installed on the roof of a building close to the catchment, and the flow monitoring devices are set up at the sewage outlet.
Figure 2.
Study urban catchment in eastern Paris (12 ha, Le Perreux sur Marne, France). A rain gauge is installed on the roof of a building close to the catchment, and the flow monitoring devices are set up at the sewage outlet.
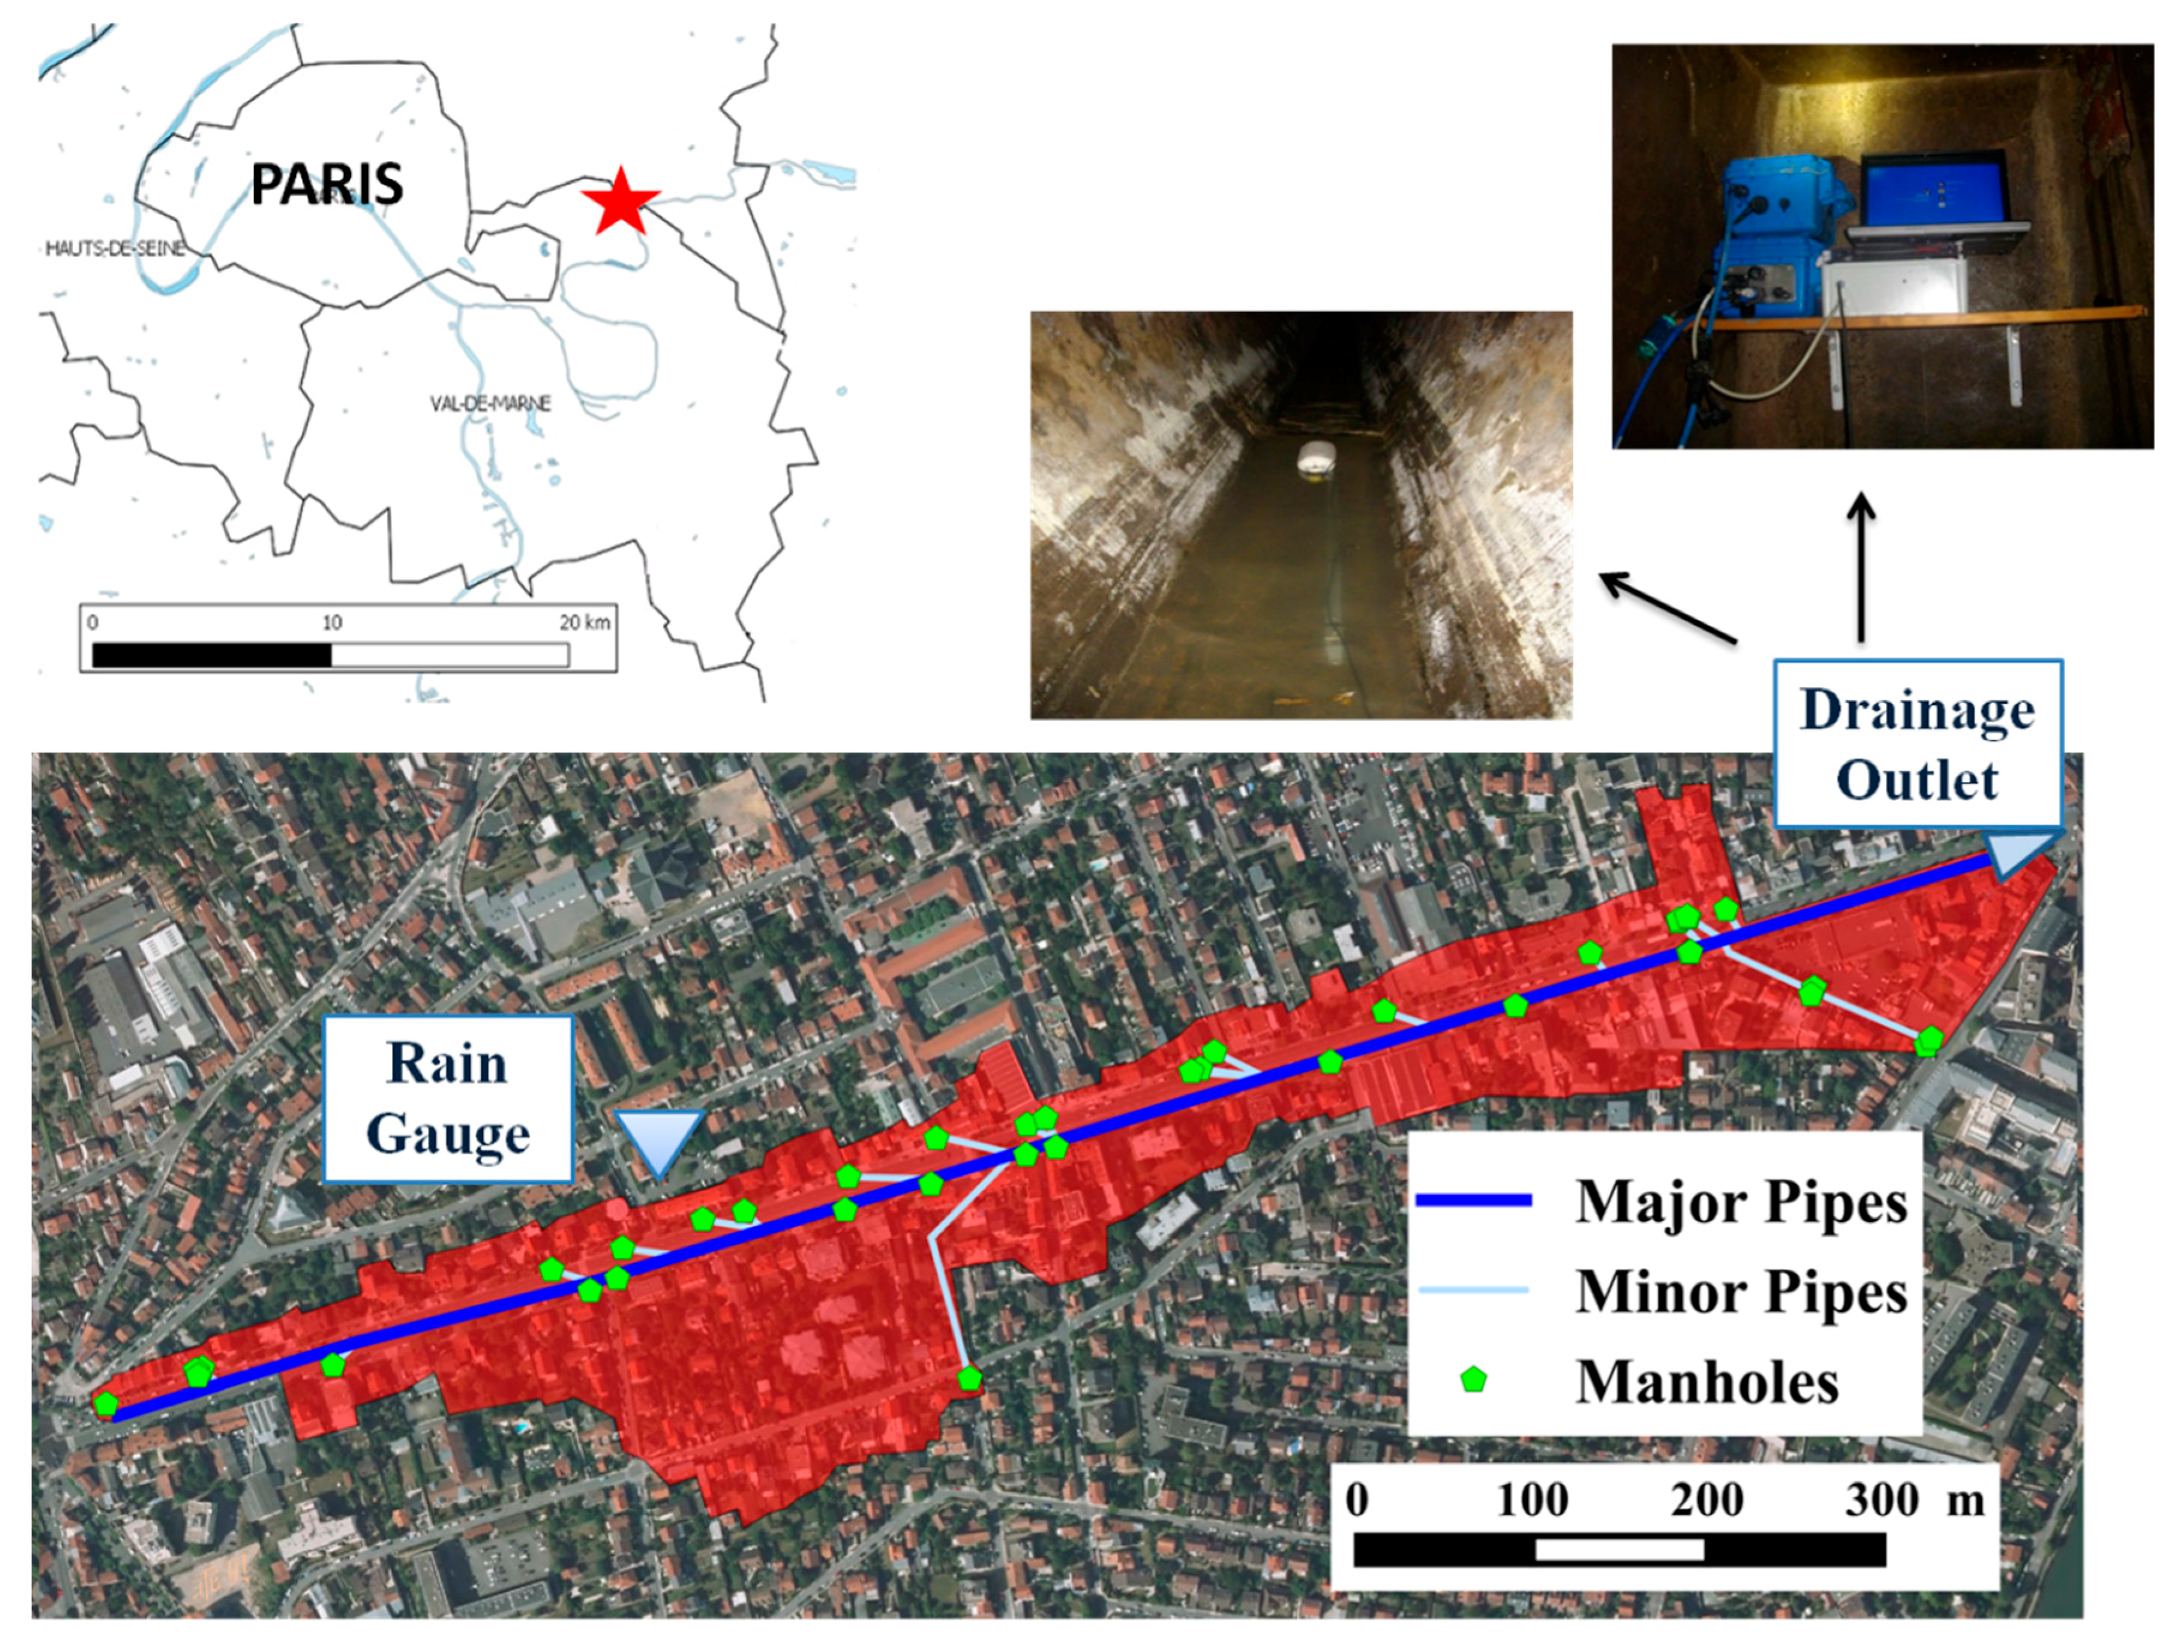
Figure 3.
Different sources of the topographic data. (a) Coarse digital terrain model (DTM) data of 25 m resolution; (b) 20 cm resolution light detection and ranging (LiDAR) topographic data for roads and sidewalks.
Figure 3.
Different sources of the topographic data. (a) Coarse digital terrain model (DTM) data of 25 m resolution; (b) 20 cm resolution light detection and ranging (LiDAR) topographic data for roads and sidewalks.

Figure 4.
Three different topographic input data. For (a) DTM, (b) DTM—dug road, and (c) DTM + LiDAR.
Figure 4.
Three different topographic input data. For (a) DTM, (b) DTM—dug road, and (c) DTM + LiDAR.

Figure 5.
Input land-use information (a) obtained by combining multiple data sources, (detailed land-use); (b) extracted directly from the BD-TOPO® database (coarse land-use).
Figure 5.
Input land-use information (a) obtained by combining multiple data sources, (detailed land-use); (b) extracted directly from the BD-TOPO® database (coarse land-use).

Figure 6.
Water flow simulations using the urban 2D/1D TRENOE model with the DTM + LiDAR topography and detailed land-use data. The simulated discharges at the network outlet (solid blue lines) are compared with the measured data (red circles). Rainfall is plotted on the upper part. For events (a) 8 October 2014; (b) 12 October 2014; (c) 3 November 2014; (d) 15 November 2014; (e) 25 November 2014; (f) 12 December 2014.

Figure 7.
Sensitivity to low-resolution topographic data and coarse land-use information (free access). Simulations using DTM + LiDAR topography and detailed Land-use (reference, solid blue lines) are compared with simulations using (i) DTM topography and detailed land-use (DTM + DL, dashed blue lines); (ii) DTM—dug road topography and detailed land-use (DTM_dug + DL, dash-dotted blue lines); and (iii) DTM + LiDAR topography and coarse land-use (DTM_LiDAR + CL, dotted blue lines). Rainfall is plotted on the upper part. For events (a) 8 October 2014; (b) 12 October 2014; (c) 3 November 2014; (d) 15 November 2014; (e) 25 November 2014; (f) 12 December 2014.


Table 1.
Characteristics of the six studied rainfall events.
| Rainfall Date | Rainfall Depth (mm) | Mean Intensity (mm/h) | Max Intensity (mm/h) | Duration (h) |
|---|---|---|---|---|
| 8 October 2014 | 4.86 | 1.52 | 8.57 | 6.17 |
| 12 October 2014 | 3.60 | 1.68 | 7.50 | 2.14 |
| 3 November 2014 | 4.60 | 1.33 | 36.0 | 10.3 |
| 15 November 2014 | 9.27 | 2.81 | 6.21 | 4.41 |
| 25 November 2014 | 2.86 | 1.32 | 5.14 | 3.33 |
| 12 December 2014 | 4.15 | 1.28 | 40.0 | 22.6 |
Table 2.
Parameter values for the 2D-surface and 1D-sewer modeling.
| 2D-Surface Modeling | ||
|---|---|---|
| Impervious surface (road, sidewalk, etc.) | Pervious surfaces (grass, trees, etc.) | |
| Initial loss (mm) | 0.5 | 3 |
| Suction head at the wetting front (m) | 0.01 | 0.05 |
| Residual soil moisture content | 0.1 | 0.4 |
| Manning’s N values for surface runoffs | 0.015 | 0.2 |
| Saturated hydraulic conductivity (m/s) | 1.0 × 10⁻⁸ | 1.0 × 10⁻⁵ |
| Initial loss (mm) | 0.5 | 3 |
| 1D sewer and roof modeling | ||
| Manning’s N for sewer networks | 0.014 | |
| Manning’s N for virtual sub-basins | 0.012 | |
Table 3.
Mean deviation (MD) and relative mean deviation (RMD) between the reference simulations and simulations using low-resolution topographic data and coarse land-use information, respectively.
Table 3.
Mean deviation (MD) and relative mean deviation (RMD) between the reference simulations and simulations using low-resolution topographic data and coarse land-use information, respectively.
| Tested Scenarios vs. Reference Scenario | DTM + DL vs. DTM_LiDar + DL | DTM_dug + DL vs. DTM_LiDar + DL | DTM_LiDAR + CL vs. DTM_LiDAR + DL | |||
|---|---|---|---|---|---|---|
| Performance indicator | MD (L·s−1) | RMD (%) | MD (L·s−1) | RMD (%) | MD (L·s−1) | RMD (%) |
| 8 October 2014 | 1.96 | 14.7 | 1.31 | 9.33 | 6.32 | 47.6 |
| 12 October 2014 | 1.72 | 16.5 | 1.70 | 16.3 | 5.34 | 51.3 |
| 3 November 2014 | 3.76 | 23.3 | 1.99 | 12.3 | 7.54 | 46.9 |
| 15 November 2014 | 2.80 | 10.5 | 1.94 | 7.30 | 12.5 | 47.1 |
| 25 November 2014 | 0.94 | 17.4 | 0.86 | 15.9 | 2.76 | 51.1 |
| 12 December 2014 | 2.32 | 11.3 | 2.31 | 11.2 | 9.58 | 46.6 |
© 2017 by the authors. Licensee MDPI, Basel, Switzerland. This article is an open access article distributed under the terms and conditions of the Creative Commons Attribution (CC BY) license (http://creativecommons.org/licenses/by/4.0/).
Share and Cite
MDPI and ACS Style
Hong, Y.; Bonhomme, C.; Soheilian, B.; Chebbo, G. Effects of Using Different Sources of Remote Sensing and Geographic Information System Data on Urban Stormwater 2D–1D Modeling. Appl. Sci. 2017, 7, 904. https://doi.org/10.3390/app7090904
AMA Style
Hong Y, Bonhomme C, Soheilian B, Chebbo G. Effects of Using Different Sources of Remote Sensing and Geographic Information System Data on Urban Stormwater 2D–1D Modeling. Applied Sciences. 2017; 7(9):904. https://doi.org/10.3390/app7090904
Chicago/Turabian StyleHong, Yi, Céline Bonhomme, Bahman Soheilian, and Ghassan Chebbo. 2017. "Effects of Using Different Sources of Remote Sensing and Geographic Information System Data on Urban Stormwater 2D–1D Modeling" Applied Sciences 7, no. 9: 904. https://doi.org/10.3390/app7090904
Note that from the first issue of 2016, this journal uses article numbers instead of page numbers. See further details here.