Article

Comparison of Laser-Engraved Hole Properties between Cold-Rolled and Laser Additive Manufactured Stainless Steel Sheets

by
Matti Manninen
1,*,
Marika Hirvimäki
1,
Ville-Pekka Matilainen
1 and
Antti Salminen
1,2
1
Laboratory of Laser Processing, School of Energy Systems, Lappeenranta University of Technology, 53850 Lappeenranta, Finland
2
Machine Technology Center Turku Ltd., 20520 Turku, Finland
*
Author to whom correspondence should be addressed.
Appl. Sci. 2017, 7(9), 913; https://doi.org/10.3390/app7090913
Submission received: 16 August 2017 / Revised: 30 August 2017 / Accepted: 4 September 2017 / Published: 6 September 2017
(This article belongs to the Special Issue 3D Printing of Metals)

Abstract

:
Laser drilling and laser engraving are common manufacturing processes that are found in many applications. With the continuous progress of additive manufacturing (3D printing), these processes can now be applied to the materials used in 3D printing. However, there is a lack of knowledge about how these new materials behave when processed or machined. In this study, sheets of 316L stainless steel produced by both the traditional cold rolling method and by powder bed fusion (PBF) were laser drilled by a nanosecond pulsed fiber laser. Results were then analyzed to find out whether there are measurable differences in laser processing parts that are produced by either PBF (3D printing) or traditional steel parts. Hole diameters, the widths of burn effects, material removal rates, and hole tapers were measured and compared. Additionally, differences in microstructures of the samples were also analyzed and compared. Results show negligible differences in terms of material processing efficiency. The only significant differences were that the PBF sample had a wider burn effect, and had some defects in the microstructure that were more closely analyzed. The defects were found to be shallow recesses in the material. Some of the defects were deep within the material, at the end and start points of the laser lines, and some were close to the surfaces of the sample.

1. Introduction

Laser drilling is a process where material is removed by a focused laser beam to produce usually a hole with a circular cross-section. Schulz et al. extensively covered the basics of laser drilling in a review [1]. It is used for a variety of applications, e.g., the production of cooling channels and lubrication holes for turbine components and engine parts, the fabrication of orifices for nozzles and controlled leaks, microvia hole drilling in circuit interconnects, and biomedical applications such as needles, catheters, and sensors [2,3]. Also, other electrical components such as hard disks, displays, computer peripherals, and telecommunication devices utilize laser drilling on a micro scale [3]. The four most used processes for laser drilling are single pulse, percussion (using multiple pulses in the same spot), trepanning (moving the laser beam along the circumference of the hole), and helical drilling (trepanning while simultaneously adjusting the focal plane).
Laser drilling is a relatively well-understood process that has been studied for decades. There are certain aspects of drilling that have been of special interest. Challenges related to producing high precision and high aspect ratio holes have been investigated [4]. Aspect ratios greater than 50 have been produced with high quality, usually by employing helical or trepanning drilling [5,6,7]. In addition to high precision and aspect ratios, high-speed drilling and micro drilling are utilized, especially in aerospace applications [8]. Burr formation and elimination are also important issues, studied e.g., by Duan et al. [9]. Their investigations showed which laser parameters cause burr formation and how to minimize it. Ghoreishi et al. investigated the effect of laser parameters on hole taper and circularity in percussion drilling of steels [10]. Goyal and Dubey investigated similar hole characteristics and drilling optimization in a case of titanium alloy material [11]. Their studies provide guidance on how to optimize processing parameters to produce smaller holes with less tapering, and better circularity. Hole quality properties, including circularity and taper, are also important because of the need to control the shape of the drilled hole [12]. Jahns et al. developed a new type of optical systems that enable control of the hole taper to produce either positive or negative taper [13,14]. Some effort has been expended to combine electro-discharge machining with laser drilling to produce high quality holes without the recast layer and heat affected zones, which can be problematic in laser drilling [15,16,17].
More specialized studies include Hidai et al.’s examination of curved drilling using inner hole reflections [18]. They were able to drill a 50-μm diameter hole with a curvature of about 3°, beginning at a depth of 400–600 μm. On a more fundamental level, Arrizubieta et al. investigated the hole characterization and formation [19]. They developed a numerical model to simulate the drilled hole geometry for AISI (American Iron and Steel Institute) 304 stainless steel. Jackson and O’Neill investigated the drilling of tool steels by using a nanosecond diode-pumped Nd:YAG (neodymium doped yttrium-aluminum-garnet) laser [20]. With a laser wavelength of 1064 nm, the maximum material removal rate obtained was about 1 μm per pulse. Voisey et al. studied single pulse drilling with a millisecond-pulsed Nd:YAG laser [21]. They determined particle size distribution, the angle of trajectory, molten layer thickness, and the temporal variation of melt ejection.
Drilling depth estimation can be difficult unless a vast experimental data bank is available. Ho et al. monitored the plasma plume from the side, and estimated the depth online through image acquisition and analysis [22]. Their results indicate that the cumulative plasma size correlates with the drilling depth, with a high degree of confidence.
Overall, there seems to be a reasonable amount of data about the principles and mechanisms of laser drilling, with many studies focusing on the effects of processing parameters on the quality and speed-related properties of the drilled hole. However, there are no studies conducted specifically on drilling laser additively manufactured materials. This is understandable, since the technology is still new and the differences between metallic materials produced conventionally and from melted powder seem to be quite small. This study aims to find out whether there are any significant differences between laser drilling a one-millimeter thick cold rolled AISI 316L stainless steel and a similar sheet produced by selective laser melting—one of the techniques of additive manufacturing. The results provided will support more fundamental research into the differences between conventionally produced and additively manufactured steel parts, as well as help the industry utilize laser engraving or drilling technology to better optimize their laser parameters.
In this study, the laser drilling is performed by engraving a circular hole through the material, because that method works best for the laser used in the study. While this is an unusual process, in this case the specific method of drilling is not important as the study is about the differences in processing two different materials. Laser engraving shares many similarities with laser drilling, because they are both processes that essentially require the removal of material until a desired shape is achieved. The major differences are that in engraving, the material is not usually fully penetrated, and the desired shapes are more complex.

2. Materials and Methods

The laser source used in the engraving experiments was a pulsed ytterbium fiber laser manufactured by IPG Photonics, with 20 W of maximum average power, typical beam quality M2 value of 1.5, maximum pulse energy of 1 mJ, a variable pulse repetition rate from 1.6 to 1000 kHz, and a changeable pulse length from 4 ns to 200 ns in 8 different waveforms. Scan head optics was used where the scan head was Scanlab’s Hurryscan 14 II with an f100 telecentric lens. The laser beam focal point diameter was ~40 μm with a Rayleigh length of 0.39 mm and a near Gaussian beam power distribution, as measured by Primes MicroSpotMonitor monitoring tool (see Figure 1b). A schematic drawing of the test setup can be seen in Figure 1a.

2.1. Test Sample Materials and Manufacture of PBF Sheet

Two sets of laser drilling experiments were conducted; one for a cold rolled 316L steel sheet and one for a powder bed fusion (PBF)-produced steel sheet. Both steel sheets were of the same size, 20 × 30 × 1 mm. The compositions for both steels are shown in Table 1; the values were found in literature and measured values are given. The compositions were measured by Hitachi scanning electron microscope (model number SU3500) from the surface of the samples.
The PBF sheets were manufactured using the selective laser melting (SLM) technique [23] with a modified research PBF system, similar to EOSINT M270, manufactured by EOS, with a maximum build volume of 245 × 245 × 215 mm. The system uses a 200 W ytterbium fiber laser to selectively melt powder layer by layer. The focal point diameter of the laser beam was 100 μm. Manufacture of the sheet was executed as one build. Nitrogen was used as the shielding gas in the process chamber to avoid oxidation of the parts and to reduce the oxygen content to below 0.8%. Powder was deposited by a recoater blade that moved in one direction from the powder storage platform, onto the building platform, and finally depositing the excess powder onto the third platform. All of the platforms moved vertically as necessary to build the sheet. For laser beam scanning, the ‘island’ scan strategy, as studied by Carter et al. [24], was used. The manufacturing parameters were: laser power 200 W, laser scan velocity 1000 mm/s, layer thickness 20 μm, and hatch distance 0.1 mm. After the manufacture, the sample was sawed off the building platform. No other post-processing was done. Figure 2 shows the orientation of the sample from the top-down perspective during the manufacture.

2.2. Differences in Physical Properties

Analyzing the differences between the physical properties of the two materials would be beneficial for understanding the possible reasons for processing them in different ways. However, while there is plenty of information available on traditionally produced 316L stainless steel, there is no information readily available on the thermal conductivity, thermal expansion coefficient, heat capacity, or many other properties of 3D printed stainless steels. The mechanical properties, such as tensile and yield strengths and Young’s modulus, are available for both materials. Some typical physical properties of these materials are given in Table 2. For some additional insight into the differences, according to a data sheet published by 3D Alchemy [25], the thermal conductivity for 1.4542 (martensitic, AISI 630) stainless steel is 13 W/m °C as built, whereas for conventionally produced sheets it is 14 W/m °C at room temperature [26]. This indicates that the cold or hot rolled material might have a slightly higher thermal conductivity than the 3D printed parts. The 3D printed stainless steels seem to also be a little harder. Studies have indicated that the relative density of 3D printed parts is at around 99.5% [27,28].
In addition to the properties listed in Table 2, residual stresses within the material are different. The cold rolled sheet was annealed to remove external stresses, but the PBF sheet was used in the experiments as built. According to Wu et al., the PBF-produced 316L sheets typically have high compressive stress in the center, and tensile stress near surfaces [31]. Still, considering that the properties of traditional and 3D printed materials seem to be very close to each other, it can be expected that the results in laser engraving should differ by a few percentage points at most, despite how rough the surface of a 3D printed part is.

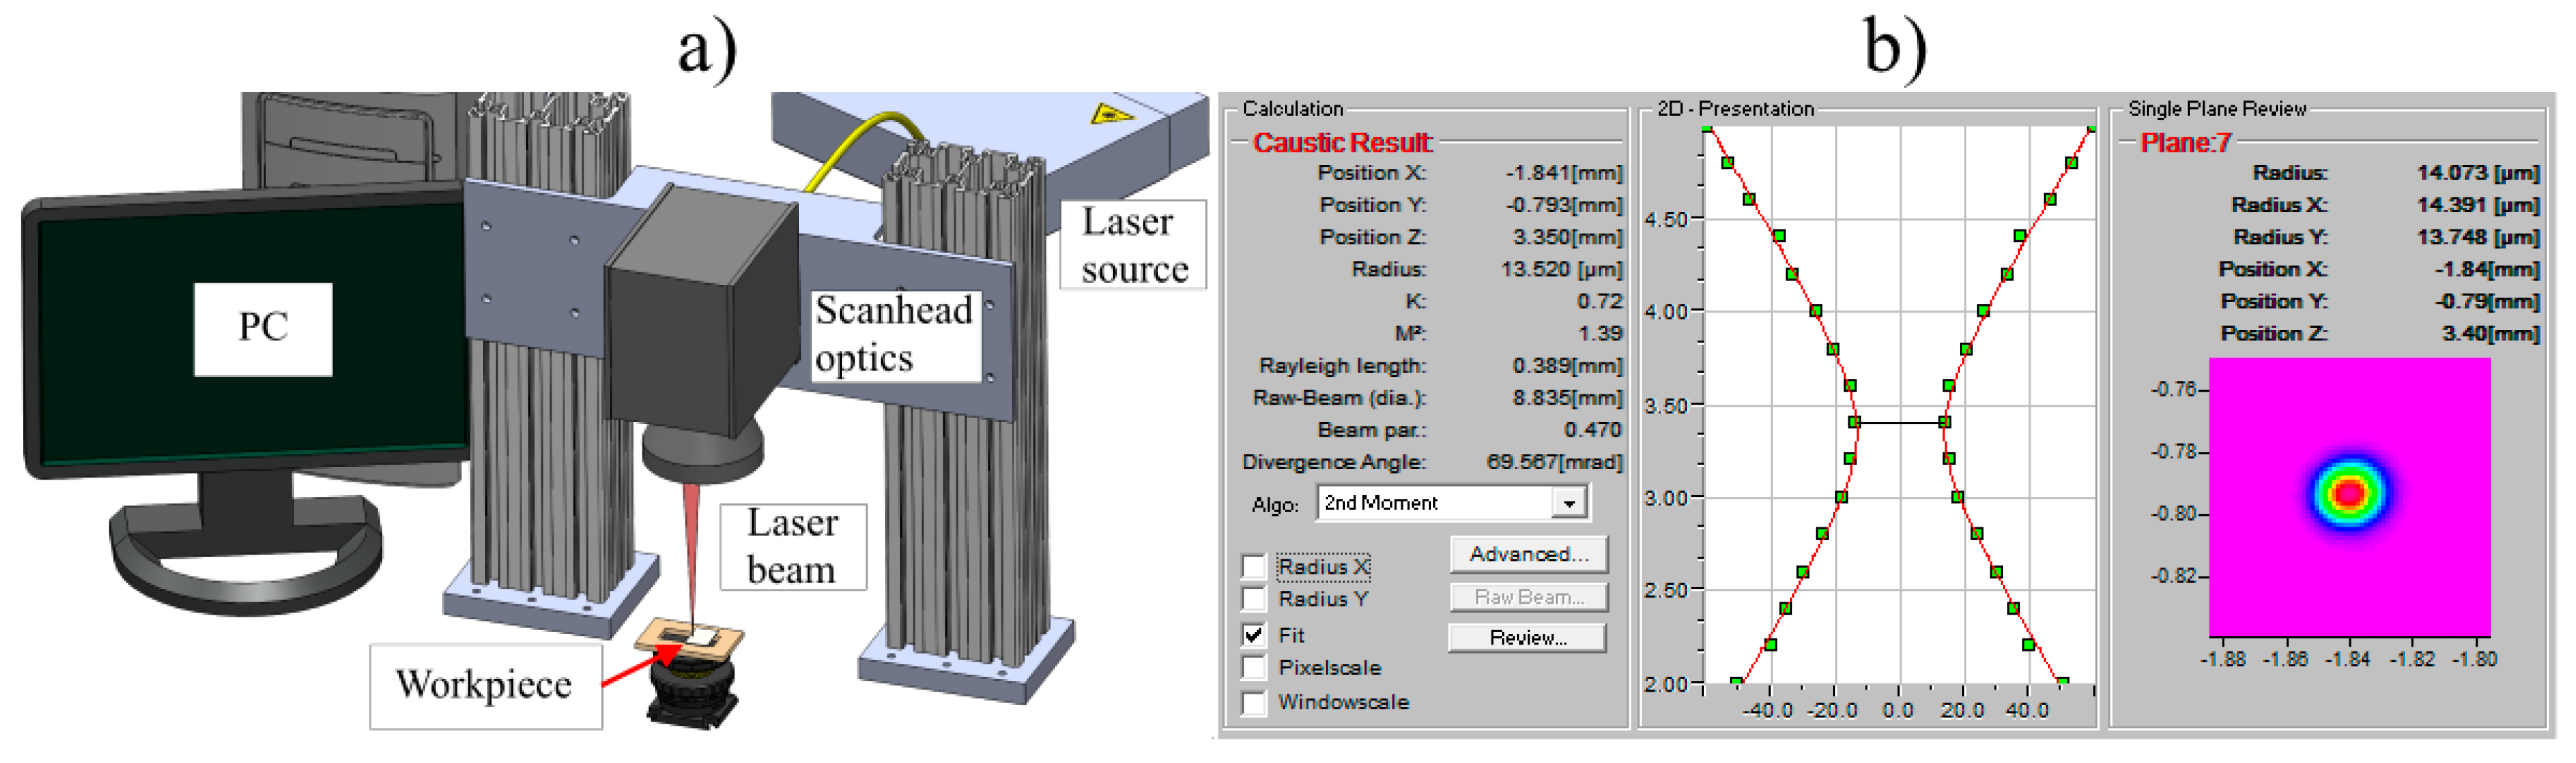
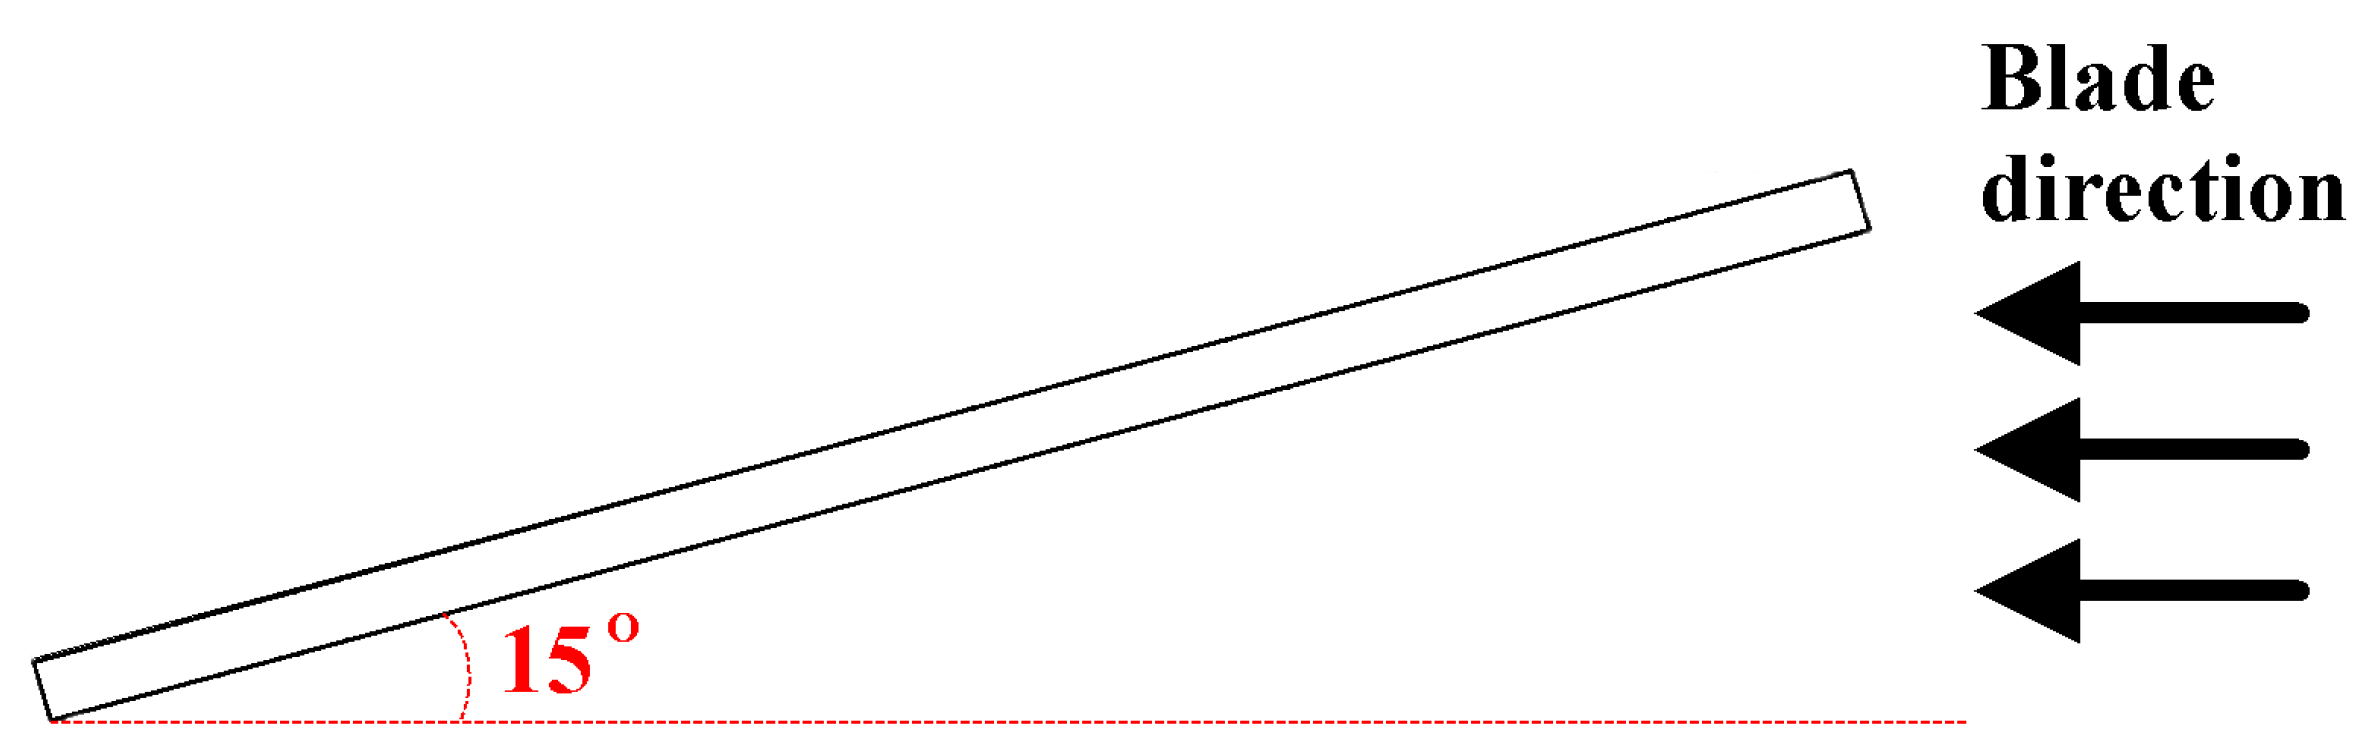
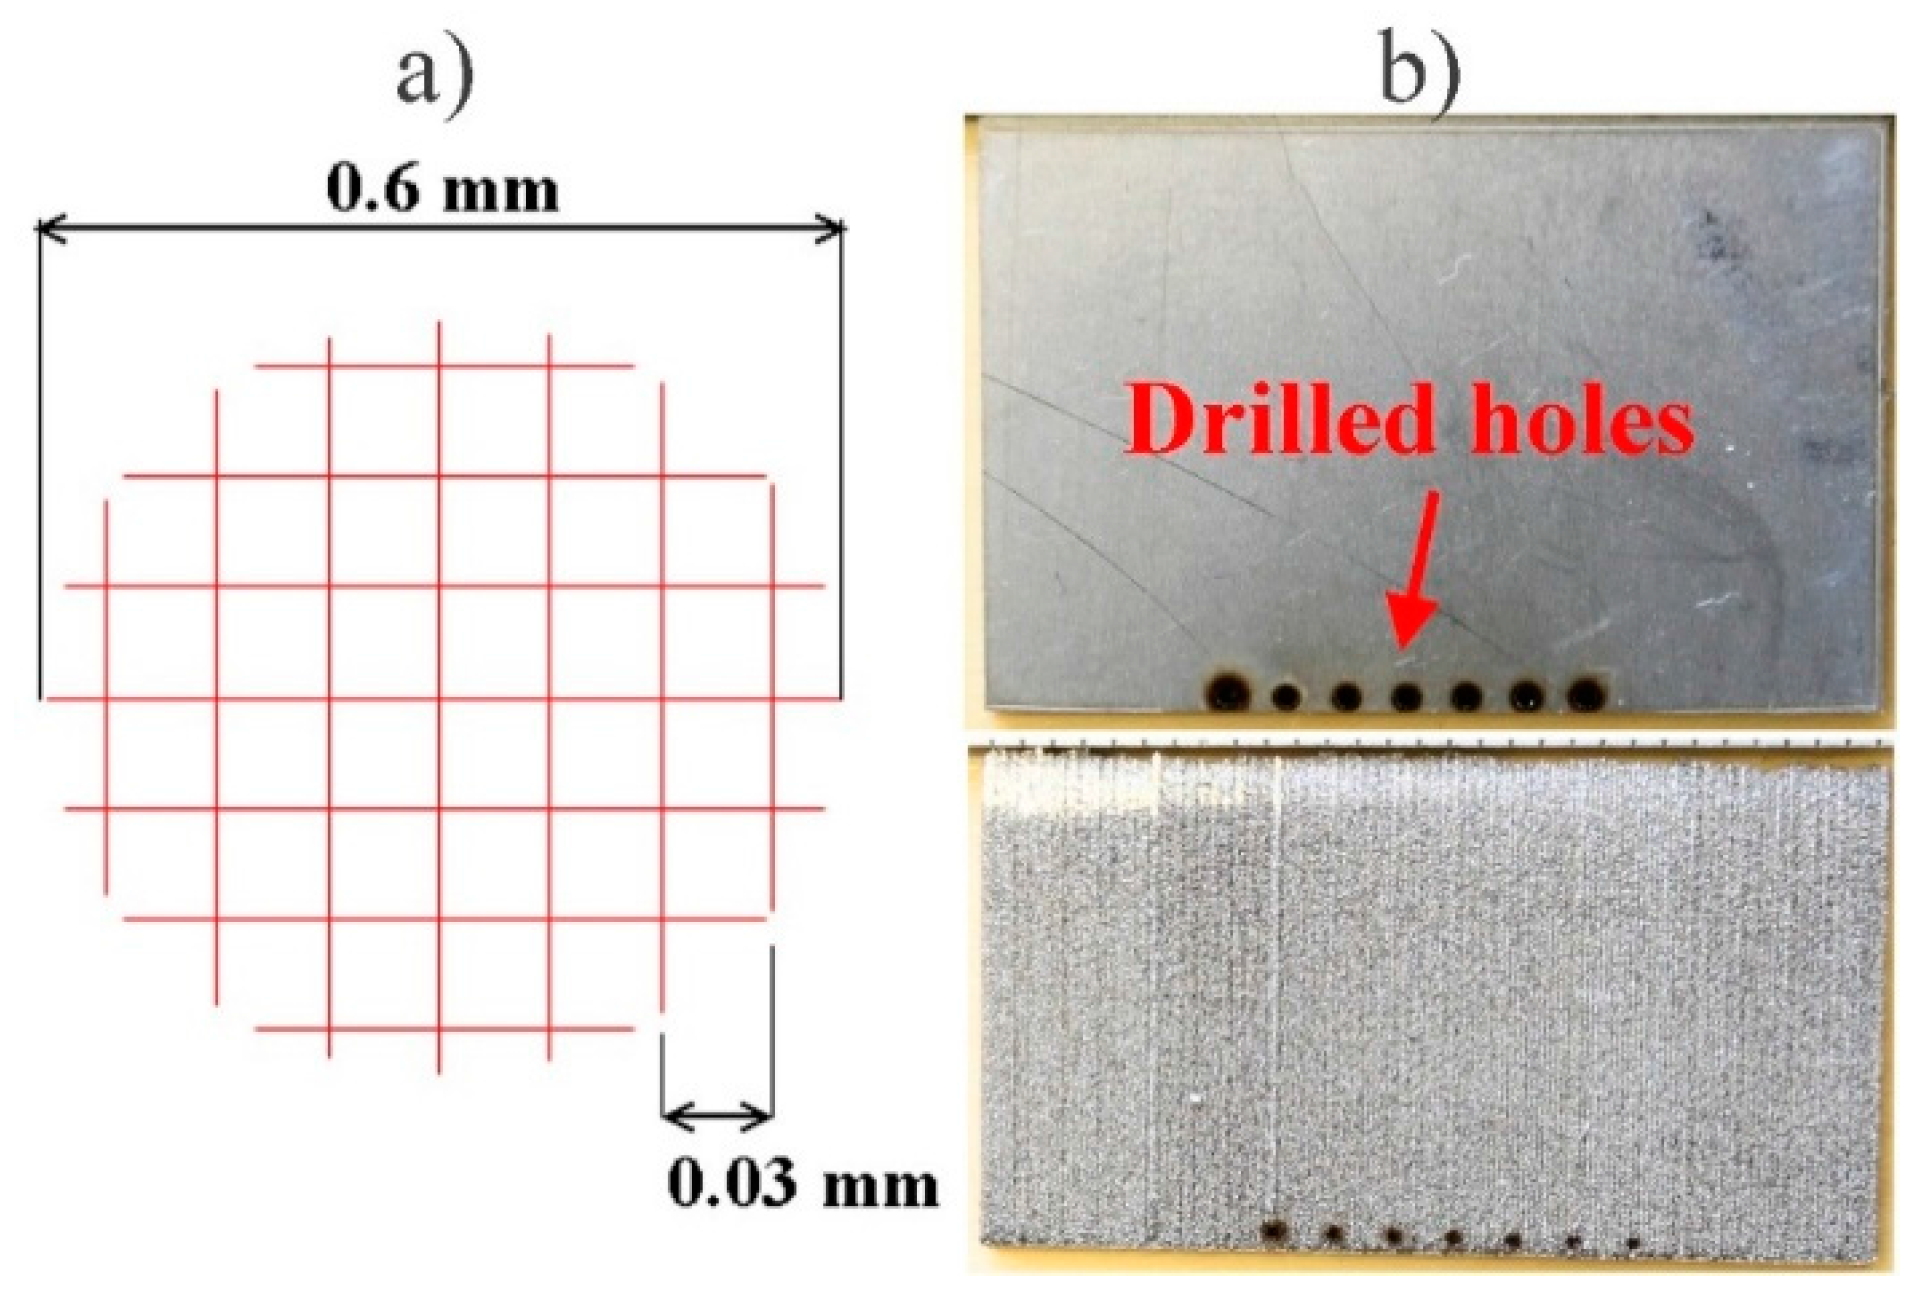
2.3. Drilling Procedure and Parameters

Seven holes were drilled on each plate, near the edge. Different waveforms and other laser parameters were used for each of the seven holes. The parameters are listed, and different waveforms shown in Table 3. Maximum pulse repetition rates (PRR) corresponding to the pulse length were used. Laser beam speed was kept at 2000 mm/s, except for those pulse lengths where the PRR was so low that the speed had to be lowered to keep the minimum pulse overlap. Minimum pulse overlap was 50% to ensure even material removal. Waveforms are shown in Table 3, where the X-axis is time, and the Y-axis is radiation intensity, in order to illustrate the temporal shapes of the laser pulses.
Drilling was not performed by any of the common drilling methods such as percussion or trepanning techniques, but rather by engraving, in order to find out whether it can be a competitive method for producing holes. The engraving was performed by moving the laser beam in the pattern shown in Figure 3a. During drilling, the work piece was moved higher so that the focal point was always near the surface, until a through hole was achieved. The focal plane was adjusted up to 100 times, depending on the laser parameters. The drilling was stopped while adjusting the focus, which allowed the work piece to cool down between the cycles. After full penetration, up to 10 additional drilling cycles were repeated at the lowest focal point to ensure as clean an exit hole as possible. The holes were drilled near the edge (as seen in Figure 3b) to make it easy to produce micrographs from the cross-sections of the holes by grinding the excess material from the edge.

2.4. Measured Properties

Material removal rates, entry and exit hole diameters, hole tapers, and the widths of the burning effect (BE) on the surface, near the entry and exit holes, were measured and compared. Additionally, some microstructural analysis was carried out. Figure 4 shows where the hole diameter and BE measurements were taken, with example images taken from the drilled cold rolled sheet. For the purpose of microstructural analysis, the two sample sheets were ground and polished as close to the middle line as possible to show the cross-sections of the holes. Polished samples were then etched to show the microstructure of the material. A light microscope and a scanning electron microscope were used to take magnified images of the hole profiles.
Eight measurements were taken of each drilled hole (see Figure 4a), and the average value was used for the hole diameter calculations. Three measurements were taken of the BE (see Figure 4b) where the width of the BE was determined visually from the magnified images, and the average value was used. It was reasonably clear from the magnified images where the base material began to change color to yellow, but since the measuring process was done manually, there is likely some error present. The amount of possible error was estimated by measuring the distance from ‘where the color of base material has clearly changed’ to ‘where the color of base material has clearly not changed’. The error estimation was done for each BE measurement. Entry and exit holes were measured separately for both the hole diameter and BE. Hole tapers in degrees were calculated by a simple trigonometric equation:
Hole taper = (180/π) tan−1 (r1 − r2)/h
where r1 and r2 are the radii of the entry and exit holes, and h is the thickness of the material.
Material removal rate was calculated by the removed volume and measured drilling time. Since the drilled holes were shaped almost exactly like circular truncated cones, the volume was easy to calculate from knowing the entry and exit hole radii, and the thickness of the material. Exact material thicknesses were measured from the micrographs and used in the calculations. Since the cold rolled steel sheet was found to be slightly thicker, the exit hole diameters for the cold rolled samples were measured at a depth corresponding to the thickness of the PBF sample. Volume was then divided by the drilling time to get the material removal rate (MRR) in cubic millimeters per minute.
Scanning electron microscope (SEM) images of both the PBF and cold-rolled steel samples were taken to examine any significant differences in the material microstructure. A Hitachi SU3500 scanning electron microscope was used for the imaging.

3. Results and Discussion
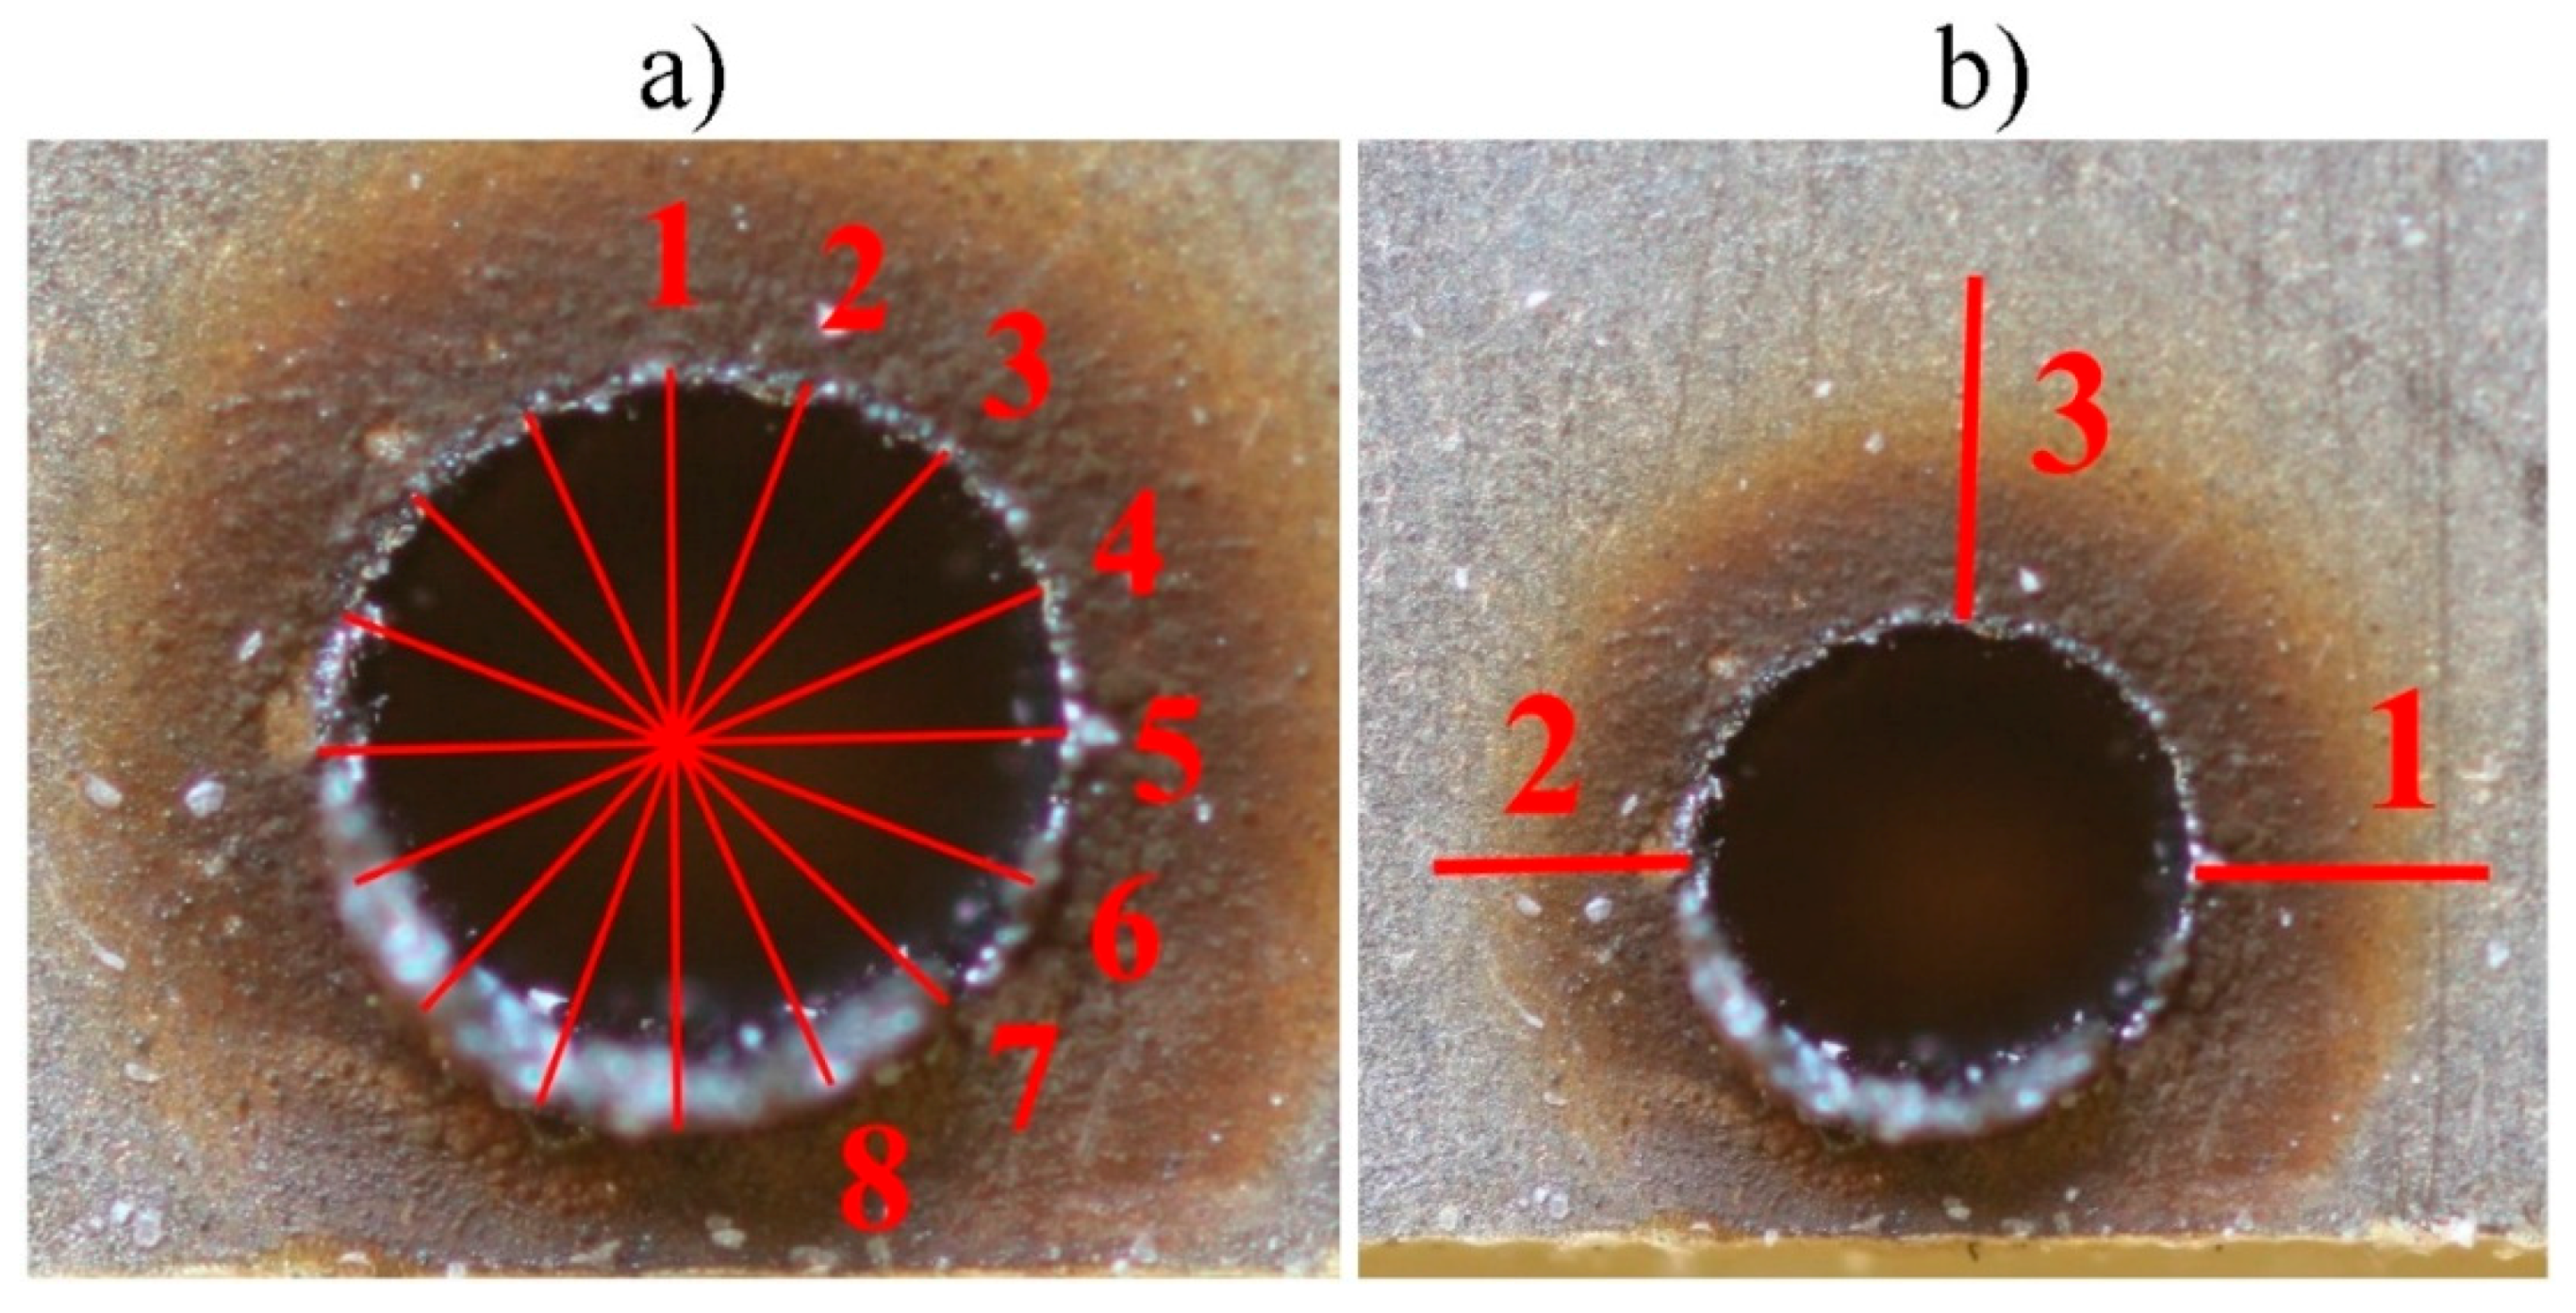
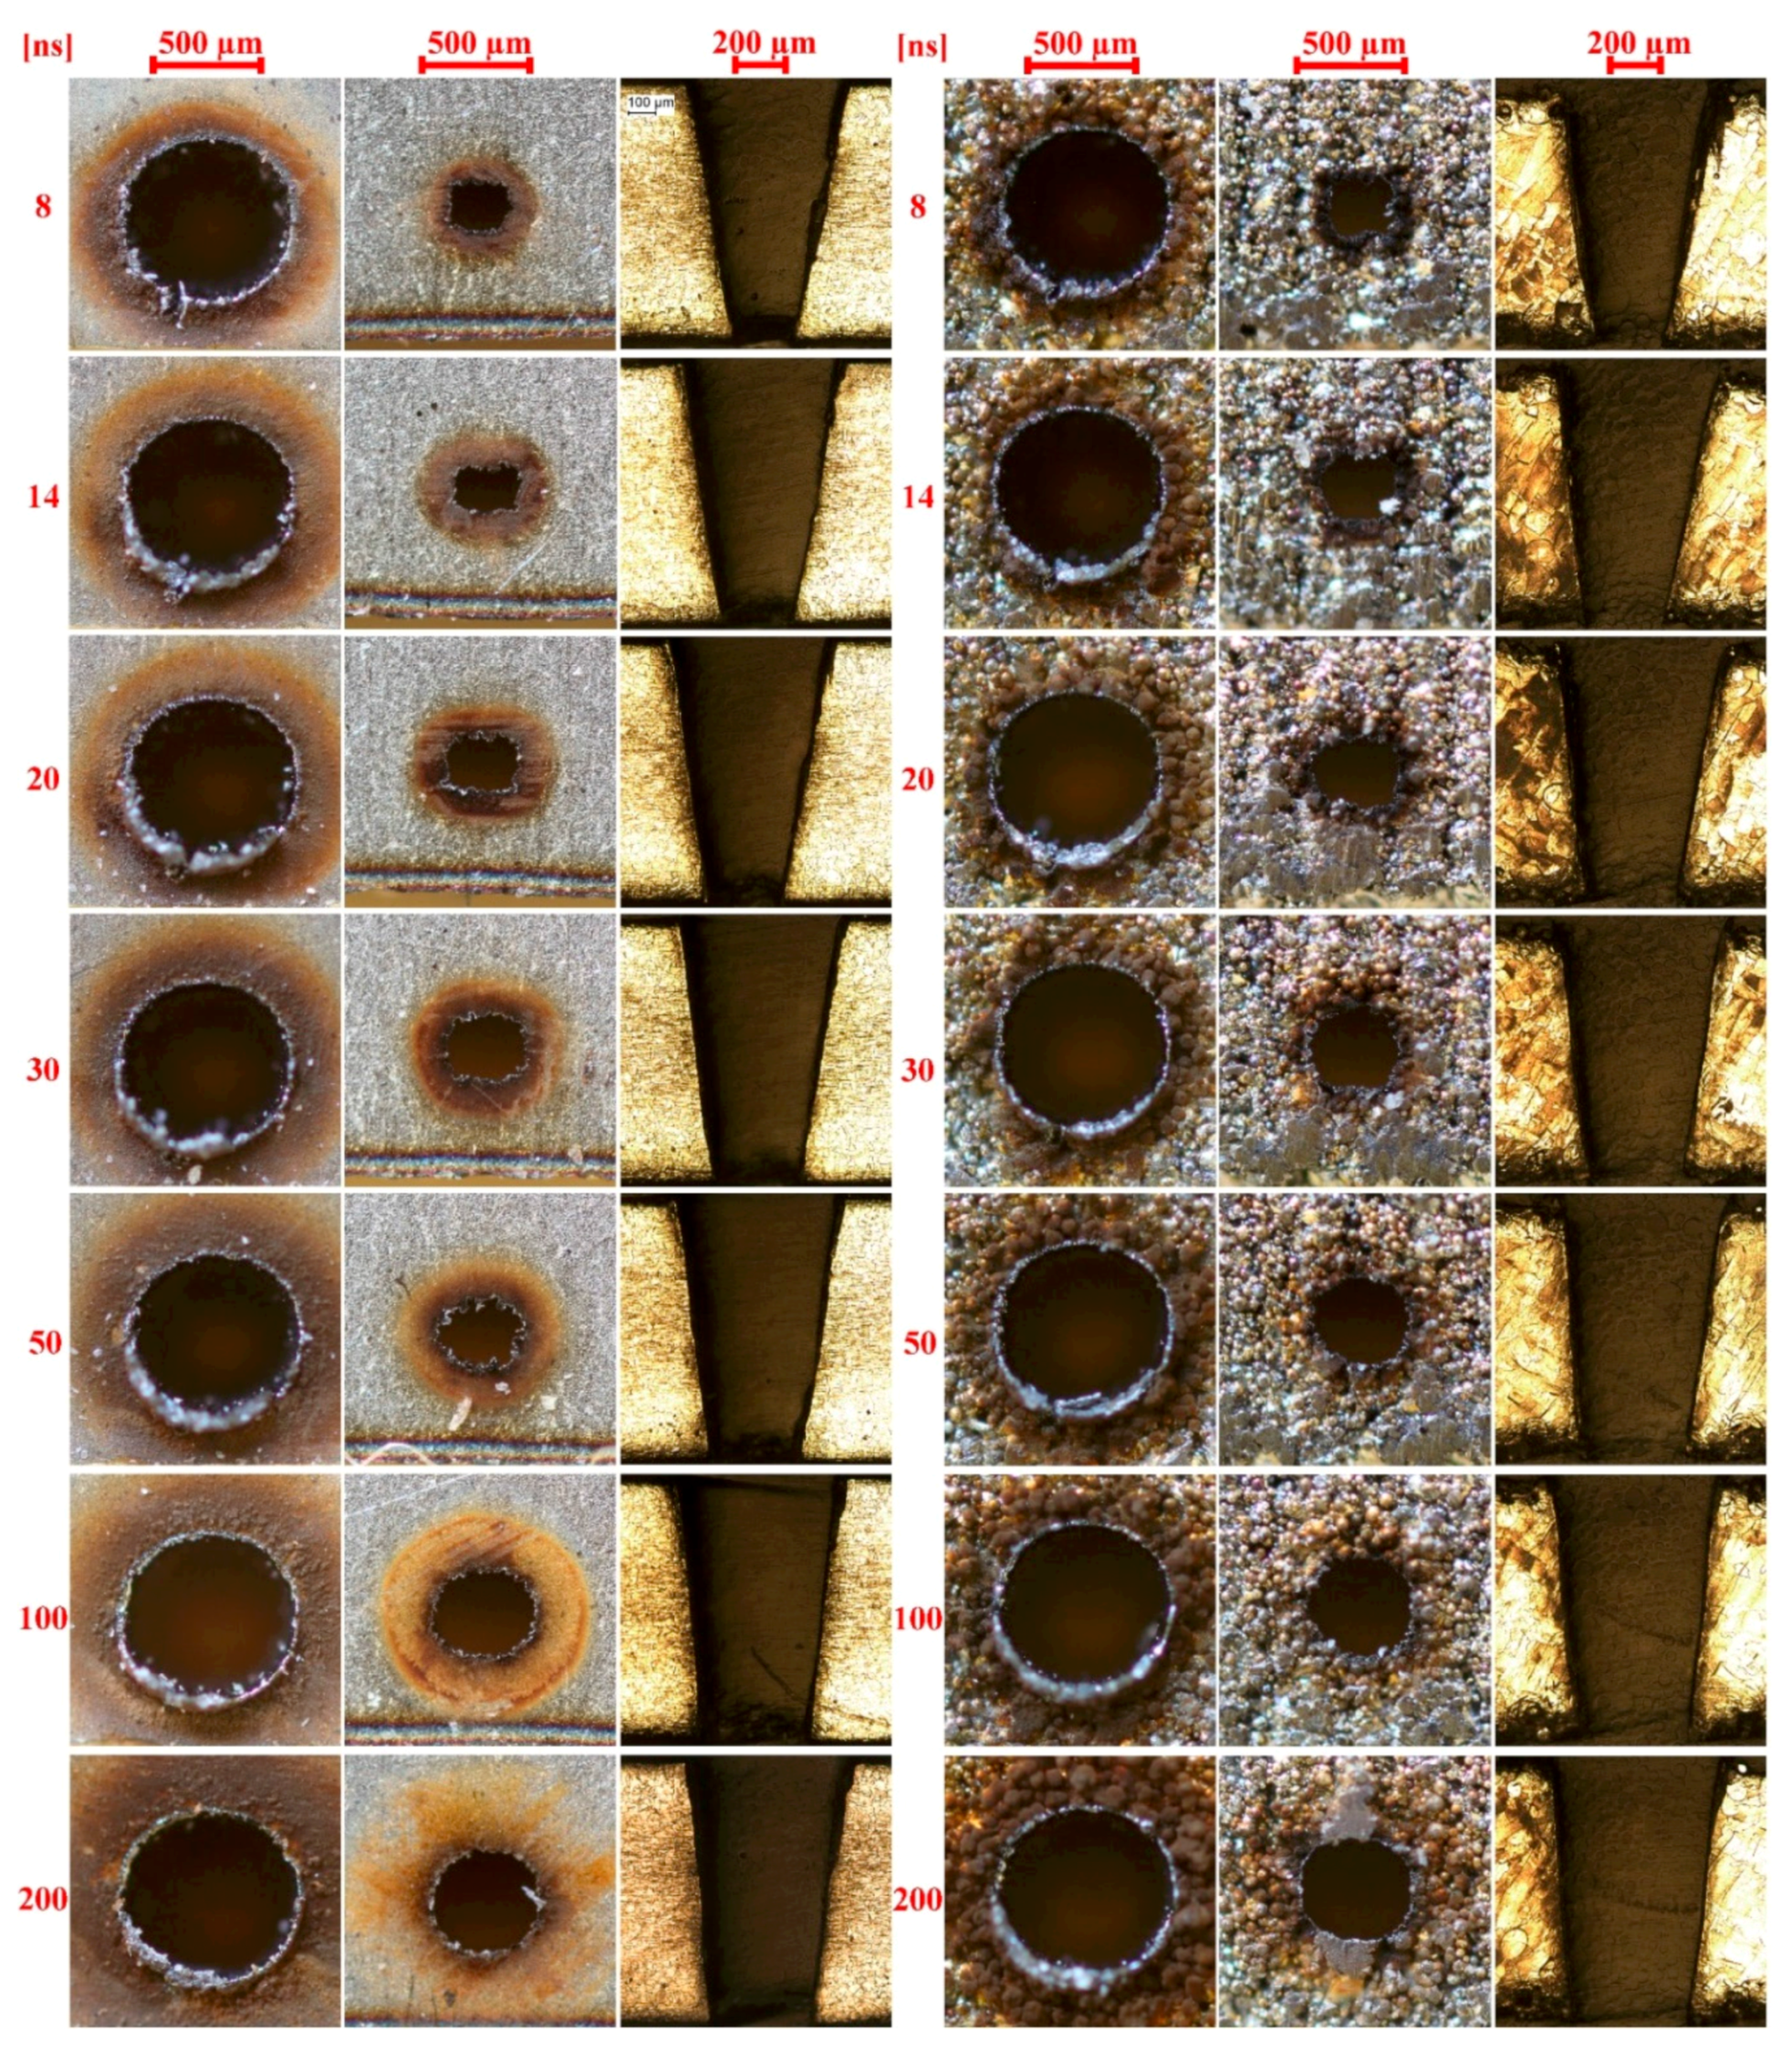
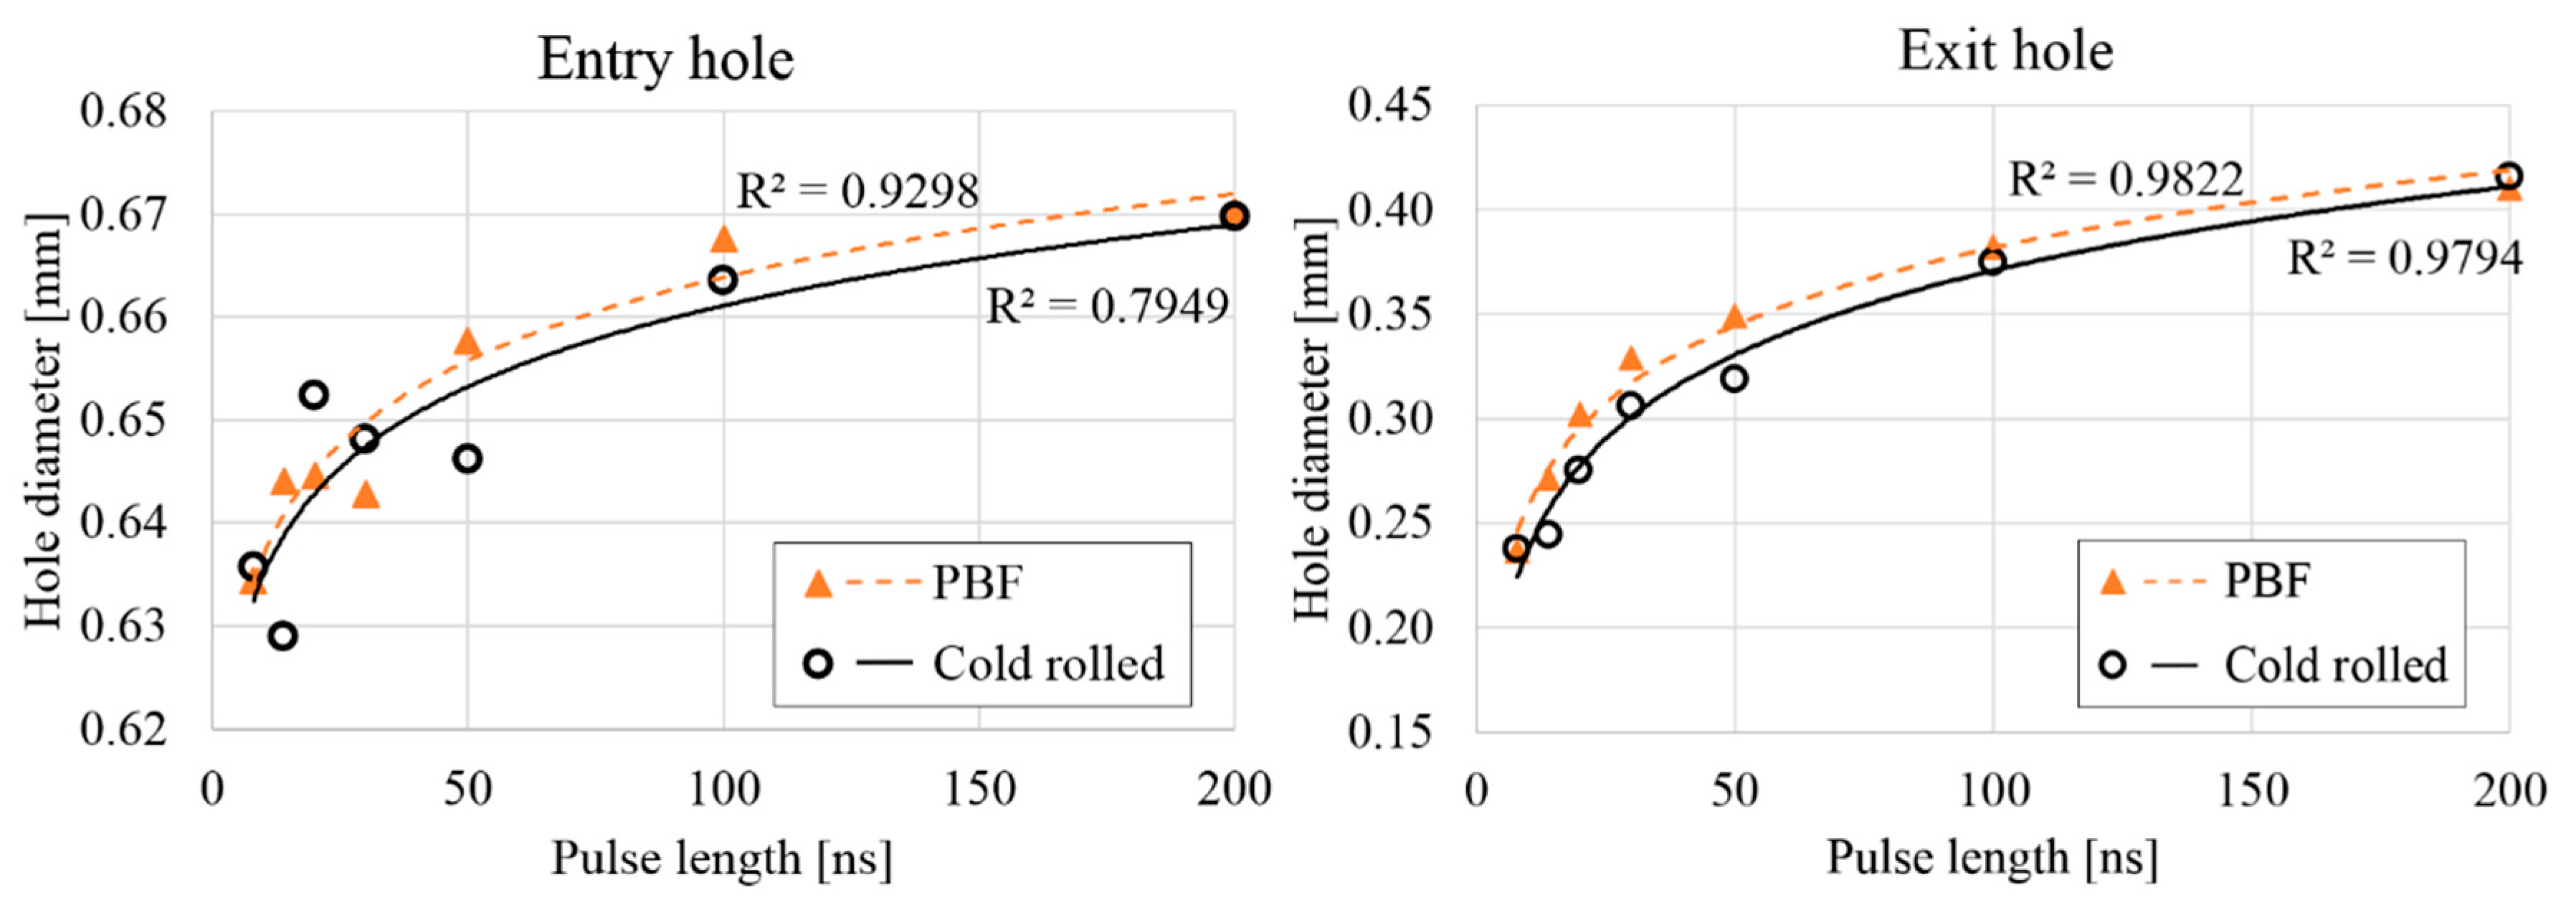
The main results of the study are compiled into the following five sections. The study focuses on comparing the results to find differences between laser engraving of cold rolled steel and PBF steel. The individual quality of the holes is of less importance. Magnified images of the entry and exit holes, and the micrographs of the hole profiles, are shown in Figure 5. Images for the cold-rolled steel sheet are shown on the left, and for the PBF sheet on the right.

3.1. Hole Diameters

Hole diameters for the entry and exit holes can be seen in Figure 6. The target diameter for the holes were 0.6 mm, so it can be seen that the entry holes are a bit larger and the exit holes are much smaller than the target diameter. Too large entry holes can usually be fixed by using a large enough beam offset with the control program. However, even with corrections, it is difficult to prevent entry hole erosion due to the upwards melt flow, as discussed by Li et al. [32]. In practice, the entry hole will always be slightly rounded in laser drilling, unless the material is directly vaporized by a high enough power density. The hole diameter clearly increases with increasing pulse length. This can be attributed to the higher pulse energy and longer interaction with the material, which leads to more molten material being ejected by vapor pressure. When the pulse length is longer than 50 ns pulses, the hole diameters seem to increase nearly linearly with the increase in pulse length. When the pulse length is shortened to less than 50 ns, the hole diameters start to decrease rapidly. It is commonly known that when the pulse length is reduced to the picosecond range, the laser-induced material removal starts to resemble so-called cold ablation, where material is removed with only minimal heat effect [33]. The decrease in hole diameter seen here is likely the beginning of a transition from a highly thermal process, where the primary mechanism of material removal is the ejection of molten material by vapor pressure, to material removal by direct evaporation.
According to the results, there is at most a very slight difference between laser drilling cold rolled steel and PBF steel. On both sides, the differences are almost negligible. In four instances, the holes in cold rolled sheet are slightly larger, but overall the holes in PBF sheets are slightly larger.

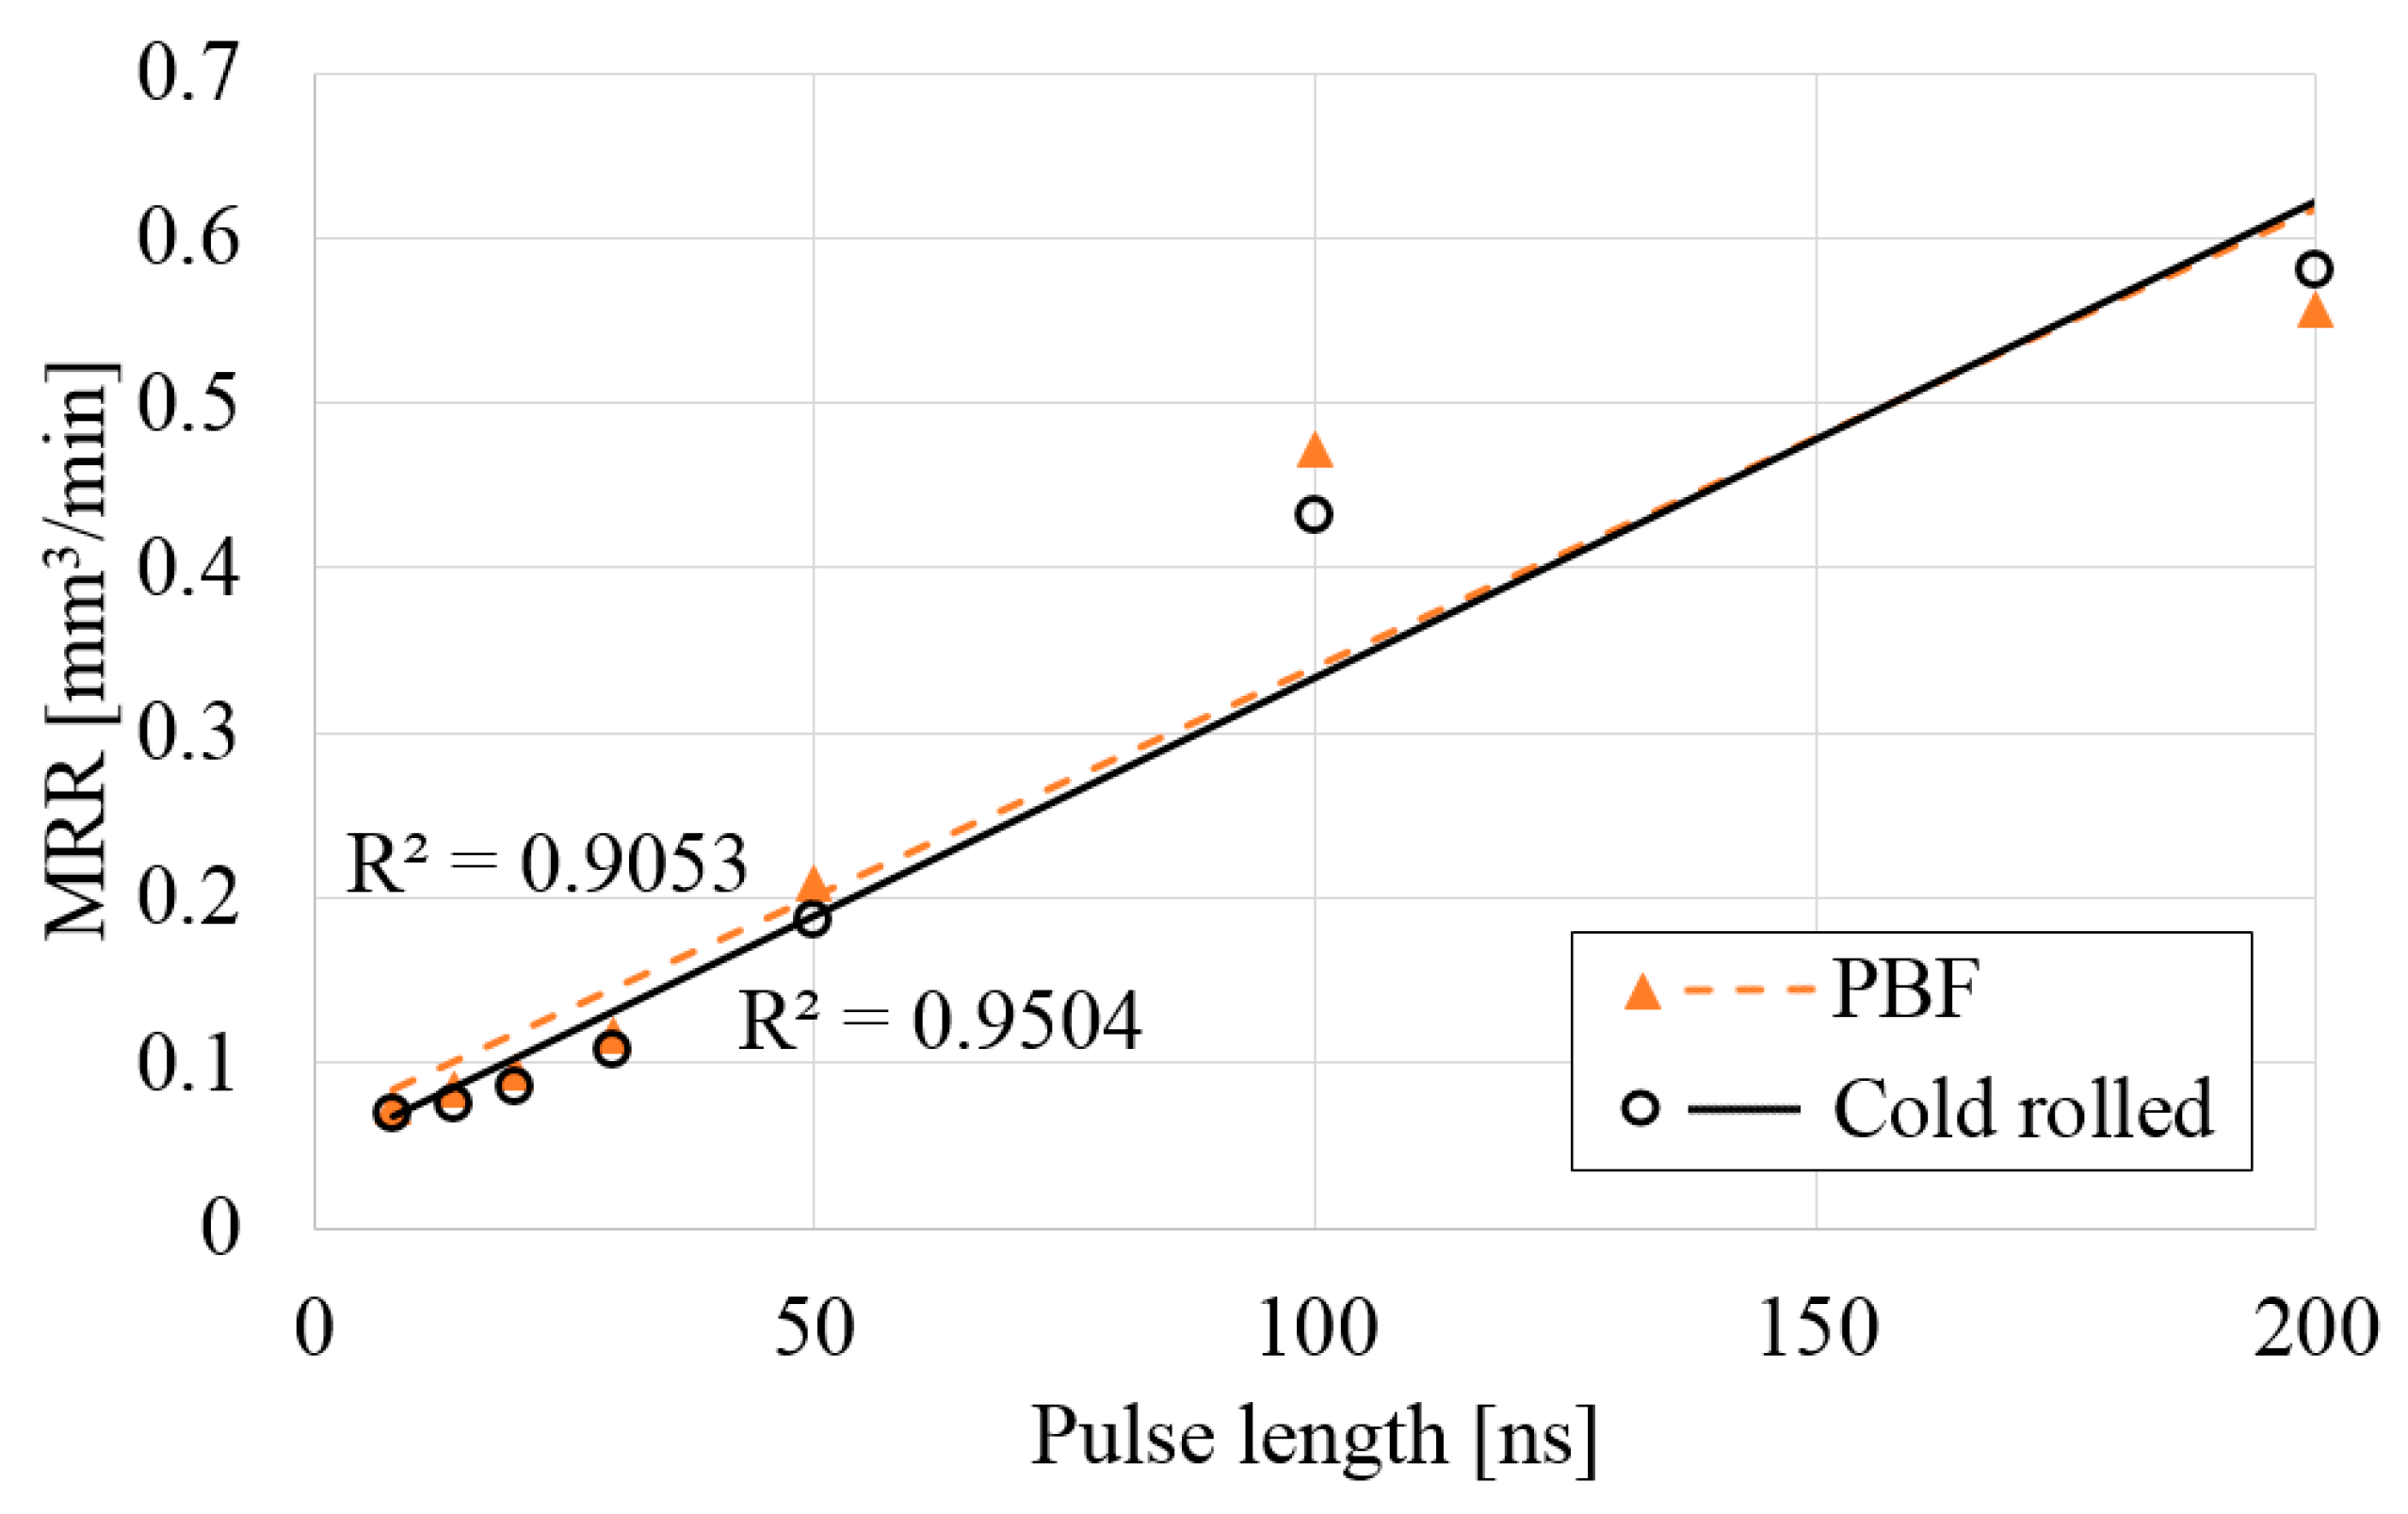
3.2. Material Removal Rate

Material removal rates for all of the drilled holes are shown in Figure 7. The process becomes significantly faster with the increase in pulse length: the drilling is over six times faster with the longest pulse length compared to the shortest. The increase is fairly linear. Similar results have been published by von Allmen, who investigated the effect of pulse duration on drilling depth in the microsecond range, and Manninen et al., who investigated the same in the nanosecond range [34,35]. No significant difference can be noticed between the cold-rolled sheets and the PBF sheets. Generally, the MRR is about 0–10% higher when PBF sheets were drilled, except in the 200 ns case, when the cold-rolled sheet was drilled 4% faster.
Similar to the results in hole diameters, the significant increase in material removal rate following an increase in pulse length can be attributed to a longer interaction time between the laser pulse and the base material. As the laser pulse heats up and eventually melts a portion of the base material, the resulting melt pool will be ejected from the bottom of the drilled hole by vapor pressure. The longer the interaction time, the more material will be melted, and thus ejected. It is surprising how significant this effect is, given that the same average laser power was used for both 200 ns and 8 ns processing. Compared with drilling with 200 ns pulses, six times more energy had to be used when drilling with 8 ns pulses. The excess energy likely heated up the base material, provided the beam was not reflected. However, compared with longer pulses, the melt ejection phenomenon could not last as long, since the pulses were much shorter. Instead, the majority of the pulse energy likely went into heating up the base material instead of material removal. As the pulse length was increased, a higher portion of the pulse energy was expended in actual material removal once the material was molten. This problem seems to exist only in the range of tens of nanoseconds to hundreds of picoseconds, because at ultrashort pulse regime (picosecond to femtosecond), the power density is so high that the material is directly vaporized.

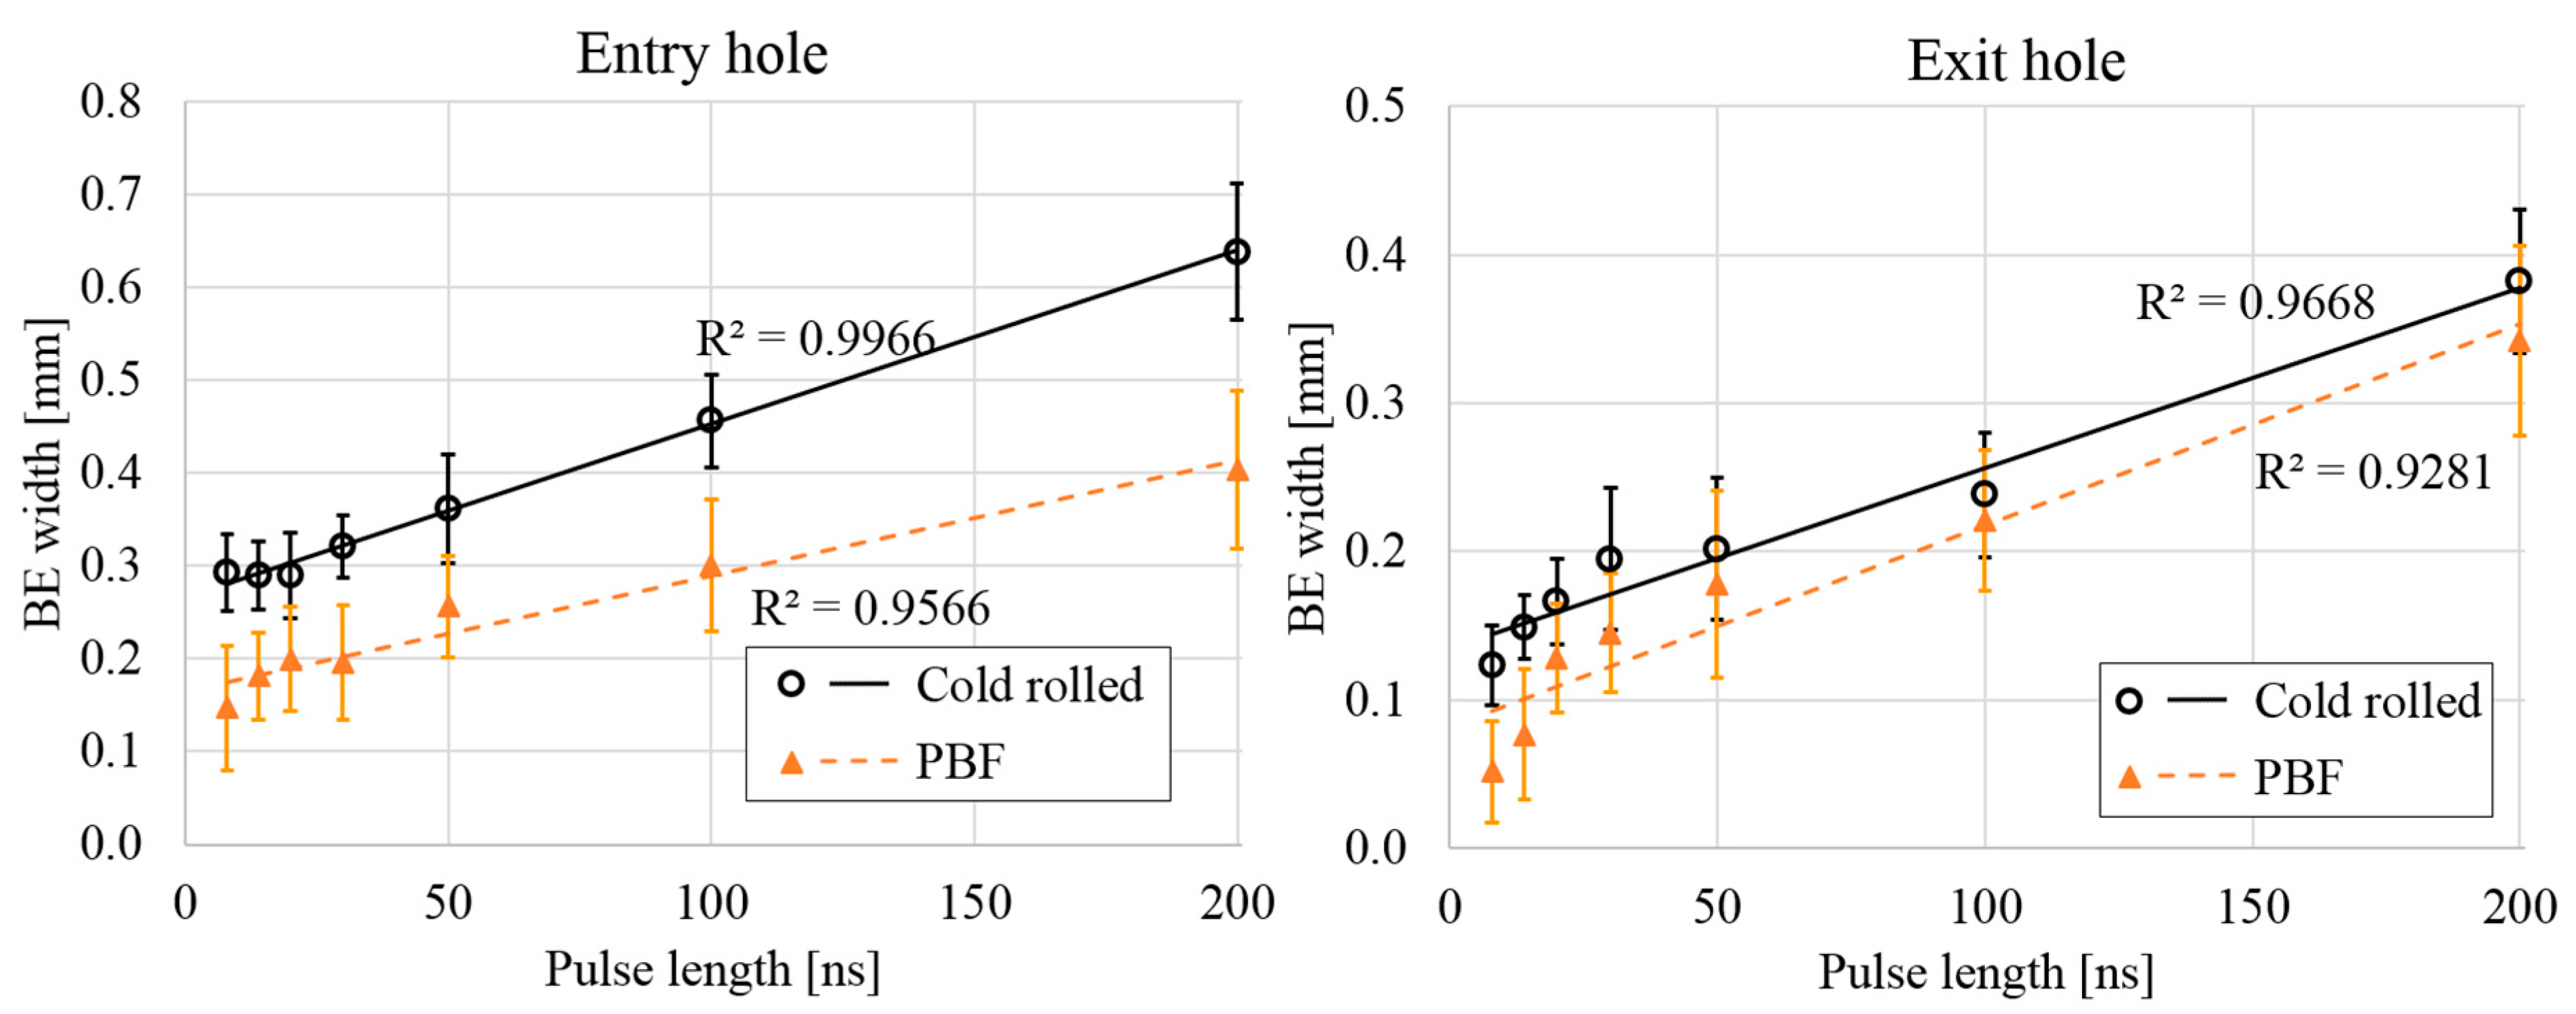
3.3. Burning Effect Width
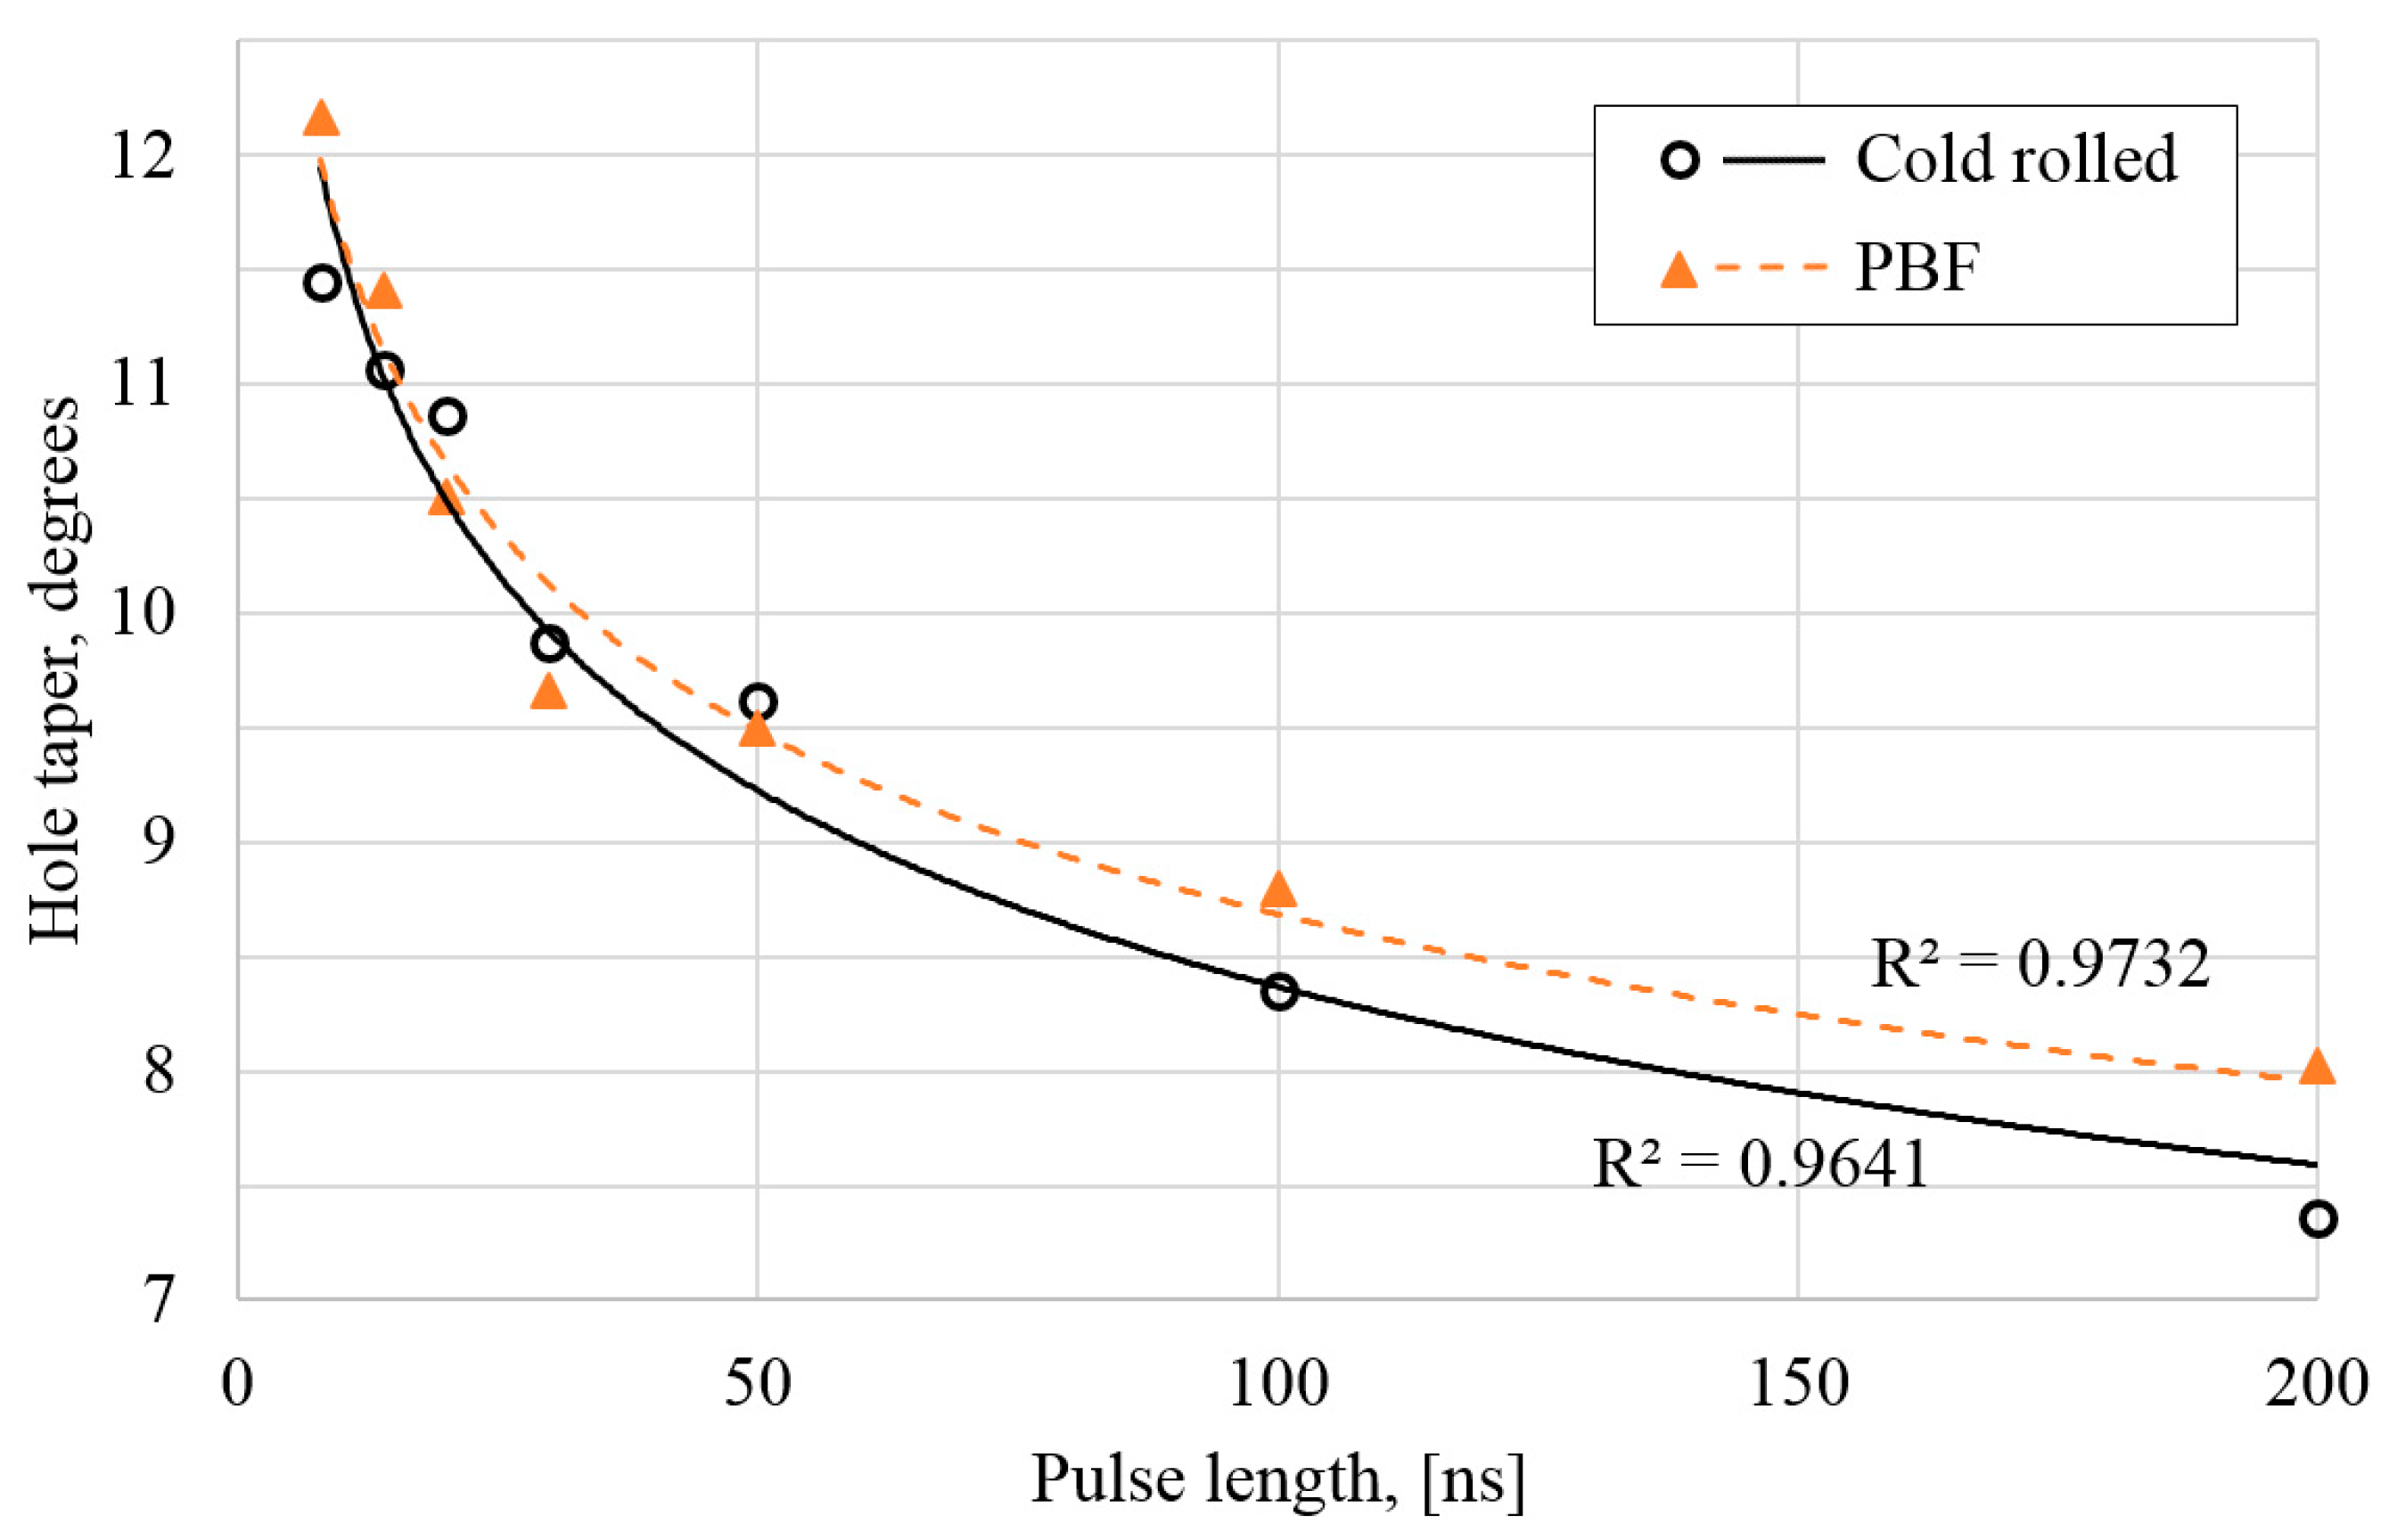
BE width for both the entry and exit holes can be seen in Figure 8. The BE width seems to increase nearly linearly in all cases, which indicates that the processing temperatures increase with the increase in pulse length. At the shortest pulse lengths, the BE width seems to start decreasing more rapidly. According to the heat temperature map published by the British Stainless Steel Association, the yellow to dark brown color seen in the samples indicate temperatures in the range of 57–673 K (30–400 °C) [36]. This agrees well with the previous findings published by the authors [34] where the processing temperature in engraving was measured with thermocouples.
There are significant differences between the samples, even after accounting for the darker color and rough surface of the PBF sheets that made it more difficult to estimate where the color began to change. For the entry hole, there is on average almost a 0.25 mm difference in the width of the BE, which indicates higher temperatures on the surface of the cold-rolled sheet. It should be noted, however, that the surface of the PBF sheet is rough and consists of ball-like formations. The roughness of the surface can be seen from the magnified images taken of the surface of the PBF sheet and from the hole profile micrographs. The PBF sheets clearly have a much larger effective surface area. The increase in surface area should help dissipate heat faster, thus resulting in a smaller BE on the PBF sheet.

3.4. Hole Taper

Hole taper in degrees for all the drilled holes is shown in Figure 9. It can be seen that the taper decreases with increase in pulse length for both materials. No significant difference in hole taper between the two sheets can be recognized; in four cases, the holes drilled in the PBF sheet have higher tapering, and in three cases, the holes drilled in cold-rolled steel sheet have higher tapering. At its highest, the difference is 0.7 percentage units, but mostly it is much less than that.
More interesting than the amount of taper is the shape of the tapering. Hole tapering in laser drilling has been reported many times, but it is almost always shaped like letter Y, i.e., the taper is not constant throughout. Instead, there is significant tapering close to the entry hole, after which the width of the hole stays mostly constant [32,37]. Drilling experiments in this study resulted in almost perfectly conical holes, due to the technique that was employed. Based on these results, it is difficult to say what exactly causes the taper angle to increase so rapidly with the decrease in pulse length. It can be concluded that holes with well-defined edges, but with high tapering, can be achieved with drilling by engraving without special optics to tilt the laser beam.

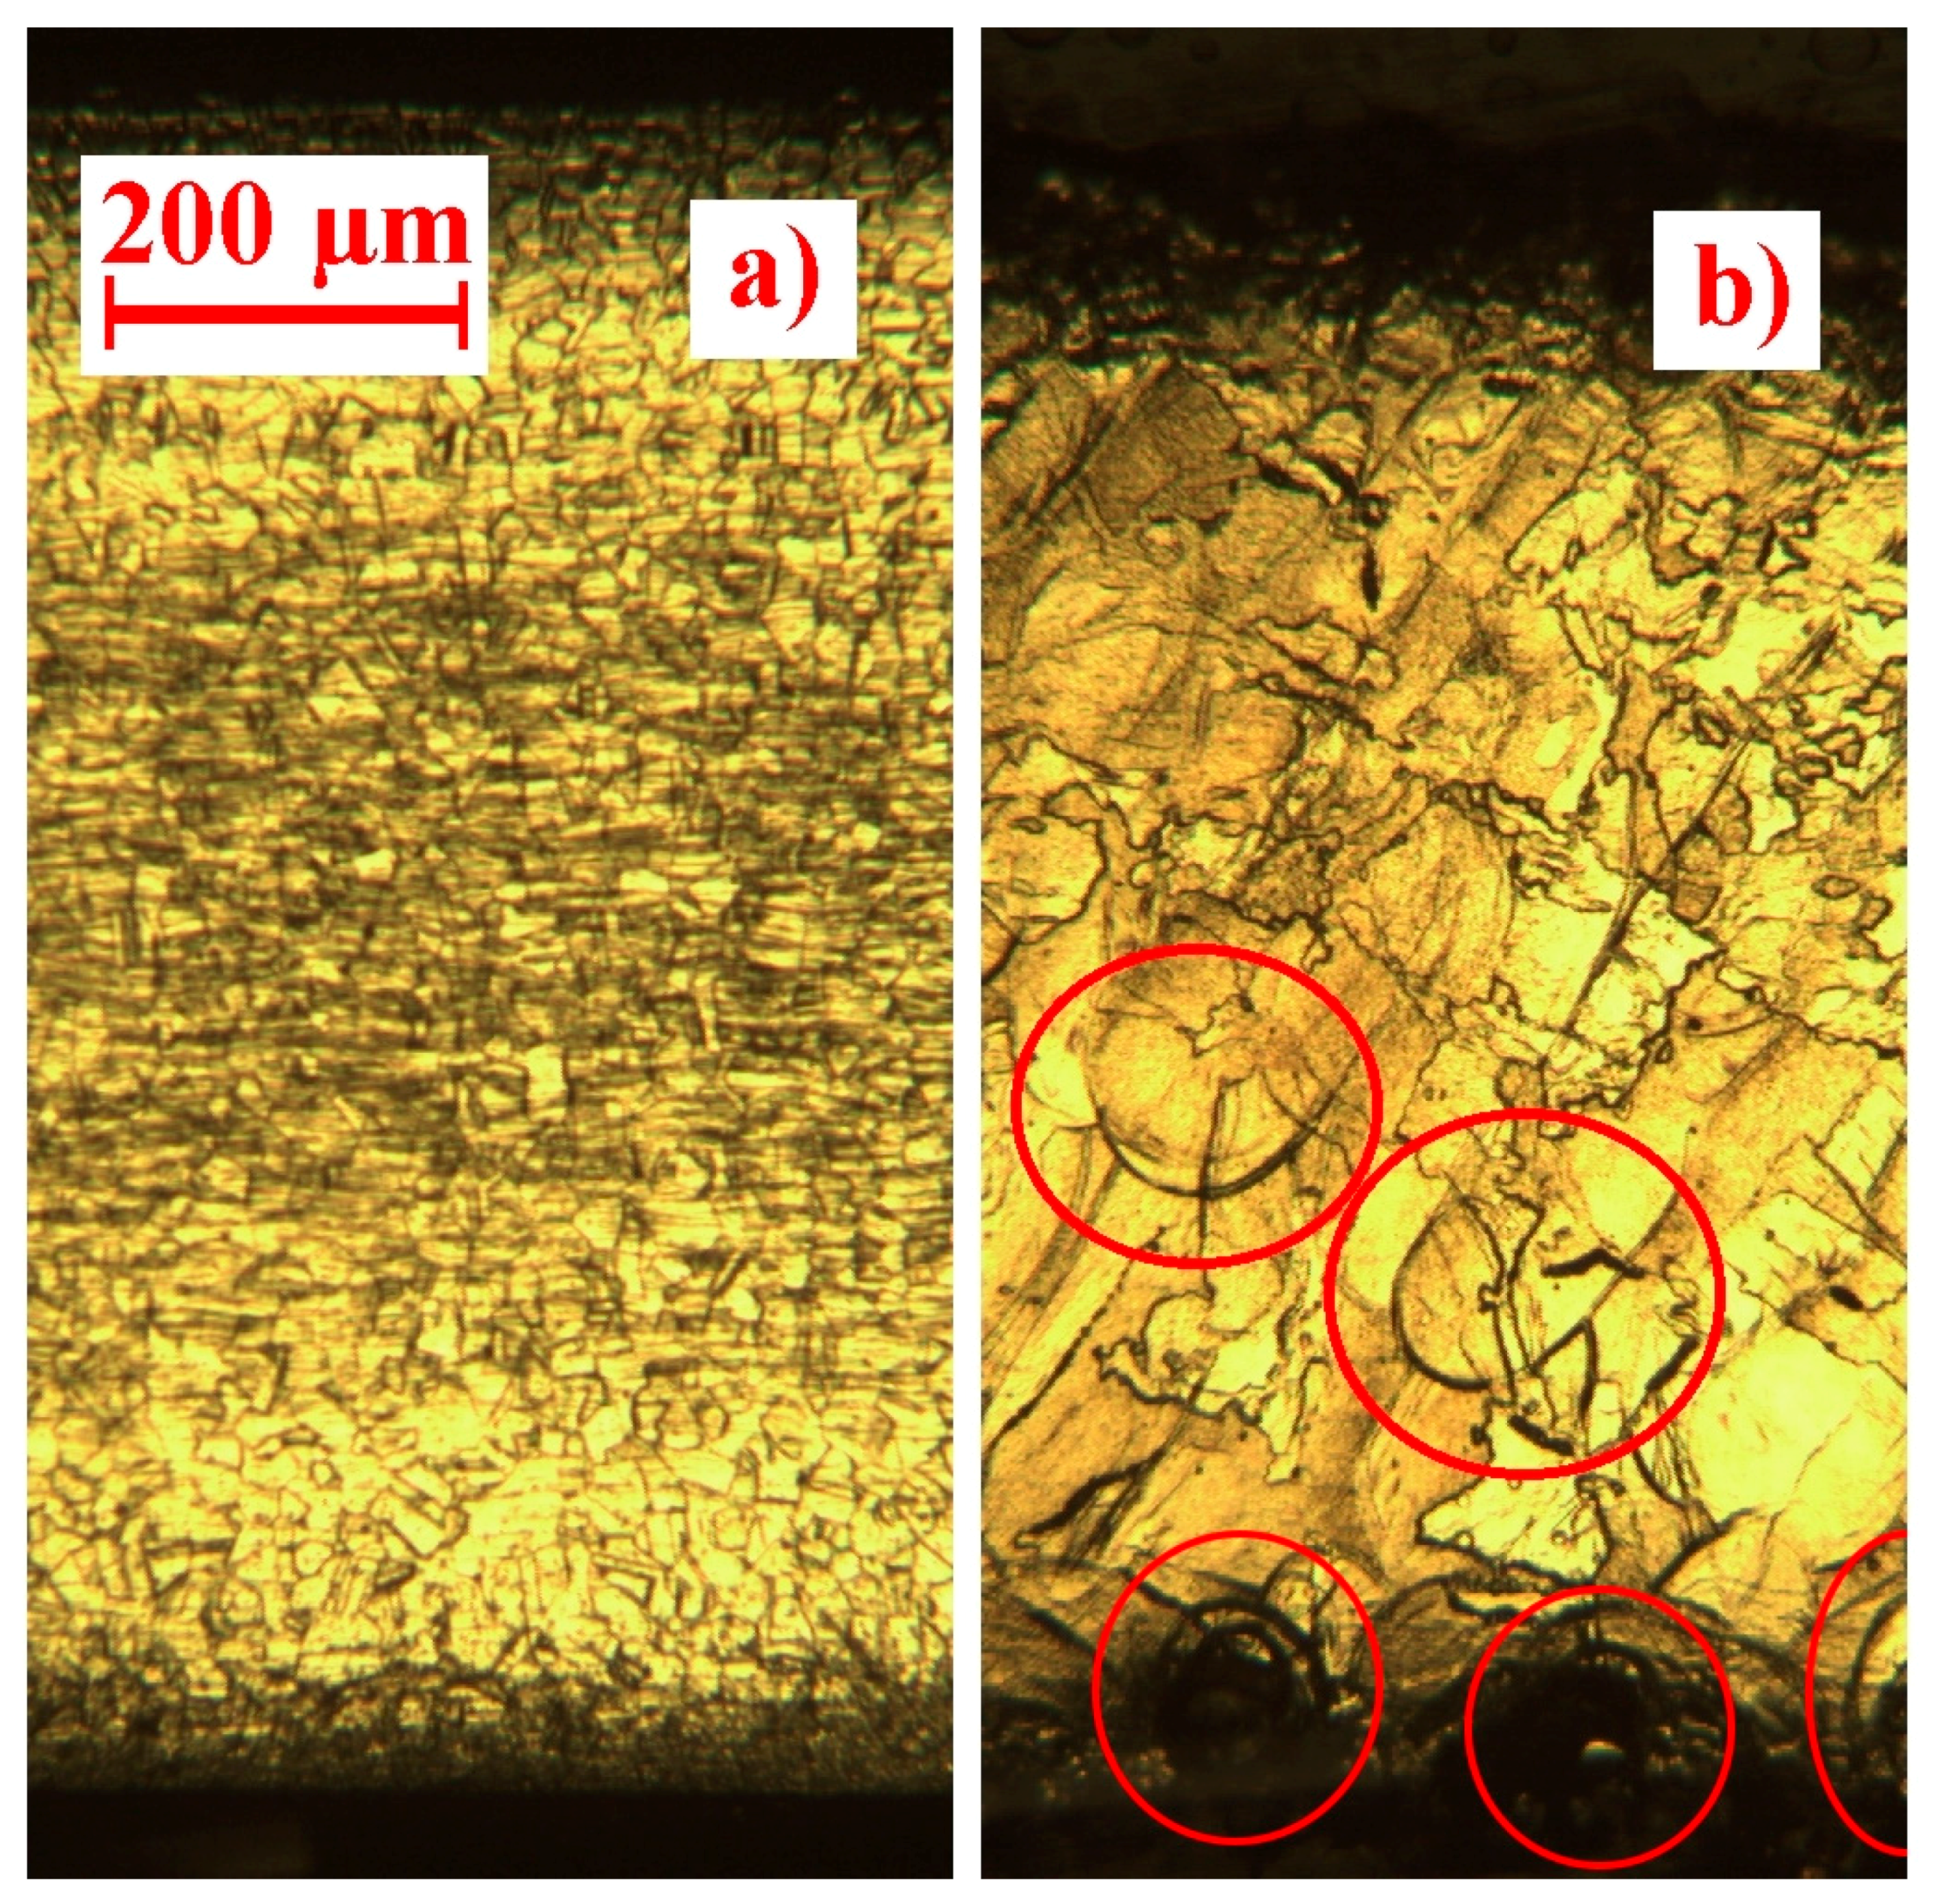
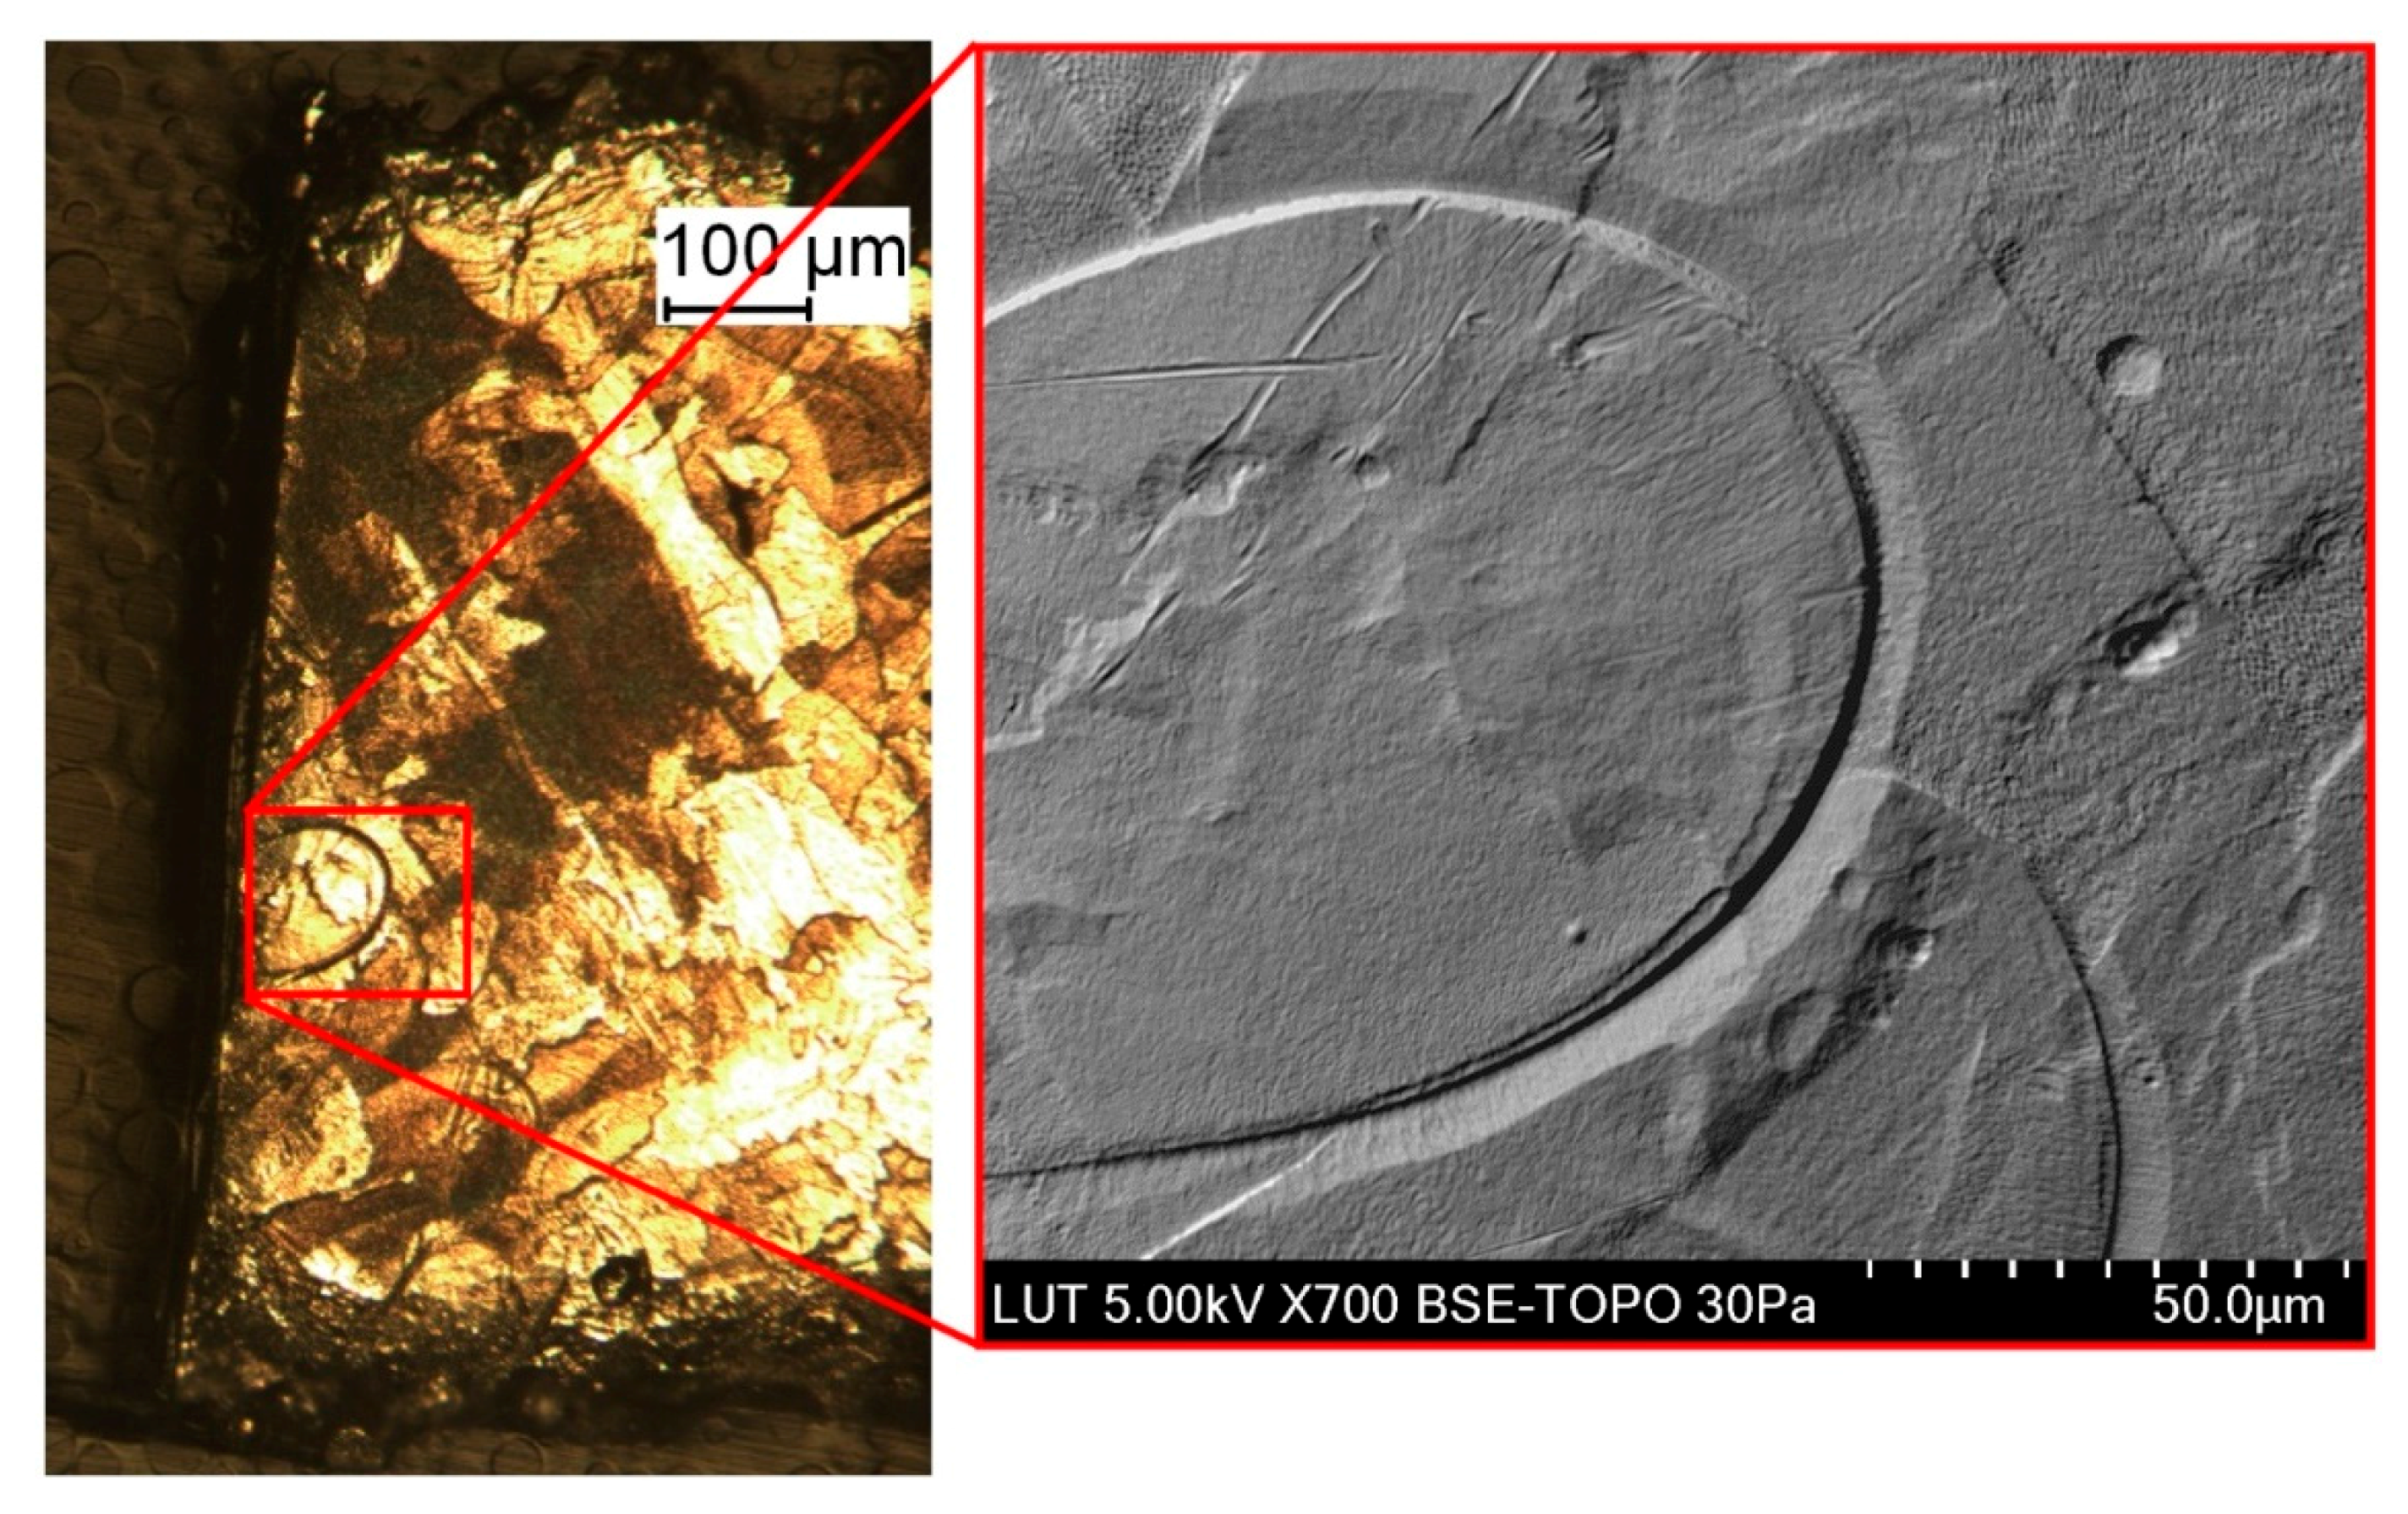
3.5. Evaluation of the Microstructures

The first micrographs of the samples were taken with a light microscope. Figure 10 illustrates the differences in microstructure between the cold-rolled and PBF sheets. The images were taken of the same surface as the hole profiles. Thus, the PBF sheet shows one melted layer, instead of a cross-section of multiple layers.
The cold-rolled sheet seen in Figure 10a has a typical austenitic stainless steel microstructure with a homogenous grain size and structure. No pores or other defects could be seen. The PBF sheet shows a much more irregular grain size pattern, but it still seems to be solid material with only few small pores. However, there are some circular patterns that can be seen as black lines in the PBF micrographs (examples circled in red in Figure 10b). After comparing them to the laser hatch pattern used in the production of the PBF sheet, it can be said that these are likely either the start or end points of laser lines. To find out what these dark lines look like at higher magnification, a scanning electron microscope was employed to analyze the topography of the surface. In Figure 11, a topographic image of a similar occurrence of a semicircle-like pattern can be seen.
From Figure 11, it can clearly be seen that the black lines in the PBF material are shallow recesses in the material. It can also be seen that they do not follow the grain boundaries. They are only about 10 μm deep and 10 μm wide and exist near the bottom and top surfaces of the material, and at the end and start points of the laser lines used in the hatch pattern when the sheet was produced. Overall, there seem to be too few of these defects, and they are not large enough to have a significant effect on the engraving process.

4. Conclusions

According to the results, the differences between laser engraving PBF and cold-rolled steel sheets seem to be negligible, or at most very small. The material removal rate, including drilling time and removed volume of material, was 0–10% higher for the PBF sheets. Generally, the holes drilled in PBF sheets were slightly bigger in diameter, and had a slightly higher tapering, up to 0.7 percentage points. The width of the BE on the material surface at the entry side was up to 0.24 mm smaller for the PBF sheets, which is a significant difference, since the drilled holes were only 0.6 mm in diameter. The difference in BE widths were attributed to the different surface topographies. From the magnified images of the PBF material surface, it can be easily seen that the surface of the material is very rough. The surface consists of small round particles with an average particle size of 32 μm (100 measurements), which is very close to the raw powder average particle size of 40 μm. The much higher effective surface area of PBF sheets likely dissipates heat more effectively, which results in a smaller BE. It should also help with the initial absorption of the laser beam, but in deep engraving this is not very significant.
Some defects were found when analyzing the microstructure of the PBF sheet. Semicircular black traces were seen at the start and end points of the laser lines, as well as near the surfaces of the PBF material. These were found to be shallow recesses in the material. It is unclear whether they were produced by the PBF-building process, or by the grinding and polishing when the samples were prepared for the micrographs. A likely explanation would be that there are deviations in energy input at the start and end points of the laser lines that causes detrimental changes in the material structure, or causes some of the powder material to not properly melt. The nearly loose material that was not fully fused was then removed when the sample was prepared for analysis. Near the surfaces of the material, these circular defects are not semicircular anymore, but rather full circles of shallow recesses. It seems as if a few powder particles were fused together, but were not fully fused to the surrounding material. Thus, two types of visible defects were noticed in the PBF material compared with the cold-rolled material: (1) powder particles near the surfaces of the object that are not fully fused to the surrounding material, and (2) semicircular defects at the end and/or start points of the laser lines. However, it can be concluded that it is very unlikely that these had a significant effect on the laser engraving process, since the recesses are so small and sparsely located.

Acknowledgments

This study was conducted in Finland as part of the research project “Micro- and millistructured reactors for catalytic oxidation reactions”, abbreviated MICATOX. The financial support of The Academy of Finland and the participants of the project are gratefully acknowledged.

Author Contributions

Matti Manninen, Ville-Pekka Matilainen and Antti Salminen conceived and designed the experiments; Matti Manninen performed the experiments; Matti Manninen and Marika Hirvimäki analyzed the data and wrote the paper.

Conflicts of Interest

The authors declare no conflict of interest. The founding sponsors had no role in the design of the study; in the collection, analyses, or interpretation of data; in the writing of the manuscript, and in the decision to publish the results.

References

  1. Schulz, W.; Eppelt, U.; Poprawe, R. Review on laser drilling I. Fundamentals, modeling, and simulation. J. Laser Appl. 2013, 24, 1–17. [Google Scholar] [CrossRef]
  2. Rohde, H. Drilling of Metals. In LIA Handbook of Laser Materials Processing, 1st ed.; Ready, J.F., Farson, D.F., Eds.; Magnolia Publishing Inc.: Pineville, LA, USA, 2001; pp. 474–477. ISBN 0-941463-02-8. [Google Scholar]
  3. Gower, M. Industrial applications of laser micromachining. Opt. Express 2000, 7, 56–67. [Google Scholar] [CrossRef] [PubMed]
  4. Uchtmann, H.; He, C.; Gillner, A. High precision and high aspect ratio laser drilling—Challenges and Solutions. In Proceedings of the SPIE 9741, High-Power Laser Materials Processing: Lasers, Beam Delivery, Diagnostics, and Applications V, San Francisco, CA, USA, 13 February 2016; Volume 974106, pp. 1–12. [Google Scholar]
  5. Weck, A.; Crawford, T.H.R.; Wilkinson, D.S.; Haugen, H.K.; Preston, J.S. Laser drilling of high aspect ratio holes in copper with femtosecond, picosecond and nanosecond pulses. Appl. Phys. A 2008, 90, 537–543. [Google Scholar] [CrossRef]
  6. Patwa, R.; Herfurth, H.; Flaig, R.; Christophersen, M.; Phlips, B.F. Laser Drilling for High Aspect Ratio Holes and a High Open Area Fraction for Space Applications. In Proceedings of the International Congress on Applications of Lasers & Electro-Optics, ICALEO, San Diego, CA, USA, 19–23 October 2014; Paper No. M1101. pp. 204–210. [Google Scholar]
  7. Fornaroli, C.; Holtkamp, J.; Gillner, A. Laser-beam helical drilling of high quality micro holes. Phys. Procedia 2013, 41, 661–669. [Google Scholar] [CrossRef]
  8. Stephen, A.; Schrauf, G.; Mehrafsun, S.; Vollertsen, F. High speed laser micro drilling for aerospace applications. Procedia CIRP 2014, 24, 130–133. [Google Scholar] [CrossRef]
  9. Duan, W.; Wang, K.; Dong, X. Experimental characterizations of burr deposition in Nd:YAG laser drilling: A parametric study. Int. J. Adv. Des. Manuf. Technol. 2015, 76, 1529–1542. [Google Scholar] [CrossRef]
  10. Ghoreishi, M.; Low, D.K.Y.; Li, L. Comparative statistical analysis of hole taper and circularity in laser percussion drilling. Int. J. Mach. Tools Manuf. 2002, 42, 985–995. [Google Scholar] [CrossRef]
  11. Goyal, R.; Dubey, A.K. Modeling and optimization of geometrical characteristics in laser trepan drilling of titanium alloy. J. Mech. Sci. Technol. 2016, 30, 1281–1293. [Google Scholar] [CrossRef]
  12. Begic-Hajdarevic, D.; Bijelonja, I. Experimental and numerical Investigation of Temperature Distribution and Hole Geometry during Laser Drilling Process. Procedia Eng. 2014, 100, 384–393. [Google Scholar] [CrossRef]
  13. Ashkenasi, D.; Kaszemeikat, T.; Mueller, N.; Dietrich, R.; Eichler, H.J.; Illing, G. Laser Trepanning for Industrial Applications. Phys. Procedia 2011, 12, 323–331. [Google Scholar] [CrossRef]
  14. Jahns, D.; Kaszemeikat, T.; Mueller, N.; Ashkenasi, D.; Dietrich, R.; Eichler, H.J. Laser trepanning of stainless steel. Phys. Procedia 2013, 41, 630–635. [Google Scholar] [CrossRef]
  15. Li, L.; Diver, C.; Atkinson, J.; Giedl-Wagner, R.; Helml, H.J. Sequential Laser and EDM Micro-drilling for Next Generation Fuel Injection Nozzle Manufacture. CIRP Ann.-Manuf. Technol. 2006, 55, 179–182. [Google Scholar] [CrossRef]
  16. Uhlmann, E.; Oberschmidt, D.; Langmack, M. Complex bore holes fabricated by combined Helical Laser Drilling and Micro Electrical Discharge Machining. In Proceedings of the 28th Annual Meeting of the American Society for Precision Engineering, ASPE 2013, Saint Paul, MN, USA, 20–25 October 2013; pp. 195–199, ISBN 978-1-887706-63-6. [Google Scholar]
  17. Luft, A.; Franz, U.; Emsermann, A.; Kaspar, J. A study of thermal and mechanical effects on materials induced by pulsed laser drilling. Appl. Phys. A 1996, 63, 93–101. [Google Scholar] [CrossRef]
  18. Hidai, H.; Kuroki, Y.; Matsusaka, S.; Chiba, A.N.; Morita, N. Curved drilling via inner hole laser reflection. Precis. Eng. 2016, 46, 96–103. [Google Scholar] [CrossRef]
  19. Arrizubieta, I.; Lamikiz, A.; Martínez, S.; Ukar, E.; Tabernero, I.; Girot, F. Internal characterization and the hole formation mechanism in the laser percussion drilling process. Int. J. Mach. Tools Manuf. 2013, 75, 55–62. [Google Scholar] [CrossRef]
  20. Jackson, M.J.; O’Neill, W. Laser micro-drilling of tool steel using Nd:YAG lasers. J. Mater. Process. Technol. 2003, 142, 517–525. [Google Scholar] [CrossRef]
  21. Voisey, K.T.; Kudesia, S.S.; Rodden, W.S.O.; Hand, D.P.; Jones, J.D.C.; Clyne, T.W. Melt ejection during laser drilling of metals. Mater. Sci. Eng. 2003, A356, 414–424. [Google Scholar] [CrossRef]
  22. Ho, C.; He, J.; Liao, T. On-Line Estimation of Laser-Drilled Hole Depth Using a Machine Vision Method. Sensors 2012, 12, 10148–10162. [Google Scholar] [CrossRef] [PubMed]
  23. Casalino, G.; Campanelli, S.L.; Contuzzi, N.; Ludovico, A.D. Experimental investigation and statistical optimisation of the selective laser melting process of a maraging steel. Opt. Laser Technol. 2015, 65, 151–158. [Google Scholar] [CrossRef]
  24. Carter, L.N.; Martin, C.; Withers, P.J.; Attallah, M.M. The influence of the laser scan strategy on grain structure and cracking behavior in SLM powder-bed fabricated nickel superalloy. J. Alloys Compd. 2014, 615, 338–347. [Google Scholar] [CrossRef]
  25. Stainless Steel—1.4542 (Stainless 17.4) Datasheet (Default) by 3D Alchemy. Available online: https://www.3d-alchemy.co.uk/assets/datasheets/3d-Alchemy-Stainless%20Steel%201-4542%20-%2001_13.pdf (accessed on 25 August 2017).
  26. 1.4542 Steel Datasheet by Lucefin. Available online: http://www.lucefin.com/wp-content/files_mf/1.4542pha63062.pdf (accessed on 25 August 2017).
  27. Cherry, J.A.; Davies, H.M.; Mehmood, S.; Lavery, N.P.; Brown, S.G.R.; Sienz, J. Investigation into the effect of process parameters on microstructural and physical properties of 316L stainless steel parts by selective laser melting. Int. J. Adv. Manuf. Technol. 2014, 76, 869–879. [Google Scholar] [CrossRef]
  28. Spierings, A.B.; Levy, G. Comparison of density of stainless steel 316L parts produced with selective laser melting using different powder grades. In Proceedings of the Twentieth Annual International Solid Freeform Fabrication (SFF) Symposium, Austin, TX, USA, 3–5 August 2009; pp. 342–353. [Google Scholar]
  29. Think3d Web Page. Available online: https://www.additively.com/en/material/from/eos/eos-stainless-steel-316l (accessed on 25 August 2017, requires login).
  30. Outokumpu Data Sheet for 316 and 316L. Available online: http://www.outokumpu.com/SiteCollectionDocuments/Datasheet-316-316L-imperial-hpsa-outokumpu-en-americas.pdf (accessed on 25 August 2017).
  31. Wu, A.S.; Brown, D.W.; Kumar, M.; Gallegos, G.F.; King, W.E. An Experimental investigation into Additive Manufacturing-Induced Residual Stresses in 316L Stainless Steel. Metall. Mater. Trans. B 2014, 45, 6260–6270. [Google Scholar] [CrossRef]
  32. Li, L.; Low, D.K.Y.; Ghoreshi, M.; Crookall, J.R. Hole Taper Characterisation and Control in Laser Percussion Drilling. CIRP Ann.-Manuf. Technol. 2002, 51, 153–156. [Google Scholar] [CrossRef]
  33. Chickov, B.N.; Momma, C.; Nolte, S.; von Alvensleben, F.; Tünnermann, A. Femtosecond, picosecond and nanosecond laser ablation of solids. Appl. Phys. A 1996, 63, 109–115. [Google Scholar] [CrossRef]
  34. Von Allmen, M. Laser drilling velocity in metals. J. Appl. Phys. 1976, 47, 5460–5463. [Google Scholar] [CrossRef]
  35. Manninen, M.; Hirvimäki, M.; Poutiainen, I.; Salminen, A. Effect of Pulse Length on Engraving Efficiency in Nanosecond Pulsed Laser Engraving of Stainless Steel. Metall. Mater. Trans. B 2015, 46, 2129–2136. [Google Scholar] [CrossRef]
  36. British Stainless Steel Association. Available online: http://www.bssa.org.uk/topics.php?article=140 (accessed on 15 April 2017).
  37. Bandyopadhyay, S.; Sarin Sundar, J.K.; Sundararajan, G.; Joshi, S.V. Geometrical features and metallurgical characteristics of Nd:YAG laser drilled holes in thick IN718 and Ti-6Al-4V sheets. J. Mater. Process. Technol. 2002, 127, 83–95. [Google Scholar] [CrossRef]
Figure 1. (a) A schematic illustration of the experimental setup; (b) Tested optical properties of the laser beam.
Applsci 07 00913 g001
Figure 2. Top-down illustration of the orientation of the powder bed fusion (PBF) sheet during manufacture; thickness: 1 mm, length: 30 mm.
Applsci 07 00913 g002
Figure 3. (a) Hatch pattern illustration for the engraving, not in scale. Red lines denote laser beam movement; (b) Photographs of the drilled sheets, drilled holes were 2 mm apart. Cold rolled sheet on top, PBF sheet on bottom.
Applsci 07 00913 g003
Figure 4. Images showing where the measurements were taken. (a) Eight measurements for the hole diameter; (b) Three measurements for the burning effect (BE) width.
Applsci 07 00913 g004
Figure 5. Magnified images of the entry and exit holes, and hole profiles, respectively, for all drilled holes. Cold-rolled sheet images are on the left, and images from the PBF sheet are on the right.
Applsci 07 00913 g005
Figure 6. Measured entry and exit hole diameters for the laser drilled holes.
Applsci 07 00913 g006
Figure 7. Material removal rates for holes laser drilled in PBF and cold rolled sheets.
Applsci 07 00913 g007
Figure 8. Measured BE widths for the entry and exit holes.
Applsci 07 00913 g008
Figure 9. Measured hole tapers in degrees for all the drilled holes.
Applsci 07 00913 g009
Figure 10. Magnified images of the samples showing the microstructure. (a) Cold-rolled steel sheet; (b) PBF produced sheet. Areas of interest circled in red.
Applsci 07 00913 g010
Figure 11. Scanning electron microscope (SEM) image showing the topography of an area with a suspected defect in the PBF sheet.
Applsci 07 00913 g011
Table 1. Material compositions by mass percentages for the experimental samples.
MaterialCCrNiMoMnCuSiPSNFe
CR1 1<0.0317.210.12.1<2<0.5<0.75<0.045<0.03<0.1bal.
CR2 2-18.49.52.32.1-0.6---66.7
PBF1 3<0.0317–1913–152.25–3<2<0.5<0.75<0.025<0.01<0.1bal.
PBF2 4-18.411.42.41.3-0.7---65.5
1 Cold rolled 316L, values from literature. 2 Cold rolled 316L, measured values.3 PBF 316L, values from literature. 4 PBF 316L, measured values (PBF: powder bed fusion).
Table 2. Comparison of physical properties between 3D-printed [29] and traditional 316L [30] stainless steel.
MaterialUltimate Tensile Strength, MPaHardness, Rockwell BDensity, g/cm3Coef. of Thermal Exp., °C−1Thermal Conductivity, W/(m °C)Heat Capacity, J/(g °C)
316L586817.91.602 × 10−515.10.502
3D printed 316L640 ± 50 (horizontal) 540 ± 55 (vertical)85min. 7.9---
Table 3. Used laser parameters and waveforms for the experiments. PRR: pulse repetition rates.
#Pulse Length, nsPulse Energy, mJPRR, kHzPulse Overlap, %Beam Speed, mm/sWaveform
180.100200752000 Applsci 07 00913 i001
2140.160125602000 Applsci 07 00913 i002
3200.190105522000 Applsci 07 00913 i003
4300.23585501700 Applsci 07 00913 i004
5500.33360501200 Applsci 07 00913 i005
61000.5004050800 Applsci 07 00913 i006
72001.0002050400 Applsci 07 00913 i007

