Enhancement of Energy Harvesting Performance by a Coupled Bluff Splitter Body and PVEH Plate through Vortex Induced Vibration near Resonance

 , ,
, ,
Abstract
:Featured Application
Abstract
1. Introduction
2. Theoretical Background
2.1. Criteria for Vortex Induced Vibration Formation
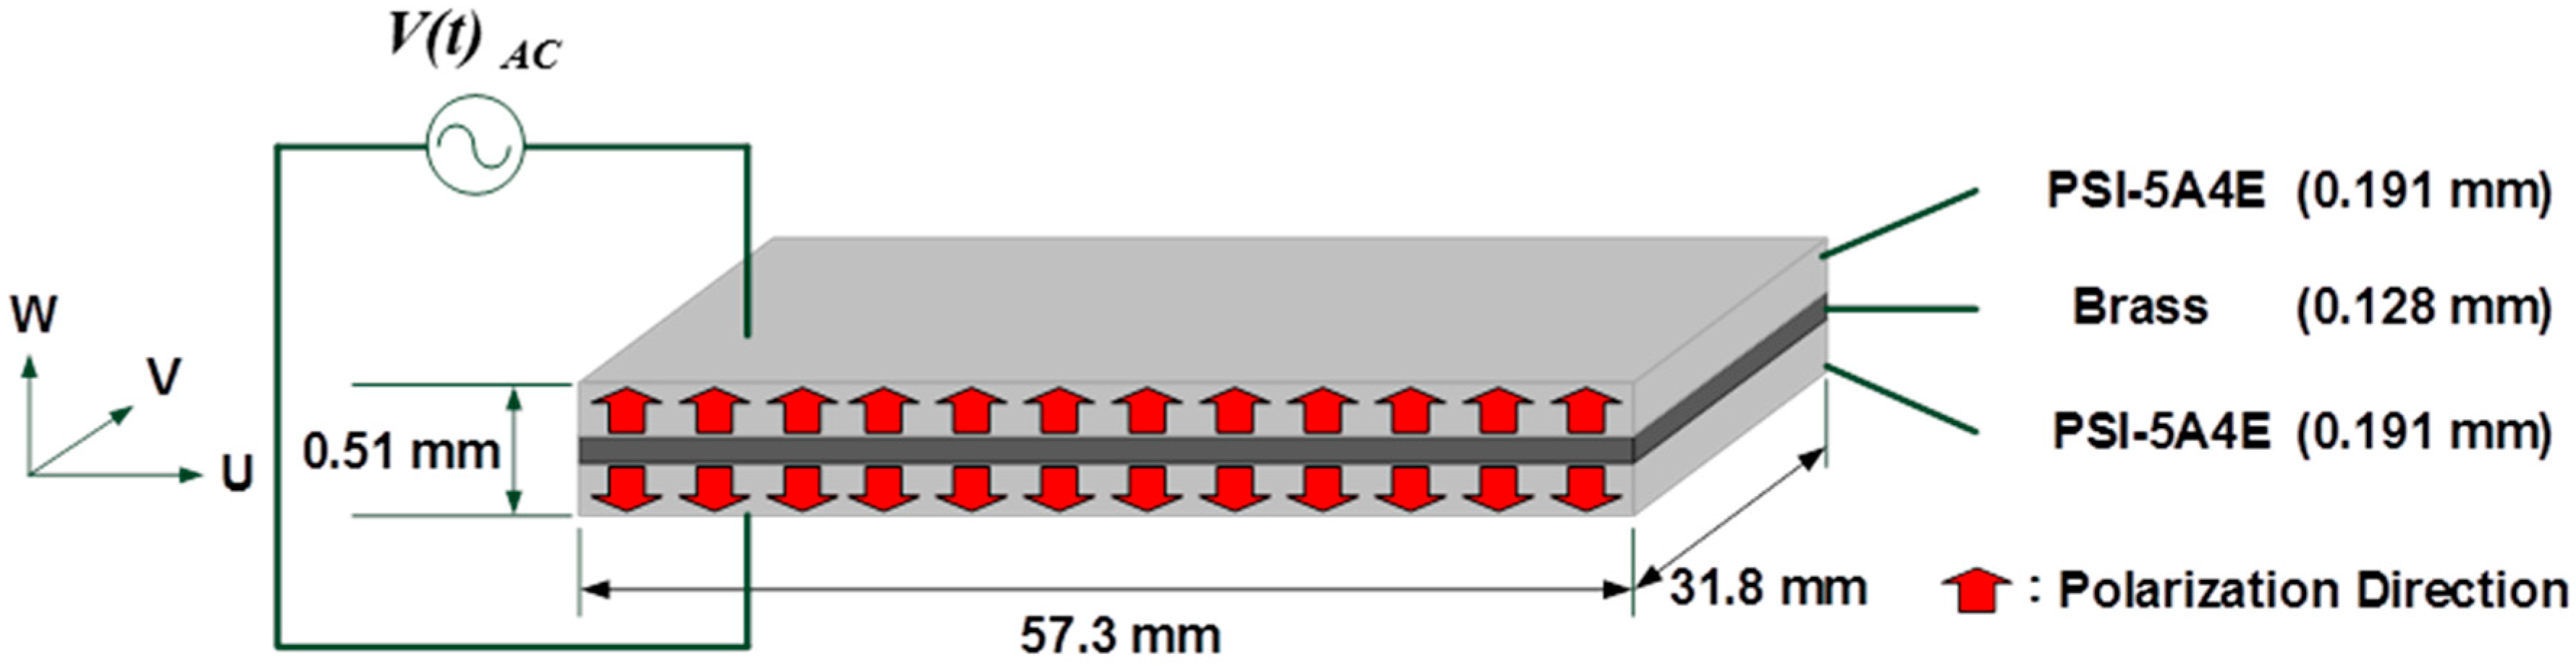
2.2. Piezoelectric Harvesters Design
2.3. Vibrational Mechanics
2.4 Optimizing Power Performance
- Maximizing the extracted electric power for a fixed deflection by matching the resistive load. It is a sub-optimal condition for a matched resistive load, assuming that is not a function of R.
- Maximizing the deflection for the matched resistor as derived in Equation (16).
3. Materials and Methods PVEH Model
3.1. PVEH Model
3.2. Design and Modelling
3.3. Structural Model Dynamic Characteristics
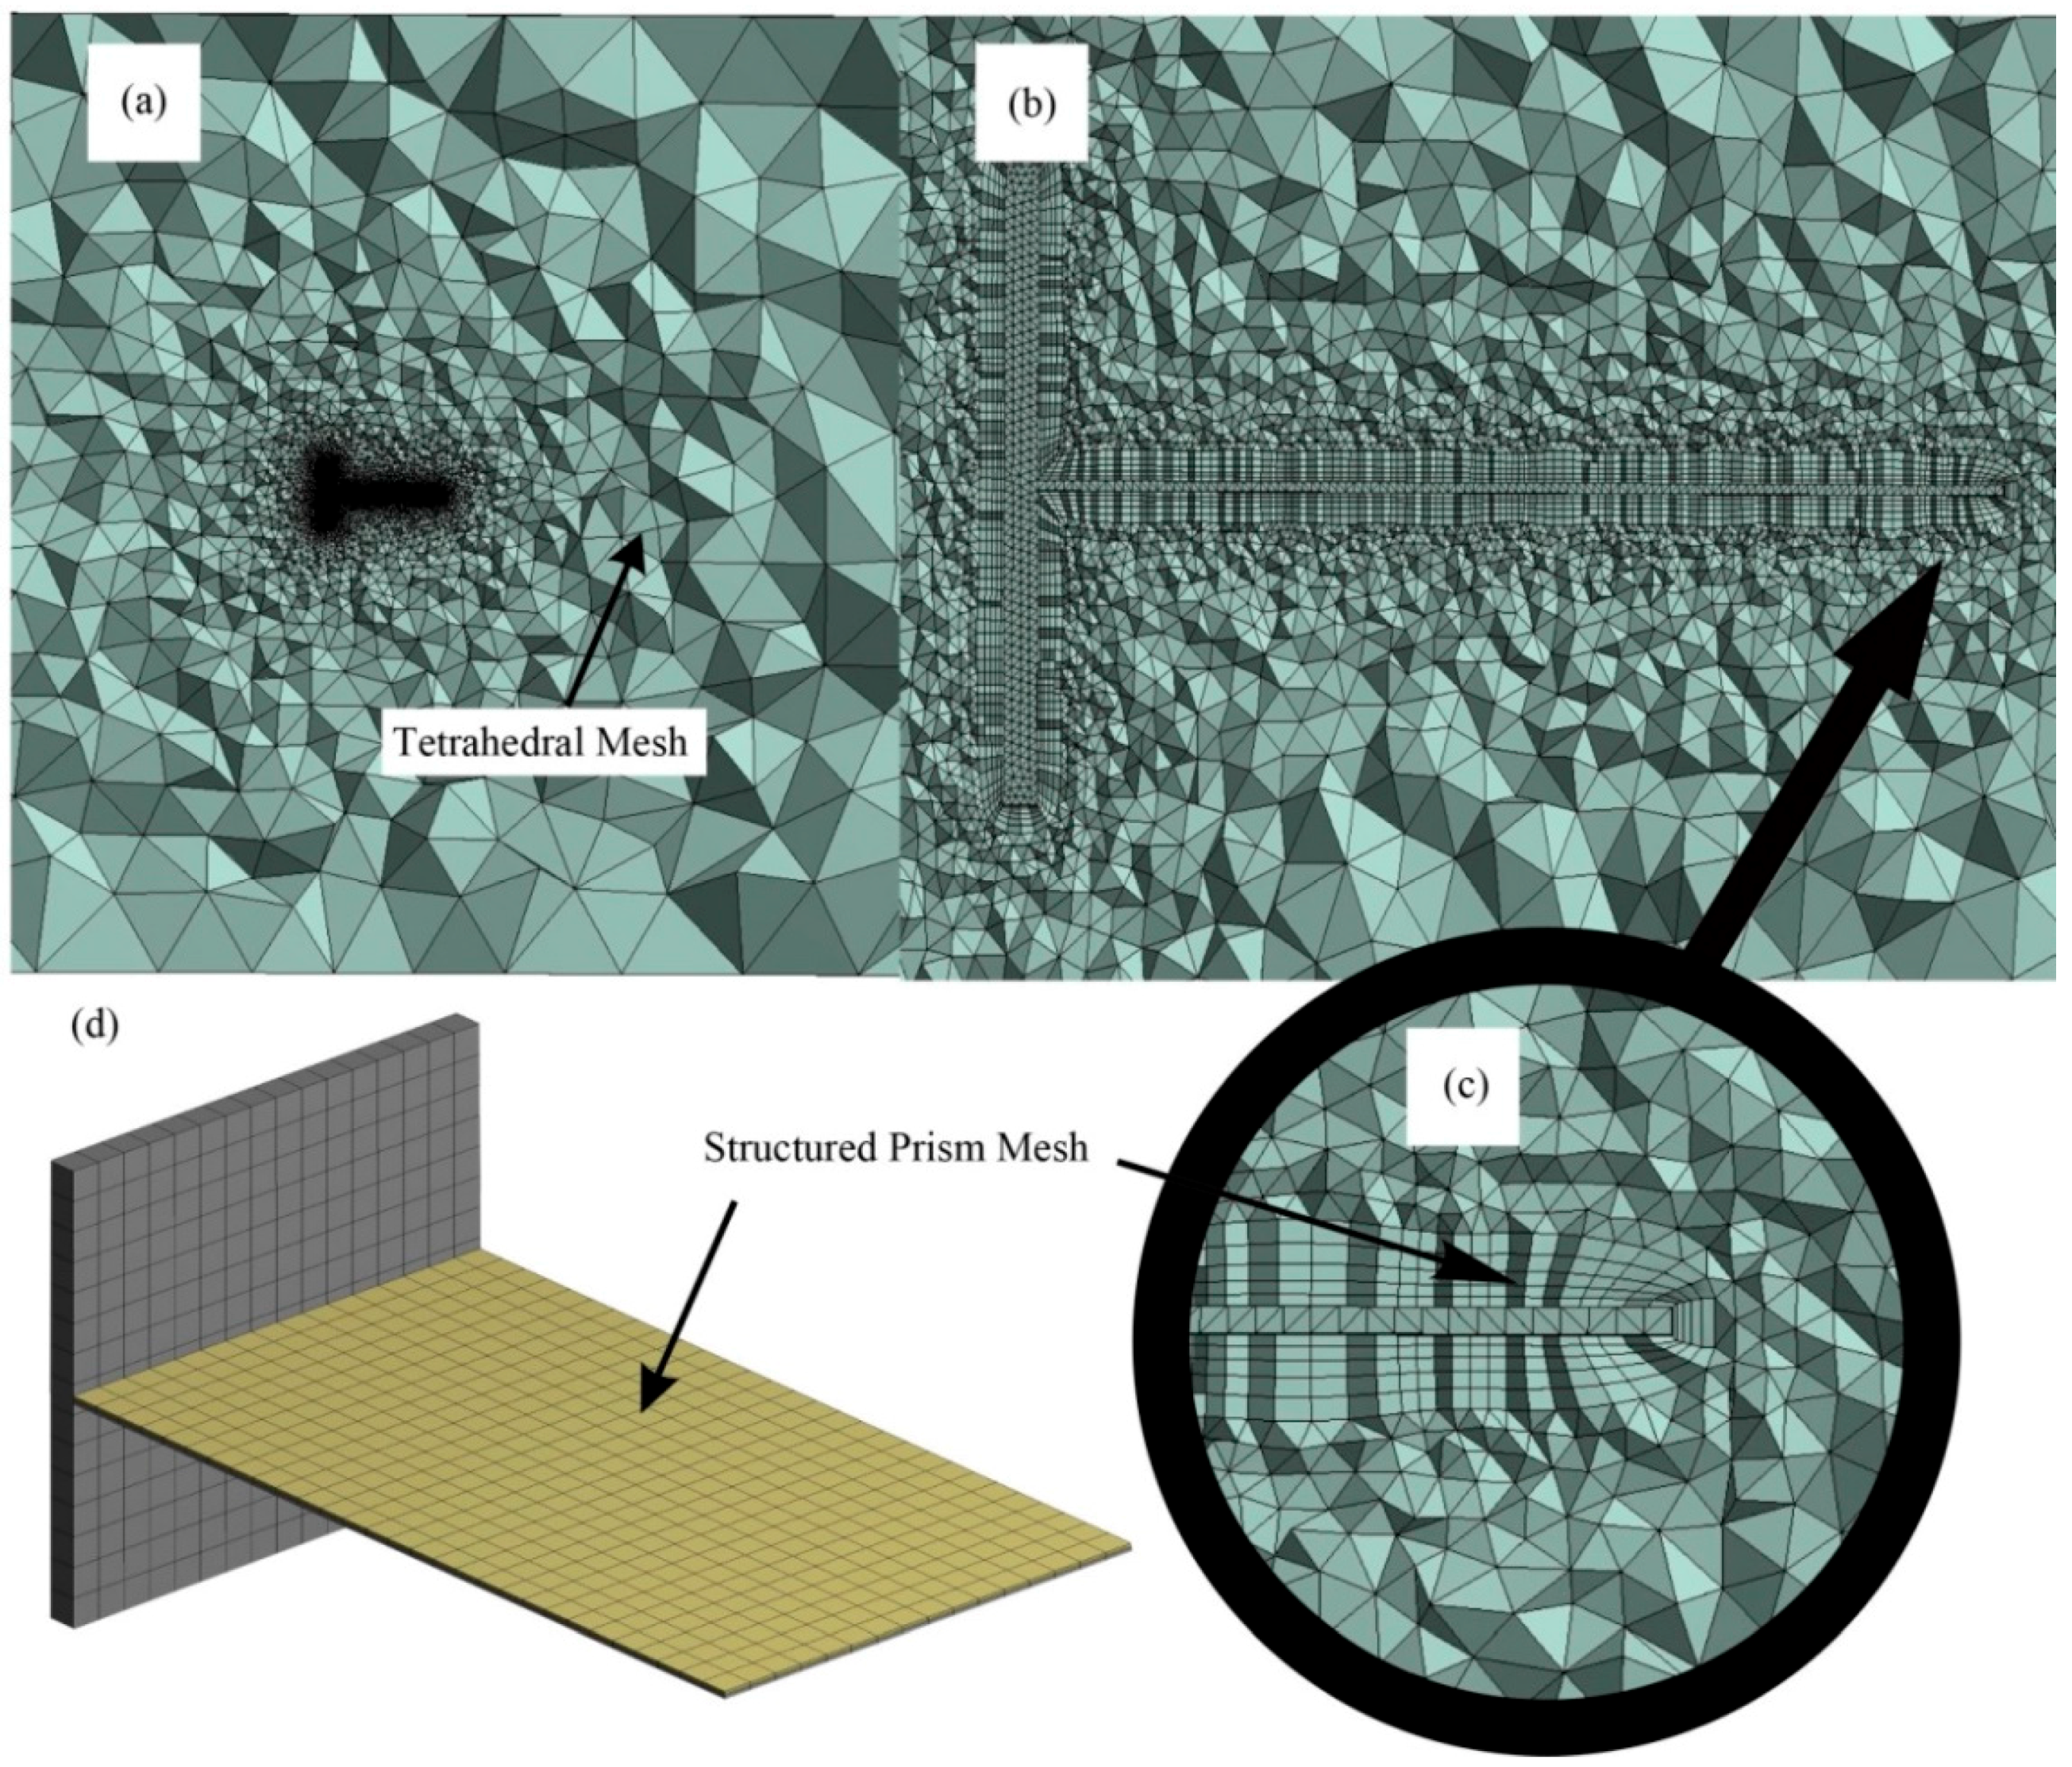
3.4. Mesh Generation
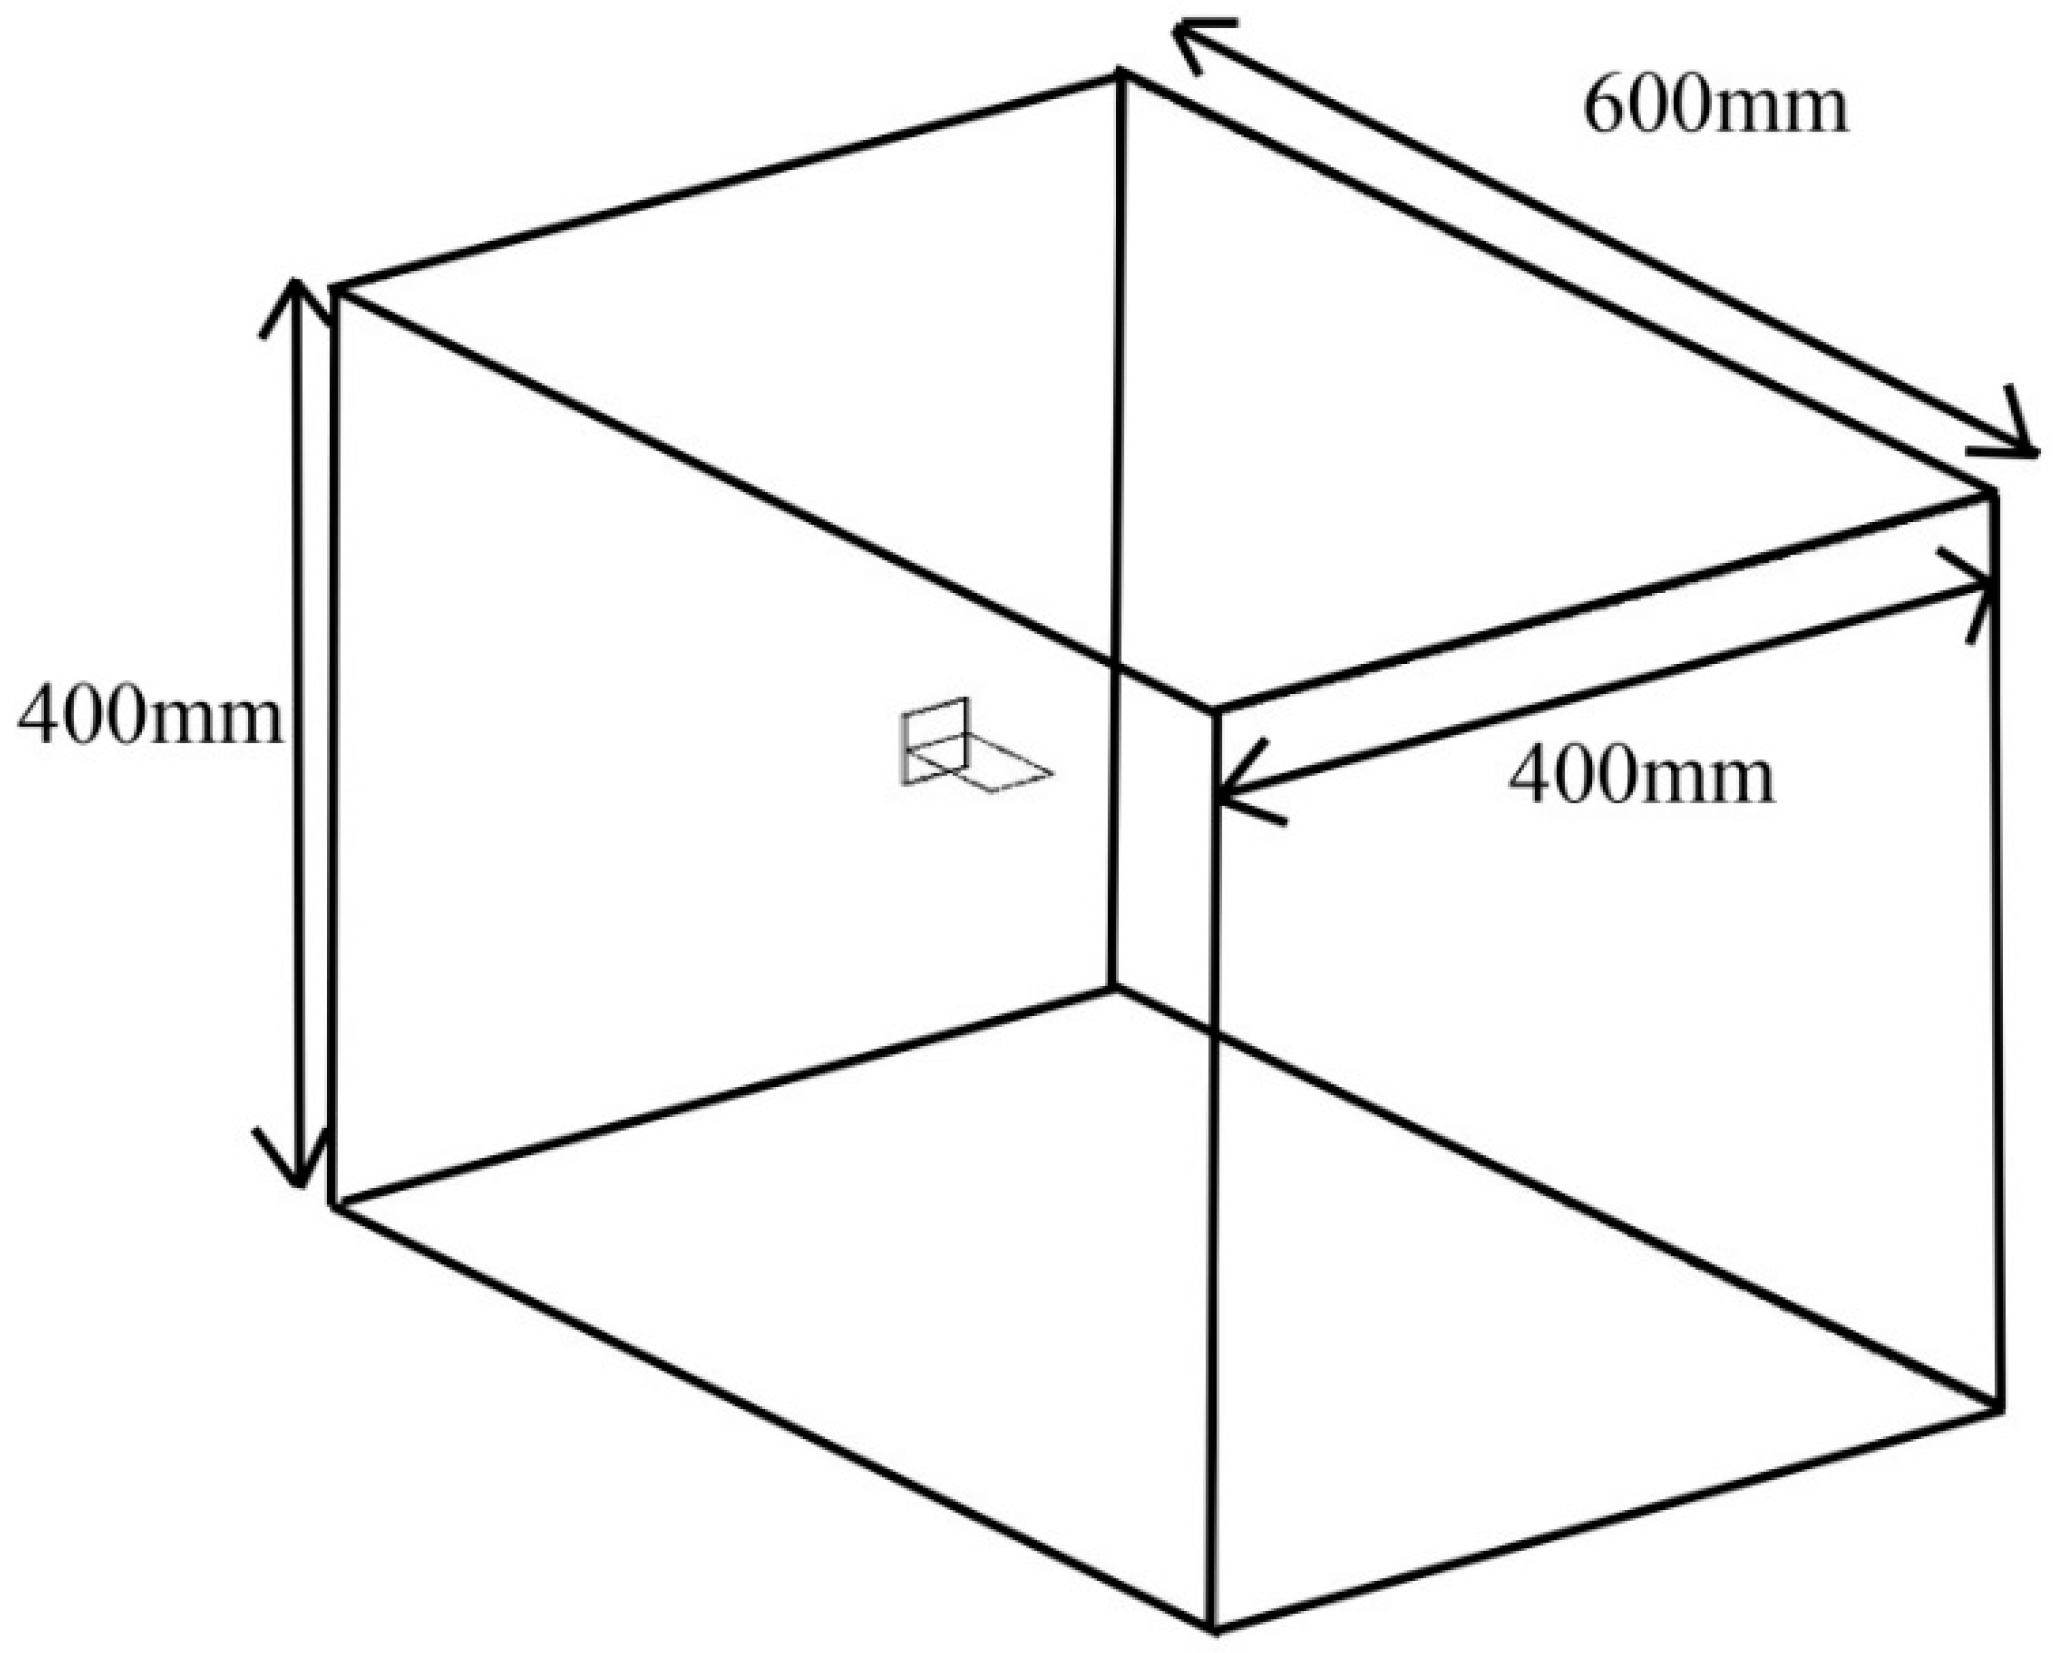
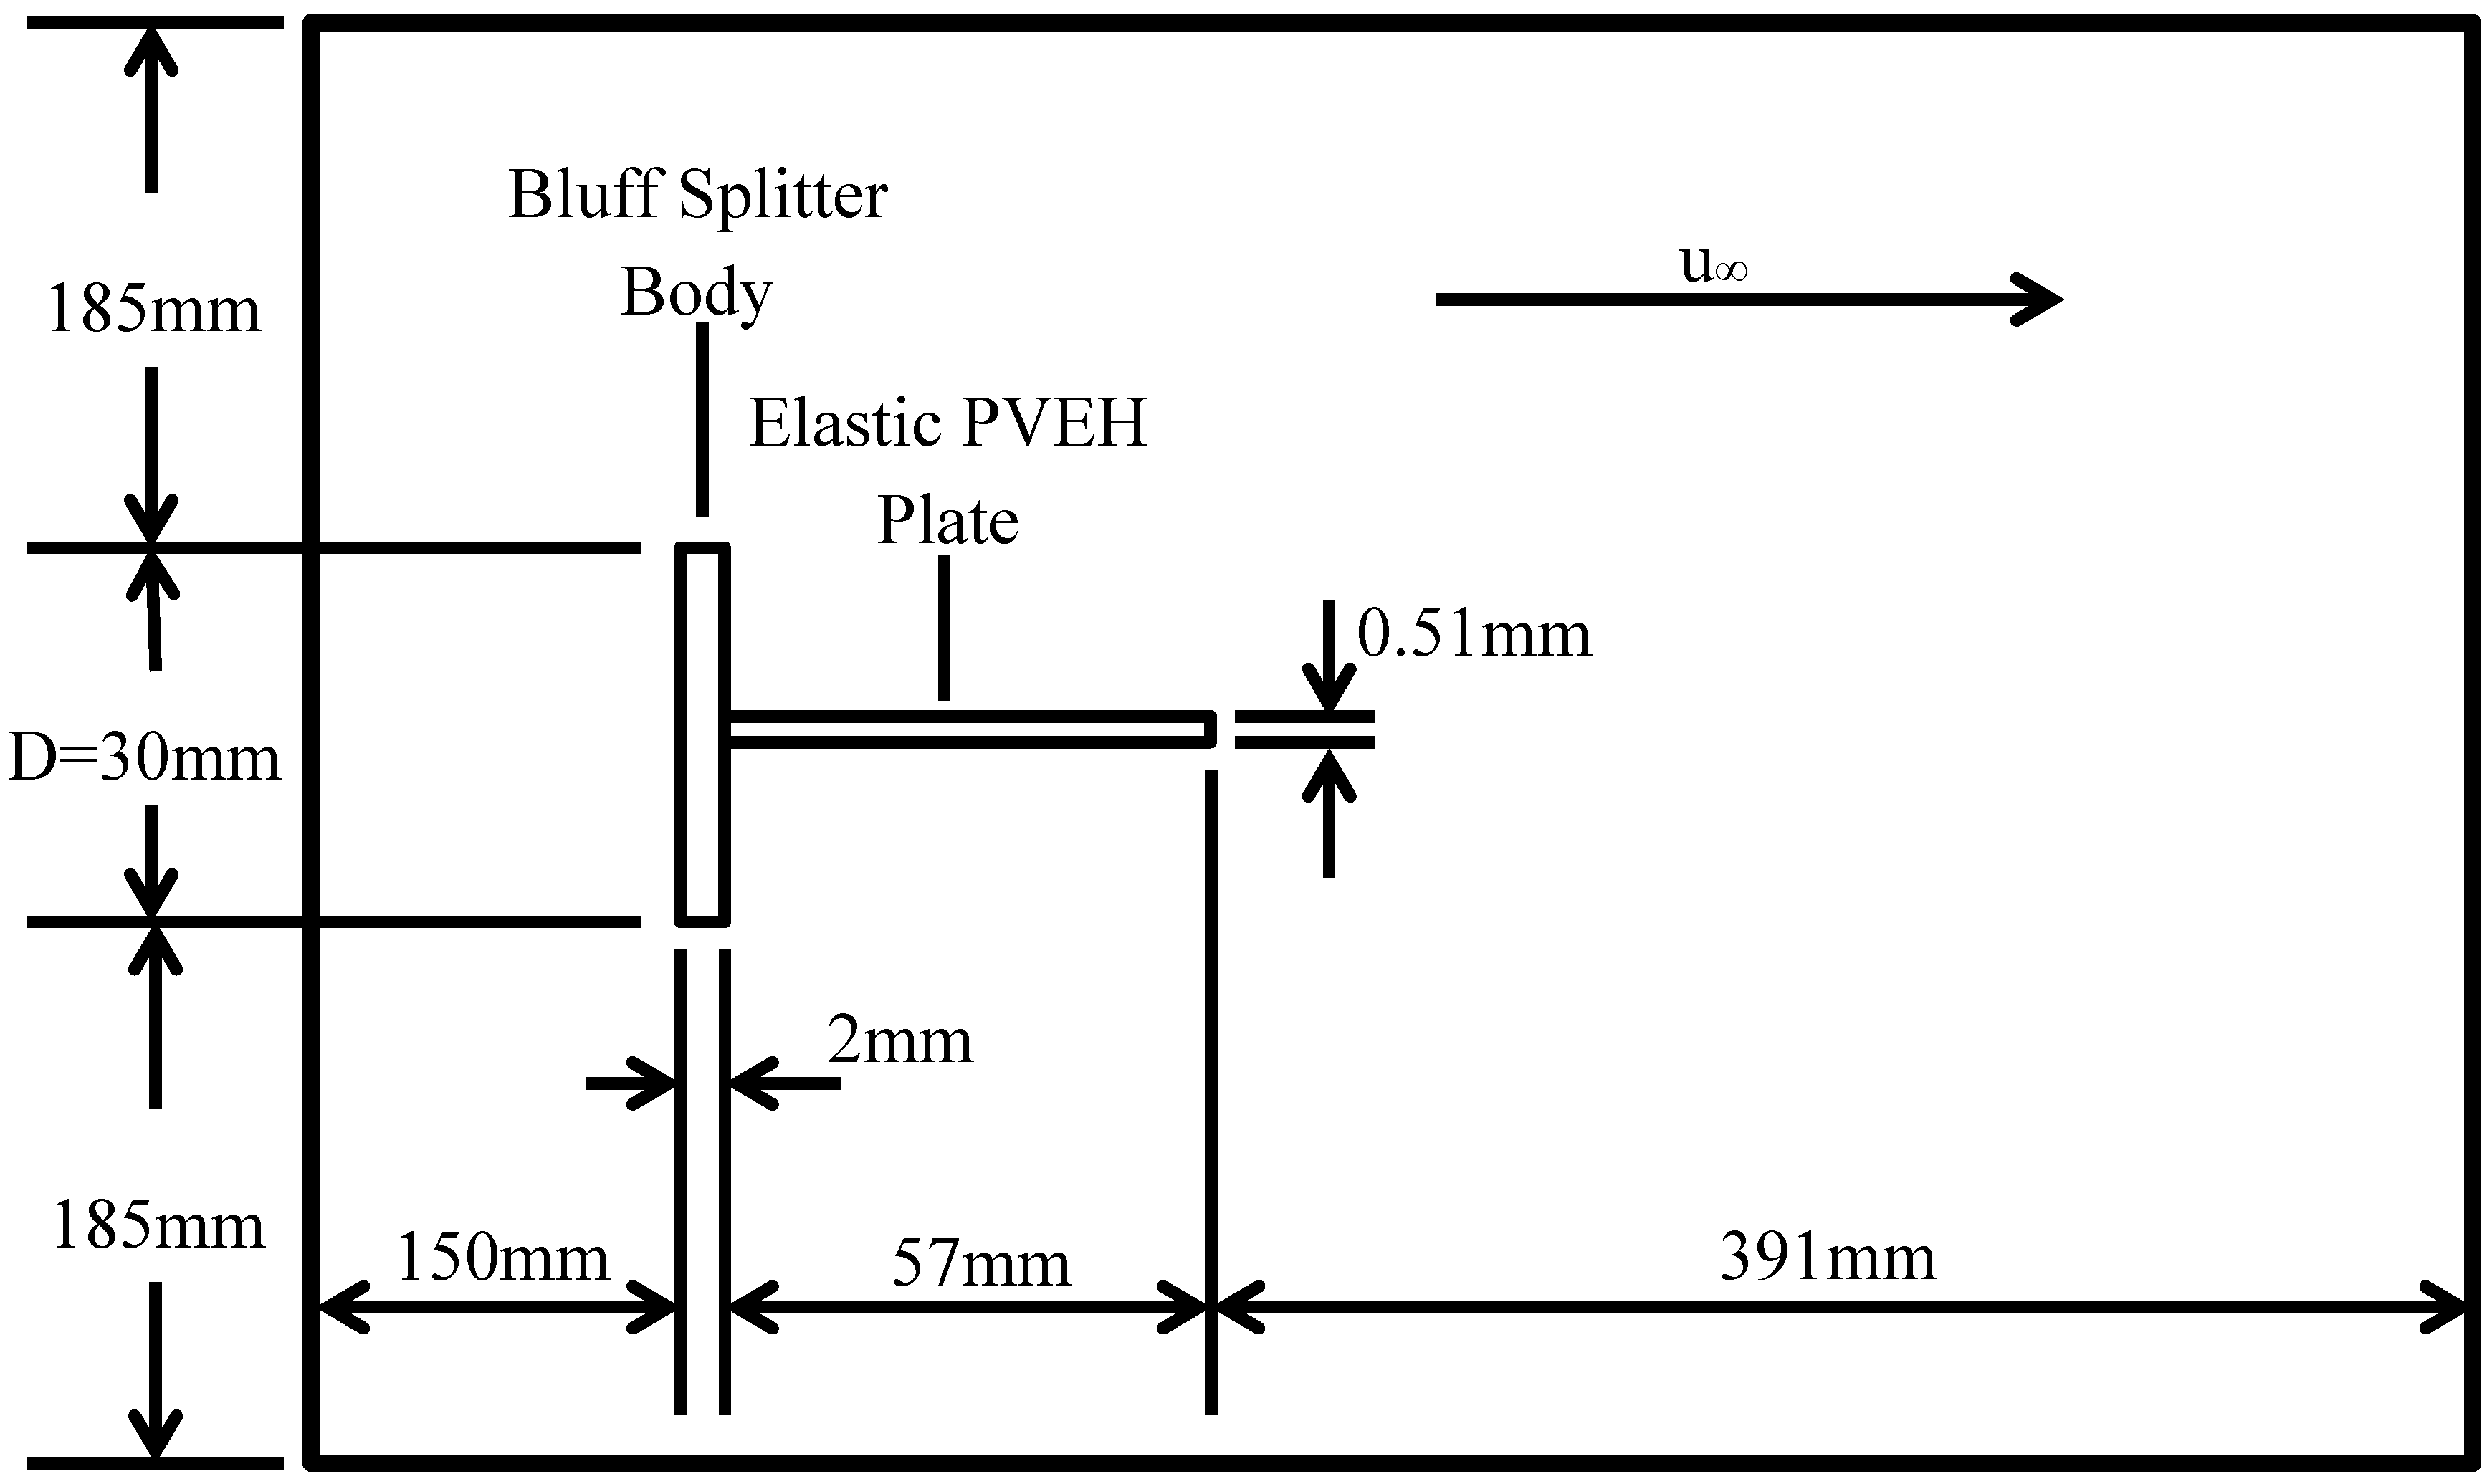
3.5. CFD Boundary Condition
3.6. Numerical Procedure
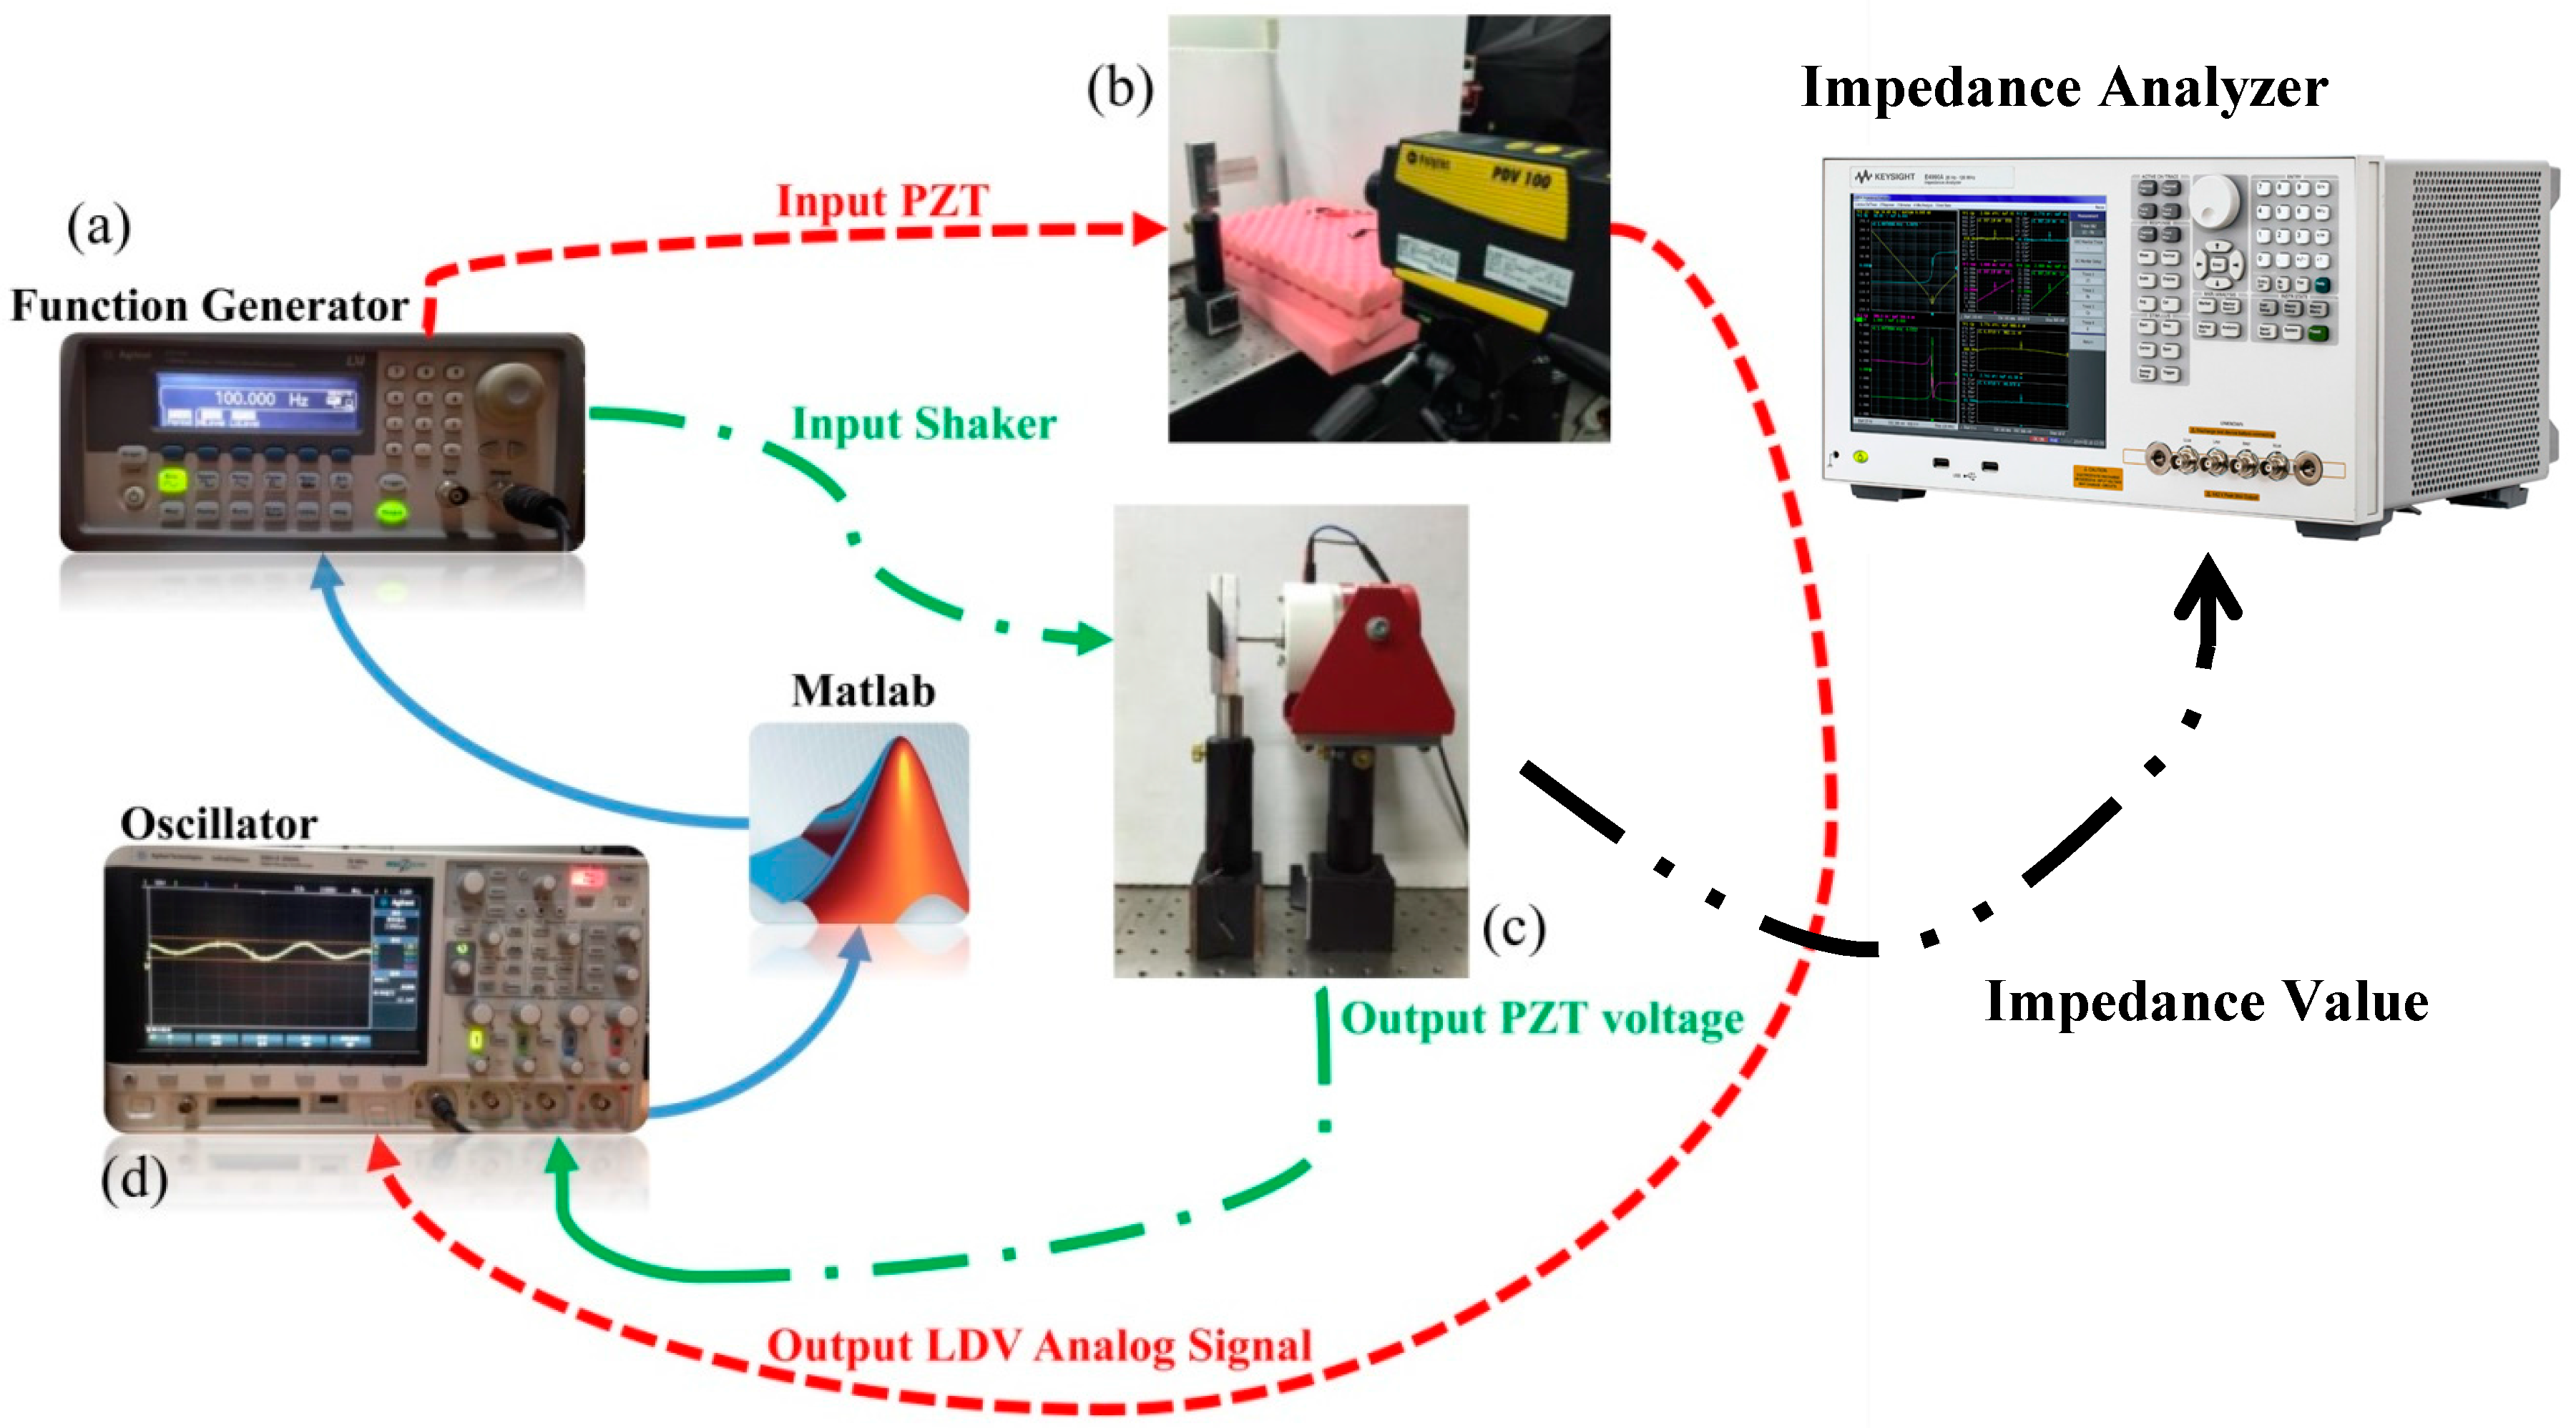
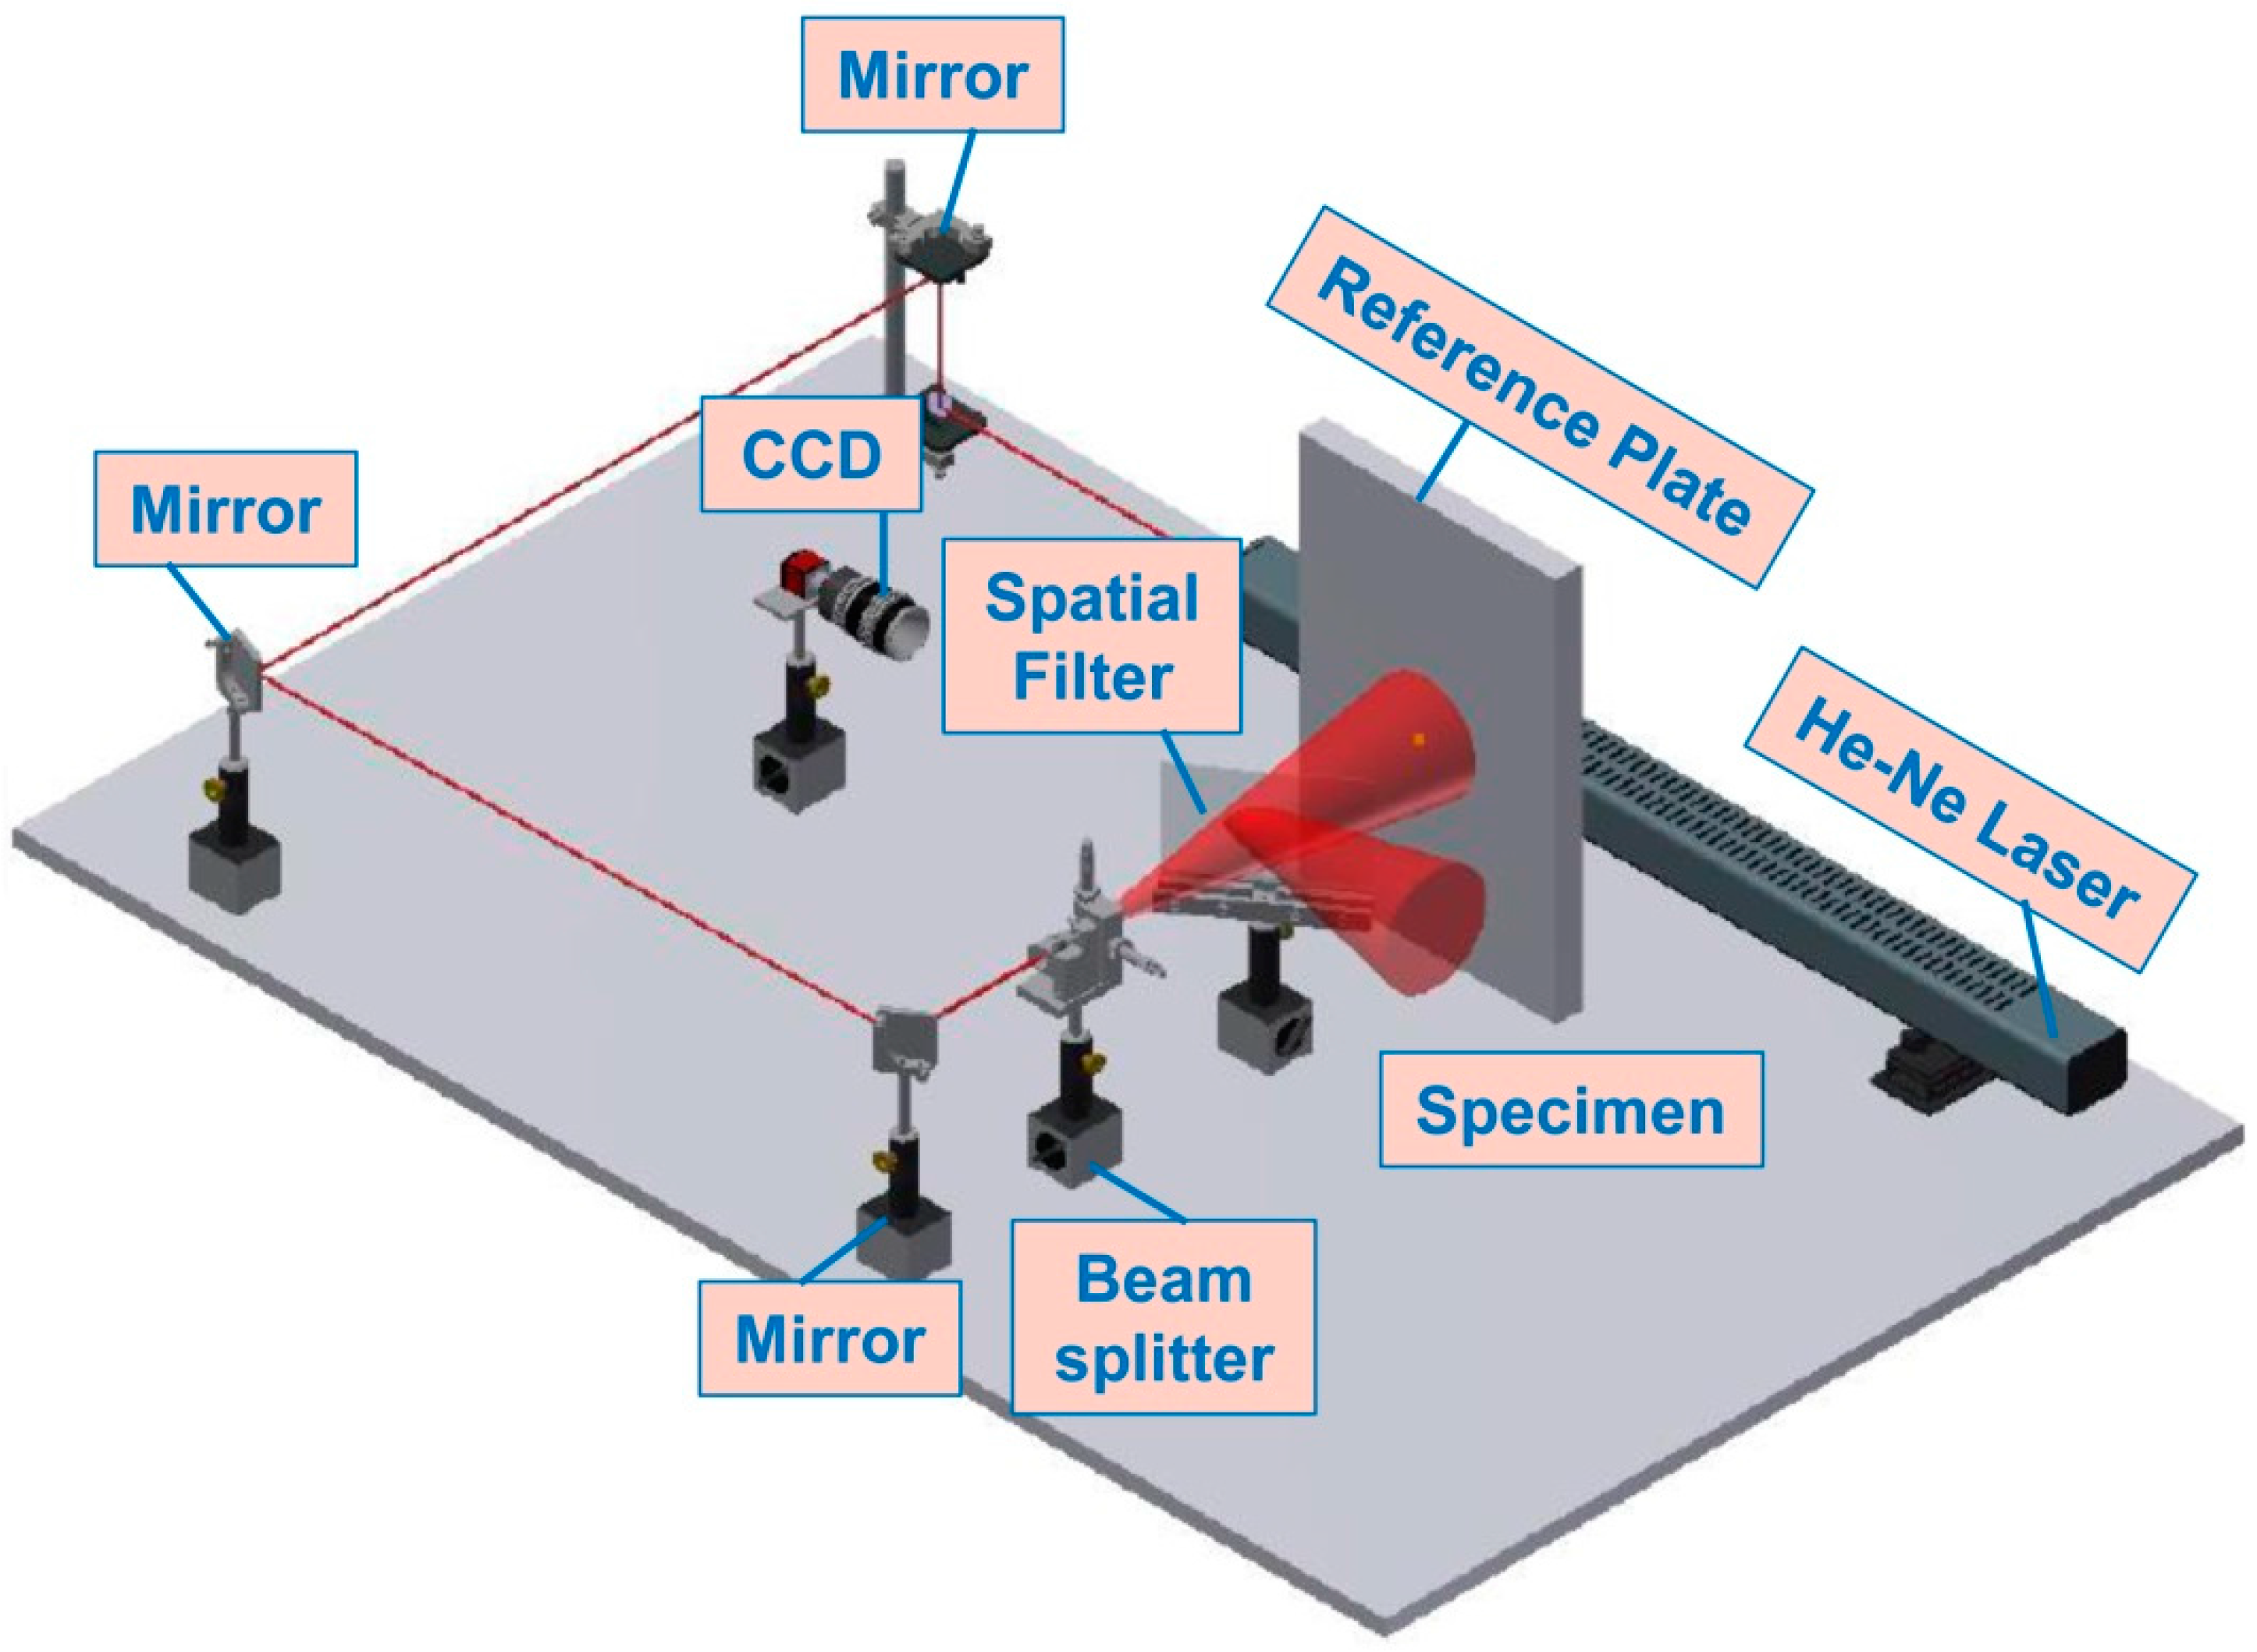
3.7. Experimental Setup
4. Results and Discussions
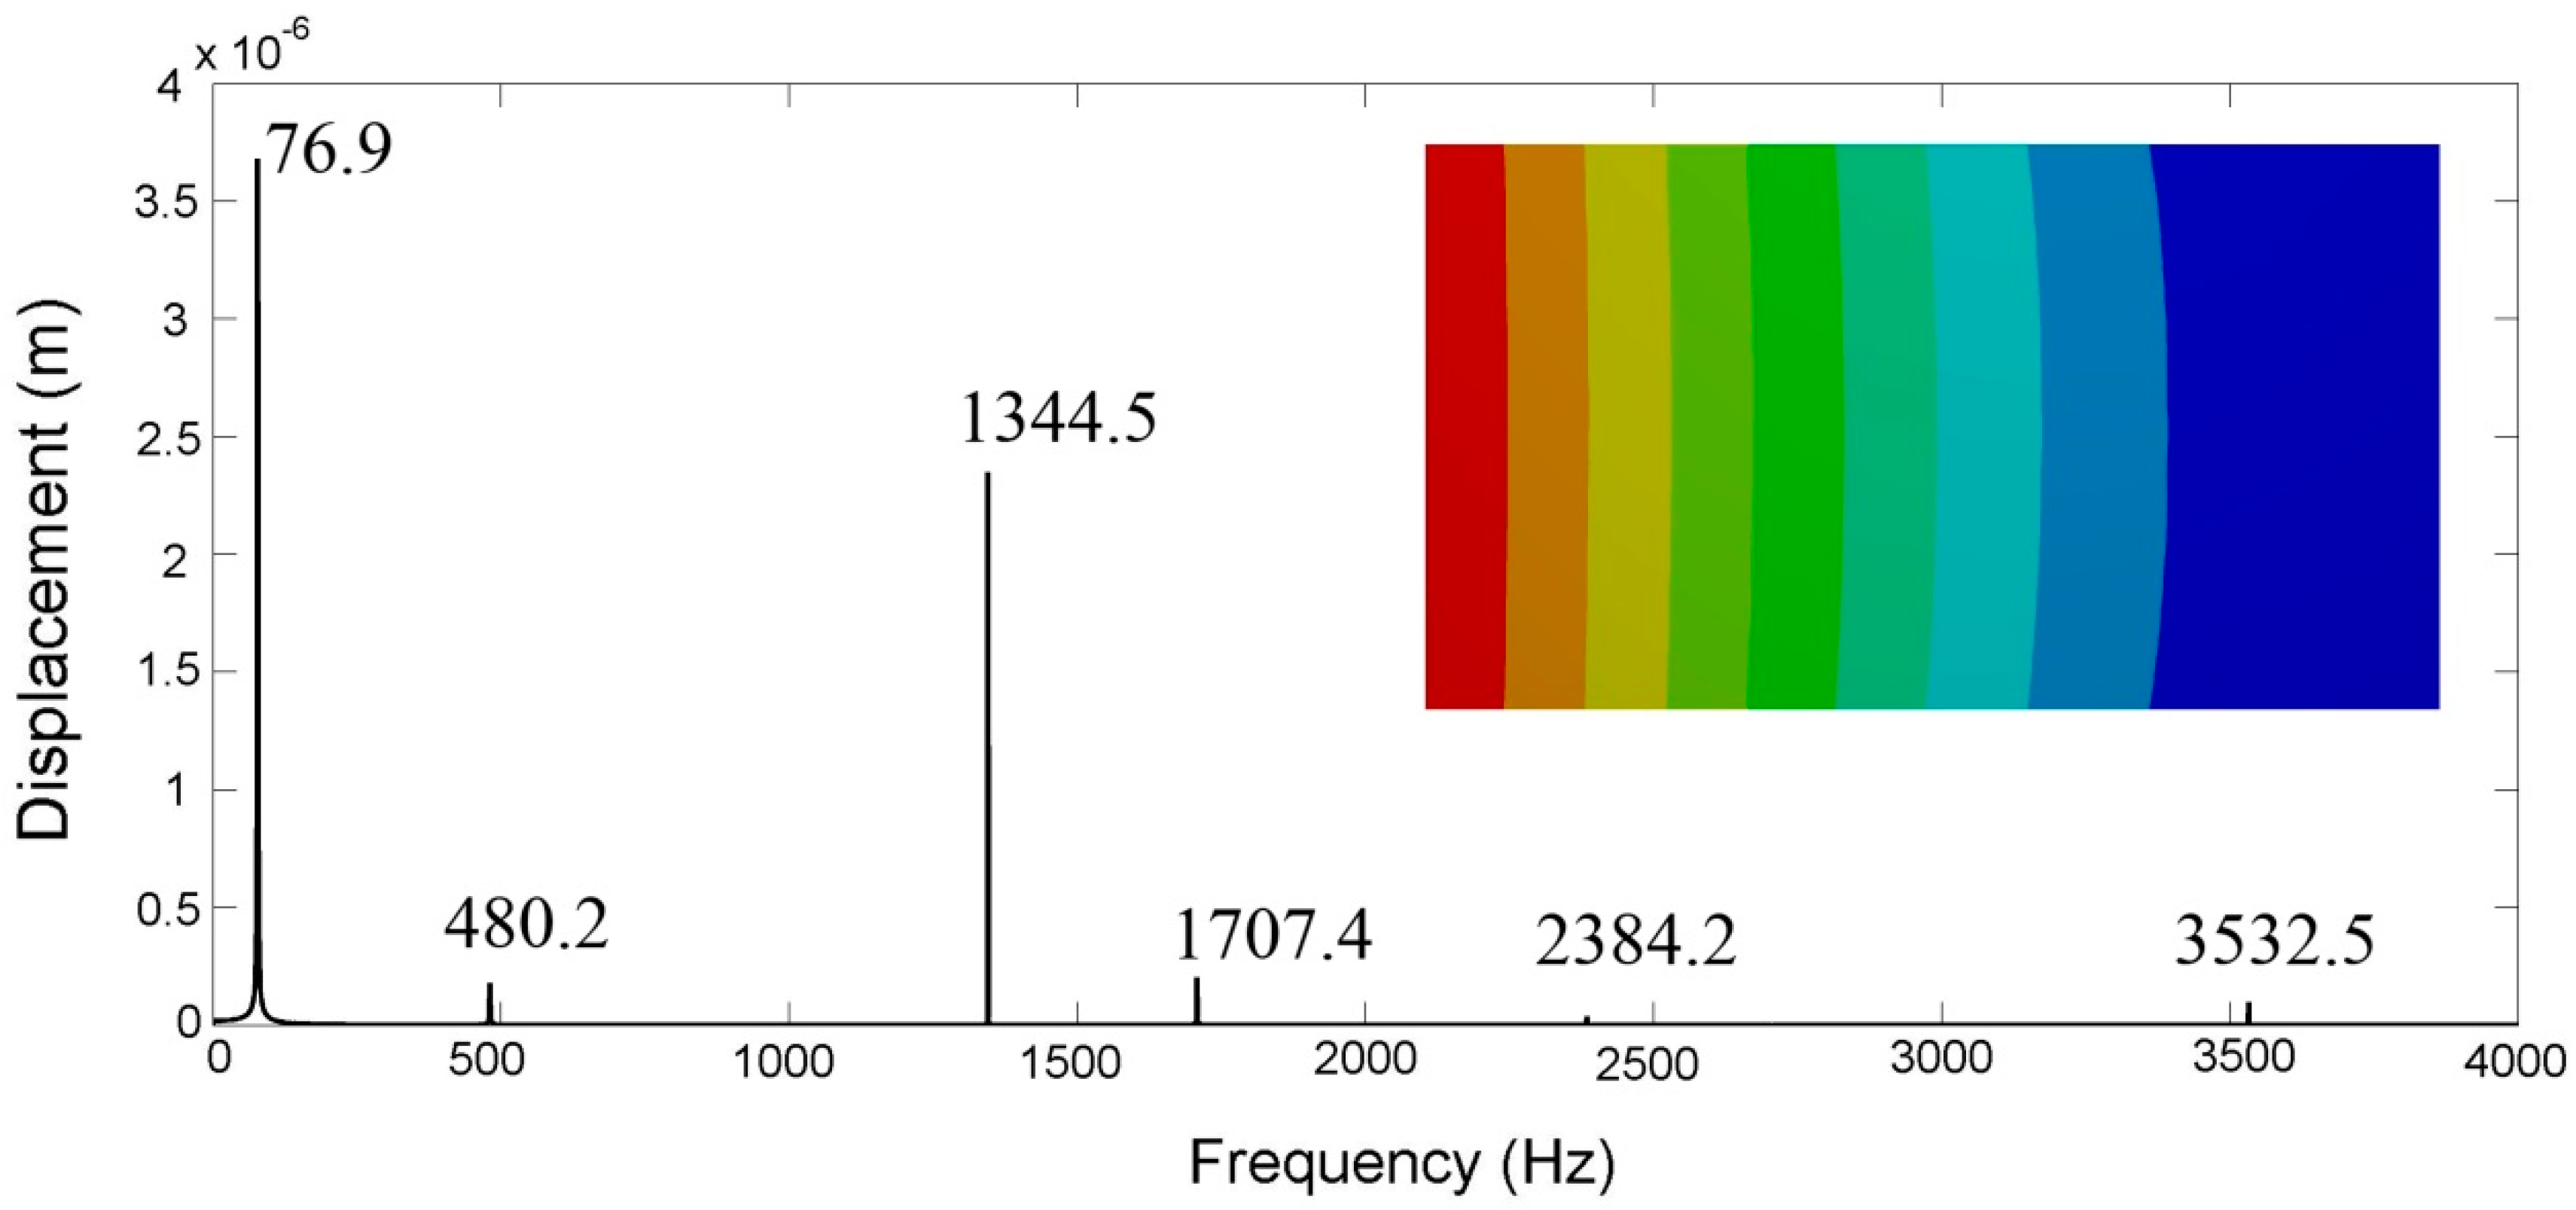
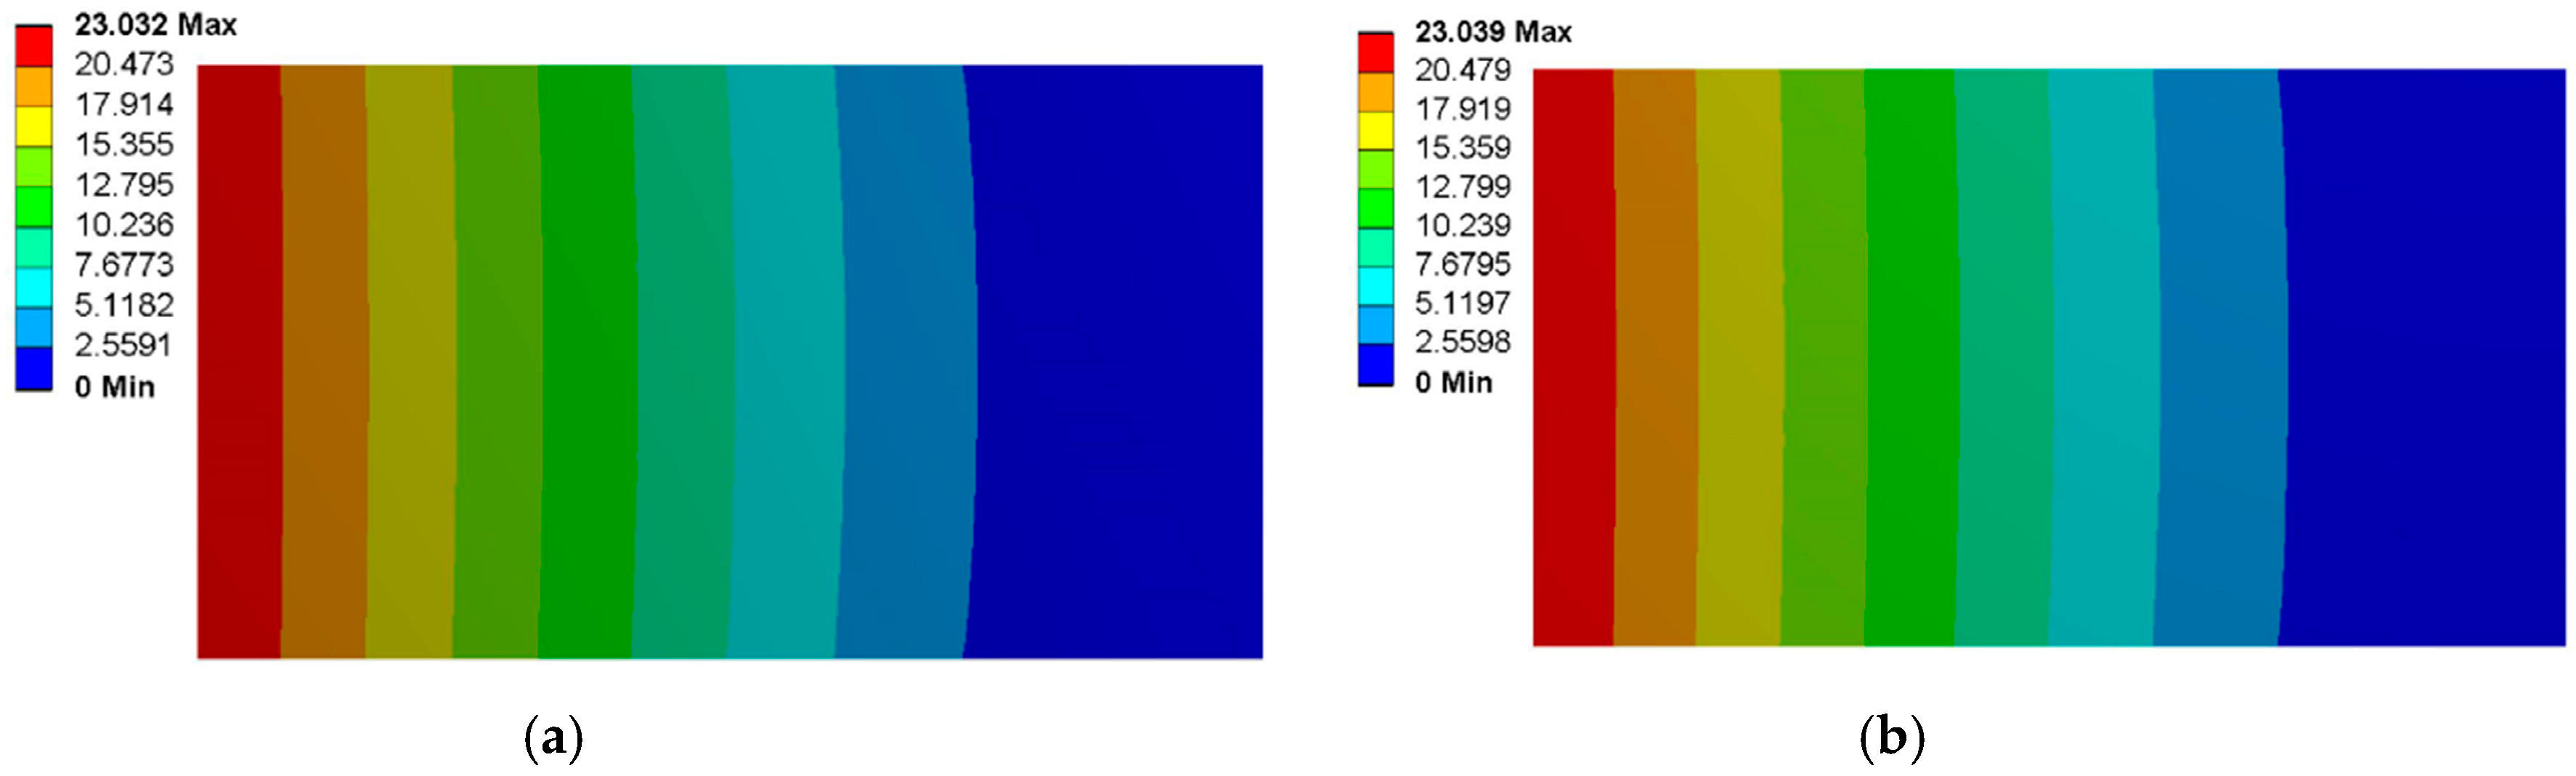
4.1. Structural Validation
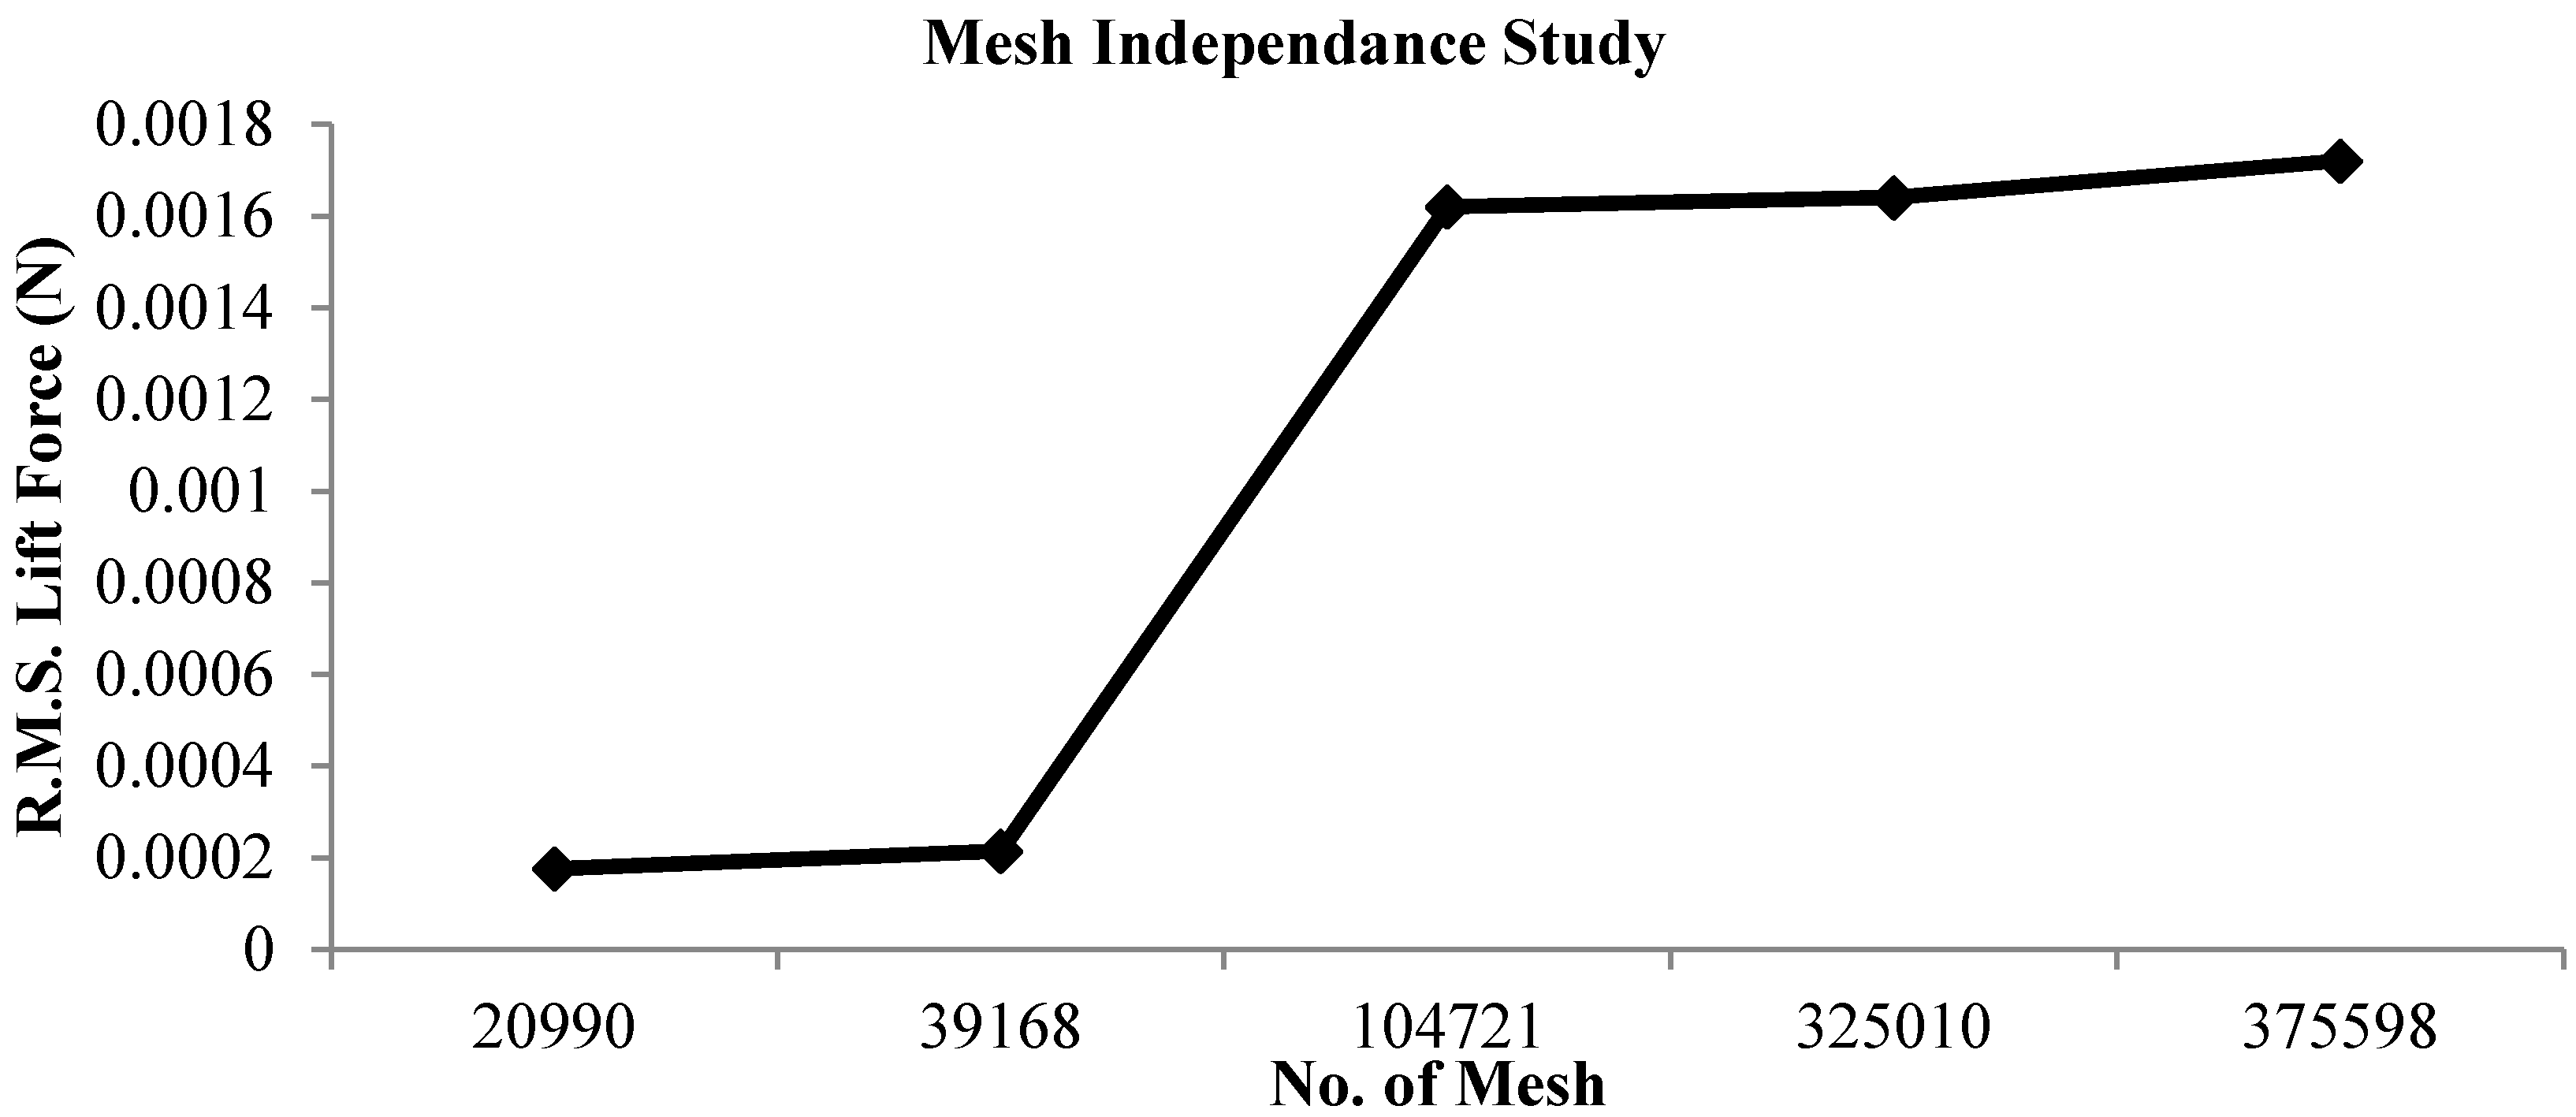
4.2. Grid Independence Study
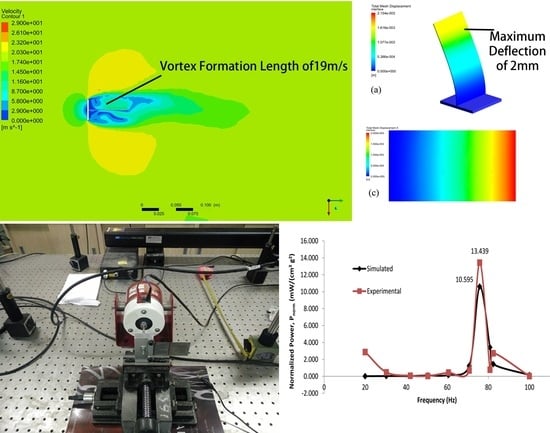
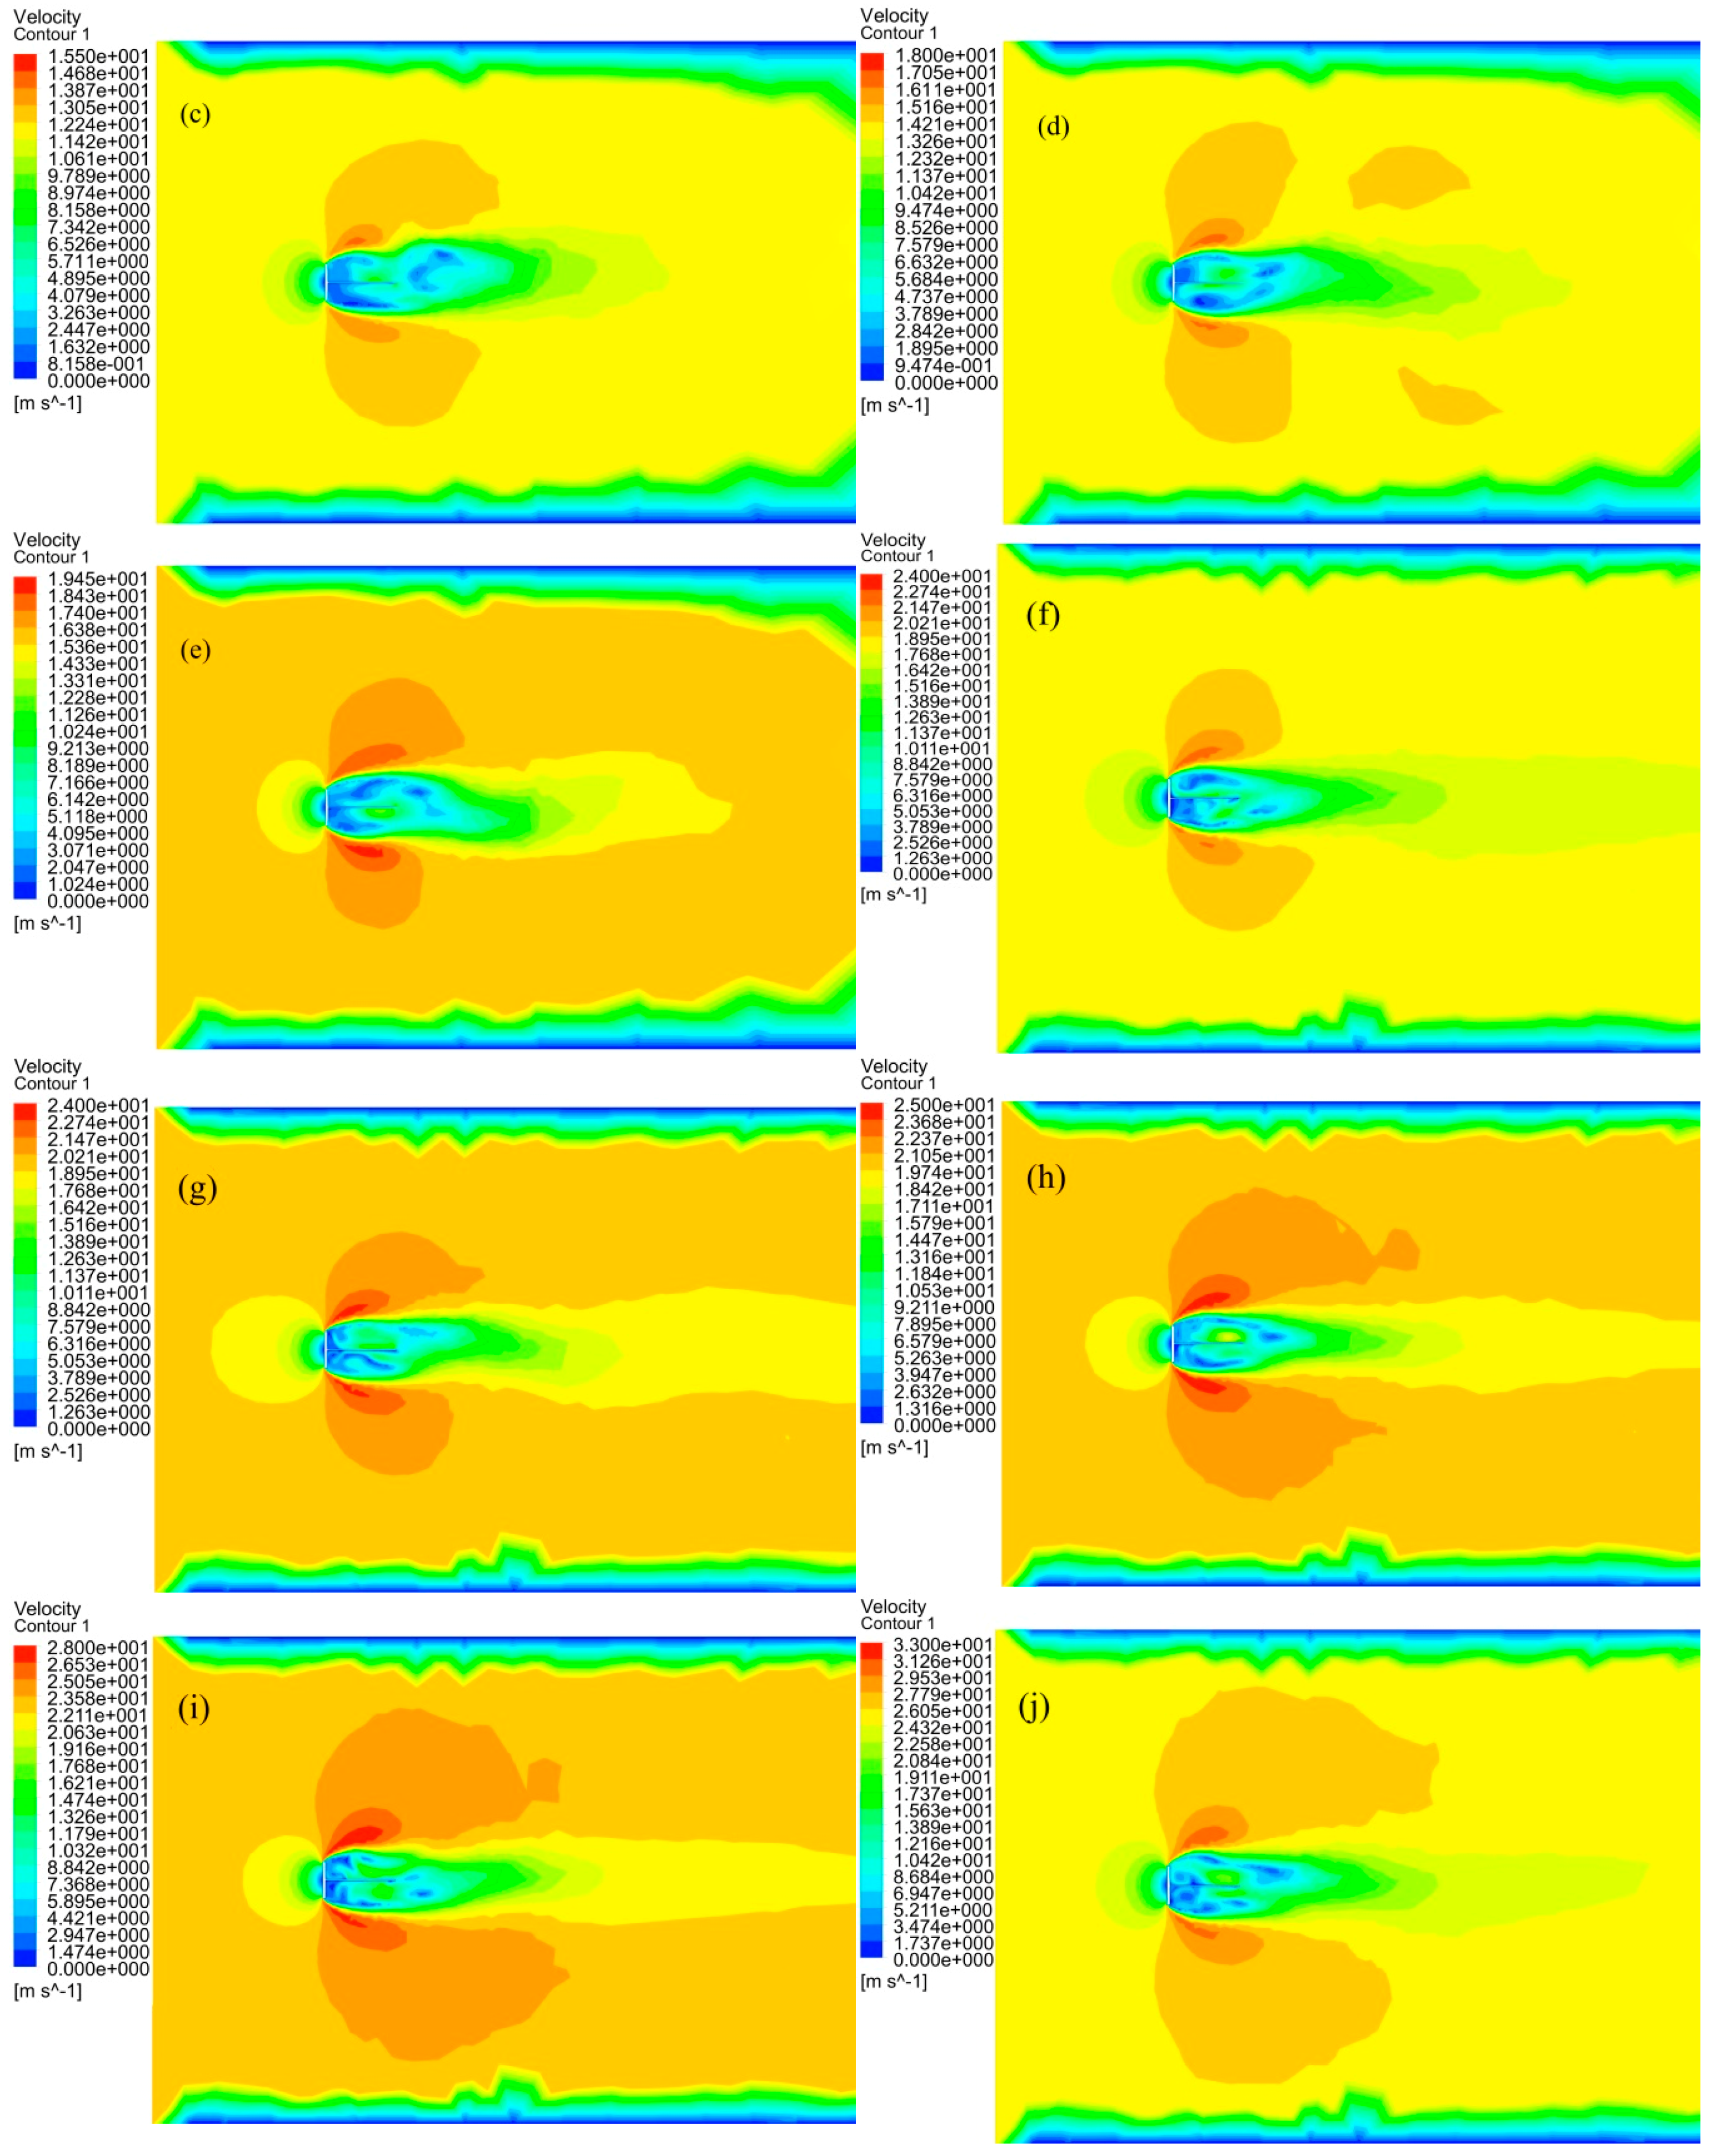
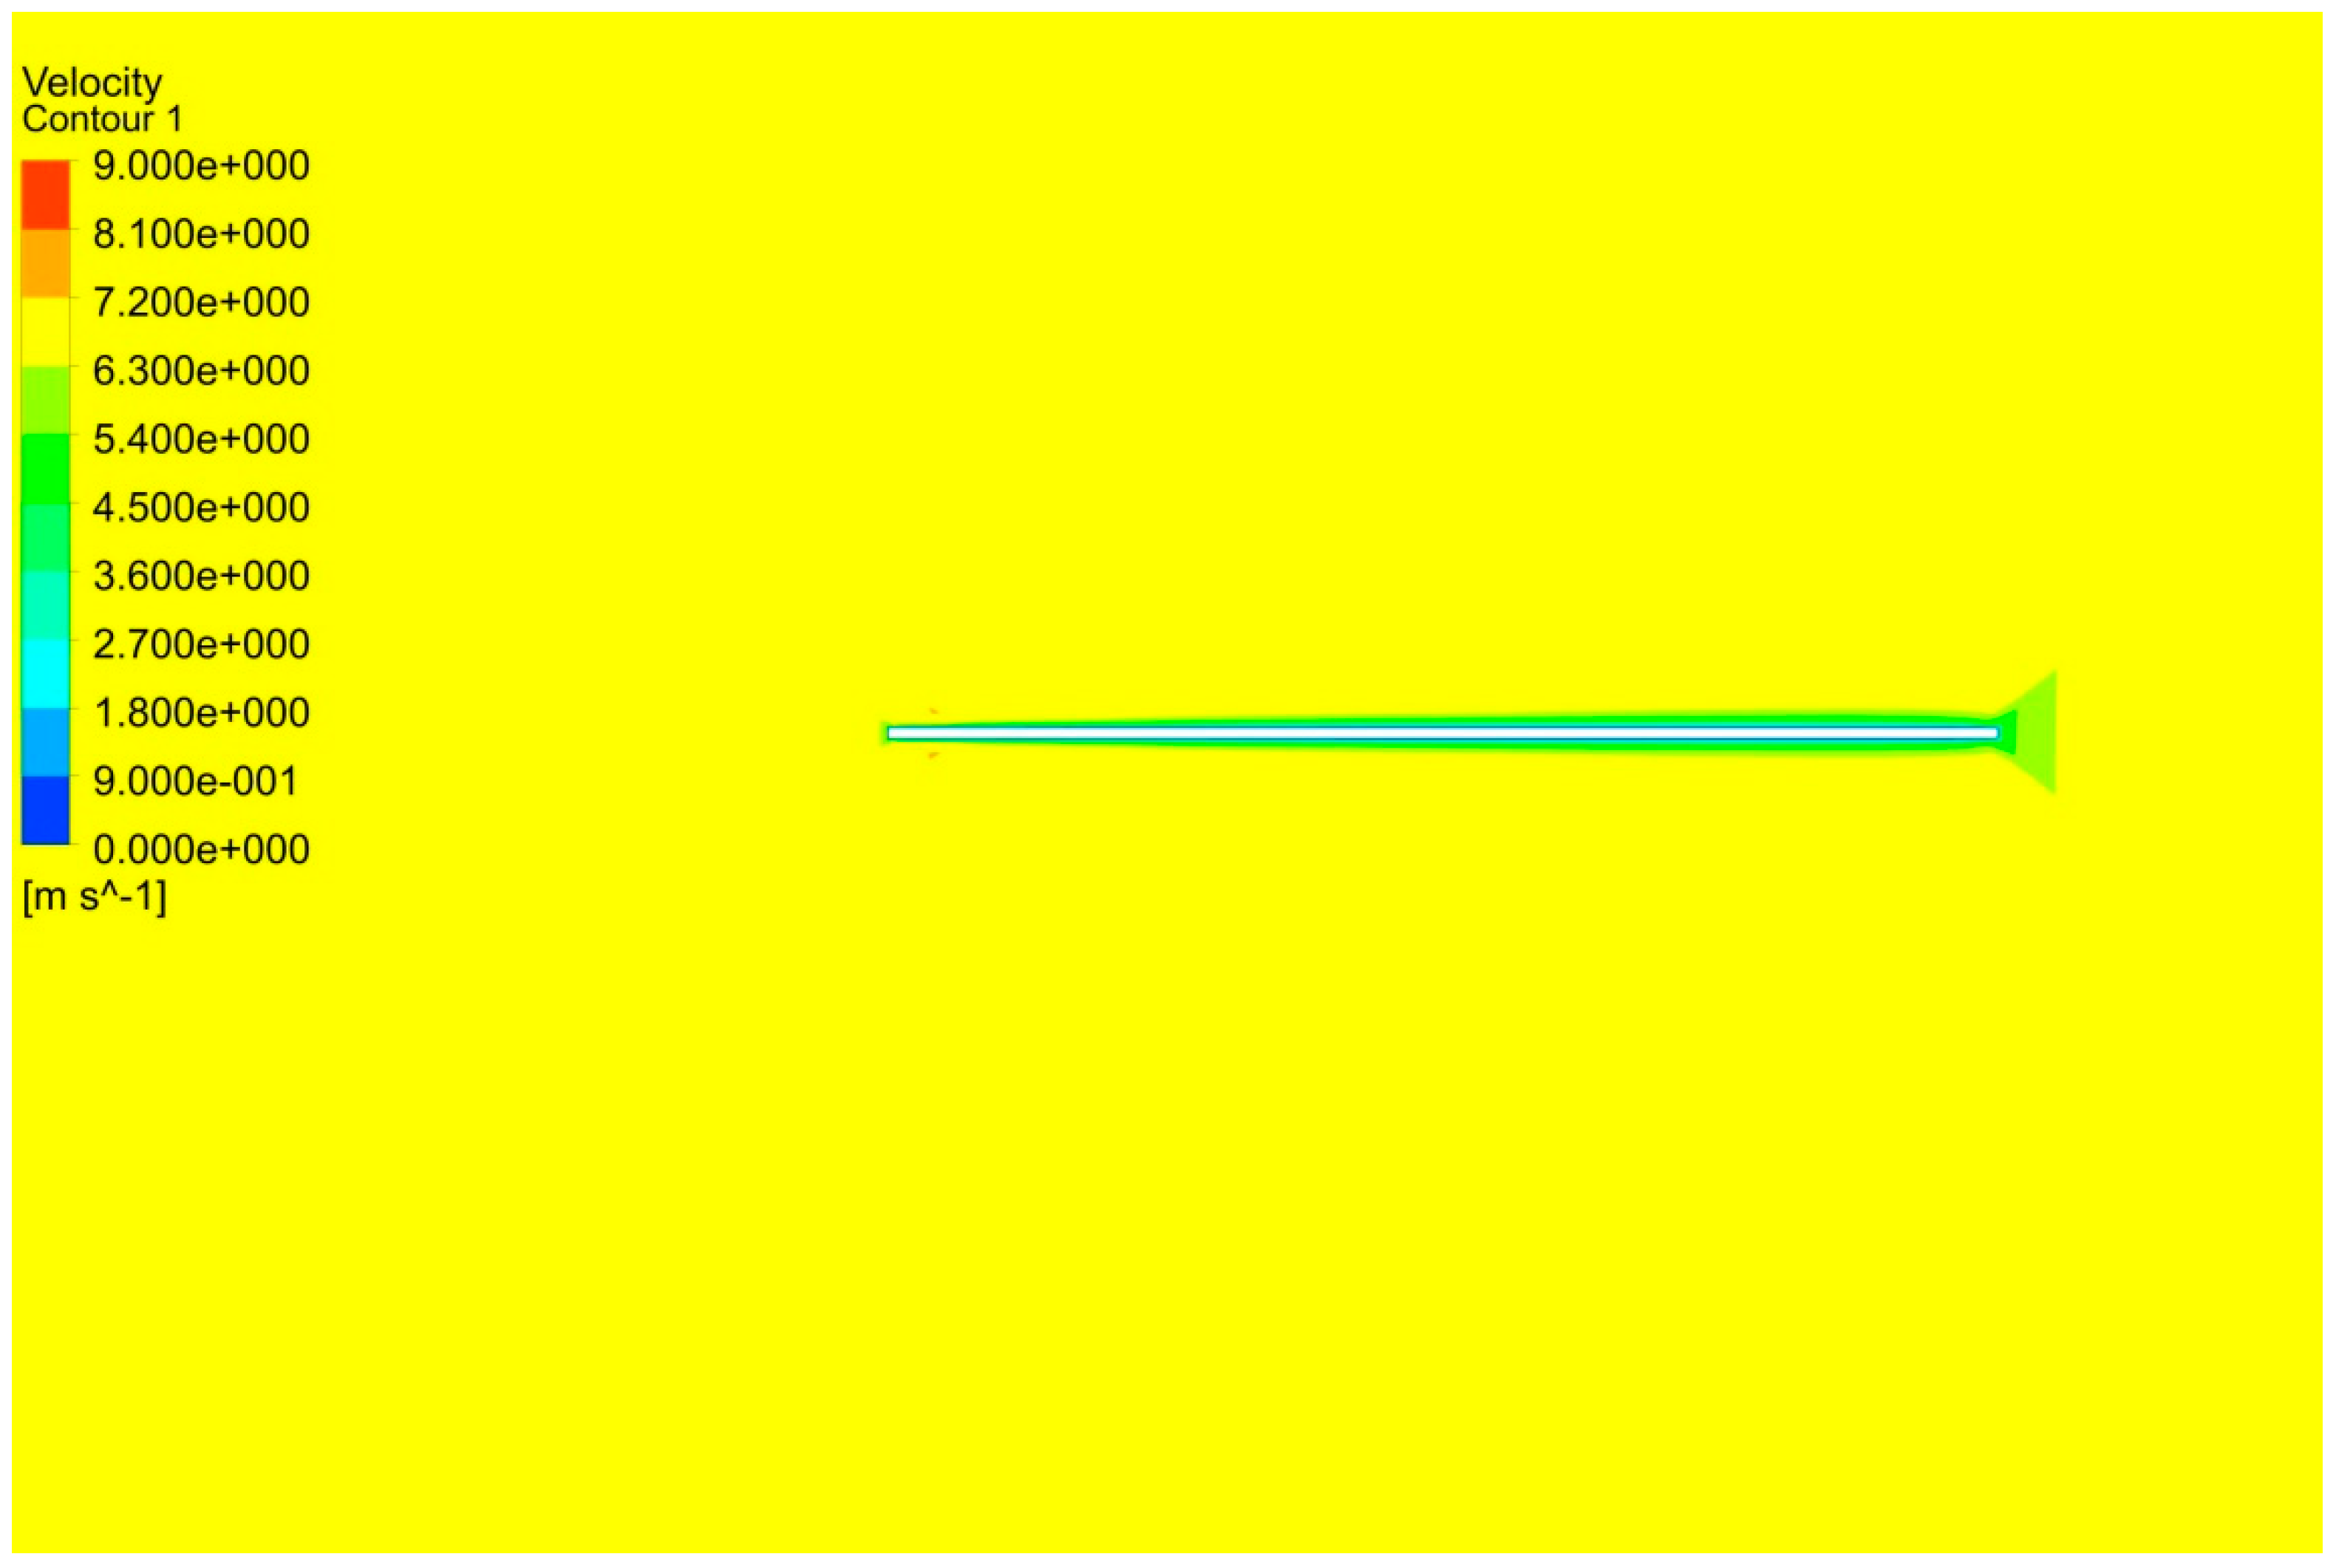
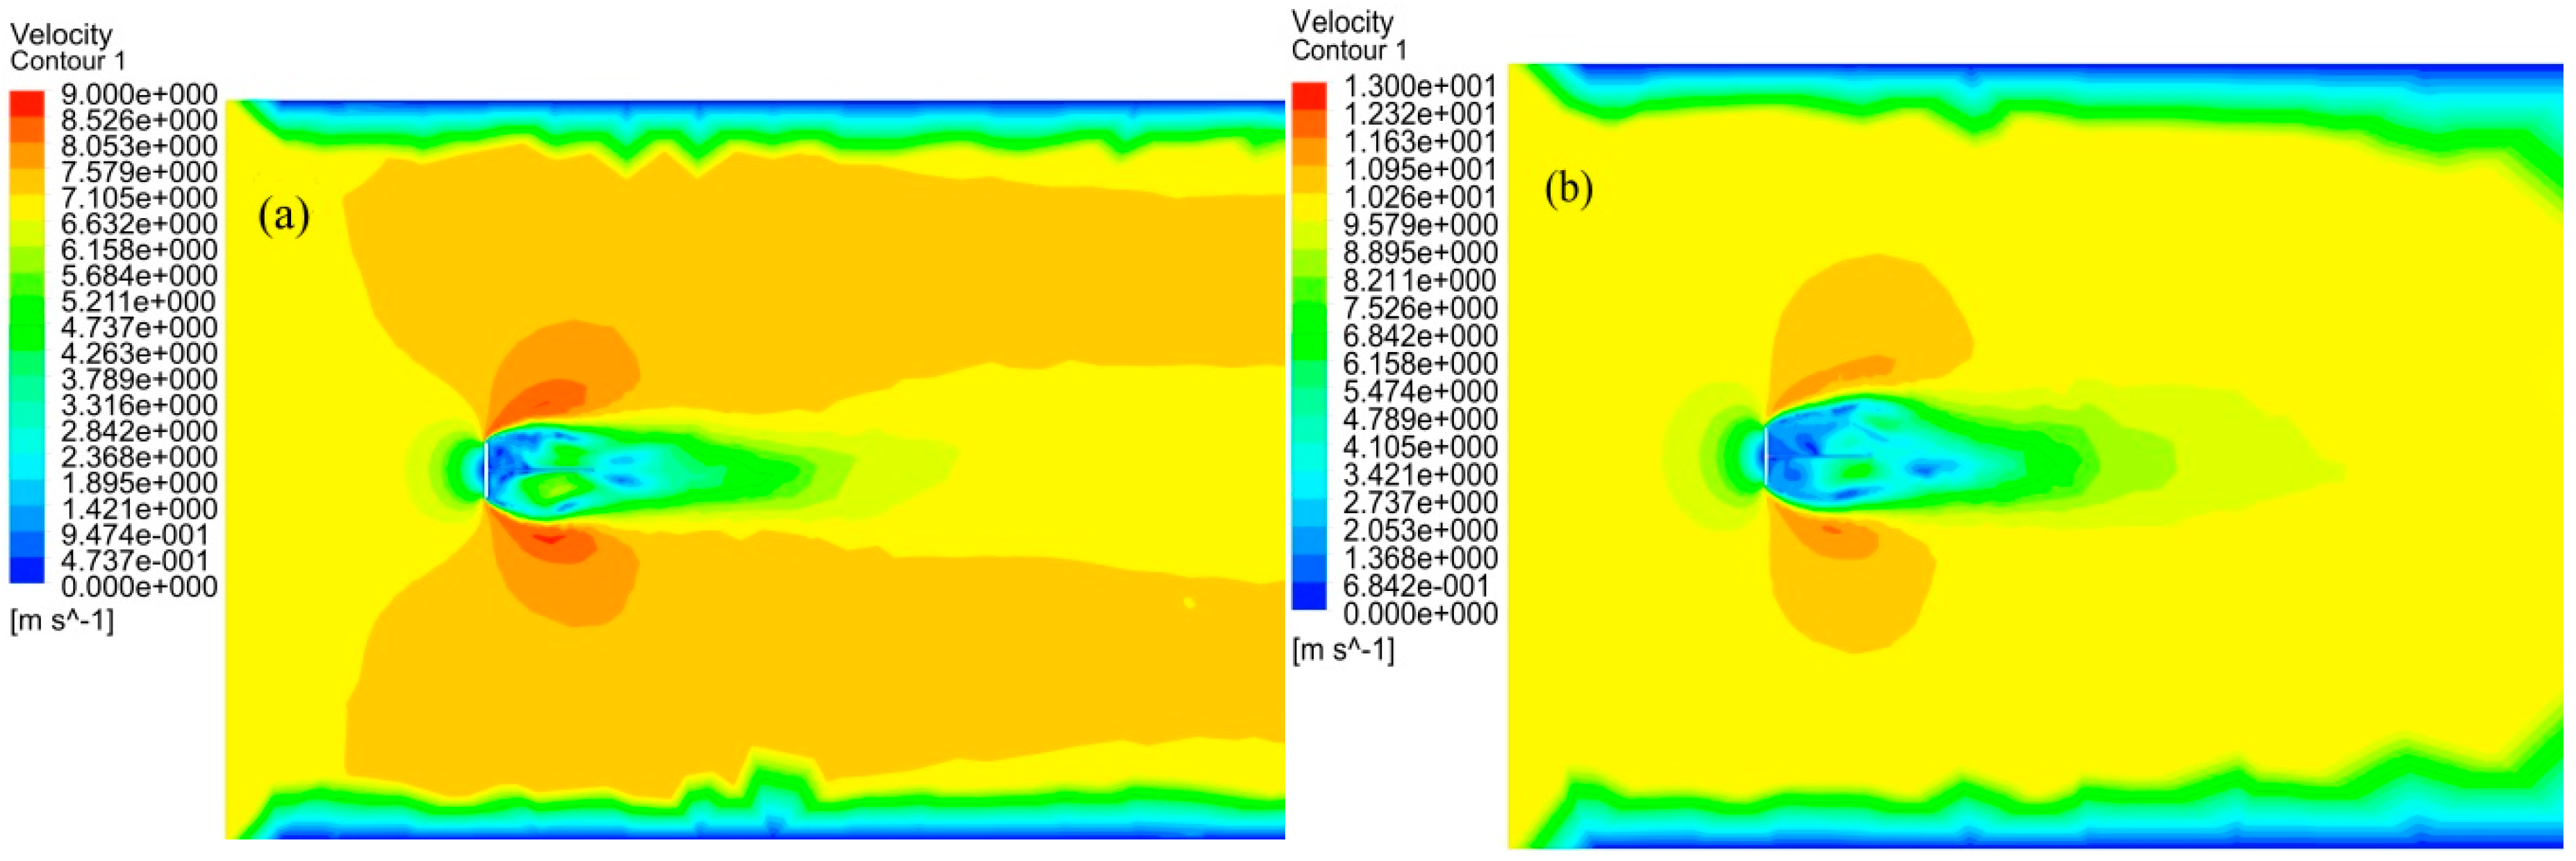
4.3. Vortex Formation with Bluff Splitter Body
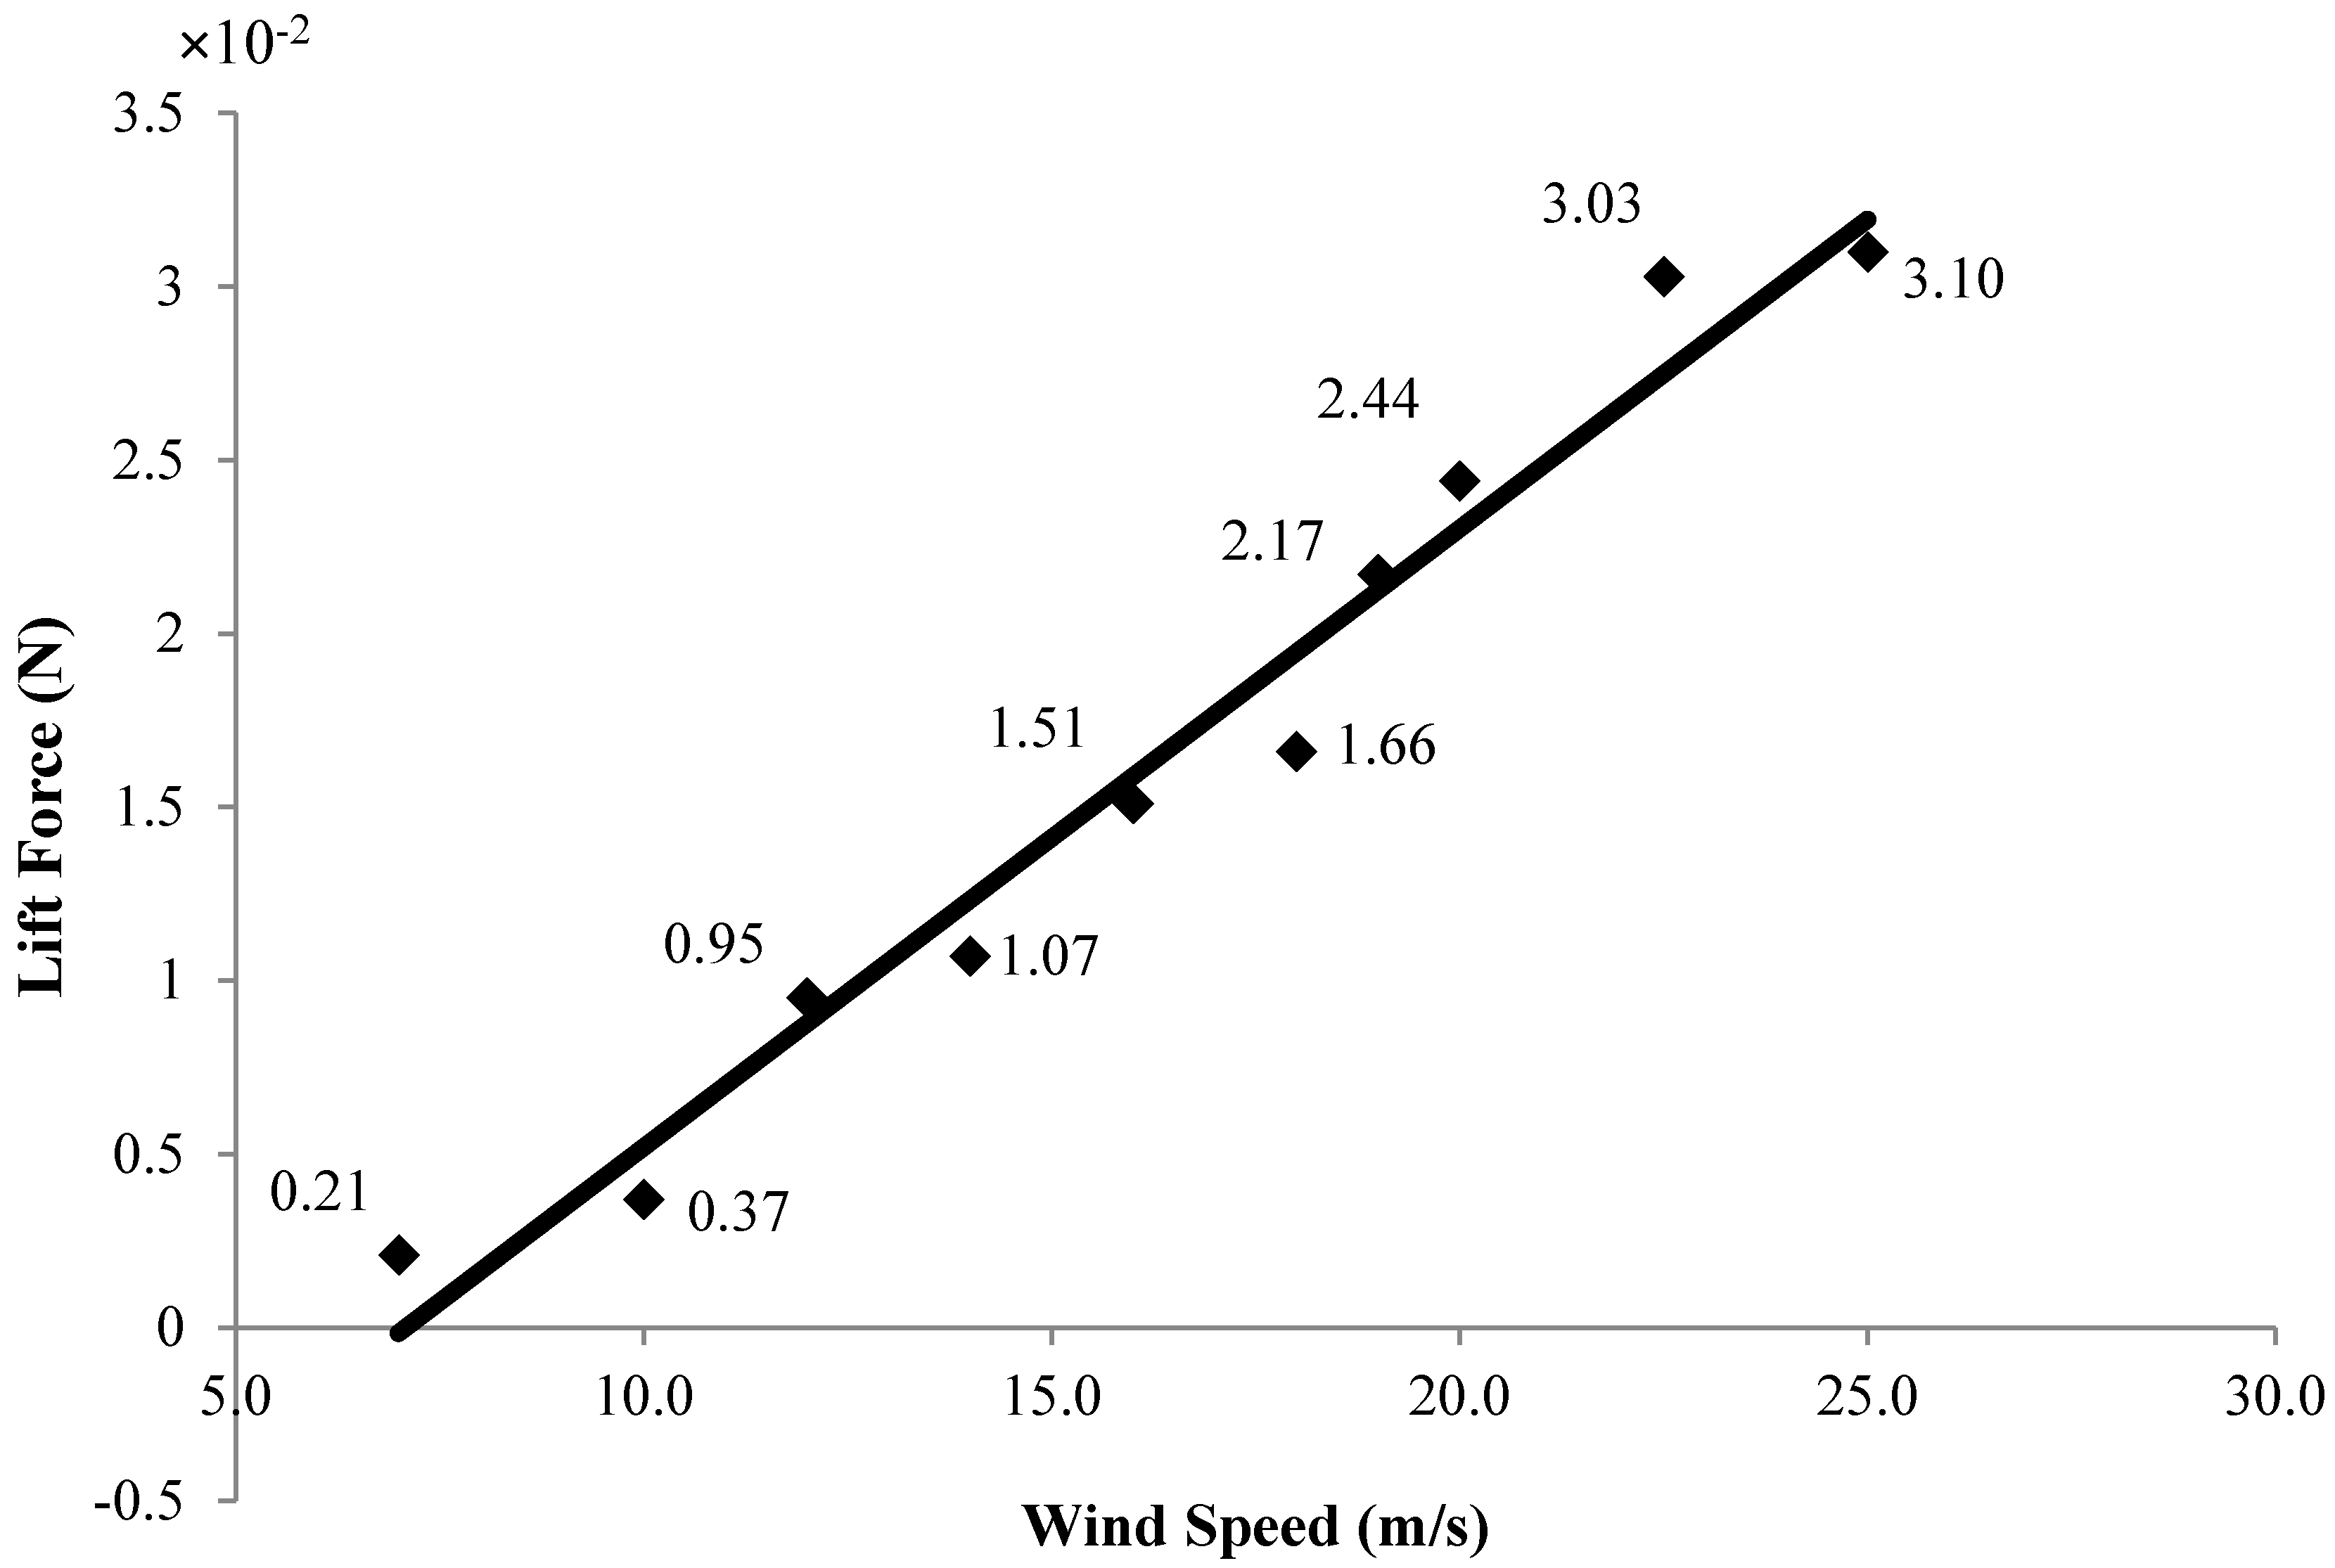
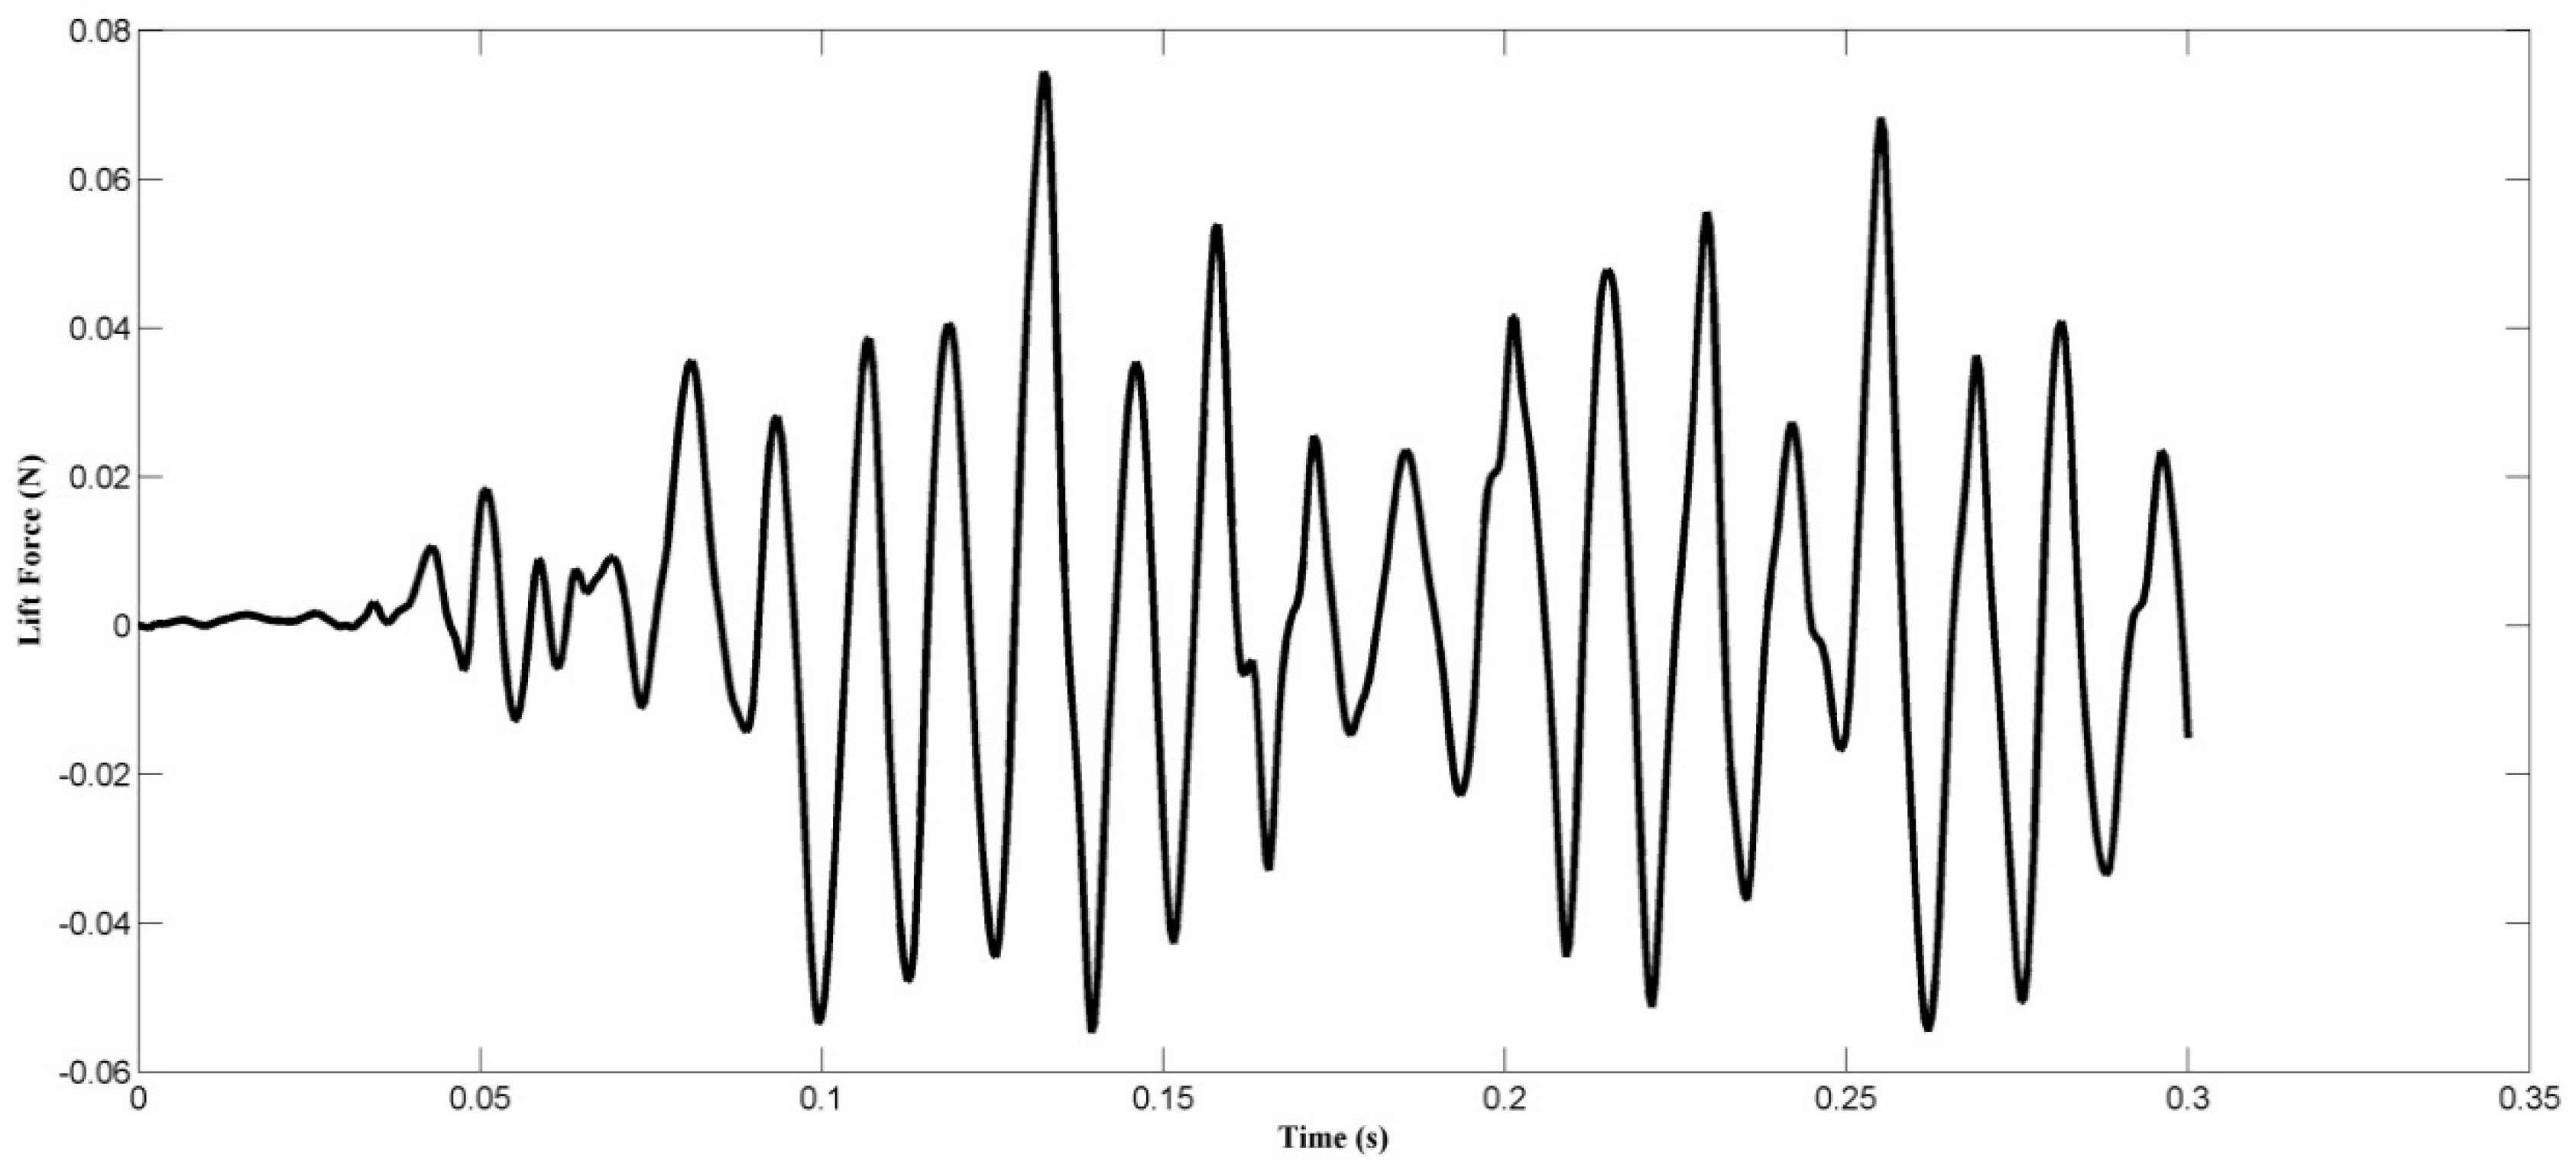
4.4. Fluctuating Lift Force
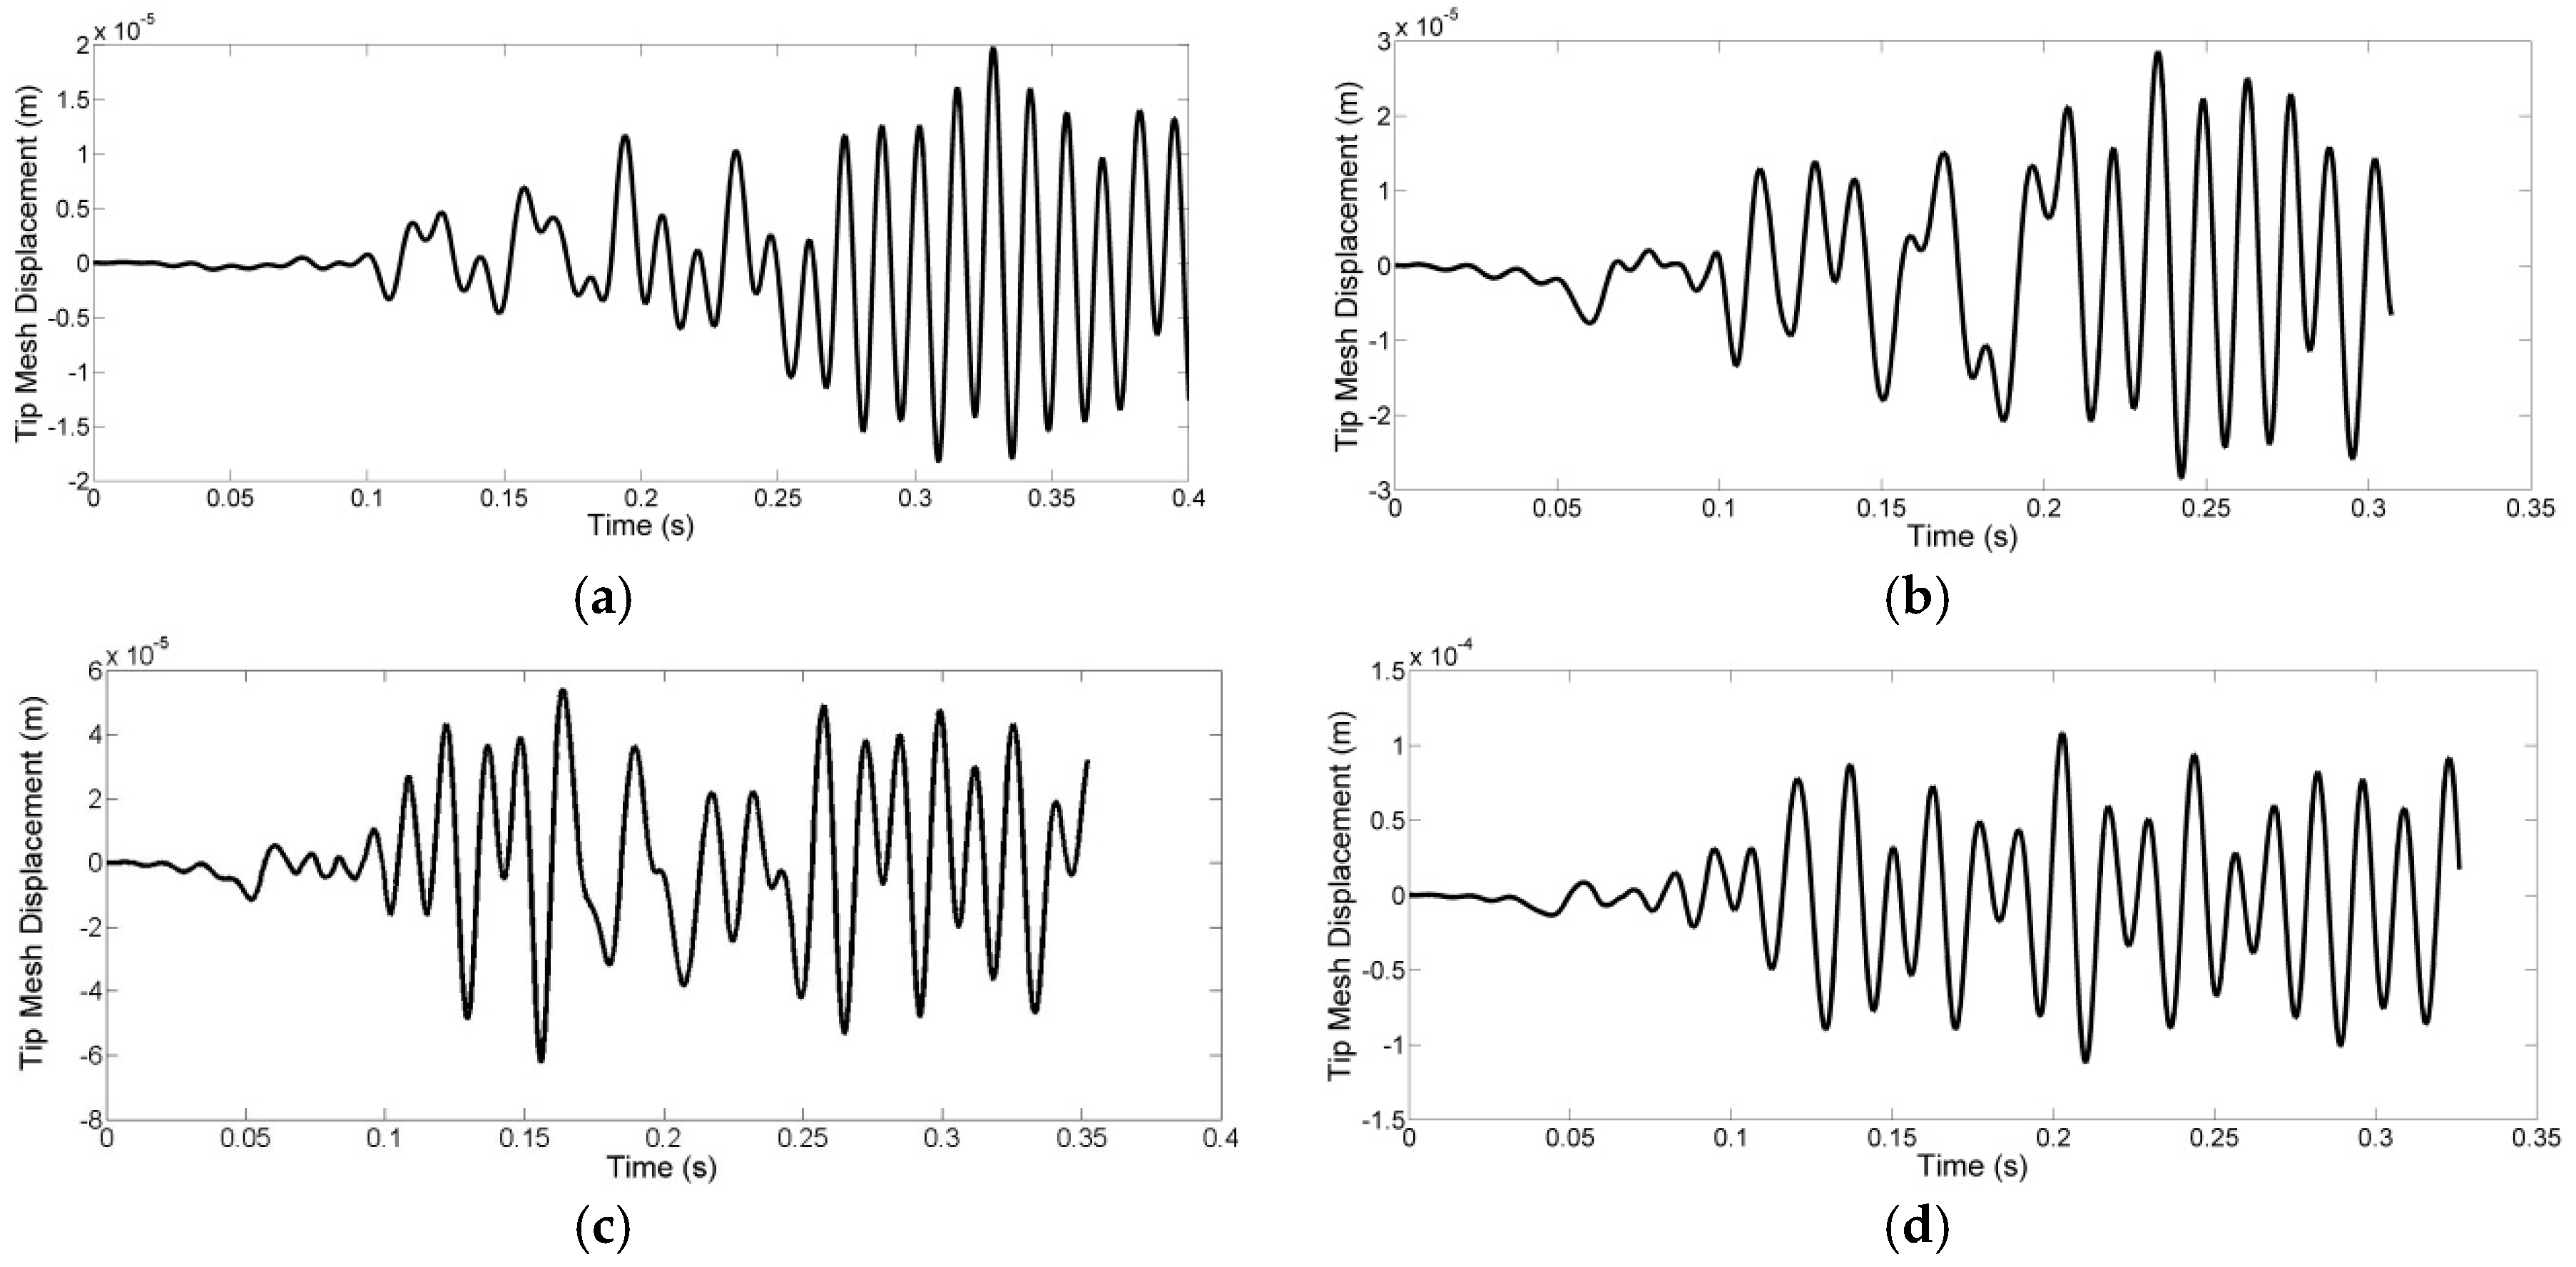
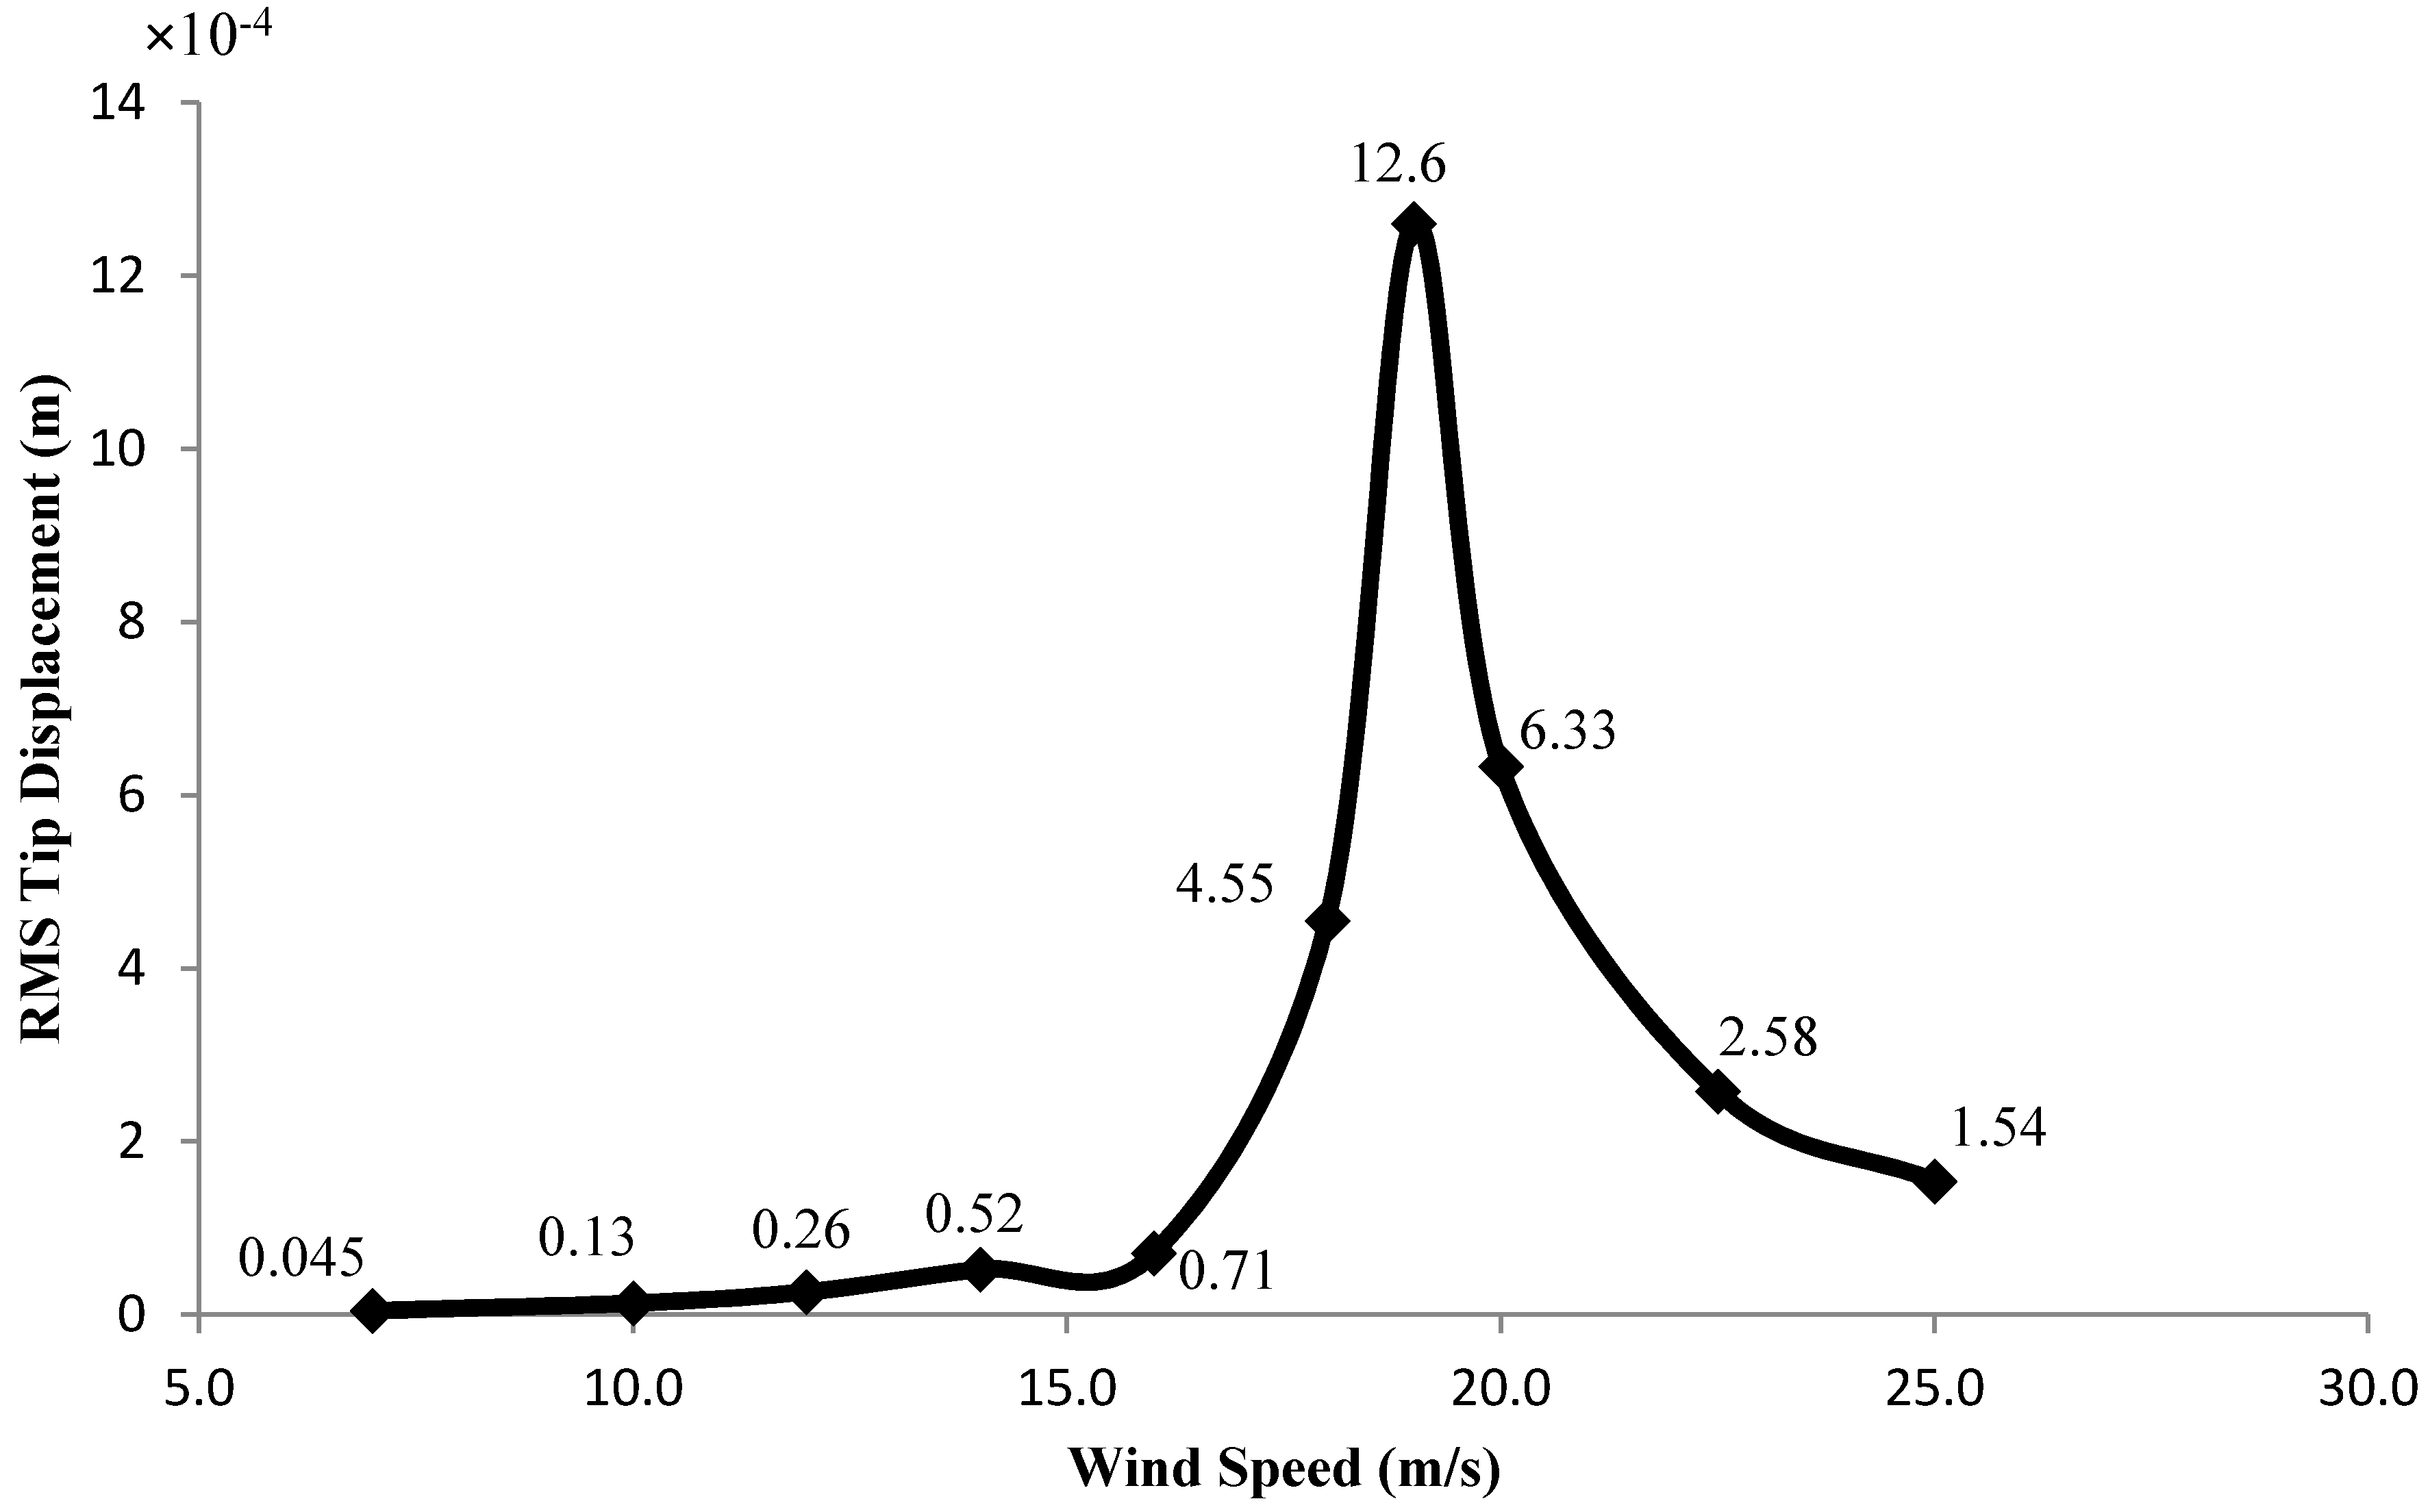
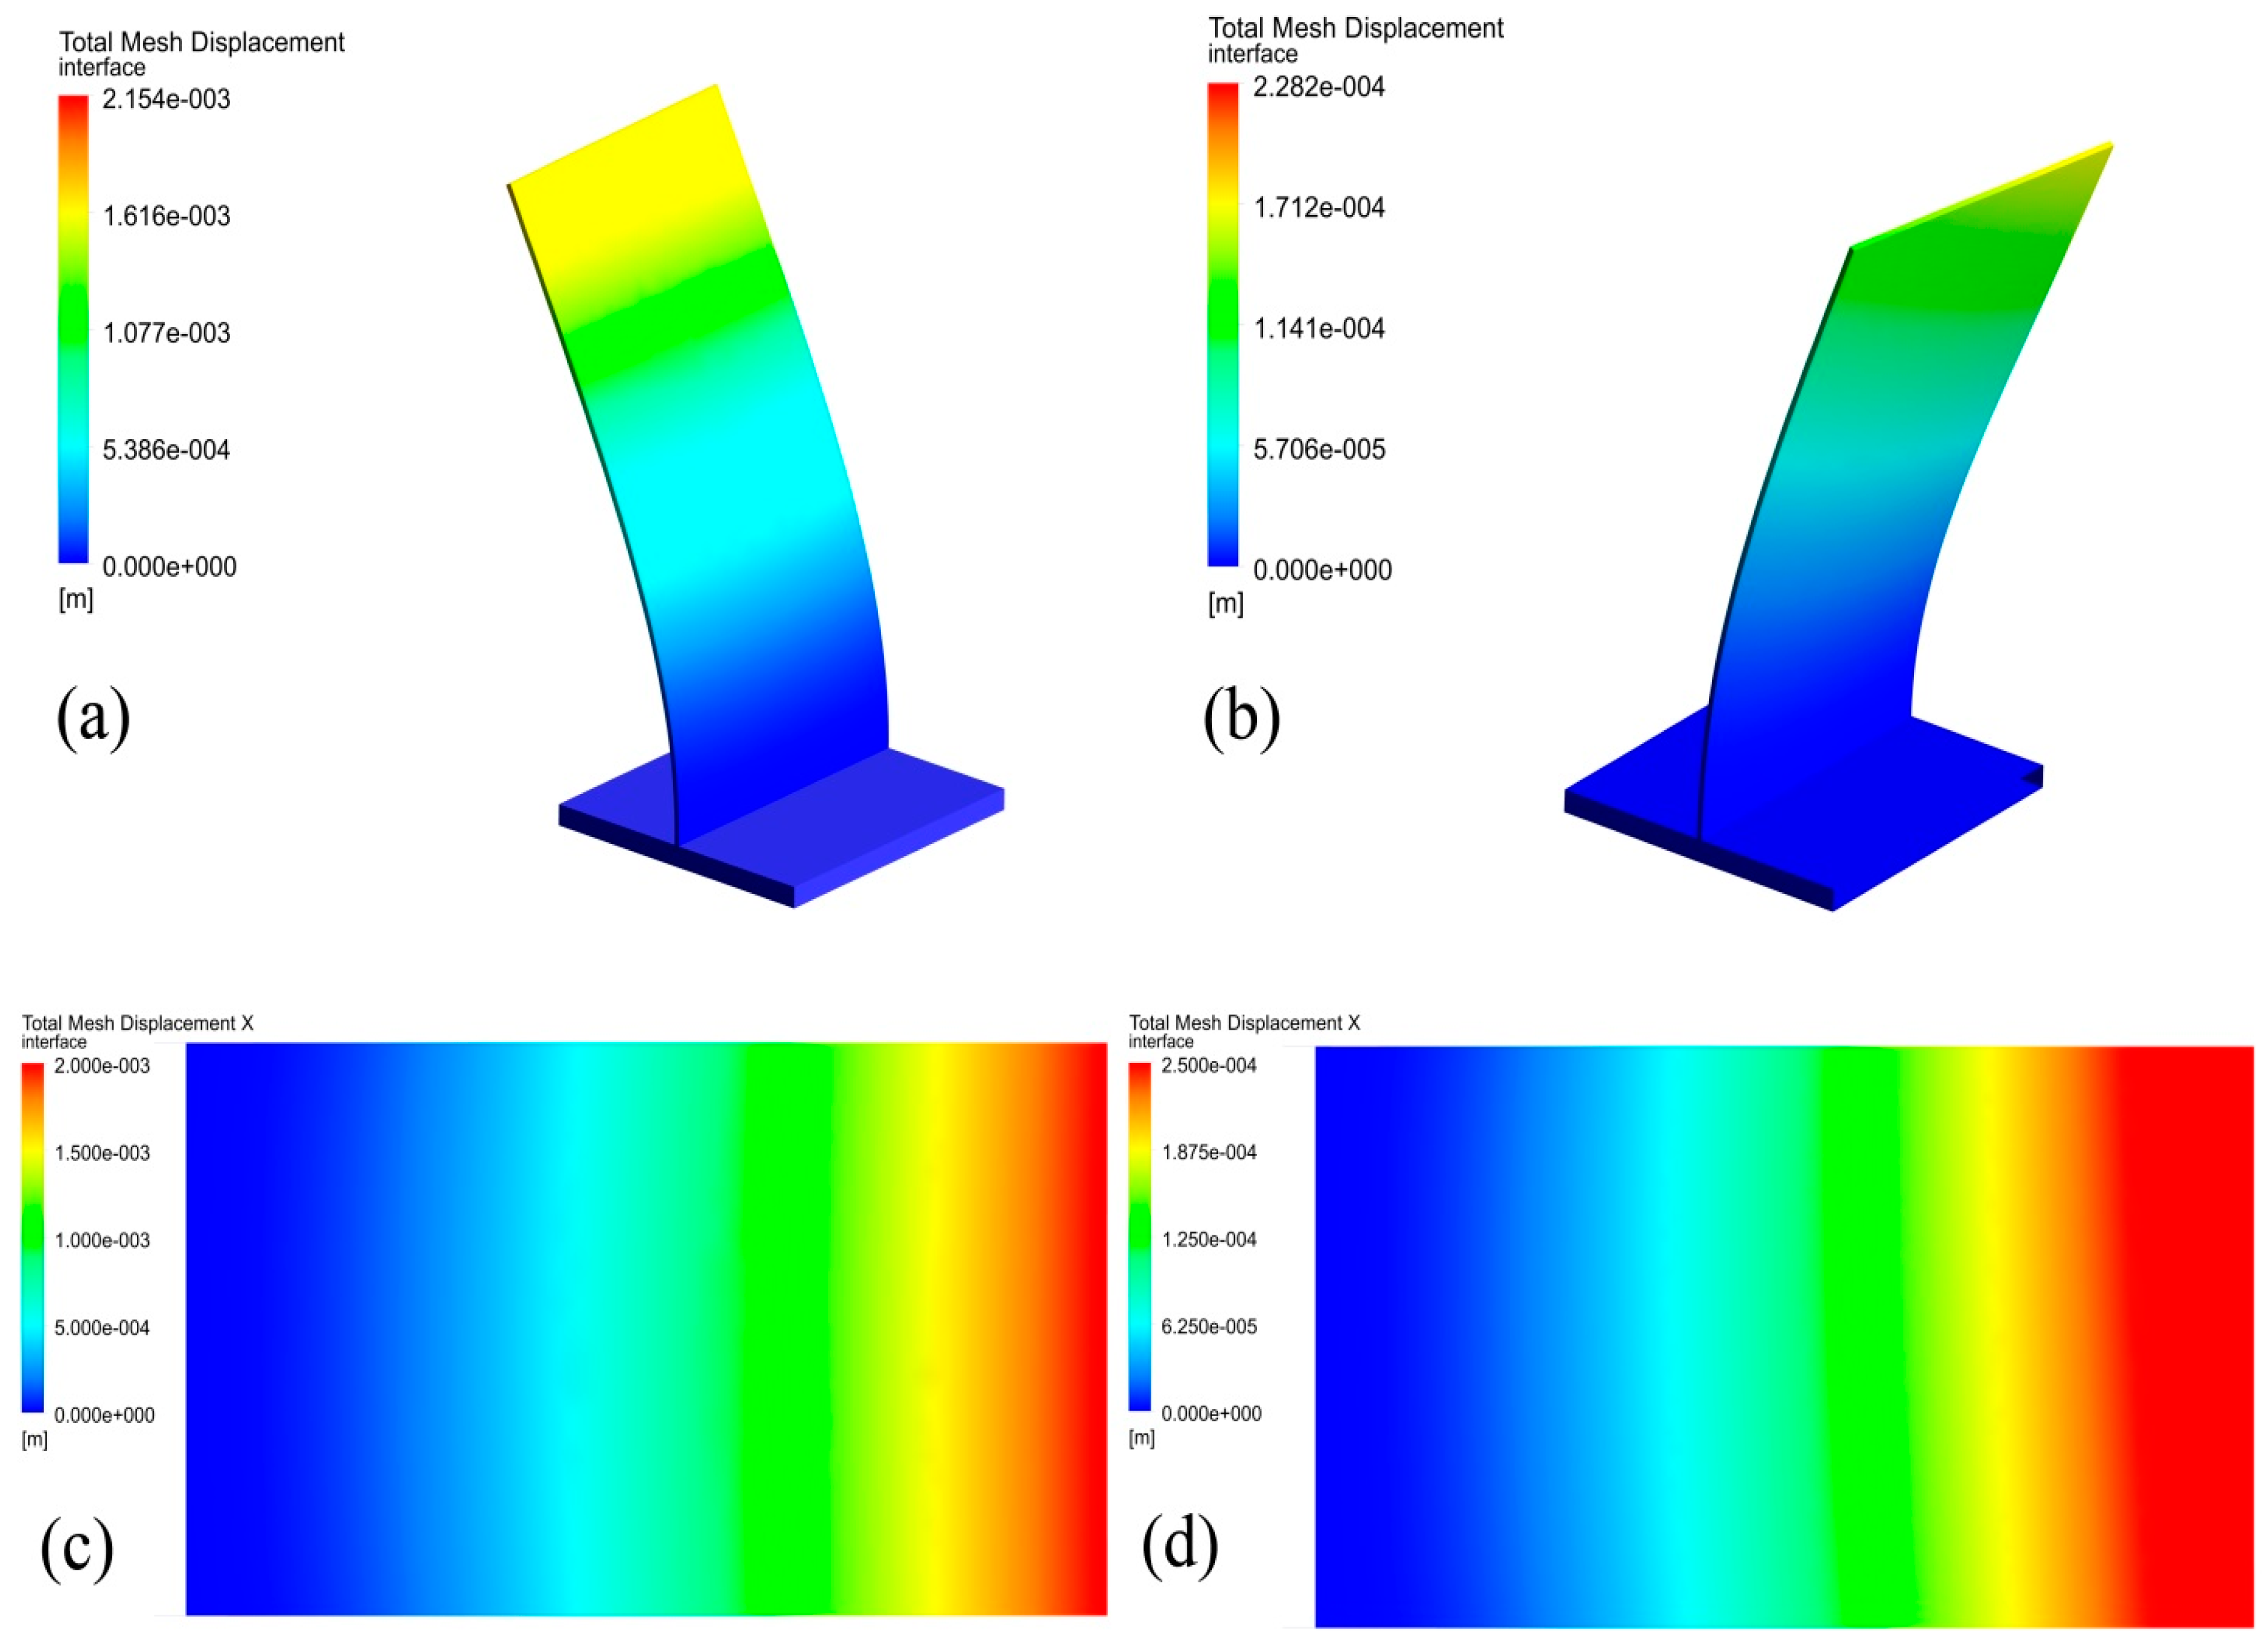
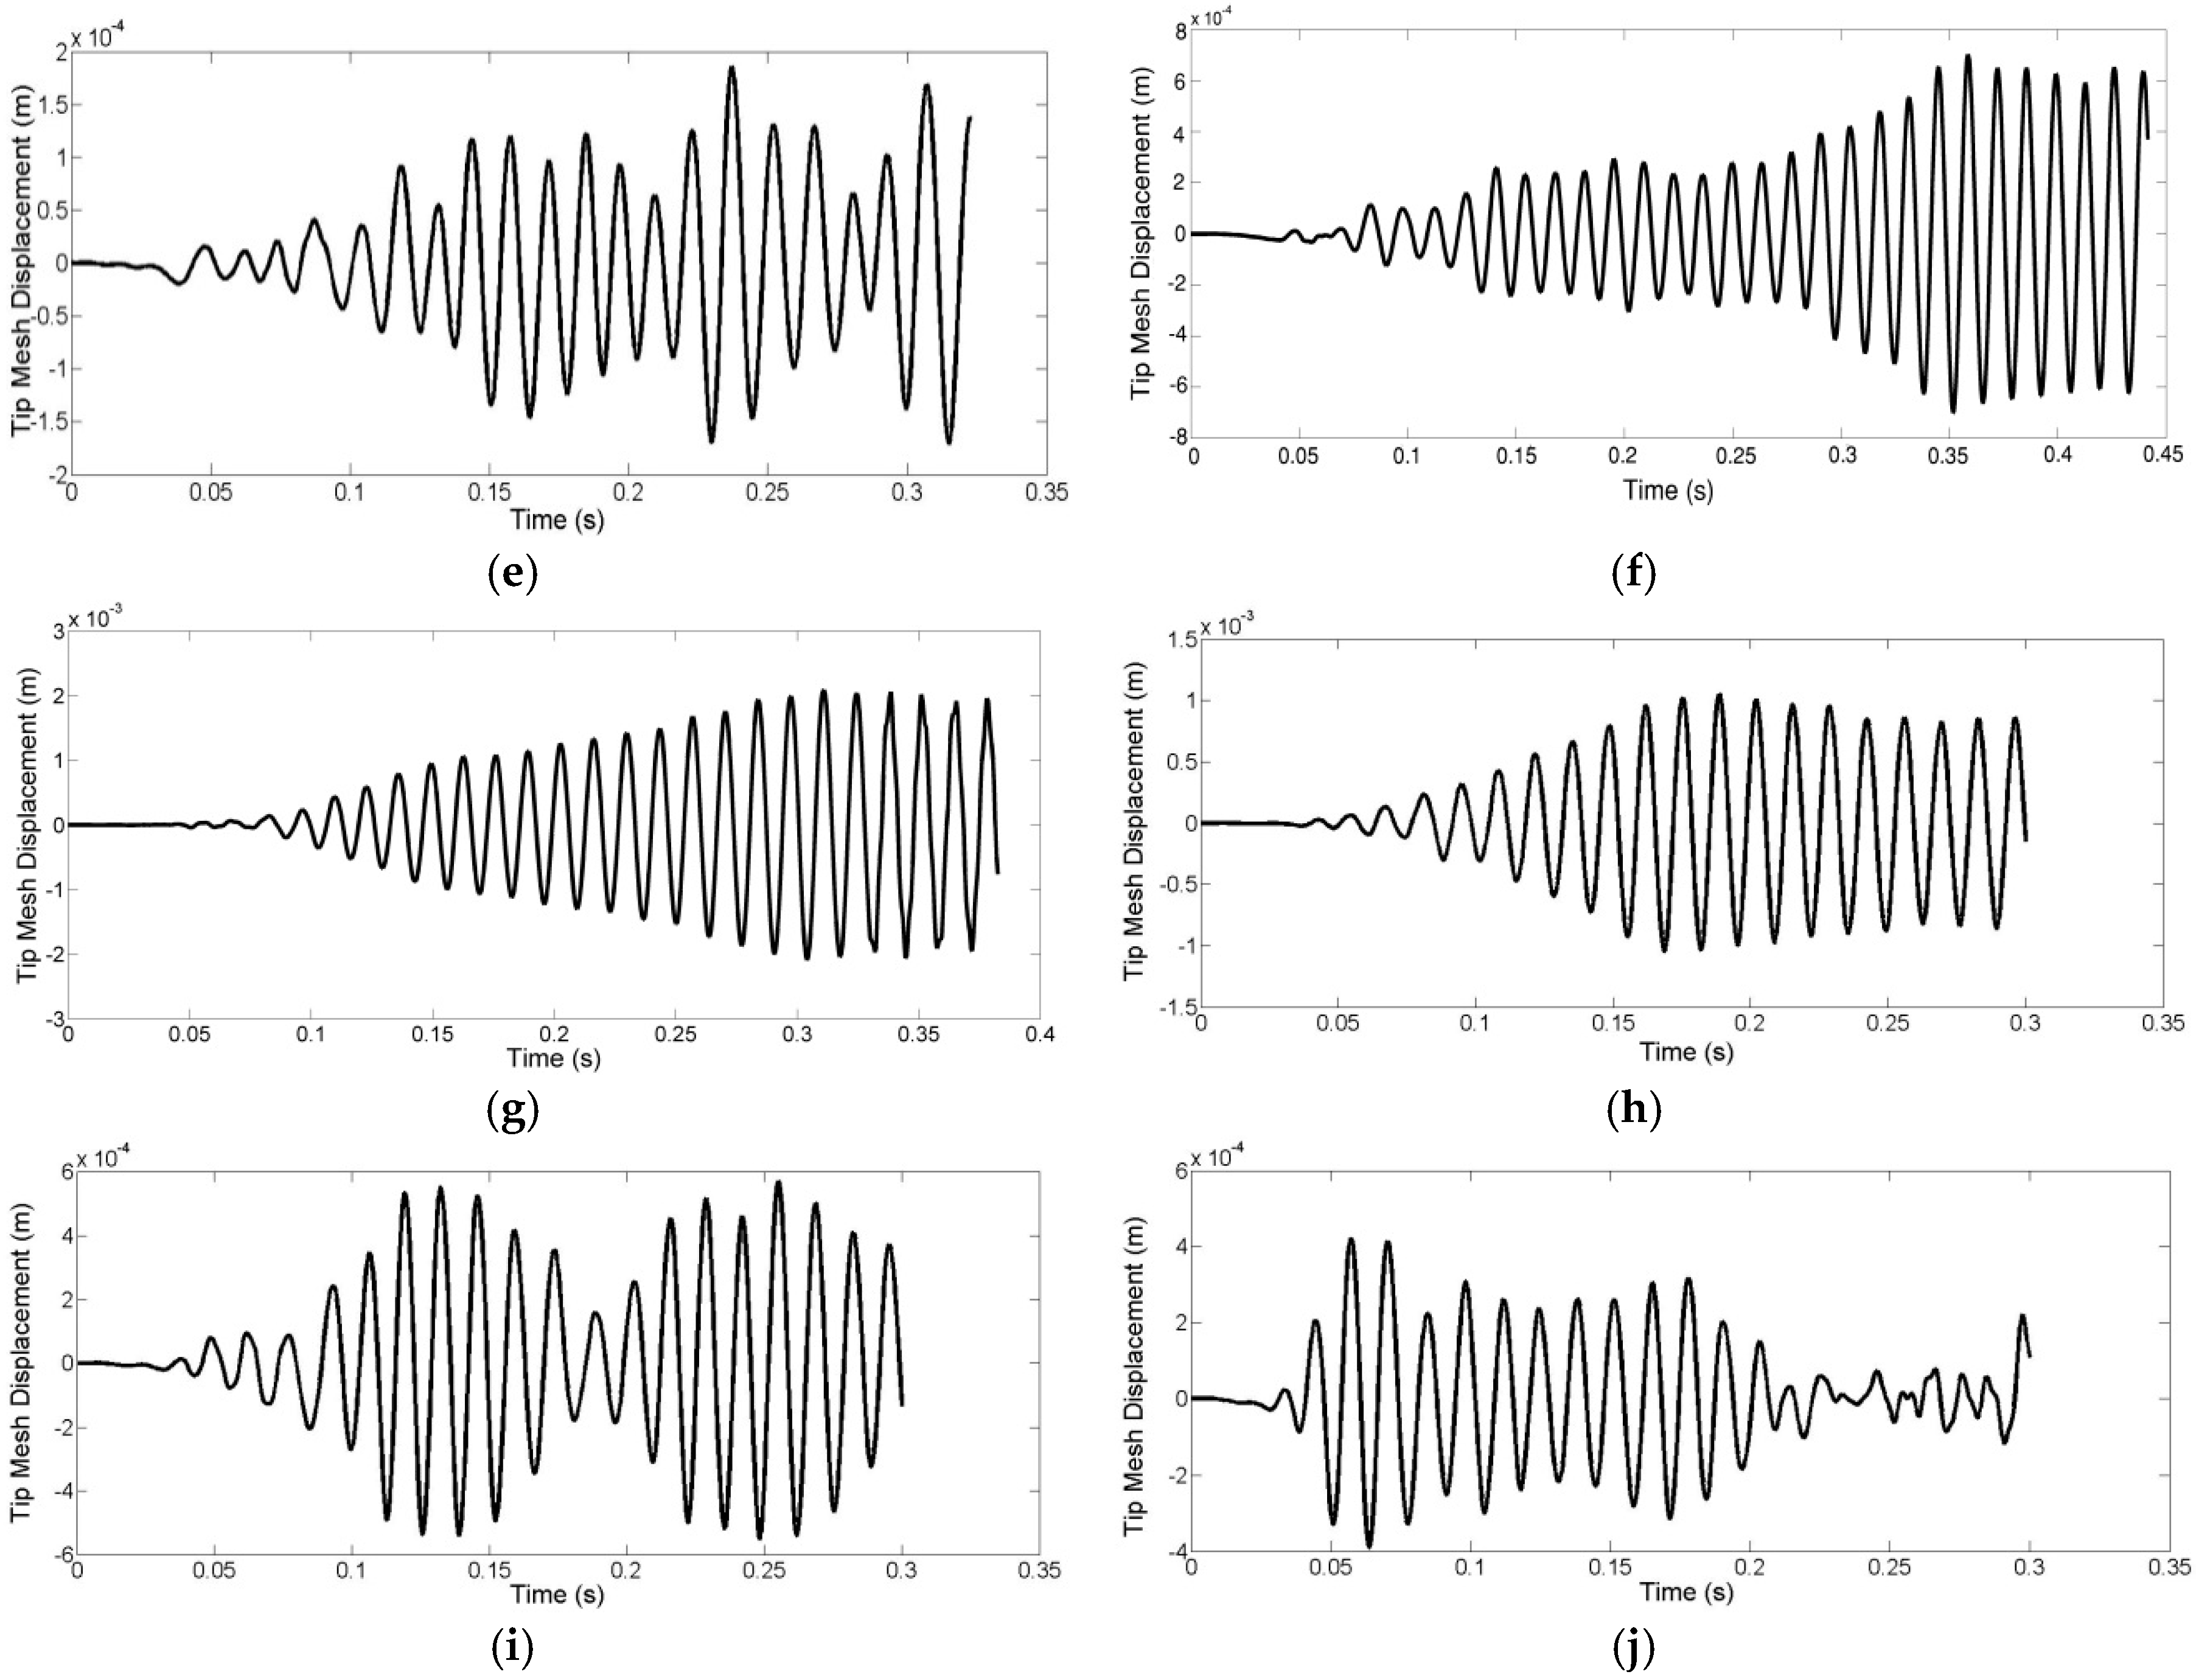
4.5. Vortex Induced Vibration Response
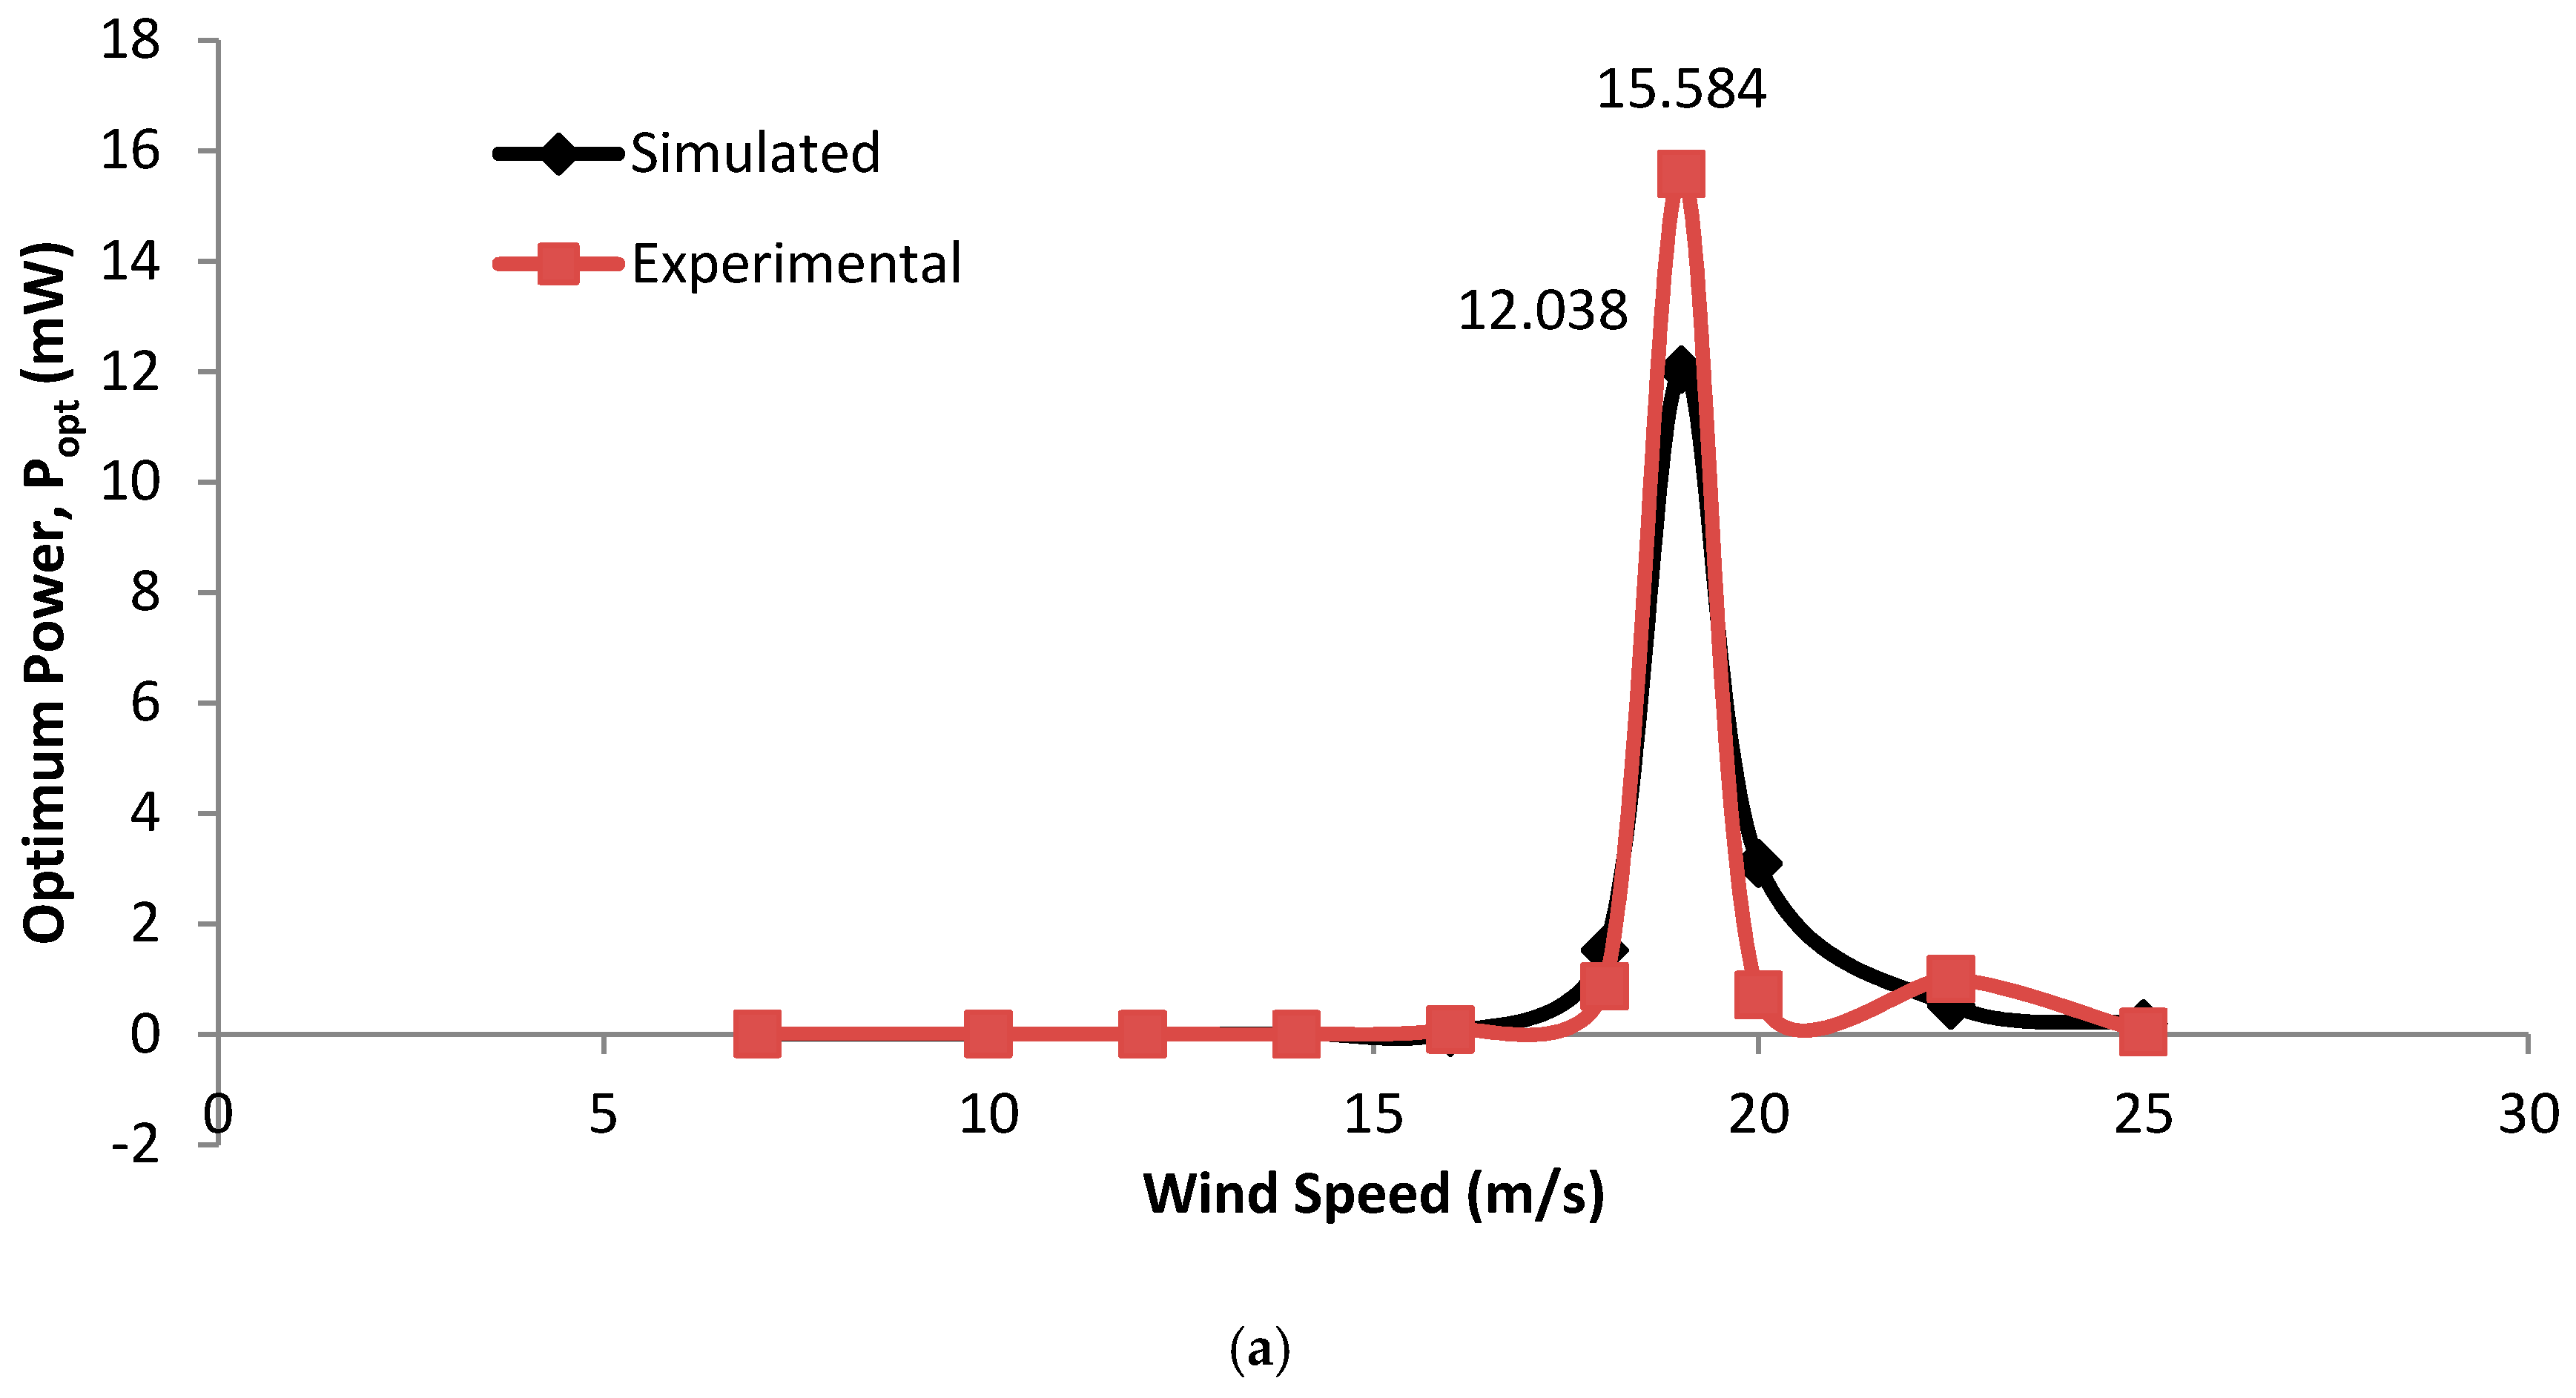
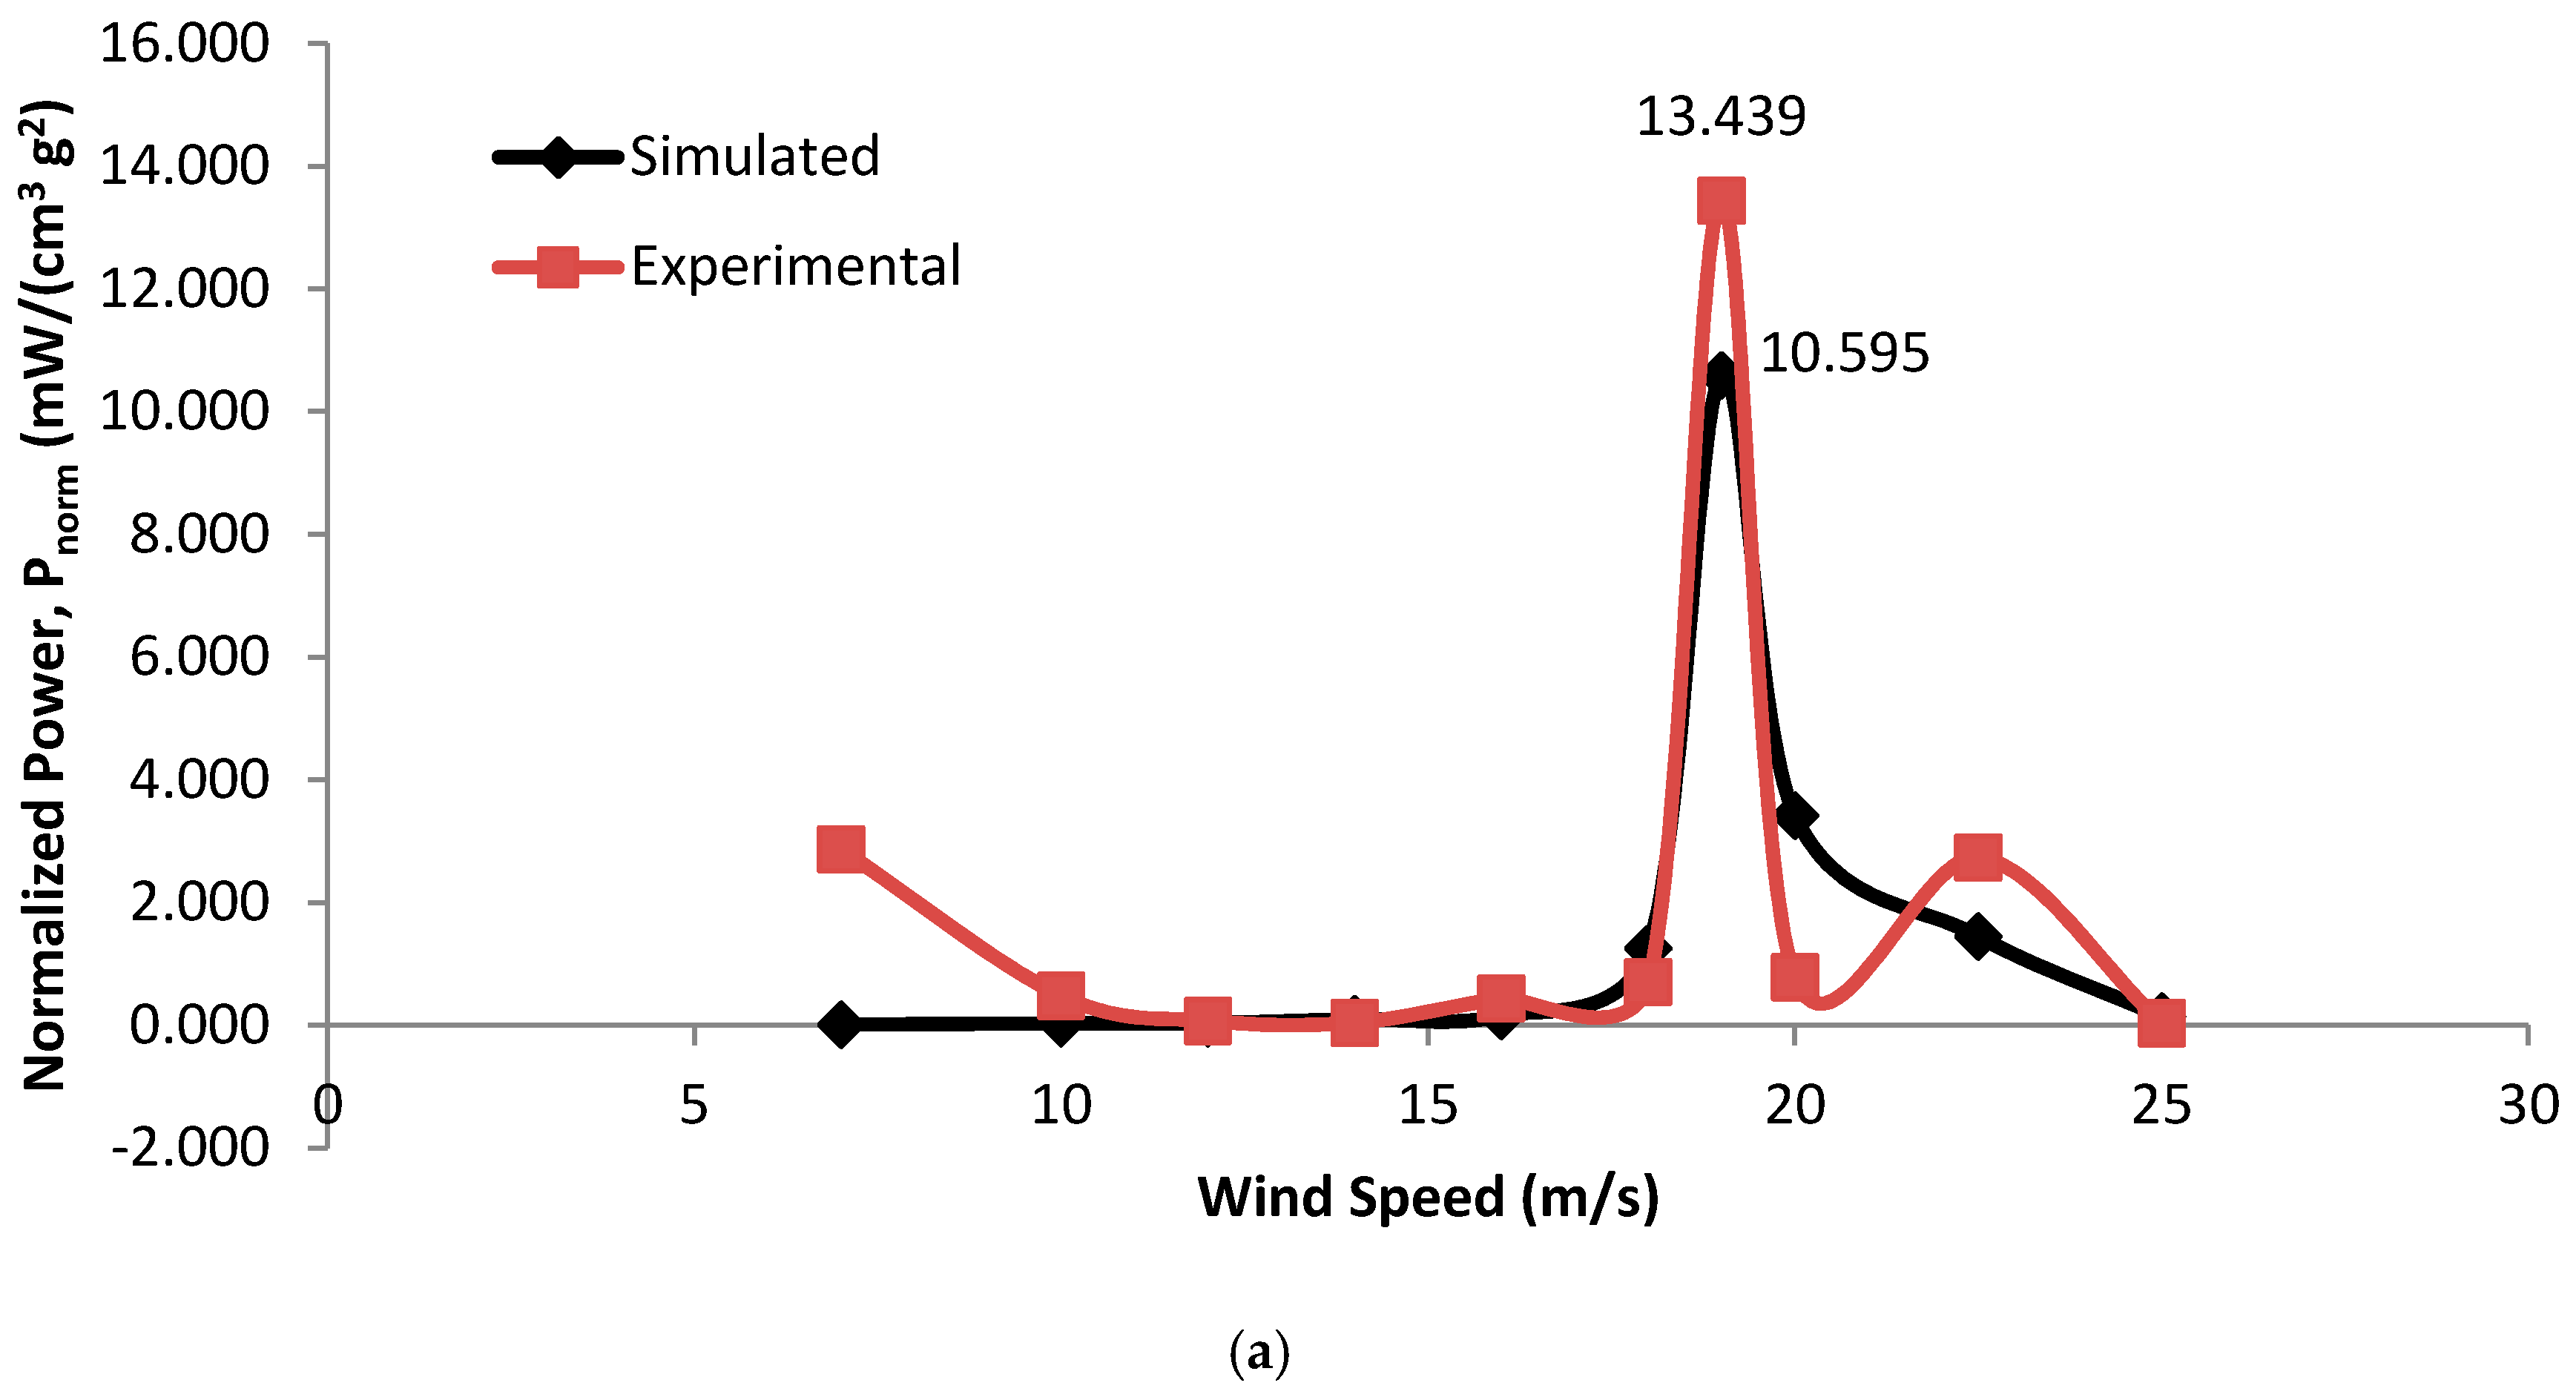
4.6. PVEH Performance
4.7. Comparison with Previous Research
5. Conclusions
Acknowledgments
Author Contributions
Conflicts of Interest
References
- Abed, I.; Kacem, N.; Bouhaddi, N.; Bouazizi, M. Nonlinear dynamics of magnetically coupled beams for multi-modal vibration energy harvesting. Proceedings of SPIE Smart Structures and Materials + Nondestructive Evaluation and Health Monitoring, Las Vegas, NV, USA, 20--24 March 2016. [Google Scholar] [CrossRef]
- Mahmoudi, S.; Kacem, N.; Bouhaddi, N. Enhancement of the performance of a hybrid nonlinear vibration energy harvester based on piezoelectric and electromagnetic transductions. Smart Mater. Struct. 2014, 23, 075024. [Google Scholar] [CrossRef]
- Blevins, R.D. Flow-Induced Vibration; Krieger Publishing Company: Malabar, FL, USA, 2001. [Google Scholar]
- Bearman, P.W. Vortex shedding from oscillating bluff-bodies. Annu. Rev. Fluid Mech. 1984, 16, 195–222. [Google Scholar] [CrossRef]
- Bearman, P.W. Circular cylinder wakes and vortex-induced vibrations. J. Fluids Struct. 2011, 27, 648–658. [Google Scholar] [CrossRef]
- Sarpkaya, T. A critical review of the intrinsic nature of vortex-induced vibrations. J. Fluids Struct. 2004, 19, 389–447. [Google Scholar] [CrossRef]
- Williamson, C.H.K.; Govardhan, R. Vortex-induced vibrations. Annu. Rev. Fluid Mech. 2004, 36, 413–455. [Google Scholar] [CrossRef]
- Cooper, K.R.; Wardlaw, R.L. Aeroelastic instabilities in wakes. In Proceedings of the Third International Conference on Wind Effects on Buildings and Structures, Tokyo, Japan, 1971; pp. 647–655. [Google Scholar]
- Bernitsas, M.M.; Raghavan, K.; Ben-Simon, Y.; Garcia, E.M.H. Vivace (vortex induced vibration aquatic clean energy): A new concept in generation of clean and renewable energy from fluid flow. J. Offshore Mech. Arct. 2008, 130, 041101. [Google Scholar] [CrossRef]
- Lee, J.H.; Bernitsas, M.M. High-damping, high-reynolds VIV tests for energy harnessing using the vivace converter. Ocean Eng. 2011, 38, 1697–1712. [Google Scholar] [CrossRef]
- Raghavan, K.; Bernitsas, M.M. Enhancement of high damping VIV through roughness distribution for energy harnessing at 8 × 10³ < Re < 1.5 × 10⁵. In Proceedings of the 27th International Conference on Offshore Mechanics and Arctic Engineering, Estoril, Portugal, 15–20 June 2008; Volume 6, pp. 871–882. [Google Scholar]
- Raghavan, K.; Bernitsas, M.M.; Maroulis, D.E. Effect of bottom boundary on VIV for energy harnessing at 8 × 10³ < Re < 1.5 × 10⁵. J. Offshore Mech. Arct. 2009, 131, 031102. [Google Scholar]
- Sun, H.; Kim, E.S.; Nowakowski, G.; Mauer, E.; Bernitsas, M.M. Effect of mass-ratio, damping, and stiffness on optimal hydrokinetic energy conversion of a single, rough cylinder in flow induced motions. Renew. Energy 2016, 99, 936–959. [Google Scholar] [CrossRef]
- Zhang, J.; Liu, F.; Lian, J.J.; Yan, X.; Ren, Q.C. Flow induced vibration and energy extraction of an equilateral triangle prism at different system damping ratios. Energies 2016, 9, 938. [Google Scholar] [CrossRef]
- Ding, L.; Zhang, L.; Wu, C.M.; Mao, X.R.; Jiang, D.Y. Flow induced motion and energy harvesting of bluff bodies with different cross sections. Energy Convers. Manag. 2015, 91, 416–426. [Google Scholar] [CrossRef]
- Sayeed-Bin-Asad, S.; Lundström, T.; Andersson, A. Study the flow behind a semi-circular step cylinder (laser doppler velocimetry (LDV) and computational fluid dynamics (CFD)). Energies 2017, 10, 332. [Google Scholar] [CrossRef]
- Karbasian, H.R.; Esfahani, J.A.; Barati, E. The power extraction by flapping foil hydrokinetic turbine in swing arm mode. Renew. Energy 2016, 88, 130–142. [Google Scholar] [CrossRef]
- Karbasian, H.R.; Esfahani, J.A.; Barati, E. Simulation of power extraction from tidal currents by flapping foil hydrokinetic turbines in tandem formation. Renew. Energy 2015, 81, 816–824. [Google Scholar] [CrossRef]
- Shan, X.; Deng, J.; Song, R.; Xie, T. A piezoelectric energy harvester with bending-torsion vibration in low-speed water. Appl. Sci. 2017, 7, 116. [Google Scholar] [CrossRef]
- Sohankar, A. A les study of the flow interference between tandem square cylinder pairs. Theor. Comp. Fluid Dyn. 2014, 28, 531–548. [Google Scholar] [CrossRef]
- Pang, J.H.; Zong, Z.; Zou, L.; Wang, Z. Numerical simulation of the flow around two side-by-side circular cylinders by ivcbc vortex method. Ocean Eng. 2016, 119, 86–100. [Google Scholar] [CrossRef]
- Kondo, N. Three-dimensional computation for flow-induced vibrations of an upstream circular cylinder in two tandem circular cylinders. Int. J. Comput. Fluids D 2014, 28, 461–476. [Google Scholar] [CrossRef]
- Sun, H.; Ma, C.; Kim, E.S.; Nowakowski, G.; Mauer, E.; Bernitsas, M.M. Hydrokinetic energy conversion by two rough tandem-cylinders in flow induced motions: Effect of spacing and stiffness. Renew. Energy 2017, 107, 61–80. [Google Scholar] [CrossRef]
- Derakhshandeh, J.F.; Arjomandi, M.; Cazzolato, B.S.; Dally, B. Effect of a rigid wall on the vortex induced vibration of two staggered circular cylinders. J. Renew. Sustain. Energy 2014, 6, 033114. [Google Scholar] [CrossRef]
- Goushcha, O.; Akaydin, H.D.; Elvin, N.; Andreopoulos, Y. Energy harvesting prospects in turbulent boundary layers by using piezoelectric transduction. J. Fluids Struct. 2015, 54, 823–847. [Google Scholar] [CrossRef]
- McCarthy, J.M.; Deivasigamani, A.; John, S.J.; Watkins, S.; Coman, F.; Petersen, P. Downstream flow structures of a fluttering piezoelectric energy harvester. Exp. Therm. Fluid Sci. 2013, 51, 279–290. [Google Scholar] [CrossRef]
- McCarthy, J.M.; Deiyasigamani, A.; Watkins, S.; John, S.J.; Coman, F.; Petersen, P. On the visualisation of flow structures downstream of fluttering piezoelectric energy harvesters in a tandem configuration. Exp. Therm. Fluid Sci. 2014, 57, 407–419. [Google Scholar] [CrossRef]
- McCarthy, J.M.; Watkins, S.; Deivasigamani, A.; John, S.J.; Coman, F. An investigation of fluttering piezoelectric energy harvesters in off-axis and turbulent flows. J. Wind Eng. Ind. Aerodyn. 2015, 136, 101–113. [Google Scholar] [CrossRef]
- Akaydin, H.D.; Elvin, N.; Andreopoulos, Y. The performance of a self-excited fluidic energy harvester. Smart Mater. Struct. 2012, 21. [Google Scholar] [CrossRef]
- Dai, H.; Abdelkefi, A.; Ni, Q.; Wang, L. Modeling and identification of circular cylinder-based piezoaeroelastic energy harvesters. Energy Proc. 2014, 61, 2818–2821. [Google Scholar] [CrossRef]
- Huynh, B.; Tjahjowidodo, T.; Zhong, Z.; Wang, Y.; Srikanth, N. Nonlinearly enhanced vortex induced vibrations for energy harvesting. In Proceedings of the 2015 IEEE International Conference on Advanced Intelligent Mechatronics, Busan, Korea, 7–11 July 2015; pp. 91–96. [Google Scholar]
- Alhadidi, A.H.; Abderrahmane, H.; Daqaq, M.F. Exploiting stiffness nonlinearities to improve flow energy capture from the wake of a bluff body. Physica D 2016, 337, 30–42. [Google Scholar] [CrossRef]
- Song, R.; Shan, X.; Lv, F.; Li, J.; Xie, T. A novel piezoelectric energy harvester using the macro fiber composite cantilever with a bicylinder in water. Appl. Sci. 2015, 5, 1942–1954. [Google Scholar] [CrossRef]
- Allen, J.J.; Smits, A.J. Energy harvesting eel. J. Fluids Struct. 2001, 15, 629–640. [Google Scholar] [CrossRef]
- Huang, Y.H. Electromechanical coupling efficiency of transverse vibration in piezoelectric plates according to electrode configuration. J. Chin. Inst. Eng. 2013, 36, 842–855. [Google Scholar] [CrossRef]
- Huang, Y.H.; Ma, C.C. Experimental and numerical investigations of vibration characteristics for parallel-type and series-type triple-layered piezoceramic bimorphs. IEEE Trans. Ultrason. Ferroelectr. Freq. Control 2009, 56, 2598–2611. [Google Scholar] [CrossRef] [PubMed]
- Krushynska, A.; Meleshko, V.; Ma, C.C.; Huang, Y.H. Mode excitation efficiency for contour vibrations of piezoelectric resonators. IEEE Trans. Ultrason. Ferroelectr. Freq. Control 2011, 58, 2222–2238. [Google Scholar] [CrossRef] [PubMed]
- Ma, C.C.; Lin, Y.C.; Huang, Y.H.; Lin, H.Y. Experimental measurement and numerical analysis on resonant characteristics of cantilever plates for piezoceramic bimorphs. IEEE Trans. Ultrason. Ferroelectr. Freq. Control 2007, 54, 227–239. [Google Scholar] [CrossRef] [PubMed]
- Chong, W.T.; Yip, S.Y.; Fazlizan, A.; Poh, S.C.; Hew, W.P.; Tan, E.P.; Lim, T.S. Design of an exhaust air energy recovery wind turbine generator for energy conservation in commercial buildings. Renew. Energy 2014, 67, 252–256. [Google Scholar] [CrossRef]
- Chong, W.T.; Poh, S.C.; Fazlizan, A.; Yip, S.Y.; Chang, C.K.; Hew, W.P. Early development of an energy recovery wind turbine generator for exhaust air system. Appl. Energy 2013, 112, 568–575. [Google Scholar] [CrossRef]
- Chong, W.T.; Hew, W.P.; Yip, S.Y.; Fazlizan, A.; Poh, S.C.; Tan, C.J.; Ong, H.C. The experimental study on the wind turbine’s guide-vanes and diffuser of an exhaust air energy recovery system integrated with the cooling tower. Energy Convers. Manag. 2014, 87, 145–155. [Google Scholar] [CrossRef]
- Hensley, J.C. Cooling Tower Fundamental, 2nd ed.; SPX Cooling Technologies, Inc.: Overland Park, KS, USA, 2009. [Google Scholar]
- Gulvanessian, H. En1991 eurocode 1: Actions on structures. Proc. Inst. Civ. Eng. Civ. Eng. 2001, 144, 14–22. [Google Scholar]
- Kärnä, T. Damping methods to mitigate wind-induced vibrations. J. Struct. Mech. 2009, 42, 38–47. [Google Scholar]
- Flaga, A.; Lipecki, T. Code approaches to vortex shedding and own model. Eng. Struct. 2010, 32, 1530–1536. [Google Scholar] [CrossRef]
- Fail, R.; Lawford, J.A.; Eyre, R.C.W. ARC Techncial Report. Low-Speed-Experiments: On the Wake Characteristics of Flat Plates Normal to an Air Stream; H.M. Stationery Office: London, UK, 1959. [Google Scholar]
- Stokes, A.N.; Welsh, M.C. Flow-resonant sound interaction in a duct containing a plate. 2. Square leading-edge. J. Sound Vib. 1986, 104, 55–73. [Google Scholar] [CrossRef]
- Hehn, T.; Manoli, Y. CMOS Circuits for Piezoelectric Energy Harvesters: Efficient Power Extraction, Interface Modeling and Loss Analysis; Springer: Amsterdam, The Netherlands, 2014. [Google Scholar]
- Akaydin, H.D.; Elvin, N.; Andreopoulos, Y. Energy harvesting from highly unsteady fluid flows using piezoelectric materials. J. Intell. Mater. Syst. Struct. 2010, 21, 1263–1278. [Google Scholar] [CrossRef]
- Tabesh, A.; Fréchette, L.G. On the Concepts of Electrical Damping and Stiffness in Design of a Piezoelectric Bending Beam Energy Harvester. Available online: https://www.researchgate.net/publication/265865792_ON_THE_CONCEPTS_OF_ELECTRICAL_DAMPING_AND_STIFFNESS_IN_THE_DESIGN_OF_A_PIEZOELECTRIC_BENDING_BEAM_ENERGY_HARVESTER (accessed on 31 August 2017).
- Wallin, S.; Johansson, A.V. An explicit algebraic Reynolds stress model for incompressible and compressible turbulent flows. J. Fluids Mech. 2000, 403, 89–132. [Google Scholar] [CrossRef]
- Huang, Y.H.; Ma, C.C.; Li, Z.Z. Investigations on vibration characteristics of two-layered piezoceramic disks. Int. J. Solids Struct. 2014, 51, 227–251. [Google Scholar] [CrossRef]
- Huera-Huarte, F.J. On splitter plate coverage for suppression of vortex-induced vibrations of flexible cylinders. Appl. Ocean Res. 2014, 48, 244–249. [Google Scholar] [CrossRef]
- Kovasznay, L.S.G. In Hot-wire investigation of the wake behind cylinders at low reynolds numbers. Proc. R. Soc. Lond. Ser. A Math. Phys. Sci. 1949, 198, 174–190. [Google Scholar] [CrossRef]
- Zhang, M.; Wang, J. Experimental study on piezoelectric energy harvesting from vortex-induced vibrations and wake-induced vibrations. J. Sens. 2016. [Google Scholar] [CrossRef]
- Tsujiura, Y.; Suwa, E.; Nishi, T.; Kurokawa, F.; Hida, H.; Kanno, I. Airflow energy harvester of piezoelectric thin-film bimorph using self-excited vibration. Sens. Actuator A-Phys. 2017, 261, 295–301. [Google Scholar] [CrossRef]
- Koyvanich, K.; Smithmaitrie, P.; Muensit, N. Perspective microscale piezoelectric harvester for converting flow energy in water way. Adv. Mater. 2015, 6, 538–543. [Google Scholar] [CrossRef]


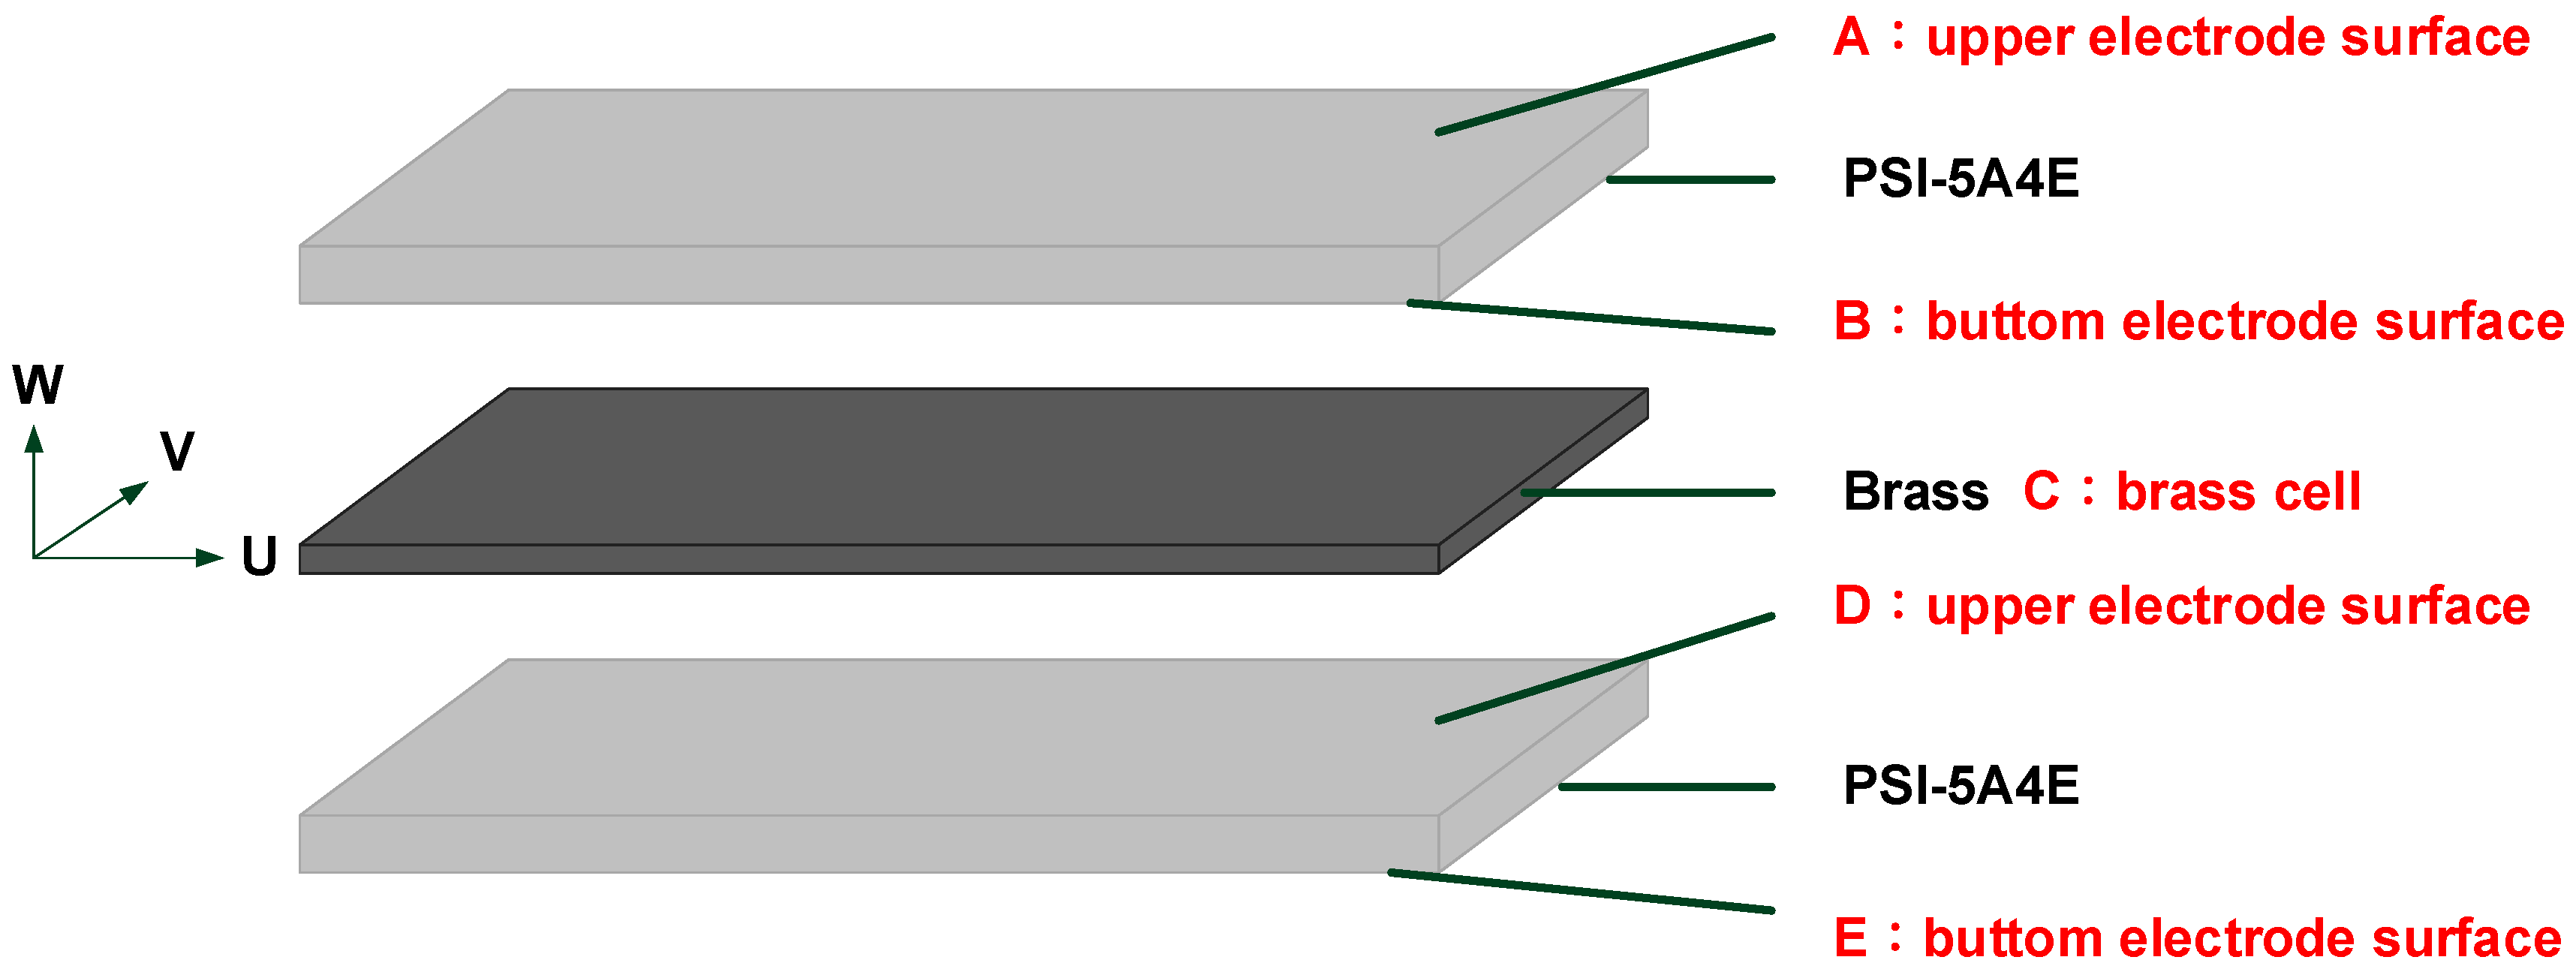
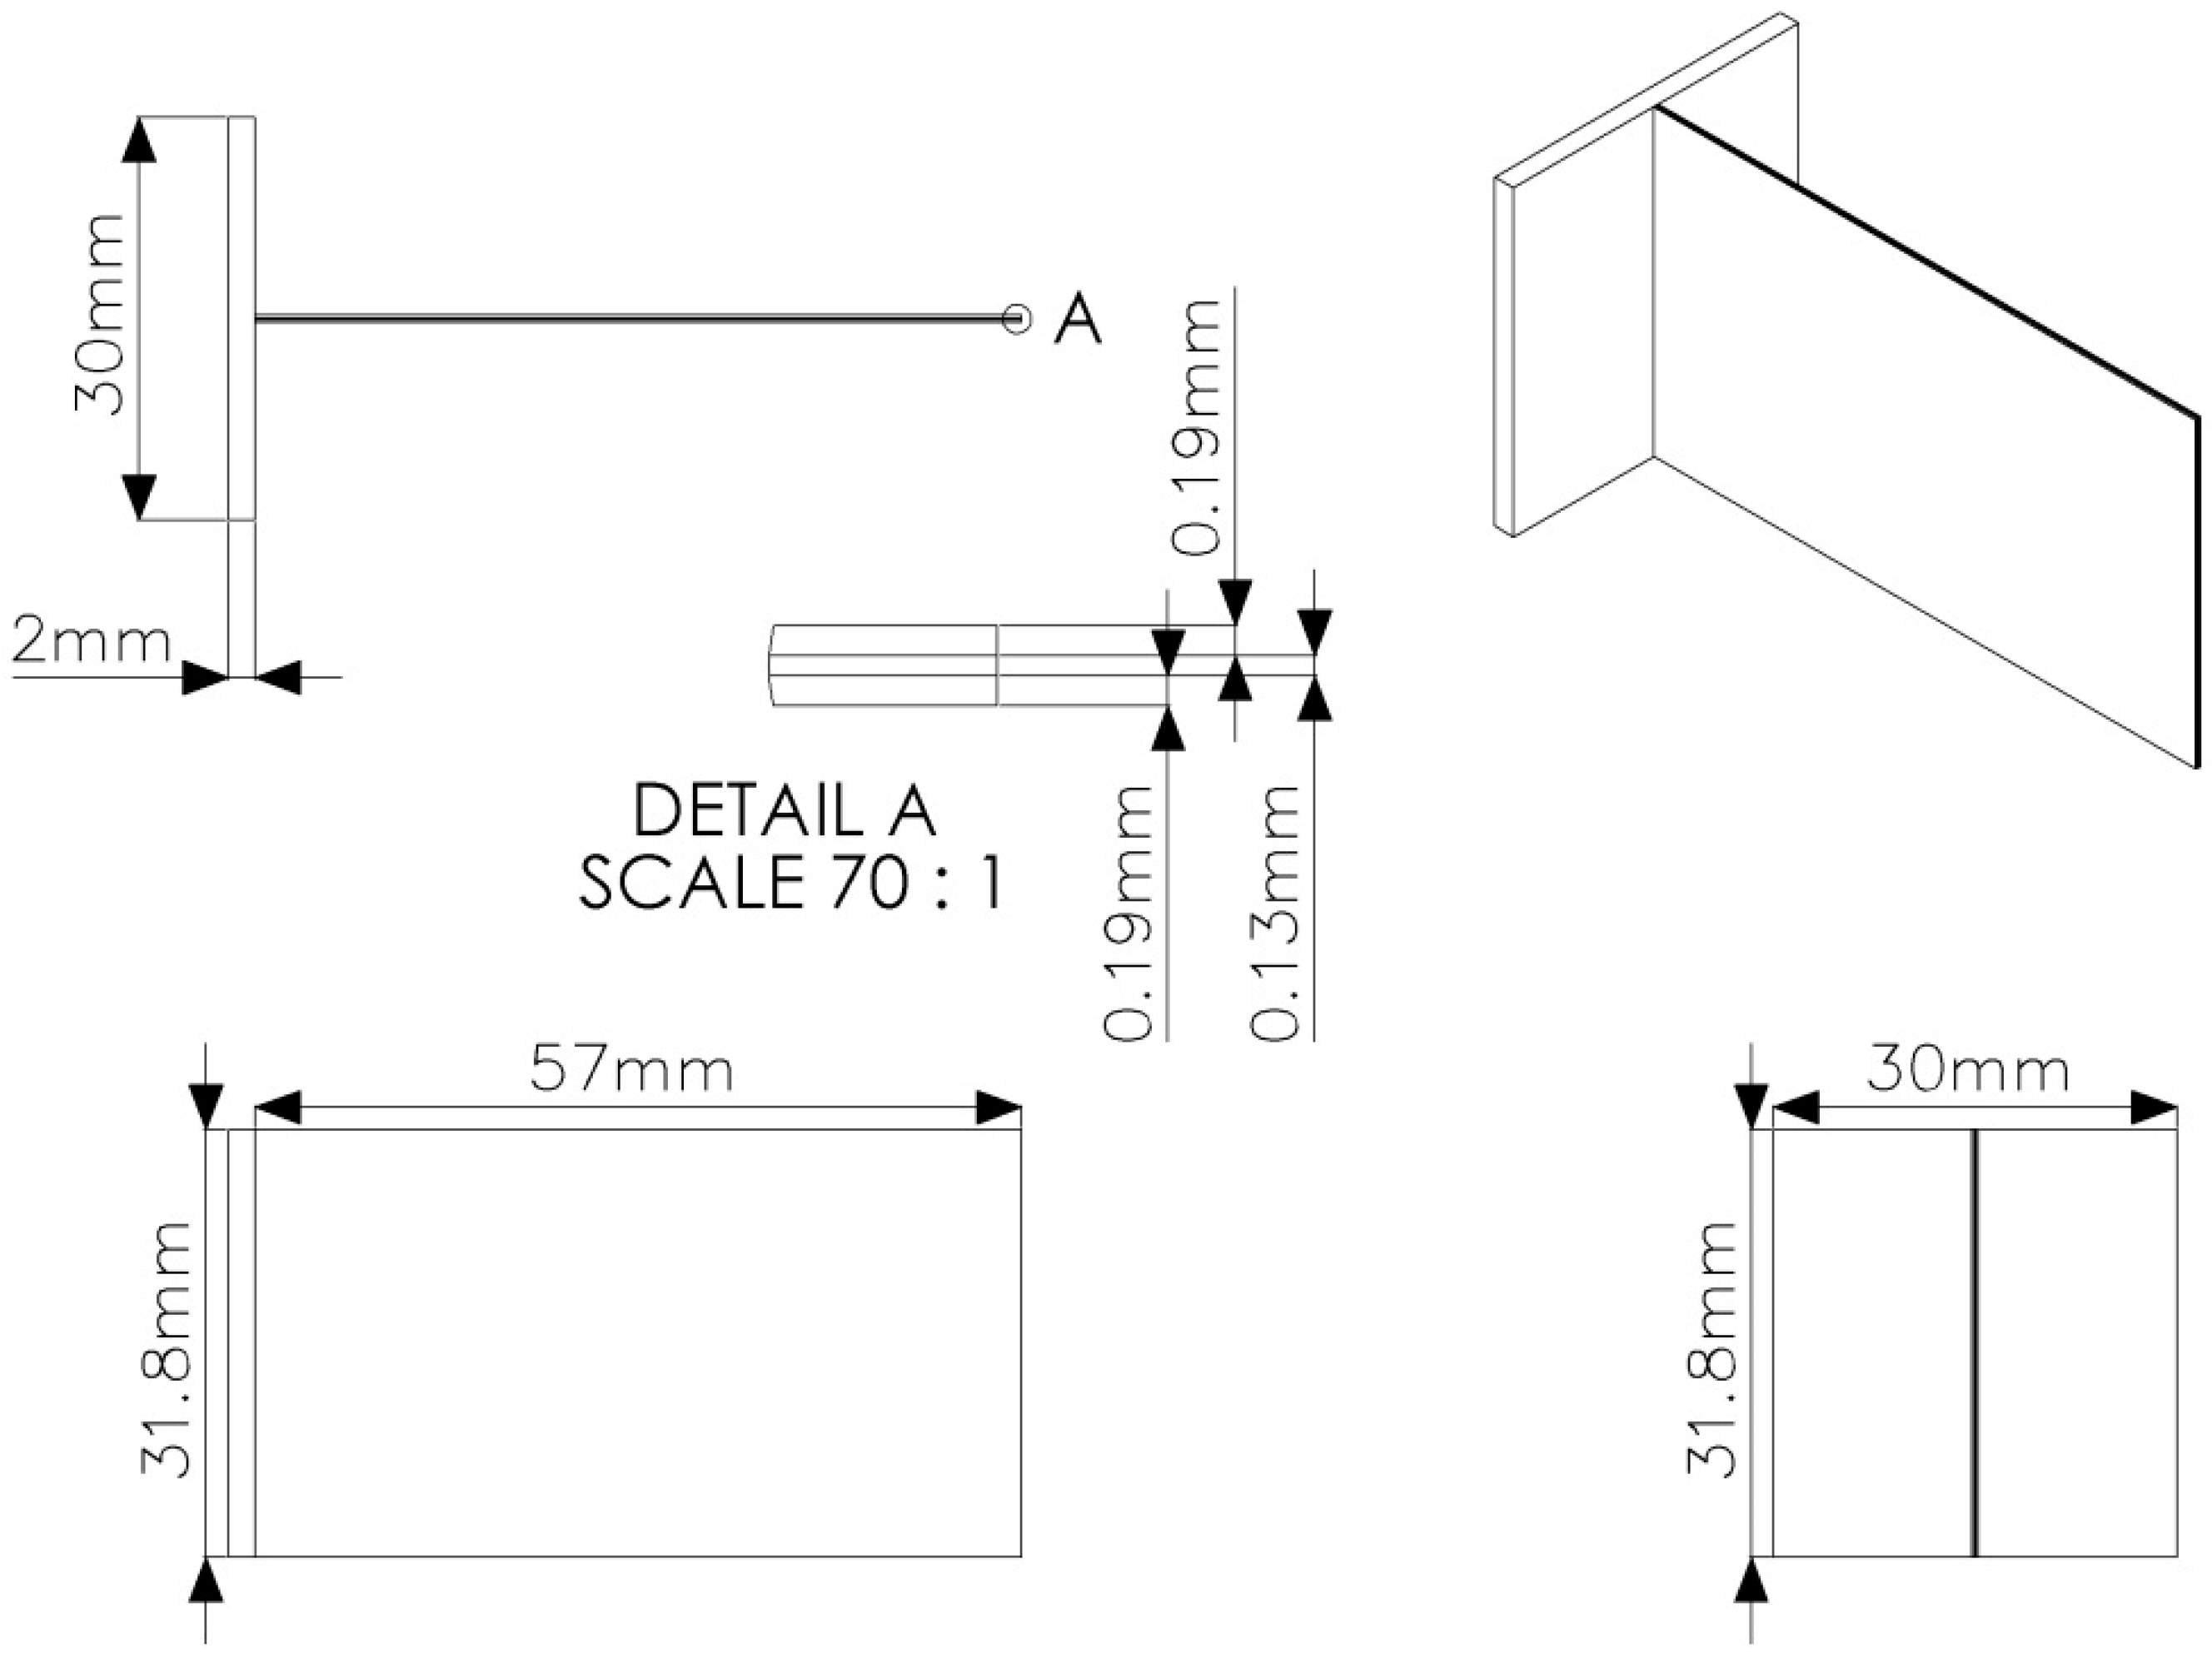
| Material Properties | Piezoelectric Plate (Brass) | Piezoelectric Plate (PZT) | Aluminum Bluff Splitter Body |
|---|---|---|---|
| Model Dimensions | 31.8 × 57 × 0.13 mm thick | 31.8 × 57 × 0.19 mm thick | 31.8 × 30 × 2 mm thick |
| Density | 8830 kg/m3 | 7800 kg/m3 | 2770 kg/m3 |
| Young’s Modulus | 1.03 × 10¹¹ Pa | x-direction—6.6 × 10¹⁰ Pa y-direction—6.6 × 10¹⁰ Pa z-direction—5.2 × 10¹⁰ Pa | 7.1 × 10¹⁰ Pa |
| Poisson’s Ratio | 0.34 | x-direction—0.31 y-direction—0.242 z-direction—0.242 | 0.33 |
| Piezoelectric Constants | - | d15 = 550 pm/V d31 = −190 pm/V d33 = 390 pm/V | - |
| Dielectric Constants | - | εS11 = 11.12 nF/m εS33 = 14.02 nF/m | - |
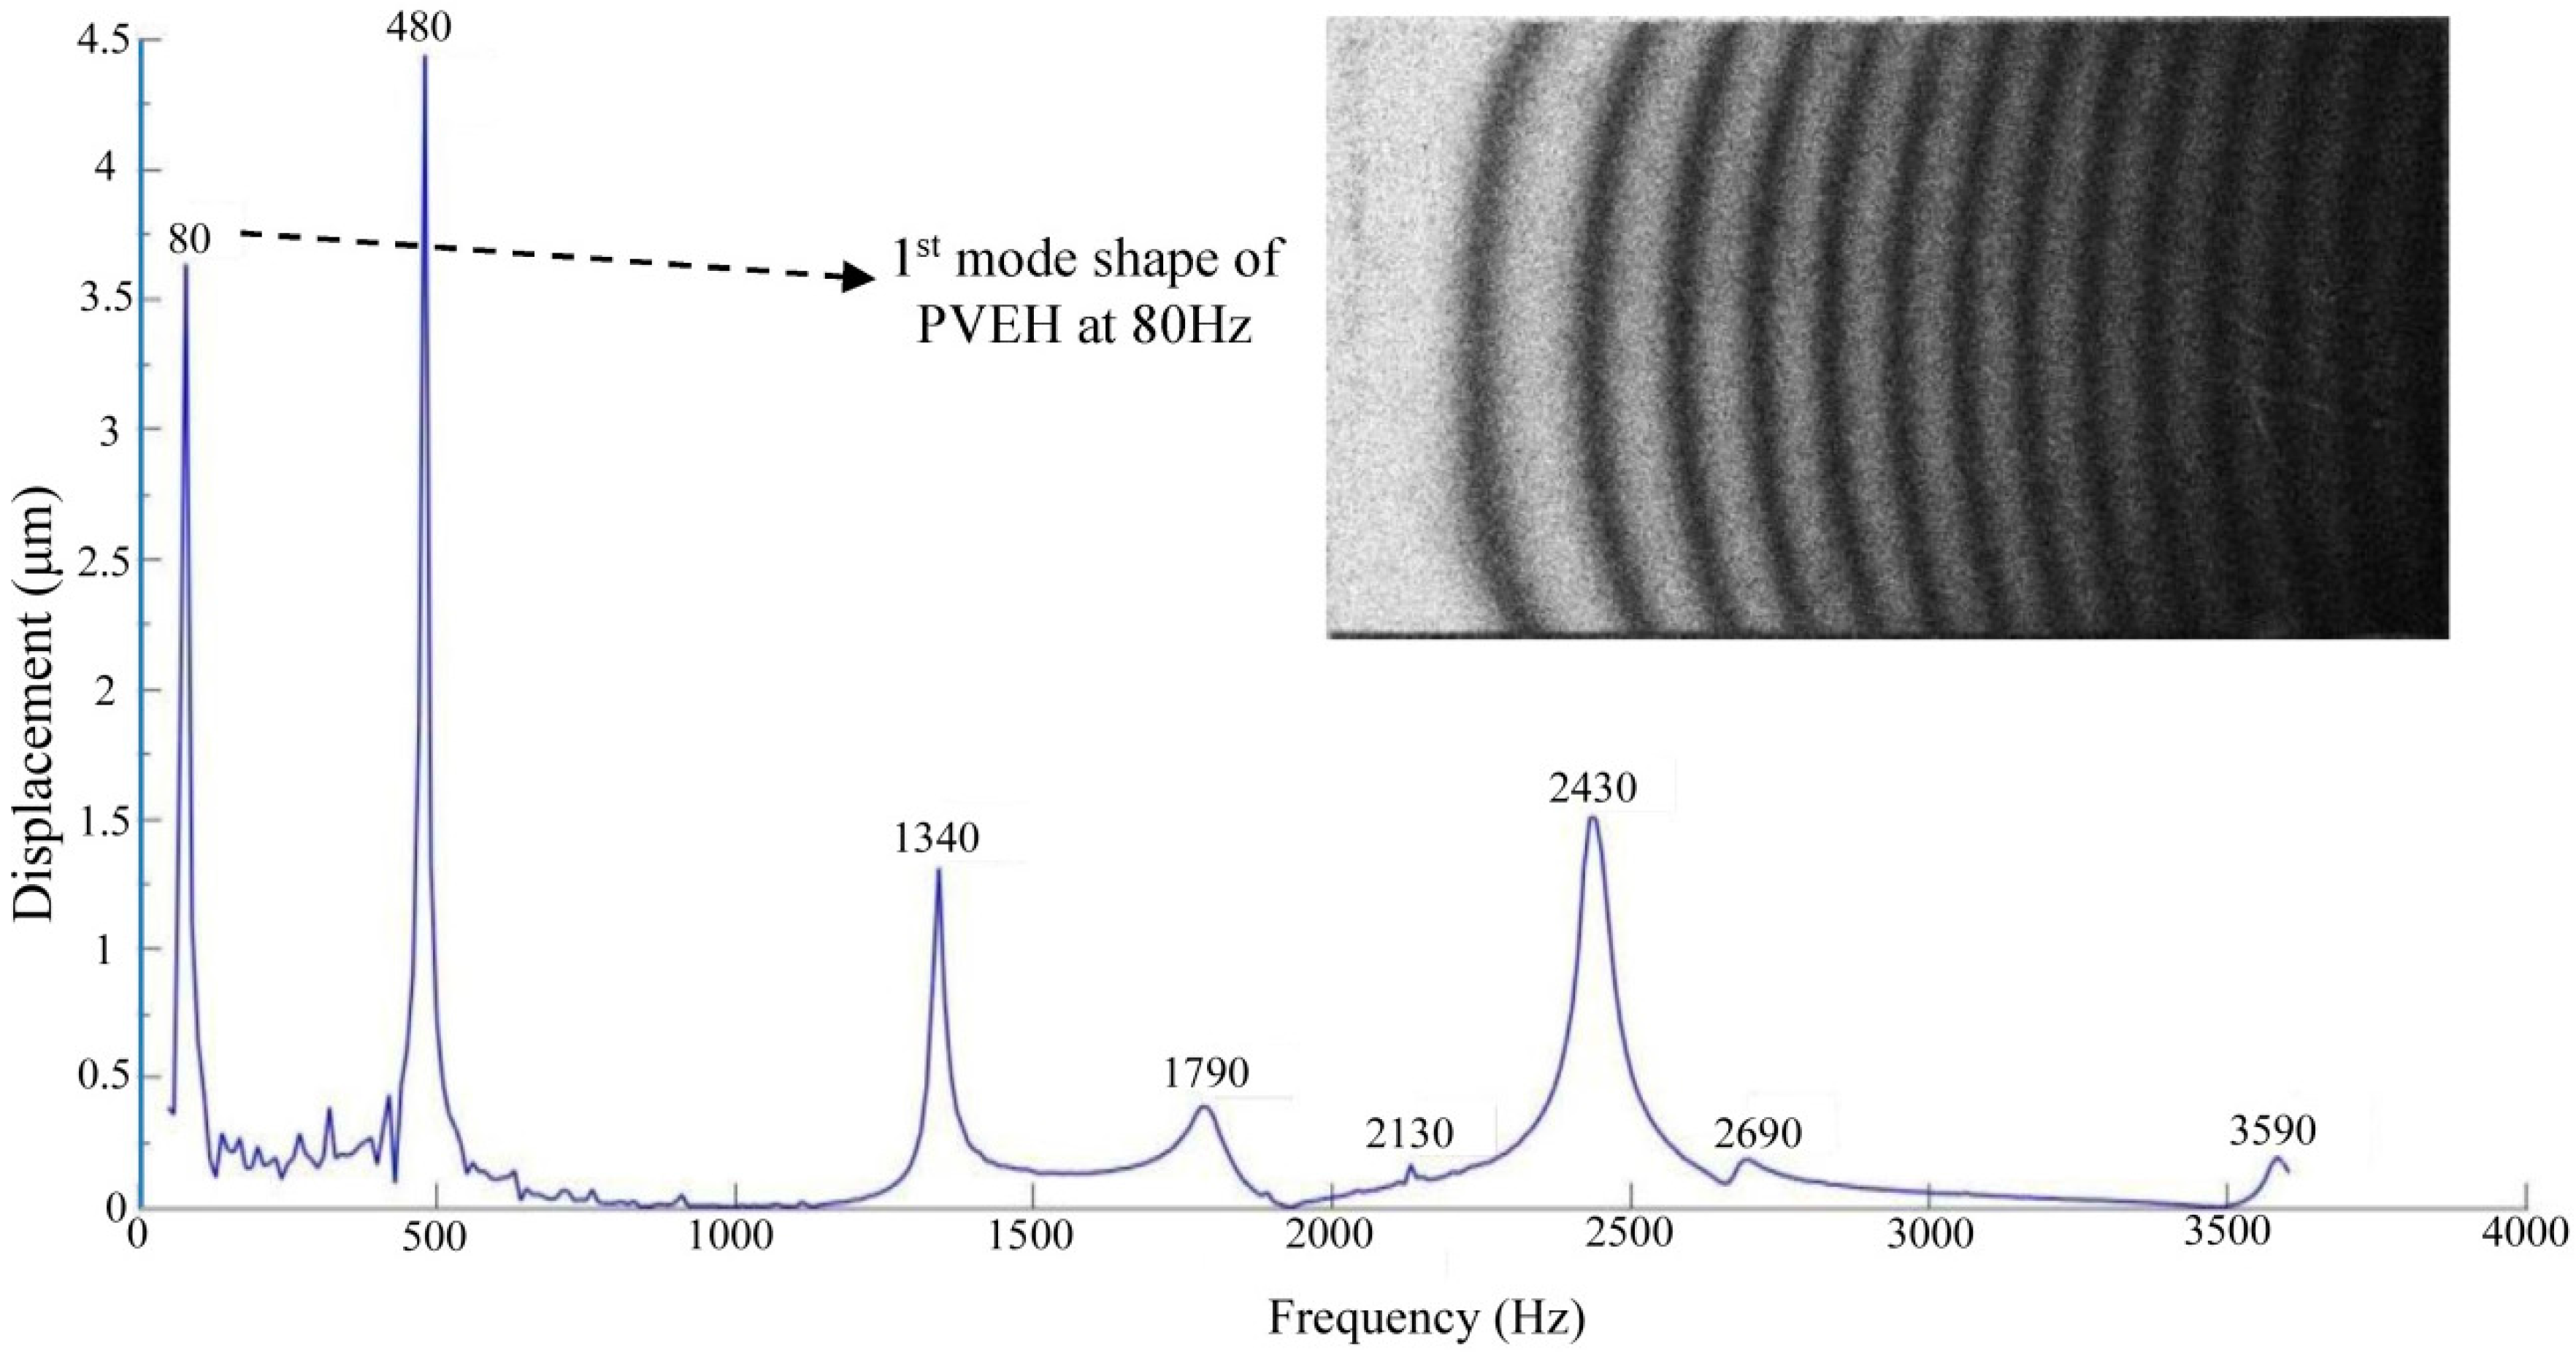
| FEM Harmonic Response (Hz) | ESPI (Hz) | Difference (%) |
|---|---|---|
| 76.9 | 80 | −3.75 |
| 480.2 | 480 | 0.042 |
| 1344.5 | 1340 | 0.33 |
| 1707.4 | 1790 | −4.614 |
| 2384.2 | 2430 | −1.884 |
| 3532.5 | 3590 | −1.602 |
| Wind Speed (m/s) | Reynolds Number | Strouhal Number |
|---|---|---|
| 7.00 | 8.76 × 10⁴ | 0.08580 |
| 10.00 | 1.29 × 10⁴ | 0.090909 |
| 12.00 | 1.55 × 10⁴ | 0.104895 |
| 14.00 | 1.81 × 10⁴ | 0.108225 |
| 16.00 | 2.07 × 10⁴ | 0.113636 |
| 18.00 | 2.33 × 10⁵ | 0.117845 |
| 19.00 | 2.46 × 10⁵ | 0.119618 |
| 20.00 | 2.61 × 10⁵ | 0.120071 |
| 22.50 | 2.87 × 10⁵ | 0.111376 |
| 25.00 | 3.24 × 10⁵ | 0.118297 |
| Wind Speed (m/s) | Resultant Frequency (Hz) | Natural Frequency (Hz) | Difference (%) |
|---|---|---|---|
| 7.00 | 20.020 | 76.9 | −73.73% |
| 10.00 | 30.303 | −60.59% | |
| 12.00 | 41.958 | −45.44% | |
| 14.00 | 50.505 | −34.32% | |
| 16.00 | 60.606 | −21.19% | |
| 18.00 | 70.707 | −8.05% | |
| 19.00 | 75.758 | −1.48% | |
| 20.00 | 80.808 | +4.04% | |
| 22.50 | 82.418 | +7.18% | |
| 25.00 | 100.00 | +30.05% |
| Author | Wind Speed (m/s) | Frequency (Hz) | Power (µW) | Normalized Power (µW/g2) |
|---|---|---|---|---|
| Zhang et al. [55] | 1.05 | 26.37 | 0.0007 | 2.20 × 10⁻⁶ |
| Tsujiura et al. [56] | 8.00 | 67.00 | 36.4 | 3.09 × 10⁻⁴ |
| Koyvanich et al. [57] | 6.80 | 0.40 | 0.18 | 5.93 × 10⁻² |
| Akaydin et al. [29] | 1.19 | 3.14 | 100 | 1.74 × 10 |
| Current work | 19 | 75.758 | 1.56 × 10⁴ | 1.344 × 10⁴ |
© 2017 by the authors. Licensee MDPI, Basel, Switzerland. This article is an open access article distributed under the terms and conditions of the Creative Commons Attribution (CC BY) license (http://creativecommons.org/licenses/by/4.0/).
Share and Cite
Chin, W.K.; Ong, Z.C.; Kong, K.K.; Khoo, S.Y.; Huang, Y.-H.; Chong, W.T. Enhancement of Energy Harvesting Performance by a Coupled Bluff Splitter Body and PVEH Plate through Vortex Induced Vibration near Resonance. Appl. Sci. 2017, 7, 921. https://doi.org/10.3390/app7090921
Chin WK, Ong ZC, Kong KK, Khoo SY, Huang Y-H, Chong WT. Enhancement of Energy Harvesting Performance by a Coupled Bluff Splitter Body and PVEH Plate through Vortex Induced Vibration near Resonance. Applied Sciences. 2017; 7(9):921. https://doi.org/10.3390/app7090921
Chicago/Turabian StyleChin, Wei Ken, Zhi Chao Ong, Keen Kuan Kong, Shin Yee Khoo, Yu-Hsi Huang, and Wen Tong Chong. 2017. "Enhancement of Energy Harvesting Performance by a Coupled Bluff Splitter Body and PVEH Plate through Vortex Induced Vibration near Resonance" Applied Sciences 7, no. 9: 921. https://doi.org/10.3390/app7090921