An Event Reporting and Early-Warning Safety System Based on the Internet of Things for Underground Coal Mines: A Case Study


Department of Civil and Environmental Engineering, Hanyang University, 222 Wangsimni-ro, Seongdong-gu, Seoul 04763, Korea
*
Author to whom correspondence should be addressed.
Appl. Sci. 2017, 7(9), 925; https://doi.org/10.3390/app7090925
Submission received: 3 August 2017
/
Revised: 1 September 2017
/
Accepted: 5 September 2017
/
Published: 8 September 2017
Abstract
:Fatal accidents associated with underground coal mines require the implementation of high-level gas monitoring and miner’s localization approaches to promote underground safety and health. This study introduces a real-time monitoring, event-reporting and early-warning platform, based on cluster analysis for outlier detection, spatiotemporal statistical analysis, and an RSS range-based weighted centroid localization algorithm for improving safety management and preventing accidents in underground coal mines. The proposed platform seamlessly integrates monitoring, analyzing, and localization approaches using the Internet of Things (IoT), cloud computing, a real-time operational database, application gateways, and application program interfaces. The prototype has been validated and verified at the operating underground Hassan Kishore coal mine. Sensors for air quality parameters including temperature, humidity, CH4, CO2, and CO demonstrated an excellent performance, with regression constants always greater than 0.97 for each parameter when compared to their commercial equivalent. This framework enables real-time monitoring, identification of abnormal events (>90%), and verification of a miner’s localization (with <1.8 m of error) in the harsh environment of underground mines. The main contribution of this study is the development of an open source, customizable, and cost-effective platform for effectively promoting underground coal mine safety. This system is helpful for solving the problems of accessibility, serviceability, interoperability, and flexibility associated with safety in coal mines.
1. Introduction
Underground coal mine operation has always proved to be a very dangerous and hazardous environment [1] due to the presence of coal dust, methane, and other toxic gases [2,3]. It has been reported that approximately 33.8% of deaths that happen in the mining sector are a consequence of coal dust or methane gas explosions. During the years 1990 to 2007, 1601 cases of mine fires were reported in the United States (U.S.) alone [4]. Recently, a report by the Inspectorate of Mines, Punjab, Pakistan, showed that a high number (38%) of underground mine accidents were due to gas accumulation in the coal mines of salt-range region [5]. Although the combustible range of methane gas is 5–15%, exposure to even low concentrations of methane can critically damage the human body [6]. In addition to methane gas, other toxic gases exist in underground coal mines, including carbon monoxide (CO), carbon dioxide (CO2), and hydrogen sulfide (H2S). Short-term exposure to these gases may not have any damaging effects, but long-term exposure always results in severe damage to the body [7]. Therefore, the accurate monitoring of the underground mine environment is of prime importance for the safety of miners and mine property.
Over the last decade, the development of control system gateways for the Internet of Things (IoT) in various fields is redefining how the internet extends to everyday life with uniquely identifiable objects in the wireless sensor networks (WSNs) [8]. IoT can be suitably applied to environmental monitoring [9]. Recently, the authors in [10] implemented IoT integrated with cloud computing for real time monitoring of a mine tailing dam. Similarly, IoT-based cloud computing has been used for the spatiotemporal analysis of data, event detection, and real-time information sharing; these are promising steps towards establishing a new era of mine safety. Such systems have rarely been reported for underground mines, and their implementation will be helpful for enhancing the environmental and personnel safety. The objective of this study is to investigate the isolated safety aspects of underground mines, to study their inter-dependencies, to and seamlessly integrate IoT-based separately identifiable systems to build a comprehensive monitoring and safety system specifically for underground mines. In this study, we are interested in the cost-effective integration of technologies, such as standard monitoring, intelligent event detection and identification, miner localization, and real-time information sharing for IoT system development. We have overall goals of better understanding the harsh and real underground application domain and enhancing overall mine safety. The implementation of such a system will bring a revolutionary change in the safety of underground mines in Pakistan. The following are key contributions of this study:
- (1)
- We propose the use of an Arduino-based, scalable, cost effective, reliable, and distributed network for underground environmental monitoring.
- (2)
- We propose the seamless integration of key technologies of information systems based on IoT and cloud services for underground mine informatics, in which a cloud server communicates with mobile devices.
- (3)
- We originally proposed a single “Mine Warning Index (MWI)” for an easy and quick assessment of mine safety.
- (4)
- We proposed an outlier detection algorithm for event detection and identification in an underground coal mine.
- (5)
- When compared to the conventional receive signal strength (RSS) method, the proposed RSS range-based weighted centroid localization algorithm improved tracking accuracy by 30%.
The remainder of the article is organized as follows. Section 2 explains the related work, Section 3 provides a detailed design of the IoT-based integrated event detection and early-warning safety system for underground coal mines. Section 4 deals with the methodology and system design for safety in underground mines. Section 5 presents the study models for MWI, outlier detection, miner’s localization, and event reporting frameworks. The implementation of this proposed system is discussed in Section 6. Section 7 focuses on the system performance and an evaluation, followed by discussion and conclusions.
2. Related Work
Initially, the concept of digital underground mines was introduced with a very narrow vision of limited communication and the involvement of an operator. Now, this concept can be divided into separable categories of wireless communication and expert systems for safety and rescue in underground mines, personal position monitoring, and database systems. A wide range of literature on the present wireless communication and environmental monitoring in underground coal mines is summarized in [11]. WSNs use in underground mines is a new area of research [12]. Recently, a highly robust smart system was implemented at Shangwan Coal Mine, Erdos, China [13]. They upgraded a previously developed cable environmental monitoring system to a WSN. This system includes environmental monitoring and is capable of periodic inspection and interruption. An algorithm for early fire detection that includes alarms was introduced as a WSN in a bord-and-pillar mine [14,15]. The most promising feature of this system is the early fire detection and the ability to locate a fire in the underground mine. Many existing studies [16,17] have implemented WSNs with focus on low power and low operational costs in real underground conditions to enhance safety and productivity. From the perspective of wireless routing, a minimum delay maximum lifetime (MDML) [18] is an energy efficient, cost-effective, and reliable routing algorithm which has been specifically designed for the emergency and non-emergency transmission in underground coal mines. Jin-ling et al. [19] proposed a virtual multiple-input multiple-output (V-MIMO), combined with a orthogonal frequency division multiplexing to solve challenges of diffraction, attenuation, and scattering in WSNs of underground mines. The simulation results showed an enhanced wireless transmission reliability and reduced bit error rate as compared to simple single-input and single-output (SISO) in underground mines. Li and Liu [20] developed a Structure-Aware Self-Adaptive (SASA) WSN based on stationary mesh nodes to locate miners. This system utilizes a normal beacon strategy for the detection of falling roofs, along with a limited monitoring of environmental parameters in underground coal-mines. WSNs with various indoor localization algorithms such as RSS, time-of-arrival (ToA), time difference of arrival (TDoA) [21], and angle of arrival (AoA) [22] have been widely implemented. Recently, RSS-based indoor localization has been widely adopted because of its simple calculations and the fact that it effectively estimates the mobile node (MN) position without requiring any additional hardware [23]. Akeila et al. [24] proposed an RSSI approach for indoor localization using Bluetooth nodes with a reduced accuracy error. Qandour et al. [25] presented a sensing platform based on the Wasmote and Meshlium gateway. This platform enabled the enhanced wireless (ZigBee/802.15.4) communication between the sensing platform and routing nodes (RNs) with the implementation of the data-forwarding approach. In addition to all of this, Bychkov et al. [26] implemented cloud services for mine informatics and information management. In brief, miner’s localization, tracking, gas monitoring, and event identification based on online cloud services can be effectively integrated into a single platform to further enhance underground coal mine safety.
However, previous works related to mine safety are limited to basic monitoring and some event reporting. They lack the extensive and comprehensive system level integration of a wide range of safety aspects that includes information related to personnel and the underground mine itself. They are not sufficient enough to ensure comprehensive safety of the dynamic underground environment of the mine. Therefore, the solution must involve the seamless integration at local and global levels, and it must be scalable for large underground mines. Furthermore, the system must be cost-effective and should be efficient enough to identify abnormal events. Moreover, the solution must include a main server to monitor the global state of the mine if an event occurs in a specific part of the mine.
The present study introduces an integrated IoT-platform based on Arduino sensor modules distributed as an elementary unit to monitor the air quality parameters in underground mines. This system utilizes a Bluetooth low energy (BLE) protocol for the transmission of mine air quality data and determining the locations of miners. The system algorithm supports real-time event identification and it recalls the spatiotemporal characteristics of previous events to enable intelligent event detection and decision-making. The main server of this system applies K-means clustering for event identification as well as spatiotemporal statistical models for determining the service state of the mine. To locate miners inside of the mine, this system applies an RSS weighted centroid algorithm with BLE. This system also provides information sharing of mine informatics using a web 2.0 page at diverse locations via node remembrance in wireless communication. Such Arduino-based intelligent and efficient systems for continuous monitoring and event reporting have rarely been reported in the context of underground coal mines. More specifically, the development of smart automatic systems is still far away from the desired objectives in the coal mines of Pakistan. In brief, this study provides a simple, low computation, and high performance open source platform for ensuring the safety of underground coal mines. The key differences between our system and previous WSNs studies are summarized in Table 1.
3. System Overview
Dynamicity, well-distributed networking, and the simultaneous interaction of multiple devices for the collection, analysis, and sharing of information are well-known features of IoT [29]. These characteristics make IoT different from and more highly regarded than previous smart systems, and they also enable the development of IoT-based early-warning systems. To effectively prevent mine accidents and to enhance safety, the system must (i) provide useful monitoring data, (ii) track miners working inside the mine, and (iii) share information in real time. Mine safety systems based on IoT seamlessly integrate gas sensing monitoring, miner tracking, and cloud computing to create an intelligent loop of safety through analytics. In this study, IoT utilizes BLE for transmitting data from Arduino modular sensors. The cloud is helpful for determining the service state of the mine and for sharing information. Thus, seamless integration can result in a reduction in mine accidents. In short, a lack of closely-coupled information sharing between “things”, miners, and mine management make it difficult to generate a quick response to emergencies occurring in underground mines. Therefore, integration based on the IoT concept is necessary for effective data collection, data analysis, automatically detecting abnormal events, and information sharing. Figure 1 shows the integration of different technologies used in early warning integrated system using IoT for underground coal mines.
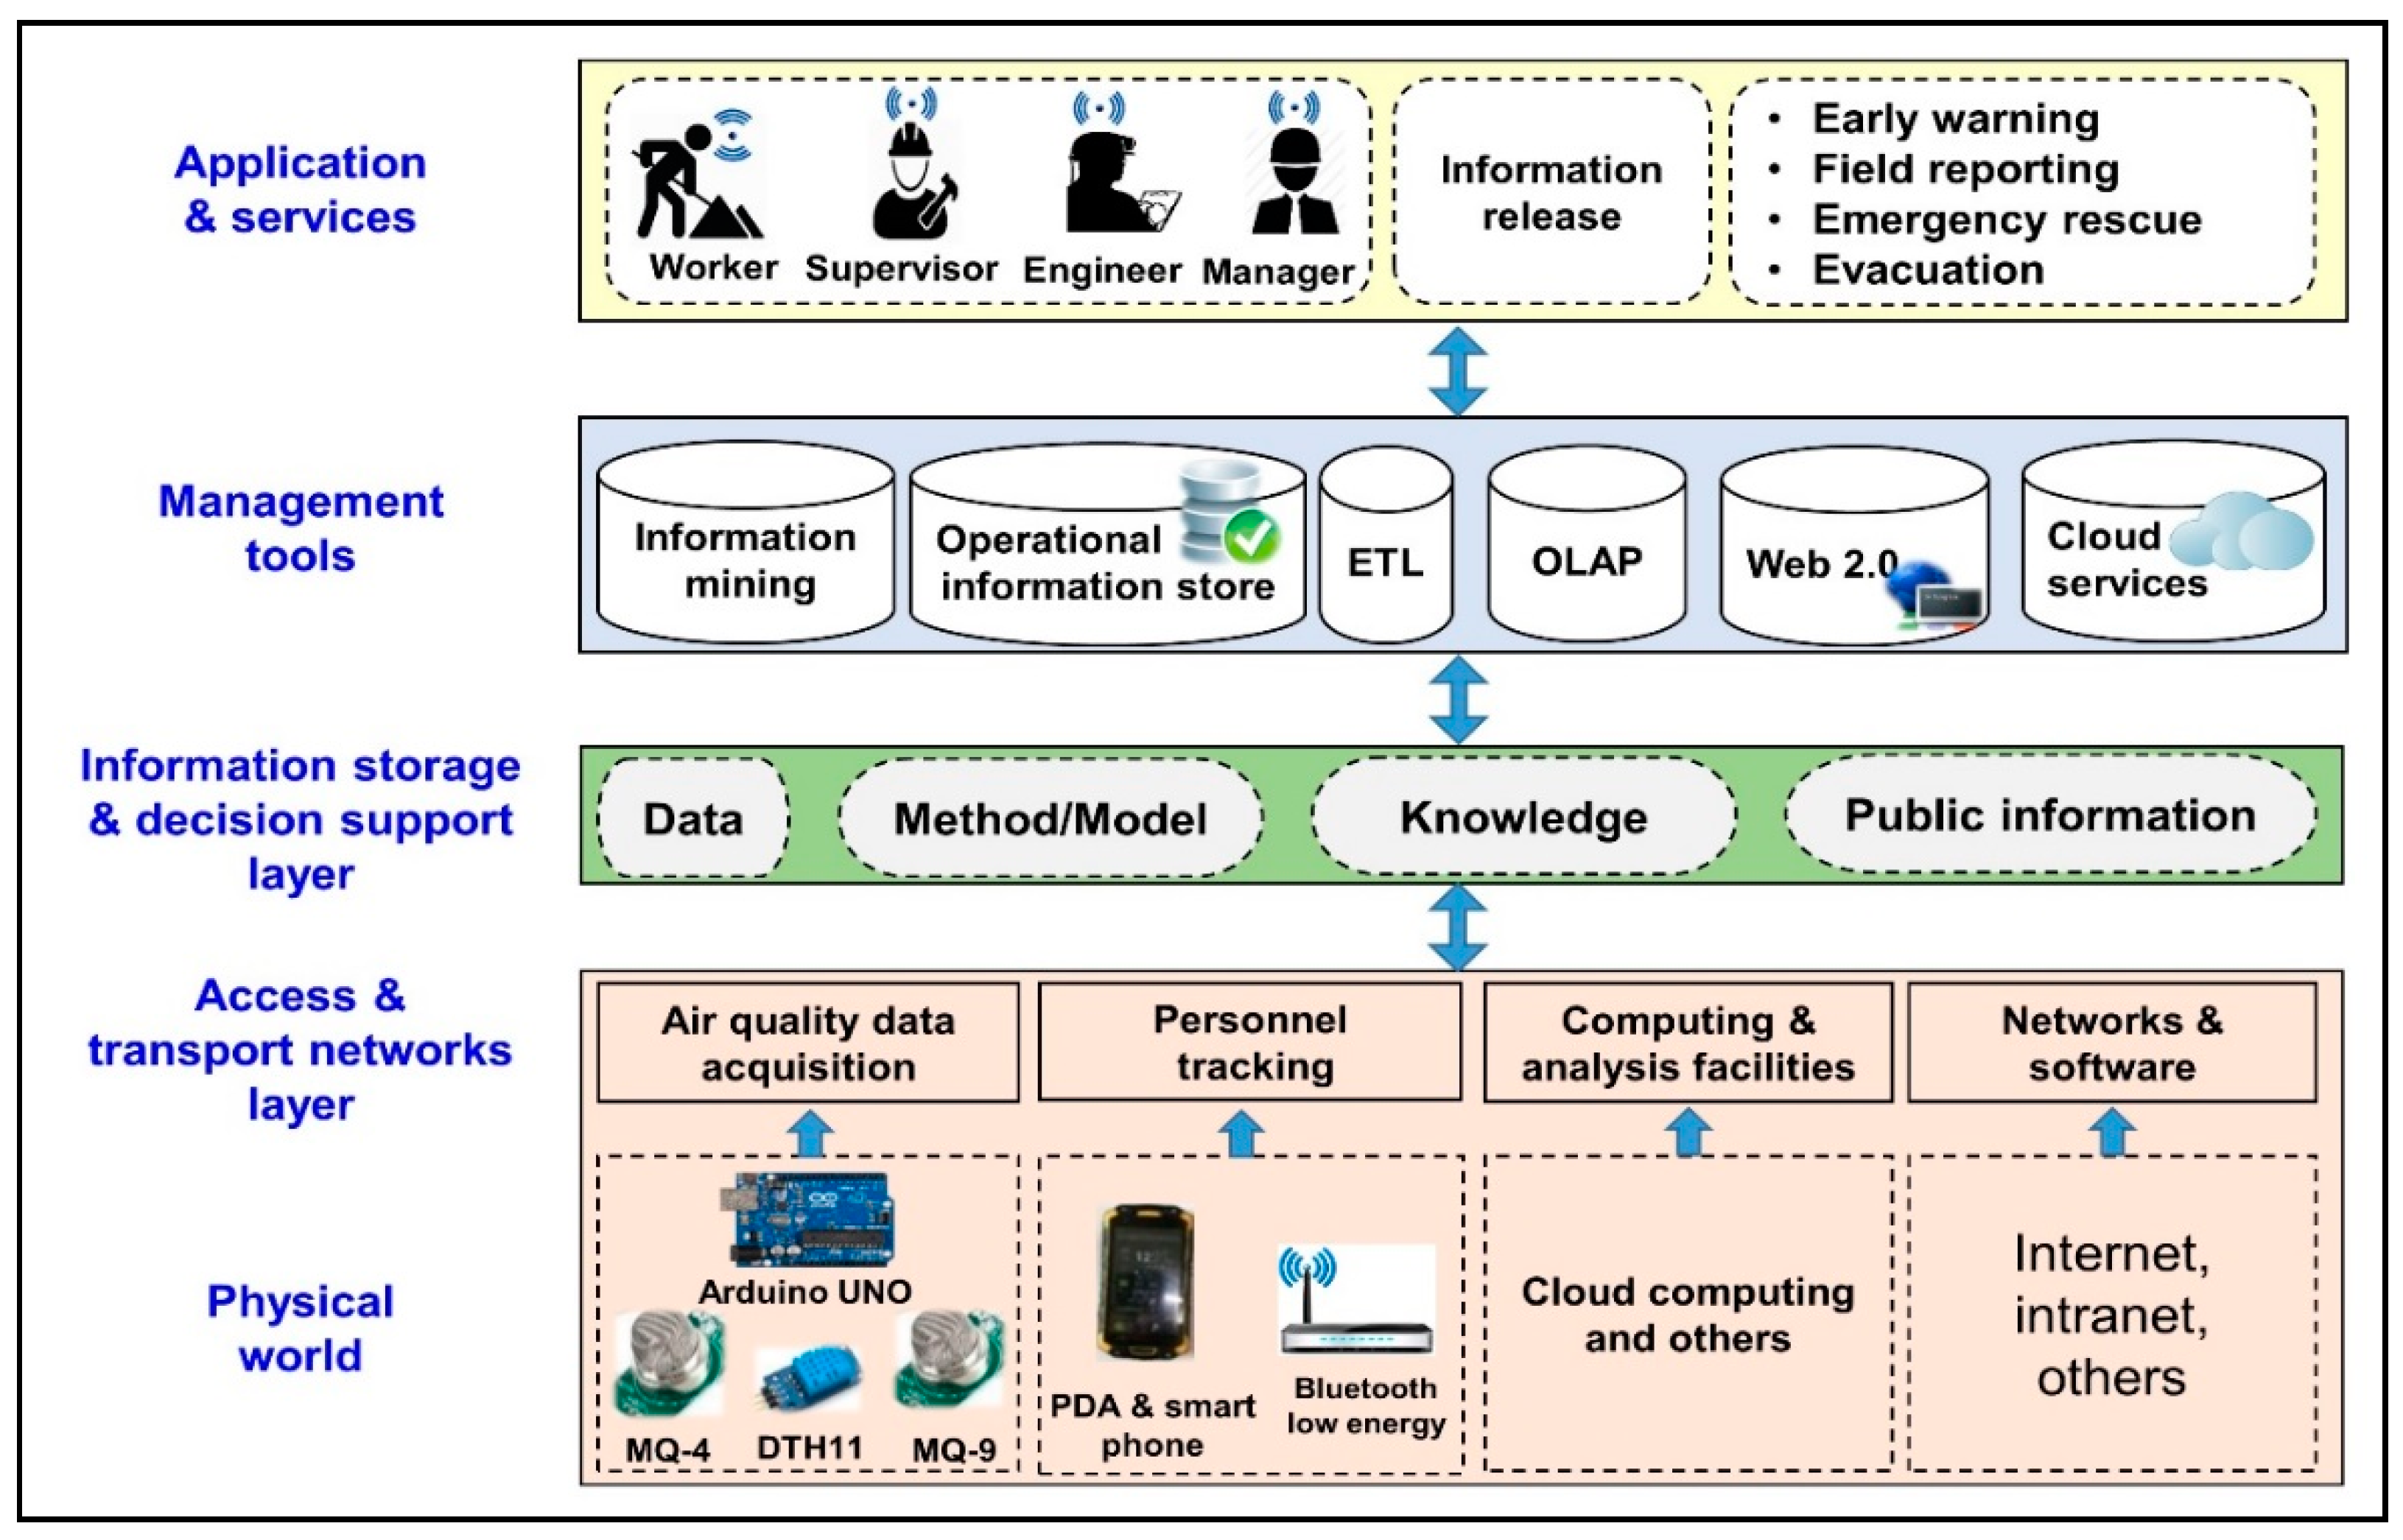
The mainframe of IoT has four characteristic layers: a perception layer, a network layer, a middleware layer, and an application layer. Each layer has its own functions in the main framework of IoT. The layered structure of IoT-based event detection and early-warning systems for underground coal mines is illustrated in Figure 2, which clearly indicates the function of each layer.
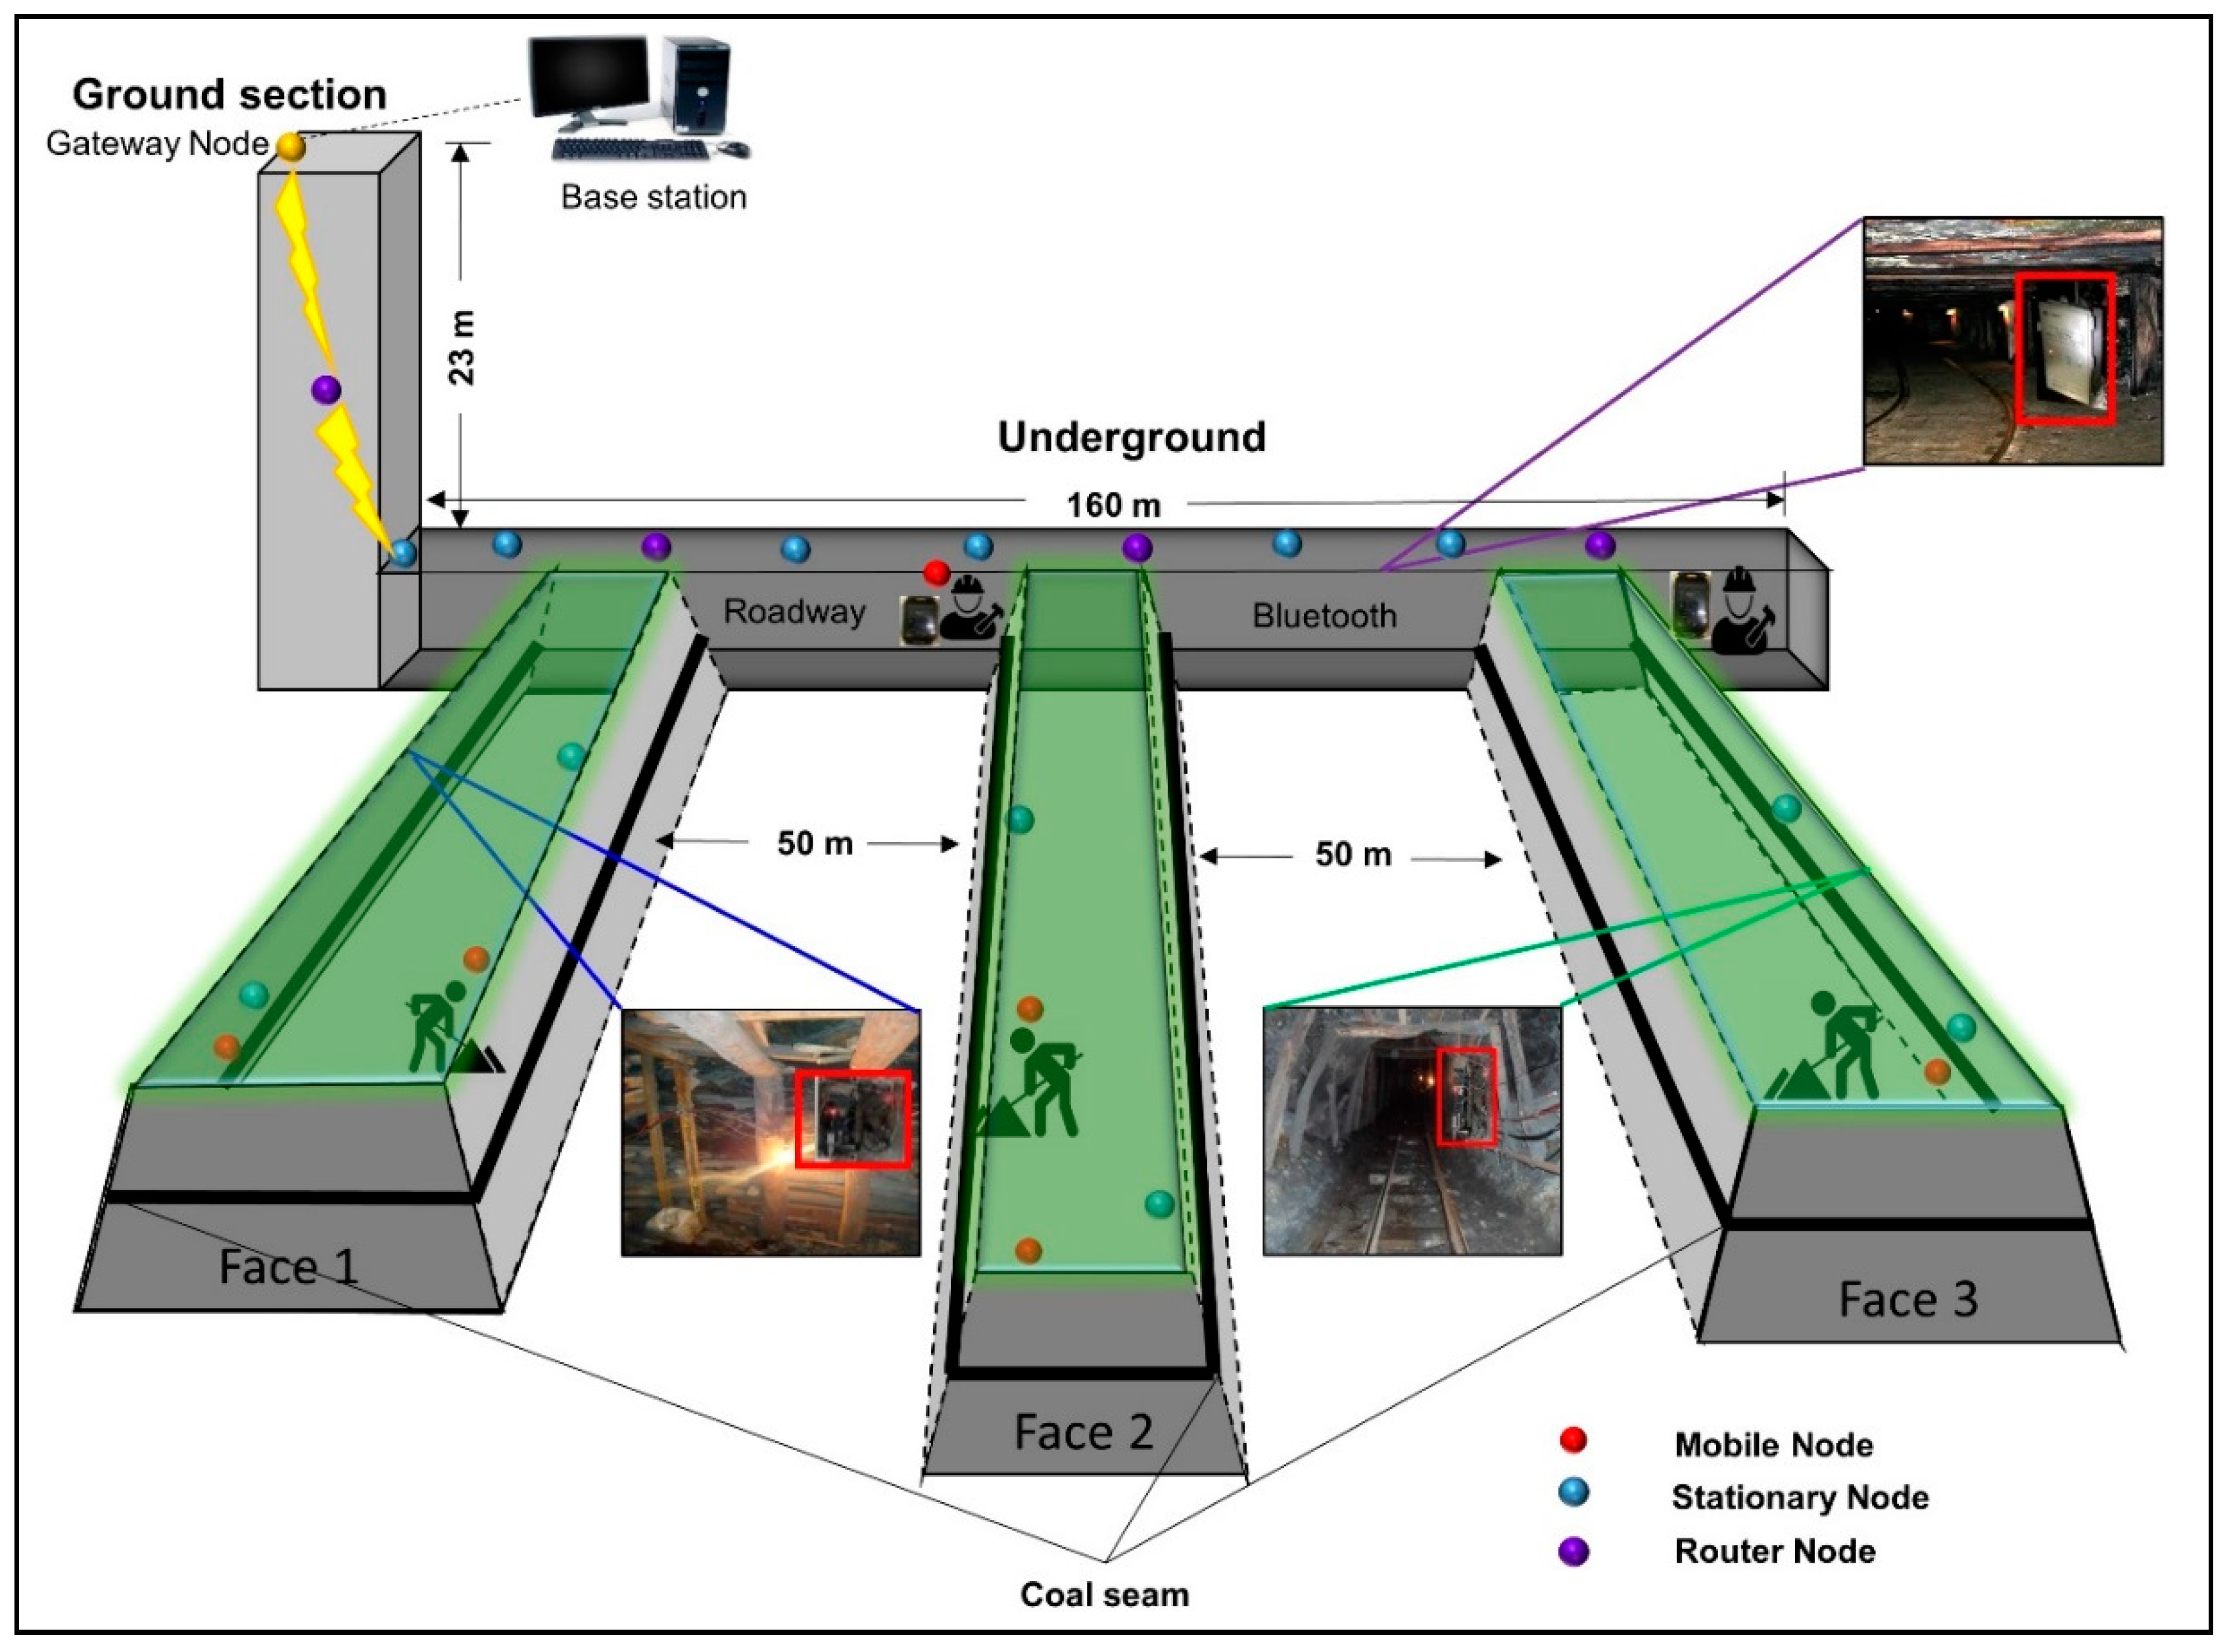
The architecture of IoT-based event detection and early-warning systems for underground coal mines is shown in Figure 3. The Arduino-based sensor network utilizes the Bluetooth communication protocol to cover the entire mine. In this network, the nodes are divided depending upon their function. Stationary nodes (SN) are the basic nodes for monitoring mine air parameters, and router nodes (RNs) are the parental nodes with a subordinate cluster consisting of a few SNs. Finally, both SNs and RNs transmit data to the base station (BS) through a gateway using a Bluetooth communication protocol. The base station is directly connected to the global internet and cloud computing to provide data analytics of the sensory data.
4. System Design
4.1. Physical Layer: Data Collection
There are three main functions of the present system: (i) gas monitoring and outlier detection for event identification; (ii) miner tracking and (iii) cloud computing. Acquiring data for air quality and miner tracking from an underground mine requires hardware such as SNs, RNs, gateways and MNs, which are carried by miners. Each hardware runs its own specific algorithm and communicates. Hardware design and power requirements vary greatly for each category. A detailed description of each type of hardware is given in the following subsections.
4.1.1. Stationary Node Design (Environment Parameter Monitoring)
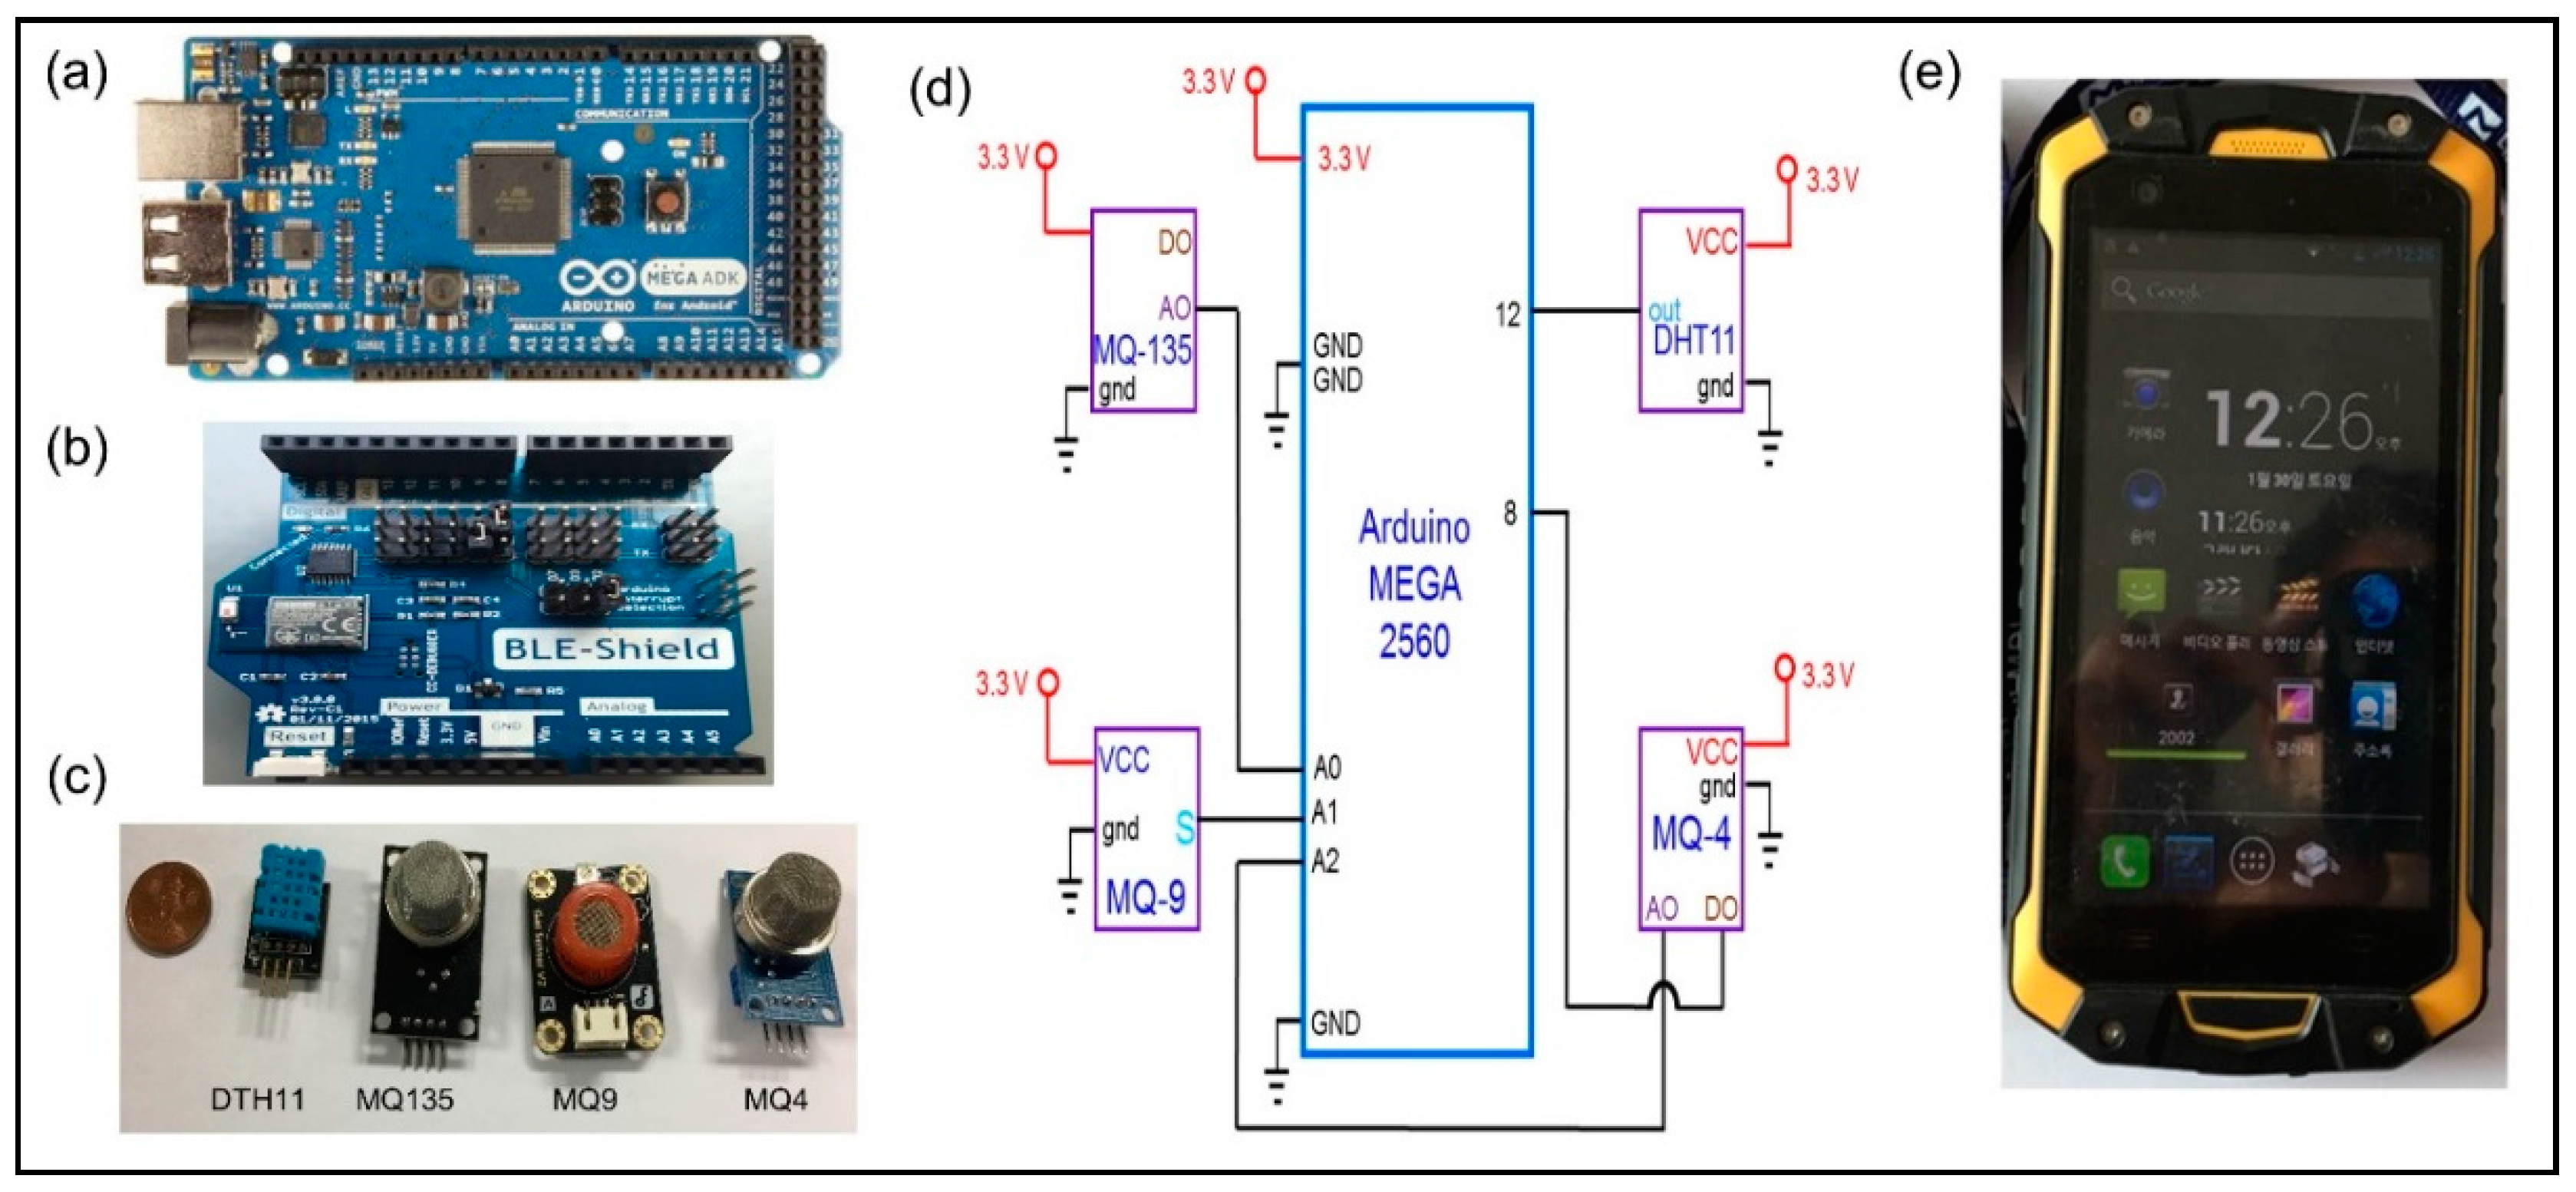
The basic sensing unit of the proposed IoT platform is Arduino [30], a microcontroller for digital and analog input/output (I/O). The Arduino MEGA 2560 microcontroller (ATmega1280, Atmel, San Jose, CA, USA) (Figure 4a) with MQ-9, MQ-4, MQ135 and DTH11 (D-Robotics, London, UK) (Figure 4c) sensor modules were used for monitoring the underground environment. Figure 4d shows the circuit diagram of sensors attached to the different pins of the Arduino MGEA. Arduino MEGA is an open-source microcontroller chip for reading and writing OUTPUT data in real-time. Arduino was used because of its fast and easy prototyping, low-cost, support of existing libraries, and the fact that it is used by a large community as a common hardware for IoT [31]. Besides this, MQ-9, MQ-4 and MQ-135 sensors are highly responsive to flammable gases regardless of the environmental effects (especially dust and water vapor), and the electrical signals of these sensors are stable. The DTH11 sensor has a temperature range of between −40 °C and 120 °C. Therefore, it provides a wide range of temperature measurements with efficient monitoring of RH between 0 and 100 RH, making it highly appropriate for mines. These sensors are suitable for this application because they provide a high performance, low-cost, a simple architecture, and have been used in a wide range of applications. Each SN unit runs its own algorithm for local event detection, which allows for distributed processing. Thus, if SNs are disconnected from the network, they can analyze gathered data for the local identification of events. Table 2 summarizes the specifications of each sensor.
4.1.2. Mobile Nodes and Other Nodes (Miner Location Tracking)
Figure 4e shows a smartphone (136.6 × 69.8 × 7.9 mm), which is a portable device carried by miners having a weight of 145 g. These smartphones have an Adreno 330 CPU and an Android 6.0.1 (Marshmallow) operating system. They were connected to SNs and RNs using Bluetooth communication, which is further explained in Section 4.2. They use Li-ion batteries (3000 mAh) and can be charged easily. MNs are capable of exchanging information with the nearest SN. Using an MN, the miner can send emergency signals related to his health and can run a location algorithm. Thus, these MNs are helpful for tracking the position of miners and tracking their health conditions. On the other hand, static RNs are fixed to provide a BLE backbone network in the mine. SNs are different from RNs because sensors modules are also attached to SNs. The main function of the RN is to provide connectivity and to acquire data from the subordinate SNs. RNs in this system are limited to a maximum of four SNs. Finally, gateway nodes are the nodes connecting the SN and RN to the base station. Bluetooth is the main communication protocol for the entire network. The BS is responsible for the detection and declaration of global events.
4.2. Network Layer: Communication Protocol
In this study of mine safety, BLE with a bandwidth of 2.4 GHz (which is a common feature of mobile phones) has been used. BLE takes less time compared to Bluetooth classic in discovering in-range devices. In addition, BLE consumes less energy for tracking when compared to Bluetooth classic and WiFi [32]. The receive signal strength index of Bluetooth has several advantages, including the fact that it can send data without any additional data transmission processes [33]. The main element of SN and RNs is Arduino, which is equipped with an ATmega32u4 BLE (shown in Figure 4b) (L-com, North Andover, MA, USA) chip connected in serial. Arduino runs at 8 MHz clock speed and 3.3 V logic for compatibility with 3.3 V. It has 28 KB of FLASH available for program storage, and 2 KB of RAM. The BLE can support 40 connections with a data throughput of 250 kbps. The efficiency was 98% when performing at 15.5 dBi, while the error drop-down transmission was ±25. As the miners enter the mine, they are provided with a MN and a Bluetooth connection is maintained between the MN, SN, and RNs for sharing information.
4.3. Information Storage, Decision Support System and Application Layer
Information is presented to the client in our proposed system in the form of an online web page with two modes of triggered events and periodic inspection. Algorithms in the BS of the system continuously look for global events. In our system of real-time information sharing, communication between applications, components, standards, and interfaces was created using the Representational State Transfer (REST) application programming interface. A massive amount of data from SNs is efficiently managed by the real-time operational database (RODB). These databases work in combination with extract-transform-load (ETL) to extract and transform user-acquired information. First, the extract function reads data from various sources and extracts a desired subset of data. Next, the transform function works with the collected data and converts it to the desired state. Finally, the load function is used to write the resulting data to a target database. A naming, addressing, and profile server (NAPS) was deployed for assigning an internet protocol (IP) address to all sensor nodes using IPv6 Low-Power Wireless Personal Area Networks (6LoWPAN) as a link layer protocol. A constrained application protocol (CoAP) was used for application gateways (AGs) and application software for different platforms and tasks. Our system follows a Service-oriented Architecture (SOA) that simplifies complex systems into simple, well-oriented applications and components through common interfaces and standard protocols. Moreover, cloud services are linked to external data storage such as amazon S3, amazon EBS, Google’s Cloud Storage, etc. These services can support load, update, and mix operation systems, and can provide analysis languages such as SQL, Hadoop, and MapReduce. They can also provide big data analytics frameworks like Spark, Storm, Flink, and Google’s dataflow. The present study also provides an e-science platform for cloud computing, data analysis and real-time information analysis. The e-Science platform serves roles like IaaS (Infrastructure as a Service), SaaS (Software as a Service), PaaS (Platform as a Service) and DaaS (Data as a Service).
5. Methods and Models
Real-time continuous gas monitoring for ambient intelligence and outlier detection, and miner tracking are basic features of this study. The determination of the state of the mine as a single index is a unique feature of our proposed IoT system. We introduce a “Mine Warning Index (MWI)” for an easy and quick assessment of the state of the mine as normal, warning, and alarming. This index is based on the threshold limit values of gas concentrations. Moreover, ambient intelligence is also introduced in this system based on temporal statistical models. The present system can perform outlier detection using clustering analysis of data collected from sensors. Local event reporting and global event identification with collision avoidance are also the main features of the event-reporting framework. The developed framework reports an event using the remembrance of the involved node. Another attractive feature of the proposed system is that it tracks miners working inside the mine to provide a quick rescue in the case of an emergency. RSS has been used for locating MNs in the mine using BLE. Because of the simple computations associated with RSS, it is a less defined and less accurate approach [34], especially in the Bluetooth domain. Therefore, a tradeoff has been made between accuracy and computational complexity. Each feature of the proposed system is explained separately below.
5.1. Mine Warning Index (MWI) and Ambient Intelligence
The MWI is dependent on gas concentrations, temperature and humidity. Generally, the combined effect of temperature and humidity on the human body is given by the Heat Index (HI), as in Equation (1) [35].
HI = −42.379 + (2.04901523 × T) + (10.14333127 × rh) − (0.22475541 × T × rh) − (6.83783 × 10⁻³ × T2) − (5.481717 × 10⁻² × rh2) + (1.22874 × 10⁻³ × T2 × rh) + (8.5282 × 10⁻⁴ × T × rh2) − (1.99 × 10⁻⁶ × T2 × rh2)
Here, T is the temperature in °F and rh is the relative humidity.
HI has four categorical stages of “caution, extreme caution, danger and extreme danger” with values of <90, 90−103, 103−124, and 124−137, respectively. In this study, we ignored the extreme danger condition to match three stages of HI with the three states of the proposed system. As HI is mainly associated with a worker’s comfort, we assumed that workers would evacuate the mine before the system approaches the second threshold limit.
Moreover, a single parameter of MWI was introduced based on the combined effect of gas concentration and HI on the human body. MWI is helpful for the pre-evaluation of mine conditions and enables easy information sharing. This system for the determination of MWI utilizes aggregated data from all the sensors nodes. MWI is given as
where n is the number of toxic gases being monitored by a particular system and G1, G2 and Gn are the gas concentrations. The nominator is to define the in-scale limits of MWI, it can vary from case to case depending upon the number of gases to be monitored by the system. Previous knowledge, experience, and established standards are always of extreme importance for developing intelligent systems because they provide threshold limit values. The normal and threshold limit values of gases and HI in the MWI for warning (yellow) and alarming (red) conditions are summarized in Table 3. These threshold limit values have been chosen from [6,36]. As the mining industry of Pakistan follows the Mine Act of 1923 revised in 1926. These threshold limit values are under the limits defined by the Mine Act, 1926 Section 121 in the Ref. [37].
Statistical models of the average, mode, median, skewness, and standard deviation enable the intelligent detection of suspect data and provide easy scalability of multidimensional data. Also, these models are compared at different locations in the mine to determine the correlations of various parameters and their dependencies. The statistical models used in our method are given in Equations (3)–(6).
The generalized form of the normal distribution is given by
While monitoring is in progress, the change in concentration of gases alters the statistical model values. The disturbed symmetry around the mean value (normal distribution) can be easily observed as a result of a change in the value of a statistical model [38]. A disturbance in the symmetry is associated with the skewness of the model. If the skewness is >0 or <0, the distribution is on both sides, and whenever skewness is zero the distribution will be uniform around its mean. Non-zero values of skewness are a clear indication of an event in that particular region. In addition, a comparison of the statistical values of different regions allows ambient intelligence to answer following questions:
- 1.
- What is the most well-known range of gas concentration?
- 2.
- What is the safety state in each region of the mine?
- 3.
- What are the variations from the norm and why? Are they detected?
- 4.
- What is the relationship between the different monitoring parameters?
5.2. Outlier Detection Algorithm
Each SN of the proposed system runs a distributed event detection algorithm for local events, while the BS runs a global event detection algorithm. Generally, the backbone of any event detection approach is outlier detection, which consists of observations of significant differences from a normal dataset of values [39]. Outliers could be noise or sensor faults. Therefore, the event identification algorithm of each SN is designed in such a way that they identify an event if four consecutive readings of outliers are received by the SN. Although many outlier detection approaches exist, clustering was considered as the most appropriate because of its simplicity, high outlier detection, low false positivity, and high reliability. Among partitioning clustering approaches [40], K-means has gained popularity as it is able to incorporate multiple attributes and can be implemented in an unsupervised manner. The time series equation of a K-means algorithm was used for data partitioning. It follows the rule of k ≤ n, where k is the number of clusters and n is the number of observations. Track duplication of dist (a, b) has been removed by using the Euclidean distance from the Malinowski space using the following relationship
Here, dab is the distance of the i-th data point to the center of cluster k, xi is the i-th data, and Cka is the centroid of the cluster. A steadfast verification of cluster analysis is the Silhouette value (ζi) [41], which is in the range of −1 ≤ ζi ≤ 1 and has an easy graphical representation. For n clusters, the silhouette coefficient values are
Here, αi is the average distance of the i-th object in an individual group of the same cluster. If αi is unknown, then the minimum distance (βi) is chosen from another nearby cluster. This enables the easy identification of an outlier from the collected data in a mine environment. The cumulative Euclidean distance derived from K-means is stored and used to determine the contribution of each weight by following these steps: (i) the contribution of each attribute is determined from their mean and covariance, (ii) the Euclidean distance is calculated again for each attribute using the mean and variance of the remaining attributes, (iii) the newly calculated Euclidean distance is subtracted from the cumulative Euclidean distance Dm, and (iv) the results of step two are divided by the Dm to determine the contribution of attributes.
5.3. Event Reporting and Global Event Detection
Data aggregation is an important element for improving transmission efficiency. Thus, it is carried out at the SN levels for local events and at the BS level for global events. Local event frameworks are summarized in Table 4. A frame of environmental information has been defined as 0×0a, with the Limit field of 0×01 if a parameter overruns. Otherwise it is 0, and the Type field represents the parameter type, and PaRm is configured with specific values of tracked parameters. Besides this, SN runs an algorithm for localization and geographic positioning, and it updates 32 bits for the x and y coordinates.
After receiving aggregated data from SNs, the RN is set to 0×0b to maintain the identity of the environment related data. Further, transmission from RNs is done after adding the identity of the SN. The Num field is the number of SNs, and Addr represents the IP address of the SN. As data collision is always a considerable factor in WSN routing, both Num and Addr are helpful for avoiding data collision. There is no need to change the frame monitored in Table 4. Moreover, the data is sent directly to RNs without aggregation for overruns, to distinguish them as urgent transmissions of emergency data. Table 5 shows the frame format of RNs.
The local guidance and tracking information (LGTI) is updated by the BS for SNs ({LGTI}) each time {LGTI} is tagged with a sequence number of SeqF. Whenever there is new information for the BS, it inserts this information into the LocalizInfo of {LGTIi}, SeqF, and also adds a number of packets to the data flooding, as shown in Table 6. The broadcasted packets contain information in the form of a list. Whenever an RN i receives LocalizInfo, it matches the received information with the previously received information. It also compares the SeqF with the previous SeqF. A higher SeqF indicates that the received packet contains new information for this node (LGTIi). Thus, it updates information and revises SeqF in a similar manner. Then, the RN checks for the information related to subsequent SNs. If it is empty, then it is ignored, otherwise it updates SN.
5.4. Miner Tracking Algorithm
In underground mines, tracking is still an unsolved problem as most of the applied techniques rely on RSS. The harsh environment and uneven surfaces of mine walls make RSS measurements highly vulnerable to errors. In this study, this effect was minimized using an RSS range-based weighted centroid approach by creating a tradeoff between accuracy and computational complexity. This algorithm utilizes RSS values of mobile nodes according to their logarithmic distances from SNs. Our model follows a linear relationship between RSSI and logarithmic distance given by
To enhance accuracy, the present system measures power from at least three reference SNs, resulting in a rough estimation of MN. Refinement is done using a triangulation approach of centroid localization. SNs with known coordinates Nk = Nl(x, y) should be defined over the entire system to help estimate the position of MN located within the coverage range of SNs, given by
This localization only considers the coverage range of SN, while ignoring RSS values of MN. These results are calculated based on equal distances for all reference nodes. Therefore, we considered advanced algorithms based on weighted centroids, in which each SN contributes by assigning a weight factor to the RSS. Position estimation of MN within the coverage range of each SNs is given by
The object weight is calculated using
Here, dij is the distance between MN and SN as determined from RSSI, and g is the degree of contribution of each anchor node, usually set to 1. The normalized weight of wi can be given by
The estimated positions of the target node are
Equation (14) represents the estimated position of a target node. The benefit of using this technique is that it does not require any calculation of a path loss component or other parameters. Thus, it provides the advantages of low-complexity and high accuracy.
6. Implementation: Case Study
An underground mine, the Hassan Kishore coal mine situated in the Mahiwal region of the eastern salt range, Punjab Pakistan, was selected for the implementation of the proposed system. This particular coal-mine is positioned at Ara-Basharat, 48 km southeast of Kalar Kahar. The mine portal coordinates are 32°46′26″ N and 73°06′45″ E, while the portal elevation from sea level is 870 m. The average thickness of the coal bed at this particular coal mine is 0.1–0.5 m at an average depth of 23 m below the surface.
The real challenge for the deployment of this system was the topology management. The unstructured architecture, uneven mine opening surfaces, bends/curves in mine opening, and dynamic nature of mine workings reduce the wave propagation. These challenges have been solved by adopting the following procedure. Firstly, the entire mine was divided into three different regions i–e; the incline, the main roadway, and working faces with connected galleries. Secondly, the optimum topology with in-nodes distance (17 m) was determined by a hit and trial method. The following procedural steps have been adopted for setting up the entire network:
- (1)
- BLE shields were installed and programmed using Arduino. Then, the sensor modules for temperature, humidity, CO2, CH4, and CO were fabricated with Arduino. The sensing prototype was pre-programmed with the threshold limits of gases, temperature, and humidity, as summarized in Table 1 in Arduino Integrated Development Environment (IDE 1.0.X Arduino AG).
- (2)
- The SNs and RNs were installed on the side walls of the mine at different locations shown in Figure 5.
- (3)
- Power at 3 V to 5 V was supplied to SNs and RNs using the electrical power of the underground mine.
- (4)
- The entire framework of the system was installed on a PC server (Intel Xeon E5420 2.5 GHz with 8G RAM) running on an operating system of Windows 7 (Microsoft, Redmond, WA, USA).
- (5)
- The early-warning data was transferred to the main server every second. Initially, the monitored data were compared with commercially available well-known devices for a day. These devices included: Onset HOBO U12-012 (Onset, Bourne, MA, USA) [42] for temperature and humidity, Gas central CH4C 100 (Ventilation Control Products, Brodalsvägen 7, Hus Z, Partille, Sweden) for methane (CH4) gas, Telaire 7000 series (Amphenol Thermometrics, Inc., Saint Marys, Pennsylvania, PA, USA) for CO2 and Fluke CO-220 (Fluke Corporation, Everett, WA, USA) for CO.
- (6)
- The RSS-weighted centroid localization algorithm was defined and programmed in the computer for miner tracking.
The straight length of the mine entries at this particular mine was approximately 250 m and the width was about 2 m. The entire network of our system consisted of one BS, one gateway, 12 SNs, 4 RNs, and an MN. Moreover, two actuators for controlling ventilation fans and three for alarm devices were also added to the system for noticing the emergency response. All Arduino-based SNs and RNs were installed near the crown level at an approximate height of 1.8 m to avoid human interruption. Gases being monitored by our system are lighter than air, so they tend to accumulate near the roof of the mine. SNs and RNs were installed in a zigzagging manner, where each RN was followed by two SNs. The average distance between BLE nodes was approximately 17–18 m, and this was selected by considering the mine opening surface conditions, as uneven surfaces greatly influence the WSN range. The chosen distance allows for the overlapping of a single node with at least three consecutive nodes. Thus, in the case that one or two nodes fail, our system can reconfigure itself with a node within range. This gives a high density of locations of each of SNs and RNs inside the mine. These are summarized in Table 7 and shown in Figure 6. The position of MN is also shown in Figure 6 as a red color, the SNs are represented as a blue color, while RNs are shown as an indigo color.
(1) The initial startup of the entire system takes 90 s at a refresh rate of 1.5 kHz. Installation of the entire setup was completed on 26 July 2016. Prior to extensive monitoring, it was necessary to train the system by having it memorize 300 initial readings. After training, the setup was started at 12:00 a.m., 28 July, so that both off-shift and on-shift gases concentrations can be observed. The performance evaluation of the sensors in the actual conditions in the mine environment were carried out for the first 24 h with their well-known commercial equivalent instruments including: HOBO U12-012 (12-bit resolution measurement) for temperature and humidity, Gas central CH4C 100 for methane (CH4) gas, Telaire 7000 series for CO2, and Fluke CO-220 for CO. The reading interval was set to 1 min for both the commercial equivalent and our system (OS). Areas with more workers are important areas within the mine. Therefore, only two locations in the mine (mine face 1 and midway mine) have been considered for comparison purposes. We used 300 initial readings to train the normal outputs of monitoring systems, and covariance was computed for the next 400 readings to determine if the incoming measurement is an outlier or not.
(2) To check the efficacy of the localization algorithm, two experiments were performed for the RSS calculation by (i) moving the connected MN and (ii) determining the localization error. The localization error was determined by performing an experiment to determine the value of g (Equation (13)). In these experiments, the degree of contribution of each anchor node was constant at 1. To determine the localization error, experimental settings include: static SNs of known location inside the mine and a MN connected to SNs via a Bluetooth connection. The moving accuracy of the MN carried out by personnel was given attention because it requires uniform motion. Therefore, we ensured that the MNs moved at a uniform speed. The miners were moved up to 30 m from the static node with uniform speed and stopped at 2 m intervals. The RSS values were observed at the SN, which were further processed for determining weighted centroids. One of the features of this approach is that it considers the previously collected RSS values when applying weighted centroids.
(3) A network of five connected SNs was created in the proposed topology. SN5 is the SN connected to GN from the back side, while SN1 is the last SN in this experimental network. To check for node failure, nodes SN2 and SN4 were powered off. The system detected and reported dead SNs with 100% success in less than 10 s and adjoining SNs were able to reconfigure within 20 s. Then, powered off nodes were again turned on, and the network again reconfigured itself to the previous configuration within 10 s.
7. System Performance and Evaluation
7.1. Calibration
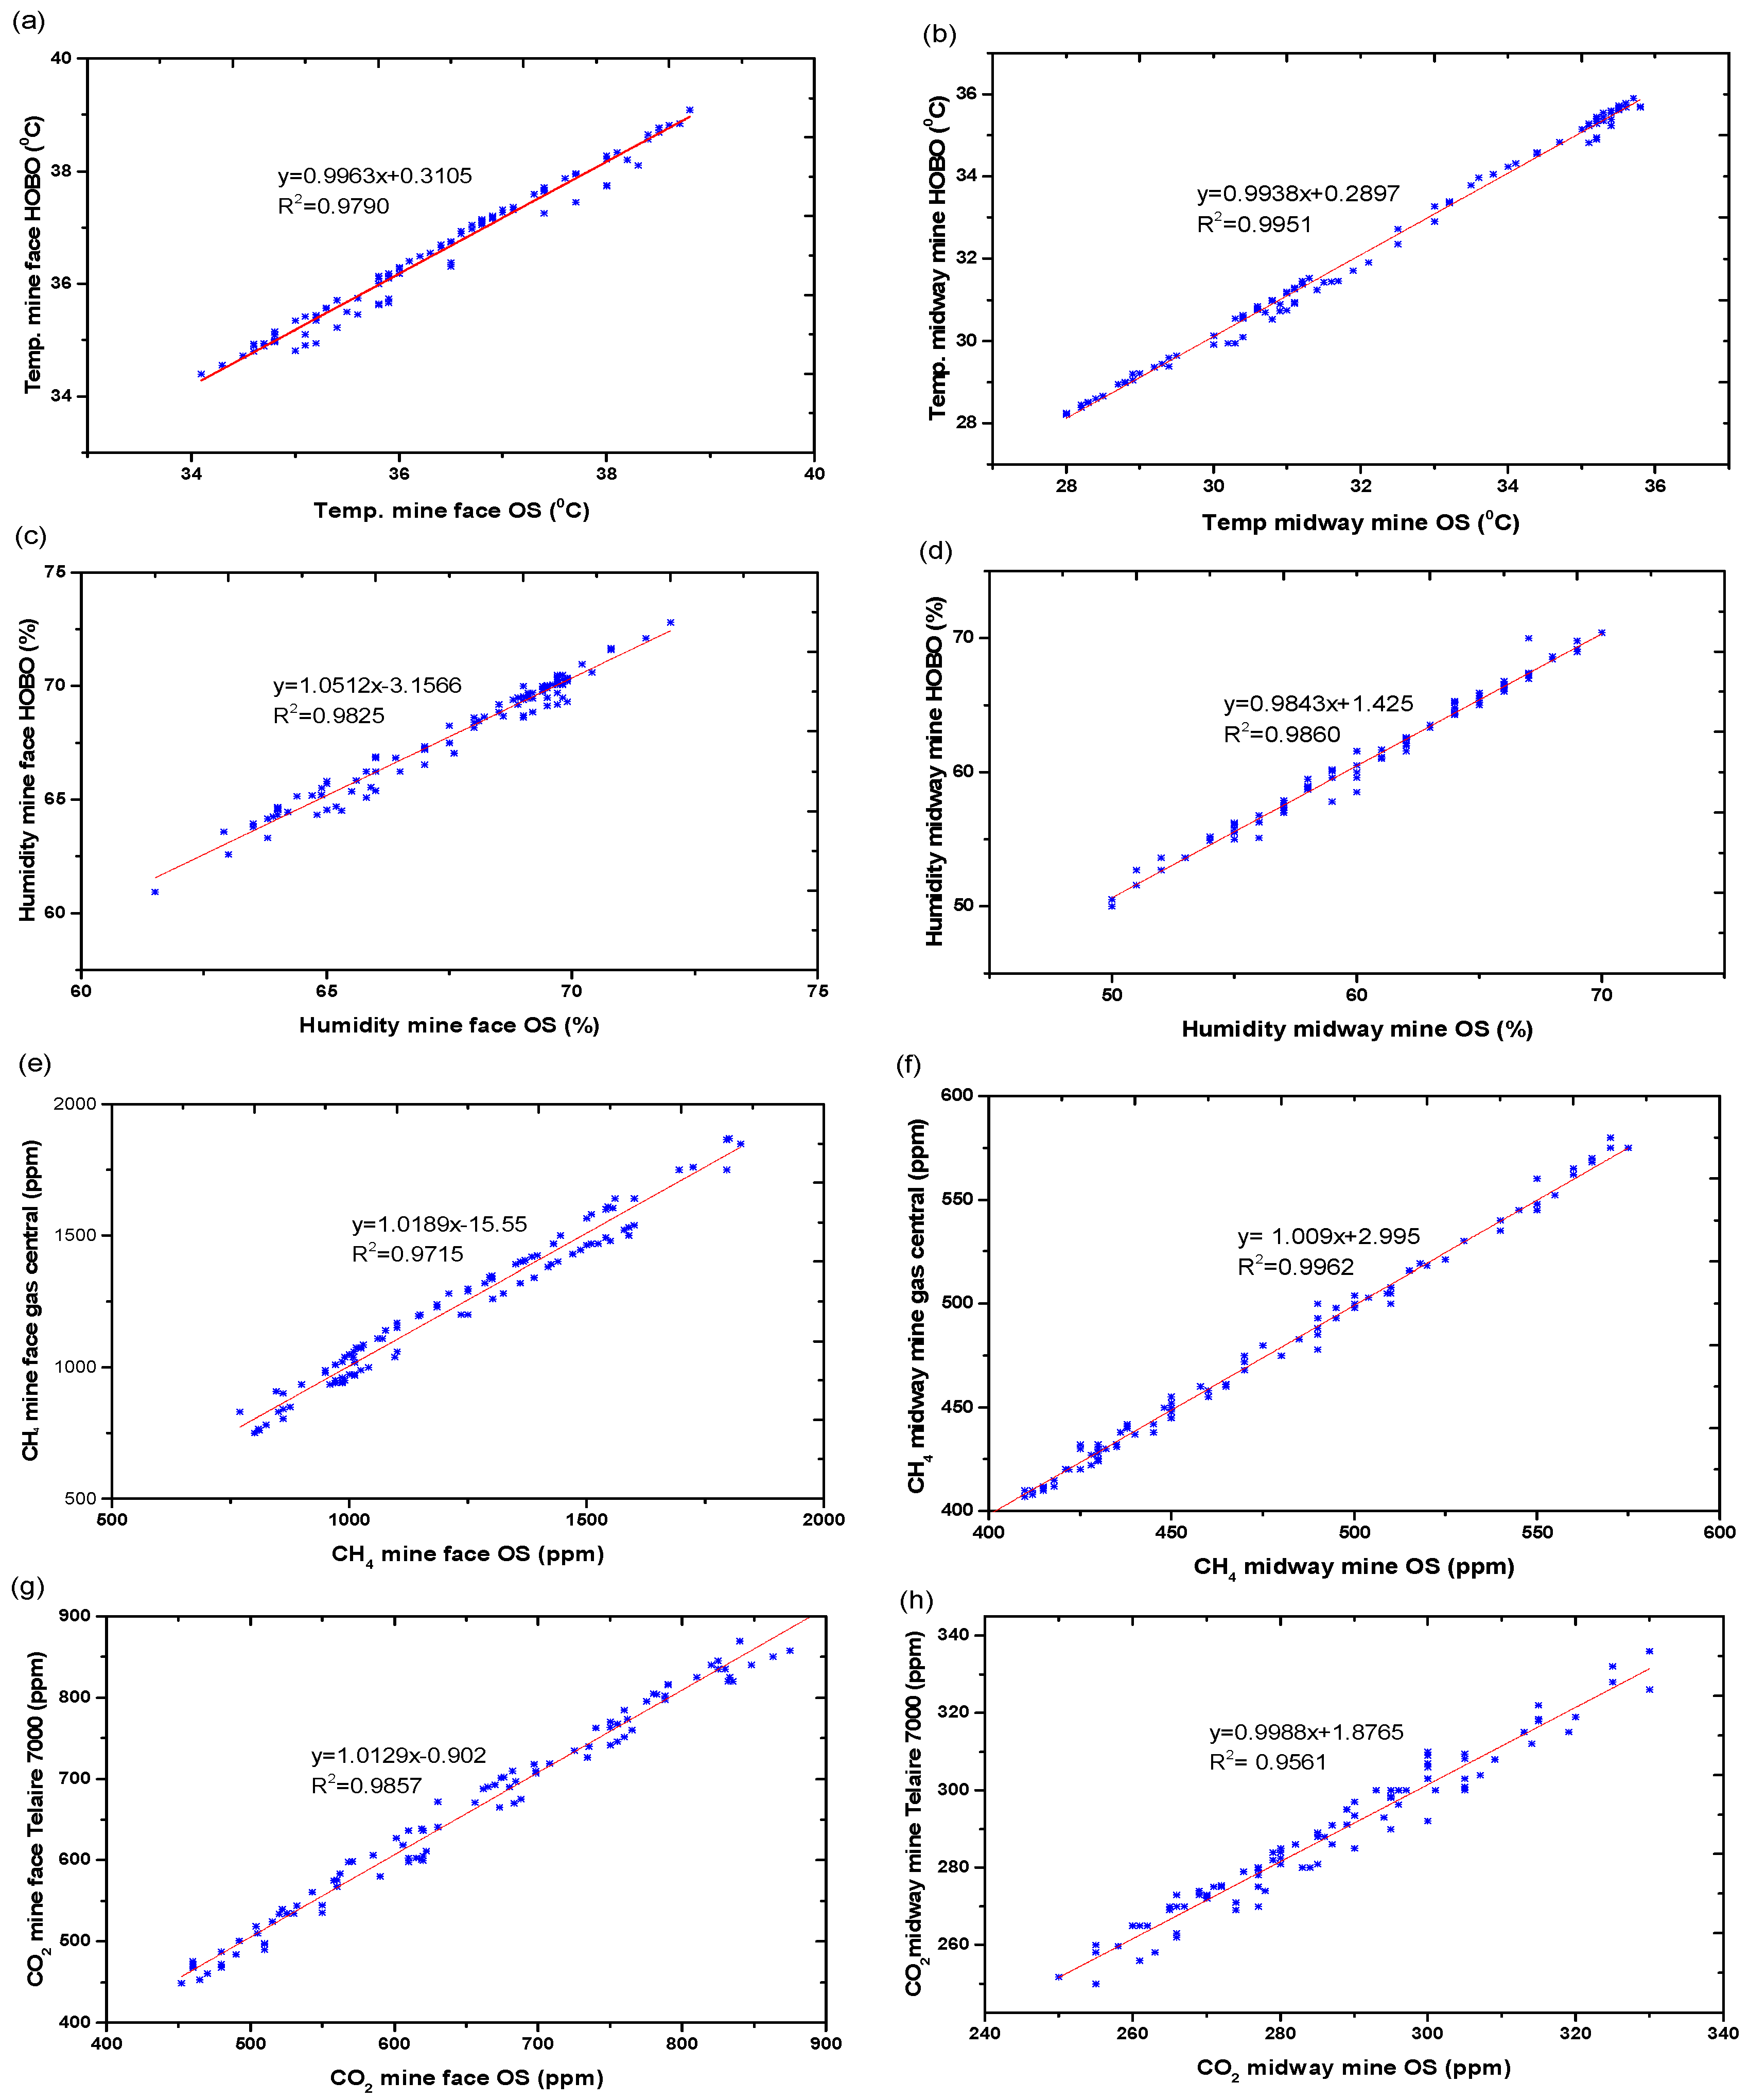
The linear correlation between the sensors readings of our system (OS) and their commercial equivalents at mine face 1 and the midway point of the mine are shown in Figure 7. Figure 7a–d show strong correlations between the temperature and humidity measured by Arduino-based sensors and commercial equivalents. The regression constant obtained for temperature and humidity at both of these localities was always greater than 0.96. The mean square error for Figure 7a–d was found always to be less than 0.581 and the root mean square error was observed to be always less than 0.762. Figure 7e shows the linear correlation constant (R2) between CH4, monitored by OS and the Gas Central CH4C 100, which was 0.9715 with a slope of 1.018 across the range of 750−1850 ppm. Moreover, an R2 of CH4 (0.9962) at the midway mine point is shown in Figure 7f. The correlation constant coefficient between CO2 concentration measured by OS and Telaire 7000 was found to be (R2 = 0.9857) having a slope = 1.01. Similarly, the R2 and slope values of CO2 for midway mine are illustrated in Figure 7h. However, the mean square error for the cases Figure 7e–h were quite high because of the abrupt changes and large variations in the values of CH4 and CO2. Minimum root square error for these cases was found to be greater than 4.33. These regressions show that OS is a good replacement for expensive and less efficient mine monitoring instruments for these specific parameters.
7.2. Intelligent Decision Making
Table 8 summarizes the statistical model values (described in Section 5.1) for real-time readings of all gases present at the mine face 1 from t0 to t1440. As shown, the observed results for temperature, humidity, and CO are quite accurate (standard error <5%). However, in the case of CH4 and CO2, the standard error values are much higher. These data provide an answer to the research question: What is the level of safety in each region of the mine? Apart from the temperature, all of the other monitored parameters indicated values in the normal state for the time internal t0 to t1440, as the values oscillated around the allowable limit values in Table 1. Statistical model values of the monitored parameters at the midway point in the mine are given in Table 9. A comparison of the normal distribution of considered parameters at mine face 1 and the mine midway point provided a quick assessment of the mine working state. The values of skewness of both the tables are >0 or <0, clearly indicating that after leaving the face of the mine, the air becomes diluted at the midway point of the mine.
By comparing the values of statistical models at mine face 1 and the midway point of the mine we answer the research question: What are the relationships between different monitoring parameters? In this study, there are two parameters of prime importance during an emergency, temperature, and CH4. These were considered for establishing a correlation. Both showed a degree of independence <0.05 in the case of a normal distribution at both selected locations while considering a normal distribution with a confidence interval of 0.95. This clearly indicates that CH4 is highly dependent on temperature, where a high temperature reflects a high concentration of CH4. On the contrary, CO is independent of temperature, as there is no effect on the statistical model values of CO with increases in temperature. Thus, the temporal statistical models govern intelligent decision-making and work well in the harsh environment of an underground mine.
7.3. Outlier Detection and Event Identification
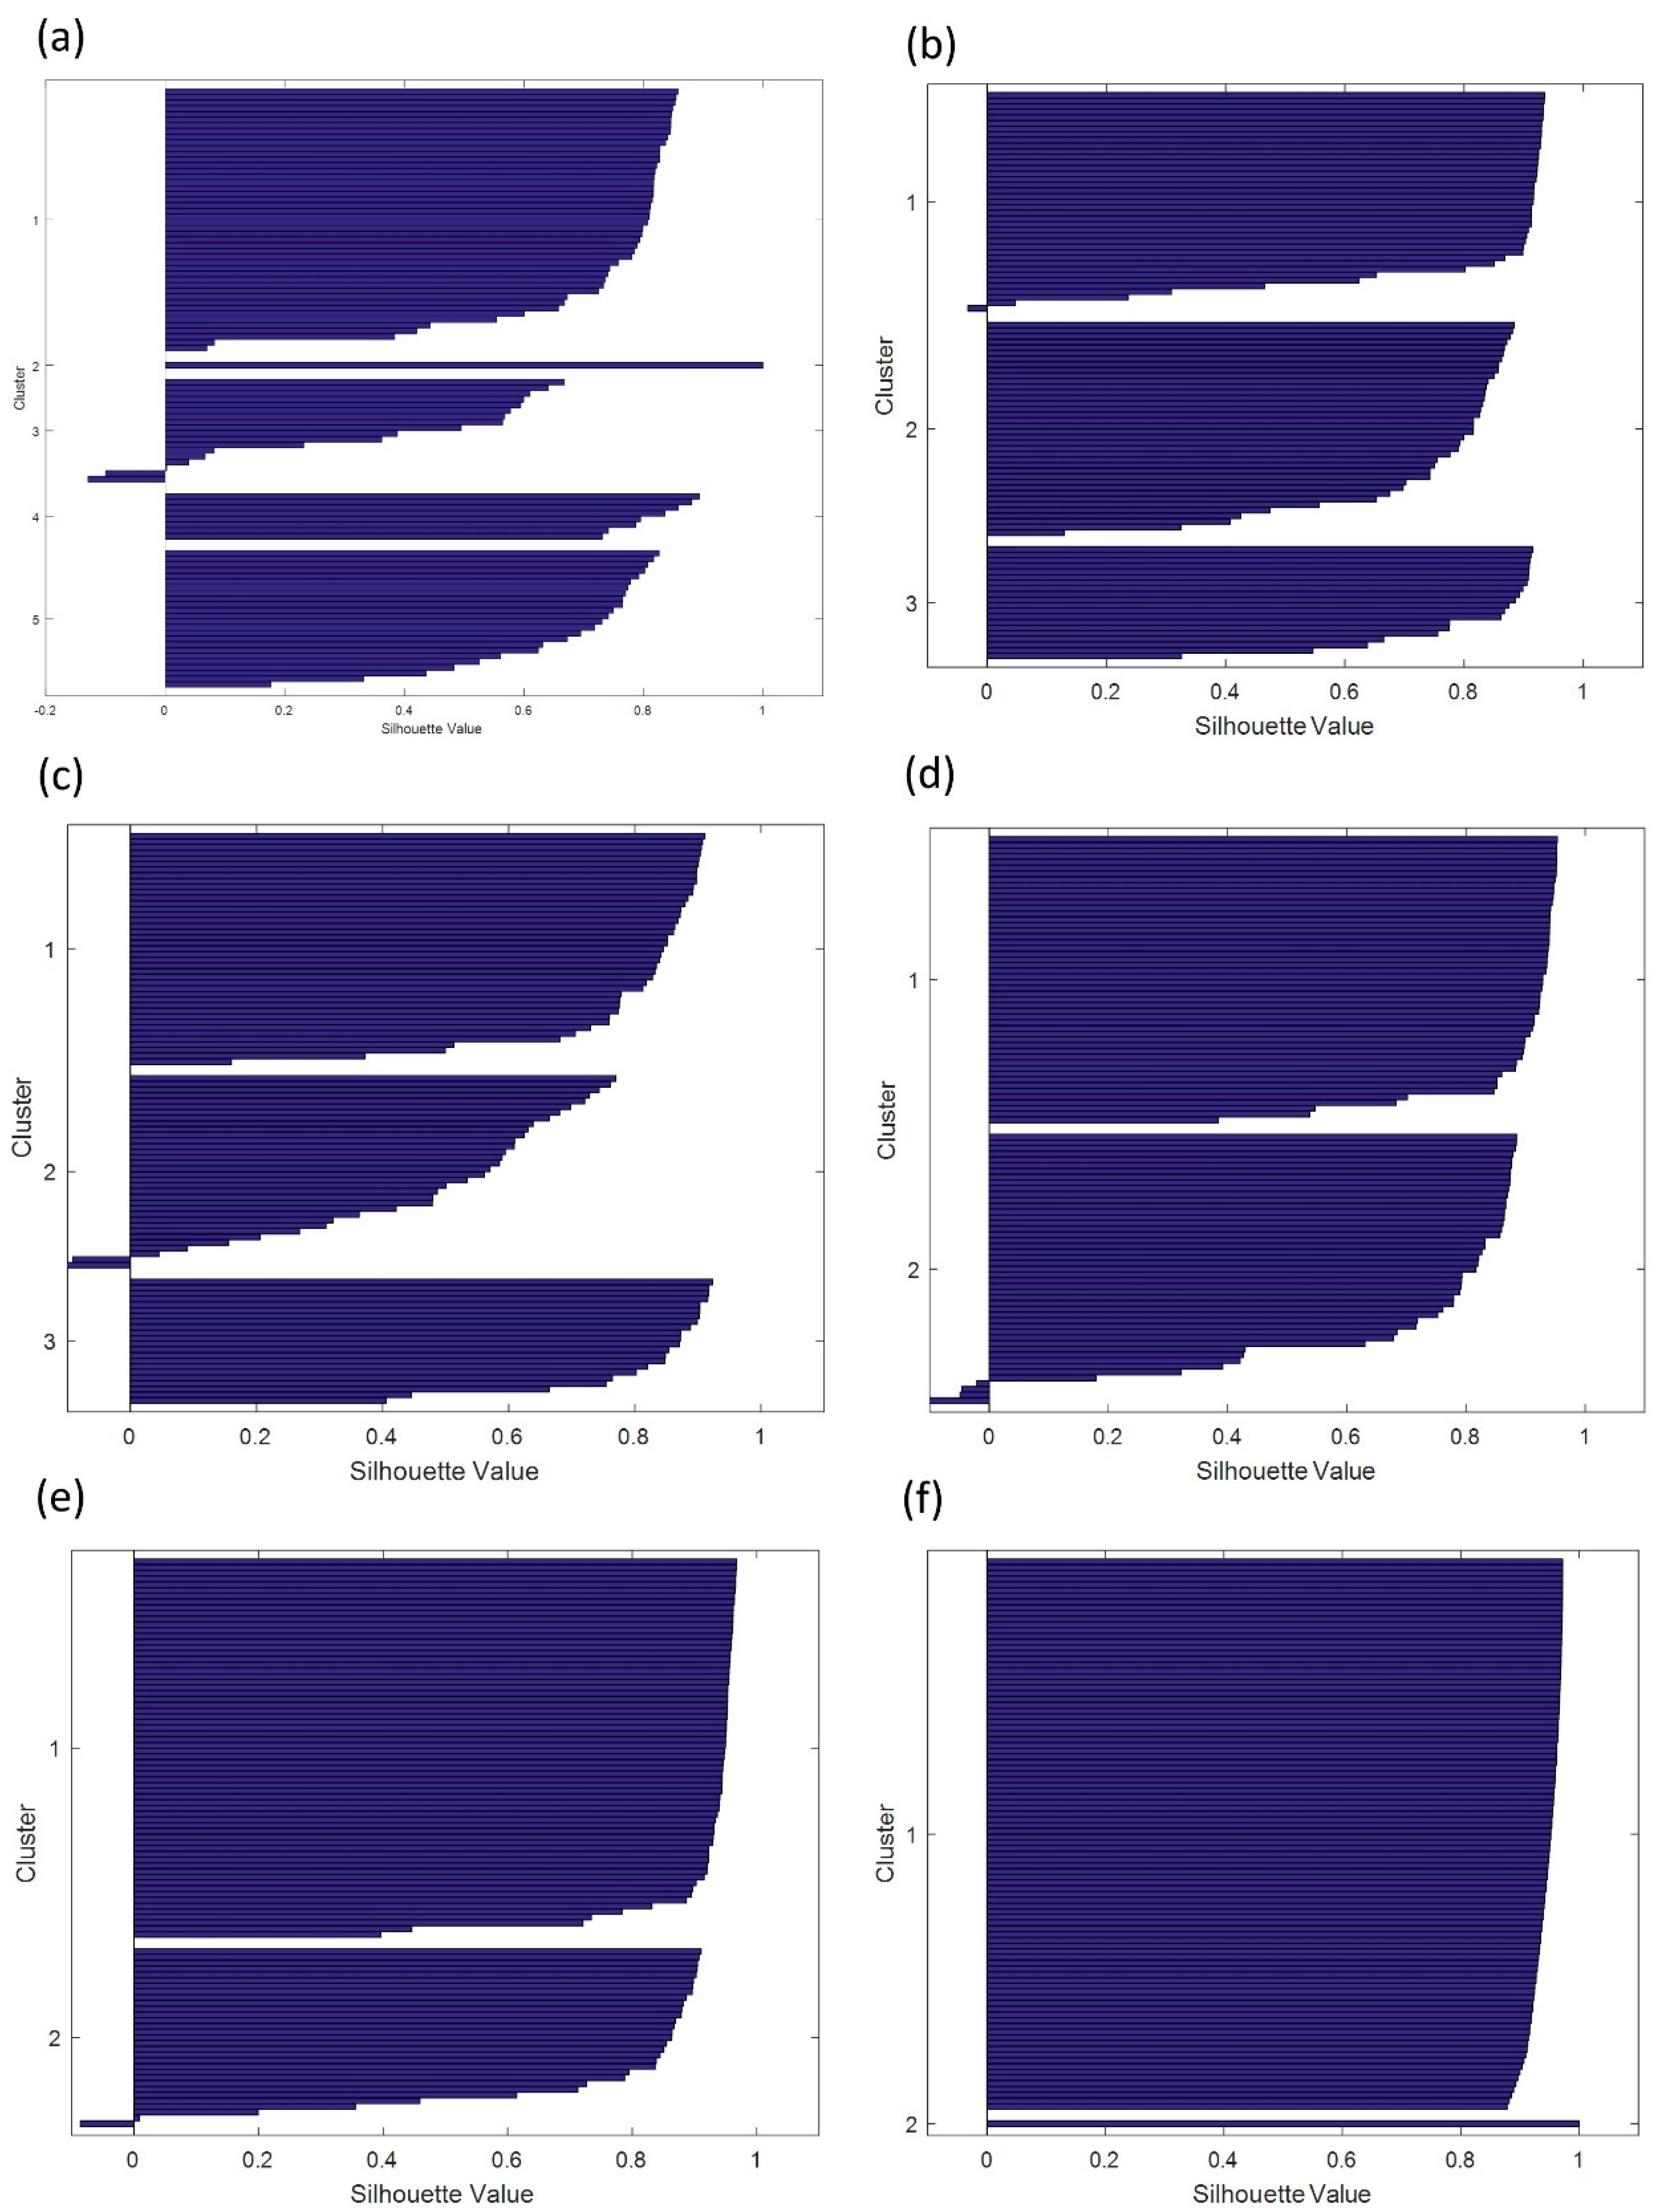
We used a K-means centroid algorithm (discussed in Section 5.2) to make clusters of the raw data obtained from the underground mine. Figure 8a shows five separately identifiable clusters of all collected data and how they depend on the number of monitoring parameters. These data provide answers to the research questions: Are there any abnormalities? If so, what are the reasons for the abnormalities? Figure 8b shows the clusters of raw temperature data. As shown, cluster 1 is well-defined as the silhouette values are higher, followed by clusters 3 and 2. Higher cluster values show a higher variability in the obtained data. Figure 8c illustrates the three clusters of humidity raw data that show significant variations, especially in cluster 2. Figure 8d depicts the clustering of CH4 data measured at the mine face and the midway point of the mine with a high consistency for cluster 1. Similarly, Figure 8e is related to the raw data clustering of CO2 with less variability than cluster 1. In addition, Figure 8f focuses on CO clustering, and both clusters showed a high consistency.
The K-means clustering classifies data into a defined number of clusters based on the compactness and separation. The x-axis of these clusters is the cohesion, while the width of the cluster calculated from ζi is represented by the y-axis. Higher values on the x-axis are helpful for determination of the Euclidean distance. As long the as the silhouette value is near 1, the cluster is more compact, and a decreasing value of the Euclidean distance defines a new cluster. Such dissimilarities are helpful for defining new sub-clusters within the same cluster. The values along the negative x-axis represent the dissimilarities in cluster values, i–e, outliers. K-means clustering is also helpful for predicting the air quality of the underground mine. To ensure accuracy, clusters obtained during experimentation were compared with four sets of clusters already gathered during training sessions. Time, percentage accuracy, and mean values are the basic elements of clustering. Under the different scenarios, the system was tested for outlier’s detection and the efficiency was found to be more than 90% for all cases.
7.4. Localization Results
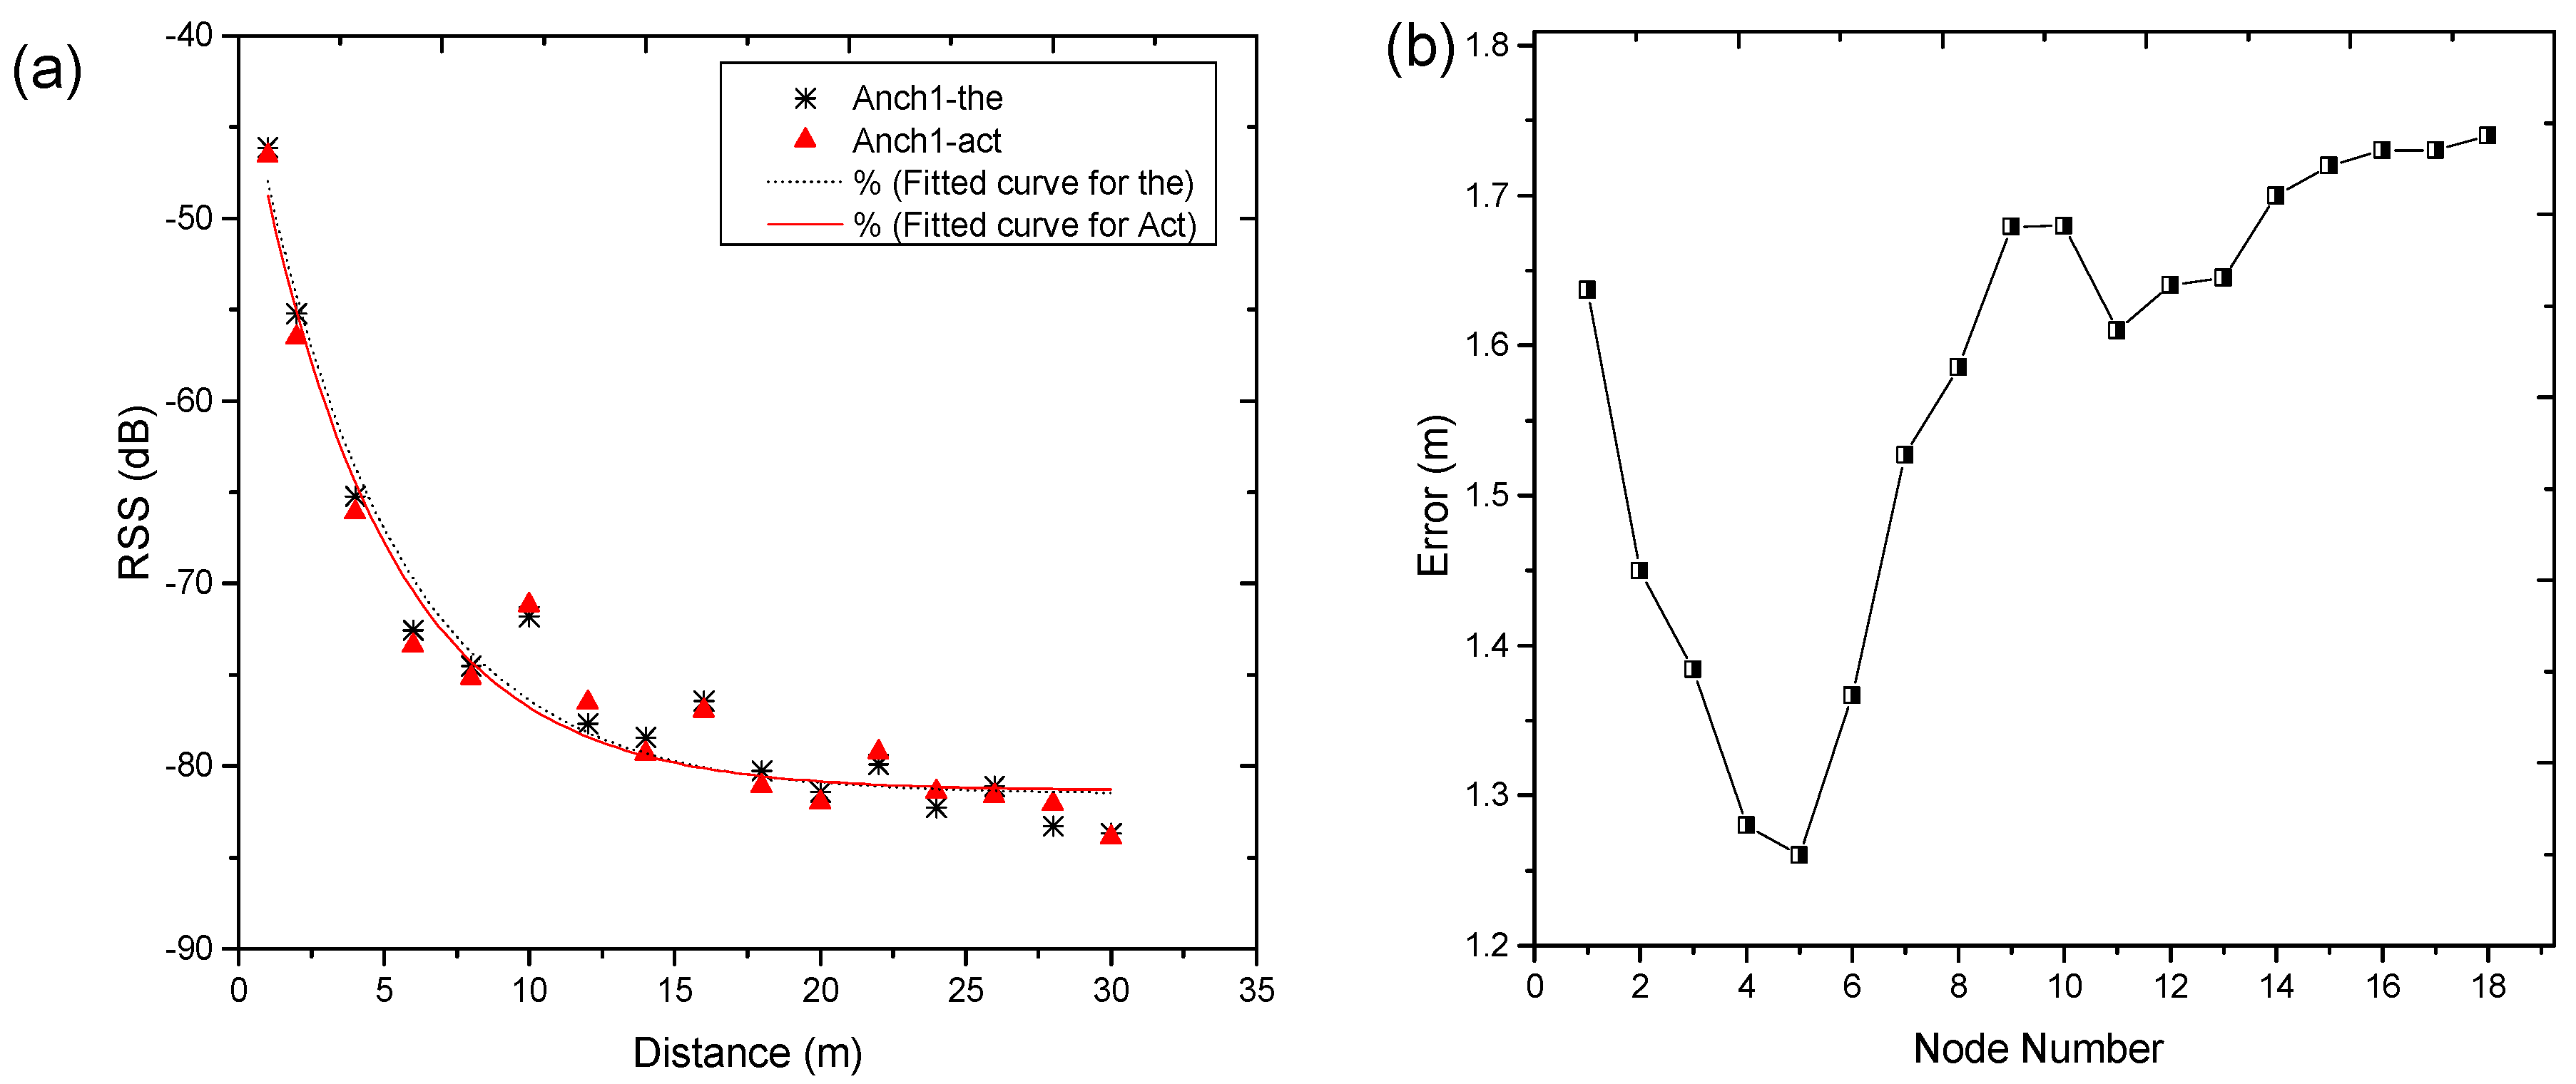
Figure 9a shows the values of RSS of a moving MN plotted against its distance from SN (discussed in Section 5.4). In the same Figure, ANCi-the is the theoretically calculated RSS, while the experimental RSS values are denoted by ANCi-act, calculated for the j-th to i-th anchor. Even though MN was placed at the same height, some variation in RSS values was found for different anchor nodes. This was attributed to the change in wavelength, uneven surfaces of mine walls, and obstacles. The value of RSS decreased with an increasing distance. Again, the same figure shows a gradual change in the theoretically calculated RSS values. RSS values leveled off at a distance of 17 m, which also indicates the topology design of our system that perfectly matches the RSS values of Bluetooth. Figure 9b shows the calculated error between source anchor nodes and MNs, while varying the distance from 1 to 30 m with a step interval of 2 m. The standard deviation of the system in the main roadway of the mine was less than 1.8 m for a node 30 m away from the source anchor node. On the contrary, the error for simple RSS was found to be more than 2.4 m when the same MN was 30 m away from the source node. Thus, the proposed RSS range-based weighted centroid localization algorithm improved the accuracy by 30%. One of the key assumptions of this experiment is that it only considers the weights of anchor nodes without knowing their condition, thus, the degree of error is irrational.
7.5. Information Sharing Web Page
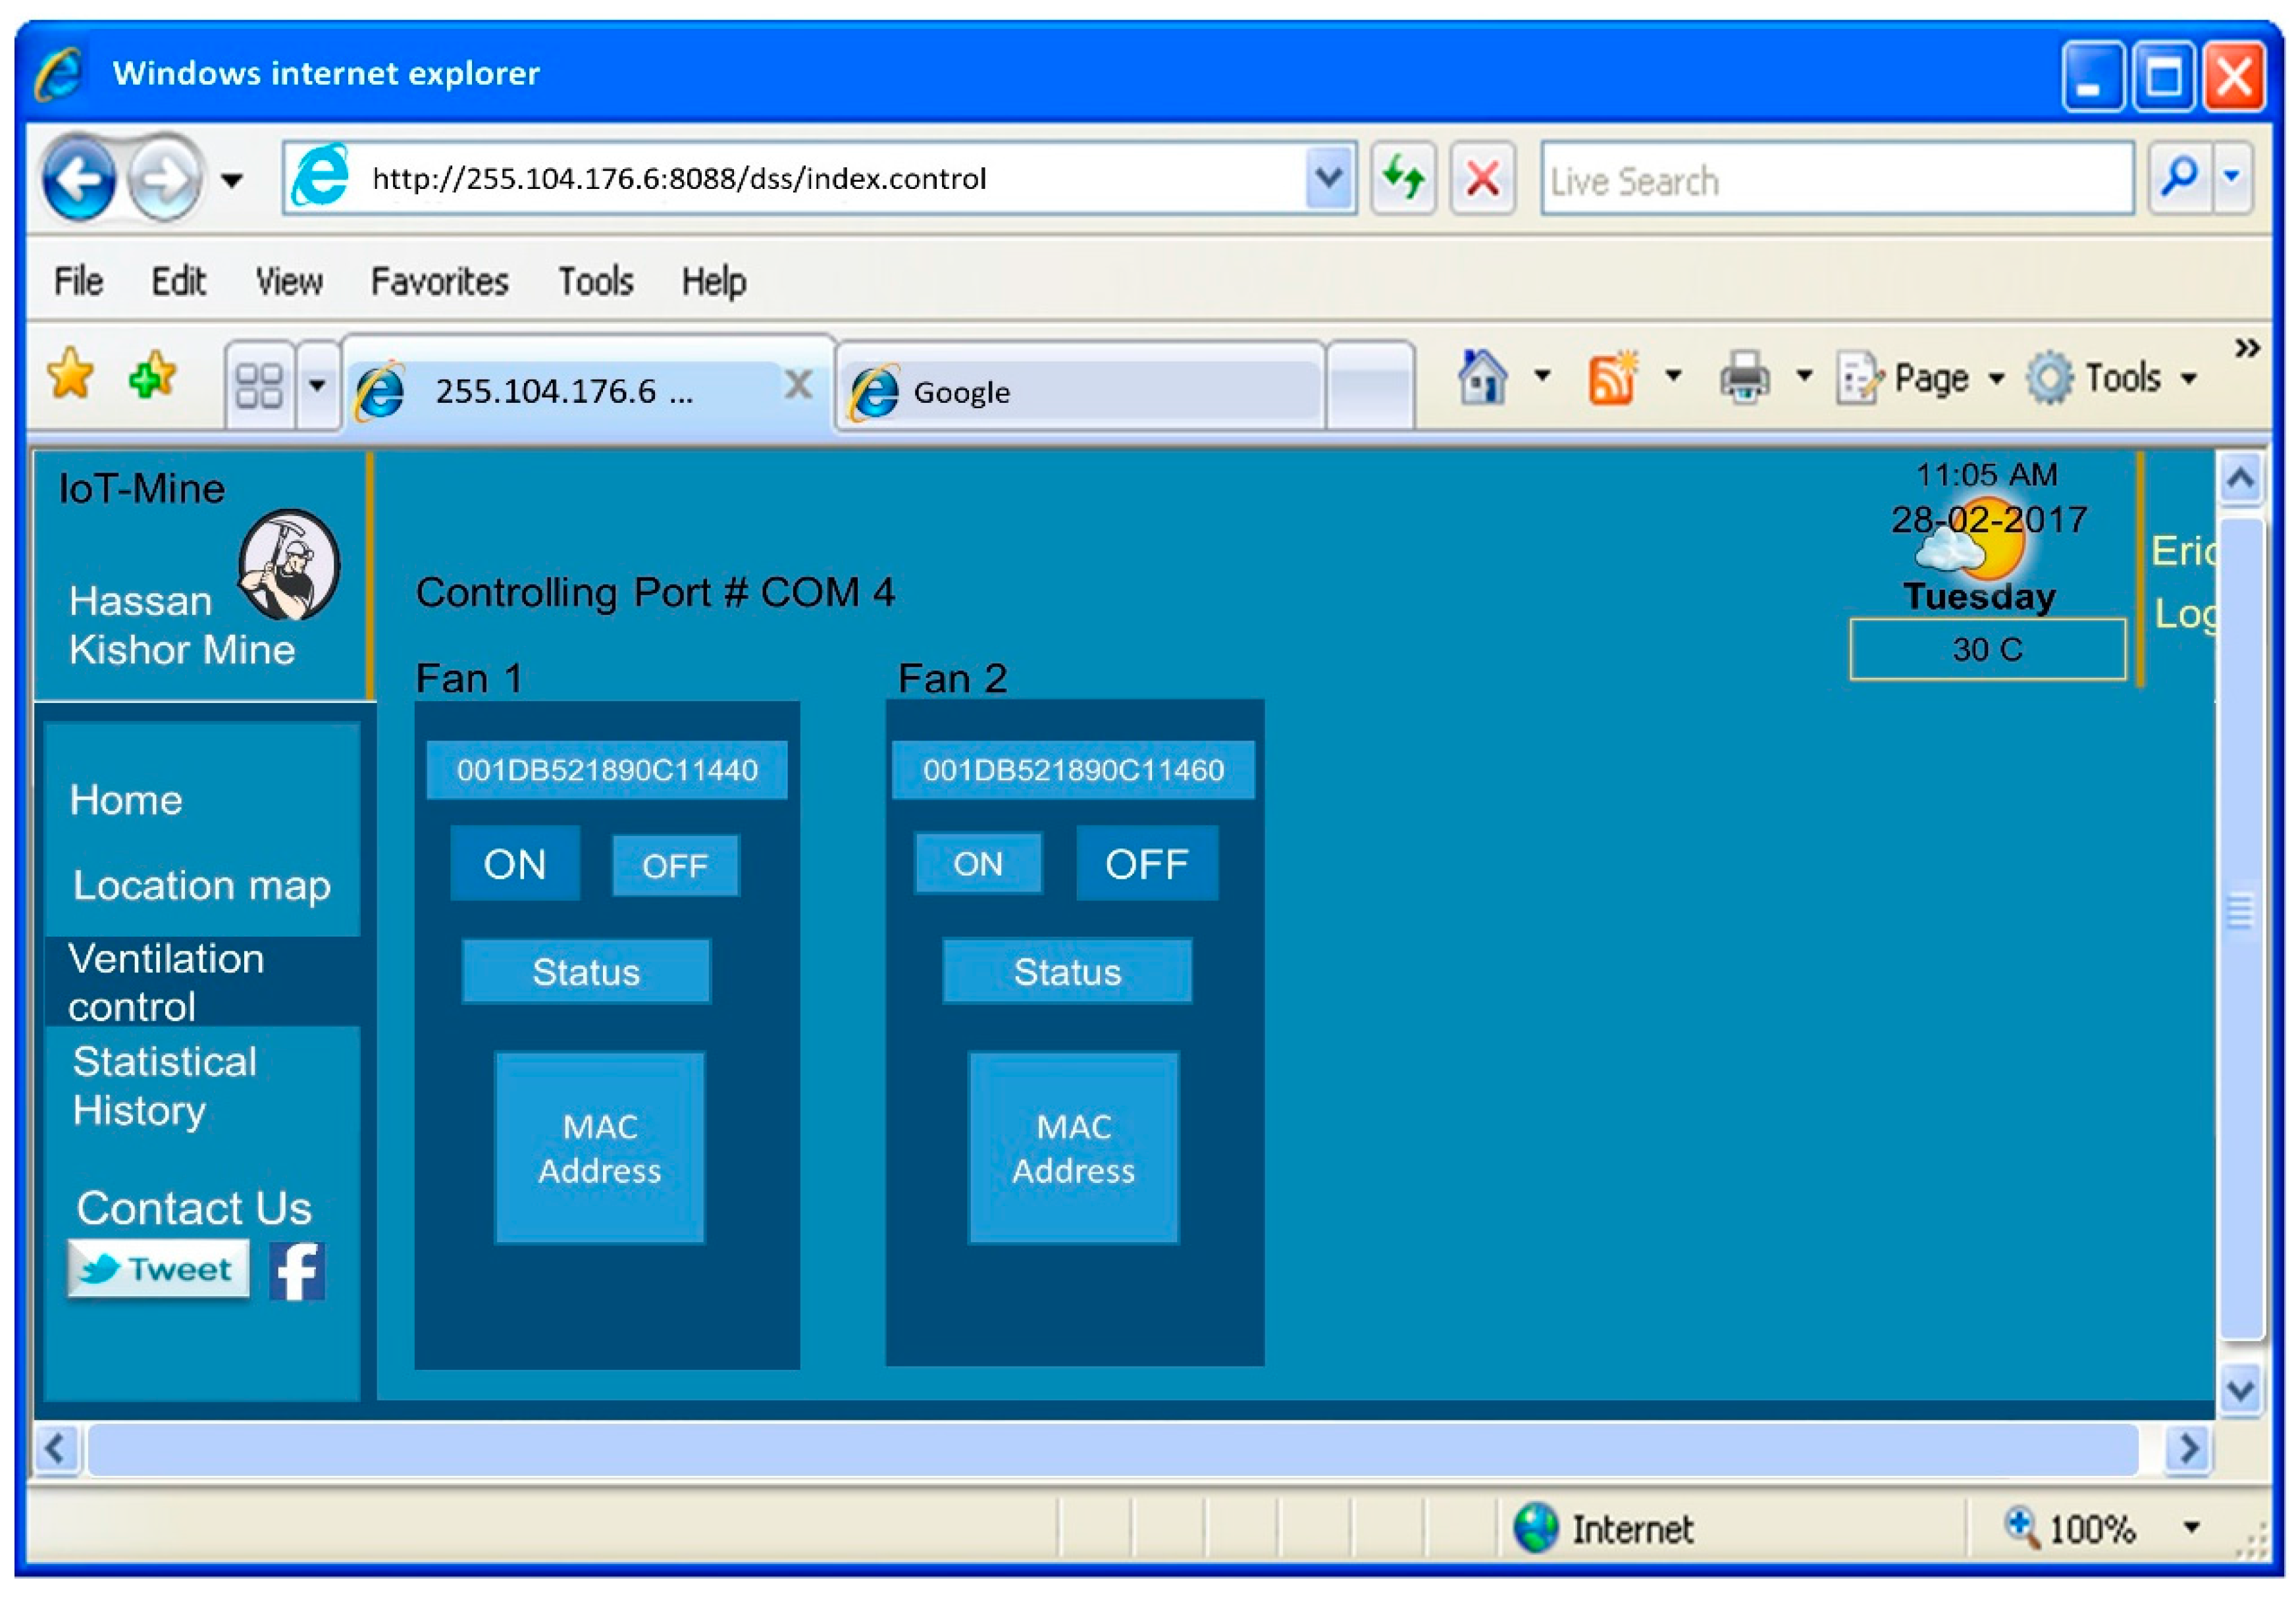
In this system, Java 2 Enterprise Edition (J2EE), support application platforms, e-Science platforms, and Web 2.0 applications were utilized for the system interface (described in Section 4.3). Moreover, java data base connectivity (JDBC) was used for the I/O data. Figure 10 shows a screen shot of standard monitoring at different SNs. Figure 11 shows how the Web interface switches to turn ON/OFF two actuators of ventilation fans remotely via a computer. The main server easily detects environmental conditions by comparing present readings with threshold limits values for the initial assessment of the serving state of the mine. The warning is in the form of emergency lights and alarms; therefore, some of the nodes were equipped with alarms and warning lights.
7.6. Performance of Web Page
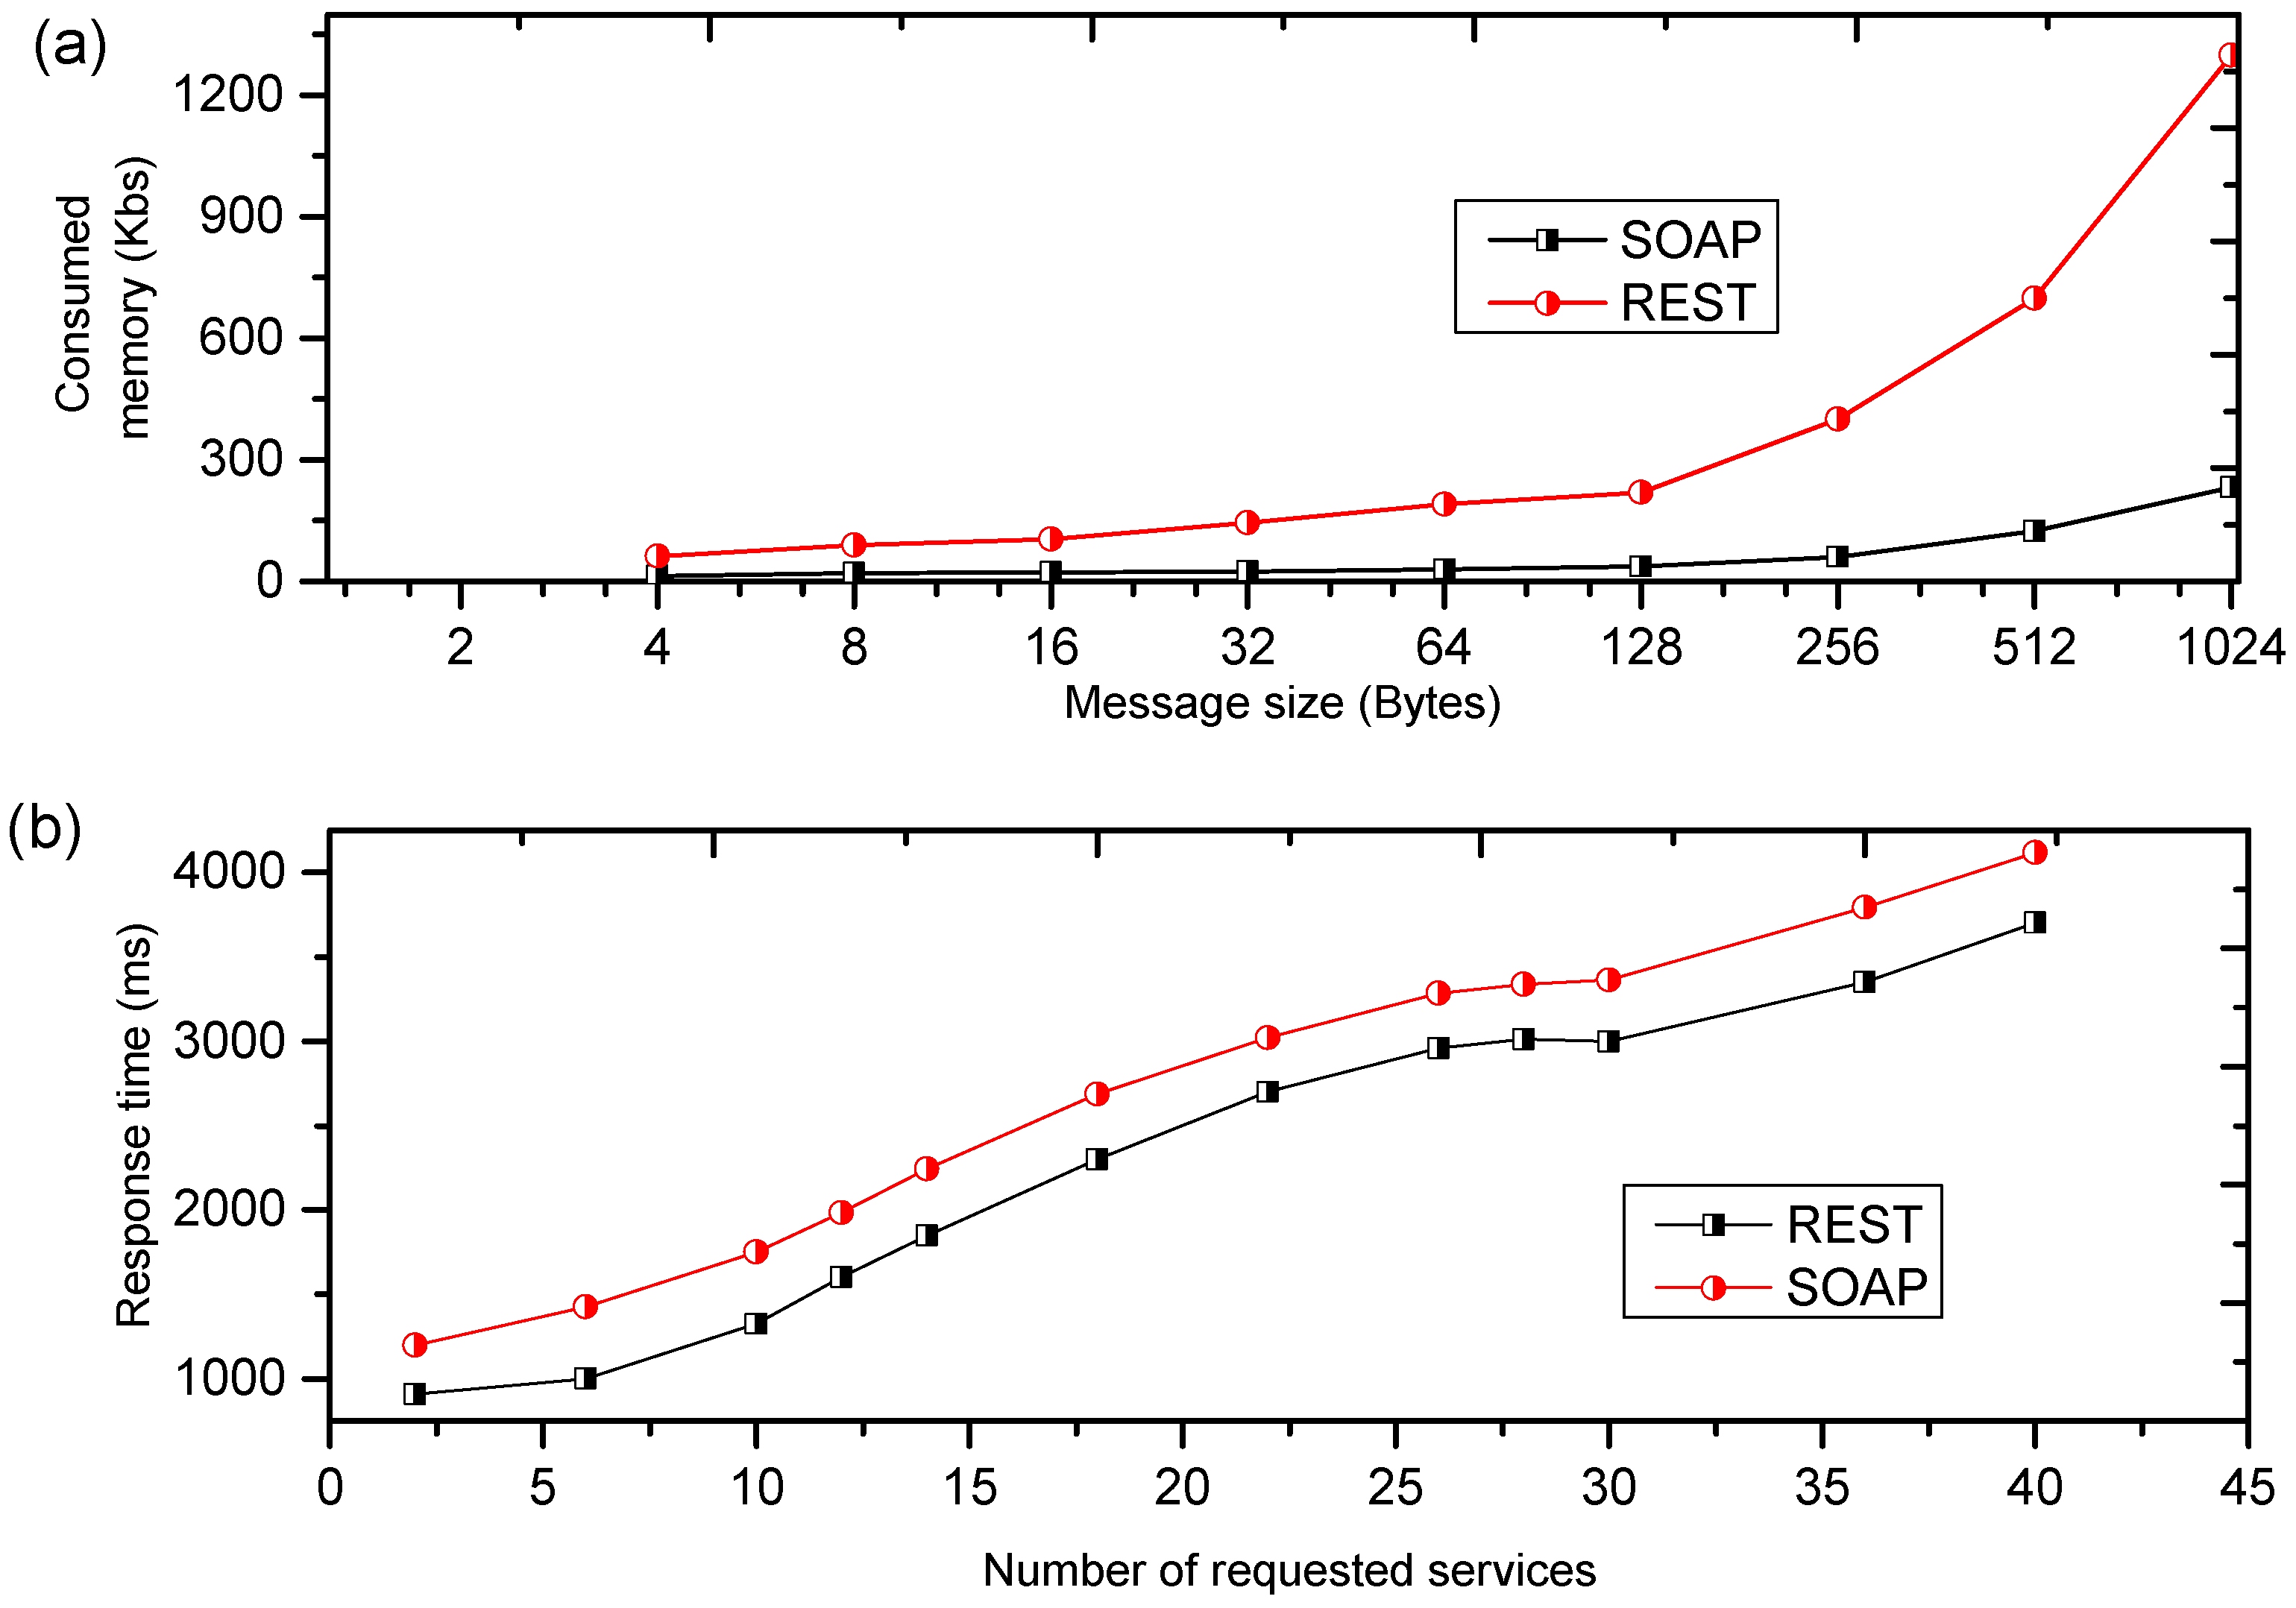
The web page should be lightweight and scalable for efficient information sharing in real-time. To check the efficiency of our web page, an equivalent simple object access protocol (SOAP)-based remote web-monitoring framework was developed to check flexibility, overhead, and scalability. For comparison purposes, a client requested one or more requests simultaneously, and multi-threading was used to respond to multiple client requests. Figure 12a compares the memory consumption of REST-based and SOAP-based web pages for greater than 50 requests. As the number of requests increases, the message size also increases. Figure 12b shows the comparative analysis of a REST web service application program interface with that of an existing SOAP-based web service framework. For a similar number of requests, the REST-based program interface consumes substantially less time when compared to the SOAP-based web page. The REST outperformed SOAP in terms of request completion time and demonstrated faster responses when compared to SOAP-based web services. Therefore, the REST style web interface is efficient and light weight. Moreover, the SOAP-based web server utilizes more memory as compared to the REST-based webpage.
8. Discussion
Before the implementation of this system, there was no safety management system in the mine except for the simple telephone communications between the surface and underground stations. The previous method of manual entries of accidents were not reliable and made it extremely difficult to build a quantitative comparison between the number of accidents before and after the installation of the integrated system. Therefore, four persons (mine manager, a technical consultant, and two miners from the mine staff) were interviewed after the implementation of this system. After the implementation of this system, a training session was arranged for miner’s training and explaining to them the benefits of this system. Afterwards, the two representatives of miners were interviewed. They showed the positive response for carrying MN, because of its light weightiness, safety concerns, and also as a source of entertainment. Also, there was a significant reduction in mine accidents. Hence, this system proved to be highly suitable and provides a replacement for the previous mine management system. This system is helpful for mine managers because they always know the locations of the mine crew inside the mine. Thus, this system enables improved management performance, especially for restricted areas. The continuous tracking of miners helps to prevent unauthorized entry to restricted areas that have high concentrations of toxic gases. Moreover, an important aspect of this system is the simultaneous information sharing with all involved workers and managers. This system enables quick rescues in case of an accident or unexpected danger. Furthermore, this system helped to provide information about the general trend of gases emissions throughout the coal mine. Table 10 compares distinguishing features of our proposed system relative to the few previously existing systems.
In fact, the use of WSNs in mines can be further enhanced by taking into consideration issues like energy management [43,44]. In addition, the operation of the proposed WSN based platform could be considerably more efficient if not only hard thresholds but also soft thresholds would be used. So that the sensor nodes send alarm messages each time that there is a specific deviation between the current and the last value of the parameters measured as suggested in [45].
9. Conclusions
In this paper, we introduced an initial effort towards an IoT-based early warning, event detection, and information sharing integrated platform that has the potential to provide comprehensive safety and improved services in underground coal mines. Our system integrates underground mine environment monitoring, miner location tracking, and cloud services through the application program interfaces for data analytics. This system has been successfully implemented at the Hassan Kishore coal mine, an operating underground coal mine. Arduino sensor modules were selected to measure five parameters i.e., temperature, humidity, CO2, CO, and CH4 at different locations in the underground mine with more than 95% and greater than 99% of accuracy and efficiency, respectively. The results obtained from the system implementation clearly indicated the status of the mine in terms of a “Mine Warning Index (MWI)”. The contingency table of MWI is based on the threshold limit values of gases, temperature, and humidity. Implementation in actual conditions confirmed some of the claims in a recent literature survey that covered toxic gases, seamless integration, and event detection, namely that a simple temporal statistical based ambient intelligence approach is far better than conventional qualitative decision-making. K-means clustering with Euclidean distance measurements and silhouette values are efficient in detecting abnormal events in an underground coal mine environment. Attributed and spatio-temporal correlated event detection algorithms provide early warnings to prevent disasters by analyzing sensor data. The RSS range-based centroid algorithm is efficient for tracking miners, but the accuracy is low. A web-based lightweight remote monitoring and control system with a REST style is efficient and consumes less memory when providing access to underground sensors.
To test the effectiveness of the proposed integrated system, a number of artificial events were created and the system was tested under various actual underground coal mine conditions. These tests showed that the system is robust. However, there are a few challenges which demand the consideration for full-fledged implementation of this system in underground coal mines. These challenges are the standardization of processing, the unforgiving environment of the mine, management of multisource data, data privacy, the complex nature of IoT-based platforms, and autonomous sensing. To detect outliers using a K-means method, the cluster centers needs to be defined prior to use. Overall, this system was helpful for solving the problems of accessibility, serviceability, interoperability, and flexibility for developing an “Internet of Things” for coal mines.
Acknowledgments
The authors would like to thank the anonymous reviewers for their constructive comments and suggestions on improving this paper.
Author Contributions
ByungWan Jo conceived the idea, provided the materials and helped with the technical aspects of system design. Rana Muhammad Asad Khan carried out the implementation, collected, managed and run different analysis on the related data, and wrote manuscript.
Conflicts of Interest
The authors declare no conflict of interest.
References
- Wang, H.; Cheng, Y.; Yuan, L. Gas outburst disasters and the mining technology of key protective seam in coal seam group in the huainan coalfield. Nat. Hazards 2013, 67, 763. [Google Scholar] [CrossRef]
- Joy, G.J. Evaluation of the approach to respirable quartz exposure control in us coal mines. J. Occup. Environ. Hyg. 2012, 9, 65–68. [Google Scholar] [CrossRef] [PubMed]
- Molina, S.; Soto, I.; Carrasco, R. Detection of gases and collapses in underground mines using wsn, Industrial Technology (ICIT). In Proceedings of the 2011 IEEE International Conference on Industrial Technology (ICIT), Auburn, AL, USA, 14–16 March 2011; pp. 219–225. [Google Scholar]
- Trevits, M.; Yuan, L.; Smith, A.; Thimons, E.; Goodman, G. The status of mine fire research in the United States. In Proceedings of the 21st World Mining Congress; Taylor & Francis Group: Krakow, Poland; London, UK, 2008; pp. 303–308. [Google Scholar]
- Annual Report, 2011 of Chief Inspector of Mines, Punjab. Available online: http://cim.pitb.gov.pk/system/files/CIM_AnnualReport_2011.pdf (accessed on 30 April 2017).
- CDC. Center for Disease Control and Prevention Mining Facilities. Available online: http://www.cdc.gov/niosh/mining/statistics/allmining.html (accessed on 6 September 2017).
- Osunmakinde, I.O. Towards safety from toxic gases in underground mines using wireless sensor networks and ambient intelligence. Int. J. Distrib. Sens. Netw. 2013. [Google Scholar] [CrossRef]
- Welbourne, E.; Battle, L.; Cole, G.; Gould, K.; Rector, K.; Raymer, S.; Balazinska, M.; Borriello, G. Building the Internet of Things using rfid: The rfid ecosystem experience. IEEE Int. Comput. 2009, 13. [Google Scholar] [CrossRef]
- Miorandi, D.; Sicari, S.; De Pellegrini, F.; Chlamtac, I. Internet of things: Vision, applications and research challenges. Ad Hoc Netw. 2012, 10, 1497–1516. [Google Scholar] [CrossRef]
- Sun, E.J.; Zhang, X.K.; Li, Z.X. The Internet of Things (iot) and cloud computing (cc) based tailings dam monitoring and pre-alarm system in mines. Saf. Sci. 2012, 50, 811–815. [Google Scholar] [CrossRef]
- Dohare, Y.S.; Maity, T.; Das, P.S.; Paul, P.S. Wireless communication and environment monitoring in underground coal mines—Review. IETE Tech. Rev. 2015, 32, 140–150. [Google Scholar] [CrossRef]
- Wang, J.; Zhang, Y.; Lu, G. Application of wsn in mine emergency communication system. In Proceedings of the 4th International Conference on Wireless Communications, Networking and Mobile Computing, Dalian, China, 12–14 October 2008; pp. 1–3. [Google Scholar]
- Zhang, Y.; Yang, W.; Han, D.; Kim, Y.-I. An integrated environment monitoring system for underground coal mines—Wireless sensor network subsystem with multi-parameter monitoring. Sensors 2014, 14, 13149–13170. [Google Scholar] [CrossRef] [PubMed]
- Bhattacharjee, S.; Roy, P.; Ghosh, S.; Misra, S.; Obaidat, M.S. Wireless sensor network-based fire detection, alarming, monitoring and prevention system for bord-and-pillar coal mines. J. Syst. Softw. 2012, 85, 571–581. [Google Scholar] [CrossRef]
- Roy, P.; Bhattacharjee, S.; Ghosh, S.; Misra, S.; Obaidat, M.S. Fire monitoring in coal mines using wireless sensor networks. In Proceedings of the 2011 International Symposium on Performance Evaluation of Computer & Telecommunication Systems (SPECTS), The Hague, The Netherlands, 27–30 June 2011; pp. 16–21. [Google Scholar]
- Misra, P.; Kanhere, S.; Ostry, D.; Jha, S. Safety assurance and rescue communication systems in high-stress environments: A mining case study. IEEE Commun. Mag. 2010, 48, 66–73. [Google Scholar] [CrossRef]
- Moridi, M.A.; Kawamura, Y.; Sharifzadeh, M.; Chanda, E.K.; Jang, H. An investigation of underground monitoring and communication system based on radio waves attenuation using zigbee. Tunn. Undergr. Space Technol. 2014, 43, 362–369. [Google Scholar] [CrossRef]
- Jafarian, M.; Jaseemuddin, M. Routing of emergency data in a wireless sensor network for mines. In Proceedings of the IEEE International Conference on Communications, Beijing, China, 19–23 May 2008; pp. 2813–2818. [Google Scholar]
- Song, J.-L.; Gao, H.-W.; Song, Y.-J. Research on transceiver system of wsn based on v-mimo underground coal mines. In Proceedings of the 2010 International Conference on Communications and Mobile Computing (CMC), Shenzhen, China, 12–14 April 2010; pp. 374–378. [Google Scholar]
- Li, M.; Liu, Y.H. Underground coal mine monitoring with wireless sensor networks. ACM Trans. Sens. Netw. 2009, 5, 10. [Google Scholar] [CrossRef]
- Shen, G.; Zetik, R.; Thoma, R.S. Performance comparison of toa and tdoa based location estimation algorithms in los environment. In Proceedings of the 5th Workshop on Positioning, Navigation and Communication, Hannover, Germany, 27 March 2008; pp. 71–78. [Google Scholar]
- Di Stefano, G.; Petricola, A. A distributed aoa based localization algorithm for wireless sensor networks. J. Comput. 2008, 3, 1–8. [Google Scholar] [CrossRef]
- Wang, J.; Gao, Q.; Yu, Y.; Cheng, P.; Wu, L.; Wang, H. Robust device-free wireless localization based on differential rss measurements. IEEE Trans. Ind. Electron. 2013, 60, 5943–5952. [Google Scholar] [CrossRef]
- Akeila, E.; Salcic, Z.; Swain, A.; Croft, A.; Stott, J. Bluetooth-based indoor positioning with fuzzy based dynamic calibration. In Proceedings of the 2010 IEEE Region 10 Conference, Fukuoka, Japan, 21–24 November 2010; pp. 1415–1420. [Google Scholar]
- Qandour, A.; Habibi, D.; Ahmad, I. Applied application of sensor networks in underground mines. In Proceedings of the 9th IEEE International Conference on Networking, Sensing and Control (ICNSC), Beijing, China, 11–14 April 2012; pp. 256–260. [Google Scholar]
- Bychkov, I.V.; Oparin, V.N.; Potapov, V.P. Cloud technologies in mining geoinformation science. J. Min. Sci. 2014, 50, 142–154. [Google Scholar] [CrossRef]
- Niu, X.; Huang, X.; Zhao, Z.; Zhang, Y.; Huang, C.; Cui, L. The design and evaluation of a wireless sensor network for mine safety monitoring. In Proceedings of the Global Telecommunications Conference, Washington, DC, USA, 26–30 November 2007; pp. 1291–1295. [Google Scholar]
- Huang, Y.; Cheng, W.; Tang, C.; Wang, C. Study of multi-agent-based coal mine environmental monitoring system. Ecol. Indic. 2015, 51, 79–86. [Google Scholar] [CrossRef]
- Kiritsis, D. Closed-loop plm for intelligent products in the era of the Internet of Things. Comput. Aided Des. 2011, 43, 479–501. [Google Scholar] [CrossRef]
- Arduino. Arduino Mega 2560. Available online: https://www.arduino.cc/en/Main/arduinoBoardMega2560 (accessed on 28 August 2017).
- Arduino. Available online: https://www.arduino.cc/en/Guide/Introduction (accessed on 28 August 2017).
- Kriz, P.; Maly, F.; Kozel, T. Improving indoor localization using bluetooth low energy beacons. Mob. Inf. Syst. 2016, 2016, 2083094. [Google Scholar] [CrossRef]
- Ibeacon for Developers-Apple Developer. Available online: https://developer.apple.com/ibeacon/ (accessed on 12 July 2017).
- Wang, Y.; Yang, X.; Zhao, Y.; Liu, Y.; Cuthbert, L. Bluetooth positioning using rssi and triangulation methods. In Proceedings of the Consumer Communications and Networking Conference (CCNC), Las Vegas, NV, USA, 11–14 January 2013; pp. 837–842. [Google Scholar]
- National Weather Service. What Is the Heat Index? Available online: http://www.srh.noaa.gov/ama/?n=heatindex (accessed on 6 September 2017).
- Moridi, M.A.; Kawamura, Y.; Sharifzadeh, M.; Chanda, E.K.; Wagner, M.; Jang, H.; Okawa, H. Development of underground mine monitoring and communication system integrated zigbee and gis. Int. J. Min. Sci. Technol. 2015, 25, 811–818. [Google Scholar] [CrossRef]
- Coal Mine Regulations, 1926. Available online: http://www.mnm.punjab.gov.pk/system/files/COAL%20MINES%20REGULATIONS%2C%201926.doc_.pdf (accessed on 28 August 2017).
- Maxwell, N. Data Matters: Conceptual Statistics for a Random World; Key College Pub.: Charlottesville, VA, USA, 2004. [Google Scholar]
- Shahid, N.; Naqvi, I.H.; Qaisar, S.B. Characteristics and classification of outlier detection techniques for wireless sensor networks in harsh environments: A survey. Artif. Intell. Rev. 2015, 43, 193–228. [Google Scholar] [CrossRef]
- Jain, A.K. Data clustering: 50 years beyond k-means. Pattern Recognit. Lett. 2010, 31, 651–666. [Google Scholar] [CrossRef]
- Rousseeuw, P.J. Silhouettes: A graphical aid to the interpretation and validation of cluster analysis. J. Comput. Appl. Math. 1987, 20, 53–65. [Google Scholar] [CrossRef]
- Onset. Available online: http://www.onsetcomp.com/products/data-loggers/u12-012 (accessed on 6 September 2017).
- Menon, K.U.; Maria, D.; Thirugnanam, H. Power optimization strategies for wireless sensor networks in coal mines. In Proceedings of the 9th International Conference on Wireless and Optical Communications Networks (WOCN), Indore, India, 20–22 September 2012; pp. 1–5. [Google Scholar]
- Haifeng, J.; Jiansheng, Q.; Yanjing, S.; Guoyong, Z. Energy optimal routing for long chain-type wireless sensor networks in underground mines. Min. Sci. Technol. 2011, 21, 17–21. [Google Scholar] [CrossRef]
- Kandris, D.; Tsioumas, P.; Tzes, A.; Nikolakopoulos, G.; Vergados, D.D. Power conservation through energy efficient routing in wireless sensor networks. Sensors 2009, 9, 7320–7342. [Google Scholar] [CrossRef] [PubMed]
Figure 1.
Internet of Things (IoT)-based integration of technologies for early-warning safety of underground coal mines.
Figure 1.
Internet of Things (IoT)-based integration of technologies for early-warning safety of underground coal mines.
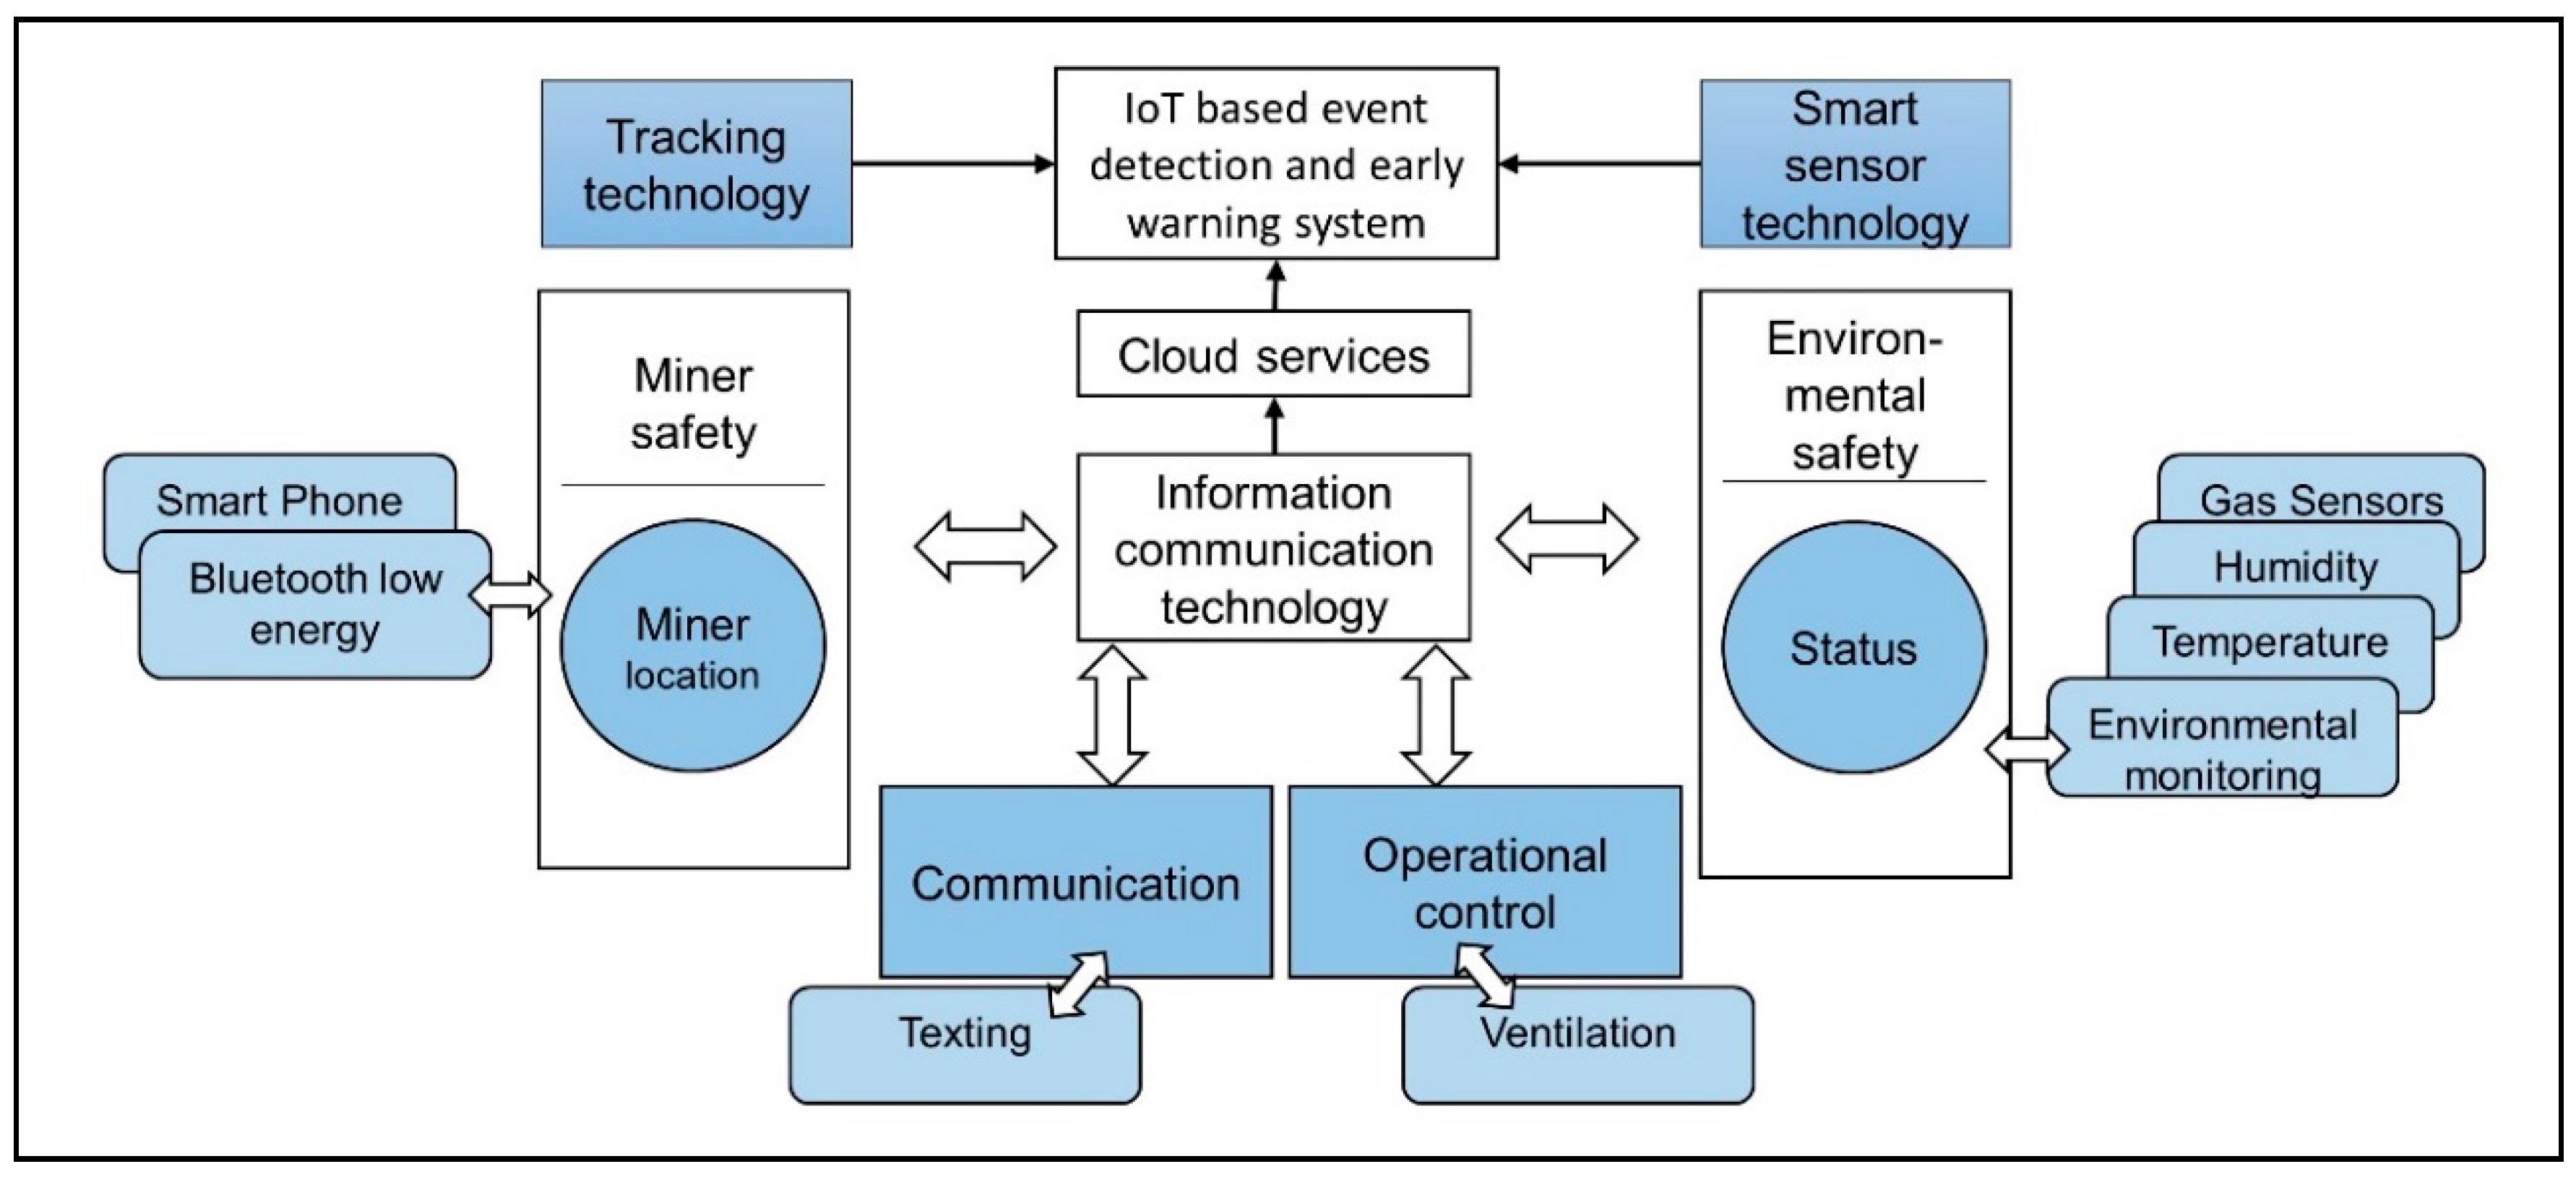
Figure 2.
Layered structure of the IoT-based early warning system in underground mines.

Figure 3.
The overall architecture of the proposed IoT system for underground mines.
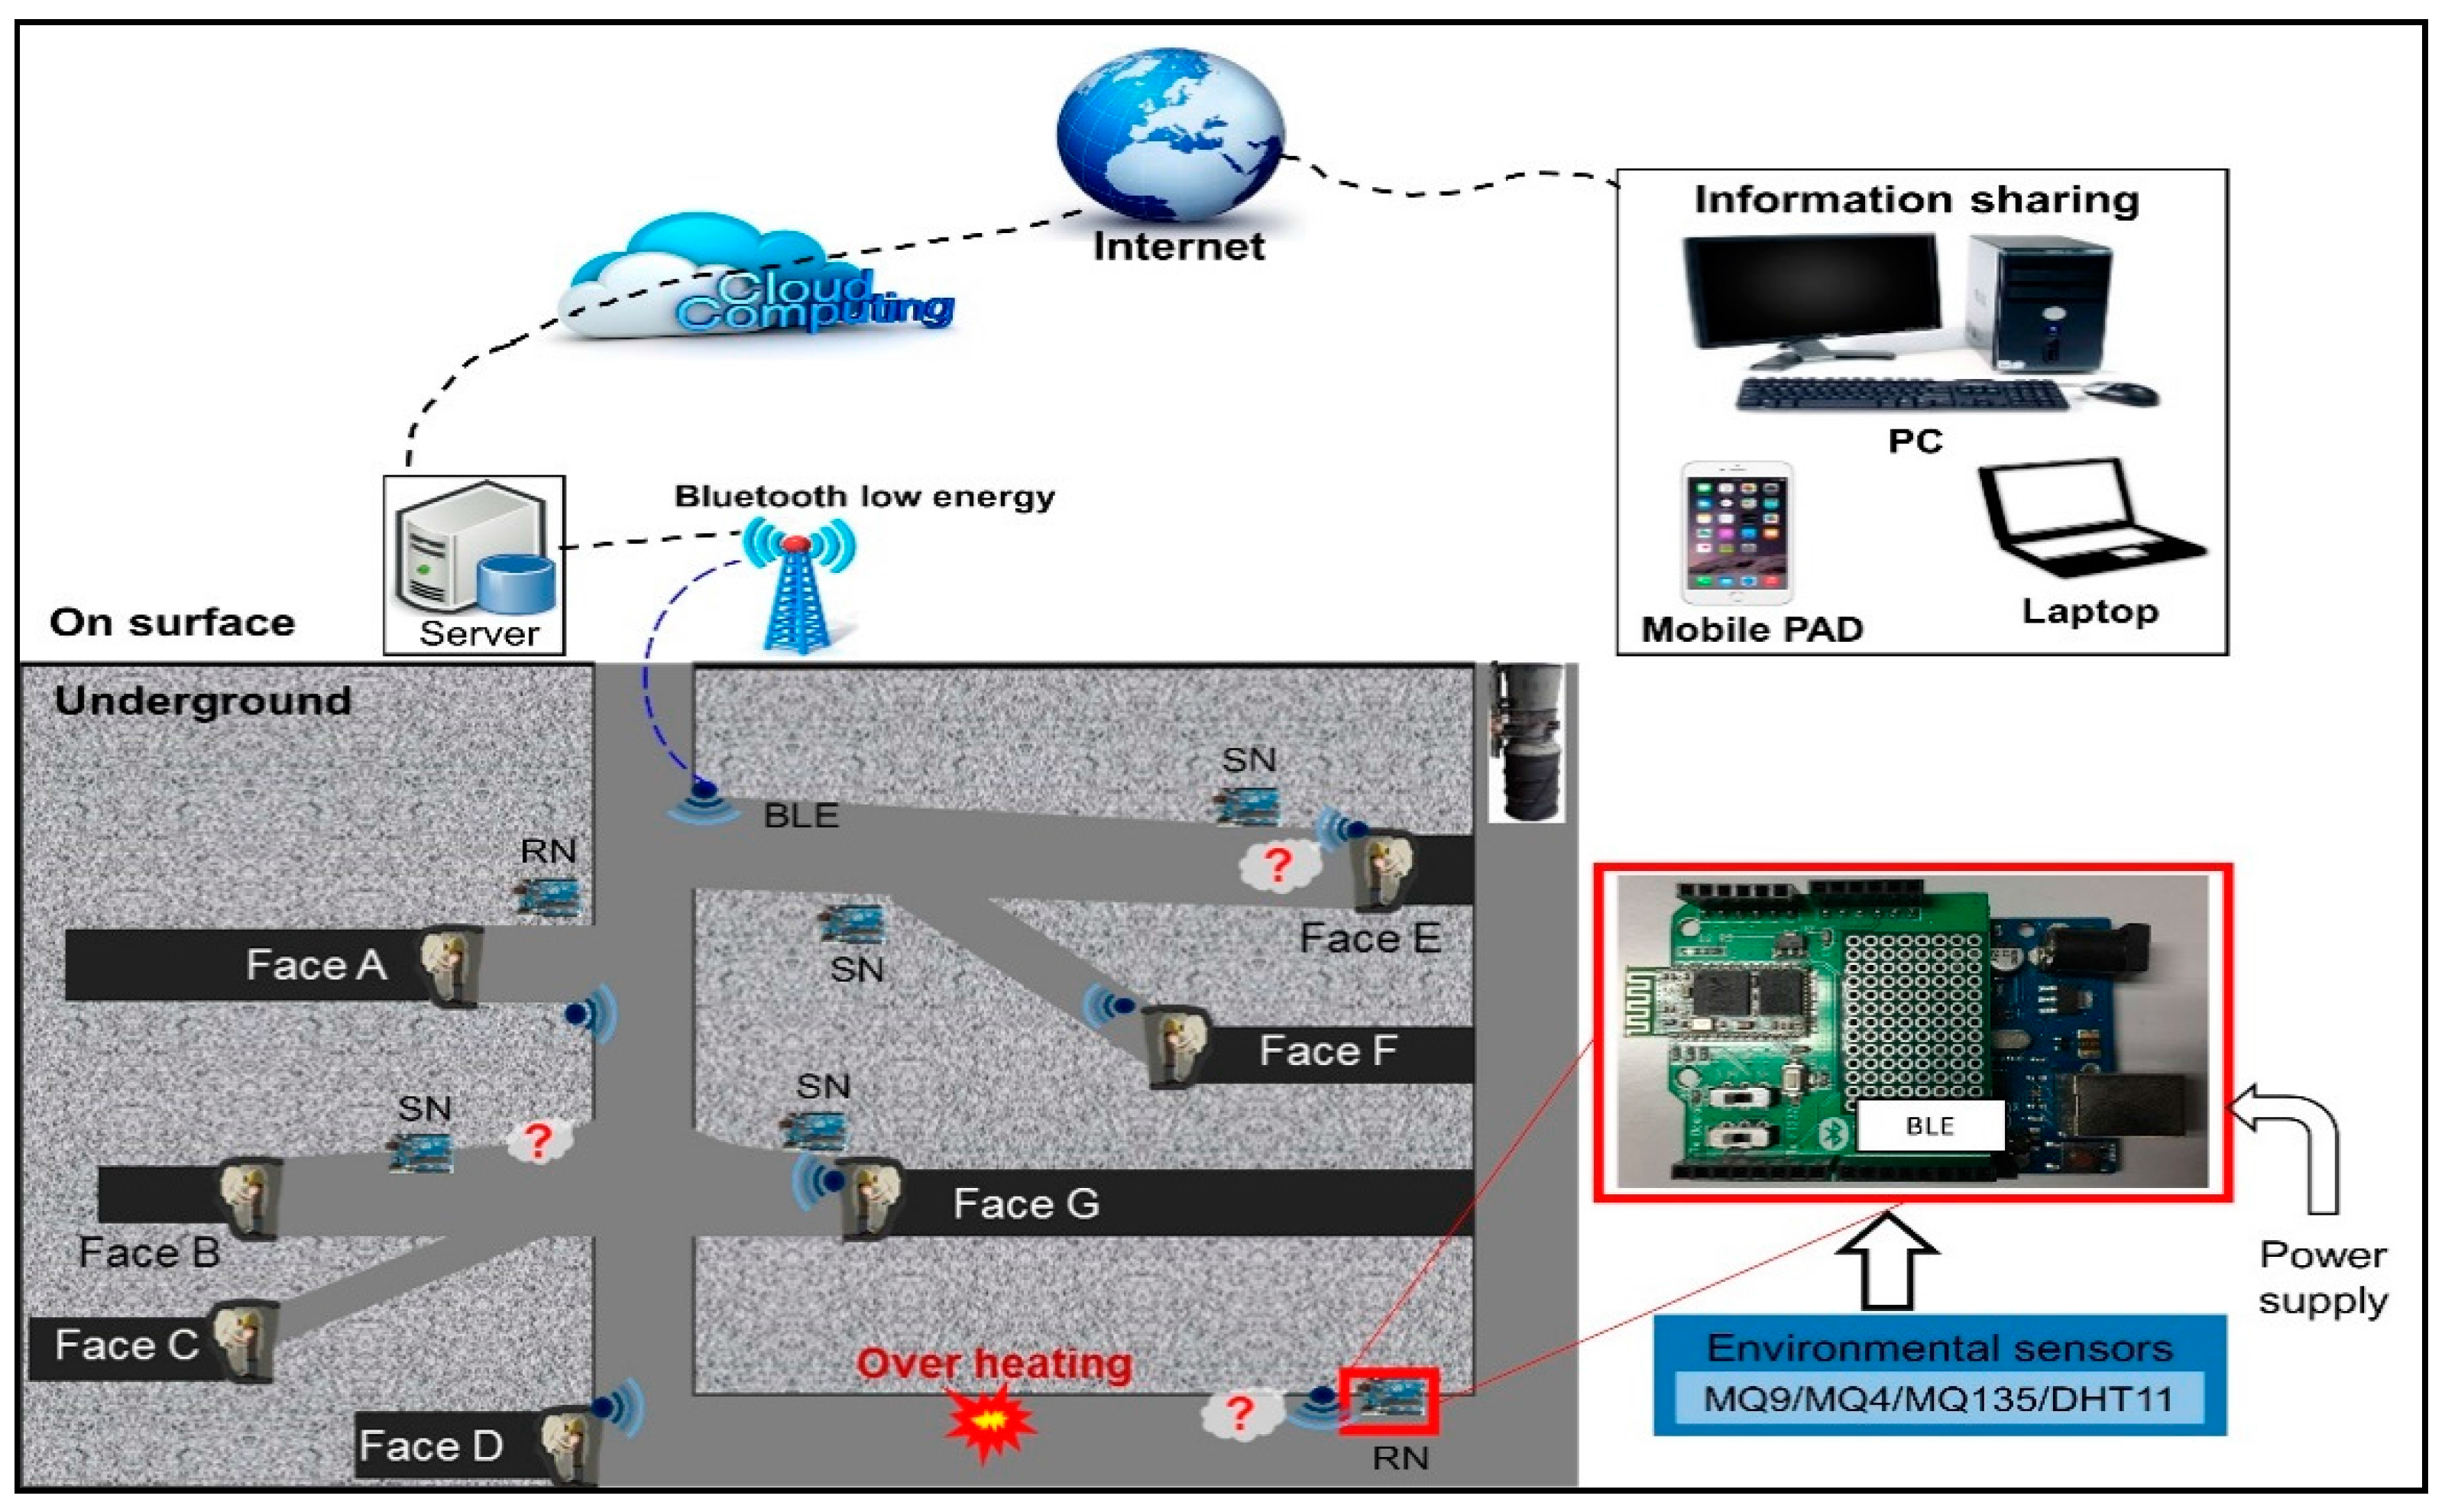
Figure 4.
(a) Arduino MEGA 2560; (b) BLE shield for Arduino; (c) photos of sensors; (d) circuit diagram of sensors attachment to Arduino MEGA 2560; (e) mobile node carried by the miners.
Figure 4.
(a) Arduino MEGA 2560; (b) BLE shield for Arduino; (c) photos of sensors; (d) circuit diagram of sensors attachment to Arduino MEGA 2560; (e) mobile node carried by the miners.

Figure 5.
A brief description of an early warning IoT-based system in mines.
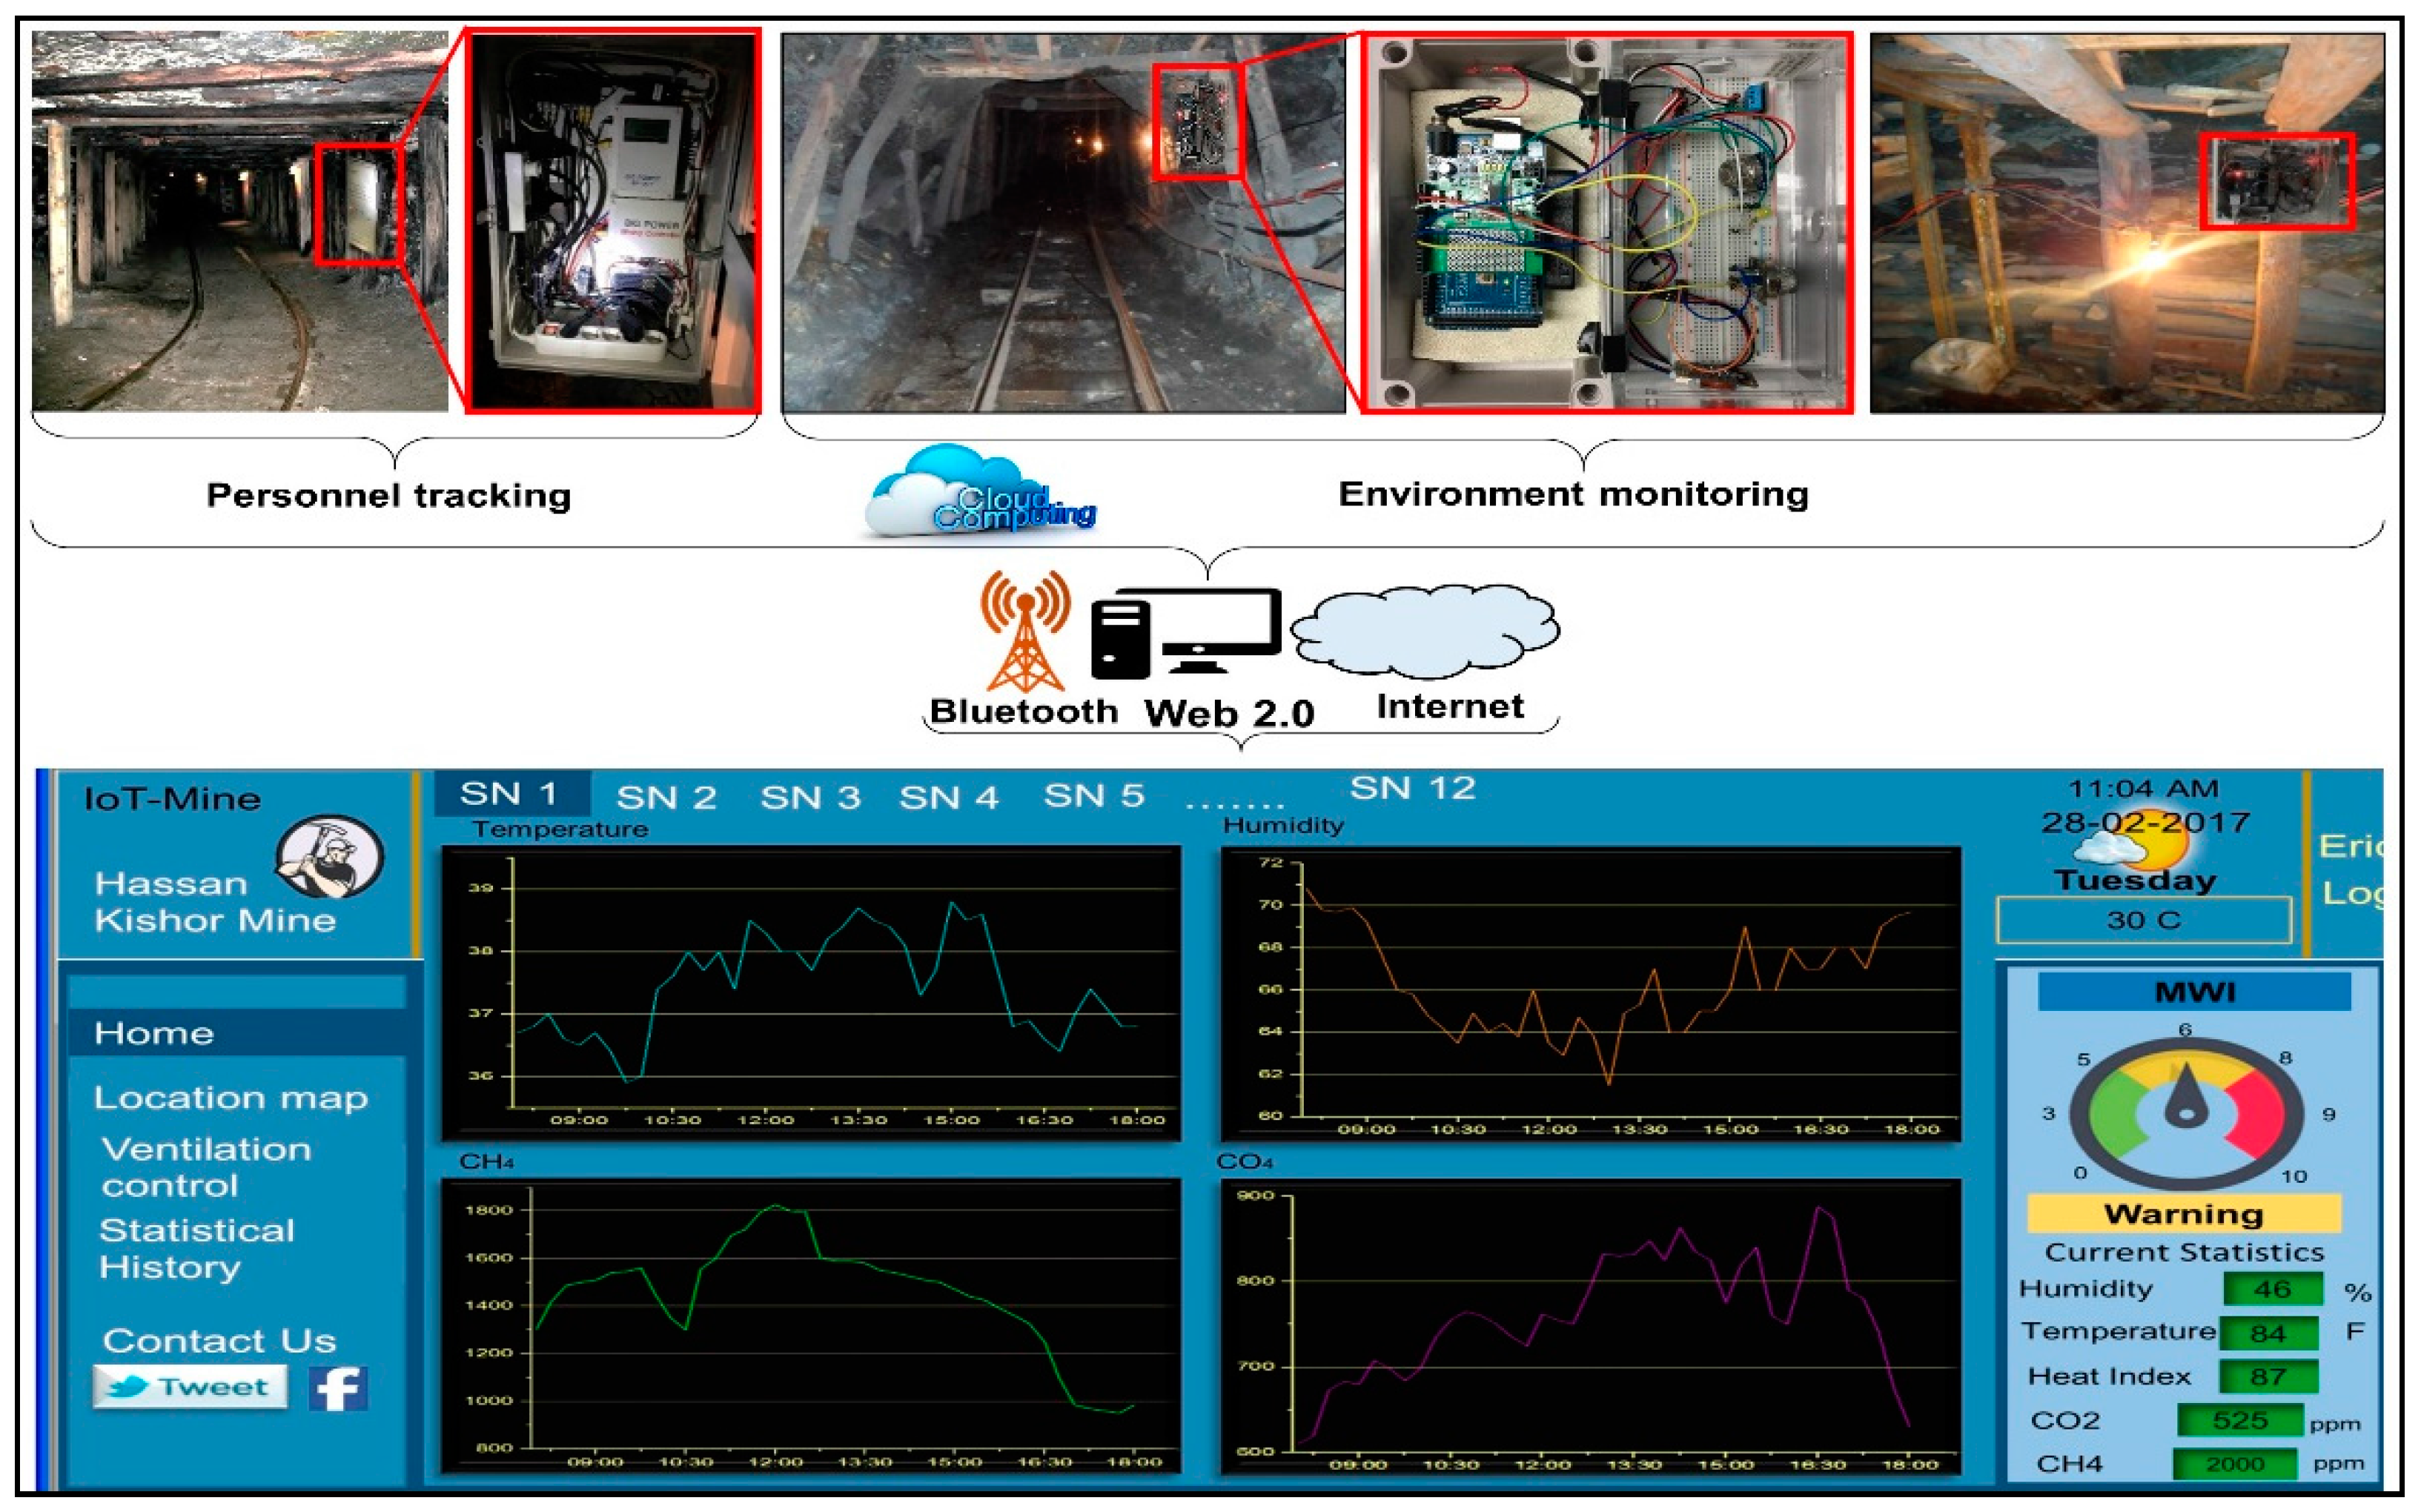
Figure 6.
Layout of SNs, RNs, gateway and moving anchor (MN) in the Hassan Kishore coal mine for enhanced safety.
Figure 6.
Layout of SNs, RNs, gateway and moving anchor (MN) in the Hassan Kishore coal mine for enhanced safety.

Figure 7.
(a) Correlation between readings of temperature at mine face 1 by our system and HOBO U12-012; (b) correlation of temperature readings at midway mine between our system and HOBO U12-012; (c) correlation of humidity at mine face 1 between our system and HOBO U12-012; (d) correlation of humidity at midway mine between our system and HOBO U12-012; (e) correlation at mine face 1 between CH4 concentrations provided by our system and Telaire 7000; (f) correlation at midway mine between CH4 concentrations provided by our system and Telaire 7000; (g) correlation of CO2 concentrations at mine face 1 between our system and Fluke CO-220; (h) correlation of CO2 concentrations at mine face 1 between our system and Fluke CO-220.

Figure 8.
K-means clustering analysis results of sensor nodes installed inside a mine during two months from December 2016 to February 2017. (a) All data with five clusters depend on the number of parameters involved; (b) Clusters for temperature data outside the mine, the midway point of the mine and at the mine face during the specified period of monitoring; (c) Clusters of humidity data monitored during specified periods outside the mine, at the midway point of the mine and at the mine face; (d) Clusters of CH4 monitored data from the midway point of the mine and at mine face 1; (e) Clusters of CO2 monitored at the midway point of the mine and at the mine face; (f) Clusters of CO monitored at the midway point and mine face.

Figure 9.
(a) Changes in receive signal strength index according to distance and (b) the distance error for various nodes.
Figure 9.
(a) Changes in receive signal strength index according to distance and (b) the distance error for various nodes.

Figure 10.
Screen shot of sensing data and information sharing based on IoT.
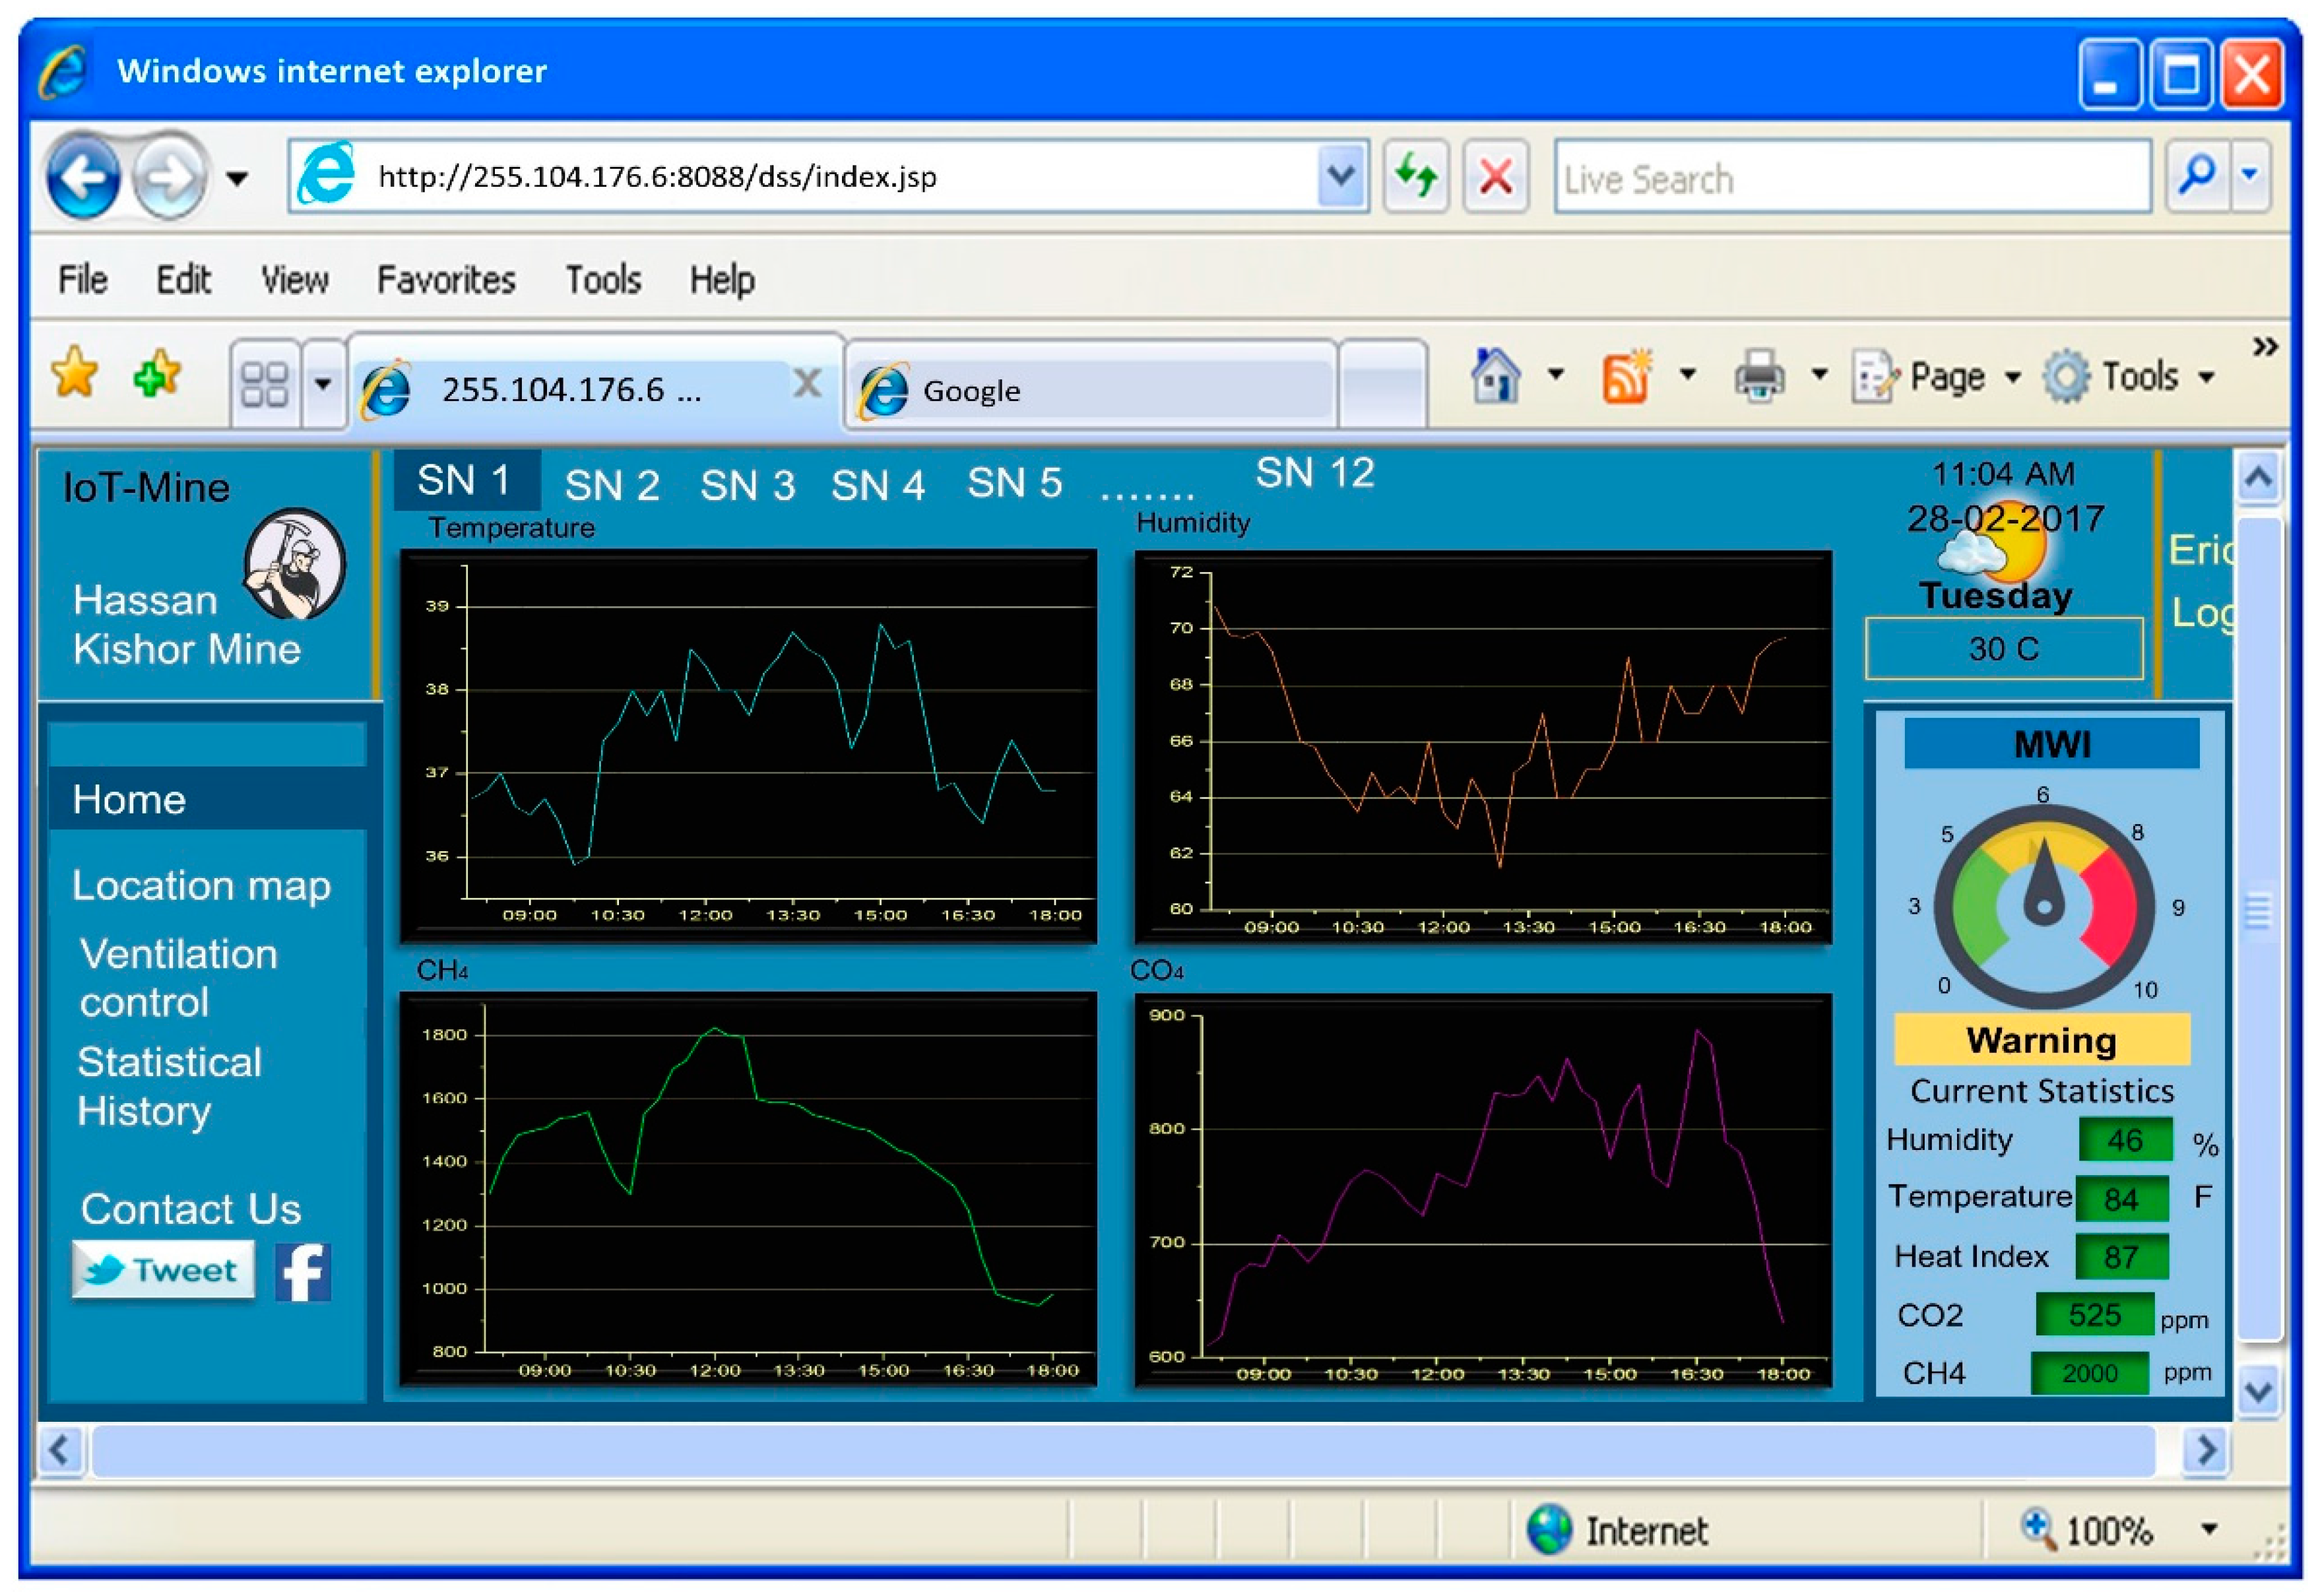
Figure 11.
Screen shot of the designed computer interface for ON/OFF switching of auxiliary fans.

Figure 12.
Comparison of representational state transfer (REST) and simple object access protocol (SOAP) in terms of (a) memory consumed and (b) response time.
Figure 12.
Comparison of representational state transfer (REST) and simple object access protocol (SOAP) in terms of (a) memory consumed and (b) response time.


Table 1.
Supporting features of the proposed system compared to the available literature.
| Previous Work | Standard Monitoring and Reporting | MWI | Intelligent Event Detection/Identification | Miner Tracking | Priority Transmission for Emergency | Distributed Processing |
|---|---|---|---|---|---|---|
| [7] | ✓ | ✓ | ||||
| [20] | ✓ | Partial | Partial | |||
| [13] | ✓ | Partial | ✓ | |||
| [27] | ✓ | Partial | ✓ | |||
| [28] | ✓ | Partial | Partial | |||
| Proposed system | ✓ | ✓ | ✓ | ✓ | ✓ | ✓ |
Table 2.
Hardware used for experiments and their specifications.
| Specification | Sensor Model | |||
|---|---|---|---|---|
| MQ-9 | MQ-4 | MQ-135 | DTH11 | |
| Voltage | 5.0 V | 5.0 V | 5.0 V | 3–5 V |
| Detection | CO and CG * | Methane | NH3, smoke, CO2 | Temperature and Humidity |
| Measurement Range | 10–1000 ppm (CO), 100–10,000 ppm (CG) | 200–1000 ppm | 10–300 ppm NH3 | 20–90% RH **, 0–50 °C |
| Accuracy | ±5% | ±5% | ±5% | ±5% RH, ±2 °C Temperature |
| Sensitive Material | SnO2 | SnO2 | SnO2 | -- |
| Configuration | 3-pin | 4-pin | 4-pin | 4-pin |
| Digital/Analog | Analog | Both | Both | Digital |
* Combustible Gas, ** Relative Humidity.
Table 3.
Threshold limit values of temperature, humidity, and toxic combustible gases based on the effect on humans.
Table 3.
Threshold limit values of temperature, humidity, and toxic combustible gases based on the effect on humans.
| MWI | Serving State | Variables | |||||
|---|---|---|---|---|---|---|---|
| HI | Temperature (T1, T2, …, Tn) (°C) | Humidity (H1, H2, …, Hn) (%) | Gases Concentrations (ppm) | ||||
| CH4 | CO | CO2 | |||||
| 0−3.5 | Normal | <90 | Ti ≤ 28 | Hi ≤ 70 | Gia ≤ 2000 | Gib ≤ 15 | Gic ≤ 2000 |
| 3.5−7.9 | Warning | 90 < Hi < 103 | 28 < Ti < 40 | 70 < Hi < 80 | 2000 < Gia < 4000 | 15 < Gib < 25 | 2000 < Gic < 5000 |
| 8−10 | Alarming | 103 < Hi < 124 | Ti ≥ 40 | Hi ≥ 80 | Gia ≥ 4000 | Gib ≥ 25 | Gic ≥ 5000 |
Table 4.
Frame format for SNs.
| 1 Byte | 1 Byte | 1Byte | Variable |
|---|---|---|---|
| RFD (0×0a) | Limit | Type | PaRm |
Table 5.
Frame format on RNs.
| 1 Byte | 1 Byte | 2 Byte | 1 Byte | Variable | … | 2 Byte | 1 Byte | Variable |
|---|---|---|---|---|---|---|---|---|
| RN (0×0b) | Num | Addr1 | Type 1 | PaRm 1 | … | Addr n | Type n | PaRm n |
Table 6.
LocalizInfo packet, field name, and size for each column.
| Pt ID | SeqF | Pt Num | Node ID | Next | … | Node ID | Next |
|---|---|---|---|---|---|---|---|
| 1 | 1 | 1 | 2 | 2 | … | 2 | 2 |
Table 7.
Stationary nodes SN and router nodes (RN) locations inside the mine (inclined lower end was considered as a reference point).
Table 7.
Stationary nodes SN and router nodes (RN) locations inside the mine (inclined lower end was considered as a reference point).
| Reader No. | Reader Type | Location | Distance from Incline Lower End (m) |
|---|---|---|---|
| 1 | GN | Incline | −23 |
| 2 | RN1 | −10 | |
| 3 | SN1 | 0 | |
| 4 | SN2 | Main roadway of mine (25 below surface) | 17 |
| 5 | RN2 | 34 | |
| 6 | SN3 | 51 | |
| 7 | SN4 | 68 | |
| 8 | RN3 | 85 | |
| 9 | SN5 | 102 | |
| 10 | SN6 | 119 | |
| 11 | RN4 | 140 | |
| 12 | SN7 | Gallery 1 | 46 |
| 13 | SN8 | 60 | |
| 14 | SN9 | Gallery 2 | 96 |
| 15 | SN10 | 110 | |
| 16 | SN11 | Gallery 3 | 151 |
| 17 | SN12 | 160 |
Table 8.
Quantitative results of parameters at the mine face shown in Figure 8.
Table 8.
Quantitative results of parameters at the mine face shown in Figure 8.
| T0 ……. T1440 | Temp. | Humidity | CH4 | CO2 | CO |
|---|---|---|---|---|---|
| Average | 36.35567 | 67.57835 | 1224.175 | 651.6824 | 2.536082 |
| Standard Error | 0.124595 | 0.24012 | 28.06941 | 12.36075 | 0.1185 |
| Median | 36.3 | 68.5 | 1185 | 656 | 3 |
| Mode | 35.9 | 69.7 | 985 | 460 | 3 |
| Standard Deviation | 1.227 | 2.364917 | 276.4516 | 121.73932 | 1.16709 |
| Skewness | 0.221967 | −0.50707 | 0.317597 | 0.07118 | −0.128 |
| Variance | 1.5058 | 5.6510 | 76176 | 351.6563 | 1.3621 |
Table 9.
Quantitative results of parameter monitoring at the midway point of the mine.
| T0 ……. T1440 | Temp. | Humidity | CH4 | CO2 | CO |
|---|---|---|---|---|---|
| Average | 32.06907 | 61.26804 | 465.3711 | 285.7732 | 2.5154 |
| Standard Error | 0.258292 | 0.5165 | 6.68 | 1.9040 | 0.119 |
| Median | 31.2 | 62 | 450 | 284 | 3 |
| Mode | 35.2 | 64 | 450 | 300 | 3 |
| Standard Deviation | 2.54388 | 5.087 | 65.8494 | 18.75 | 1.17736 |
| Skewness | 0.1108 | −0.37651 | −2.3288 | 0.366078 | −0.11685 |
| Variance | 6.4713 | 25.8857 | 4336.152 | 351.6563 | 0.5262 |
Table 10.
Distinguishing features of our proposed system in comparison to some other studies.
| Characteristics | Our System | [25] | [15] |
|---|---|---|---|
| Open-source | ✓ | ✓ | × |
| Cost-effective | ✓ | × | N/A |
| Cloud computing | ✓ | × | × |
| Multi-parameters and multiple aspects of safety | ✓ | partial | Single aspect of safety |
| Easy user interface | ✓ | ✓ | × |
| Real application | ✓ | × | × |
| Energy efficient | N/A | ✓ | N/A |
Applicable, × not applicable, N/A not available.
© 2017 by the authors. Licensee MDPI, Basel, Switzerland. This article is an open access article distributed under the terms and conditions of the Creative Commons Attribution (CC BY) license (http://creativecommons.org/licenses/by/4.0/).
Share and Cite
MDPI and ACS Style
Jo, B.W.; Khan, R.M.A. An Event Reporting and Early-Warning Safety System Based on the Internet of Things for Underground Coal Mines: A Case Study. Appl. Sci. 2017, 7, 925. https://doi.org/10.3390/app7090925
AMA Style
Jo BW, Khan RMA. An Event Reporting and Early-Warning Safety System Based on the Internet of Things for Underground Coal Mines: A Case Study. Applied Sciences. 2017; 7(9):925. https://doi.org/10.3390/app7090925
Chicago/Turabian StyleJo, Byung Wan, and Rana Muhammad Asad Khan. 2017. "An Event Reporting and Early-Warning Safety System Based on the Internet of Things for Underground Coal Mines: A Case Study" Applied Sciences 7, no. 9: 925. https://doi.org/10.3390/app7090925
Note that from the first issue of 2016, this journal uses article numbers instead of page numbers. See further details here.