Changes in Pore Structure of Coal Associated with Sc-CO2 Extraction during CO2-ECBM


1
Key Laboratory of Coal-based CO2 Capture & Geological Storage, Low Carbon Energy Institute, China University of Mining and Technology, Xuzhou 221008, China
2
Key Laboratory of Coalbed Methane Resource & Reservoir Formation History, School of Resource and Geoscience, China University of Mining and Technology, Xuzhou 221008, China
*
Author to whom correspondence should be addressed.
Appl. Sci. 2017, 7(9), 931; https://doi.org/10.3390/app7090931
Submission received: 21 August 2017
/
Revised: 5 September 2017
/
Accepted: 7 September 2017
/
Published: 10 September 2017
(This article belongs to the Special Issue The Applications of Supercritical Carbon Dioxide)
Abstract
:Supercritical CO2 (Sc-CO2), a supercritical solvent, can extract small organic molecules (fluid) from coal, changing pore structures to affect gases storage and migration in the coal matrix. Five undeformed coals before and after the second coalification jump were collected to simulate Sc-CO2 extraction performed with supercritical extraction equipment. Pore structures of the samples before and after Sc-CO2 extraction were characterized using mercury porosimetry. The results show that there are significant changes in pore size distribution of samples. ΔVMa and ΔVMe of coal samples are positive, ΔVTr and ΔVMi are positive for most coals, and ΔVMi of higher coals are negative; the ΔSMa and ΔSMe are positive with small values, the ΔSTr and ΔSMi are positive and negative before and after the second coalification jump; thus, the pore connectivity is improved. These results indicate that Sc-CO2 extraction not only increases the numbers of micropores, but also enlarges the pore diameter size; these changes in the pore structure are influenced by the second coalification. The changes in the pore structure by Sc-CO2 extraction provide more spaces for gas storage and may improve the pore throats for gas migration.
1. Introduction
The burning of fossil fuel is a primary reason for the increase of greenhouse gas CO2 concentration in the atmosphere and the exacerbation of global warming. To reduce CO2 emissions, a mitigation strategy that consists of CO2 capture and sequestration (CCS) is employed. Currently, three types of geological formations that have received extensive consideration for the geological sequestration of CO2 are deep saline formations, oil and gas reservoirs, and deep unmineable coal seams [1,2,3,4]. CO2 Enhanced Coalbed Methane recovery (CO2-ECBM) is a technique that combines CO2 sequestration and enhanced coalbed methane recovery. The implementation of this technique and its commercial value have been studied via different projects over the past 20 years [5,6].
According to the results of previous studies [7,8], coal structure is characterized as a dual pore system that includes the primary porosity consisting of microspores, transitional pores, and mesopores in the coal matrix, and the second porosity composed of non-uniformly distributed macropores and microfractures. During the process of CO2-ECBM, CO2 is distributed into the coal seam through the coal cleat system and then stored within the coal matrix due to the stronger affinity between CO2 and the coal substance [9,10,11]. Previous studies have also shown that there are various physical and geochemical interactions between CO2 and coals, such as gas adsorption on the coal internal surface [9,10,11,12,13,14], coal matrix swelling due to gas adsorption [15,16,17], and CO2 reaction with minerals [18,19,20].
In most cases, the depths of the coal seams used for CO2-ECBM are greater than 800 m, and the temperature and the pressure of coal seams are greater than the supercritical state of CO2 (Tc = 31.1 °C, Pc = 7.38 MPa). Hence, CO2 is injected into coal seams in its supercritical state. At this stage, Sc-CO2 fluid can extract small organic matters from the coal matrix to make the coal properties change. The components of organic matters of Sc-CO2 extraction have been tested from geochemistry [21,22]; however, few studies have focus on examining the effect of supercritical CO2 (Sc-CO2) extraction on the physical structure change of coal and its influence on the CO2 sequestration in coal seams. Therefore, in this work, we focus on changes in the pore structure and the connectivity of five undeformed coals before and after the second coalification jump when they are exposed to Sc-CO2 environments that are typical conditions of CO2-ECBM.
2. Materials and Methods
2.1. Coal Samples
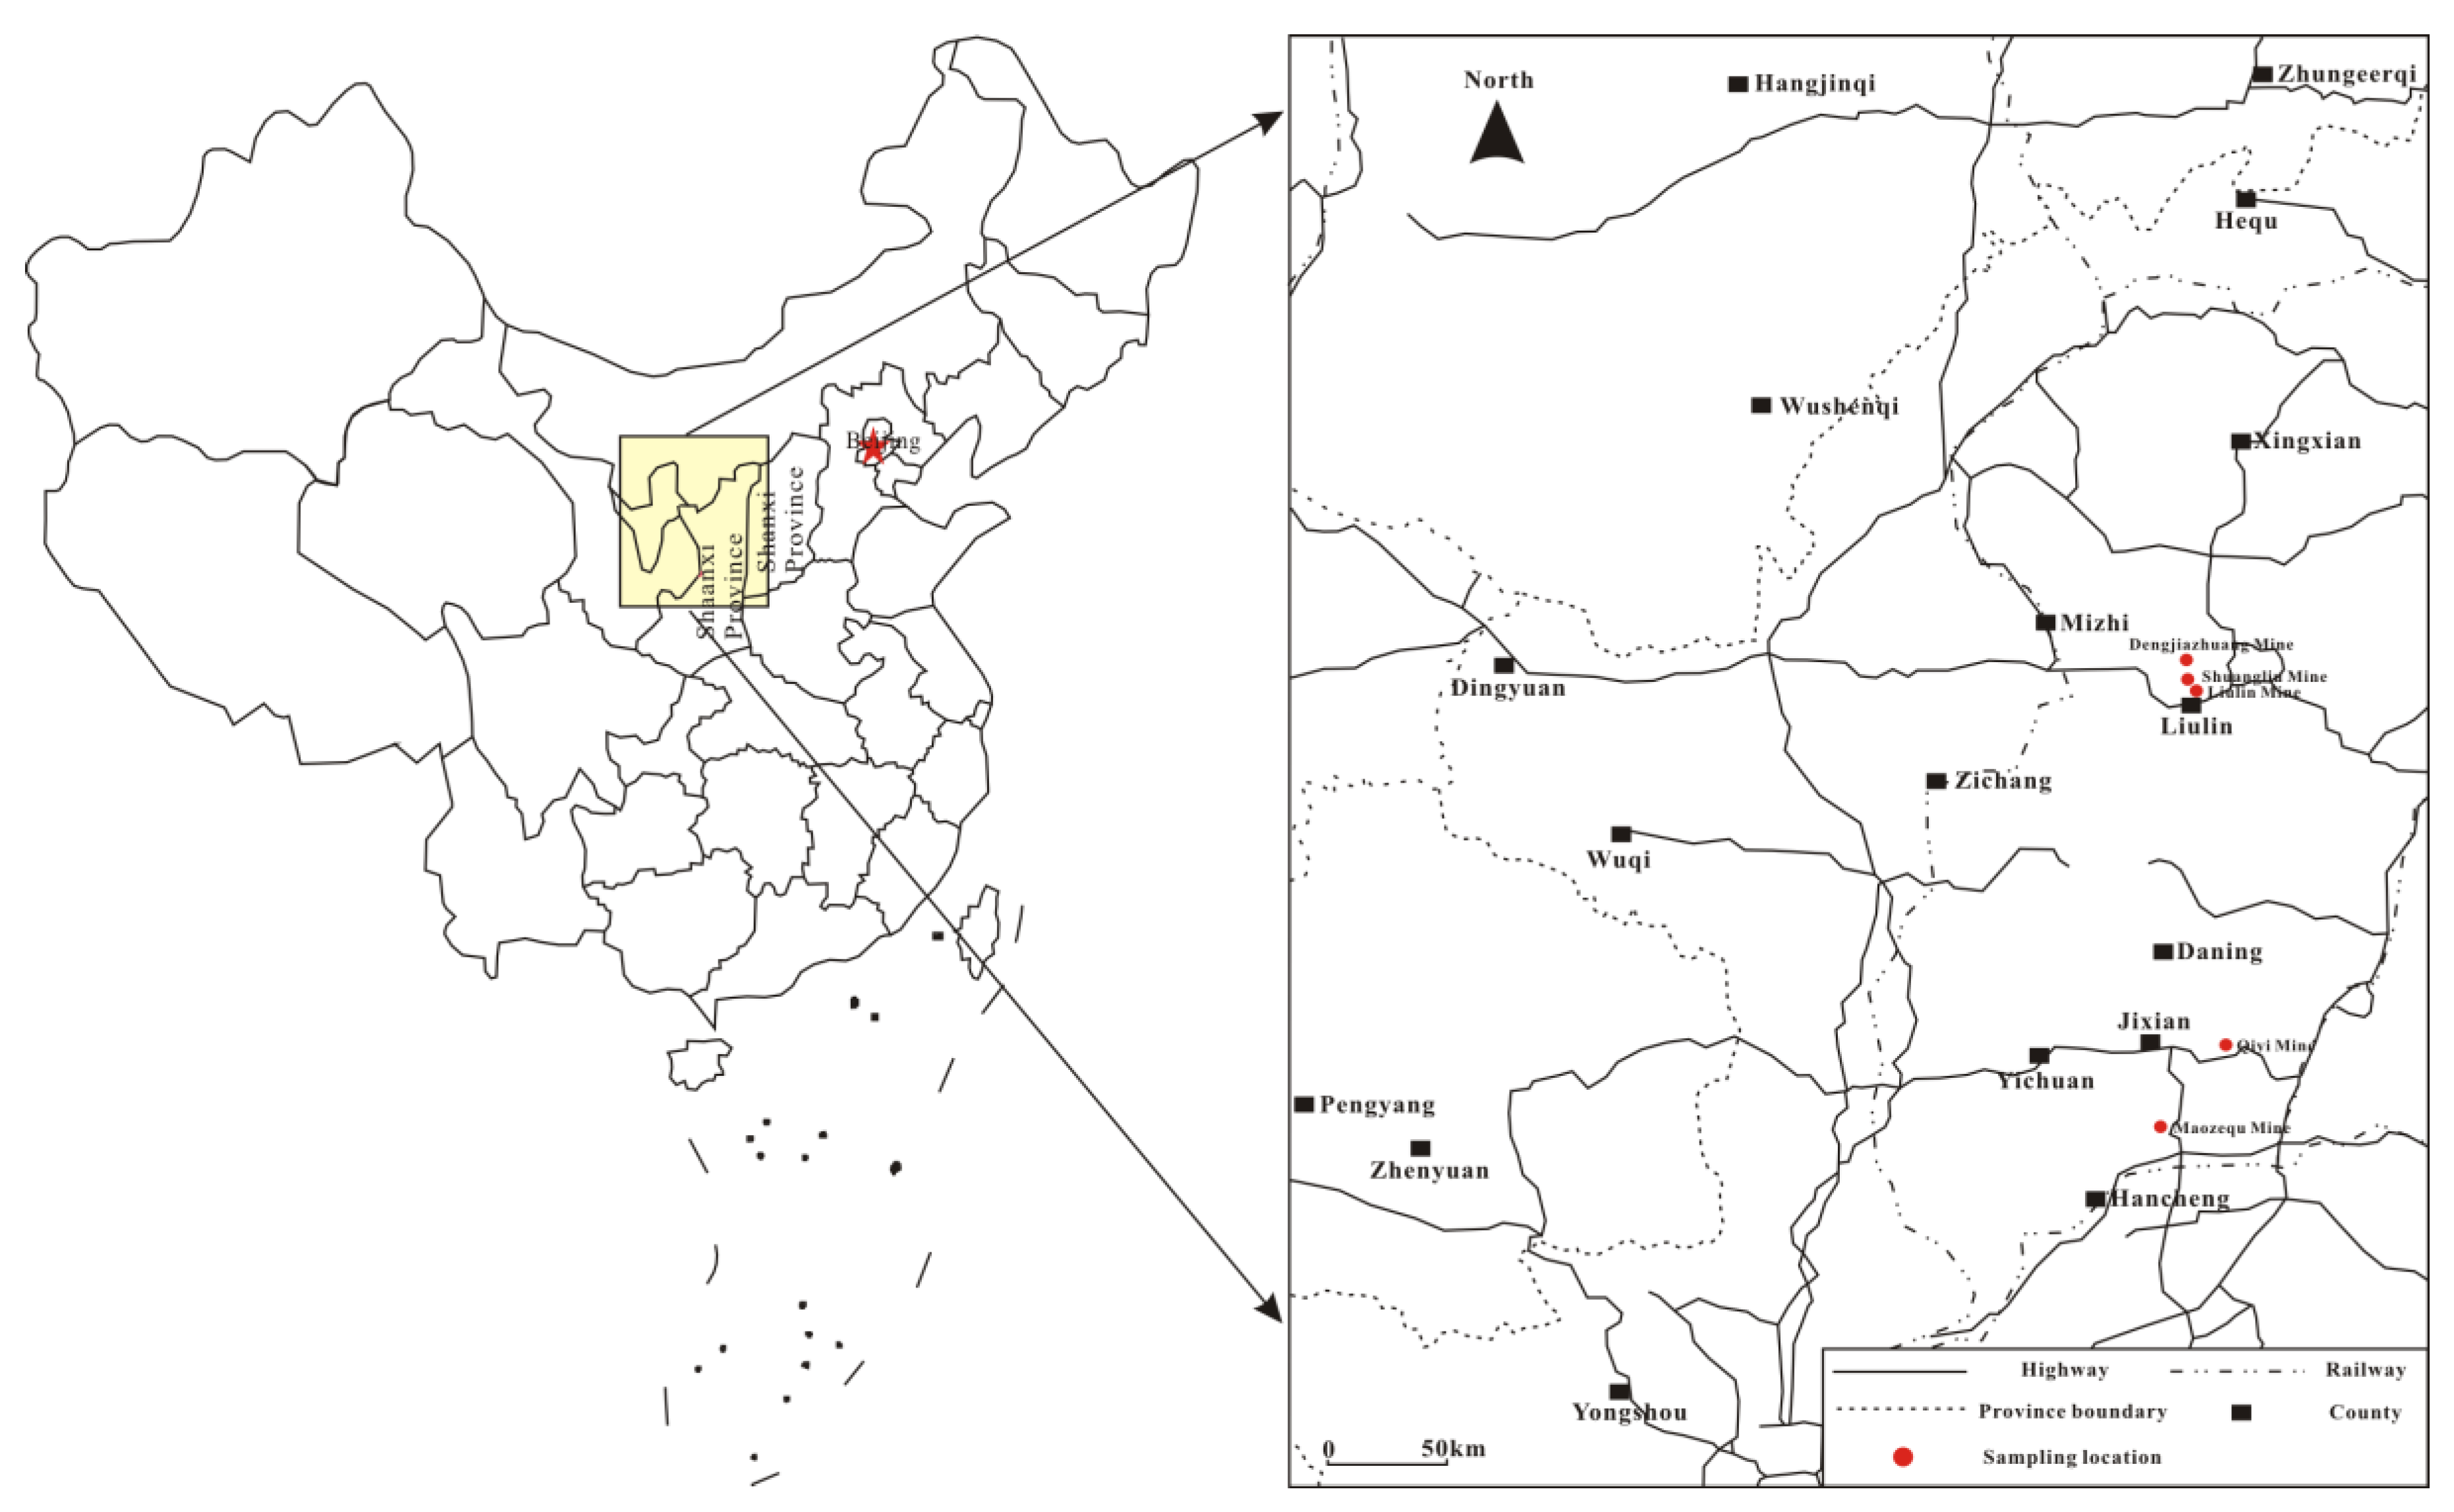
Ordos Basin is a large stable craton basin, which is rich in coal, oil, gas, and other energy sources formed in marine facies, marine-terrigenous/continental facies, and continental facies. The geological structure is relatively simple in this basin. The outcrops are Archean, Erathern, Cambrian, Ordovician, Carboniferous, Permian, Trias, Neogene, and Quaternary from the east to the west [23,24].
The main coal-bearing strata are the strata of the Carboniferous–Permian, and the thickness of the Carboniferous–Permian coal-bearing strata are approximately 764 m on average. The formations of Benxi, Taiyuan, Shanxi, Lower Shihezi, Upper Shihezi, and Shiqianfeng are the main coal-bearing formations, which consist principally of coal, limestone, siltstone, and sandstone. The Formations of Shanxi and Taiyuan are mainly concentrated economic coals and coalbed methane resources [25]. The coal seams of the Shanxi Formation, No. 5 and Taiyuan Formation, No. 8 are the main mined coal seams and have large thickness, stable distribution, and low to medium coal rank. The total thickness of the coal seams in the Carboniferous–Permian strata increases from east to west and varies from 5 to 22.8 m.
The pore structure of coal is determined by the coal rank [7,8,26], and is affected by the geological structure [27]. To investigate the influence of coal rank to Sc-CO2 extraction and avoid the influence of geological structure, five samples that were evenly distributed around the second coalification jump were collected from undeformed Permian coal seams at the southeast margin of Ordos Basin (Figure 1). The physical properties of the coals that were used are shown in Table 1. The maximum vitrinite reflectance under oil immersion (Ro,max) of the coals varies from 0.79% to 1.80%. For the vitrinite, it varies from 56.84% to 78.40%; for the inertinite, it varies from 14.87% to 37.71%; for the exinite, it varies from 2.36% to 5.48%; as for minerals, it varies from 1.25% to 10.0%. The proximate analysis showed that the equilibrated moisture varies from 0.83% to 4.34%, the ash yields varies from 6.57% to 11.36%, and the volatile matter varies from 20.31% to 31.05% for the five coal samples.
To avoid oxidation during the transportation of specimens and the time required to carry out Sc-CO2 extraction, the coal samples were stored in vacuum packagied, sealed plastic bags. Theoretically, bigger size coal samples are better for simulating Sc-CO2 extraction in situ conditions, but bigger size coal samples require a long time to reach the equilibrium of extraction and solution. On the other hand, smaller size coal samples induce difficulty for pore structure with mercury intrusion. So, to mediate the limitations of the two extreme sizes, coal samples were sieved into grain size (20~60 mesh) using a SPARTAN pulverisette before the experiment. After that, coal samples were sorted into two parts. One part was dried in an air oven at 80 °C for 12 h and then used for mercury intrusion measurements. The other part was exposed to Sc-CO2 extraction followed by the same drying and mercury intrusion measurement applied to the first part of the coal samples.
2.2. Sc-CO2 Extraction
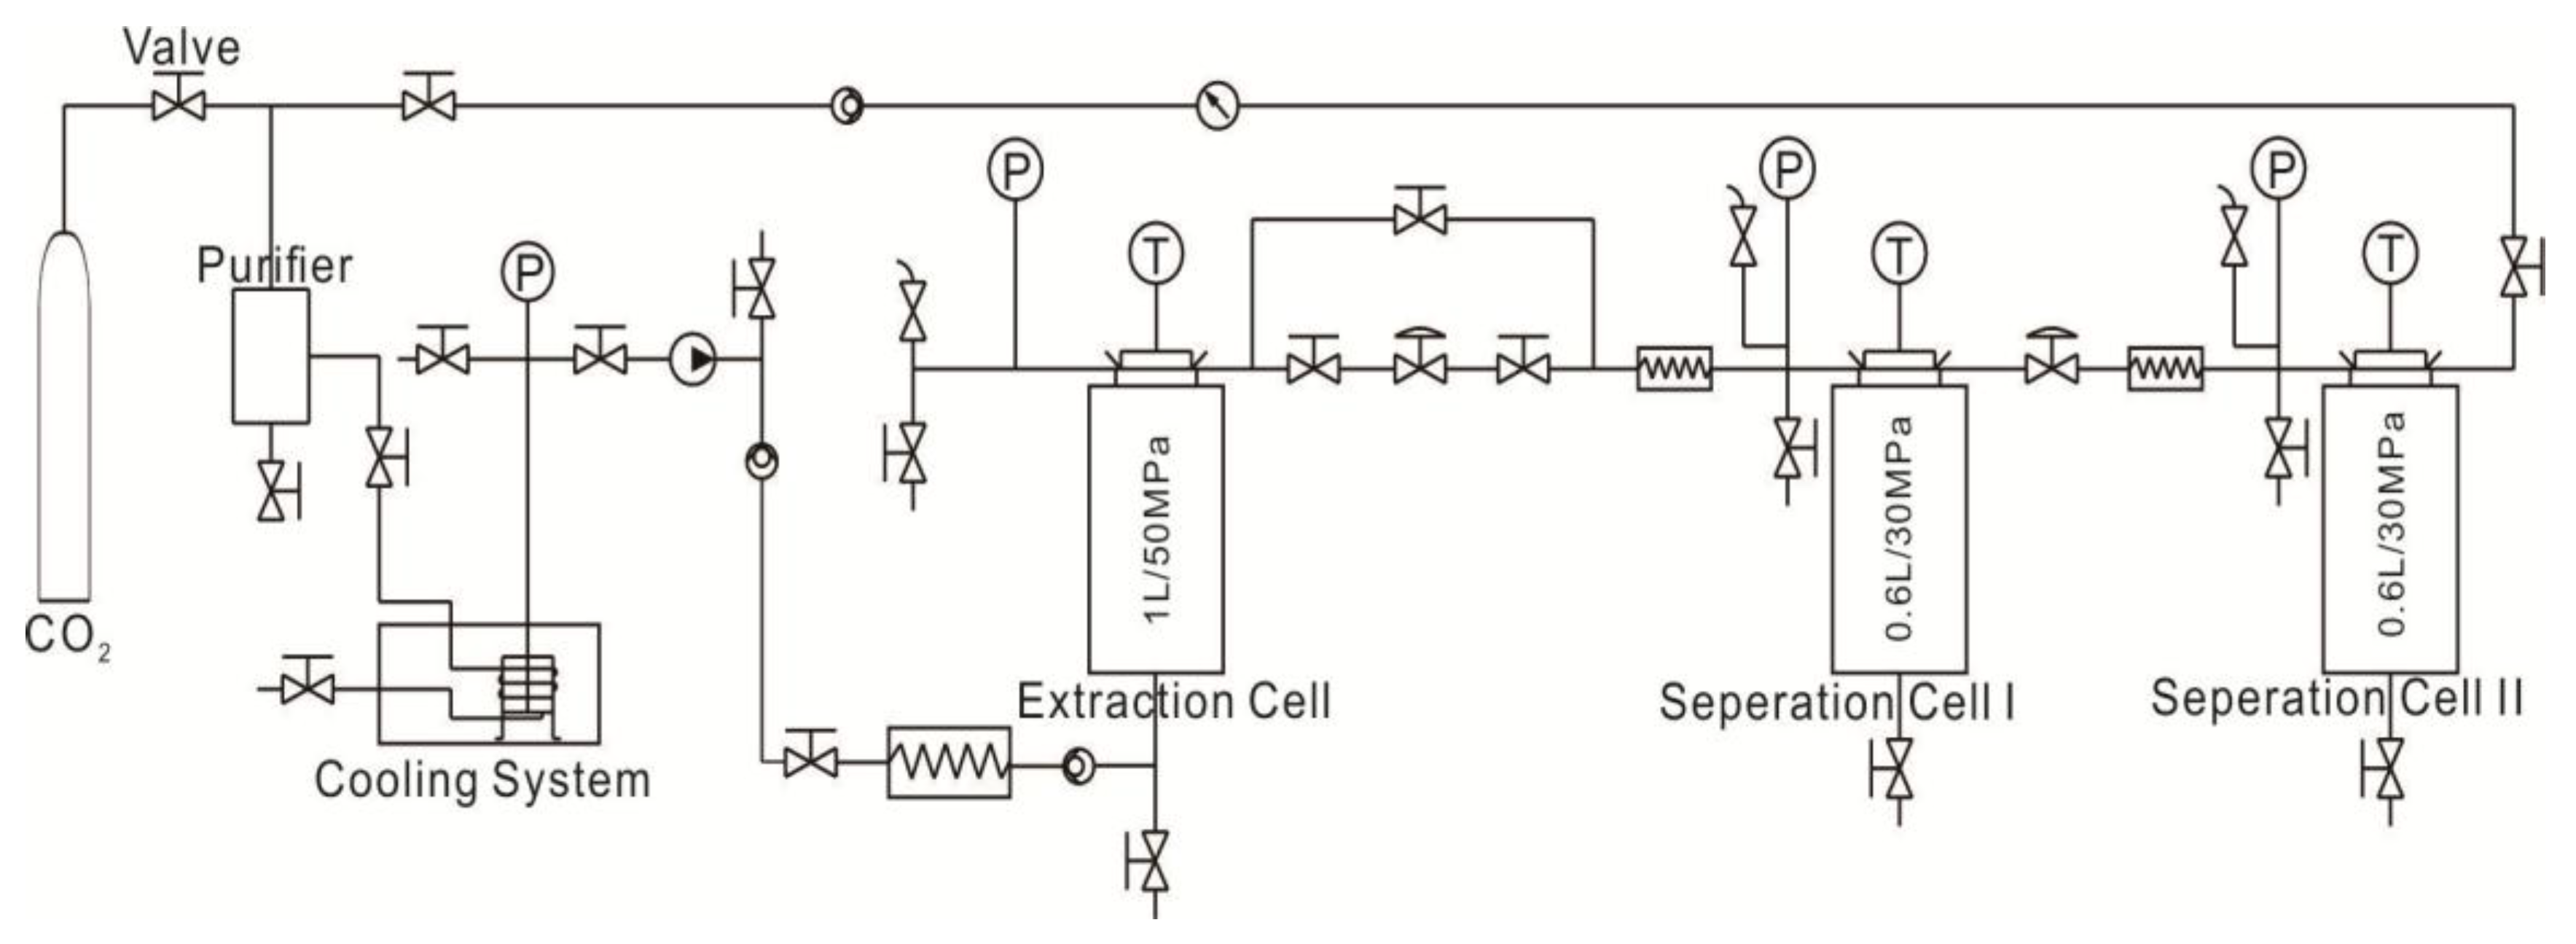
The Sc-CO2 extraction of coals were conducted via HA Supercritical Extractor/Reactor produced by Nantong Haian Supercritical Extraction Instrument Co. LTD (Nantong, China). The equipment can bear a maximum pressure of 50 MPa and a maximum temperature of 300 °C. The flow chart of Sc-CO2 extraction is shown in Figure 2. The operations are as follows:
(1) The extraction cell was opened and ~100 g dried sample was put into the supercritical extraction cell, which was then covered with the cauldron and the screws were tightened to ensure a good seal.
(2) The CO2 gas cylinder valve was opened to allow the CO2 gas flow through the purifier and the cooling system, after which it was eventually compressed into the extraction cell. After the pressure and temperature of the cell were adjusted to ~10 MPa and 40 °C, the CO2 gas cylinder valve was closed to ensure that the extraction cell remained under the designed condition. The temperature and pressure were monitored throughout the process.
(3) After 24 h of Sc-CO2 extraction, the supercritical equipment was shut down, the gas was released to bring the pressure of the extraction cell to the atmospheric pressure, the coal sample was collected after the extraction cell was cooled to room temperature, the separation cells were washed by a solvent, and the waste liquid was collected for testing.
2.3. Mercury Porosimetry
In this study, pore size distribution, surface area, and pore connectivity were investigated via AutoPore IV 9500 Mercury Porosimetry produced by Micromeritics Instrument Corp (Norcross, GA, USA). Mercury porosimetry is based on the capillary flow governing liquid penetration into small pores. This law, in the case of a non-wetting liquid such as mercury, is expressed by the Washburn equation [28]:
where D is the diameter of the pore, P is the applied pressure, is the surface tension of mercury, and is the contact angle between the mercury and the sample, all in consistent units. The volume of mercury V penetrating the pores is measured directly as a function of applied pressure. This P-V information serves as a unique characterization of the pore structure. In this study, mercury filling was permitted at pressures from 700 Pa to 414 MPa, and a surface tension of 0.48 N/m and a contact angle of 130° between mercury and coal were used.
3. Results and Discussion
3.1. Pore Size Distribution of Coal before and after Sc-CO2 Extraction
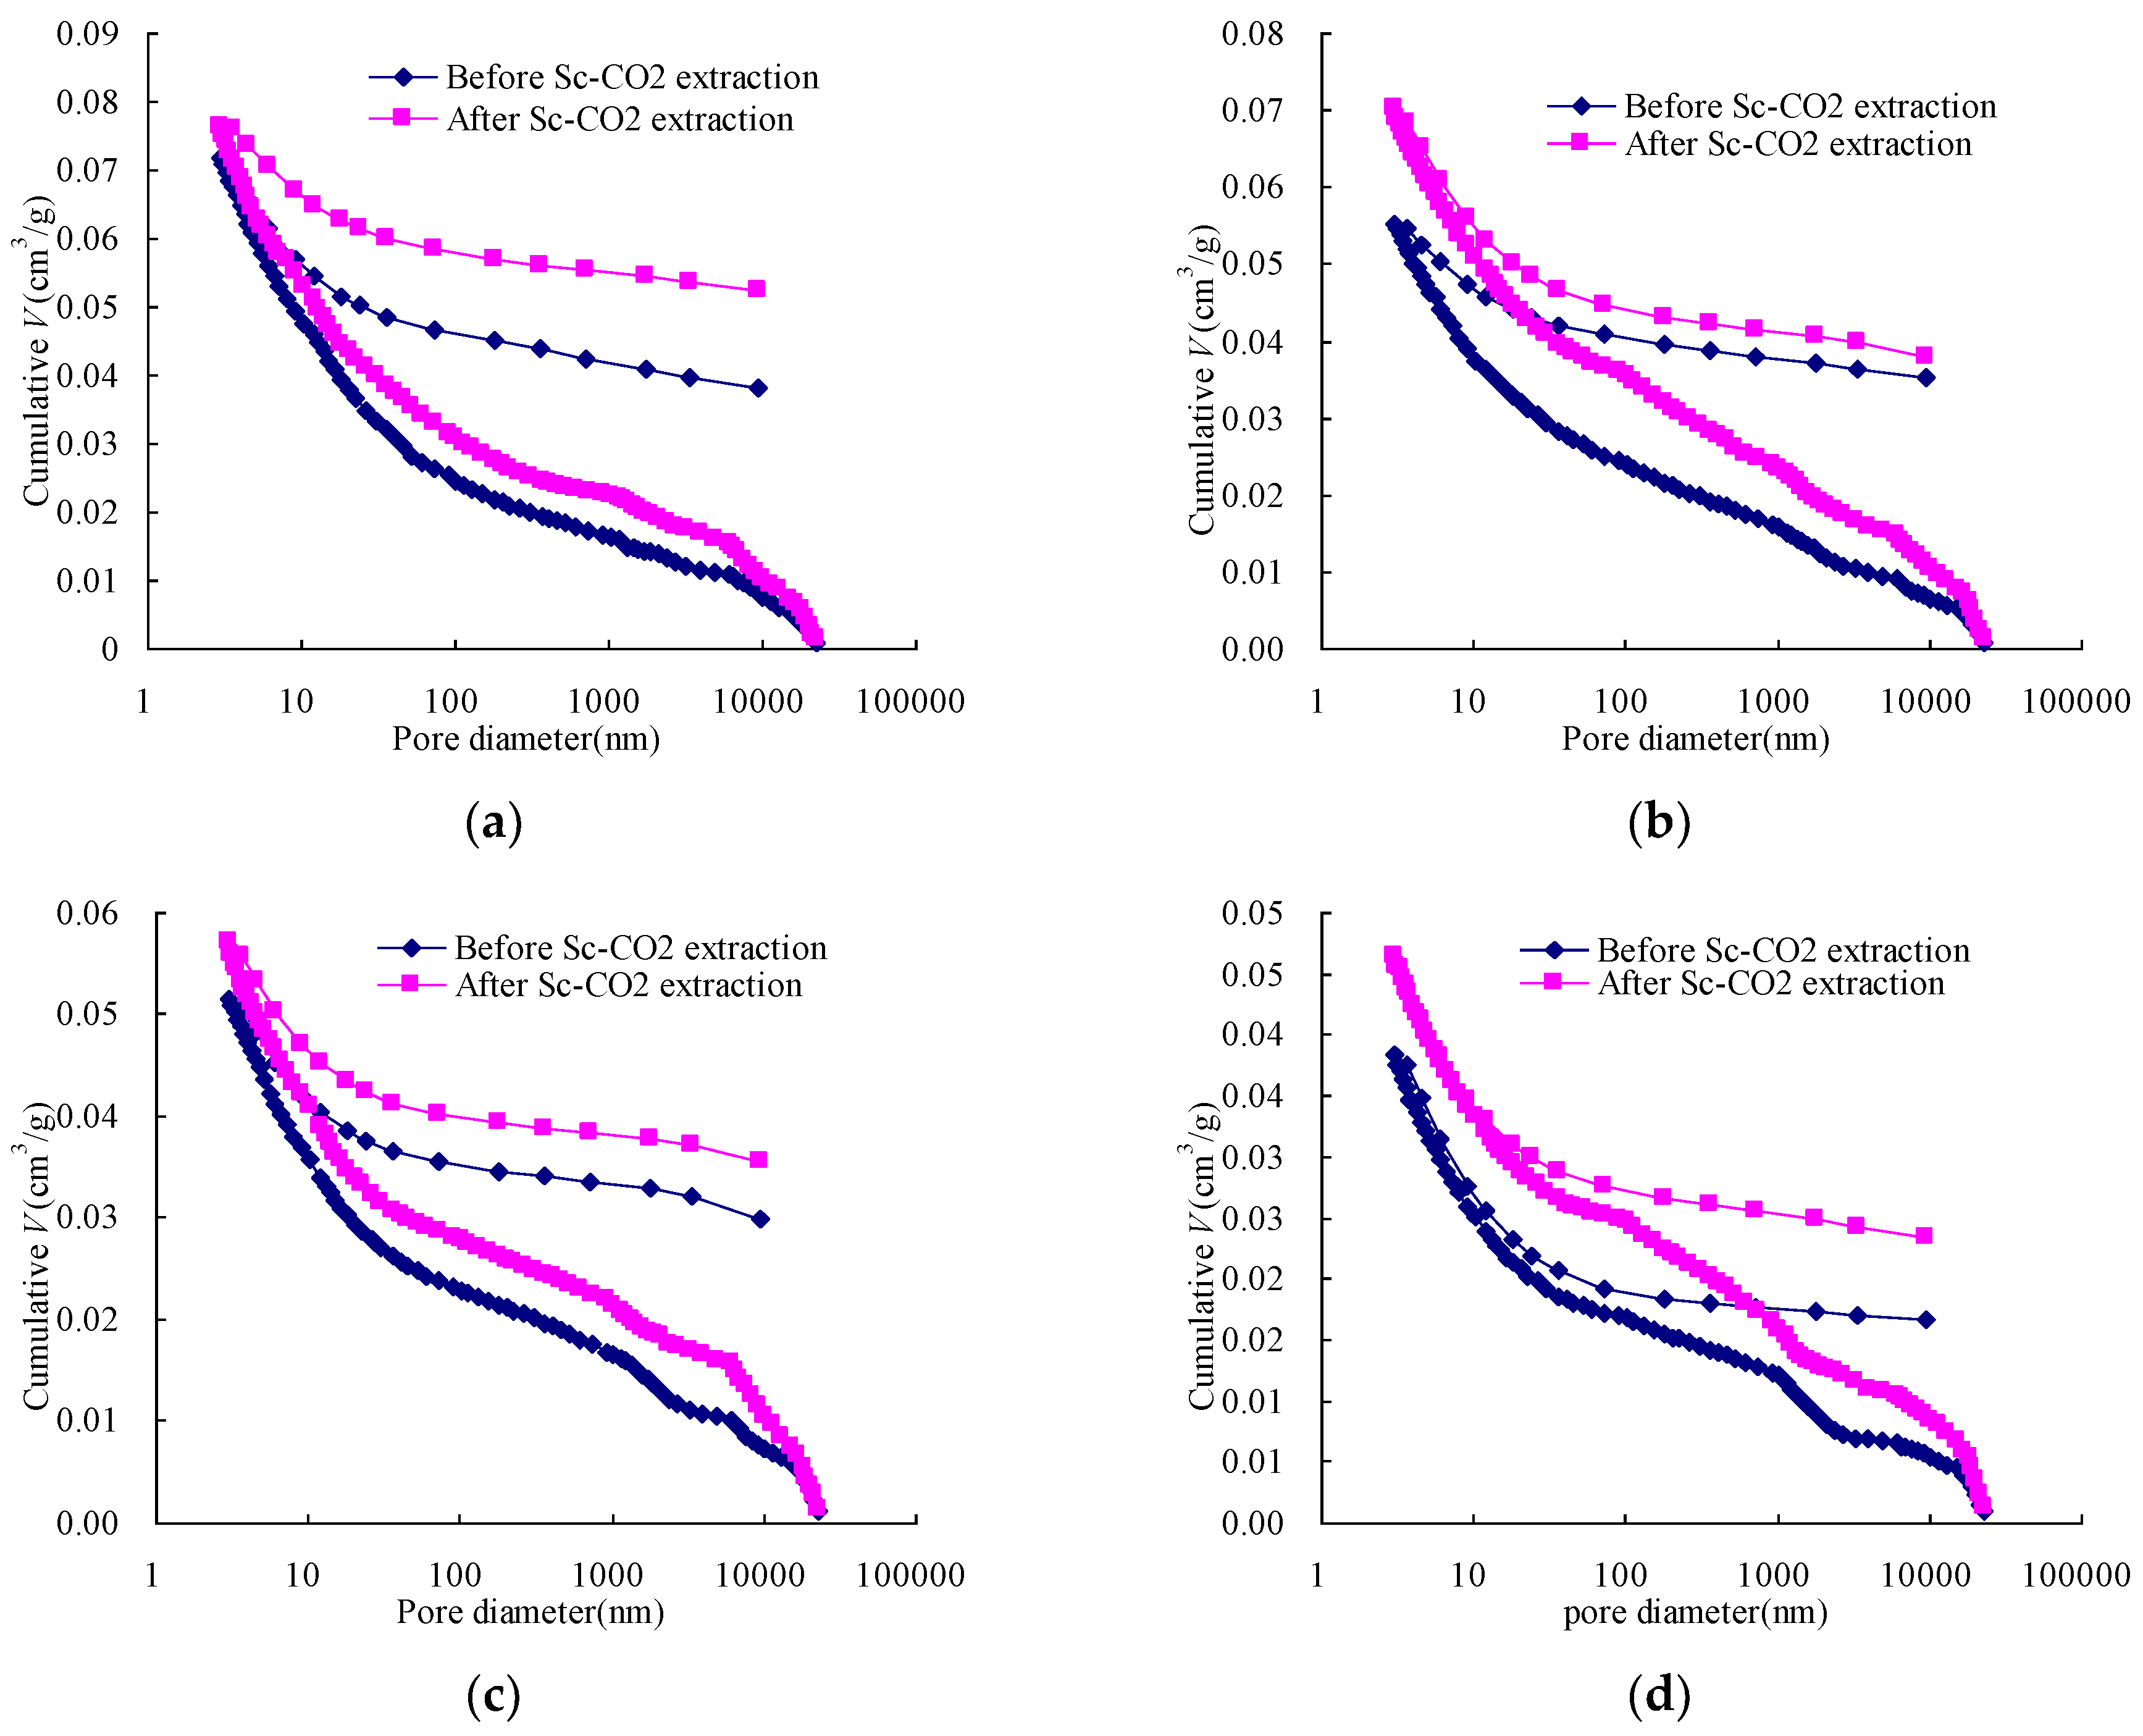
The pore size distributions of raw and Sc-CO2 extracted coal are shown in Figure 3. According to previous study [7,8], macro- and mesopores decrease and micropores increase with an increase in coalification. In this study, the volume percentages of the macro- and mesopores were very high, especially for high rank coals. This is likely because the gaps between the sample particles were tested. Hence, a modified Hodot classification [29] was used in this study, and the pores that were over 10,000 nm in diameter were eliminated to reduce the interference of the gaps on the pore distribution between sample particles. The classification is shown as follows: macropore (>1000 nm), mesopore (100~1000 nm), transitional pore (10~100 nm), and micropore (≤10 nm).
Previous study [30] showed that when the pressure becomes large enough, the mercury no longer intrudes into the pores and the coal is compressed to some extent, which make the incremental pore volume change suddenly. In this work, the incremental pore volumes of samples before and after the Sc-CO2 extraction showed such a sudden change when the pore diameter reduced to a particular range. This indicates that the samples were compressed around the points.
Figure 3 shows significant changes in the pore size distribution of samples by Sc-CO2 extraction. The volumes of incremental big pores increased after Sc-CO2 extraction, perhaps mainly caused by the pore size enlargement, while the increase of incremental small pores volumes was mainly caused by the increasing number of pores. This indicates that Sc-CO2 extraction not only increases the number of micropores, but also enlarges the pore diameter size. As mentioned above, the change in micropore size distribution was not only due to the characteristics of micropores but also caused by the compressibility of all of the samples.
3.2. The Changes in Pore Volume and Surface Area
The volumes and surface areas of the pores are tabulated in Table 2. To determine the changes in pore volumes and surface area that is due to Sc-CO2 extraction, ΔV and ΔS were defined by the following equations, respectively:
where ΔV is the pore volume change due to Sc-CO2 extraction, cm3/g; VA is the pore volume of the sample after the Sc-CO2 extraction, cm3/g; VB is the pore volume of the sample before the Sc-CO2 extraction, cm3/g; ΔS is the pore surface area change due to the Sc-CO2 extraction, m2/g; SA is the pore surface area of the sample after the Sc-CO2 extraction, m2/g; and SB is the pore surface area of the sample before the Sc-CO2 extraction, m2/g.
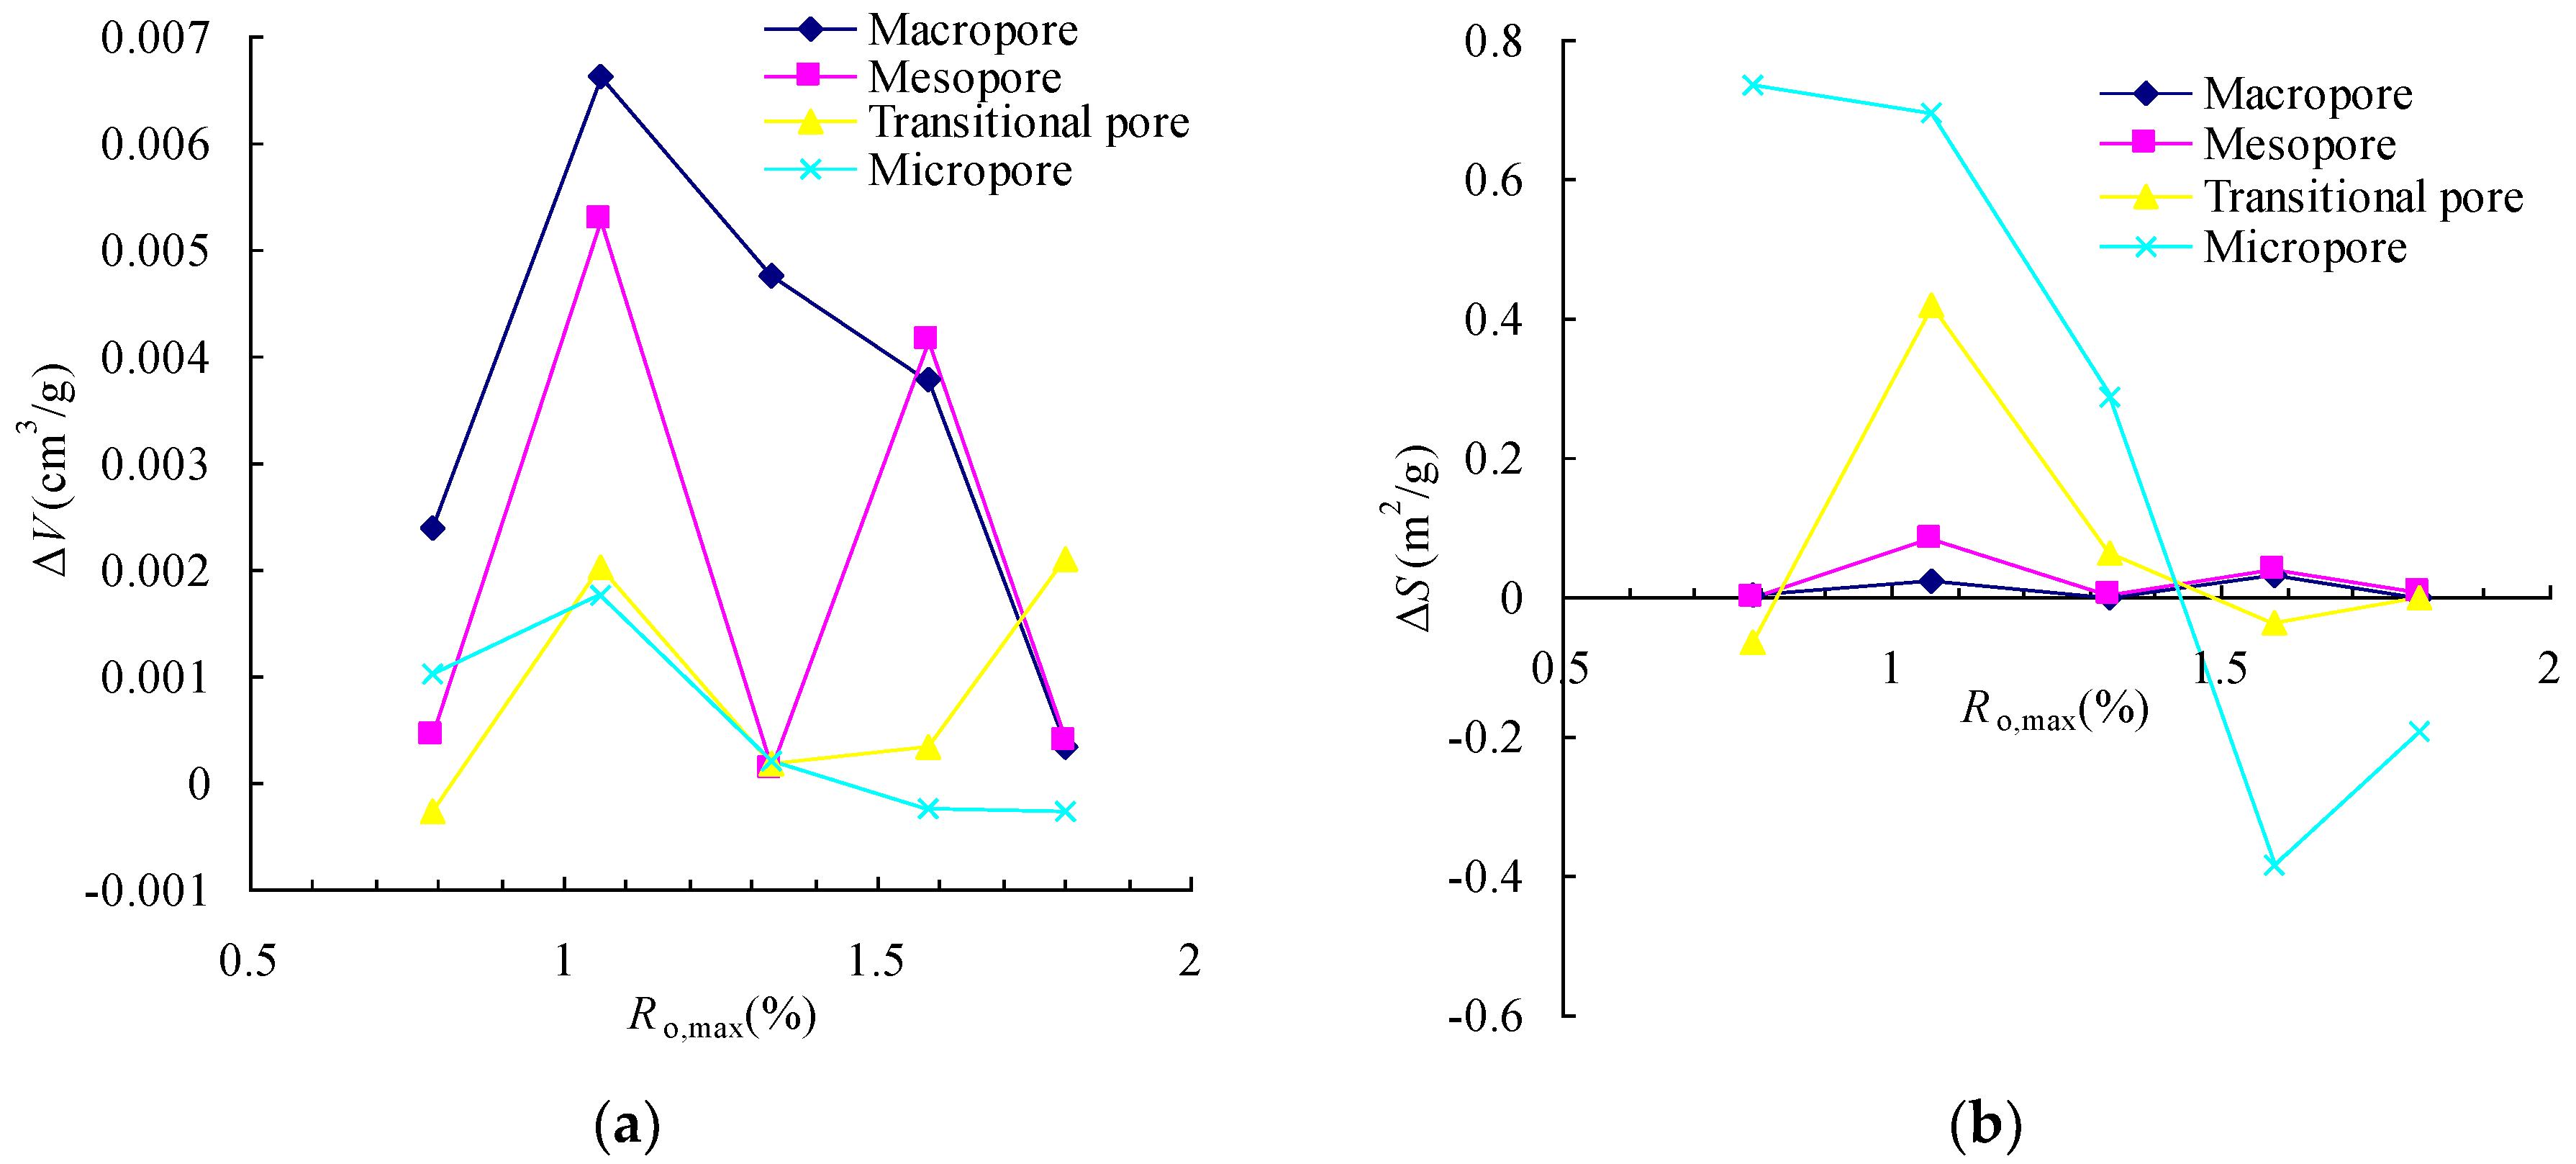
Table 2 and Figure 4a show that the ΔVMa and ΔVMe of the coal are positive, and most of ΔVTr and ΔVMi are positive, indicating that the Sc-CO2 extraction causes the incremental pore volume to increase, and the incremental macropore volume makes up most of the total pore volume. From Figure 4a, it can be seen that the changes in the incremental macropore and mesopore volumes fluctuate with coal rank before and after the second coalification. The change in the incremental transitional pore volume has an overall increasing trend when coal rank increases, while the change in the incremental micropore volume first increases and then decreases.
Table 2 and Figure 4b show that the ΔSMa and ΔSMe are positive with small values, the ΔSTr and ΔSMi are positive and negative before and after the second coalification jump; this indicates that the Sc-CO2 extraction causes the incremental micropore surface area to change significantly, and that the incremental micropore surface area is the mainly contributor to the total pore surface area.
Some studies [7,8] have provided evidence that significant changes in pore structures occur during coalification. At the early stage, aliphatic groups containing oxygen link the multilayered stacks and are not yet dissipated as volatiles in the coalification. Pore structures are compressed as the coalification increases, and thus the aliphatic groups begin to dissipate and fill the pores and cause the size of micropores to be reduced. As maturation advances, oxygen-containing compounds and other volatiles are lost. Therefore, the changes in pore structure are very significant near the second coalification jump by Sc-CO2 extraction. This indicates that the changes in pore structure due to Sc-CO2 extraction are controlled by the coalification.
3.3. The Changes in Pore Connectivity
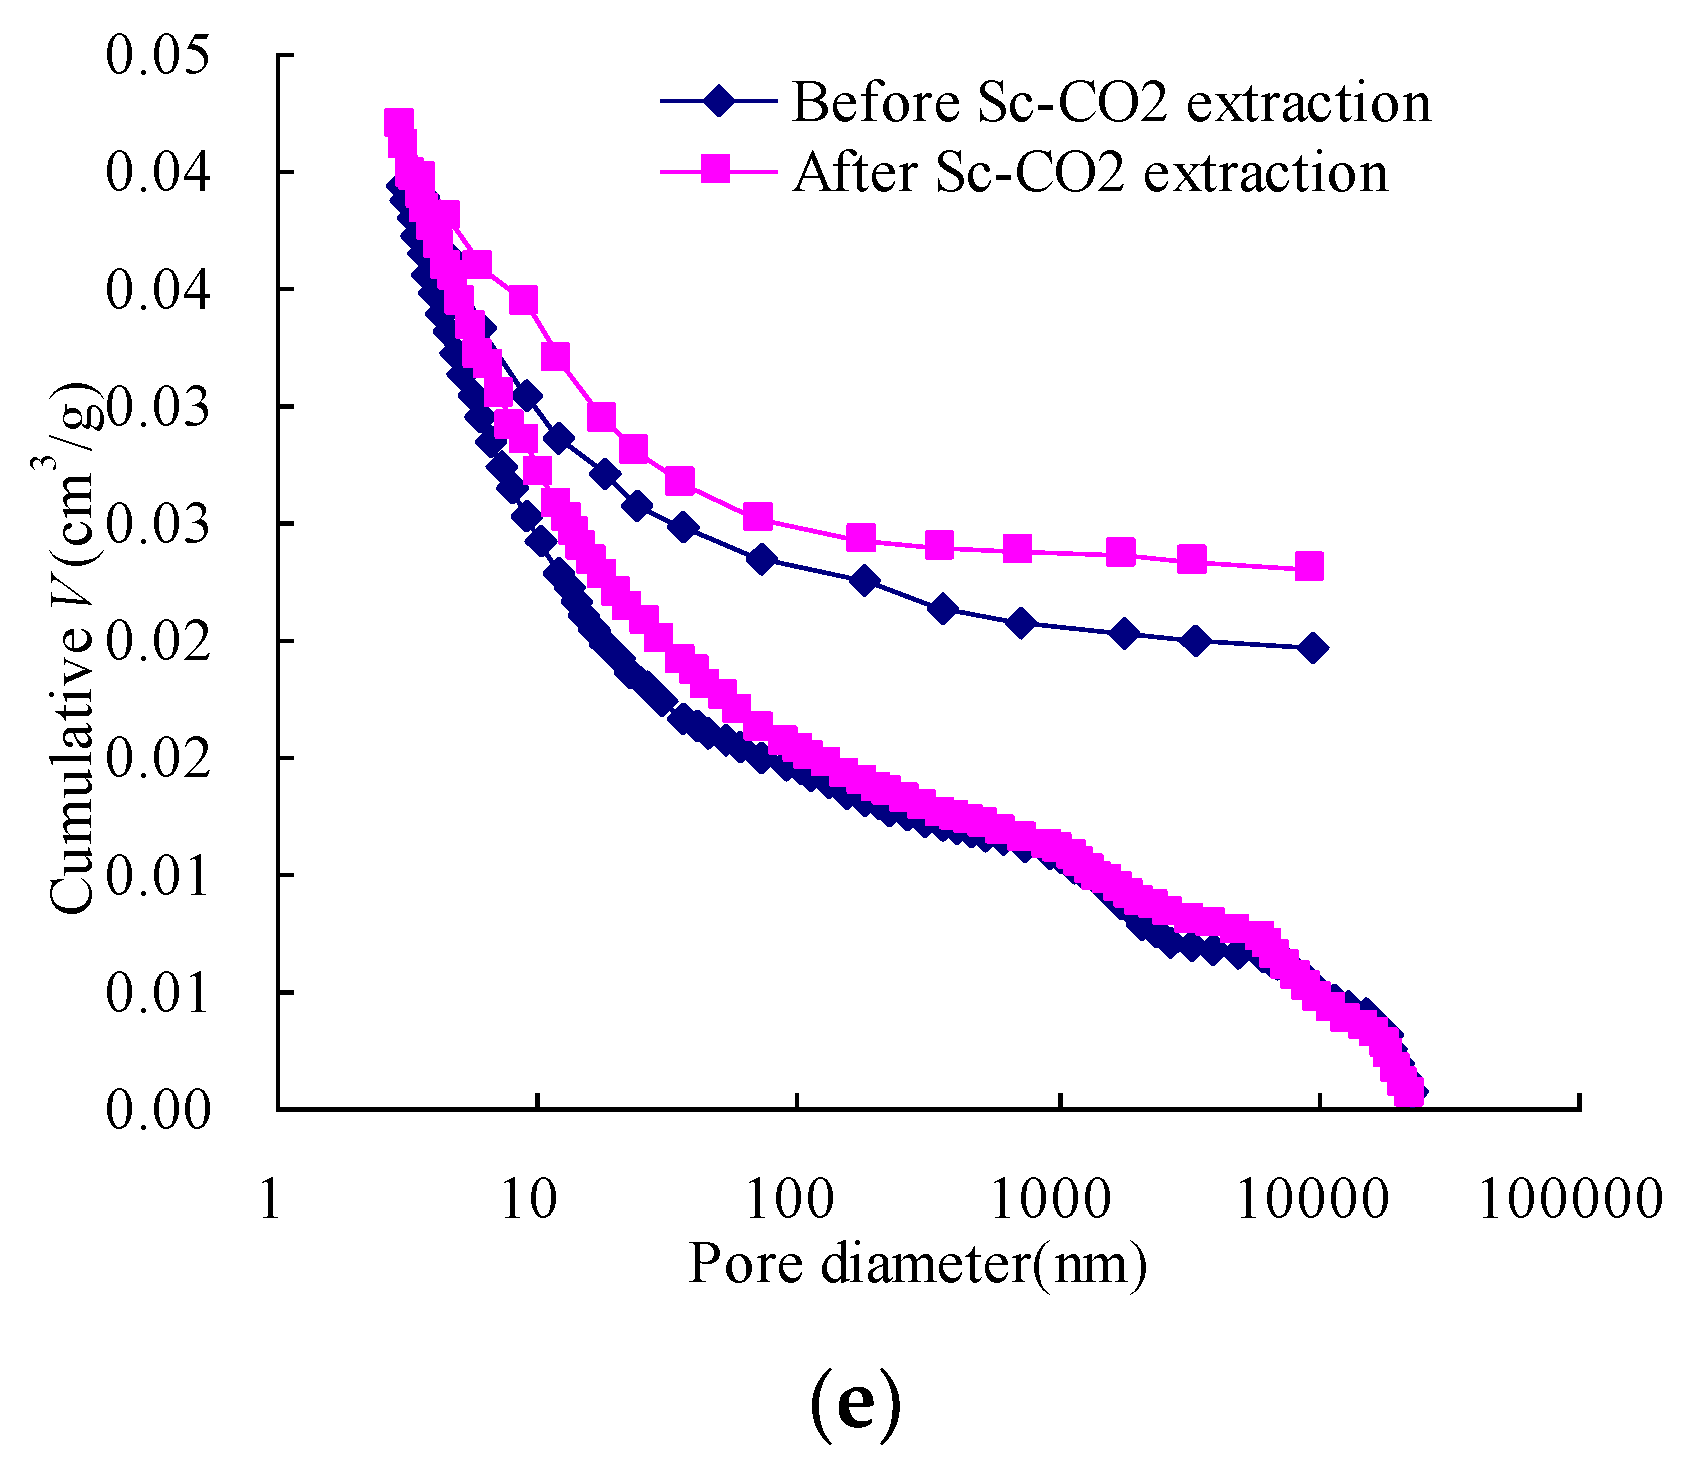
The data on incremental intrusion volume were collected for each sample, as shown in Figure 3. The cumulative intrusion and extrusion volumes of the samples before and after the Sc-CO2 extraction are presented in Figure 5. As shown in Figure 5, hysteresis was observed between the intrusion and extrusion in each sample. The phenomenon could be attributed to contact angle hysteresis [31], and can be interpreted using the ink bottle theory or connectivity model [32]. Hence, certain pores remain filled with mercury after the test.
The cumulative intrusion volume for a sample after the Sc-CO2 extraction is always larger than that of the sample before the Sc-CO2 extraction. Comparison of the cumulative intrusion and extrusion volumes (Figure 5) reveals that: (1) when small organic matters are in open pores or pore throats, the extraction of Sc-CO2 can dissolve them and flush them away, leading to mercury migration. This phenomenon enhances gas migration and CO2 sequestration in the coal seam; (2) when small organic matters are sealed pores or in ink bottle-shaped pores, they are not as easy to dissolve as those in open pores. In this condition, some pores could be opened or converted into new ink bottle-shaped pores. And when the sealed pores are opened, this leads to the reduction of mercury trapped in coal during the extrusion process, which is also better for gas migration and CO2 sequestration. When the sealed pores are converted into new ink bottle-shaped pores, this leads to an increase in mercury trapped in coal, which is better for CO2 sequestration but not better for migration. The cumulative intrusion volume for all of the samples increases more quickly at the pore diameter around 30 nm, implying that pores were compressed [7,26].
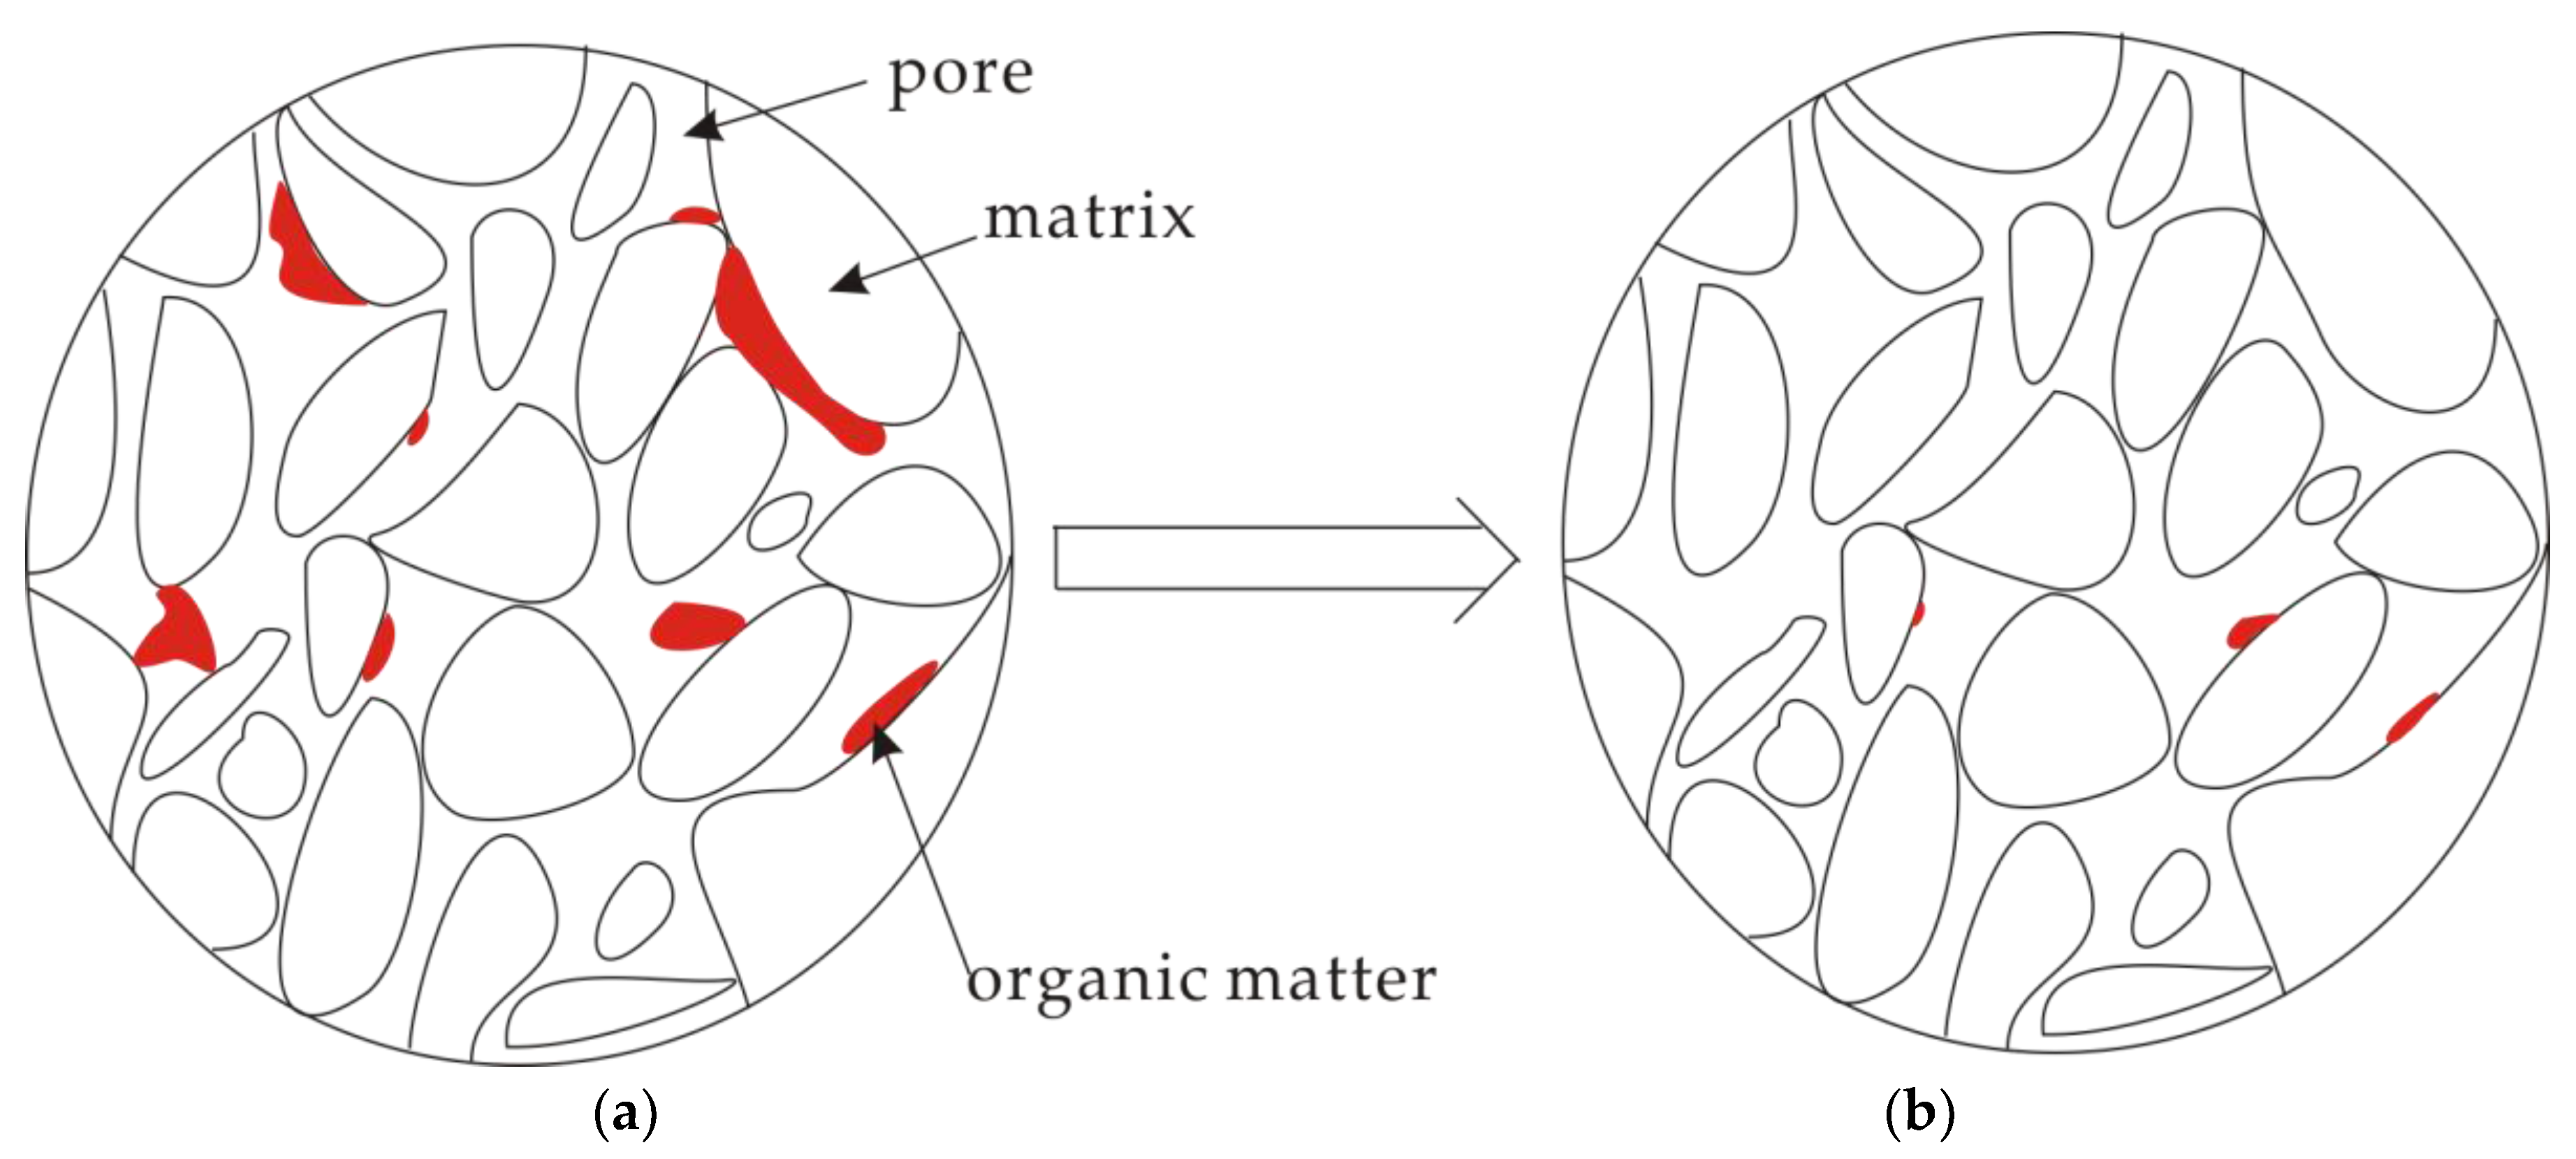
3.4. A Conceptual Model for Pore Structure Evolution
Although the changes in pore structures by Sc-CO2 extraction are controlled by coalification, the mechanisms of Sc-CO2 extraction affecting pore structure of coal are all attributed to the dissolution of small organic matters, which are flushed away in Sc-CO2 fluid. Based on previous research, we propose a conceptual model for pore structure evolution resulting from Sc-CO2 extraction, as shown in Figure 6. It was found that small organic matters (oxygen-containing compounds and other volatiles) that filled open pores can be dissolved and flushed away by Sc-CO2 fluid, which caused some pores sizes to be enlarged, and caused some closed and/or ink bottle pores with small organic matters to open and connect. Small organic matters that filled closed and ink bottle pores were dissolved partly and flushed away, which made closed pores transform into ink bottle pores and the original ink bottle pores become open pores to improve the pore throats for gas migration. In a word, the extraction of small organic matters associated with Sc-CO2 extraction changes the pore structure of coal, providing more space for gas storage and possibly improving the throats for gas migration.
4. Conclusions
Experiments in this study show that small organic matters filling in pores can be dissolved and flushed away by Sc-CO2 fluid, which directly results in changes in the pore structure of coal. The pore structure undergoes a significant change after the Sc-CO2 extraction. TheΔVMa and ΔVMe of the coals are positive; the ΔVTr and ΔVMi are positive for most coals; and the ΔVMi of higher coals are negative. The ΔSMa and ΔSMe are positive with small values; the ΔSTr and ΔSMi are positive and negative before and after the second coalification jump. In addition, the pore connectivity is improved. Sc-CO2 extraction not only increases the number of micropores, but also enlarges the pore diameter size, and the second coalification jump plays an important role in the changes in pore structure of coal associated with CO2 sequestration. The changes in pore structure by Sc-CO2 extraction provides more spaces for gas storage and may improve the throats for gas migration.
Acknowledgments
The authors express their appreciation to National Natural Science Foundation of China (No. 41572138), the Natural Science Foundation of Jiangsu Province (No. BK20150177), and the Fundamental Research Fund for Central University (CUMT) (No. 2014QNA17) for the financial support of this work.
Author Contributions
Run Chen, Yong Qin, and Chongtao Wei designed the facilities and experiments; Run Chen, Linlin Wang, and Pengfei Zhang performed the experiments; Run Chen and Youyang Wang analyzed the data and conducted the analysis; Run Chen wrote the paper.
Conflicts of Interest
The authors declare no conflict of interest.
References
- Intergovernmental Panel on Climate Change (IPCC). IPCC Special Report on Carbon Dioxide Capture and Storage; Prepared by working group III of the intergovernmental panel on climate change [Metz, B.; Davidson, O.; Coninck, de H.C.; Loos, m.; Meyer, L.A. (des.)]; Cambridge University: Cambridge, UK; New York, NY, USA, 2005; ISBN 13-978-0-521-86643-9. [Google Scholar]
- Johnson, W.E.; Macfarlane, R.M.; Breston, J.N.; Neil, D.C. Laboratory experiments with carbonated water and liquid carbon dioxide as oil recovery agents. Prod. Mon. 1952, 17, 18–22. [Google Scholar]
- Busch, A.; Gensterblum, Y.; Krooss, B.M. Methane and CO2 sorption and desorption measurements on dry Argonne premium coals: Pure components and mixtures. Int. J. Coal Geol. 2003, 55, 205–224. [Google Scholar] [CrossRef]
- Ampomah, W.; Balch, R.; Cather, M.; Rose-Coss, D.; Dai, Z.; Heath, J.; Dewers, T.; Mozley, P. Evaluation of CO2 storage mechanisms in CO2 enhanced oil recovery sites: Application to Morrow sandstone reservoir. Energy Fuels 2016, 30, 8545–8555. [Google Scholar] [CrossRef]
- Qin, Y. Mechanism of CO2 enhanced CBM recovery in China: A review. J. China Univ. Min. Technol. 2008, 18, 406–412. [Google Scholar] [CrossRef]
- Gale, J.J. Using coal seams for CO2 sequestration. Geol. Belg. 2004, 7, 99–103. [Google Scholar]
- Fu, X.H.; Qin, Y.; Wei, C.T. Coalbed Methane Geology; China University of Mining and Technology Press: Xuzhou, China, 2007; pp. 46–47. (In Chinese) [Google Scholar]
- Rogers, R.; Ramurthy, K.; Rodvelt, G.; Mullen, M. Coalbed Methane: Principles and Practices, 2nd ed.; Oktibbeha Publishing Co., LLC.: Starkville, MS, USA, 2007; pp. 126–128. ISBN 978-0-9794084-1-0. [Google Scholar]
- Su, X.B.; Chen, R.; Lin, X.Y.; Li, J.H. Desorption characteristic curves of carbon dioxide and methane in coal and their application. Nat. Gas Ind. 2008, 28, 17–20, (In Chinese with English abstract). [Google Scholar]
- Busch, A.; Gensterblum, Y.; Krooss, M.B.; Siemons, N. Investigation of high-pressure selective adsorption/desorption behaviour of CO2 and CH4 on coals: An experimental study. Int. J. Coal Geol. 2006, 66, 53–68. [Google Scholar] [CrossRef]
- Day, S.; Sakurovs, R.; Weir, S. Supercritical gas sorption on moist coals. Int. J. Coal Geol. 2008, 74, 203–214. [Google Scholar] [CrossRef]
- Fitzgerald, J.E.; Sudibandriyo, M.Z.; Pan, R.L.; Robinson, R.L.; Gasem, K.A.M. Modeling the adsorption of pure gases on coals with the SLD model. Carbon 2003, 41, 2203–2216. [Google Scholar] [CrossRef]
- Gathitu, B.B.; Chen, W.; McClure, M. Effects of coal interaction with supercritical CO2: Physical structure. Ind. Eng. Chem. Res. 2009, 48, 5024–5034. [Google Scholar] [CrossRef]
- He, J.Y.; Shi, Y.; Ahn, S.; Kang, J.W.; Lee, C.H. Adsorption and desorption of CO2 on Korean coal under subcritical to supercritical conditions. J. Phys. Chem. B 2010, 114, 4854–4861. [Google Scholar] [CrossRef]
- Day, S.; Fry, R.; Sakurovs, R. Swelling of Australian coals in supercritical CO2. Int. J. Coal Geol. 2008, 74, 41–52. [Google Scholar] [CrossRef]
- Cui, R.M.B.; Chikatamarla, L. Adsorption-induced coal swelling and stress: Implications for methane production and acid gas sequestration into coal seams. J. Geophys. Res. 2007, 112, B10202. [Google Scholar] [CrossRef]
- Pan, Z.; Connell, L.D. A theoretical model for gas adsorption-induced coal swelling. Int. J. Coal Geol. 2007, 69, 243–252. [Google Scholar] [CrossRef]
- Chen, R.; Qin, Y.; Wei, C.T.; Wang, L.L.; Wang, Y.Y.; Zhang, P.F. New discovery on supercritical CO2-H2O treated coal: Pore structure and methane adsorption. Acta Geol. Sin. (Engl. Ed.) 2017, 91, 1509–1510. [Google Scholar] [CrossRef]
- Wang, G.X.; Massarotto, P.; Rudolph, V. An improved permeability model of coal for coalbed methane recovery and CO2 geosequestration. Int. J. Coal Geol. 2009, 77, 127–136. [Google Scholar] [CrossRef]
- Kutchko, B.G.; Goodman, A.L.; Rosenbaum, E. Characterization of coal before and after supercritical CO2 exposure via feature relocation using field-emission scanning electron microscopy. Fuel 2013, 107, 777–786. [Google Scholar] [CrossRef]
- Xu, D.Q. Supercritical fluid extraction of soluble organic matter in hydrocarbon source rocks and its application. Nat. Gas Geosci. 2011, 22, 235–239. [Google Scholar]
- Wang, Y.L. Application of Supercritical Fluid Extraction in Organic Geochemistry; Lanzhou Institute of Geology, Chinese Academy of Science: Lanzhou, China, 2002. [Google Scholar]
- He, Z.X. Evolution and Oil Gas of the Ordos Basin; Petroleum Industry Press: Beijing, China, 2003; pp. 1–77. [Google Scholar]
- Zhang, Y.K.; Zhou, L.F.; Dang, B.; Sun, W. Relationship between the mesozoic and enozoic tectonic stress fields and the hydrocarbon accumulation in the Ordos basin. Pet. Geol. Exp. 2006, 28, 215–219. [Google Scholar]
- Qin, Y.; Song, D.Y. The Coalification and Its Palaeogeothermal System in Southern Shanxi and the Geological Mechanism of Gas Controlling in Coalication; Geological Publishing House: Beijing, China, 1998; pp. 1–90. ISBN 9787116025349. [Google Scholar]
- Berkowitz, N. An Introduction to Coal Technology; Academic Press: New York, NY, USA, 1979; p. 31. [Google Scholar]
- Wang, X.H.; Wang, Y.B.; Gao, S.S. Differences in pore structures and absorptivity between tectonically deformed and undeformed coals. Geol. J. Chin. Univ. 2012, 18, 528–532. [Google Scholar]
- Washburn, E.W. The dynamics of capillary flow. Phys. Rev. 1921, 17, 273–283. [Google Scholar] [CrossRef]
- Hodot, B.B. Coalbed and Gas Outburst; (Trans by Song Shizhao, Wang Youan, In Chinese); Coal Industry Press: Beijing, China, 1966. [Google Scholar]
- Liu, C.J.; Wang, G.X.; Sang, S.X.; Rudolh, V. Changes in pore structure of anthracite coal associated with CO2 sequestration process. Fuel 2010, 89, 2665–2672. [Google Scholar] [CrossRef]
- Salmas, C.; Androutsopoulos, G. Mercury porosimetry: Contact angle hysteresis of materials with controlled pore structure. J. Colloid Interface Sci. 2001, 239, 178–189. [Google Scholar] [CrossRef] [PubMed]
- Tsakiroglou, C.D.; Payatakes, A.C. Mercury intrusion and retraction in model porous media. Adv. Colloid Interface Sci. 1998, 75, 215–253. [Google Scholar] [CrossRef]
Figure 1.
Location of coal samples collected.

Figure 2.
The flow chart of Sc-CO2 extraction in this work.

Figure 3.
Pore distribution of the coals before and after Sc-CO2 extraction: (a) Qiyi coal; (b) Liulin coal; (c) Dengjiazhuang coal; (d) Shuangliu coal; (e) Maozequ coal.
Figure 3.
Pore distribution of the coals before and after Sc-CO2 extraction: (a) Qiyi coal; (b) Liulin coal; (c) Dengjiazhuang coal; (d) Shuangliu coal; (e) Maozequ coal.
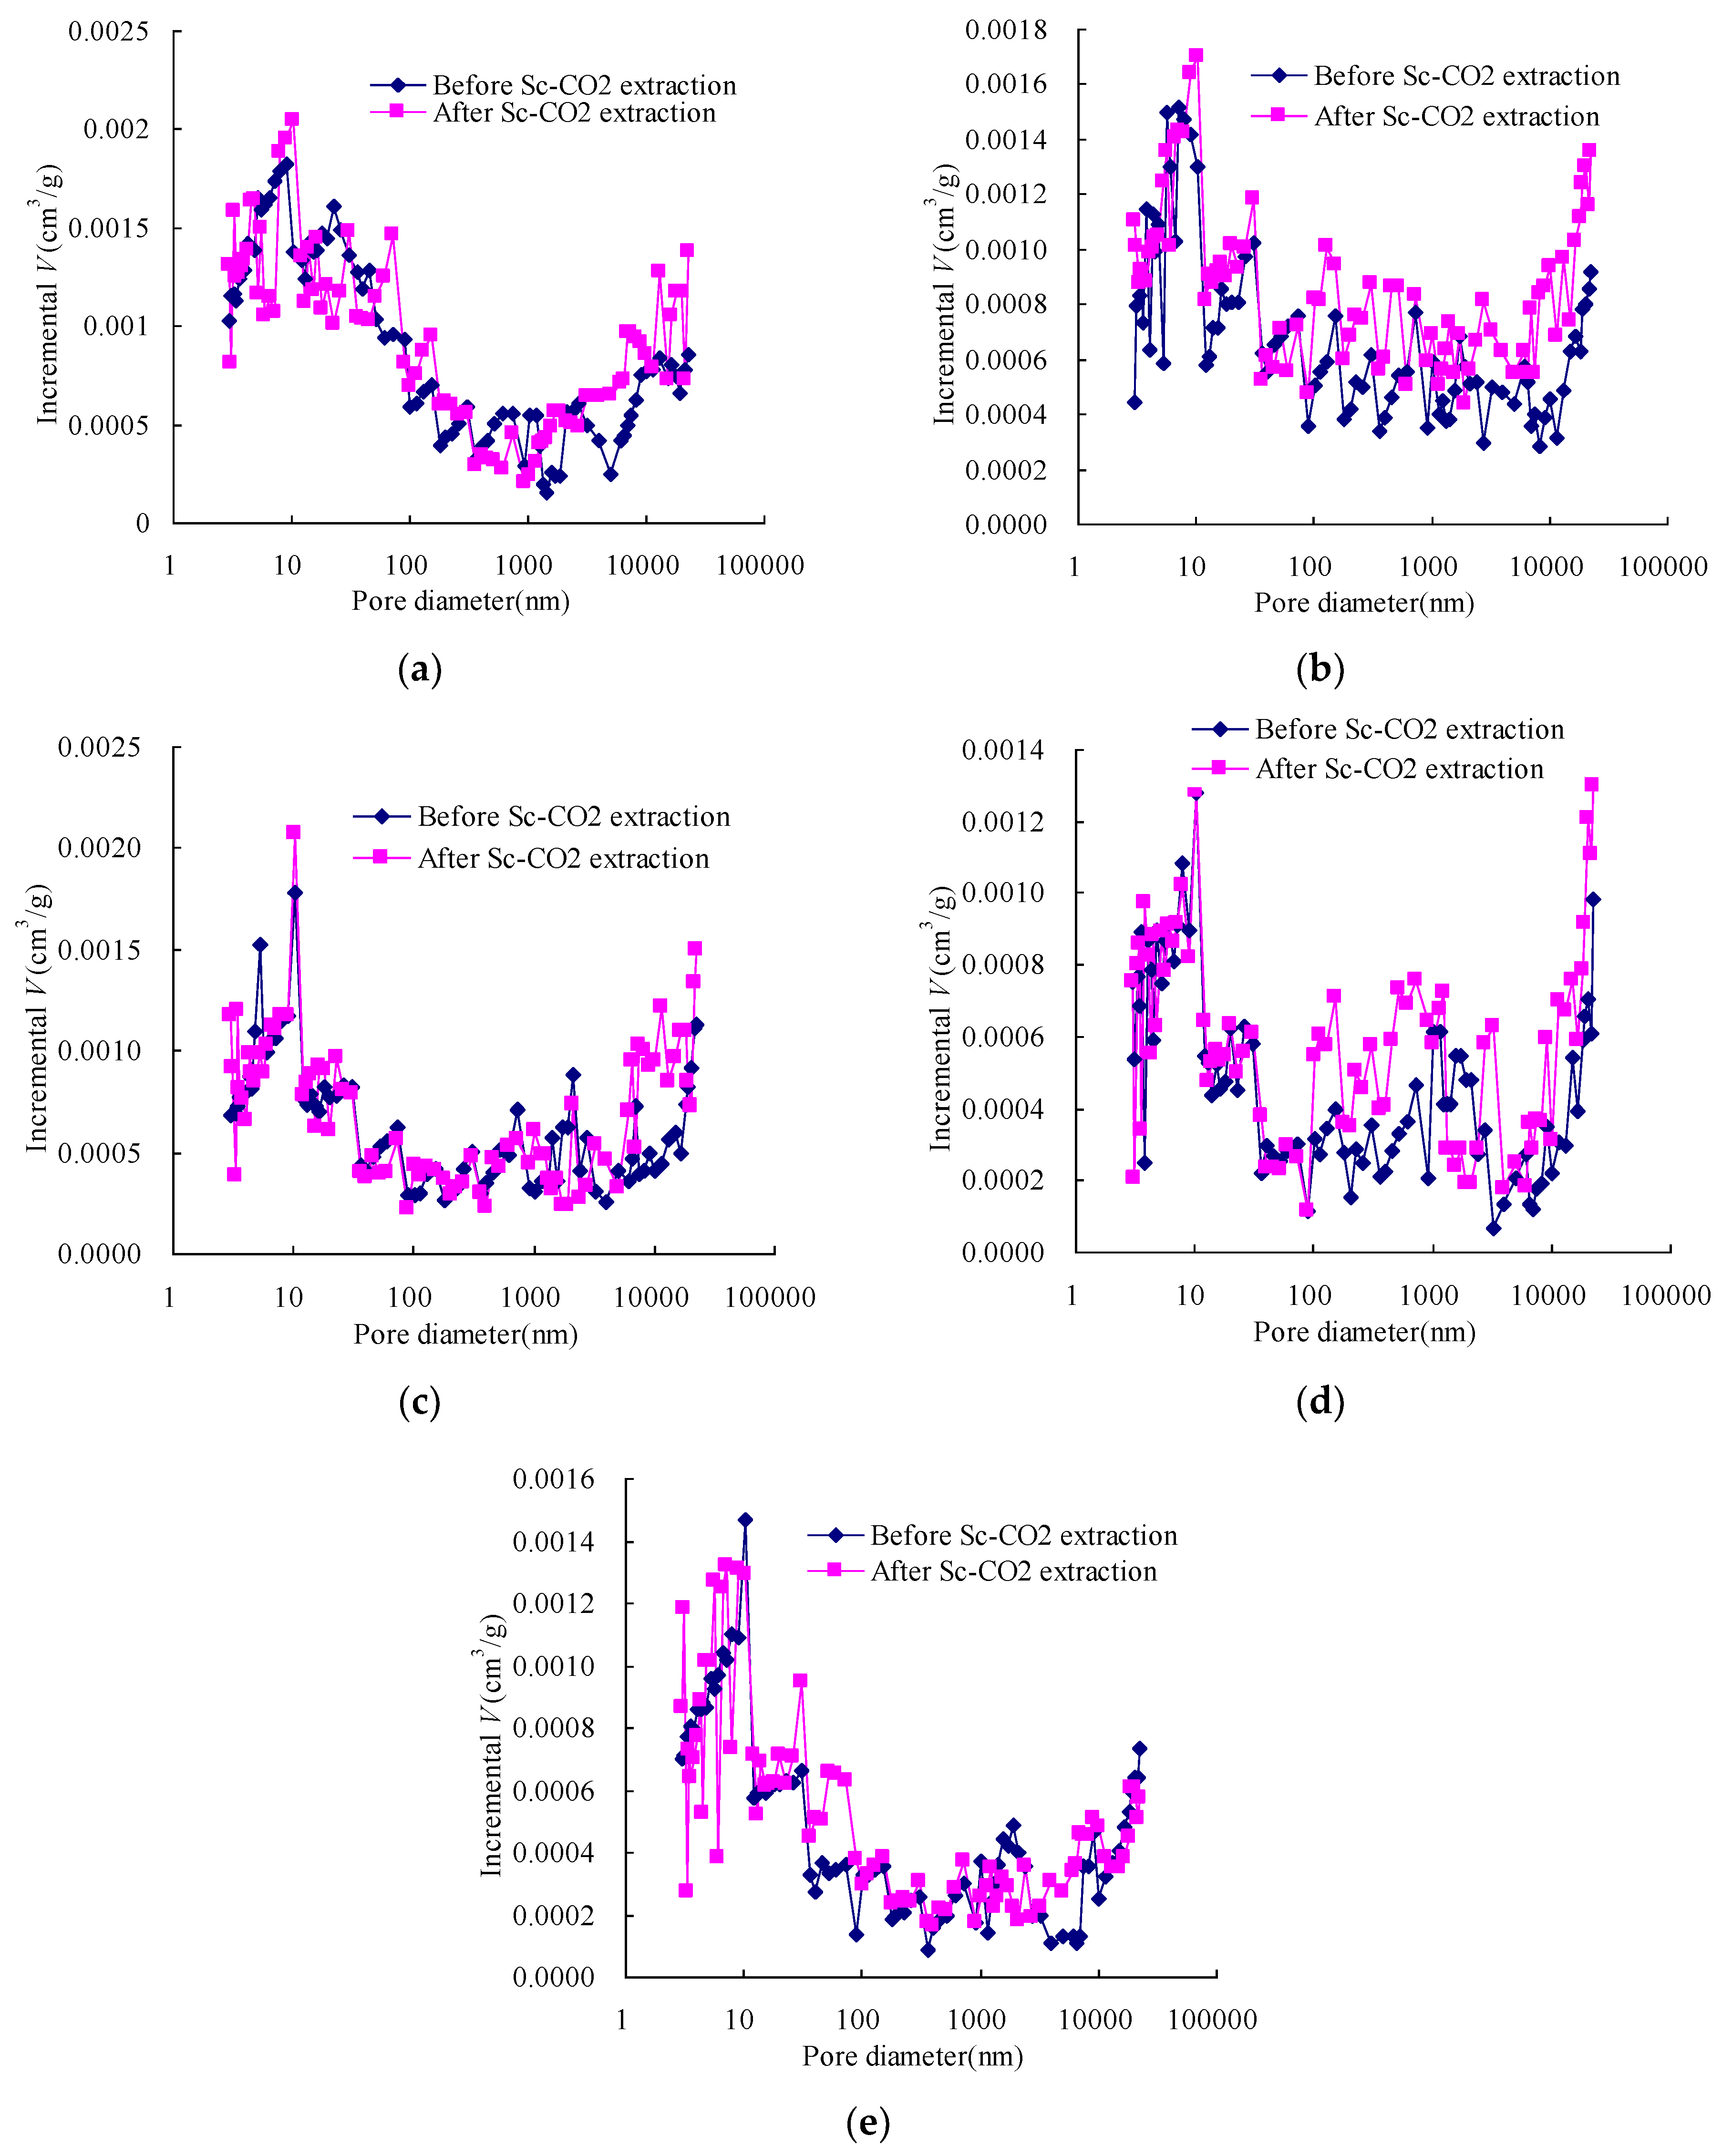
Figure 4.
The changes of incremental pore volume and surface area of coal due to Sc-CO2 extraction: (a) incremental pore volume change with coal rank increasing; (b) incremental pore surface area change with coal rank increasing.
Figure 4.
The changes of incremental pore volume and surface area of coal due to Sc-CO2 extraction: (a) incremental pore volume change with coal rank increasing; (b) incremental pore surface area change with coal rank increasing.

Figure 5.
Cumulative pore volumes of the samples before and after Sc-CO2 extraction as a function of pore size diameter: (a) Qiyi coal; (b) Liulin coal; (c) Dengjiazhuang coal; (d) Shuangliu coal; (e) Maozequ coal.
Figure 5.
Cumulative pore volumes of the samples before and after Sc-CO2 extraction as a function of pore size diameter: (a) Qiyi coal; (b) Liulin coal; (c) Dengjiazhuang coal; (d) Shuangliu coal; (e) Maozequ coal.


Figure 6.
A conceptual mechanism for the evolution of pore structure. (a) Pore structure of coal before Sc-CO2 extraction; (b) Pore structure of coal after Sc-CO2 extraction.
Figure 6.
A conceptual mechanism for the evolution of pore structure. (a) Pore structure of coal before Sc-CO2 extraction; (b) Pore structure of coal after Sc-CO2 extraction.

Table 1.
Vitrinite reflectance, macerals, and proximate analysis of the coals.
| Sample | Qiyi Coal | Liulin Coal | Dengjiazhuang Coal | Shuangliu Coal | Maozequ Coal |
|---|---|---|---|---|---|
| Ro,max (%) | 0.79 | 1.06 | 1.33 | 1.58 | 1.80 |
| Vitrinite (%) | 78.40 | 78.48 | 67.41 | 56.84 | 63.37 |
| Inertinite (%) | 14.87 | 19.16 | 25.18 | 37.71 | 30.43 |
| Exinite (%) | 5.48 | 2.36 | 4.94 | 3.13 | 4.72 |
| Mineral (%) | 1.25 | 10.0 | 2.47 | 2.32 | 1.48 |
| Mad (%) | 4.34 | 1.94 | 1.09 | 0.83 | 0.98 |
| Ad (%) | 6.57 | 10.51 | 8.47 | 11.36 | 7.69 |
| Vad (%) | 31.05 | 27.59 | 26.85 | 23.52 | 20.31 |
Table 2.
Pore volumes and surface areas of the samples before and after the Sc-CO2 extraction.
| Samples | Pore Volumes (10−2 cm3/g) | Pore Surface Area (m2/g) | |||||||||
|---|---|---|---|---|---|---|---|---|---|---|---|
| VMa | VMe | VTr | VMi | VCu | SMa | SMe | STr | SMi | SCu | ||
| Qiyi coal | Before extraction | 1.62 | 0.80 | 2.28 | 2.45 | 7.15 | 0.016 | 0.091 | 4.182 | 17.442 | 21.731 |
| After extraction | 1.86 | 0.84 | 2.26 | 2.55 | 7.51 | 0.018 | 0.092 | 4.120 | 18.179 | 22.409 | |
| Liulin coal | Before extraction | 1.64 | 0.82 | 1.35 | 1.75 | 5.56 | 0.018 | 0.116 | 3.066 | 14.028 | 17.228 |
| After extraction | 2.30 | 1.35 | 1.56 | 1.93 | 7.14 | 0.044 | 0.199 | 3.486 | 14.724 | 18.453 | |
| Dengjiazhuang coal | Before extraction | 1.65 | 0.63 | 1.29 | 1.59 | 5.16 | 0.014 | 0.076 | 2.763 | 14.829 | 17.682 |
| After extraction | 2.13 | 0.64 | 1.30 | 1.61 | 5.68 | 0.015 | 0.080 | 2.825 | 15.116 | 18.036 | |
| Shuangliu coal | Before extraction | 1.21 | 0.47 | 0.83 | 1.33 | 3.84 | 0.011 | 0.047 | 1.765 | 13.086 | 14.909 |
| After extraction | 1.59 | 0.89 | 0.86 | 1.30 | 4.64 | 0.043 | 0.088 | 1.729 | 12.701 | 14.561 | |
| Maozequ coal | Before extraction | 1.07 | 0.38 | 0.97 | 1.51 | 3.93 | 0.007 | 0.075 | 1.495 | 8.837 | 10.414 |
| After extraction | 1.10 | 0.42 | 1.18 | 1.49 | 4.19 | 0.007 | 0.082 | 1.497 | 8.646 | 10.232 | |
Ma: macropore; Me: mesopore; Tr: transitional pore; Mi: micropore; Cu: cumulative pores.
© 2017 by the authors. Licensee MDPI, Basel, Switzerland. This article is an open access article distributed under the terms and conditions of the Creative Commons Attribution (CC BY) license (http://creativecommons.org/licenses/by/4.0/).
Share and Cite
MDPI and ACS Style
Chen, R.; Qin, Y.; Wei, C.; Wang, L.; Wang, Y.; Zhang, P. Changes in Pore Structure of Coal Associated with Sc-CO2 Extraction during CO2-ECBM. Appl. Sci. 2017, 7, 931. https://doi.org/10.3390/app7090931
AMA Style
Chen R, Qin Y, Wei C, Wang L, Wang Y, Zhang P. Changes in Pore Structure of Coal Associated with Sc-CO2 Extraction during CO2-ECBM. Applied Sciences. 2017; 7(9):931. https://doi.org/10.3390/app7090931
Chicago/Turabian StyleChen, Run, Yong Qin, Chongtao Wei, Linlin Wang, Youyang Wang, and Pengfei Zhang. 2017. "Changes in Pore Structure of Coal Associated with Sc-CO2 Extraction during CO2-ECBM" Applied Sciences 7, no. 9: 931. https://doi.org/10.3390/app7090931
Note that from the first issue of 2016, this journal uses article numbers instead of page numbers. See further details here.