Structure and Capacitance of Electrical Double Layers at the Graphene–Ionic Liquid Interface

1
School of Hydraulic, Energy and Power Engineering, Yangzhou University, Yangzhou 225127, China
2
School of Energy and Environment, Southeast University, Nanjing 210096, China
*
Author to whom correspondence should be addressed.
Appl. Sci. 2017, 7(9), 939; https://doi.org/10.3390/app7090939
Submission received: 25 August 2017
/
Revised: 6 September 2017
/
Accepted: 6 September 2017
/
Published: 12 September 2017
(This article belongs to the Special Issue Clean Energy and Fuel (Hydrogen) Storage)
Abstract
:Molecular dynamics simulations are carried out to investigate the structure and capacitance of the electrical double layers (EDLs) at the interface of vertically oriented graphene and ionic liquids [EMIM]+/[BF4]−. The distribution and migration of the ions in the EDL on the rough and non-rough electrode surfaces with different charge densities are compared and analyzed, and the effect of the electrode surface morphology on the capacitance of the EDL is clarified. The results suggest that alternate distributions of anions and cations in several consecutive layers are formed in the EDL on the electrode surface. When the electrode is charged, the layers of [BF4]− anions experience more significant migration than those of [EMIM]+ cations. These ion layers can be extended deeper into the bulk electrolyte solution by the stronger interaction of the rough electrode, compared to those on the non-rough electrode surface. The potential energy valley of ions on the neutral electrode surface establishes a potential energy difference to compensate the energy cost of the ion accumulation, and is capable of producing a potential drop across the EDL on the uncharged electrode surface. Due to the greater effective contact area between the ions and electrode, the rough electrode possesses a larger capacitance than the non-rough one. In addition, it is harder for the larger-sized [EMIM]+ cations to accumulate in the narrow grooves on the rough electrode, when compared with the smaller [BF4]−. Consequently, the double-hump-shaped C–V curve (which demonstrates the relationship between differential capacitance and potential drop across the EDL) for the rough electrode is asymmetric, where the capacitance increases more significantly when the electrode is positively charged.
1. Introduction
Due to their excellent performance in the charge/discharge rate, power delivery and cycle life, supercapacitors (or electrochemical capacitors) have already been used in parts of hybrid vehicles and emergency systems, and are also reported to be a promising energy source for future energy storage systems [1,2]. Compared with traditional batteries [3,4,5,6], lower energy density is a critical problem hindering the future successful application of supercapacitors. To overcome this drawback, superior electrode and electrolyte materials, which are two main components of supercapacitors, are urgently needed. Graphene materials [7,8] have a higher conductivity and larger electrochemical available surface, and thus the ion transport in their 2D plane structure is more efficient. Therefore, compared with other carbon-based materials (such as active carbon [9], carbon nanotubes [10], onion-like carbon [11] and porous carbon materials [12,13]), graphene materials present an immense potential to improve the energy density of supercapacitors. In addition, ionic liquids [14] could remain stable under a wider range of voltages when used as the electrolyte of supercapacitors. Therefore, based on a combination of these two components, graphene/ionic liquid supercapacitors have become an attractive object in the research field of energy storage [15,16,17].
As is well known, for graphene/ionic liquid supercapacitors, the processes of energy storage and release are closely related to the structure of an electrical double layer (EDL), that is, ion distributions on the surface of the graphene electrode. For example, the counterions aggregate in the inner layer of the EDL in the energy storage process and desorb from the electrode surface in the energy release process [18]. For this reason, a thorough understanding of the structure of the EDL and its effects on the capacitance of the ionic liquid EDL is crucial for further improving the efficiency of graphene/ionic liquid supercapacitor applications.
An EDL commonly exists in electrolytes at the solid/liquid interface, which usually plays an important role in fluid flow in microchannels or porous materials [19,20]. An EDL can be represented by a Helmholtz model and by the Gouy–Chapman theory [21,22]. Note that these models are usually suitable for inorganic electrolytes, where simple inorganic ions are usually regarded as particles. However, the ionic liquid only contains organic cations and organic (or inorganic) anions with a complex structure, which is free of solvent and cannot be simply regarded as a system of ‘particles’. This make the ionic liquid EDL more complicated than that of traditional inorganic electrolytes. Consequently, the above theories do not seem to be tenable any more. In order to solve this problem, many researchers have turned to further study of the ionic liquid EDL on the solid surface [23,24], and they suggest that the EDL of the ionic liquid contains two components: the inner compact layer and the outer diffusive layer. In the former layer, the counterions are packed closely. Outside the compact layer, anions and cations are distributed alternately in several consecutive layers, which form the diffusive layer. From this viewpoint, the complex structures of ions are taken into consideration. Based on this viewpoint, several groups have carried out studies on the ionic liquid EDL on the graphene surface and its structures, as well as the capacitance, in an effort to support the design and optimization of graphene/ionic liquid supercapacitors. Feng et al. [25,26] examined the EDL structures of different ionic liquids near planar electrodes and found that the size and charge of ions could significantly affect the ions’ distribution on the surface of the graphene electrode and the EDL capacitance. Vatamanu et al. [27] showed that an enhancement in the capacitance can be obtained when the length scale of the surface roughness of the graphene electrode is comparable to the ion size. In addition, the relationship between differential capacitance and the electrode potential (i.e., the C–V curve or capacitance-voltage curve), another important property of supercapacitors, has also been extensively investigated. Bell-shaped and double-hump-shaped C–V curves were both observed for different electrodes and electrolytes, as reported by Kornyshev, Fedorov, Vatamanu and others [28,29,30].
In summary, up until now, several investigations have been carried out to study the ionic liquid EDL on the graphene electrode surface, including its structures and capacitance characteristics, as well as the relative influence factors. However, the detailed distribution and migration of the ions during electrode charging, as well as the underlying molecular-level mechanisms, are not fully understood. In addition, the influence of electrode morphology on the detailed distribution and migration of the ions needs to be further explored. As a result, in order to gain a molecular-level insight into the ionic liquid EDL on the graphene electrode surface, an electrode–electrolyte model is constructed here by combining the vertically oriented graphene electrode [31] and [EMIM]+/[BF4]− ionic liquid, which is numerically analyzed by the molecular dynamics (MD) method in this work. Accordingly, the distribution and migration of the ions in the ionic liquid EDL on the vertically oriented graphene electrode with different charge densities and roughnesses are compared and analyzed to clarify the effect of electrode surface morphology on the capacitance of the ionic liquid EDL.
2. Simulation System and Methods
The molecular-level structures of [EMIM]+/[BF4]− ion pairs, vertically oriented graphene and the graphene/ionic liquid interface are illustrated in Figure 1, where the atoms on the ions are labeled by the numerical and element symbols in Figure 1a. The non-rough vertically oriented graphene electrode is modeled by 12 successive graphene nano-ribbon layers which are stacked in A–A sequence [30]. All the graphene layers orient toward the ions with their edge planes, forming the electrode surface. According to previous studies [30], as shown in Figure 1c, the layer space of the multi-graphene layers in a non-rough electrode is set as 0.34 nm. Compared with the multi-graphene layers in the non-rough electrode, the rough electrode has the same layer space and different rough surface, possessing grooves with a width of 1.01 nm and depth of 0.85 nm, as depicted in Figure 1b. The non-rough and rough electrodes both have lateral sizes of 4.26 × 3.94 nm2. In the electrolyte near the electrode surface, 300 [EMIM]+/[BF4]− ion pairs are randomly packed with a thickness of about 4.0 nm. Outside the electrolyte region, another 4.0 nm vacuum space is added to eliminate the interaction between the particles and their images outside of the unit cell in the z-direction.
The simulations are conducted in the canonical ensemble (NVT) using a universal force field (UFF) [32]. For each [EMIM]+ cation and [BF4]− anion, the partial charge q on each atom are modified and assigned according to the previous studies [33] (as shown in Table 1) and remain unchanged during the simulations. Periodic boundary conditions are imposed in all three directions. Under these boundary conditions, particles leave the domain at one side and reenter the domain at the opposite side with the same velocity. During the simulation, the electrode atoms are fixed in their initial positions in all cases. A Nose thermostat [34] is used to maintain the system temperature at 300 K. Starting from a random distribution of [EMIM]+/[BF4]− ion pairs near the electrode surfaces, the systems above are firstly relaxed to eliminate the undesirable interactions between ions and electrode. In addition, the SMART method [35] is used in this step to minimize the system energies. Then, the equilibrium and production processes are continued for 2 × 10⁶ steps with a time step of 1 fs, and the atom positions and micro-structure of the electrode/electrolyte interface are saved every 20 ps. The Ewald summation method [36] is used for Coulombic interactions with an accuracy of 10−3 kcal/mol, and the atom-based summation method [37] is used for van der Waals interactions with a cutoff of 1.2 nm. To simulate the charge/discharge process, different constant charge densities σ (the ratio between total charge and atom numbers at the electrode surface) are set on the electrode surface as σ = 0, ±0.02, ±0.05 and ±0.08 e/atom. According to the results of the ion-concentration distributions normal to the graphene surface under different charge densities, the differential capacitances are finally calculated by solving the Poisson equation.
3. Results and Discussion
3.1. Ion Distributions in EDL
The distribution and migration of ions in the EDL, especially those ions next to the electrode surface, could directly affect the capacitance of the ionic liquid EDL. Therefore, firstly, Figure 2 intuitively illustrates the three-dimensional arrangement of ions in the innermost cation/anion layer on the electrode surface with various electrode charge densities (σ). For the non-rough electrode, when σ = 0 e/atom (i.e., neutral electrode), the [EMIM]+ ions become uniformly distributed next to the electrode surface, and the alkyl tail of the [EMIM]+ cation spreads toward the neutral electrode due to its small steric effect (see the inset in Figure 2a). [BF4]− ions are capable of getting into the space among the larger [EMIM]+ ions, as shown in the front view of region A-A of Figure 2a, which is because of the small size of the [BF4]− ion and the electrostatic attractions between [BF4]− ions and [EMIM]+ ions. As shown in Figure 2b, when exposed to the electrode charged by the positive potential, the [BF4]− ions tend to accumulate in the innermost layer near the electrode surface due to electrostatic attractions. Meanwhile, there are still some [EMIM]+ ions located in the innermost layer. This can be explained by the charge delocalization phenomenon of cations, which weakens the electrostatic repulsion between the [EMIM]+ ions and the positively charged electrode surface. In addition, the [EMIM]+ cations adjust their arrangement by retrieving their alkyl tails owing to the extrusion of the [BF4]− anions. As shown in Figure 2c, when exposed to the electrode charged by the negative potential, the [BF4]− ions are apt to move away from the electrode by the electrostatic repulsion, while the [EMIM]+ ions are moved toward the electrode by electrostatic attraction.
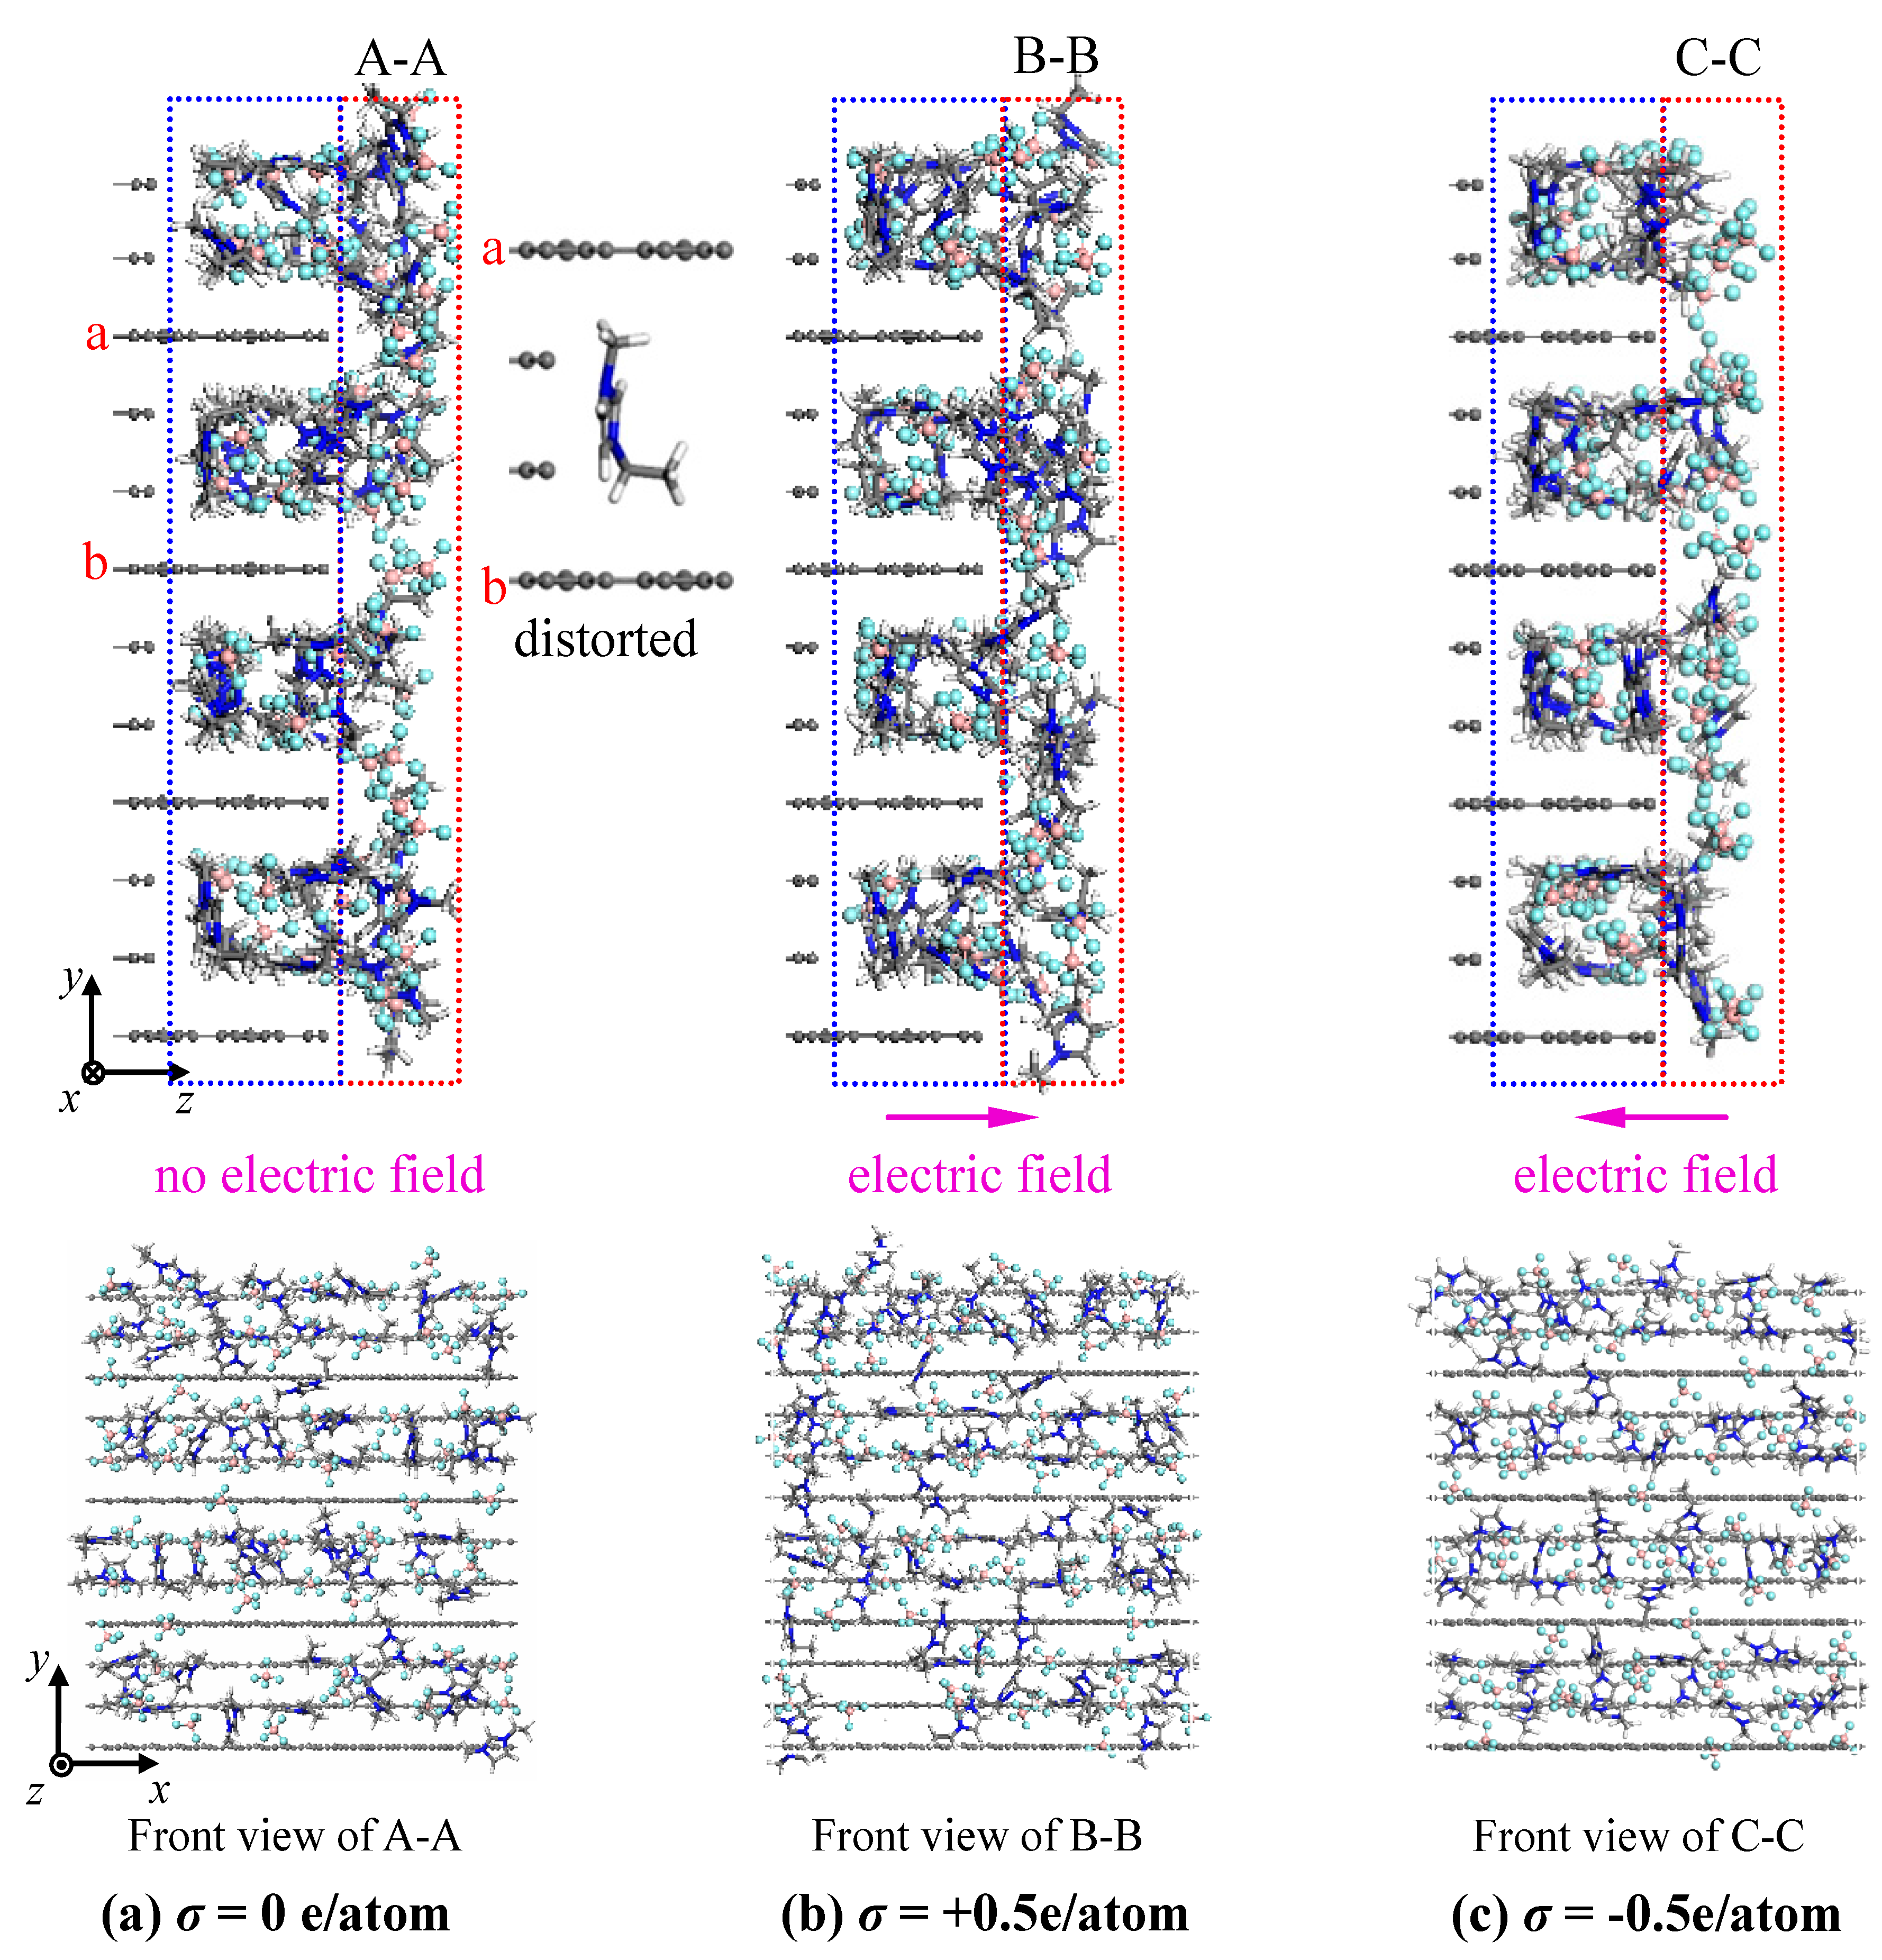
Compared with the ion distribution on the flat surface of the non-rough electrode, the cations and anions are wrapped in the grooves of the rough electrode, even on the neutral electrode surface, as marked by the blue dashed box in Figure 3. In particular, [EMIM]+ ions are distorted in the grooves with their chain configuration aligned along the surface of the groove (see the inset in Figure 3a). In addition, the comparison between the ion distribution outside the grooves near the positively and negatively charged electrodes (see dashed box B-B in Figure 3b and the dashed box C-C in Figure 3c) indicates that the electrostatic force also has an important impact on the anions and cations on the rough electrode, and thus more [BF4]− ions with small size and high mobility are repulsed into the layer region C-C outside the grooves with negative potential.
In order to further observe the distribution of ions, Figure 4 quantifies it by showing the concentration profiles of cations and anions along the z-direction perpendicular to the charged/uncharged electrode surface, where ρlcl is the local ion concentration along the z-direction and ρavg is the average concentration of ions in the simulation box. It can be seen that the concentration profiles of ions exhibit periodical oscillations with decaying amplitude along the z-direction, implying that anions and cations are distributed alternately in several consecutive layers outside the electrode. In addition, at the liquid–vacuum interface, the number of cations and anions is quickly reduced to zero and almost no ions are moved into the vacuum space because of the strong long-range electrostatic interactions between cations and anions. As shown in Figure 4a, the first peak of the [EMIM]+ concentration profile corresponding to the first layer has only a little migration outside the charged electrode, relative to that in uncharged cases. This is due to the significant steric effect of the big [EMIM]+ cation, which dramatically reduces its migration ability and thus weakens the electrostatic repulsion and attraction. However, when the electrode is positively and negatively charged, the alternate layers of [BF4]− anions (i.e., the crests of the concentration profile) show obvious migration towards and away from the electrode relative to the case of the σ = 0 e/atom, respectively (see Figure 4b). This different phenomenon from that of the [EMIM]+ cation can be mainly explained by the good mobility of the [BF4]− anion under the same electrostatic repulsion or attraction, owing to its small size and steric effect. In addition, the small size and steric effect also lead to easy accumulation of the [BF4]− anions, which produces higher peaks of the [BF4]− anion concentration profile than those of the [EMIM]+ cations.
As shown in Figure 5, the oscillations in ion concentration profiles are still observed on the rough electrode surface, which also reflects the presence of alternate stacked layers of cations and anions near the rough electrode surface. However, at the charged/uncharged rough electrode surface, only a limited number of [EMIM]+ and [BF4]− ions can move into the narrow grooves, which results in smaller values of the first peaks in the ion concentration profiles than on the non-rough electrode surface. In addition, the rough electrode induces a wider scope of oscillations in the ion concentration profiles, implying that the ion layers can be extended deeper into the bulk electrolyte solution by the larger interaction from the rough electrode.
What is more, Figure 6 indicates the ion–ion pair correlation functions [38] or radial distribution functions (RDF) for the [EMIM]+/[BF4]− ions near the non-rough neutral electrode surface, so as to further understand the alternate stacked layers of cations and anions in the EDL, where g(r) is the probability of finding one kind of ion at a distance r from the reference ion with respect to that in the bulk phase, and where r is the distance between a pair of ions. The comparison among the RDFs of different ion pairs indicates that the highest first peak appears in the RDF of the [EMIM]+/[BF4]− pair at the smallest r, implying that the stacked layer of [EMIM]+ cations is nearest to the corresponding layer of [BF4]− anions due to the strong electric attraction between them. Meanwhile, the lowest first peak with the largest broadness emerges on the [EMIM]+/[EMIM]+ RDF at a larger r. This suggests a loose accumulation of [EMIM]+ cations owing to their great steric effect and a greater distance between the two stacked layers of [EMIM]+ cations in a pair. On the other hand, the RDF of [BF4]−/[BF4]− exhibits a medium first peak at a value of r similar to that of [EMIM]+/[EMIM]+, which is attributed to the easier packing of [BF4]− anions due to the smaller steric effect compared to the [EMIM]+ cations. In addition, this also shows that the distance between the stacked layers of [BF4]− anions in the pair approximates that between the stacked layers of [EMIM]+ cations. Especially, it can be seen that the crests on the RDF curves of [EMIM]+/[EMIM]+ and [BF4]−/[BF4]− appear to correspond to the valley on the RDF curves of [EMIM]+/[BF4]− and vice versa, which further supports the alternate distribution of stacked layers of cations and anions near the electrode surface.
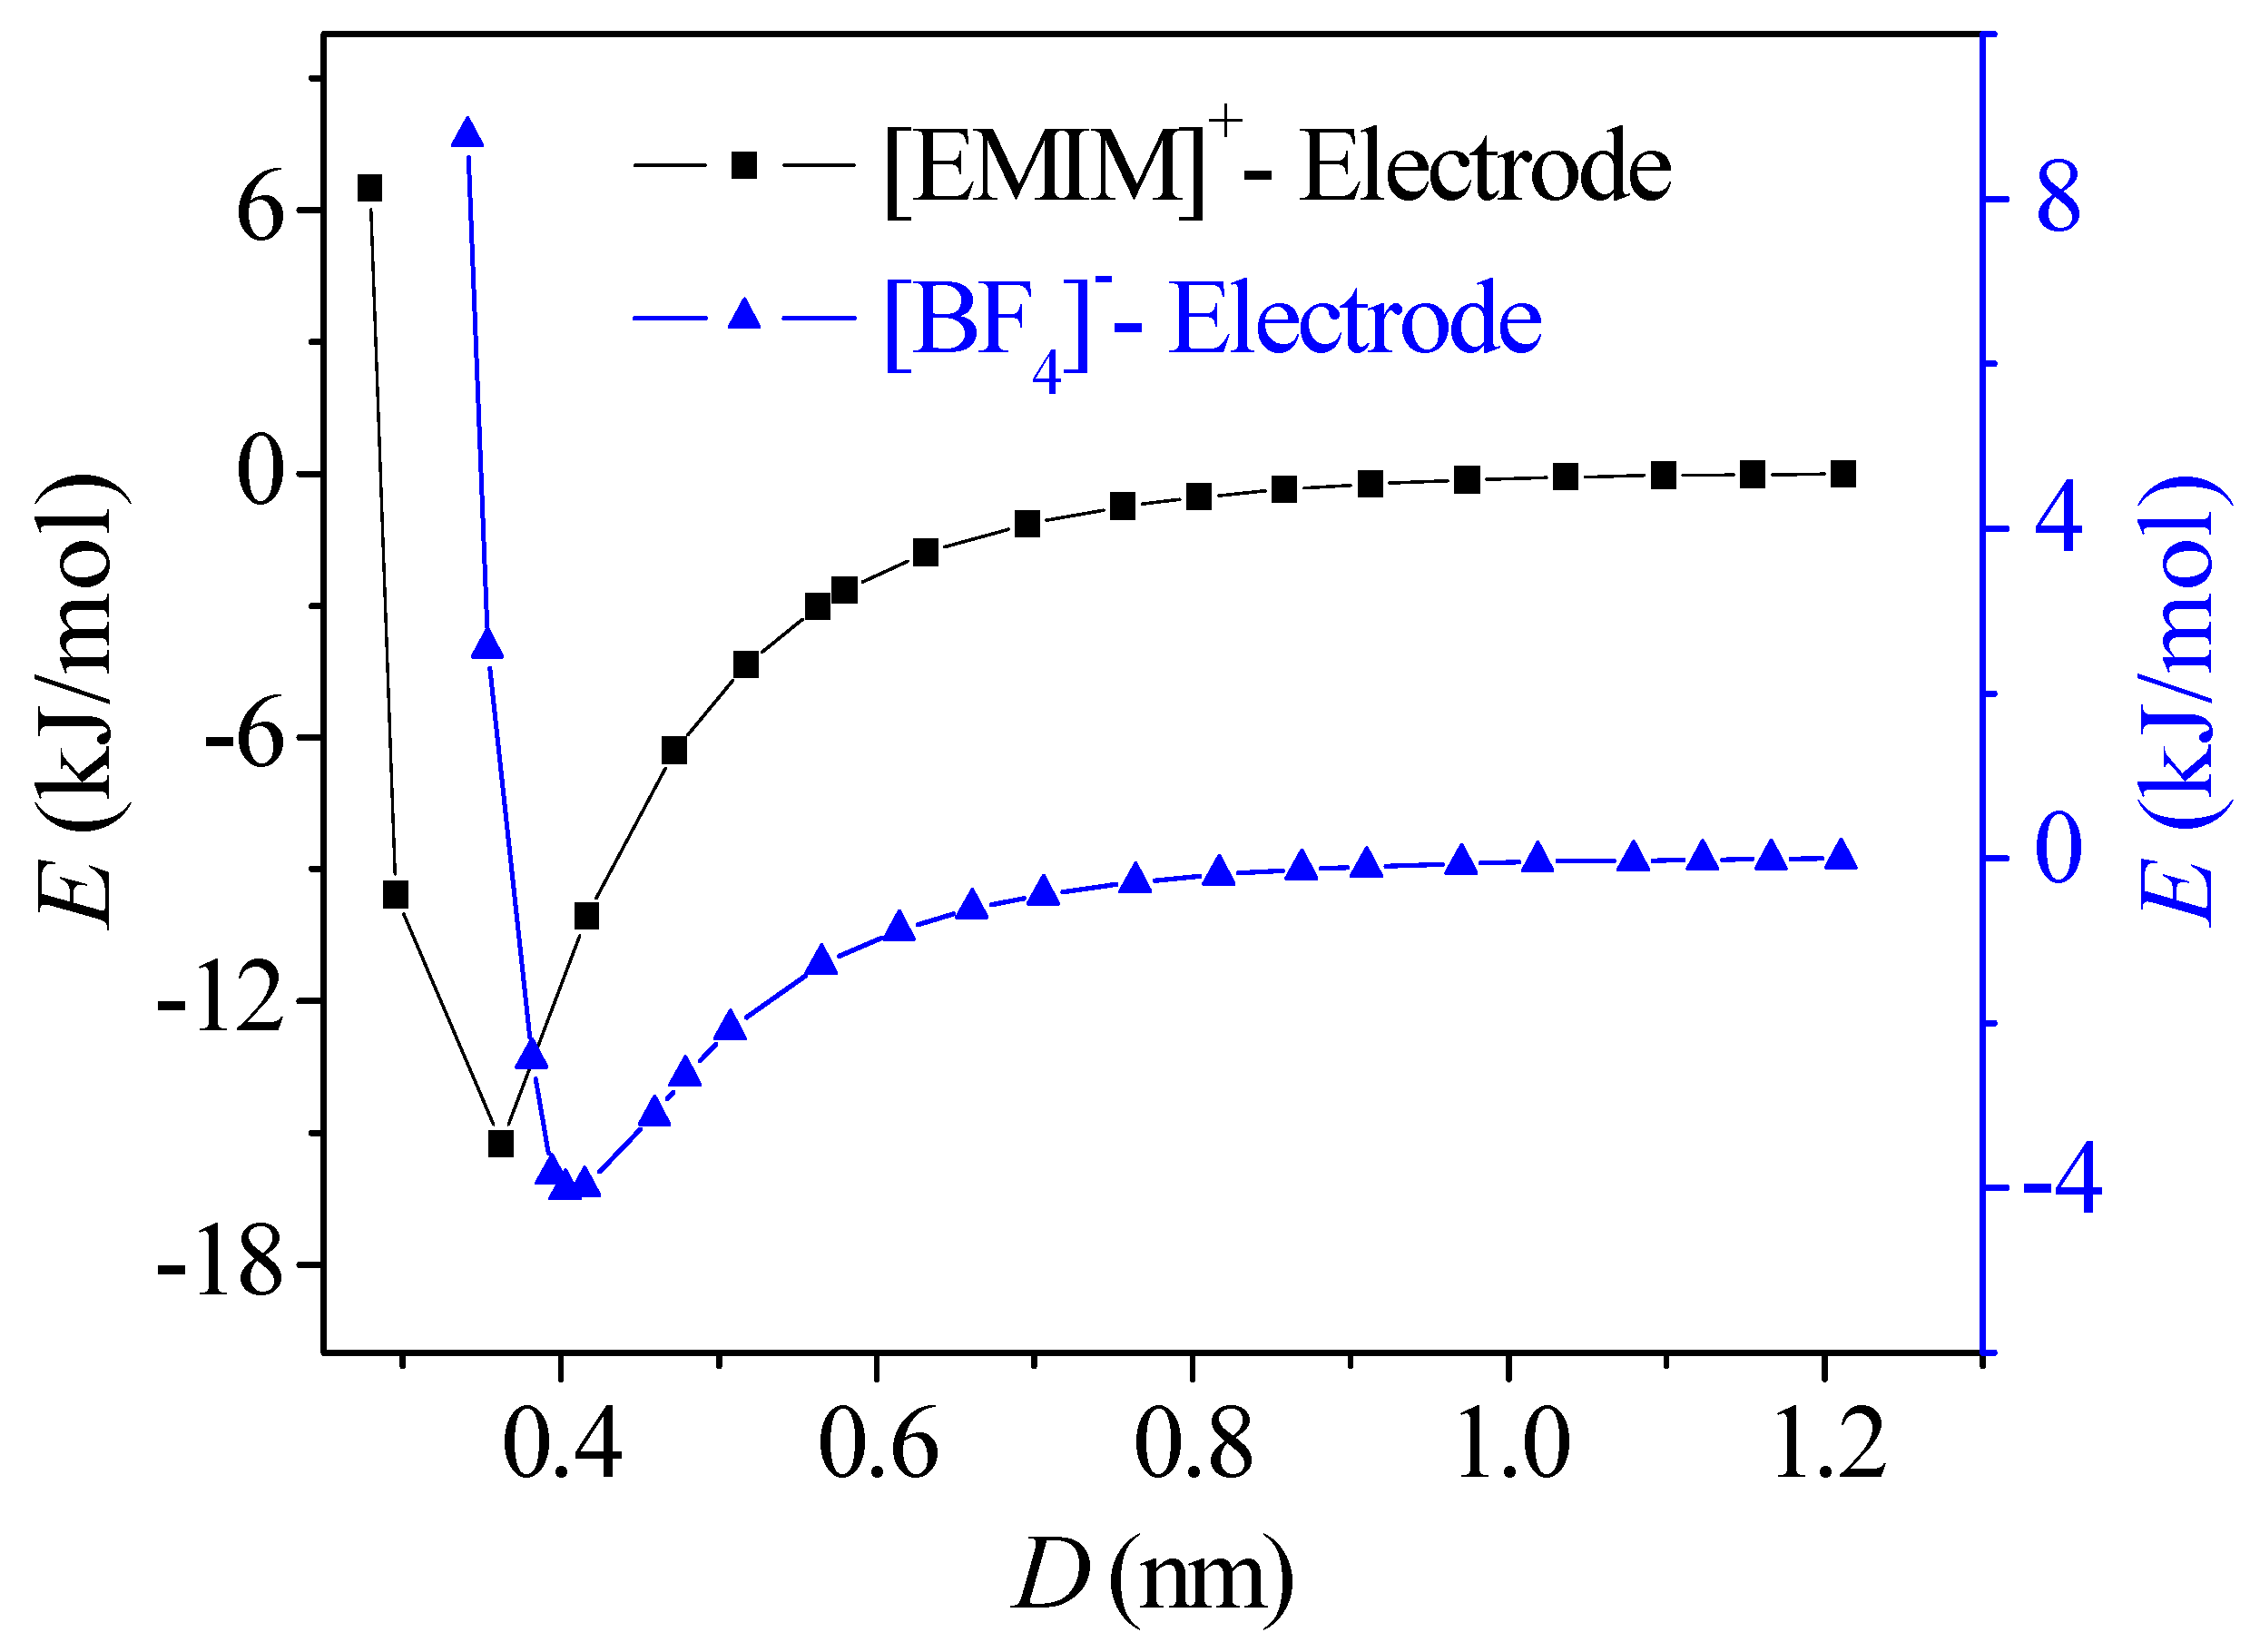
Additionally, it is worth noting from Figure 4 and Figure 5 that even on the neutral electrode surface (σ = 0 e/atom) there also exists an obvious first layer of ions in the EDL, which is able to produce the potential on the uncharged electrode surface (as discussed in the following Section 3.2). In order to clarify this phenomenon, Figure 7 depicts the variations in potential energies of the [EMIM]+ cation and [BF4]− anion near the neutral electrode, where E is the potential energy of the ion and D represents the distance between the ions and the electrode. As shown, potential energy valleys are observed for both the [EMIM]+ cation and the [BF4]− anion, which establishes the potential energy difference to compensate the energy cost of the accumulation of ions in the location of the valleys. Therefore, the [EMIM]+ cations and [BF4]− anions are accumulated in the location of the valleys, forming the first layers on the neutral electrode. In addition, it can be seen that the potential energy valley of the [EMIM]+ cation appears a little closer to the electrode than the [BF4]− anion, which explains the occurrence of the first peak at the smaller z for the [EMIM]+ cation on the neutral electrode surface (σ = 0 e/atom) (see insets (a) and (b) in Figure 4 and Figure 5).
3.2. Differential Capacitance Calculation and Analysis
Apparently, the abovementioned different characteristics of ion distributions near the non-rough and rough electrodes could affect the capacitance properties of the EDL, which can be represented by the C–V curve (i.e., differential capacitance versus the potential drop across the EDL) of the EDL. To obtain the C–V curve, it is necessary to firstly find the total potential (Φ = Φσ + ΦIL) distribution of the whole simulation system along the z-direction. Herein, Φσ = σz/ε is produced by the charge on the electrode, where ε is the effective dielectric constant of the electrolyte. ΦIL is produced by the ionic liquid, which can be gained by integrating the Poisson equation [39]:
where ρe(u) = e(ρcat − ρani) is the space charge density along the surface normal direction (ρcat and ρani are the ion concentrations of [EMIM]+ cautions and [BF4]− anions, respectively, and e is the elementary charge), and ε = ε0εr is the effective dielectric constant of the electrolyte (ε0 and εr are the permittivity of vacuum and relative dielectric constant, respectively). Considering that the dielectric constant in the compact layer can be nearly ten times smaller than that in the bulk phase [25,40], we chose εr = 7.8 for the [EMIM]+/[BF4]− electrolyte. With the boundary condition Φ(0) = 0 and dΦ/dz = 0 in the bulk phase of electrolyte, the total potential distribution along the z-direction can be expressed as:
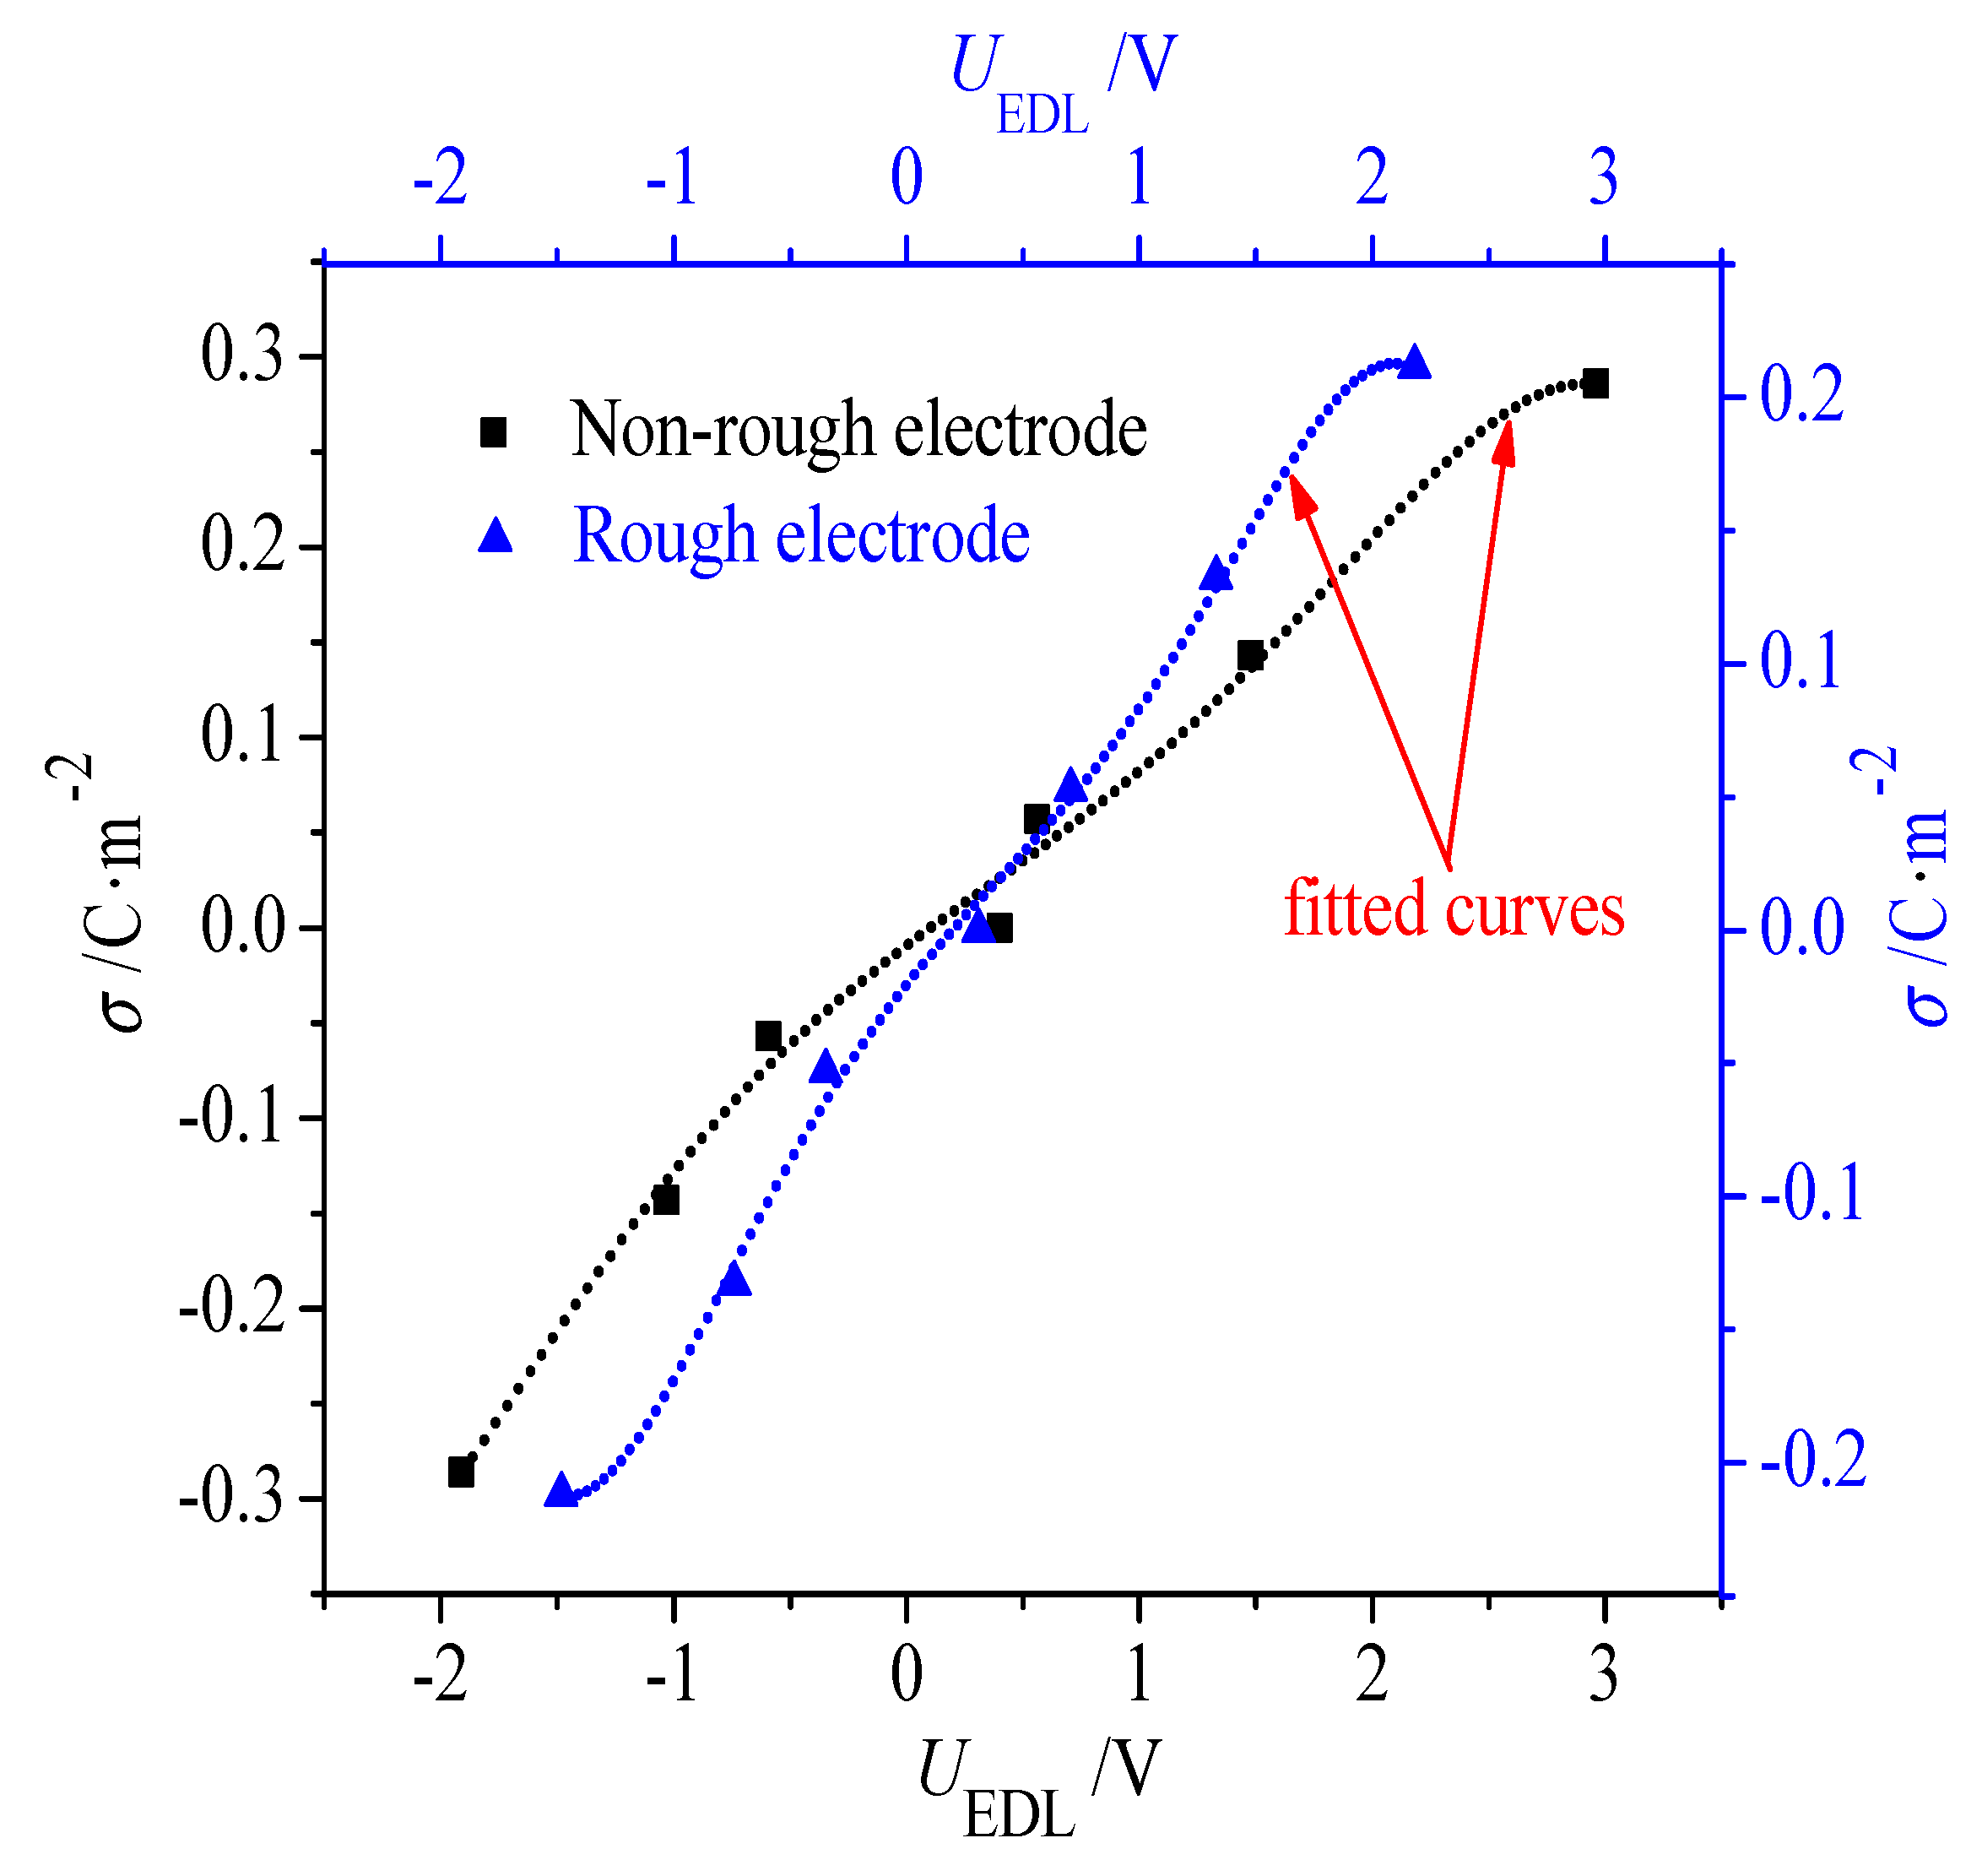
When the potential distribution is obtained according to Equation (2), the potential drop across the EDL (UEDL) can be calculated as UEDL = Φe − Φb, where Φe is the potential on the electrode and Φb is the potential in the middle of the electrolyte phase. In this way, UEDL values on the non-rough electrode and the rough one are calculated as shown in Figure 8. Based on the data points of σ versus UEDL, the σ-UEDL curve is obtained by fitting these points with a fifth-order polynomial (see Figure 8). As shown, the potential drop across the EDL (UEDL) is not zero but a positive value at σ = 0 e/atom. As discussed above, this phenomenon must be generated by the first layer of ions in the EDL on the neutral electrode surface.
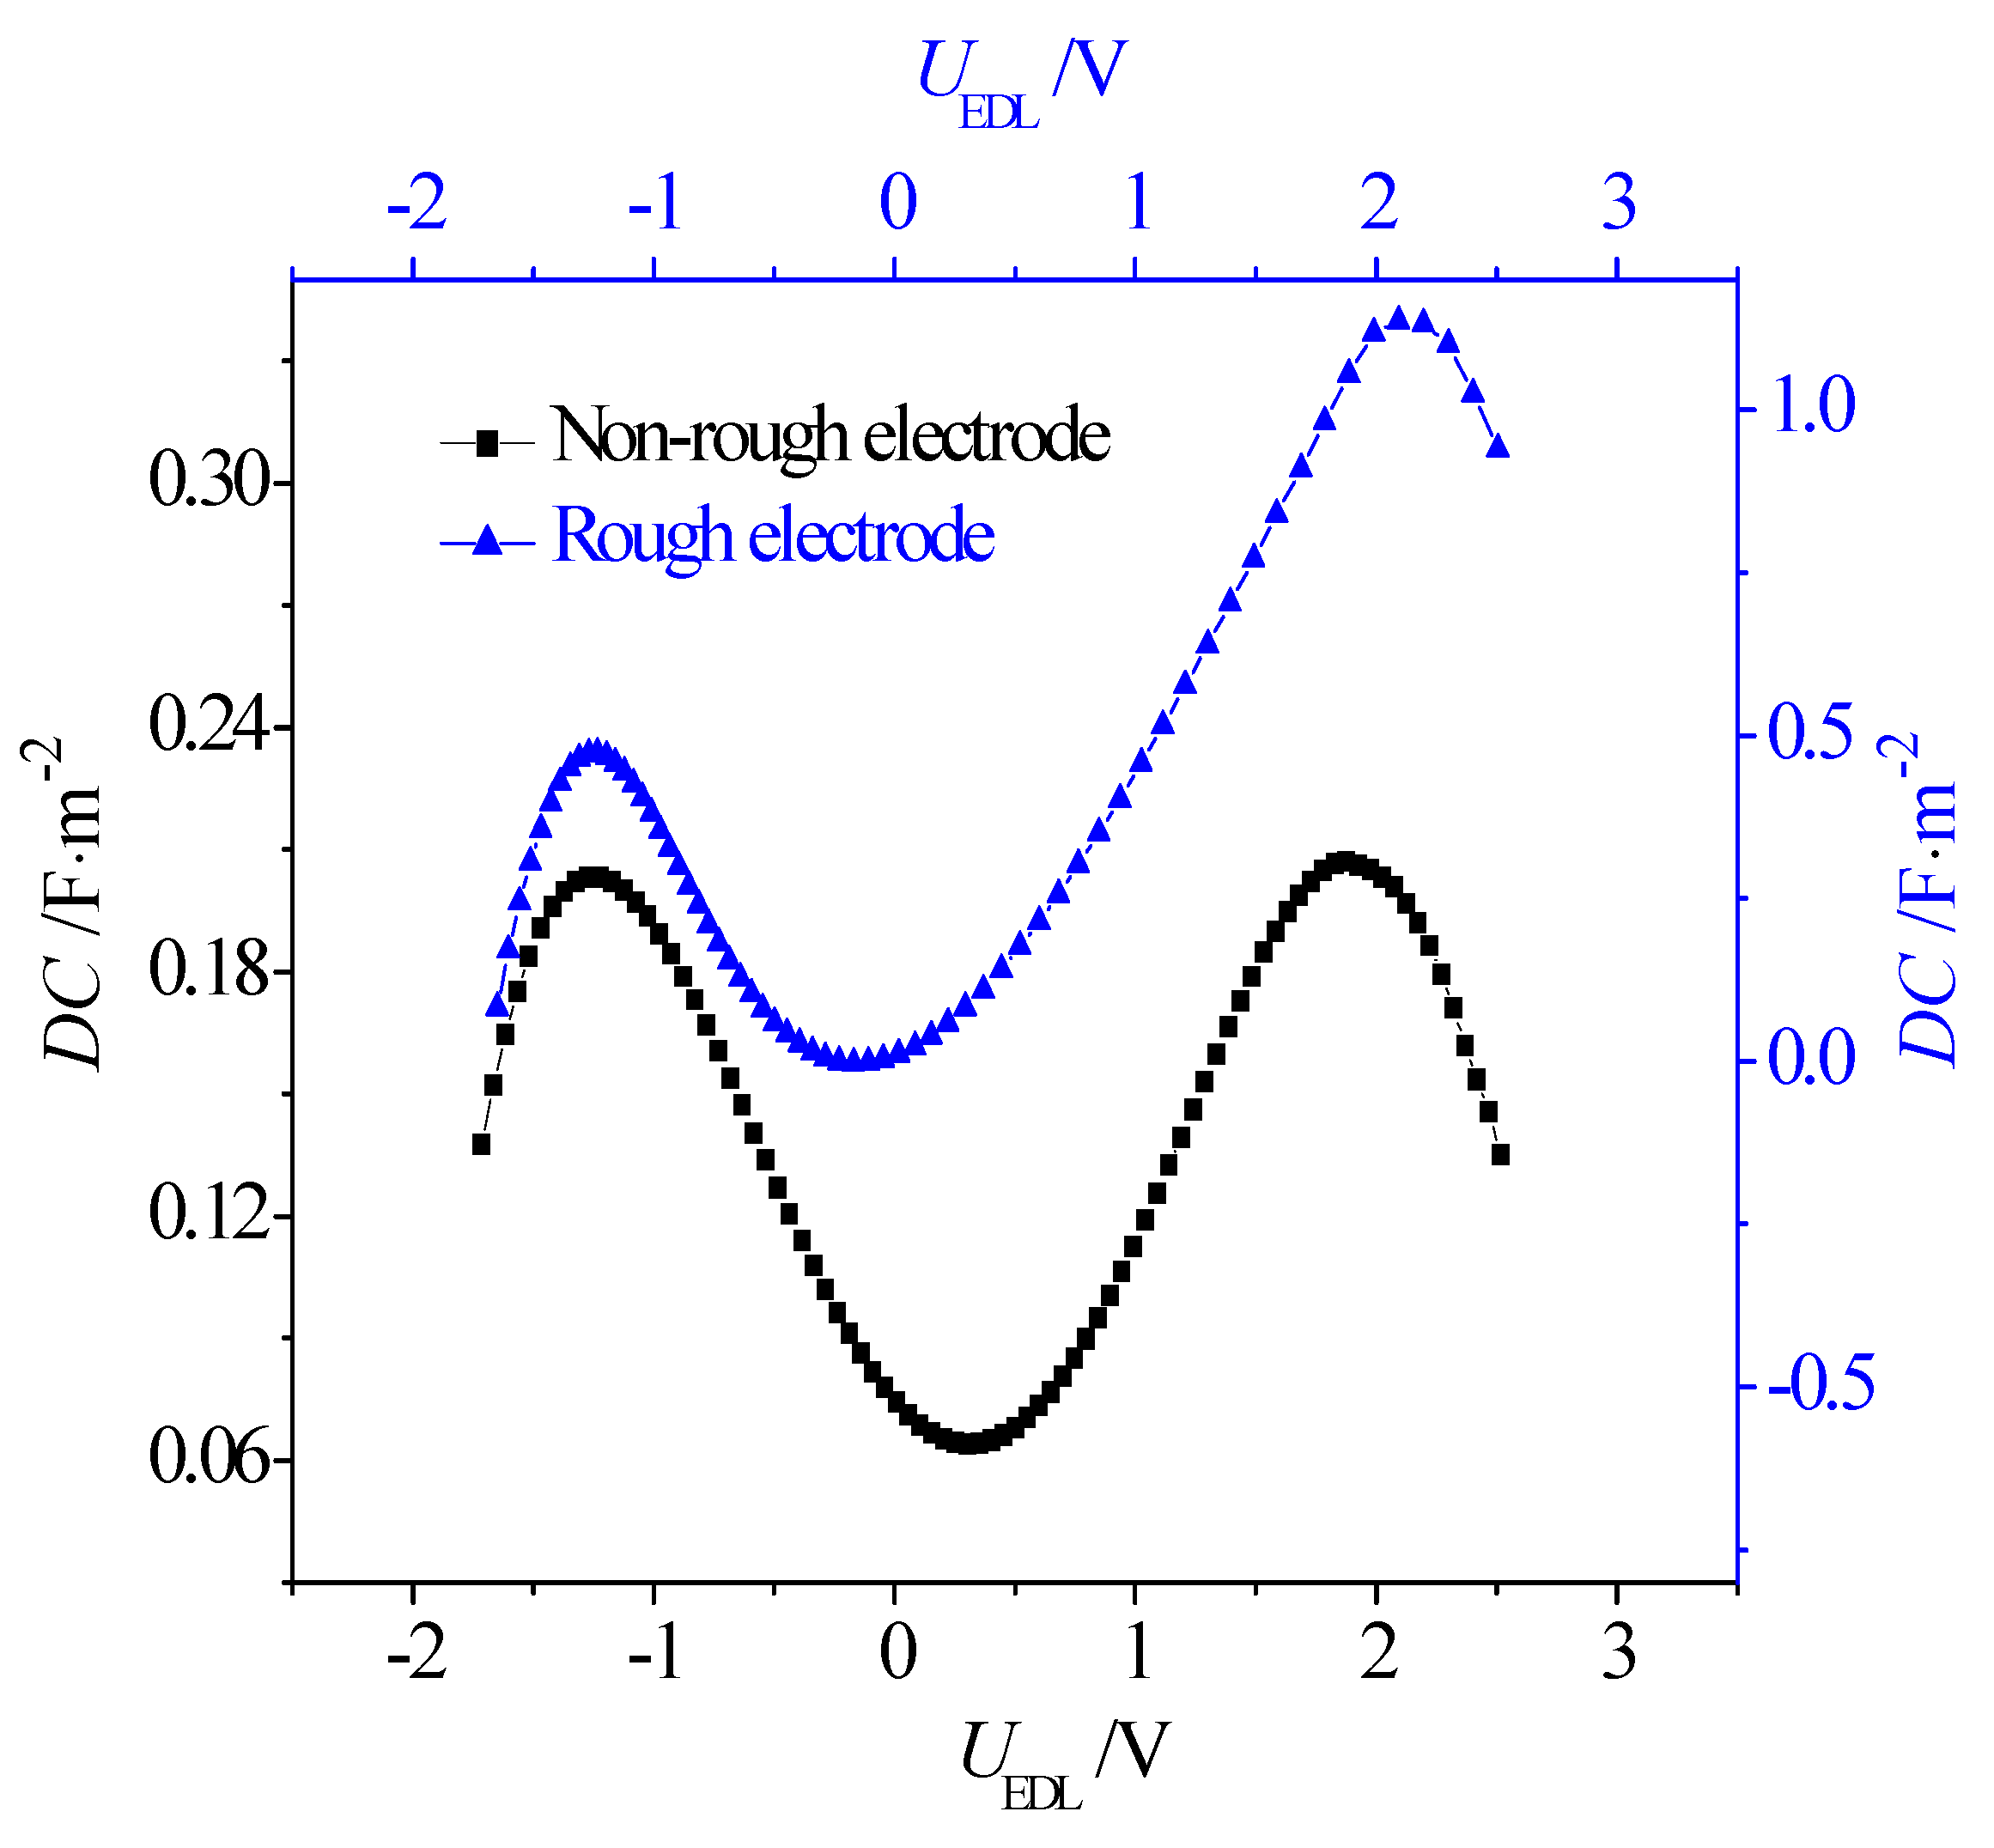
Accordingly, the C–V curves can be obtained by analytically differentiating the polynomial according to the equation DC = dσ/dUEDL, and are depicted in Figure 9 for the non-rough and rough electrodes. As shown, the C–V curves on the non-rough and rough electrodes both exhibit the double-hump shape. That is, a minimum point appears on the C–V curves near the potential of zero charge (PZC), while two maximum ones appear at lower and higher values of UEDL. As discussed above, it is the accumulation of ions near the negatively and positively charged electrode surface that results in the maximum capacitance at negative UEDL and the one at positive UEDL. However, with the increasing concentration of ions near the charged electrode surface, the accumulation of ions at the charged electrode surface tends to be weakened when the electrode is further charged. As a result, the capacitance climbs over two maximum points and decreases in turn, forming the double-hump-shaped C–V curves. It is also observed that, despite whether the electrode is charged positively or negatively, there is a more significant increase in capacitance in the rough cases than in the non-rough cases. This phenomenon can be attributed to the fact that the rough electrode increases the effective contact area between the ions and electrode, which attracts more counterions to the electrode surface compared to the non-rough electrode. In addition, the double-hump-shaped C–V curve for the rough electrode is asymmetric with respect to the symmetric one for the non-rough electrode, where the capacitance is increased more significantly when the electrode is positively charged. This must be caused by the different impact of the grooved electrode surface on the accumulation of [EMIM]+ cations and [BF4]− anions. Clearly, when the electrode is charged, it is harder for the larger-sized [EMIM]+ cations to accumulate in the narrow grooves on the rough electrode when compared with the smaller [BF4]−. Consequently, a smaller capacitance appears on the negatively charged rough electrode. The comparisons between the C–V curves of the EDLs on the non-rough and rough electrodes suggest that roughness on the electrode can increase the capacitance in the EDL, and thus be beneficial for improving the energy density of the EDL supercapacitor in real applications. We believe this work can provide useful information to improve the energy density of the EDL supercapacitor via optimizing the micro-structure of the electrode. In addition, the charging/discharging rate, which is a crucial parameter for the super-capacitor system, will be considered in our future work.
4. Conclusions
In this work, based on the molecular dynamics method, an electrode–electrolyte model is established to numerically investigate the molecular-level structure in the electrical double layers of the [EMIM]+/[BF4]− ionic liquid on the vertically oriented graphene electrode. The detailed distribution and migration of the ions on the non-rough and rough electrode surfaces with different charge densities are compared and analyzed. In addition, the C–V curve of the EDL is obtained to clarify the effect of the electrode surface morphology on the capacitance of the EDL. The main conclusions can be summarized as follows:
- (1)
- The concentration profiles of ions exhibit periodical oscillations with decaying amplitude along the direction perpendicular to the charged/uncharged electrode surface, which suggests an alternate distribution of anions and cations in several consecutive layers in the EDL on the electrode surface. When the electrode is charged, the alternate layers of [BF4]− anions experience more-significant migration than the layers of [EMIM]+ cations, owing to the good mobility of the [BF4]− anion due to its small size and steric effect. Additionally, these ion layers can be extended deeper into the bulk electrolyte solution by the stronger interaction of the rough electrode compared to the situation for the non-rough electrode.
- (2)
- The potential energy valley of ions near the neutral electrode surface establishes a potential energy difference to compensate the energy cost of the ion accumulation. As a result, ions are able to accumulate in the location of the valley to form the first layers near the electrode, allowing the potential drop across the EDL on the uncharged electrode surface to be produced.
- (3)
- Due to the greater effective contact area between the ions and electrode, the rough electrode possesses a larger capacitance than the non-rough one when it is negatively and positively charged. In addition, when the electrode is charged, it is harder for the larger-sized [EMIM]+ cations to accumulate in the narrow grooves on the rough electrode when compared with the smaller [BF4]−. Consequently, when compared with the symmetric double-hump-shaped C–V curve for the non-rough electrode surface, the double-hump-shaped C–V curve for the rough electrode is asymmetric, where the capacitance is increased more significantly when the electrode is positively charged.
Acknowledgments
The authors gratefully acknowledge the support provided by the National Natural Science Foundation of China (51406175) and the Natural Science Foundation of Jiangsu Province (BK20140488).
Author Contributions
Xiangdong Liu provided the guidance and supervision. Pengfei Lu implemented the main research, discussed the results, and wrote the paper. Qiaobo Dai and Liangyu Wu checked and revised the paper. All authors read and approved the final manuscript.
Conflicts of Interest
The authors declare no conflict of interest.
References
- Winter, M.; Brodd, R.J. What are batteries, fuel cells, and supercapacitors? Chem. Rev. 2004, 104, 4245–4269. [Google Scholar] [CrossRef] [PubMed]
- Fronk, B.M.; Neal, R.; Garimella, S. Evolution of the transition to a world driven by renewable energy. J. Energy Resour. Technol. 2010, 132, 021009. [Google Scholar] [CrossRef]
- Yang, W.; Li, J.; Ye, D.D.; Zhang, L.; Zhu, X.; Liao, Q. A hybrid microbial fuel cell stack based on single and double chamber microbial fuel cells for self-sustaining pH control. J. Power Sources 2016, 306, 685–691. [Google Scholar] [CrossRef]
- Zhu, X.B.; Zhao, T.S.; Wei, Z.H.; Tian, P.; An, L. A high-rate and long cycle life solid-state lithium-air battery. Energy Environ. Sci. 2015, 8, 3745–3754. [Google Scholar] [CrossRef]
- Demirocak, D.E.; Srimivasan, S.S.; Stefanakos, E.K. A Review on Nanocomposite Materials for Rechargeable Li-ion Batteries. Appl. Sci. 2017, 7, 731. [Google Scholar] [CrossRef]
- Simon, P.; Gogotsi, Y.; Dunn, B. Where do batteries end and supercapacitors begin? Science 2014, 343, 1210–1211. [Google Scholar] [CrossRef] [PubMed] [Green Version]
- Rao, C.N.R.; Sood, A.K.; Subrahmanyam, K.S.; Govindaraj, A. Graphene: The new two-dimensional nanomaterial. Angew. Chem. Int. Ed. 2009, 48, 7752–7777. [Google Scholar] [CrossRef] [PubMed]
- Iro, Z.S.; Subramani, C.; Dash, S.S. A brief review on electrode materials for supercapacitor. Int. J. Electrochem. Sci. 2016, 11, 10628–10643. [Google Scholar] [CrossRef]
- Rajput, N.N.; Monk, J.; Hung, F.R. Ionic liquids confined in a realistic activated carbon model: A molecular simulation study. J. Phys. Chem. C 2014, 118, 1540–1553. [Google Scholar] [CrossRef]
- Yang, L.; Fishbine, B.H.; Migliori, A.; Pratt, L.R. Molecular simulation of electric double-layer capacitors based on carbon nanotube forests. J. Am. Chem. Soc. 2008, 131, 12373–12376. [Google Scholar] [CrossRef] [PubMed]
- Feng, G.; Jiang, D.E.; Cummings, P.T. Curvature effect on the capacitance of electric double layers at ionic liquid/onion-like carbon interfaces. J. Chem. Theory Comput. 2012, 8, 1058–1063. [Google Scholar] [CrossRef] [PubMed]
- Wen, Z.Q.; Li, M.; Zhu, S.J.; Wang, T. Three-dimensional (3D) nanocomposites of MnO2-modified mesoporous carbon filled with carbon spheres/carbon blacks for supercapacitors. Int. J. Electrochem. Sci. 2016, 11, 23–33. [Google Scholar]
- Shim, Y.; Kim, H.J. Nanoporous carbon supercapacitors in an ionic liquid: A computer simulation study. ACS Nano 2010, 4, 2345–2355. [Google Scholar] [CrossRef] [PubMed]
- Hayes, R.; Warr, G.G.; Atkin, R. Structure and nanostructure in ionic liquids. Chem. Rev. 2015, 115, 6357–6426. [Google Scholar] [CrossRef] [PubMed]
- Baldelli, S.; Bao, J.; Wu, W.; Pei, S.S. Sum frequency generation study on the orientation of room-temperaturre ionic liquid at the graphehe-ionic liquid interface. Chem. Phys. Lett. 2011, 516, 171–173. [Google Scholar] [CrossRef]
- Vijayakumar, M.; Schwenzer, B.; Shutthanandan, V.; Hu, J.Z.; Liu, J.; Aksay, I.A. Elucidating graphehe-ionic liquid interfacial region: A combined expermental and computational study. Nano Energy 2014, 3, 152–158. [Google Scholar] [CrossRef]
- Mo, Y.F.; Wan, Y.F.; Chou, A.; Huang, F.C. Graphene/ionic liquid composite films and ion exchange. Sci. Rep. 2014, 4, 5466. [Google Scholar] [CrossRef] [PubMed]
- Vatamanu, J.; Bedrov, D. Capacitive energy storage: Current and future challenges. J. Phys. Chem. Lett. 2015, 6, 3594–3609. [Google Scholar] [CrossRef] [PubMed]
- Lin, T.Y.; Kandlikar, S.G. A theoretical model for axial heat conduction effects during single-phase flow in microchannels. J. Heat Transf. 2012, 134, 020902. [Google Scholar] [CrossRef]
- Li, W.M.; Qu, X.P.; Alam, T.; Yang, F.H.; Chang, W.; Khan, J.; Li, C. Enhanced flow boiling in microchannels through integrating multiple micro-nozzles and reentry microcavities. Appl. Phys. Lett. 2017, 110, 014104. [Google Scholar] [CrossRef]
- Helmholtz, H. Studies of electrical interfaces. Ann. Phys. 1879, 243, 337–382. [Google Scholar] [CrossRef]
- Bolt, G.H. Analysis of the validity of the Gouy-Chapman theory of the electric double layer. J. Colloid Sci. 1955, 10, 206–218. [Google Scholar] [CrossRef]
- Oldham, K.B. A Gouy-Chapman-Stern model of the double layer at a (metal)/(ionic liquid) interface. J. Electroanal. Chem. 2008, 613, 131–138. [Google Scholar] [CrossRef]
- Kornyshev, A.A. Double-layer in ionic liquids: paradigm change? J. Phys. Chem. B 2007, 111, 5545–5557. [Google Scholar] [CrossRef] [PubMed]
- Feng, G.; Qiao, R.; Huang, J.S.; Dai, S.; Sumpter, B.J.; Meunier, V. The importance of ion size and electrode curvature on electrical double layers in ionic liquids. Phys. Chem. Chem. Phys. 2011, 13, 1152–1161. [Google Scholar] [CrossRef] [PubMed]
- Li, S.; Feng, G.; Bauelos, J.L.; Rother, G.; Fulvio, P.F.; Dai, S.; Cummings, P.T. Distinctive nanoscale organization of dicationic versus monocationic ionic liquids. J. Phys. Chem. C 2013, 117, 18251–18257. [Google Scholar] [CrossRef]
- Vatamanu, J.; Hu, Z.Z.; Bedrov, D. Increasing energy storage in electrochemical capacitors with ionic liquid electrolytes and nanostructured carbon electrodes. J. Phys. Chem. Lett. 2013, 4, 2829–2837. [Google Scholar] [CrossRef]
- Fedorov, M.V.; Kornyshev, A.A. Ionic liquid near a charged wall: Structure and capacitance of electrical double layer. J. Phys. Chem. B 2008, 112, 11868–11872. [Google Scholar] [CrossRef] [PubMed]
- Fedorov, M.V.; Georgi, N.; Kornyshev, A.A. Double layer in ionic liquids: The nature of the camel shape of capacitance. Electrochem. Commun. 2010, 12, 296–299. [Google Scholar] [CrossRef]
- Vatamanu, J.; Cao, L.L.; Borodin, O.; Bedrov, D.; Smith, G.D. On the influence of surface topographyc double layer structure and differential capacitance of graphite/ionic liquid interfaces. J. Phys. Chem. Lett. 2011, 2, 2267–2272. [Google Scholar] [CrossRef]
- Bo, Z.; Zhu, W.G.; Ma, W.; Wen, Z.H.; Shuai, X.R.; Chen, J.H. Vertically oriented graphene bridging active-layer/current-collector interface for ultrahigh rate supercapacitors. Adv. Mater. 2013, 25, 5799–5806. [Google Scholar] [CrossRef] [PubMed]
- Rappé, A.K.; Casewit, C.J.; Colwell, K.S.; Goddard, W.A., III; Skiff, W.M. UFF, a full periodic table force field for molecular mechanics and molecular dynamics simulations. J. Am. Chem. Soc. 1992, 114, 10024–10035. [Google Scholar]
- De Andrade, J.; Böes, E.S.; Stassen, H. Computational study of room temperature molten salts composed by 1-alkyl-3-methylimidazolium cations—Force-field proposal and validation. J. Phys. Chem. B 2002, 106, 13344–13351. [Google Scholar] [CrossRef]
- Nosé, S. A unified formulation of the constant temperature molecular dynamics methods. J. Chem. Phys. 1984, 81, 511–519. [Google Scholar] [CrossRef]
- Zhang, C.B.; Lu, P.F.; Chen, Y.P. Molecular dynamics simulation of electroosmotic flow in rough nanochannels. Int. J. Heat Mass Transf. 2014, 59, 101–105. [Google Scholar] [CrossRef]
- Nymand, T.M.; Linse, P. Ewald summation and reaction field methods for potentials with atomic charges, dipoles, and polarizabilities. J. Chem. Phys. 2000, 112, 6152–6160. [Google Scholar] [CrossRef]
- Nyden, M.R.; Stoliarov, S.I.; Westmoreland, P.R.; Guo, Z.X.; Jee, C. Applications of reactive molecular dynamics ot the study of the thermal decomposition of polymers and nanoscale structures. Mater. Sci. Eng. A 2004, 365, 114–121. [Google Scholar] [CrossRef]
- Dell, A.E.; Tsang, B.; Jiang, L.X.; Granick, S.; Schweizer, K.S. Correlated two-particle diffusion in dense colloidal suspensions at early times: Theory and comparison to experiment. Phys. Rev. E 2015, 92, 052304. [Google Scholar] [CrossRef] [PubMed]
- Outhwaite, C.W. Modified Poisson-Boltzmann equation in electric double layer theory based on the Bogoliubov-Born-Green-Yvon integral equations. J. Chem. Soc. 1978, 74, 1214–1221. [Google Scholar] [CrossRef]
- Singh, T.; Kumar, A. Static dielectric constant of room temperature ionic liquids: internal pressure and cohesive energy density approach. J. Phys. Chem. B 2008, 112, 12968–12972. [Google Scholar] [CrossRef] [PubMed]
Figure 1.
The detailed illustration of the simulation system: (a) ion structure of [EMIM]+ and [BF4]−, (b) stack structure of graphene electrode, (c) interface models of graphene/ion liquid with non-rough and rough graphene surface.
Figure 1.
The detailed illustration of the simulation system: (a) ion structure of [EMIM]+ and [BF4]−, (b) stack structure of graphene electrode, (c) interface models of graphene/ion liquid with non-rough and rough graphene surface.
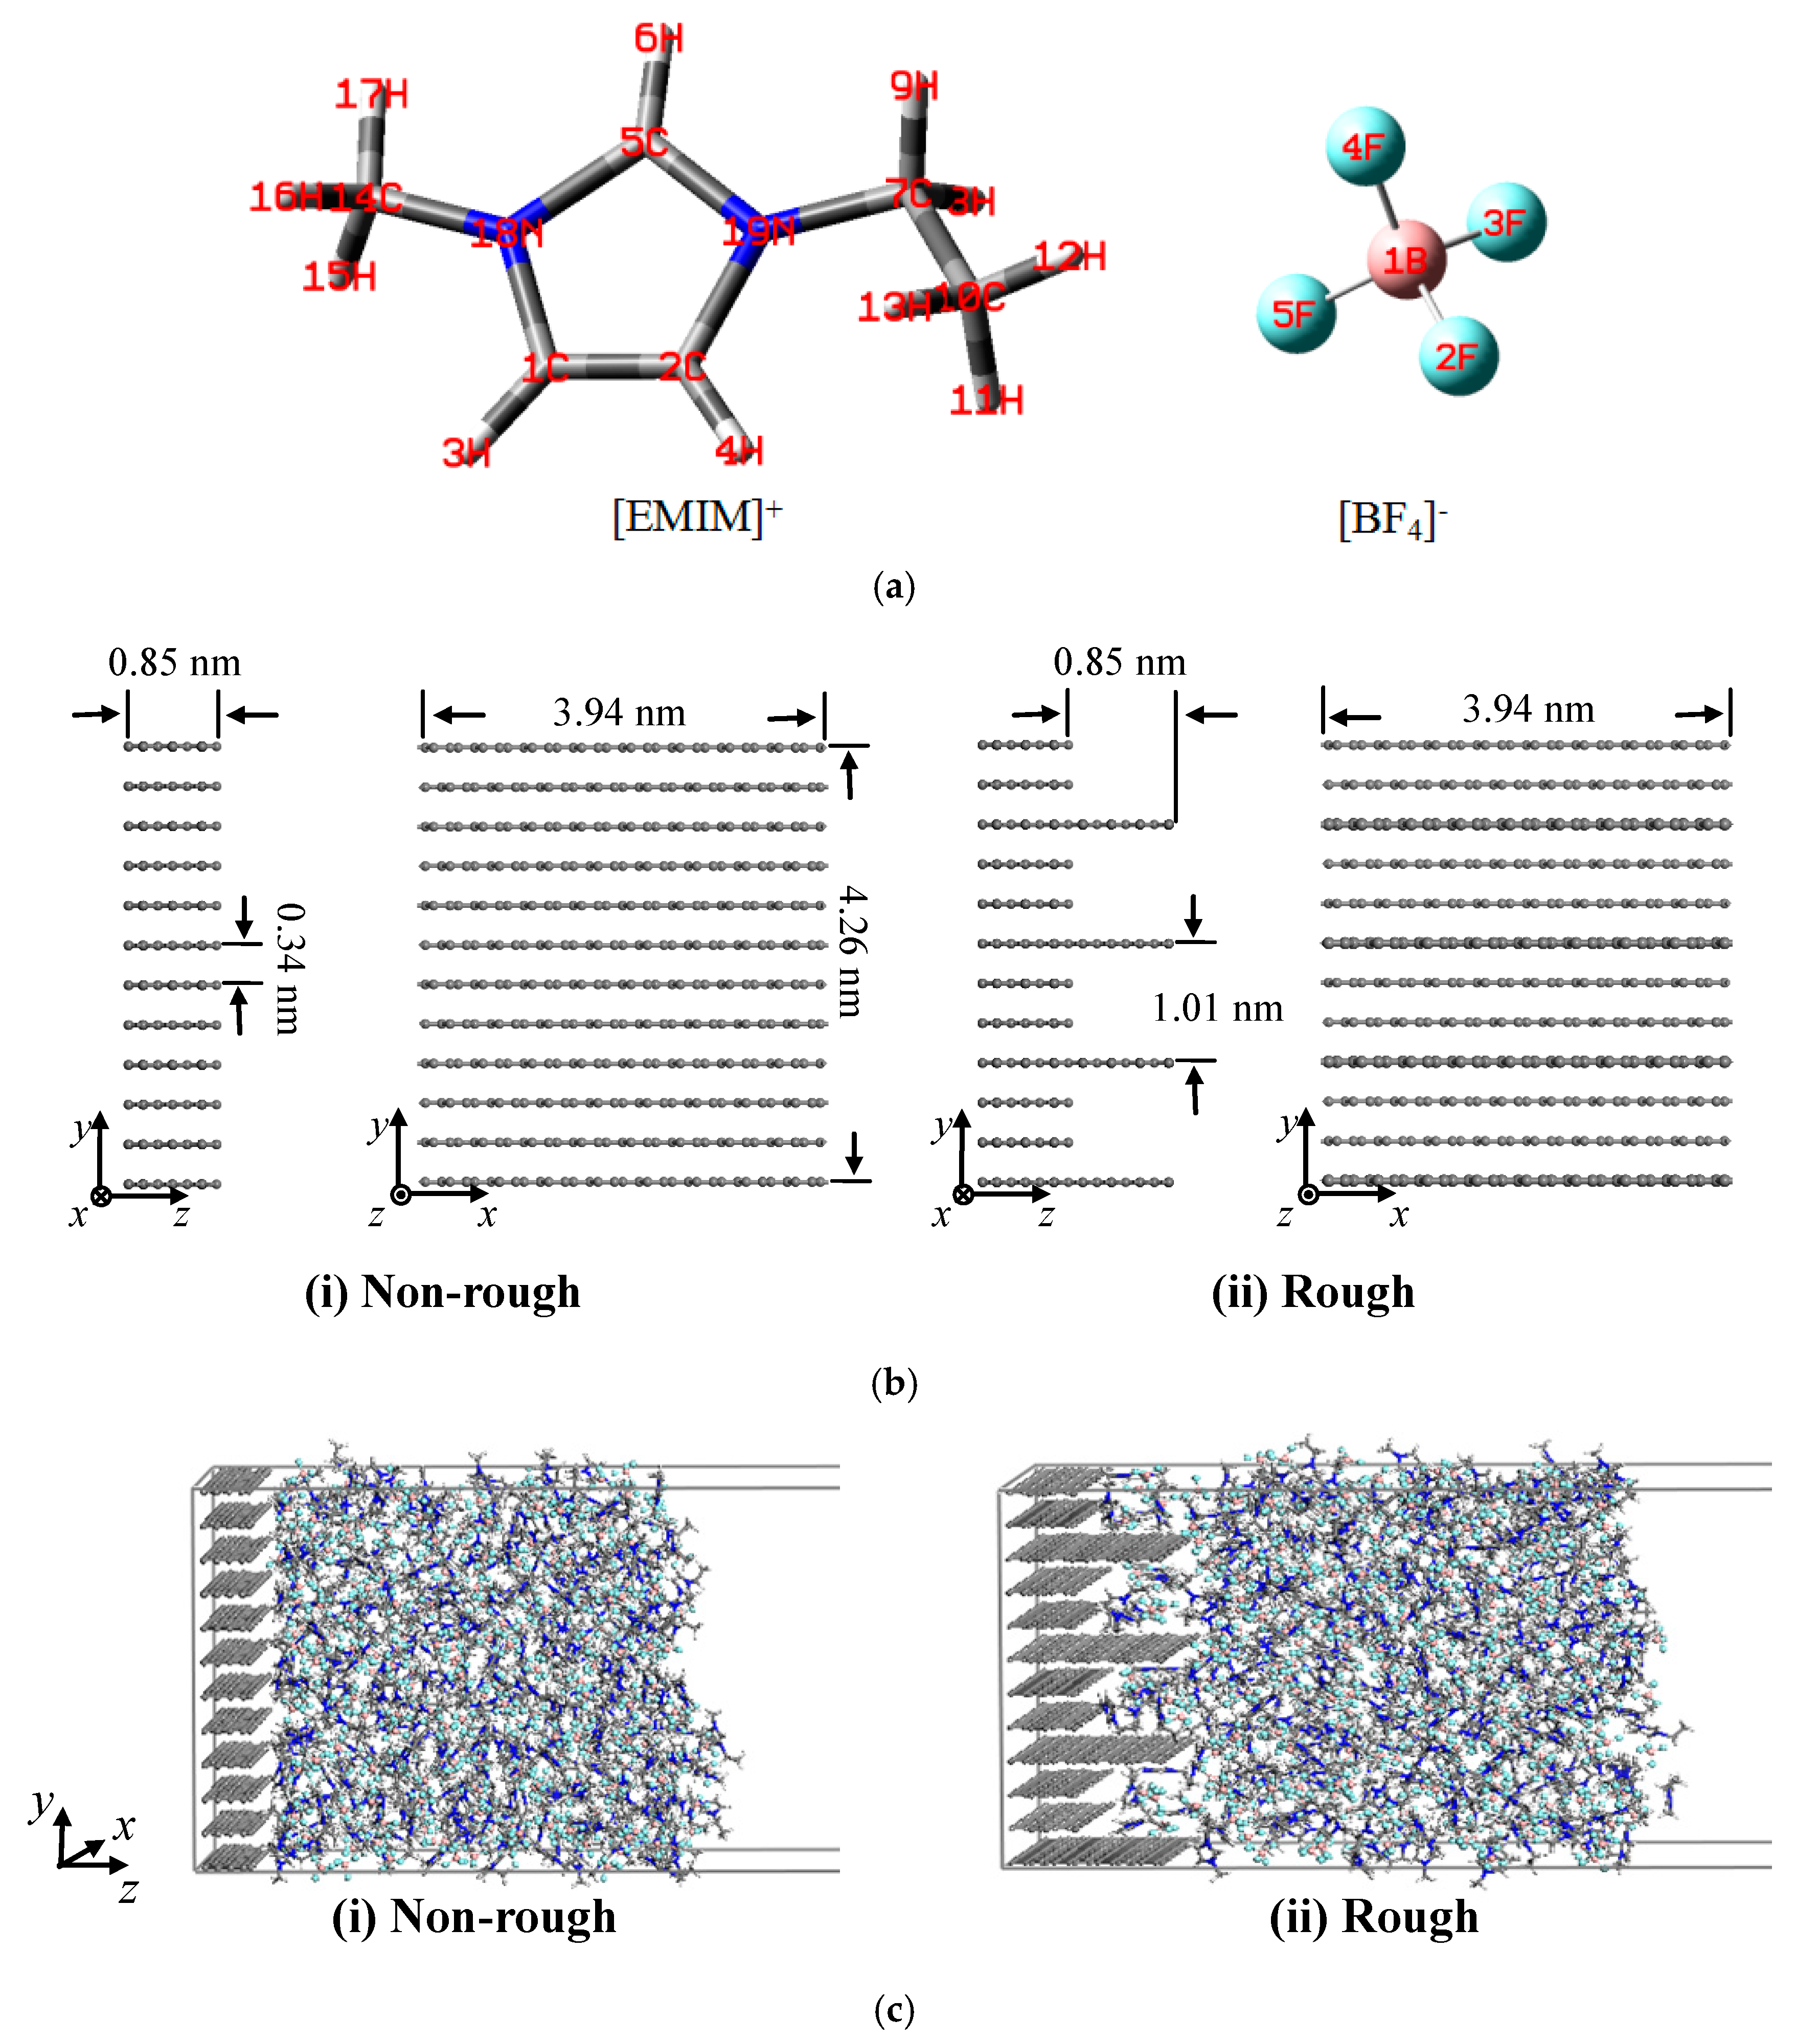
Figure 2.
Snapshots of ions in the layer close to the non-rough electrode surface with different charges: (a) σ = 0 e/atom, (b) σ = +0.5 e/atom, (c) σ = −0.5 e/atom.
Figure 2.
Snapshots of ions in the layer close to the non-rough electrode surface with different charges: (a) σ = 0 e/atom, (b) σ = +0.5 e/atom, (c) σ = −0.5 e/atom.
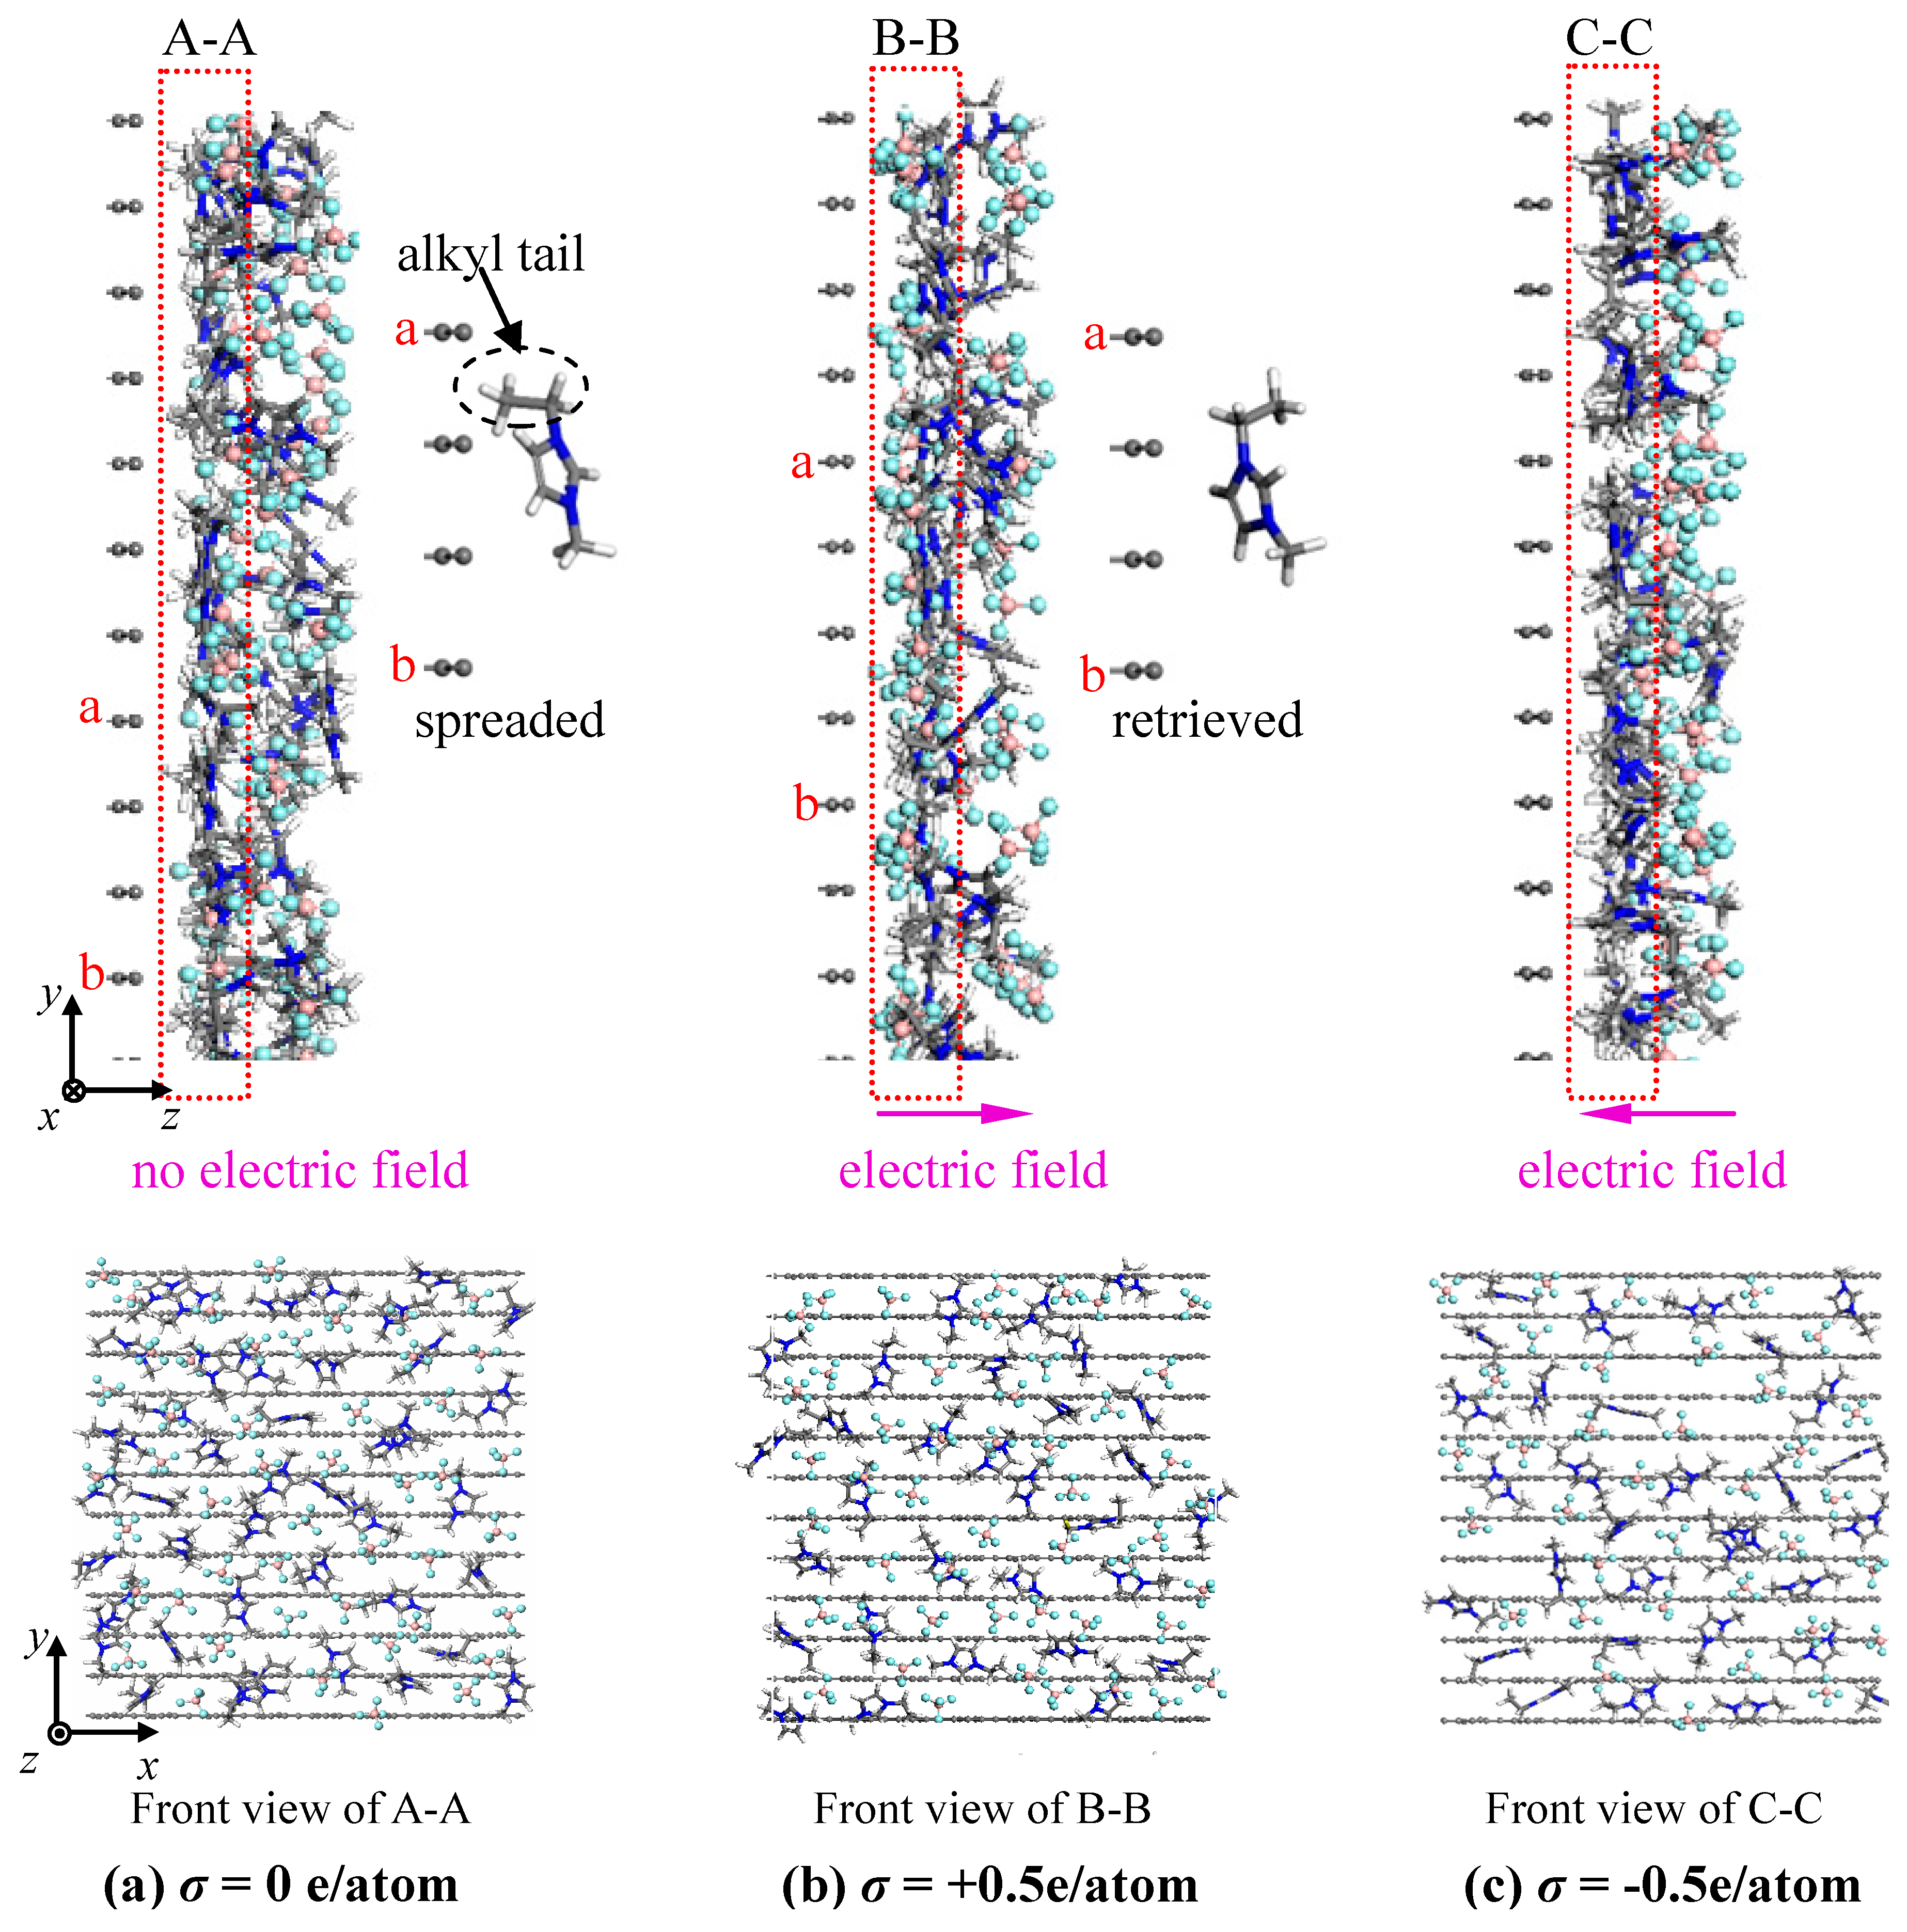
Figure 3.
Snapshots of ions in the layer close to the rough electrode surface with different charges: (a) σ = 0 e/atom, (b) σ = +0.5 e/atom, (c) σ = −0.5 e/atom.
Figure 3.
Snapshots of ions in the layer close to the rough electrode surface with different charges: (a) σ = 0 e/atom, (b) σ = +0.5 e/atom, (c) σ = −0.5 e/atom.

Figure 4.
Concentration profiles of [EMIM]+ cations and [BF4]− anions near charged/uncharged non-rough electrodes: (a) σ = 0 e/atom, (b) σ = +0.05 e/atom, (c) σ = −0.05 e/atom.
Figure 4.
Concentration profiles of [EMIM]+ cations and [BF4]− anions near charged/uncharged non-rough electrodes: (a) σ = 0 e/atom, (b) σ = +0.05 e/atom, (c) σ = −0.05 e/atom.
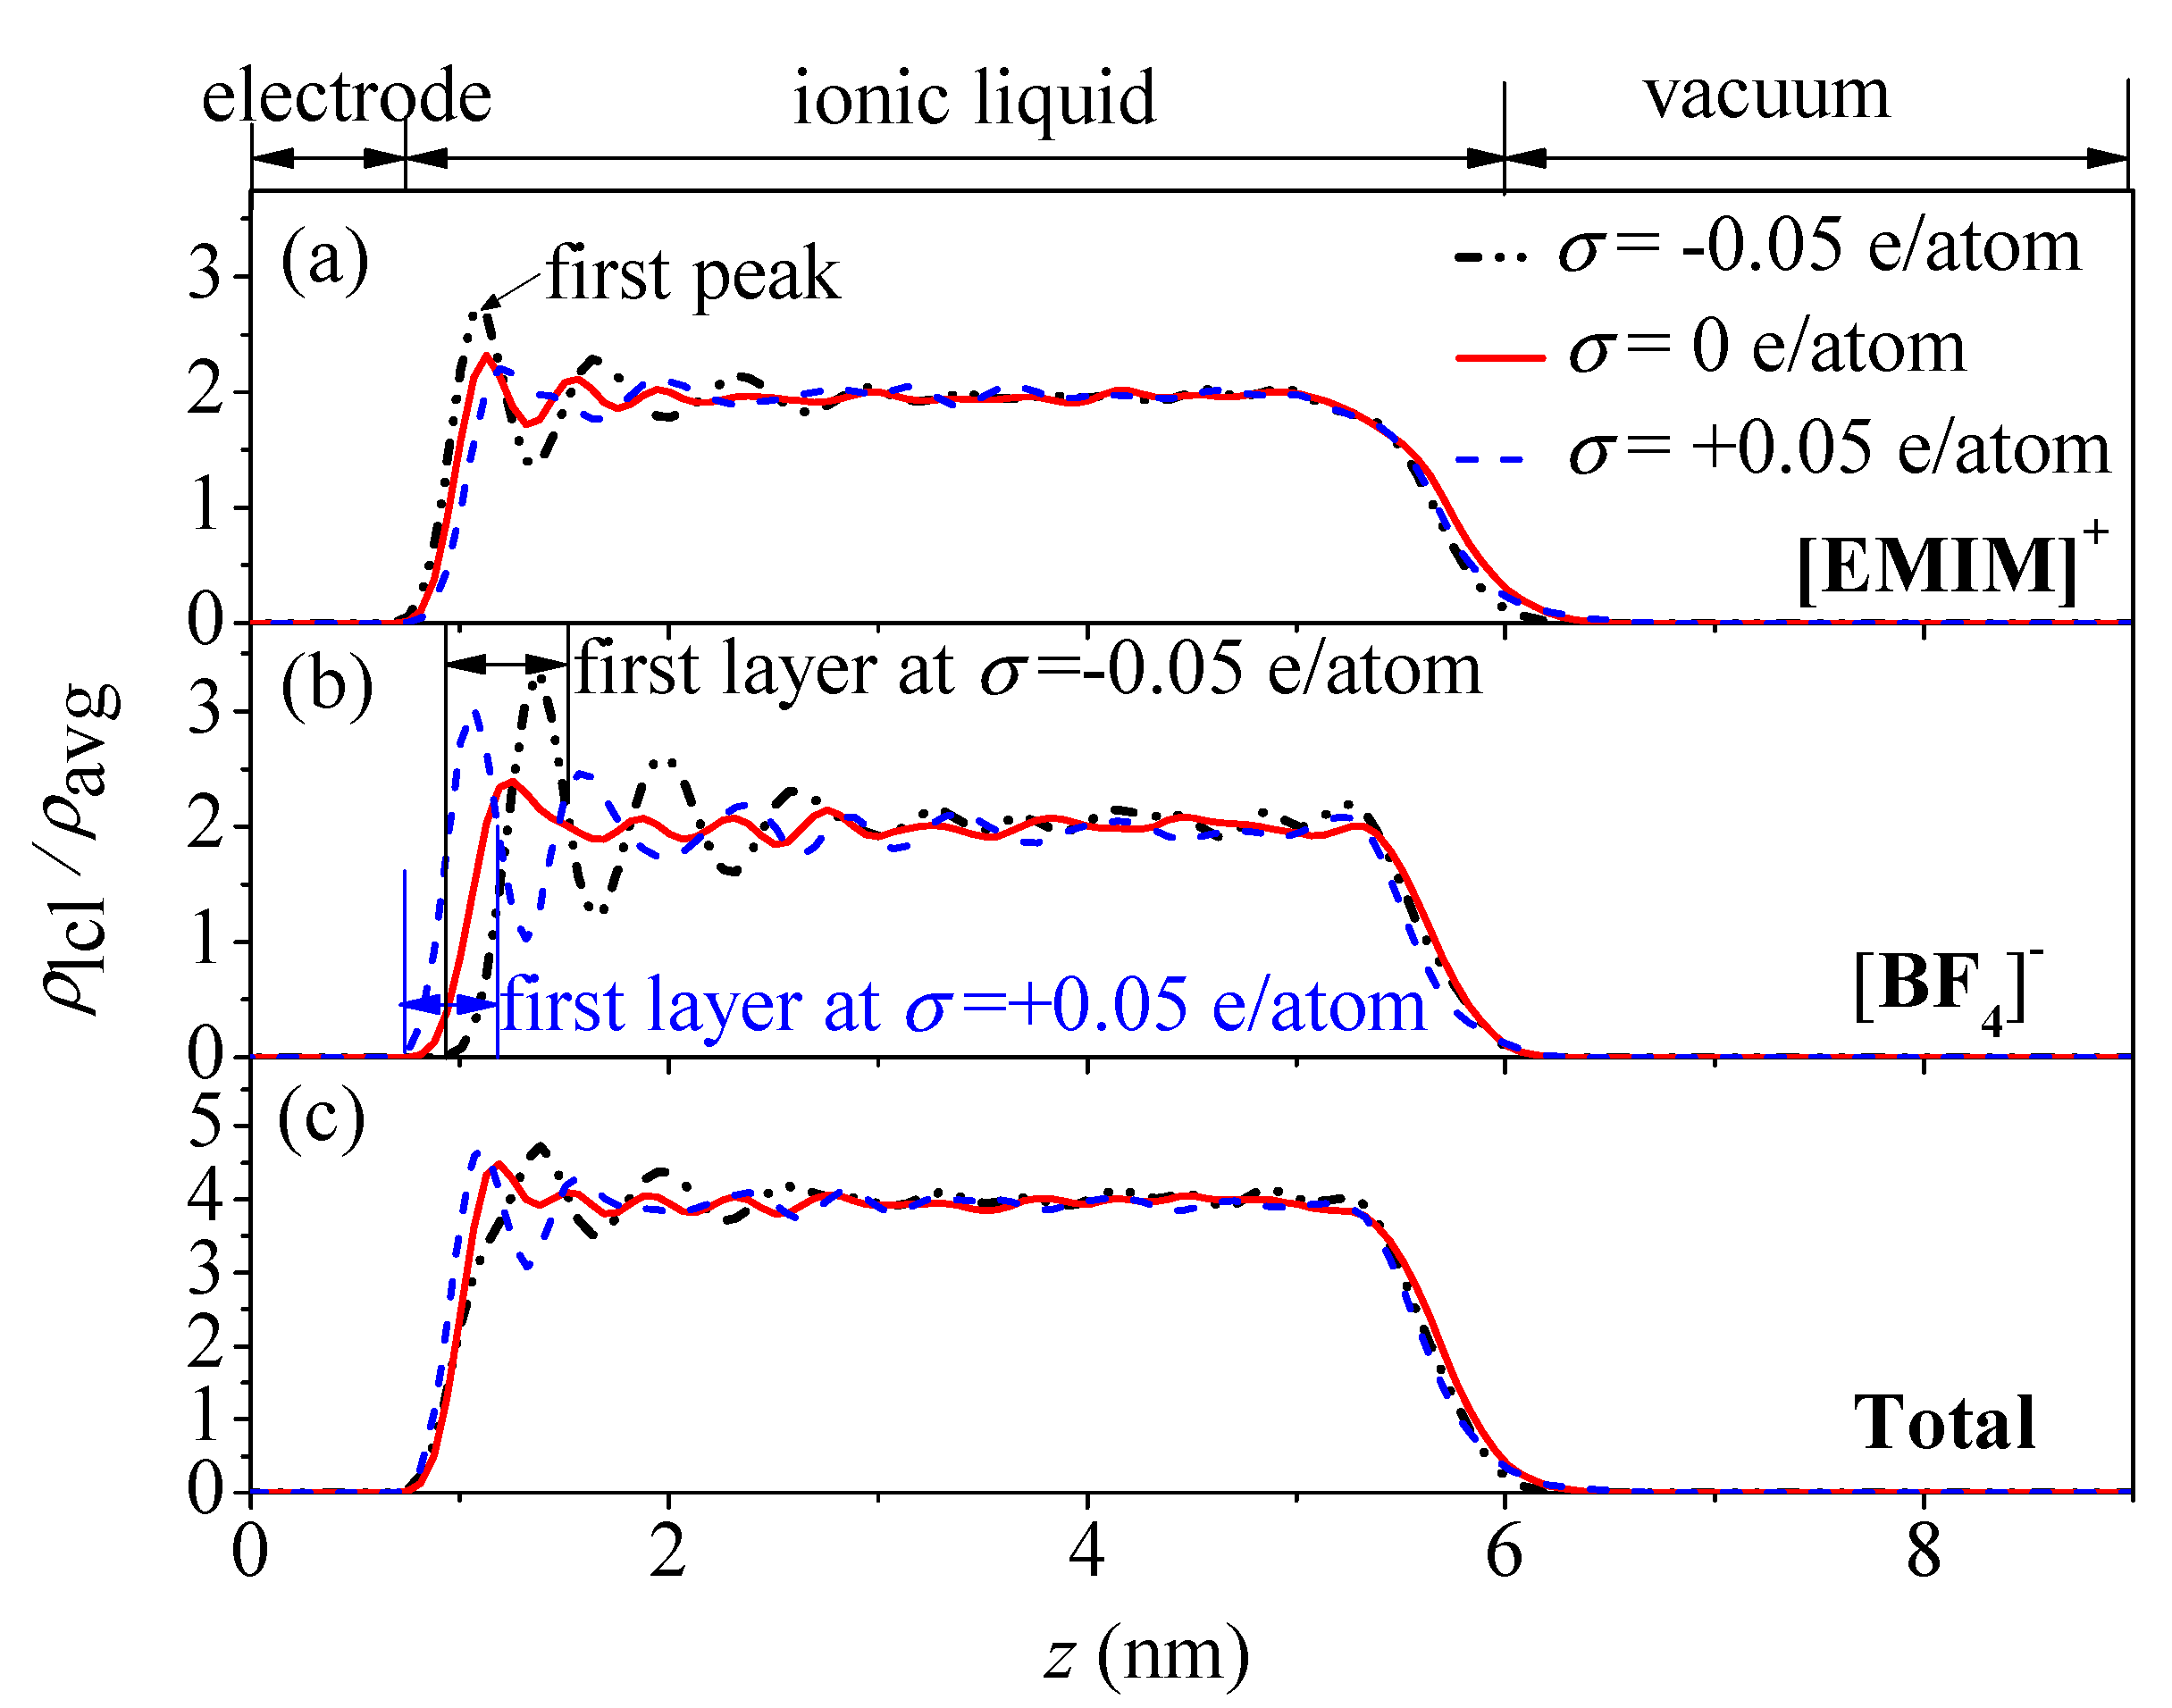
Figure 5.
Concentration profiles of [EMIM]+ cations and [BF4]− anions near charged/uncharged rough electrodes. (a) σ = 0 e/atom, (b) σ = +0.05 e/atom, (c) σ = −0.05 e/atom.
Figure 5.
Concentration profiles of [EMIM]+ cations and [BF4]− anions near charged/uncharged rough electrodes. (a) σ = 0 e/atom, (b) σ = +0.05 e/atom, (c) σ = −0.05 e/atom.
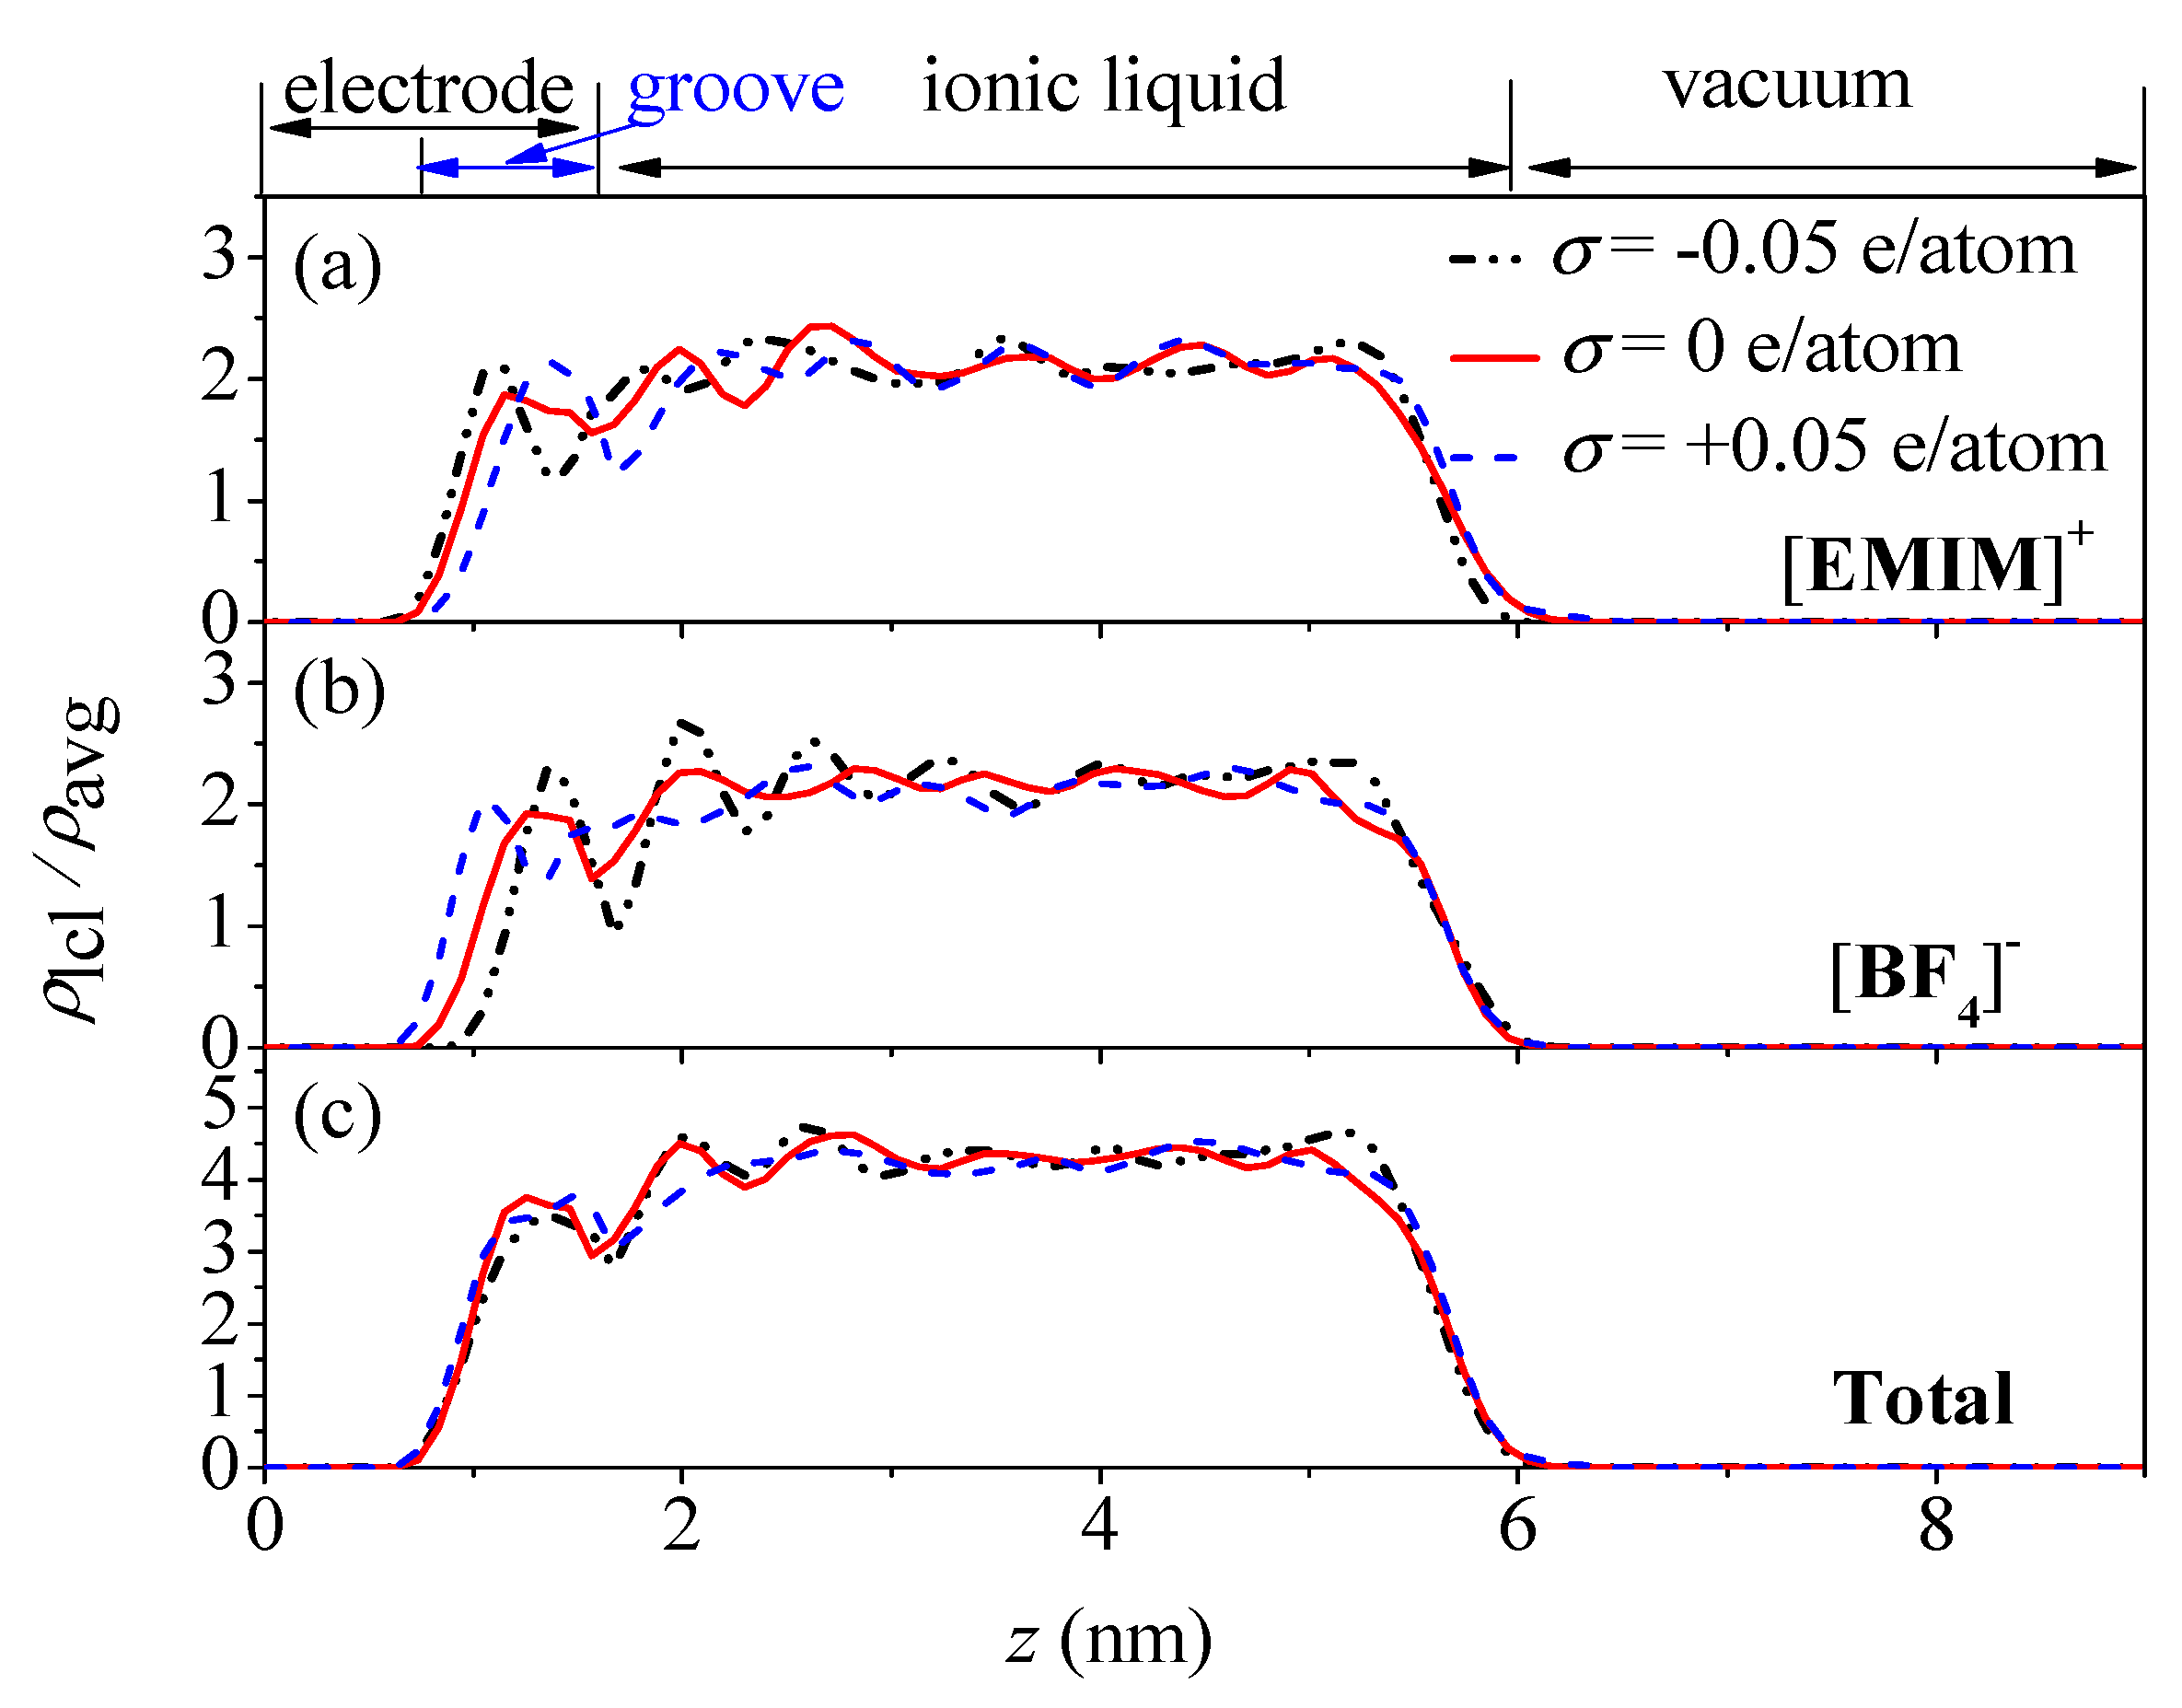
Figure 6.
Ion–ion radial distribution functions (RDFs) for the [EMIM]+/[BF4]− electrolyte on the non-rough neutral electrode surface.
Figure 6.
Ion–ion radial distribution functions (RDFs) for the [EMIM]+/[BF4]− electrolyte on the non-rough neutral electrode surface.
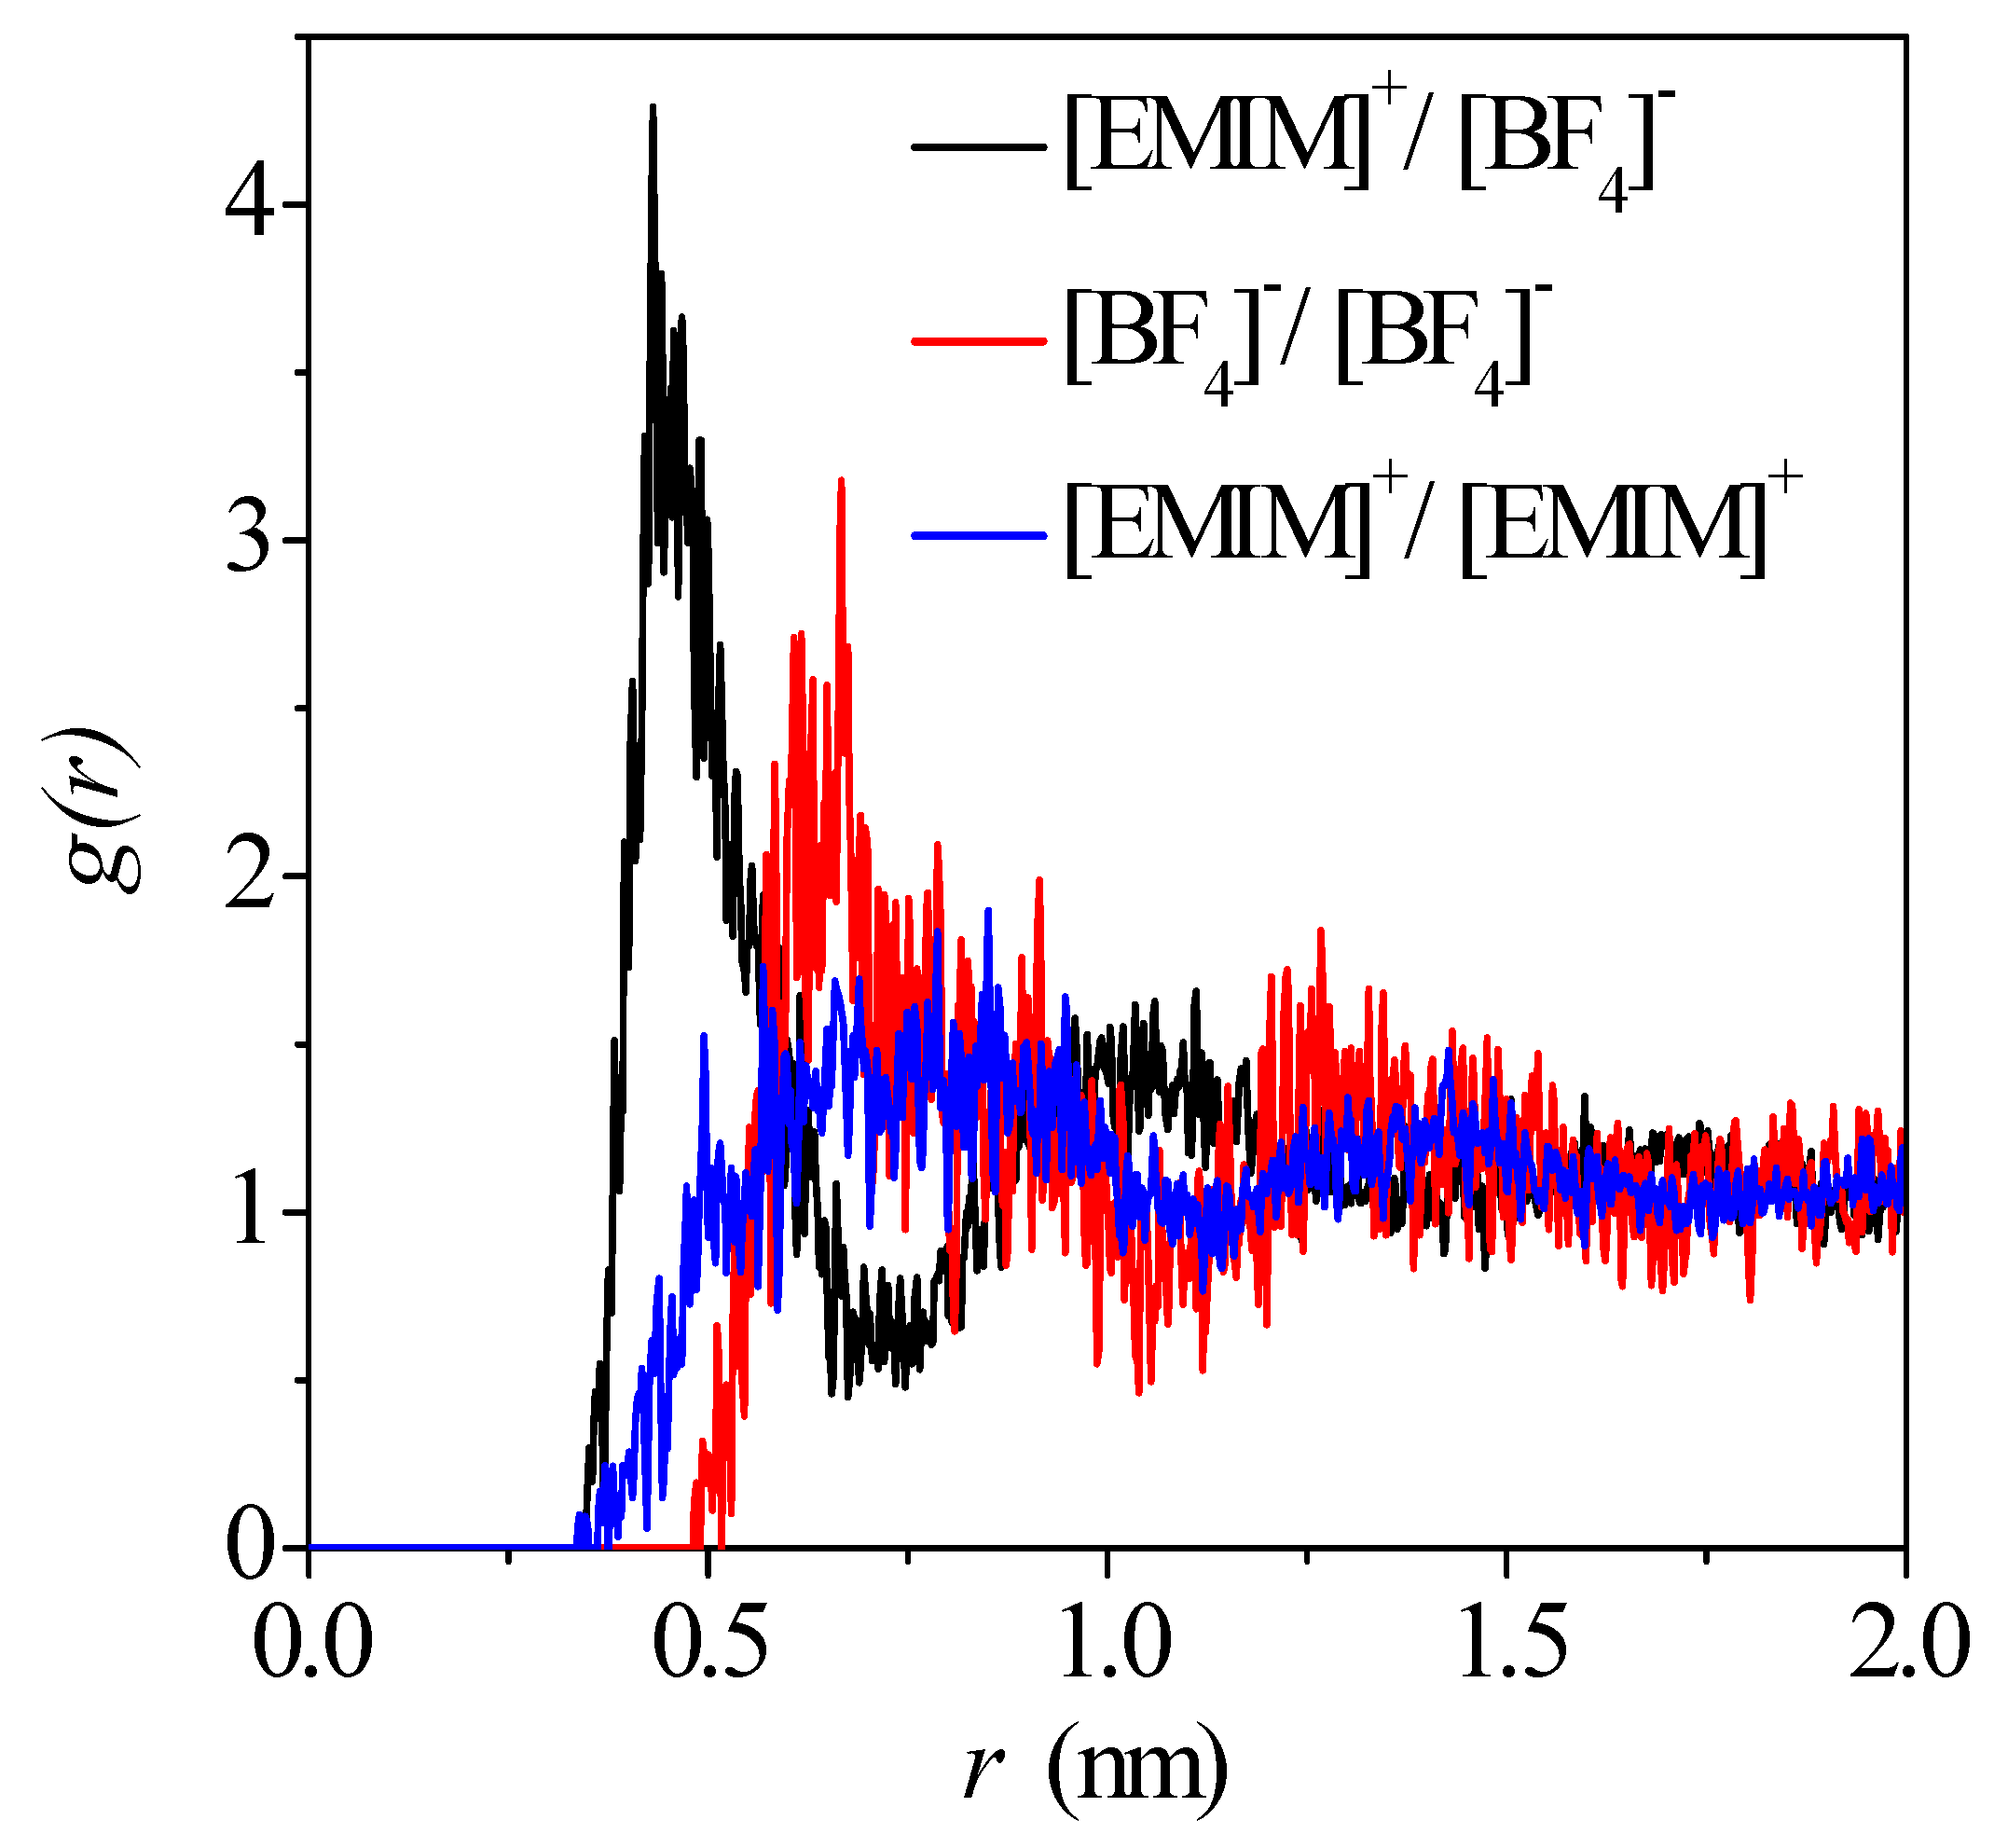
Figure 7.
Total interaction energies of the [EMIM]+ ion and [BF4]− ion at different positions on the neutral electrode surface.
Figure 7.
Total interaction energies of the [EMIM]+ ion and [BF4]− ion at different positions on the neutral electrode surface.

Figure 8.
Correlation between the electrode charge density and the potential drop across the electrical double layers (EDLs) on the non-rough and rough electrodes.
Figure 8.
Correlation between the electrode charge density and the potential drop across the electrical double layers (EDLs) on the non-rough and rough electrodes.

Figure 9.
Correlation between the capacitance and the potential drop across the EDLs on the rough and non-rough electrodes.
Figure 9.
Correlation between the capacitance and the potential drop across the EDLs on the rough and non-rough electrodes.

Table 1.
Atom types and partial charges on the atoms of cation and anion.
| Atoms | Atom Type | q(e) | Atoms | Atom Type | q(e) |
|---|---|---|---|---|---|
| 1C | C_R | −0.167 | 14C | C_3 | −0.166 |
| 2C | C_R | −0.192 | 15H | H_b | 0.129 |
| 3H | C_R | 0.248 | 16H | H_b | 0.129 |
| 4H | H_b | 0.259 | 17H | H_b | 0.129 |
| 5C | C_R | 0.058 | 18N | N_R | 0.079 |
| 6H | H_b | 0.205 | 19N | N_R | −0.010 |
| 7C | C_3 | 0.033 | 1B | B_3 | 0.828 |
| 8H | H_b | 0.089 | 2F | F_ | −0.457 |
| 9H | H_b | 0.089 | 3F | F_ | −0.457 |
| 10C | C_3 | −0.079 | 4F | F_ | −0.457 |
| 11H | H_b | 0.056 | 5F | F_ | −0.457 |
| 12H | H_b | 0.056 | - | - | - |
| 13H | H_b | 0.056 | - | - | - |
© 2017 by the authors. Licensee MDPI, Basel, Switzerland. This article is an open access article distributed under the terms and conditions of the Creative Commons Attribution (CC BY) license (http://creativecommons.org/licenses/by/4.0/).
Share and Cite
MDPI and ACS Style
Lu, P.; Dai, Q.; Wu, L.; Liu, X. Structure and Capacitance of Electrical Double Layers at the Graphene–Ionic Liquid Interface. Appl. Sci. 2017, 7, 939. https://doi.org/10.3390/app7090939
AMA Style
Lu P, Dai Q, Wu L, Liu X. Structure and Capacitance of Electrical Double Layers at the Graphene–Ionic Liquid Interface. Applied Sciences. 2017; 7(9):939. https://doi.org/10.3390/app7090939
Chicago/Turabian StyleLu, Pengfei, Qiaobo Dai, Liangyu Wu, and Xiangdong Liu. 2017. "Structure and Capacitance of Electrical Double Layers at the Graphene–Ionic Liquid Interface" Applied Sciences 7, no. 9: 939. https://doi.org/10.3390/app7090939
Note that from the first issue of 2016, this journal uses article numbers instead of page numbers. See further details here.