Application of Artificial Neural Networks to Ship Detection from X-Band Kompsat-5 Imagery


1
Department of Geoinformatics, University of Seoul, Seoul 02504, Korea
2
Center for Environmental Assessment Monitoring, Environmental Assessment Group, Korea Environment Institute (KEI), Sejong-si 30147, Korea
*
Author to whom correspondence should be addressed.
Appl. Sci. 2017, 7(9), 961; https://doi.org/10.3390/app7090961
Submission received: 31 July 2017
/
Revised: 10 September 2017
/
Accepted: 18 September 2017
/
Published: 20 September 2017
(This article belongs to the Special Issue Application of Artificial Neural Networks in Geoinformatics)
Abstract
:For ship detection, X-band synthetic aperture radar (SAR) imagery provides very useful data, in that ship targets look much brighter than surrounding sea clutter due to the corner-reflection effect. However, there are many phenomena which bring out false detection in the SAR image, such as noise of background, ghost phenomena, side-lobe effects and so on. Therefore, when ship-detection algorithms are carried out, we should consider these effects and mitigate them to acquire a better result. In this paper, we propose an efficient method to detect ship targets from X-band Kompsat-5 SAR imagery using the artificial neural network (ANN). The method produces the ship-probability map using ANN, and then detects ships from the ship-probability map by using a threshold value. For the purpose of getting an improved ship detection, we strived to produce optimal input layers used for ANN. In order to reduce phenomena related to the false detections, the non-local (NL)-means filter and median filter were utilized. The NL-means filter effectively reduced noise on SAR imagery without smoothing edges of the objects, and the median filter was used to remove ship targets in SAR imagery. Through the filtering approaches, we generated two input layers from a Kompsat-5 SAR image, and created a ship-probability map via ANN from the two input layers. When the threshold value of 0.67 was imposed on the ship-probability map, the result of ship detection from the ship-probability map was a 93.9% recall, 98.7% precision and 6.1% false alarm rate. Therefore, the proposed method was successfully applied to the ship detection from the Kompsat-5 SAR image.
1. Introduction
Ship-detection algorithms from SAR images have been proposed by many researchers [1,2,3,4,5]. Most methods exploit the fact that ships on SAR images are much brighter than the sea surface due to the corner-reflection effect [6,7]. That is, the ship is a target having a higher backscatter coefficient, and hence the ship is very bright in SAR imagery, while the sea surface is very dark in SAR imagery because it has a lower backscatter coefficient.
Constant false-alarm rate (CFAR) has been widely used for ship detection. The CFAR detects ships by finding a threshold value using the probability density function (PDF) of background clutter [8,9,10,11]. However, detection results from the CFAR algorithm can be biased by statistical variables such as mean and standard deviation, because the false-alarm rate must be fixed [12]. In addition, the CFAR algorithm has the disadvantages that it is very complex and time-consuming [13]. The adaptive threshold approach is very similar to CFAR in that it estimates the mean and standard deviation of an image using constant value c, but the approach has a drawback in that it does not consider the characteristics of background noise [14].
Recently, many studies have relied on image-based feature extraction (machine learning) methods, such as the artificial neural network (ANN) and support vector machine (SVM) methods [15,16]. The machine-learning analyzes the input data by calculating weighting factors from the relation between input data and training set. Thus, results from the machine learning can be varied according to input data and training set [17]. This means that the performance of the machine-learning algorithm is largely dependent on the selection of input data and training sets. In order to choose the training set for ship detection, we can use automatic identification system (AIS) data if it is available, whereas we can select the training set from a map which is manually created if AIS data is not available [18]. Thus, the selection of training set used for ship detection is not very difficult. However, the selection of input layers used for ship detection is not easy. The limitations of ship detection using the machine-learning algorithm are as follows:
Firstly, image characteristics have been ignored when the ANN approach is applied to the detection of a target. For a better detection of the detected target using machine learning, image characteristics of the detected target must be emphasized, while those of other targets should be not underlined. Consequently, the input layers of ANN must be created from the image after target-emphasis procedures are done. This means that we need to emphasize ships in an SAR image in order to detect ships from SAR images. However, in most previous studies, input layers have not been created from SAR images without ship emphasis processing [19,20,21,22]. The SAR images have speckle noise, the ghost phenomena, the side-lobe effect, and so on. The SAR image characteristics affect the precision of ship detection. To remarkably reduce the negative effects in the ANN approach, we need to minimize these effects. Moreover, the Kompsat-5 SAR image has severe ghost phenomena and side-lobe effects. Additional steps to mitigate the effects should be applied to the Kompsat-5 image.
Secondly, subset images have usually been used to validate the ship detection algorithm in the previous studies [17,23]. When ships are detected from SAR images, the most important thing is to minimize the negative effects from background noise, the side-lobe effect, wave effect, land area effect and so on. Thus, it is a better choice that the algorithm performance is validated by using the full scene. Therefore, for a better performance of the ship detection using the ANN approach, the input layers of ANN should be created by minimizing the negative effects of the Kompsat-5 SAR image, and the detection performance should be tested and validated by using the full scene rather than the sub-image.
In this paper, we propose an efficient method to detect ship targets from X-band Kompsat-5 SAR imagery using the ANN approach. The proposed method creates two input layers for ship detection through optimal image processing in order to consider Kompsat-5 SAR image characteristics. The method is tested and validated by using a full-scene Kompsat-5 SAR image. The detection procedure is as follows: (1) two input layers, an intensity differential map and a texture differential map, are generated from an SAR image using the azimuth low-pass filter, the non-local (NL)-means filter, the median filter, the sum-of-square (SS) operation, and so on; (2) a ship-probability map is created by the ANN approach; and (3) ships are detected from the map by using a threshold value. The NL-means filter and median filter were used to reduce phenomena related to the false detections. The NL-means filter effectively reduced noise on SAR imagery without smoothing edges of the objects, while the median filter was used to remove ship targets in SAR imagery. For the performance validation of the proposed method, the X-band Kompsat-5 SAR data with horizontal transmitting and horizontal receiving (HH) polarization was used in the study. A total number of 78 ship targets were extracted from the test full scene via a visual analysis and used to calculate the precision, recall and false detection rate.
2. Test Data
X-band Kompsat-5 SAR data with the HH single polarization of the standard mode was used in this study (Figure 1). The data was provided in the single look complex (SLC) Level 1A format, and the detailed information for the data is summarized in Table 1. As seen in Figure 1, ships on sea and artificial structures on the land are very bright due to the corner reflection effect in SAR imagery. Especially, the ghost phenomenon is very severe in the Kompsat-5 SAR image as seen Figure 1b, and the side-lobe effect is severe in the image as seen Figure 1a. The side-lobe effect is caused by the matched filtering when the SAR image compression is applied [24,25]. The compression of the raw radar signal is represented as a sinc function, and the side lobes of the sinc function are relatively high. The ghost phenomena are caused by aliasing of the Doppler phase history of each target [26]. If the ghost phenomena occur in a SAR image, after-images of land objects having high backscattering coefficients appear in the ocean, and hence, the after-images can be misunderstood as ships because they are much brighter than the sea surface. Therefore, the side-lobe effect and ghost phenomena should be mitigated before detecting ship targets, because they degrade the quality of an image and are an obstacle to ship detection.
The shuttle radar topography mission digital elevation model (SRTM DEM) with a spatial resolution of 30 m was used for this study [27]. A synthetic SAR image was simulated from the SRTM DEM and used to mask land area in the SAR image, in order to remove false alarms from the land area. However, some areas, such as fish farms, offshore bars and so on, were still left in the SAR image. The structures over the areas could bring out false detection, as shown in Figure 1c,d. Therefore, we need to mitigate the false detection from the structures for a better ship detection precision.
3. Methods
In this study, we proposed an efficient method to detect ships from Kompsat-5 SAR imagery through the ANN approach. A key of the proposed method is that the input layer of the ANN approach uses two ship-emphasized images through minimizing the negative effects of the SAR image characteristics. Figure 2 presents the detailed workflow of the proposed method. The proposed method is categorized into (1) input-layer generation from a SAR image via SAR image processing, (2) ship-probability map creation through the ANN approach and (3) ship identification from the probability map using threshold value.
For more-optimal input-layer generation, we need to (1) enhance ships in the SAR image and (2) reduce the negative effects of the SAR image characteristics, such as the speckle noise, ghost phenomena, side-lobe effect, and so on. Especially, since the negative effects are very severe in the X-band Kompsat-5 image, the effects should be corrected. The input-layer generation procedure is as follows:
- (1)
- azimuth low-pass filtering, which is designed to mitigate the ghost phenomena,
- (2)
- multi-look processing, which is normally used for speckle noise reduction,
- (3)
- sigma-naught conversion, which includes a unit conversion,
- (4)
- intensity differential image creation,
- (5)
- texture differential image creation.
The azimuth low-pass filtering is used to mitigate the ghost phenomena. This filter is designed to reduce the azimuth processing bandwidth. If the azimuth processing bandwidth is large, the spatial resolution is high while the ghost effect is severe. Otherwise, low spatial resolution and reduced ghost effect can be seen in the SAR image. For the filter, the SAR SLC image is Fourier transformed in the azimuth direction, and then multiplied with the Hanning window having the bandwidth of n·PRF, where n is a fraction factor and PRF is the pulse repetition frequency. The fraction factor n depends on the characteristics of SAR sensor. Finally, we obtain the ghost-mitigated SLC image after the inverse Fourier transform is applied. The multi-look processing is used for the speckle noise reduction. It is well-known that this step improves SAR image quality [28,29]. The multi-looked SAR image is converted into the sigma-naught image, which has a decibel unit.
In order to create intensity- and texture-differential images, the NL-means and median filters are used. The PDF of the sigma-naught image is a normal distribution, and hence the NL-means filter can be properly applied to the sigma-naught image. The NL-means filter smooths images using weighting factors that are estimated from a similarity between the center and adjacent pixels. For this, the filter uses two moving window kernels, unlike conventional filters. The smoothing factors of the filter can be determined from the standard deviation of noisy areas. Generally, conventional smoothing filters reduce the noise component of images while they smooth the edge of objects. However, the NL-means filter can reduce the noise without smoothing the object edges. Thus, when the NL-means filter is applied to the ship detection, the edge of ships can be preserved while the noise can be well-reduced. The median filter estimates the median value from the window kernel, and hence the filter does effectively remove outliers. The filter has been widely used for smoothing SAR images due to the speckle noise characteristics. The median filter is used to remove small bright objects, such as ship objects, from the SAR image. The details for the intensity- and texture-differential image generation will be followed in the subsections.
After the two input layers are created, the land areas in the input layers are masked out by using the SRTM DEM. Then, they are used for the ANN approach, and finally, the ship-probability map is created. If ground-truth data, such as the automatic information system (AIS), are available, they can be used for training and verification. However, since in-situ data is not available in this study, the training set for the ANN approach is determined by using a statistical threshold technique. Training samples of the ship detection are determined from the range calculated from the intensity-differential image. The ship training samples (PS) are selected as follows:
where P(i,j) is the pixel value at the range i and azimuth j, TS is the threshold value for the ship samples, MAX(P) is the maximum value of all of the pixels and Range(P) is the range, which is defined as MAX(P) − MIN(P). The non-ship training samples (PNS) are selected by:
where TNS is the threshold value for the non-ship samples. The threshold values of TS = 0.4 and TNS = 0.1 are used for this study, because the standard deviation of sea objects is a smaller value whereas that of ship objects is a higher value.
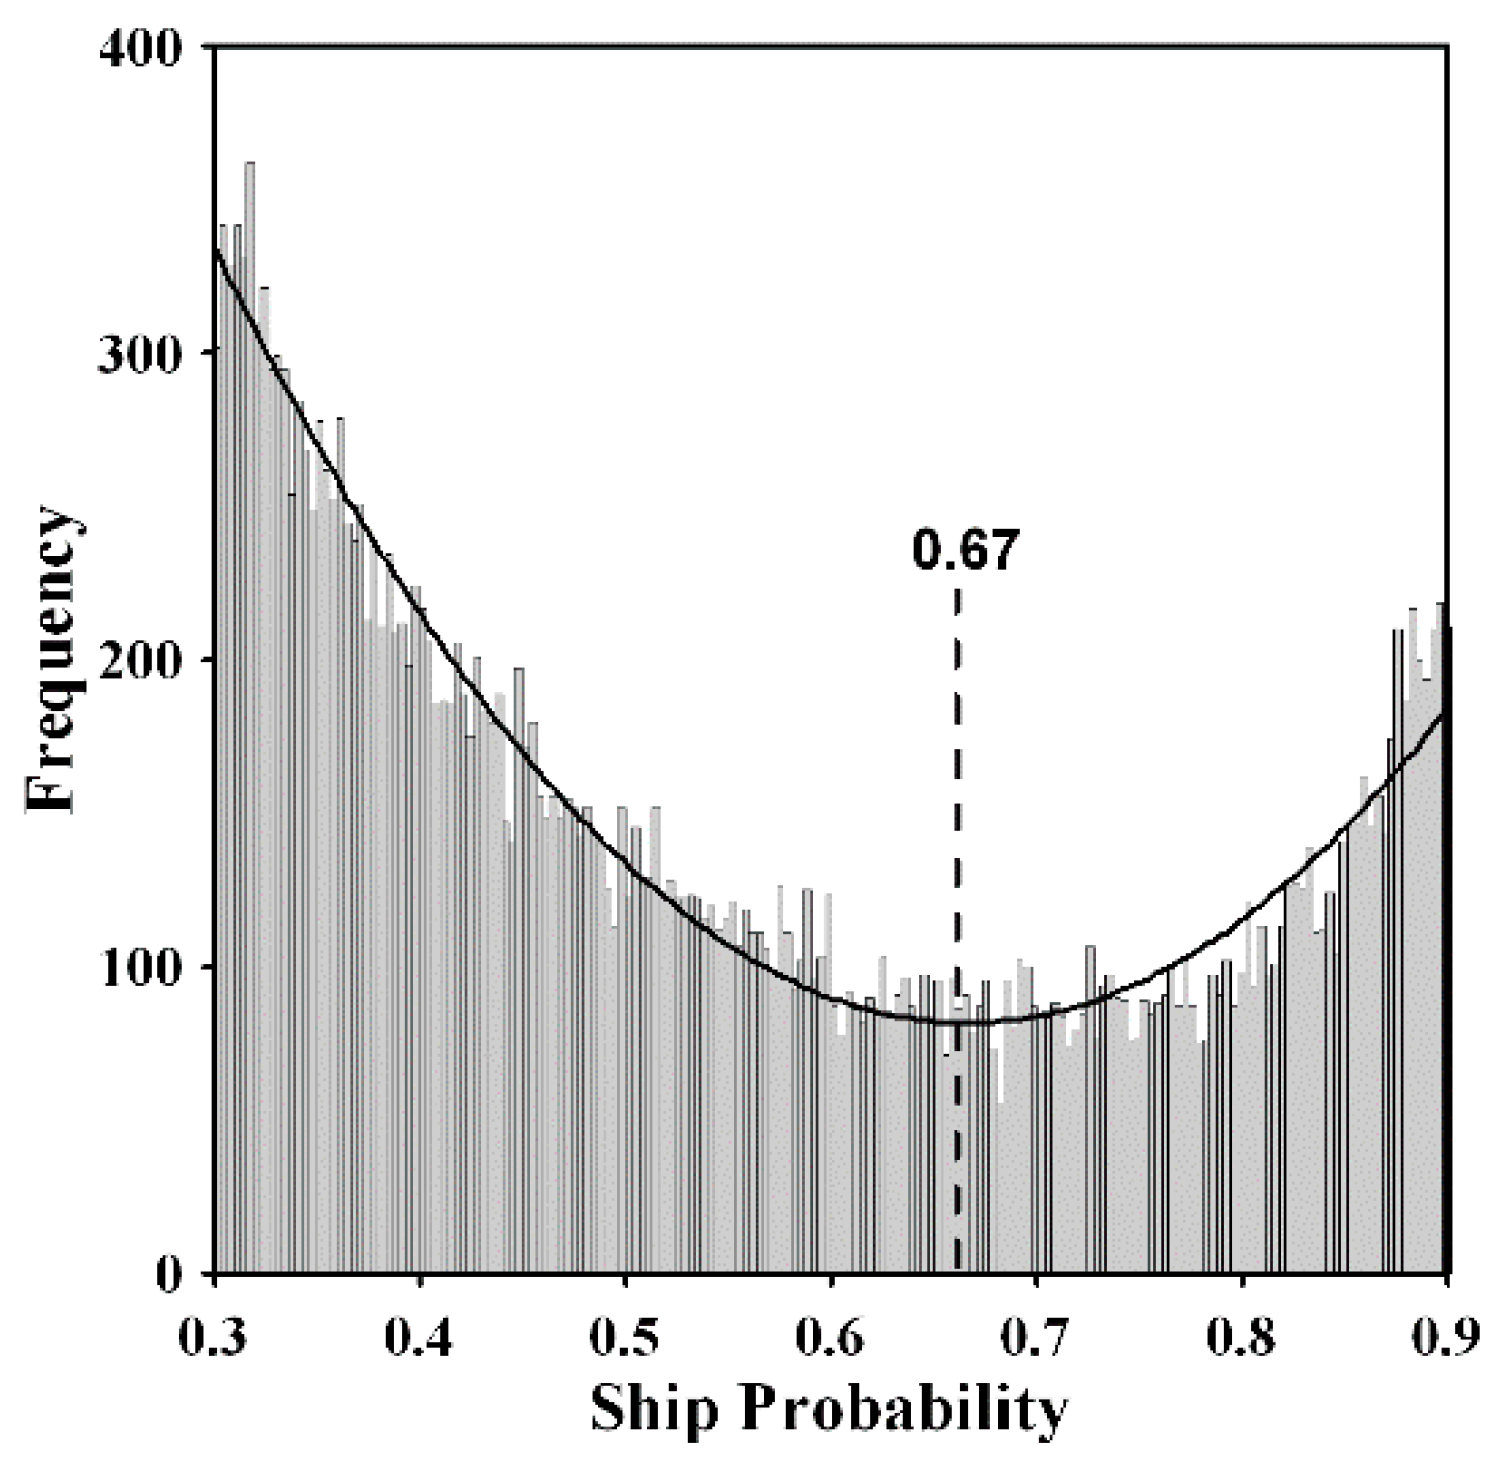
The final ship detection is performed by applying a threshold value to the ship-probability map. The threshold value is estimated from the histogram of the ship-probability map. This step is done by finding a point that the two PDFs from the ship and non-ship objects cross.
3.1. Intensity Differential Image
The intensity-differential image is created from the sigma-naught image by using the NL-means and median filter operations. Then, the image is used as the input layer of the ANN approach. The intensity-differential image is created by the following procedure:
- (1)
- applying the NL-means filter to the sigma-naught image,
- (2)
- applying the median filter to the NL-means-filtered image,
- (3)
- subtracting the median-filtered image from the NL-means-filtered image.
In this process, it is important to determine the optimal parameters of NL-means and median filters. The NL-means filter is designed to minimize noise effects in the ANN processing. That is, the reason why the NL-means filter is used is to reduce noise without smoothing object edges. Thus, the optimal parameters used for the NL-means filter should be determined by considering the noise reduction as well as the edge preservation. The median filter is used to remove ship objects. Thus, the kernel size of the median filter should be larger than the size of ship objects, because the median value should not come from ship-object pixels but sea-object pixels. If the filter is successful, we will not be able to see any ships in the median-filtered image. The median filter does not remove objects larger than ships, including fish farms and offshore bars, but it smooths the objects. If the larger objects disappear in the image, the ship false-detection might increase. Finally, the intensity-differential image can be created by subtracting the median-filtered image from the NL-means-filtered image. The background is almost zero in the intensity-differential image, and the brightness values of fish farms and offshore bars are low in the image. The intensity-differential image enhances ship targets, and hence it must increase the ship-detection probability.
3.2. Texture Differential Image
The texture-differential image is created from the NL-means-filtered image by using the median filter and sum-of-square operation. The image is used as one of the input layers. The texture differential image is created as follows:
- (1)
- applying the NL-means filter to the sigma-naught image,
- (2)
- calculating the difference between the NL-means-filtered image and the sigma-naught image,
- (3)
- creating the texture image by applying the sum-of-square operation to the difference image,
- (4)
- applying the median filter to the texture image,
- (5)
- subtracting the median-filtered image from the texture image.
The texture image is calculated by summing the squares of the pixel values of the difference image within a window kernel. The difference image is acquired by the difference between the sigma-naught image and NL-means-filtered image. The texture differential image is generated by subtracting the median-filtered image from the texture image. The kernel size of the NL-means filter in the texture-differential image generation may be same as, or smaller than, the intensity-differential image generation. The NL-means filter is utilized to enhance the object edges in the texture-image processing, unlike its use for noise reduction in the intensity-image processing. Thus, a little weak filtering can be imposed in the NL-means filtering. If the optimal processing is applied, most ship pixels in the texture image are still bright, except some pixels within large ships. Thus, the ship objects have higher pixel values through the sum-of-square calculation. The brightness values of background pixels are reduced by using the texture-differential image, which is created by subtracting the median-filtered image from the texture image. In this texture-differential image, the ship objects are highlighted, while the side-lobe and ghost effects, fish farms and offshore bars have low brightness values. Therefore, the texture-differential image can be efficiently used to reduce the misdetection rate in some areas.
3.3. Short Description of ANN
ANN is a computing system that is inspired by the biological neural network. It is composed of interconnecting artificial neurons. In general, a neural network function creates a linear output pattern, given a particular input layer [30]. A multilayer perceptron (MLP) is commonly used as several types of neural. The MLP is a feed-forward artificial neural-network model that maps input data onto an appropriate output. An MLP is comprised of multiple node layers. Each layer connects a network with the next layer. In many cases, the units of these networks use a sigmoid function as an activation function. For training the network, MLP utilizes back propagation [31]. The back-propagation algorithm consists of a propagation and weight update phases. In the propagation step, the calculated error, which is the difference between the target value and the output value, is propagated to each layer. By using this propagated error, the weight is modified in a weight-update phase. They are repeated until the network performance is good enough [32]. We implemented the ANN with MATLAB software. The used ANN method is a two-multilayer perceptron with sigmoid-function and four neurons in the hidden layer and one linear-function output neuron. It is also trained with the back-propagation algorithm.
4. Results and Discussion
The X-band Kompsat-5 SLC image listed in Figure 1 was used for the validation of the proposed method. Since the Kompsat-5 image has severe ghost phenomena, the azimuth band-pass filtering was applied first. The fraction factor n = 0.5 was used for the filter, and hence the azimuth processing bandwidth of about 3100 Hz was reduced to that of about 2419 Hz. The ghost phenomena were effectively mitigated in the SAR image, while the spatial resolution in the azimuth direction was degraded from about 2.29 to 2.94 m. In order to reduce the speckle noise of the image, the multi-look operation of 5 × 5 looks in the range and azimuth directions was applied to the image by considering the ratio of azimuth and ground-range pixel spacing. The sigma-naught image was created by considering the incidence angle, and converted into the decibel unit.
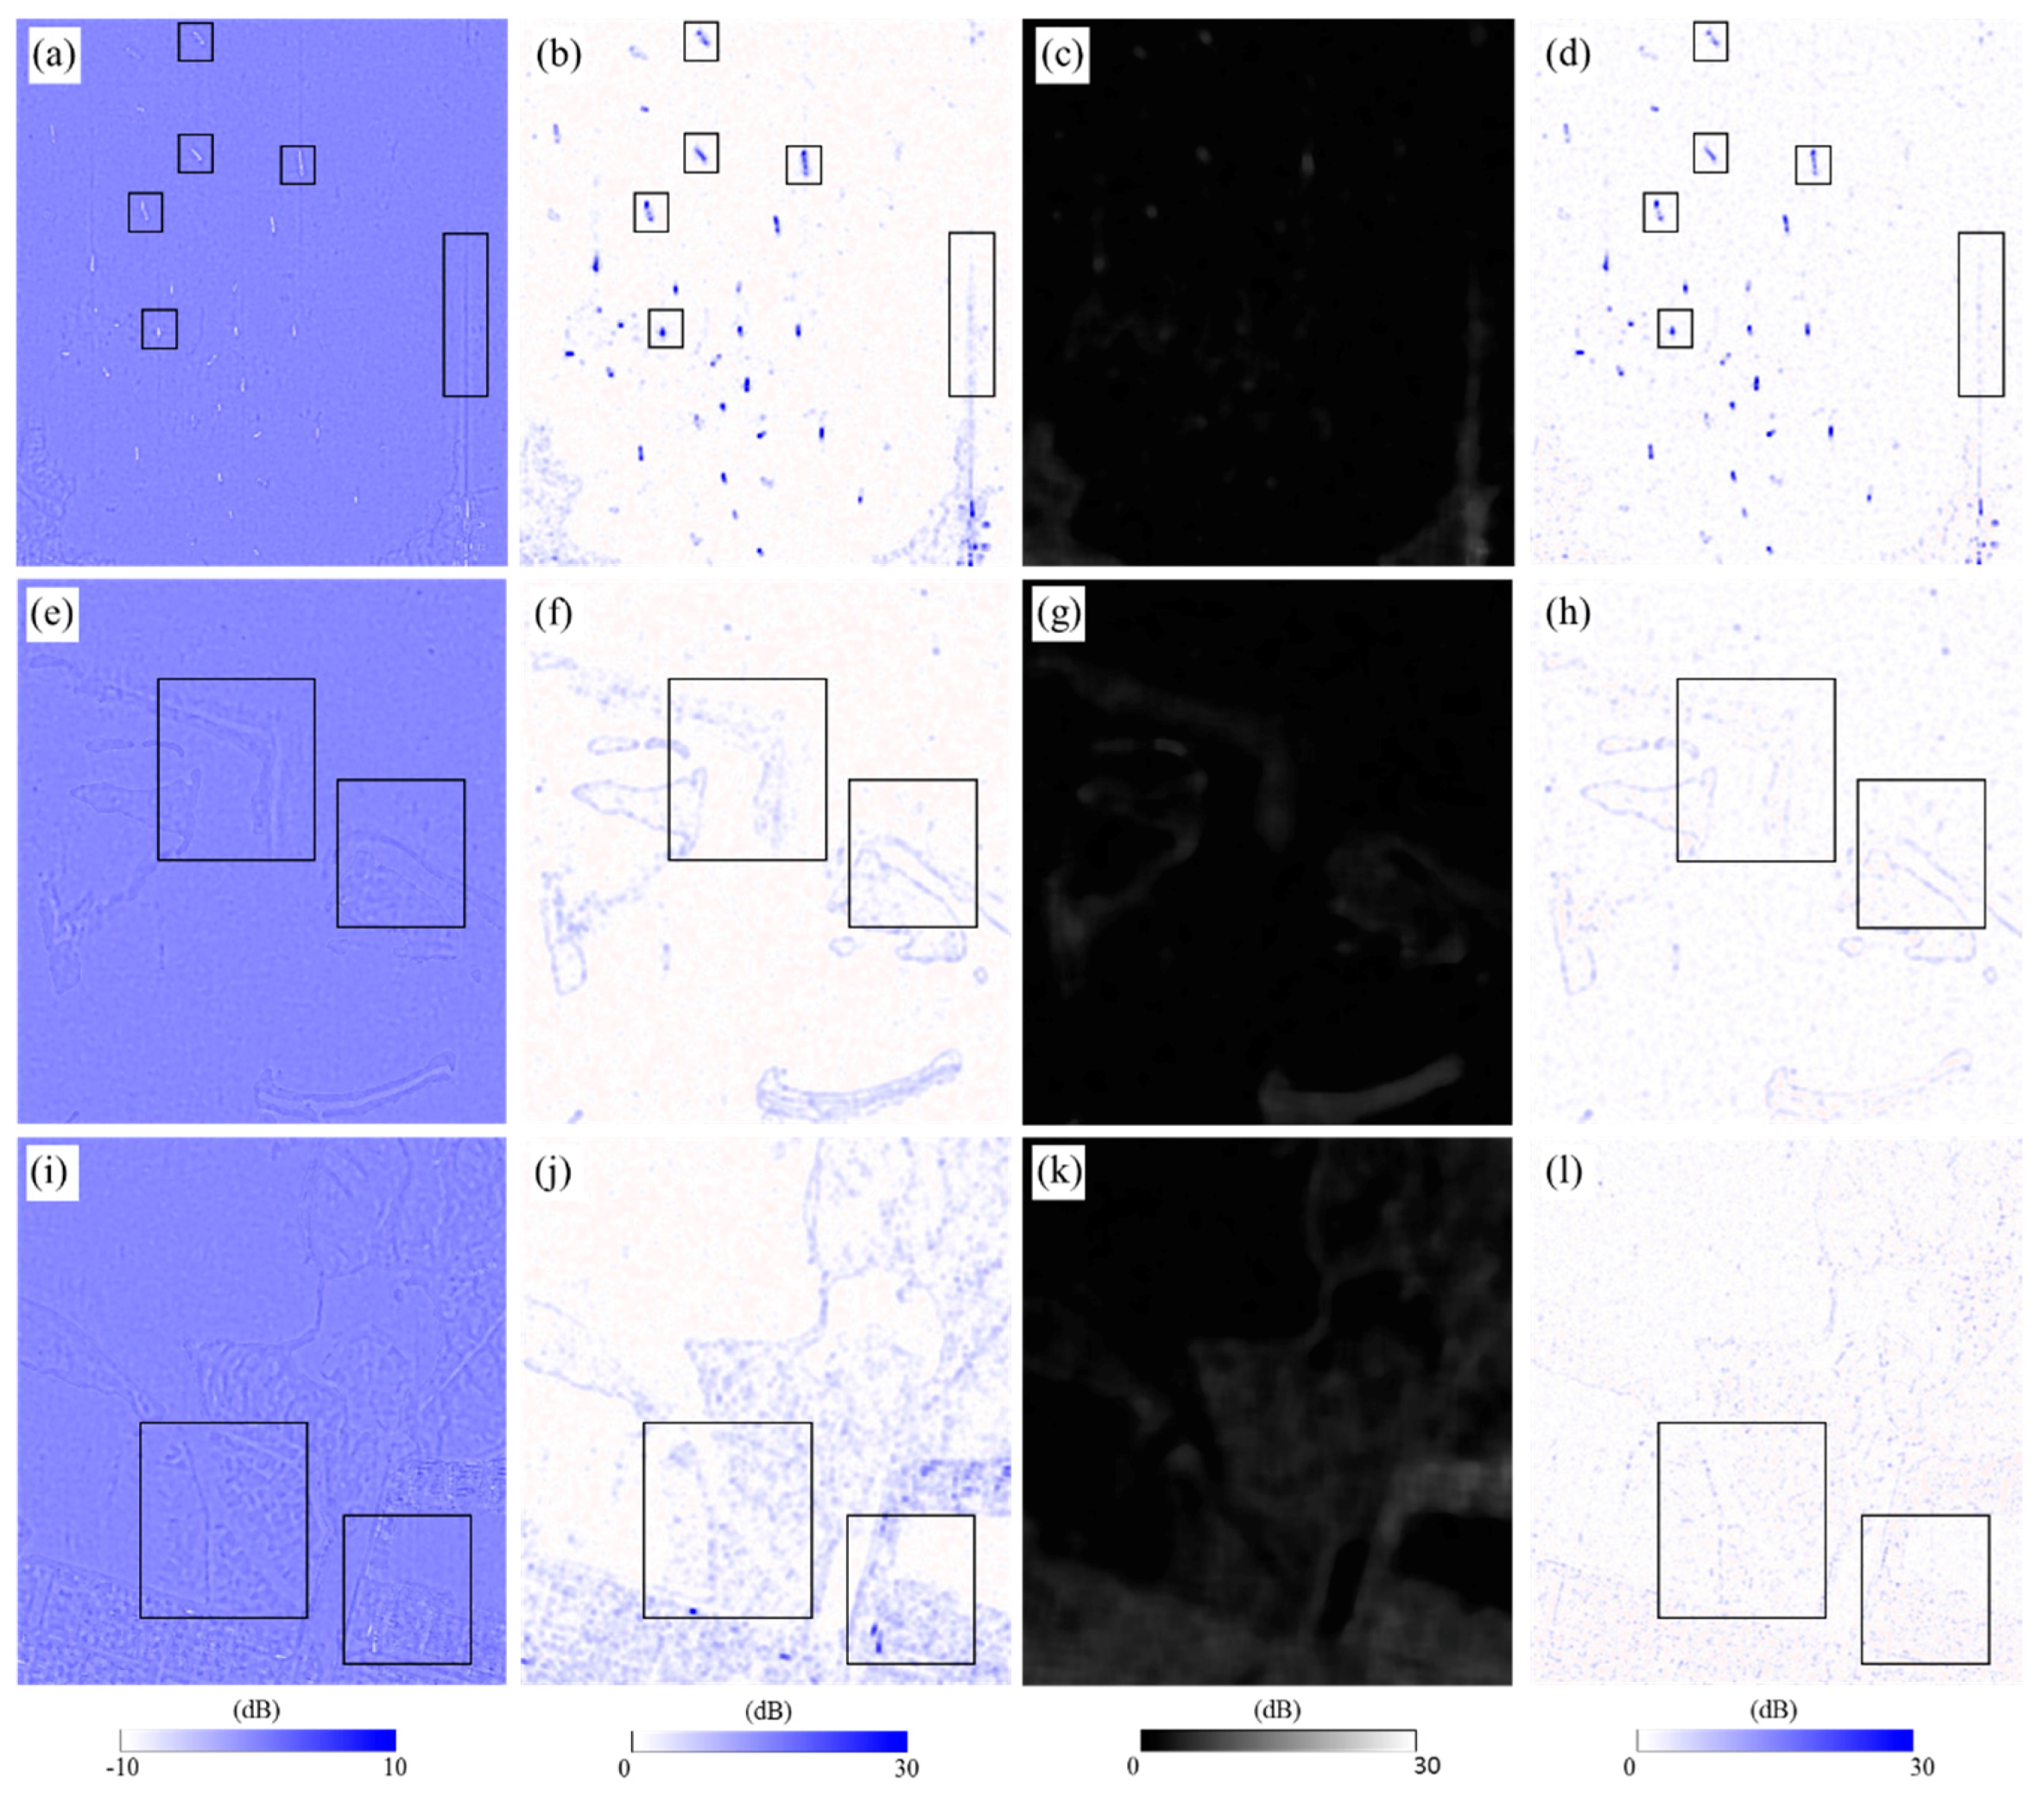
To generate the intensity-differential image from the sigma-naught image, the parameters of the NL-means filter was estimated from the standard deviation of some land areas where the intensity of noise components is relatively high. The kernel size of 5 × 5 and the filtering parameter of 5.0 were used for the NL-means filter. The NL-filtered image enhanced the edge of ship objects and reduced the image noise and the side-lobe effects, as shown in Figure 3b, Figure 3f or Figure 3j. The median filter was used to remove ships from the NL-means-filtered image. The kernel size of the median filter of 21 × 21 in both the azimuth and range directions was used for this study, because the maximum length of ships was about 20 pixels. As shown in the Figure 3c, all of the ships disappeared in the median-filtered image, while the fish farms and offshore bars were smoothed but still preserved in the median-filtered image in Figure 3g or Figure 3k. Consequently, the pixel values of the ships in the intensity-differential image were much higher than those of the sea (Figure 3d). Moreover, the side-lobe effect was remarkably reduced, as seen in Figure 3d, and most of the land area, fish farms and offshore bars were removed in Figure 3h or Figure 3l. The intensity-differential image can raise the possibility of ship detection.
One of the input layers, the texture image, was calculated by summing the squares of the difference between the sigma-naught image and the NL-means-filtered image. In order to enhance the ship objects in the texture image, the kernel size of 5 × 5 and the filtering parameter of 3.0 were used for the NL-means filter. After the NL-means filter was applied to the sigma-naught image, the difference map was generated by subtracting the NL-means-filtered image from the sigma-naught image. Figure 4a, Figure 4e or Figure 4i show the sub-images of the difference image in the boxes A, C and D of Figure 1. In the figures, the object edges were enhanced, and most bright pixels came from ships or buildings. Since most ships and buildings are small, their pixel values could be preserved because most of their pixels can be considered as edges. Moreover, the object edges were enhanced in the texture image by the sum-of-square calculation using the window kernel of 5 × 5, as shown in Figure 4b, Figure 4f or Figure 4j. As seen in Figure 4b, all of the ship pixels in the texture image were much brighter than other objects. This means that the ship objects in Figure 4b were emphasized through the sum-of-square calculation. The median filter, having the kernel size of 21 × 21, was used for the removal of the ships in the texture image. The ships effectively disappeared in Figure 4c. Thus, the ships were much enhanced in the texture-differential image that was created by the difference between the texture image and median-filtered image (Figure 4d), while the pixel values in the fish farms and offshore bars were remarkably reduced (Figure 4d, Figure 4h or Figure 4l). This image can increase the ship-detection rate as well as reduce the false-detection rate. However, the texture-differential image was a little noisy due to the sum-of-square calculation. An image-processing step can be further applied for the noise reduction. In this study, we did not consider the additional noise reduction step because the noise pixel values were very small.
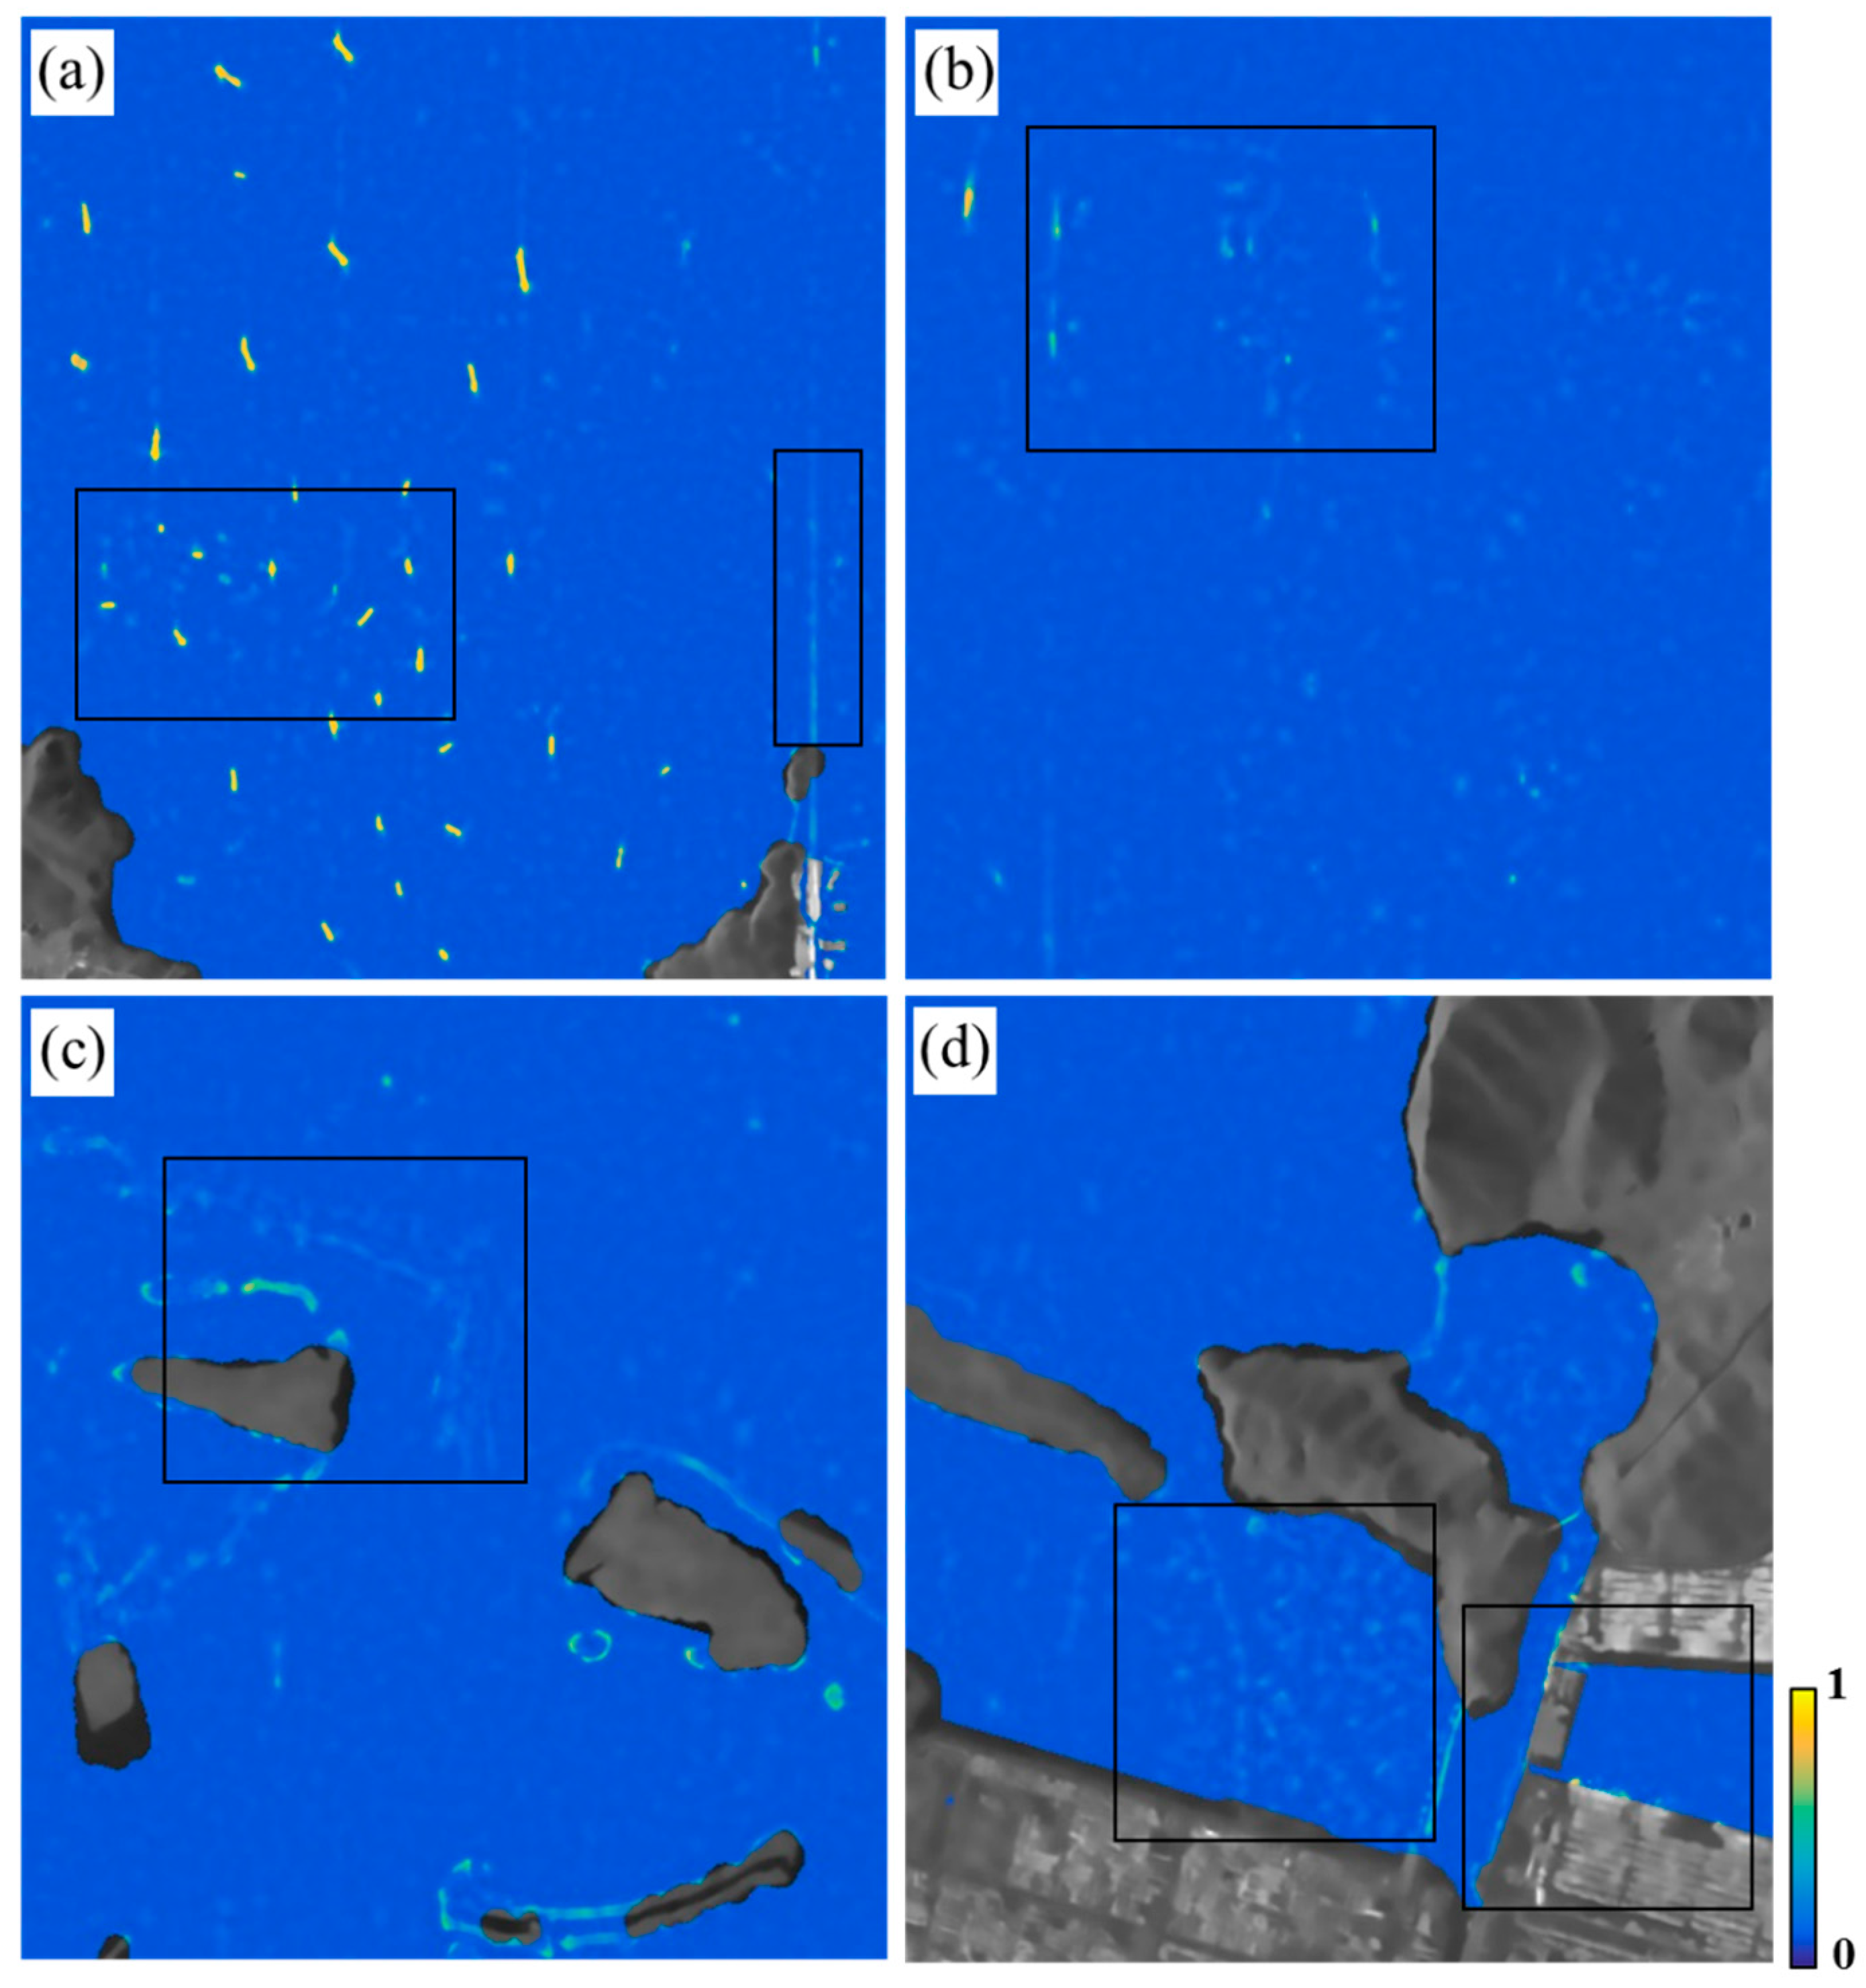
The intensity- and texture-differential images were applied as the input layers to the ANN approach. The training set was obtained by the statistical-threshold approach of Equations (1) and (2). The threshold values of 15.16 and 2.53 for ship and non-ship training selections, respectively, were estimated from the intensity-differential image, and then 67 training ship samples were selected from the statistical-threshold approach. The ANN approach was applied to the ship detection using the two input layers and the training set. Figure 5 shows the ship-probability map estimated by using ANN. The pixels in the ship-probability map have values between 0 and 1. The pixel value of ‘0’ means that the pixel is not a ship at all, while the pixel value of ‘1’ denotes that the pixel is definitely a ship. The sea surface had values as low as 0.1, while the ship objects had values as high as 0.85. If accurate coastline maps or large-scale topographic maps are available, the bridges can be masked out. In Figure 6a,b, the ghost and side-lobe effects were as low as 0.3. As shown in Figure 6c,d, the probability value in the fish farms and offshore bars was lower than the ship objects.
In order to estimate the ship-thresholding value from the ship-probability map, the histogram of the ship-probability map was created (Figure 7). From the histogram, the point that the PDFs of ship and non-ship objects cross was determined, as shown in Figure 7. The threshold value of 0.67 was applied by determining the ship objects from the probability map.
We calculated the recall and precision to validate the performance of the proposed method. The recall (sensitivity) measures how many objects are detected, and the precision denotes how many objects are correct among the detected objects. The recall and precision have a value between 0 and 1. The recall and precision can be defined as given by:
where Ng is the number of ground truth, Nt is the number of ships detected by ANN and Nr is the number of correctly detected ships.
We found the total number of 78 ships from the SAR image through visual analysis and identified ships by using threshold values of 0.67. When the threshold value of 0.67 was used, 82 objects were identified as ship objects, and 77 objects among them were real ships (while five objects were from ghost phenomena). Thus, in this case, the recall and precision were about 93.9% and 98.7%, respectively. The false-detection rate was 6.1%. Table 2 summarizes the recall, precision and false detection rate from the detection result. The result means that about 98% of all ships can be detected, and the detected assignments are actual ships about 97% of the time. The main reason for false detection was the ghost phenomena. Even though the ghost effect was reduced by the azimuth low-pass filtering, some targets still had a higher brightness value. One of the false detections was due to the barge. The one non-detected ship had a lower value in the NL-means-filtered images, unlike the other ships, because the brightness value of the ship target had a lower value.
Kompsat-5 SAR imagery has severe ghost phenomena and side-lobe effects. Due to these effects, it is very hard to identify ship targets. To improve the ship-detection rate, we applied the proposed method to the Kompsat-5 SAR image. Almost all the ships were detected by the proposed method, although some of the ghost objects were detected as ship objects. This means that the proposed method was successfully applied to ship detection from the Kompsat-5 SAR image.
5. Conclusions
We showed an efficient method to detect ship targets from the Kompsat-5 SAR image using the artificial neural network (ANN) approach. The method is composed of three main steps: (1) input-layer generation, (2) the ship-probability map generation using the ANN approach and (3) the ship-object identification. For the reduction of the side-lobe effect, ghost phenomena and speckle noises, we used the azimuth band-pass, NL-means filters and the median filter. The intensity- and texture-differential images were generated by image processing from the SAR image, and used as the input layers to enhance ship objects. The training set was derived by the statistical approach and applied to the ANN approach. The ship-probability map was generated and the ship objects were highlighted in the probability map. We have tried to estimate an optimal thresholding value from the probability map. For this, the histogram of the map was created. From the histogram, the point that the PDFs of ship and non-ship objects cross was determined as the optimal threshold value. The threshold value was 0.67.
The performance validation of our proposed method was carried out. The total number of 78 ships were found in the SAR image through visual analysis and identified ships. Through the process, 82 objects were identified as ship objects, and 77 objects among them were real ships, while five objects were from the ghost phenomenon. Thus, in this case, the recall and precision were about 93.9% and 98.7%, respectively. The false-detection rate was 6.1%. This means that about 99% of all ships can be detected, and the detected ships are true ships about 94% of the time.
It is very important to reduce the ghost and side-lobe effects and speckle noises when we find ship objects from the Kompsat-5 SAR imagery. Their reduction can enhance the ship objects in SAR imagery. The proposed method effectively reduced these noise effects, and consequently, the ship objects were well-enhanced as well as detectable. Therefore, the proposed method was successfully applied to ship detection from the Kompsat-5 SAR image. Moreover, the proposed method can be applied to other SAR satellite images such as COSMO-SkyMed and TerraSAR-X by adjusting the filtering parameters of the proposed method. It would be also expected that the proposed method can be applied not only to ANN but also to other deep learning techniques, such as convolutional neural networks (CNN).
Acknowledgments
This research (NRF-2015R1A2A2A01005018) was supported by Mid-career Researcher Program through National Research Foundation of Korea (NRF) grant funded by the Ministry of Education, Science and Technology (MEST).
Author Contributions
Hyung-Sup Jung conceived and designed the experiments. Jeong-In Hwang performed the experiments. Hyung-Sup Jung and Jeong-In Hwang analyzed the data. Sung-Ho Chae and Daeseong Kim helped the data processing for the SAR imagery. Jeong-In Hwang and Hyung-Sup Jung wrote the paper.
Conflicts of Interest
The authors declare no conflict of interest.
References
- Hwang, J.; Kim, D.; Jung, H.-S. An efficient ship detection method for KOMPSAT-5 synthetic aperture radar imagery based on adaptive filtering approach. Korean J. Remote Sens. 2017, 33, 89–95. [Google Scholar] [CrossRef]
- Wang, X.; Chen, C. Adaptive ship detection in SAR images using variance WIE-based method. Signal Image Video Process 2016, 10, 1219–1224. [Google Scholar] [CrossRef]
- Eldhuset, K. An Automatic Ship and Ship Wake Detection System for Spaceborne SAR Images in Coastal Regions. IEEE Trans. Geosci. Remote Sens. 1996, 34, 1010–1019. [Google Scholar] [CrossRef]
- Jiang, Q. Ship detection in RADARSAT SAR imagery using PNN-model. In Proceedings of the ADRO Symposium’98, Montreal, QC, Canada, 13–15 October 1998. [Google Scholar]
- Kuo, J.M.; Chen, K.S. The Application of Wavelets Correlator for Ship Wake Detection in SAR Images. IEEE Trans. Geosci. Remote Sens. 2003, 41, 1506–1511. [Google Scholar] [CrossRef]
- Wang, C.; Jiang, S.; Zhang, H.; Wu, F.; Zhang, B. Ship detection for high-resolution SAR images based on feature analysis member. IEEE Geosci. Remote Sens. Lett. 2014, 11, 119–123. [Google Scholar] [CrossRef]
- Ai, J.; Qi, X.; Yu, W.; Deng, Y.; Liu, F.; Shi, L. A new CFAR ship detection algorithm based on 2-D joint log-normal distribution in SAR images. IEEE Geosci. Remote Sens. Lett. 2010, 7, 806–810. [Google Scholar] [CrossRef]
- Crisp, D.J. The State-of-the-Art in Ship Detection in Synthetic Aperture Radar Imagery; Australian Government, Department of Defence: Edinburgh, Australia, 2004; p. 115.
- Brusch, S.; Lehner, S.; Fritz, T.; Soccorsi, M.; Soloviev, A.; van Schie, B. Ship surveillance with TerraSAR-X. IEEE Trans. Geosci. Remote Sens. 2011, 49, 1092–1103. [Google Scholar] [CrossRef]
- Fei, C.; Liu, T.; Lampropoulos, G.A. Markov chain CFAR detection for polarimetric data using data fusion. IEEE Trans. Geosci. Remote Sens. 2012, 50, 397–408. [Google Scholar] [CrossRef]
- Novak, L.M.; Sechtin, M.B.; Cardullo, M.J. Studies of target detection algorithms that use polarimetric radar data. IEEE Trans. Aerosp. Electon. Syst. 1989, 25, 150–165. [Google Scholar] [CrossRef]
- Tao, D.; Anfinsen, S.; Brekke, C. Robust CFAR detector based on truncated statistics in multiple-target situations. IEEE Trans. Geosci. Remote Sens. 2016, 54, 117–134. [Google Scholar] [CrossRef]
- Xiangwei, X.; Kefeng, J.; Huanxin, Z.; Jixiang, S. A fast ship detection algorithm in SAR imagery for wide area ocean surveillance. In Proceedings of the 2012 IEEE Radar Conference (RADAR), Atlanta, GA, USA, 7–11 May 2012; pp. 570–574. [Google Scholar] [CrossRef]
- Ouchi, K. A brief review on recent trend of synthetic aperture radar applications to maritime safety: Ship detection and classification. In Proceedings of the Application of Remote Sensing to Maritime Safety and Security, Jeju, Korea, 20–22 April 2016. [Google Scholar]
- Kaplan, L. Improved SAR target detection via extended fractal features. IEEE Trans. Aerosp. Electron. Syst. 2001, 37, 436–451. [Google Scholar] [CrossRef]
- Howard, D.; Roberts, S.; Brankin, R. Target detection in SAR imagery by genetic programming. Adv. Eng. Softw. 1999, 30, 303–311. [Google Scholar] [CrossRef]
- Martín-de-Nicolás, J.; Mata-Moya, D.; Jarabo-Amores, M.P.; del-Rey-Maestre, N.; Bárcena-Humanes, J.L. Neural network based solutions for ship detection in SAR images. In Proceedings of the 18th International Conference on Digital Signal Processing, Fira, Greece, 1–3 July 2013. [Google Scholar]
- Khesali, E.; Enayati, H.; Modiri, M.; Aref, M.M. Automatic ship detection in Single-Pol SAR Images using texture features in artificial neural networks. ISPRS Arch. 2015, 40, 395–399. [Google Scholar] [CrossRef]
- Ødegaard, N.; Knapskog, A.O.; Cochin, C.; Louvigne, J.-C. Classification of ships using real and simulated data in a convolutional neural network. In Proceedings of the Radar Conference (Radar-Conference) 2016, Philadelphia, PA, USA, 2–6 May 2016. [Google Scholar]
- Osman, H.; Pan, L.; Blostein, S.D.; Gagnon, L. Classification of ships in airborne SAR imagery using back propagation neural networks. In Proceedings of the SPIE 1997, San Diego, CA, USA, 27 July–1 August 1997; pp. 126–136. [Google Scholar]
- Dao-Duc, C.; Xiahvi, H.; Mor’ere, O. Maritime vessel Images Classification using deep convolutional neural network. In Proceedings of the 6th International Symposium on Information and Communication Technology, Dubai, UAE, 3–4 December 2015; pp. 276–281. [Google Scholar]
- Zou, Z.X.; Shi, Z.W. Ship detection in spaceborne optical image with SVD networks. IEEE Trans. Geosci. Remote. 2016, 54, 5832–5845. [Google Scholar] [CrossRef]
- Bentes, C.; Frost, A.; Velotto, D.; Tings, B. Ship-iceberg discrimination with convolutional neural networks in high resolution SAR images. In Proceedings of the EUSAR 2016: 11th European Conference on Synthetic Aperture Radar, Hamburg, Germany, 6–9 June 2016. [Google Scholar]
- Freeman, A. On ambiguities in SAR design. In Proceedings of the EUSAR 2006: 6th European Conference on Synthetic Aperture Radar, Dredsden, Germany, 16–18 May 2006. [Google Scholar]
- Carsey, F.D. Microwave Remote Sensing of Sea Ice; American Geophysical Union: Washington, DC, USA, 1992; p. 462. [Google Scholar]
- Marchand, M.A.J. SAR image quality assessment. Revista de Teledeteccin 1993, 2, 12–18. [Google Scholar]
- Farr, T.; Rosen, P.; Caro, E. The shuttle radar topography mission. Rev. Geophys. 2000, 45, 37–55. [Google Scholar] [CrossRef]
- Oliver, C.; Quegan, S. Understanding Synthetic Aperture Radar Imagery; Artech House: Norwood, MA, USA, 1998. [Google Scholar]
- Mansourpour, M.; Rajabi, M.; Blais, J. Effects and performance of speckle noise reduction filters on active radar and SAR Images. In Proceedings of the ISPRS Ankara Workshop, Ankara, Turkey, 14–16 February 2006; pp. 14–16. [Google Scholar]
- Majumdar, A.; Majumdar, P.K.; Sarkar, B. Application of linear regression, artificial neural network and neuro-fuzzy algorithms to predict the breaking elongation of rotor-spun yarns. Indian J. Fiber Text. Res. 2005, 30, 19–25. [Google Scholar]
- Spencer, M.; Eickholt, J.; Cheng, J. A deep learning network approach to AB initio protein secondary structure prediction. IEEE/ACM Trans. Comput. Biol. Bioinform. 2015, 12, 103–112. [Google Scholar] [CrossRef] [PubMed]
- Koskela, T.; Lehtokangas, M.; Saarinen, J.; Kaski, K. Time series prediction with multilayer perceptron, FIR and Elman neural networks. In Proceedings of the World Conference Neural Network, San Diego, CA, USA, 15–20 September 1996; INNS Press: San Diego, CA, USA, 1996; pp. 491–496. [Google Scholar]
Figure 1.
Kompsat-5 single look complex (SLC) image used for this study. (a–d) indicate the sub-images magnified from the A to D boxes in the Kompsat-5 SLC image.
Figure 1.
Kompsat-5 single look complex (SLC) image used for this study. (a–d) indicate the sub-images magnified from the A to D boxes in the Kompsat-5 SLC image.
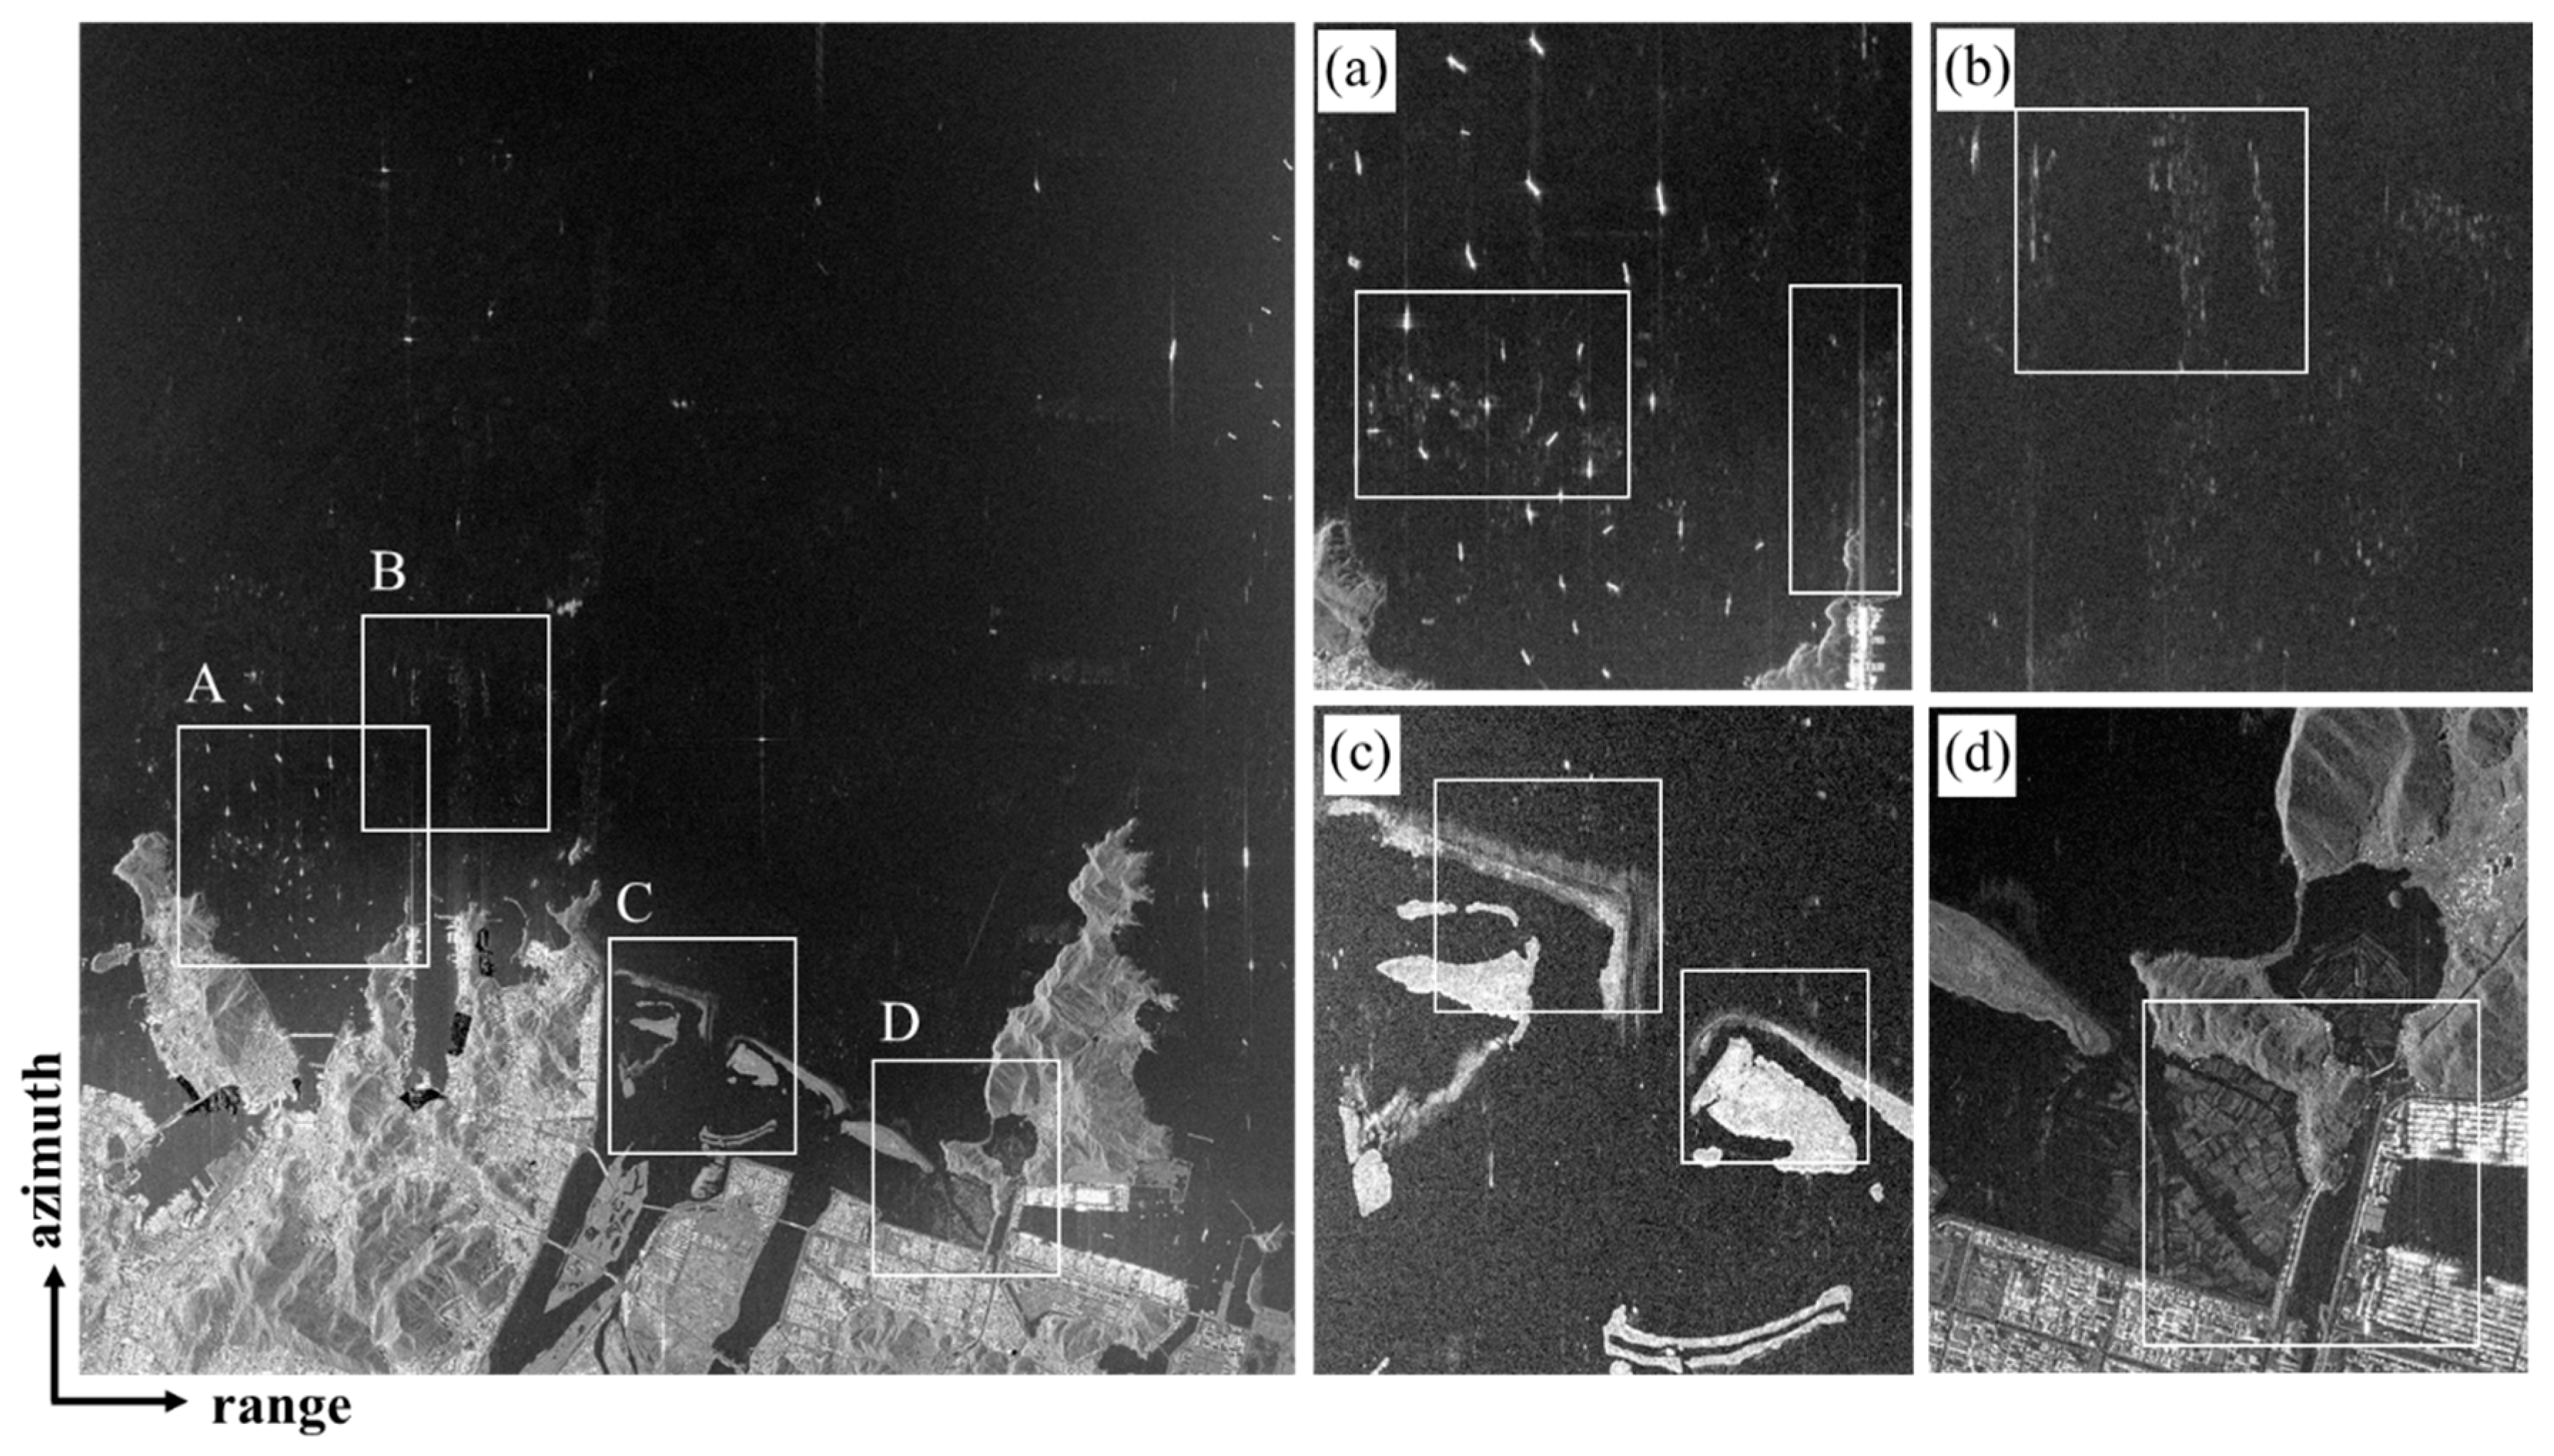
Figure 2.
Detailed workflow of the proposed method in this study. SAR: synthetic aperture radar; SRTM DEM: shuttle radar topography mission digital elevation model; NL: non-local.
Figure 2.
Detailed workflow of the proposed method in this study. SAR: synthetic aperture radar; SRTM DEM: shuttle radar topography mission digital elevation model; NL: non-local.
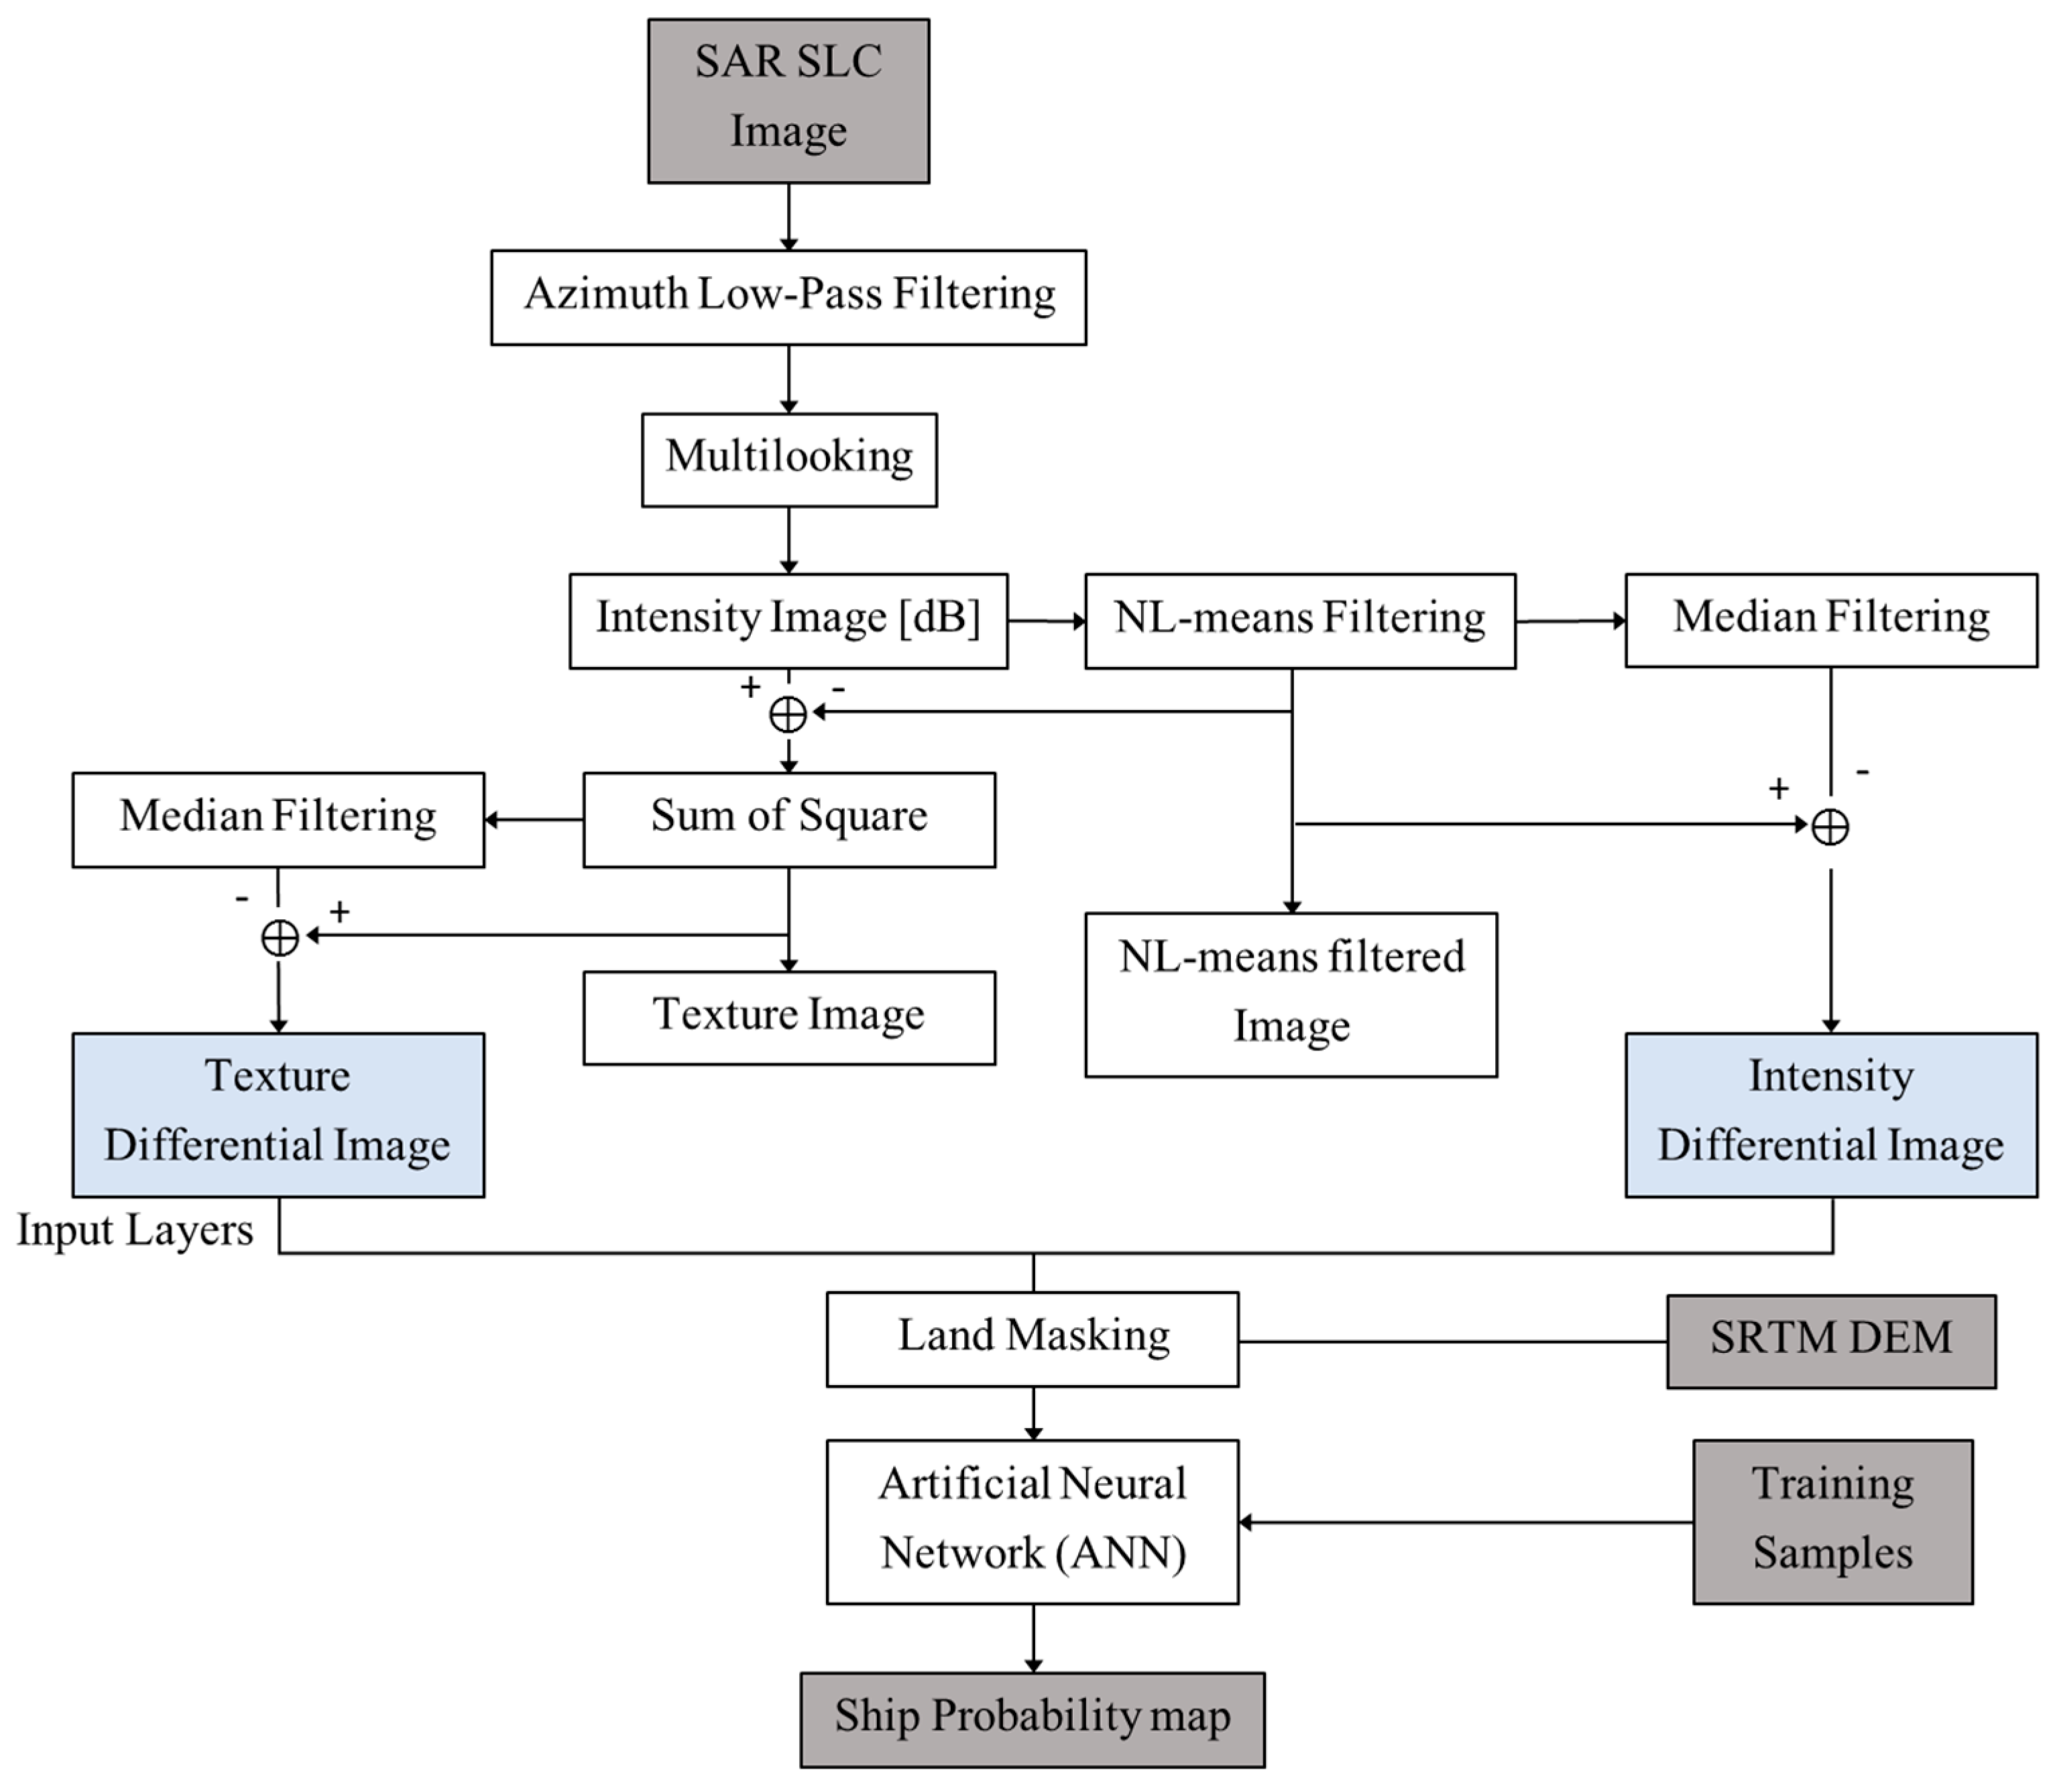
Figure 3.
Procedure for the generation of a differential image, one of the input layers of artificial neural network (ANN): (a,e,i) the intensity images, (b,f,j) the NL-means filtered images, (c,g,k) the median filtered images and (d,h,l) differential images in the boxes A, C and D (see Figure 1).
Figure 3.
Procedure for the generation of a differential image, one of the input layers of artificial neural network (ANN): (a,e,i) the intensity images, (b,f,j) the NL-means filtered images, (c,g,k) the median filtered images and (d,h,l) differential images in the boxes A, C and D (see Figure 1).
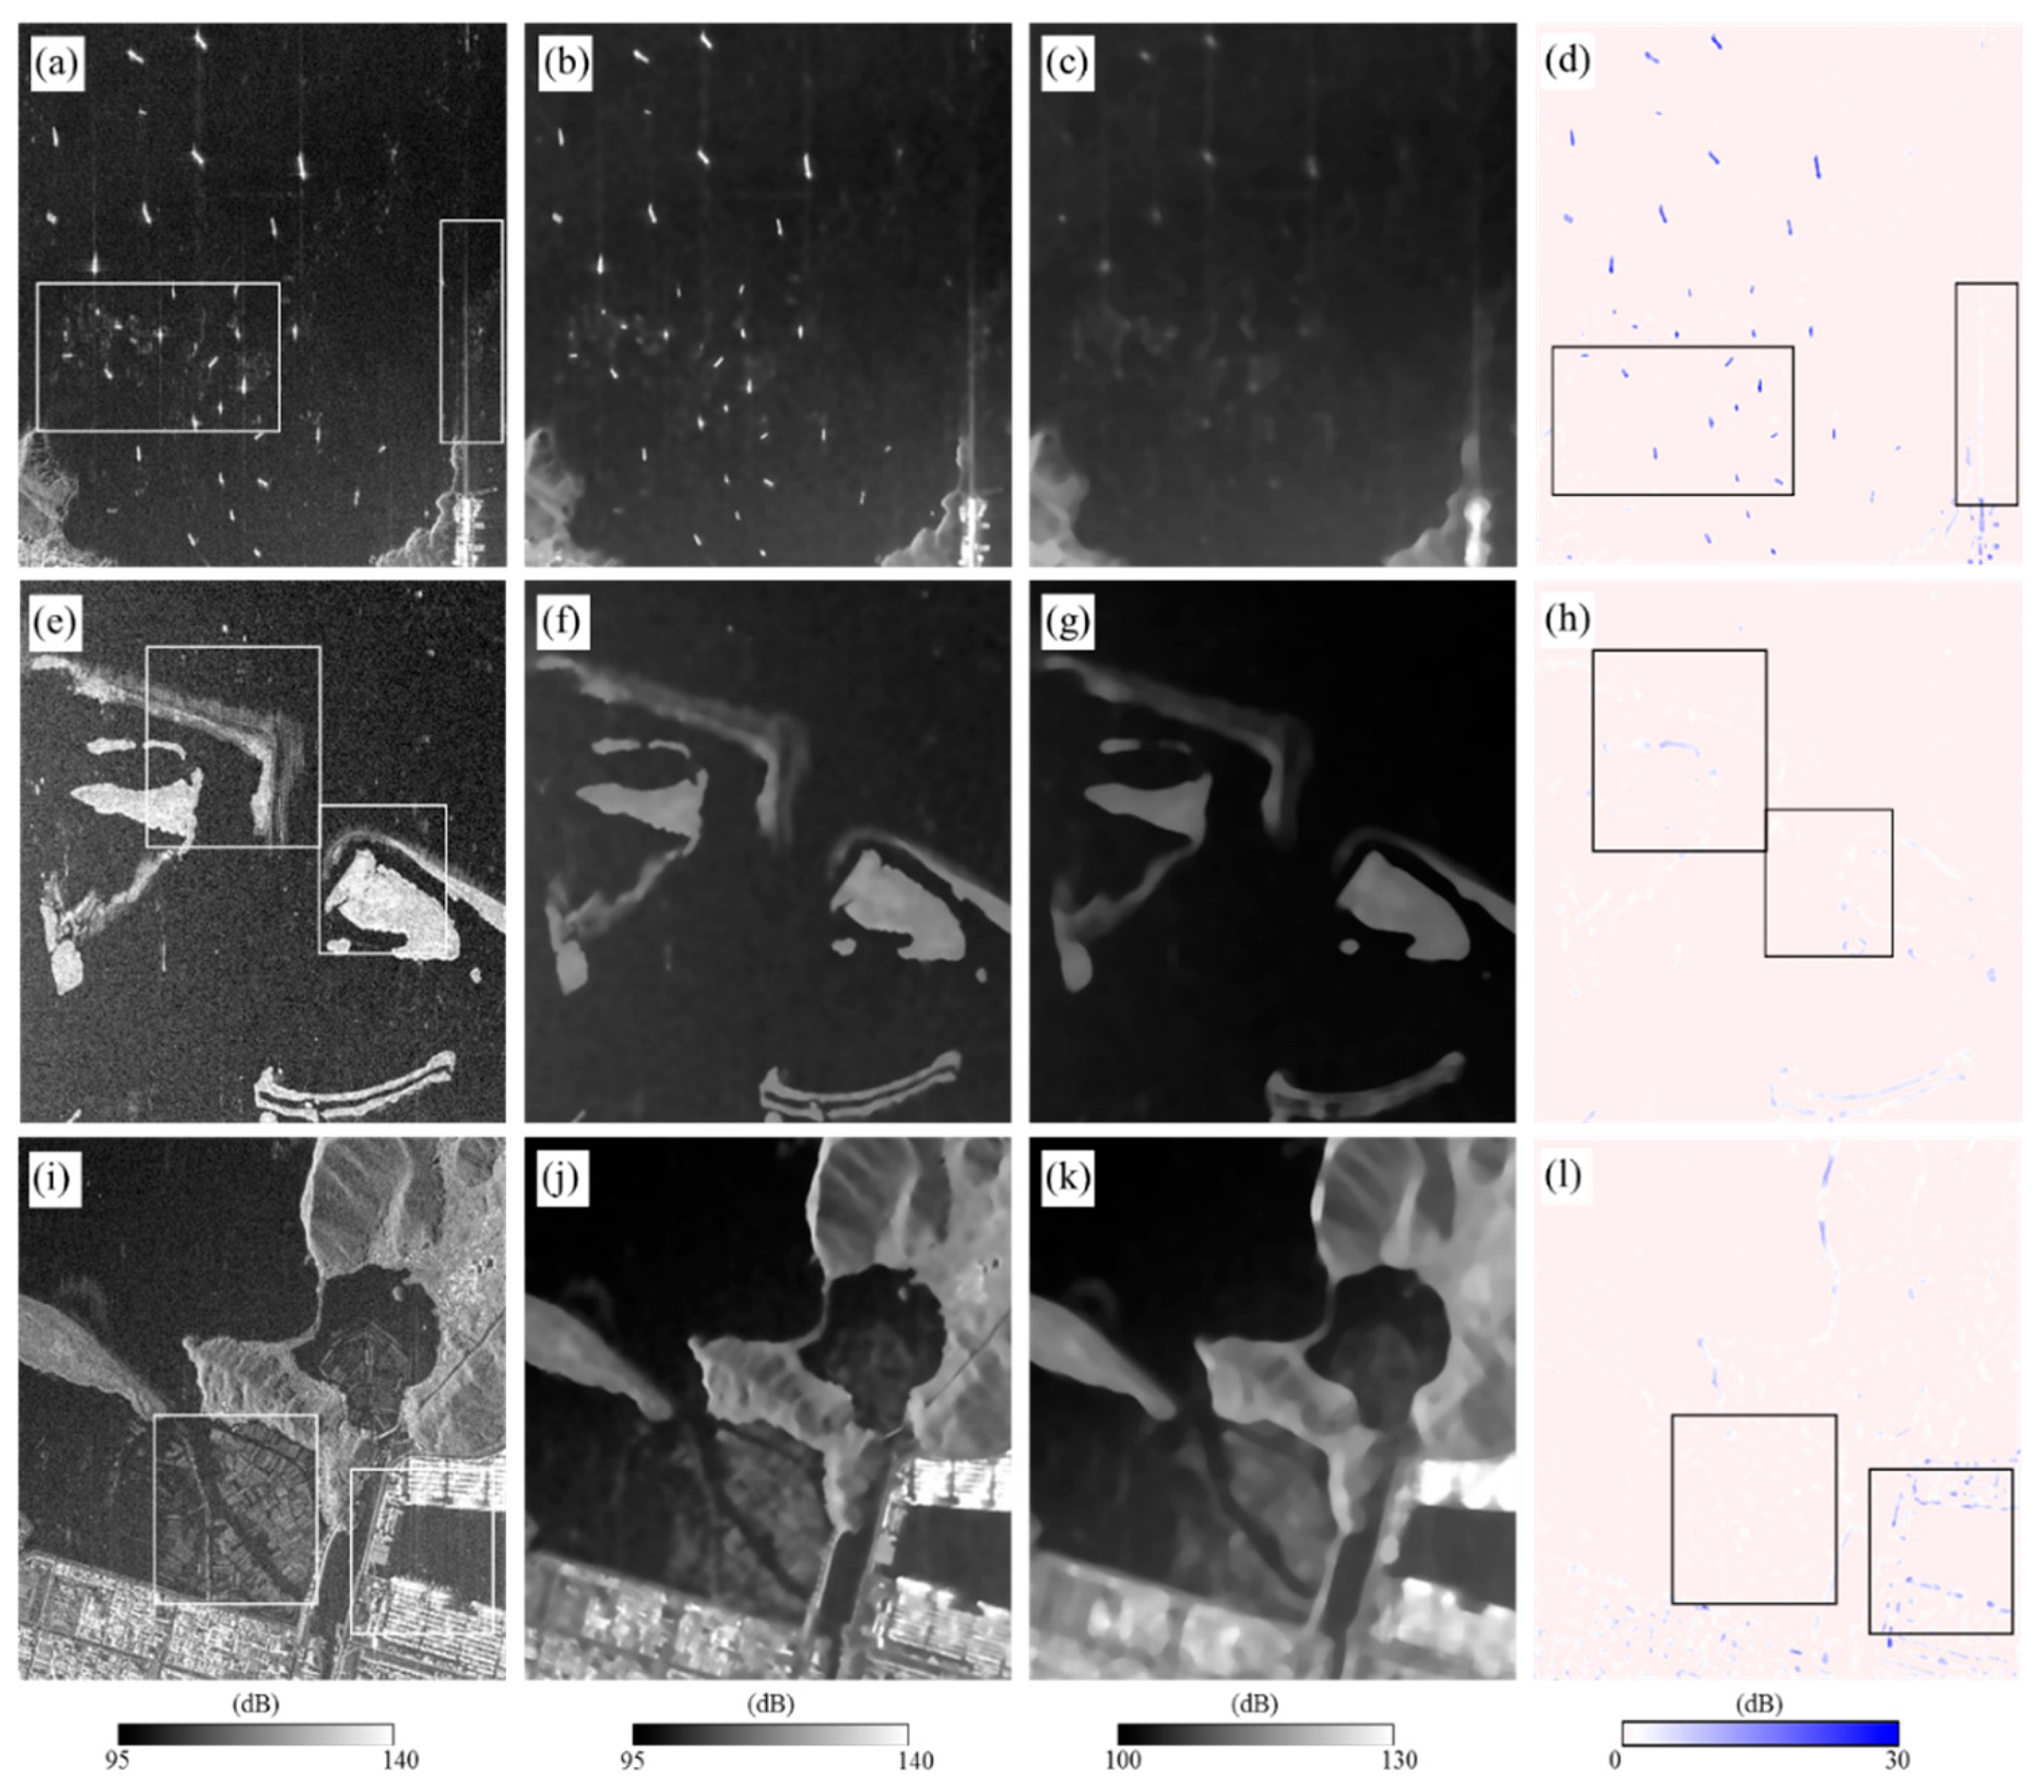
Figure 4.
Procedure for the generation of a texture-differential image, which is another input layer used for ANN: (a,e,i) the difference between sigma-naught and NL-means-filtered images, (b,f,j) the texture images, (c,g,k) the median-filtered texture images and (d,h,l) the texture-differential images in the boxes A, C and D (see Figure 1).

Figure 5.
Ship-probability map obtained by using the ANN approach. The boxes A to D are used for the detailed analysis.
Figure 5.
Ship-probability map obtained by using the ANN approach. The boxes A to D are used for the detailed analysis.
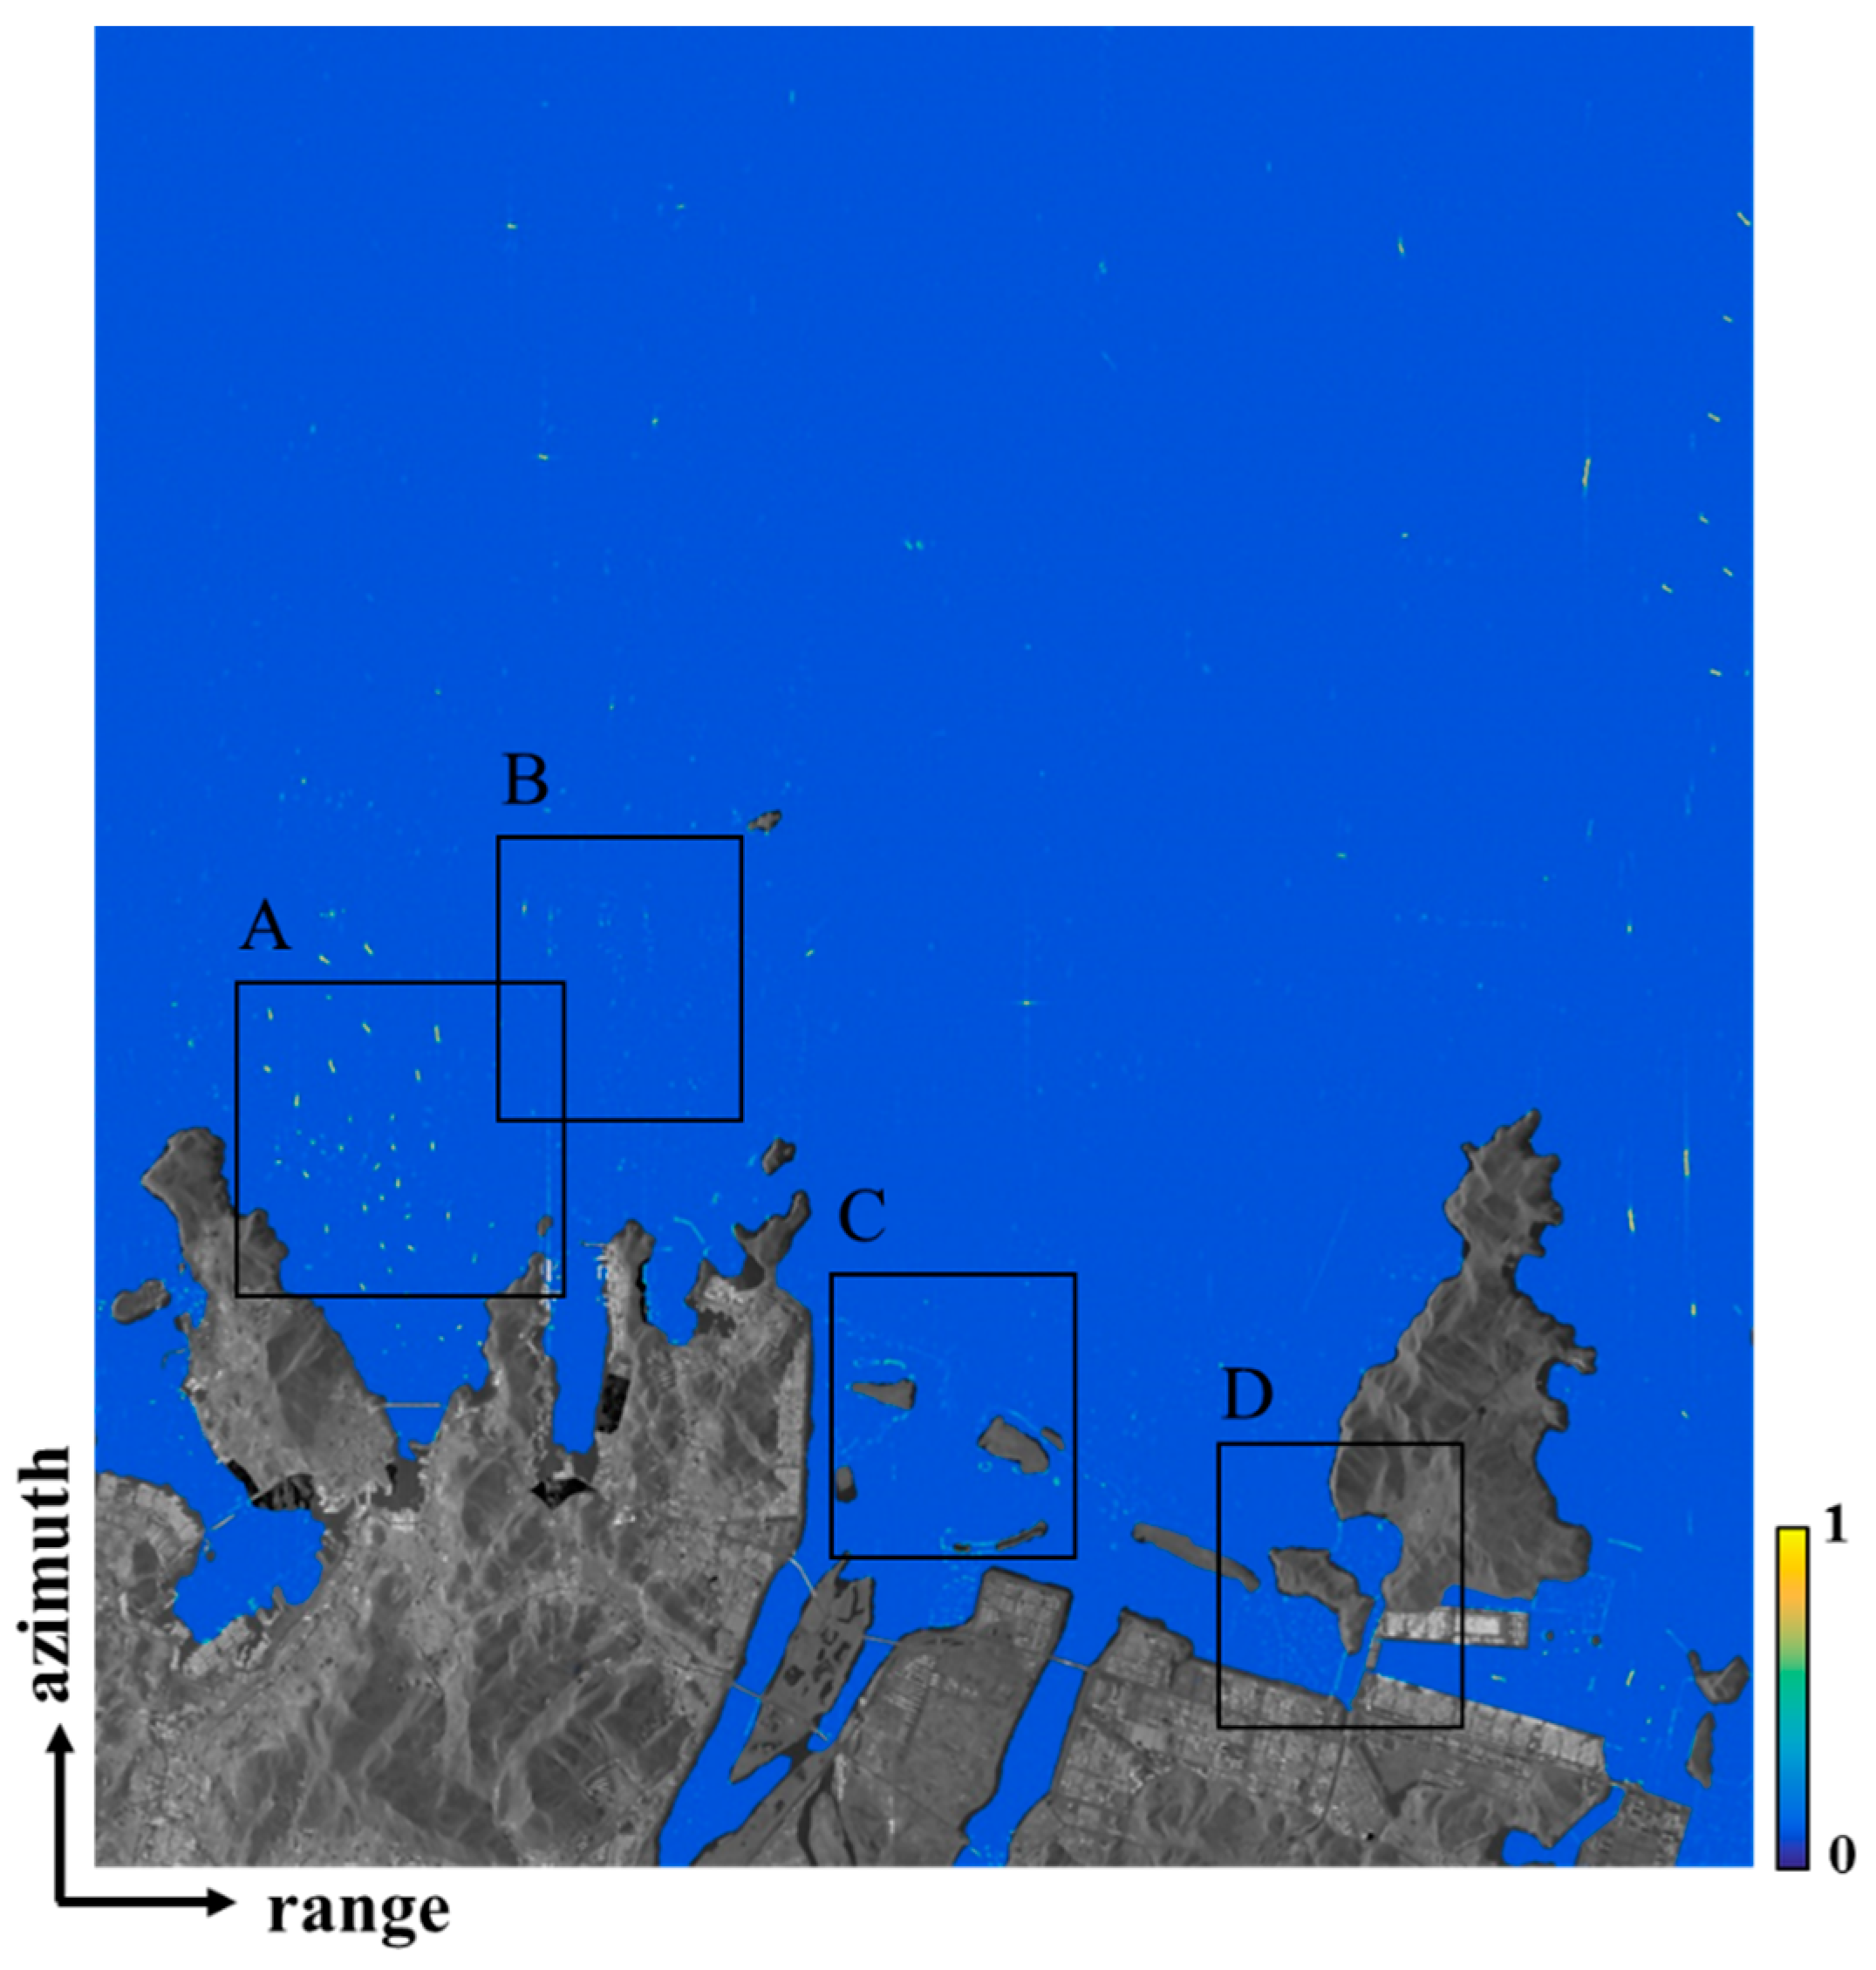
Figure 6.
(a–d) The ship-probability maps magnified from the A to D boxes in Figure 5.
Figure 6.
(a–d) The ship-probability maps magnified from the A to D boxes in Figure 5.

Figure 7.
Ship-probability map obtained by using the ANN approach.

Table 1.
Kompsat-5 single look complex (SLC) synthetic aperture radar (SAR) data information. HH: horizontal transmitting and horizontal receiving.
Table 1.
Kompsat-5 single look complex (SLC) synthetic aperture radar (SAR) data information. HH: horizontal transmitting and horizontal receiving.
| Imaging Mode | Standard (Strip) |
| Polarization | HH |
| Incidence angle (deg.) | 41.98 |
| Azimuth pixel spacing (m) | 1.75 |
| Range pixel spacing (m) | 1.29 |
| Ground-range pixel spacing (m) | 1.93 |
| Azimuth processing bandwidth (Hz) | 3100 |
| Pulse repetition frequency (Hz) | 4032 |
| Orbit | Ascending |
Table 2.
Recall, precision and false detection rate from the detection result of the test Kompsat-5 image. Ng: number of ground truth, Nt: number of detected ships, Nr: number of correctly detected ships
Table 2.
Recall, precision and false detection rate from the detection result of the test Kompsat-5 image. Ng: number of ground truth, Nt: number of detected ships, Nr: number of correctly detected ships
| Threshold | Ng | Nt | Nr | Recall (%) | Precision (%) | False Detection Rate (%) |
|---|---|---|---|---|---|---|
| 0.67 | 78 | 82 | 77 | 93.9 | 98.7 | 6.1 |
© 2017 by the authors. Licensee MDPI, Basel, Switzerland. This article is an open access article distributed under the terms and conditions of the Creative Commons Attribution (CC BY) license (http://creativecommons.org/licenses/by/4.0/).
Share and Cite
MDPI and ACS Style
Hwang, J.-I.; Chae, S.-H.; Kim, D.; Jung, H.-S. Application of Artificial Neural Networks to Ship Detection from X-Band Kompsat-5 Imagery. Appl. Sci. 2017, 7, 961. https://doi.org/10.3390/app7090961
AMA Style
Hwang J-I, Chae S-H, Kim D, Jung H-S. Application of Artificial Neural Networks to Ship Detection from X-Band Kompsat-5 Imagery. Applied Sciences. 2017; 7(9):961. https://doi.org/10.3390/app7090961
Chicago/Turabian StyleHwang, Jeong-In, Sung-Ho Chae, Daeseong Kim, and Hyung-Sup Jung. 2017. "Application of Artificial Neural Networks to Ship Detection from X-Band Kompsat-5 Imagery" Applied Sciences 7, no. 9: 961. https://doi.org/10.3390/app7090961
Note that from the first issue of 2016, this journal uses article numbers instead of page numbers. See further details here.