Article

Maximum Power Point Tracking Implementation by Dspace Controller Integrated Through Z-Source Inverter Using Particle Swarm Optimization Technique for Photovoltaic Applications

by
Kalaiarasi N.
1,*,
Subranshu Sekhar Dash
1,
Sanjeevikumar Padmanaban
2,*,
Paramasivam S.
3 and
Pandav Kiran Morati
4
1
Department of Electrical and Electronics Engineering, SRM University, Chennai 603203, India
2
Department of Energy Technology, Aalborg University, Esbjerg 6700, Denmark
3
Danfoss Industries Ltd., Chennai 600001, India
4
Department of Electrical and Electronics Engineering Science, University of Johannesburg, Auckland Park, Johannesburg 2006, South Africa
*
Authors to whom correspondence should be addressed.
Appl. Sci. 2018, 8(1), 145; https://doi.org/10.3390/app8010145
Submission received: 12 December 2017 / Revised: 11 January 2018 / Accepted: 13 January 2018 / Published: 22 January 2018
(This article belongs to the Section Energy Science and Technology)

Abstract

:
Maximum Power Point Tracking (MPPT) technique is used to extract maximum power from the photovoltaic system. This paper involves working on an enhanced Particle Swarm Optimization (PSO) based MPPT method for the photovoltaic (PV) system integrated through Z-Source inverter. The main benefit of the proposed method is the diminishing of the steady-state oscillation when the maximum power point (MPP) is located. Additionally, during an extreme environmental condition, such as partial shading and large fluctuations of irradiance and temperature, the proposed method has the capability to track the MPP. This algorithm is implemented in dspace 1104 controller. MATLAB simulations are carried out under varying irradiance and temperature conditions to evaluate its effectiveness. Its performance is compared with a conventional method like Perturb and observe (P&O) method.

1. Introduction

Photovoltaic (PV) system consists of an array, a power conditioner(s), and a transmission and distribution system. With changing irradiation and the cell temperature, the power produced by PV module varies nonlinearly. To achieve maximum power at all times, the Maximum Power Point Tracking Technique (MPPT) is developed. Till now, the MPPT algorithms comprise the constant voltage tracking (CVT), voltage feedback, Perturb and Observe (P&O), power feedback, incremental conductance (INC) method, Hill Climbing, Artificial Neural Network (ANN), Fuzzy Logic, and so on [1,2,3,4,5,6]. The simplest approach is the voltage feedback, where the output voltage at the maximum power point is essentially recognized in advance of the tracking operation. To locate the MPP, the P-V characteristic curve must be updated often, but due to the PV module declines, MPP drifts. Most of the conventional methods based on the perturbation of voltage, current or both. The popular technique is P&O method. This method compares present and past power, and then check whether the power is improved or not. If the power is improved the perturbation direction is correct otherwise the direction is reversed. This method produces more oscillation and tracking speed is less [7,8,9,10,11,12,13,14,15].
Over recent years, a large number of studies have been published on smart MPP trackers to accurately locate the MPP and enhance the performance of tracking, during static and dynamic conditions. In general, practically partially shaded panels have multiple peaks. But, these tracking approaches fail to track the global MPP due to the multiple peak problems [16,17,18,19]. In order to overcome this problem, PSO algorithm is used to follow the global MPP instead of tracking the local MPP on a multifaceted nonlinear output curve. PSO algorithm based on maximum power point tracking techniques have been proposed recently for a photovoltaic module, to increase the dynamic response of tracking [20,21,22,23,24,25,26,27,28].
Various literature shows that the PSO based MPPT incorporates for a boost converter in PV applications [20,21,22,23,24,25,26,27,28,29]. The significant contribution of this work is that the PSO based MPPT is incorporated in Z-Source inverter. Also, the implementation of MPPT and PWM generation is performed in the dspace 1104 controller. This paper mentions an enhanced MPPT method based on a PSO algorithm using a Z-Source inverter. This MPPT has a comparable structure to the conventional P&O method; therefore, a direct duty cycle control can be utilized. The main advantages of the proposed method are the reduction of steady-state oscillation and faster tracking of MPP even during the extreme environmental condition, e.g., partial shading condition and large fluctuations of irradiance. By comparing it to conventional MPPT techniques, it has been found that the PSO has a faster tracking speed. Moreover, due to the simplicity of the algorithm, it can be computed very quickly; so, it is also possible to implement this algorithm using a simple low-priced controller. The tracking performance of this method is established by experimental results. In [30], the algorithm computes the value of initial particles’ dMPP (duty cycle at MPP) based on the voltage at maximum power. Therefore, the algorithm can start the optimization process with an initial value that is already close to the MPP.
This paper is prepared as Section 1 presents introduction and necessity of MPPT, and Section 2 gives the modeling of 60 W PV panel using mathematical equations [31,32,33]. Section 3 and Section 4 discuss conventional perturb and observe method and particle swarm optimization method, respectively. To integrate the output of PV panel to load through Z-Source inverter is discussed in Section 5 [34,35,36,37,38]. Finally, the results are conferred in Section 6.

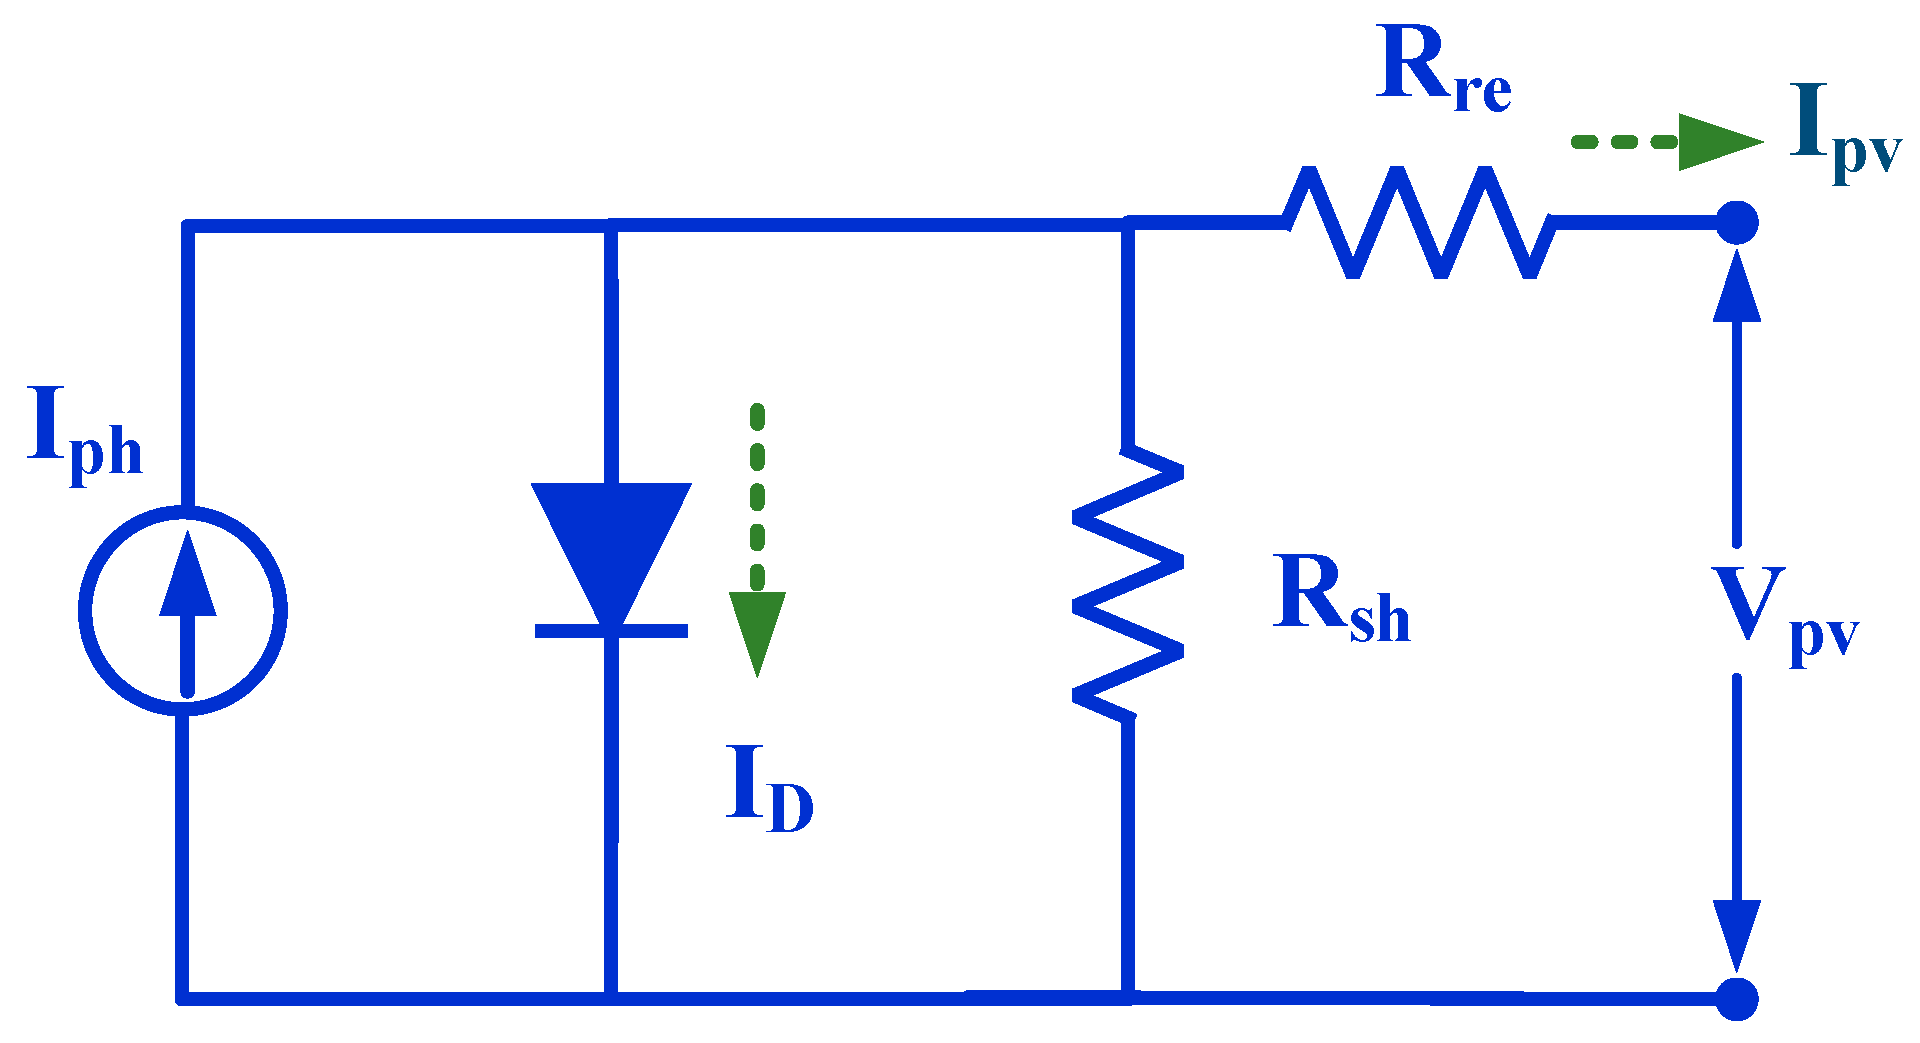
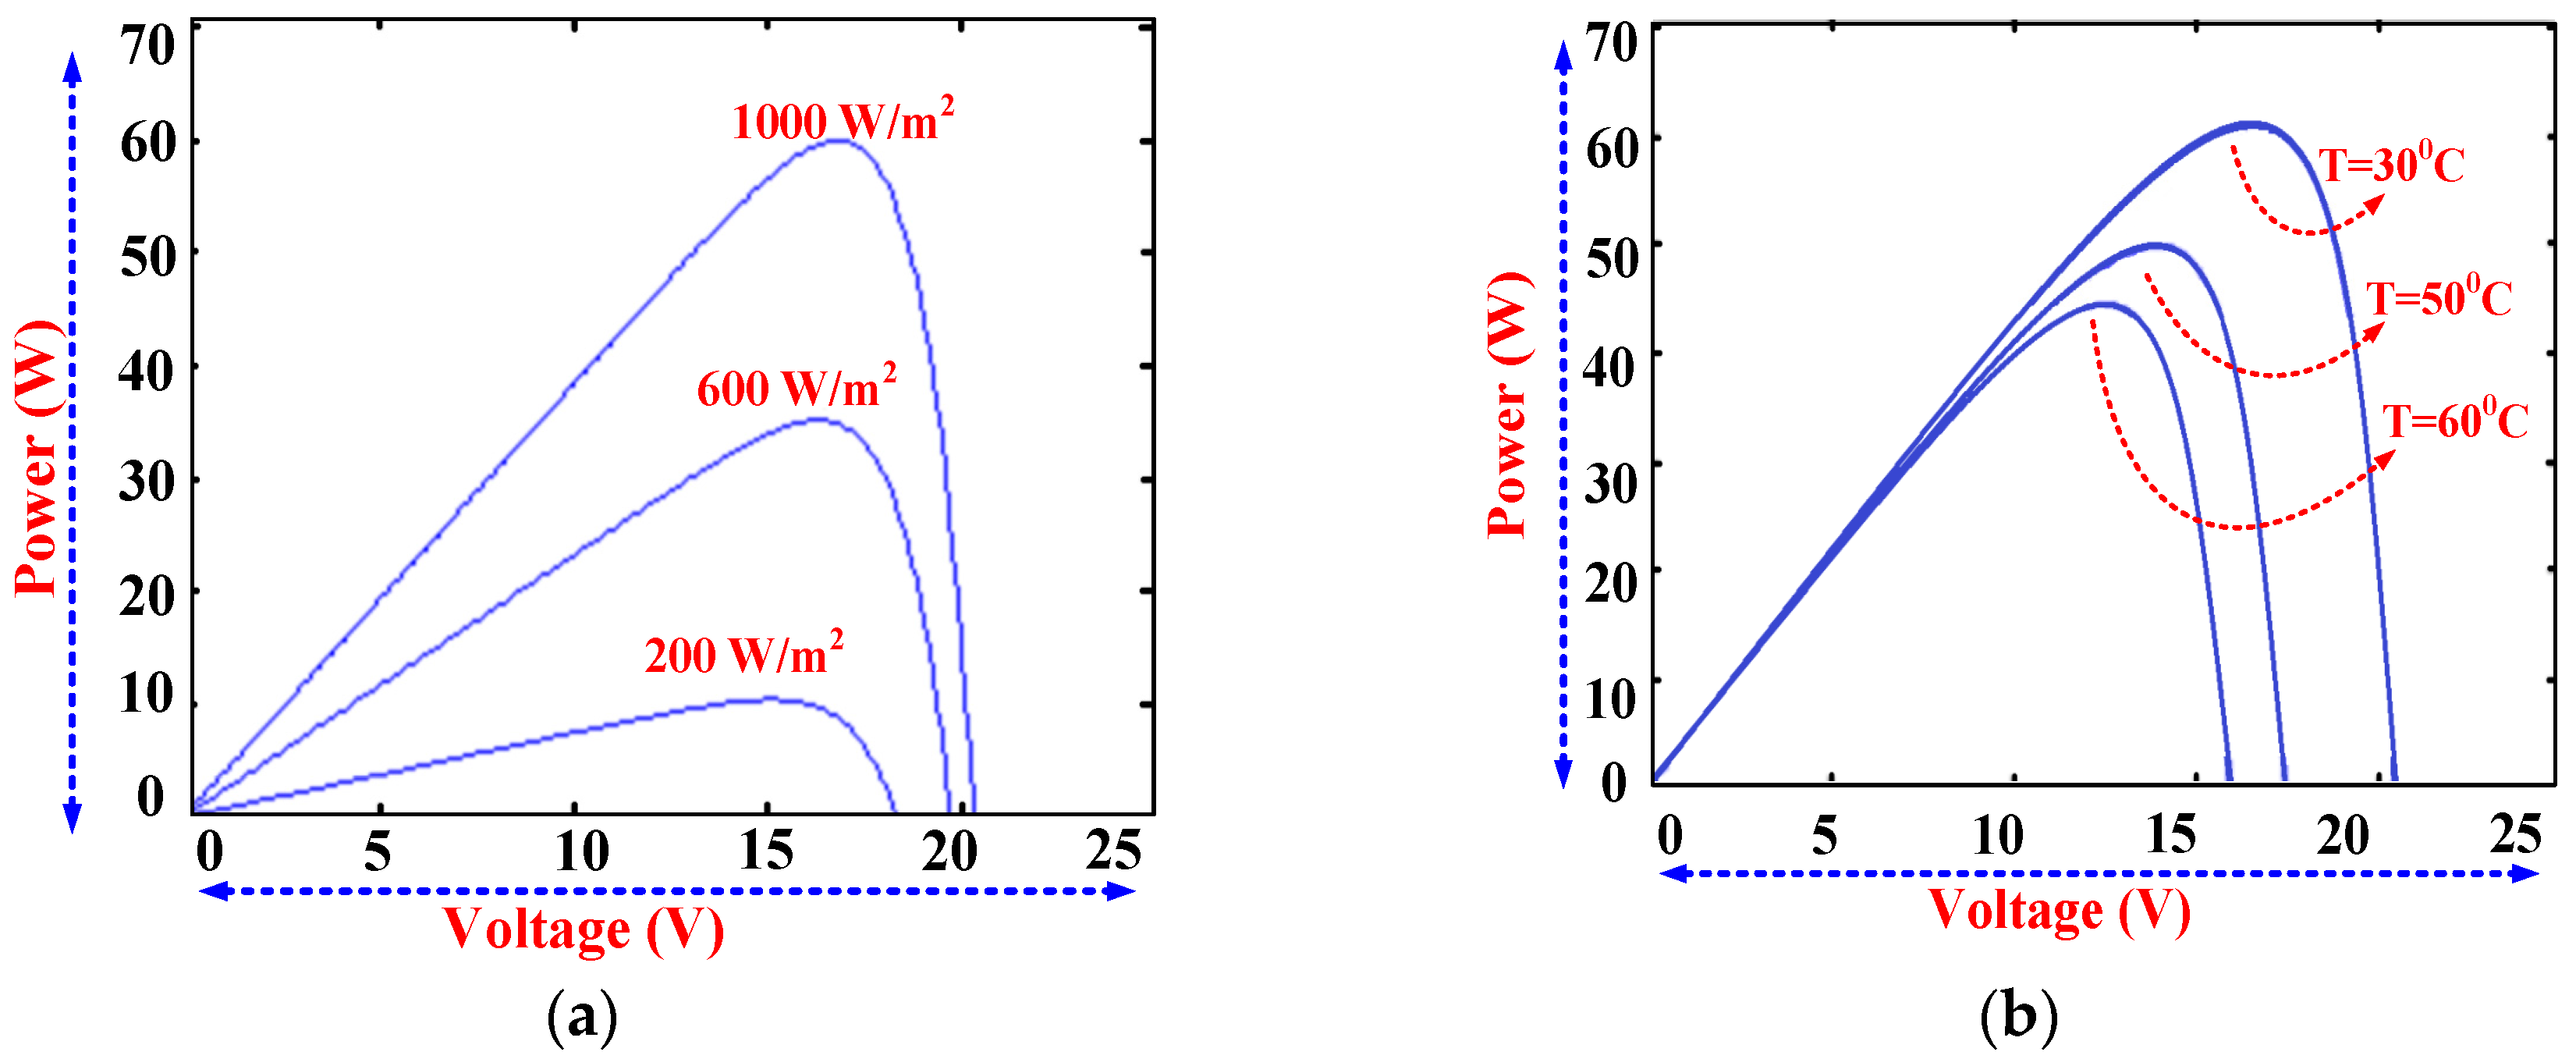
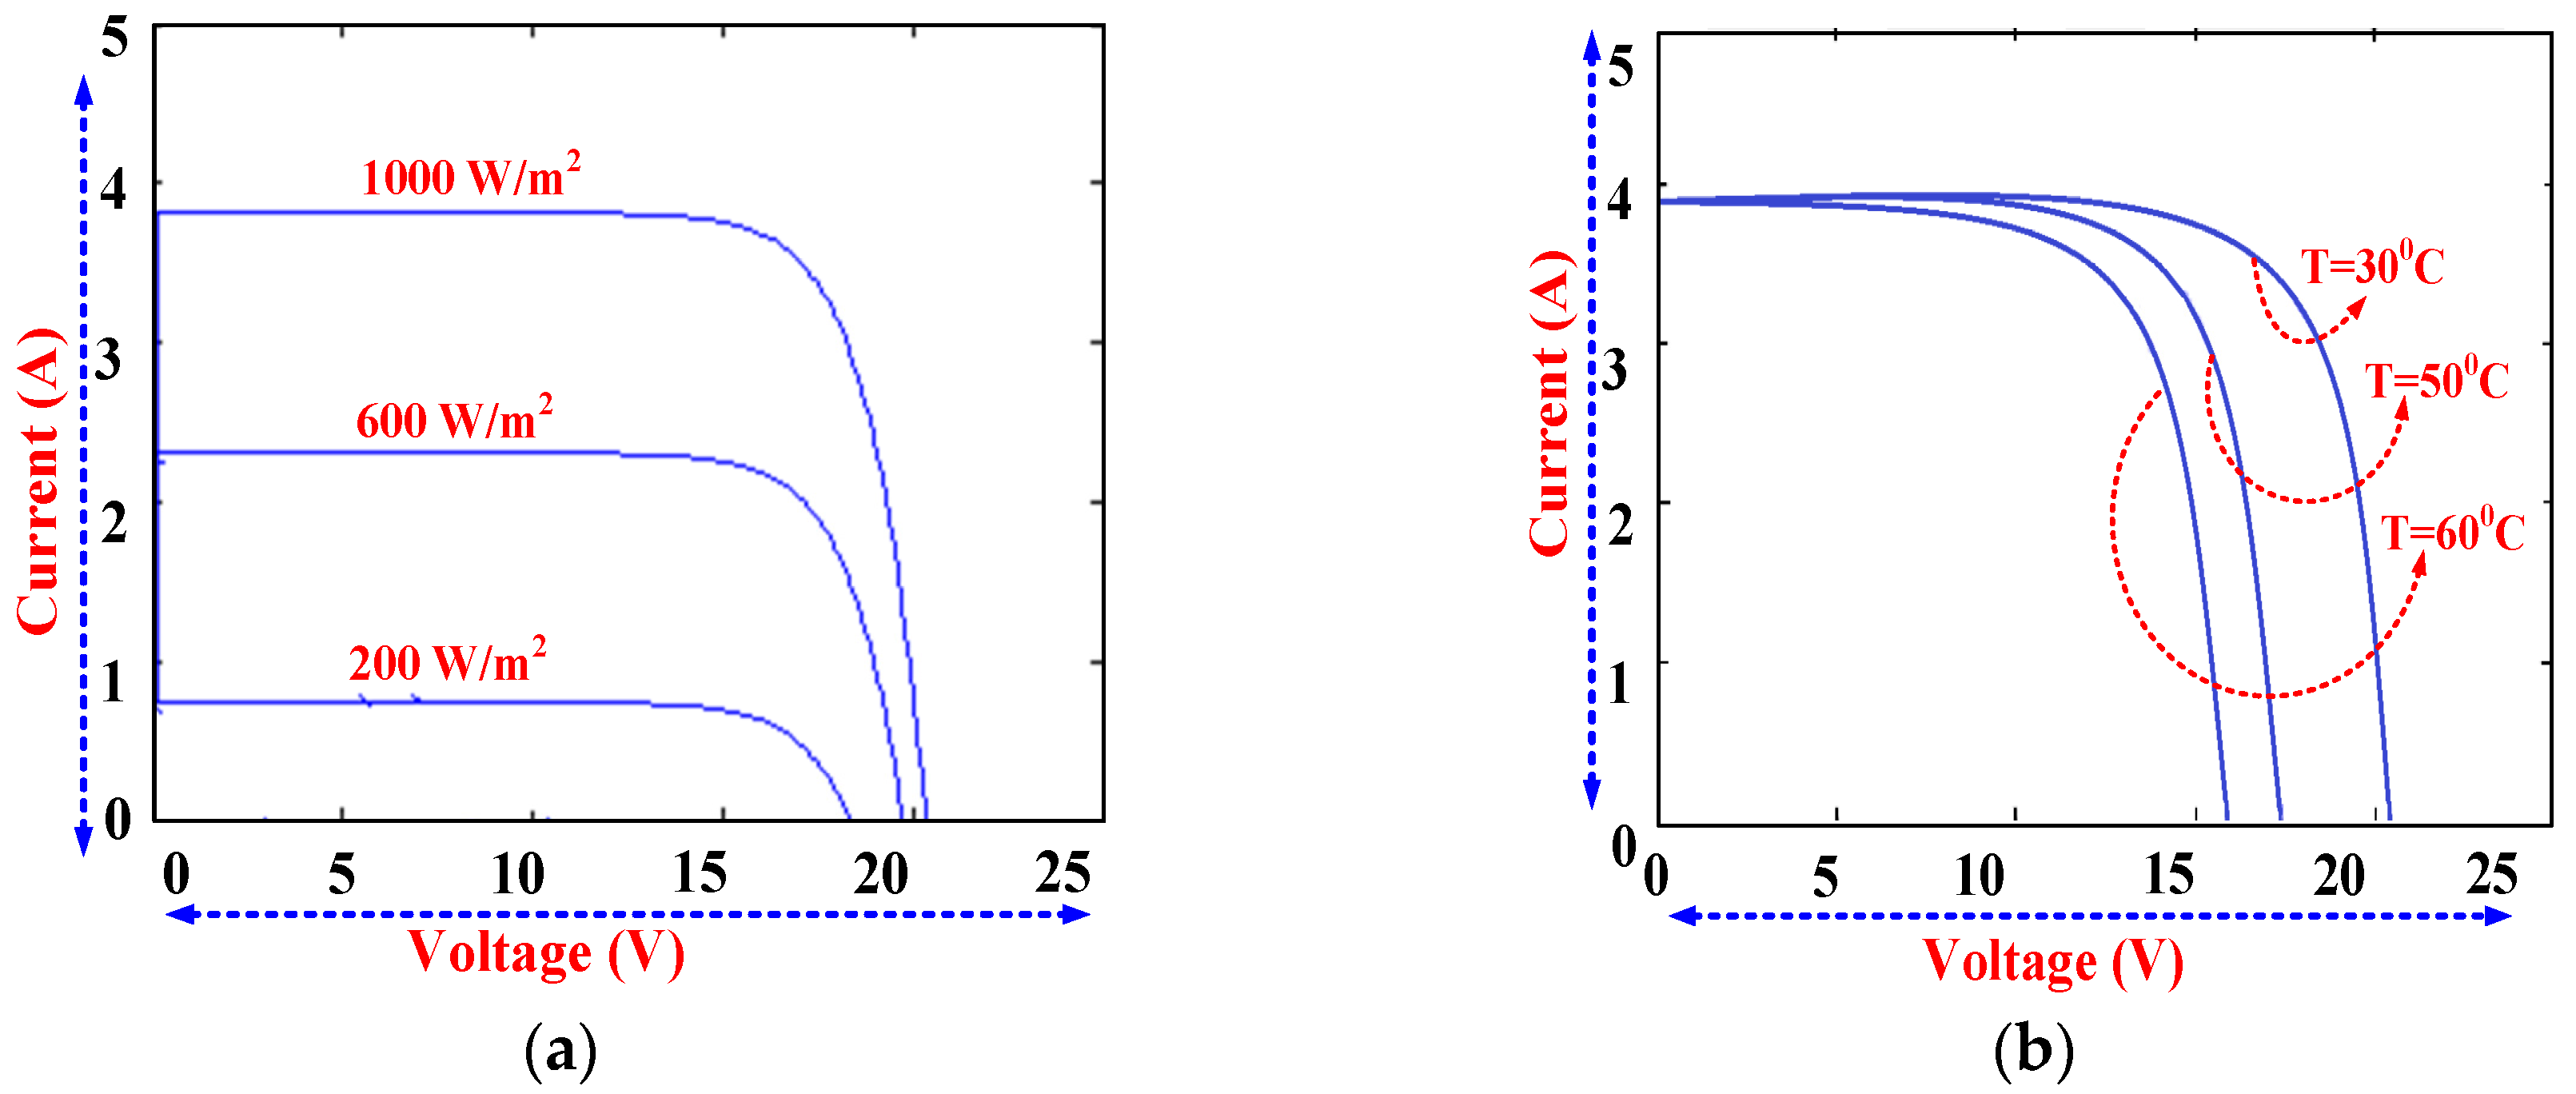
2. Modeling of PV Module

The PV module is used to convert light into electricity. To model the PV module, the required input variables are weather data, such as irradiance and temperature and output variables, may be voltage, current, power, or all the three. Though, to trace the I-V or P-V characteristics, there is a need for these three variables. The output changes immediately if any change in input. So, it is important to design an accurate model for the PV module [31].
In solar panels, Maximum Power Point Tracking (MPPT) is used to achieve the maximum possible power extraction during variations of irradiance, shading, and temperature. The equivalent circuit of PV cell shown in Figure 1.
From the PV equivalent circuit shown in Figure 1, the following parameters are calculated. The output current from the equivalent circuit is described as Equation (1)
I = I p h I s c ( exp q ( V + R s I ) N K T 1 ) ( V + R s I R s h )
where Iph-photocurrent, Isc-short circuit current, V-cell voltage, Rs-series resistance, and Rsh-shunt resistance, respectively. Iph is expressed as Equation (2).
I p h = [ I s c + K i ( T 298 ) ] I r 1000
where Ki-temperature coefficient, T-cell temperature, and Ir-solar insolation in Watts/m2. The saturation diode current is specified in Equation (3). Where Ego-Band gap energy, Tr-Nominal temperature, Vt-Diode thermal voltage.
Reverse saturation diode current is
I o = I r s [ T T r ] 3 exp [ E g o n V t ( T T r 1 ) ] .
Solar cells are arranged in series and parallel combination to obtain a PV module. Where Ns-Number of cells in series and Np-Number of cells in parallel. In MSX 60 W panel, the number of cells connected in series is 36 and parallel are 1. The Equation (4) represents the output current of the PV module.
Output current of the PV module is
I = N p I p h N p I o [ exp ( q ( V N s + I n R s N p ) K n T ) 1 ] ( N p V N s + I R s R s h ) .
These equations are modeled in MATLAB and the P-V, I-V curves are obtained in different irradiance and temperatures are shown in Figure 2 and Figure 3. Table 1 shows the parameter specifications of the MSX-60Watt panel.

3. Classification of MPPT
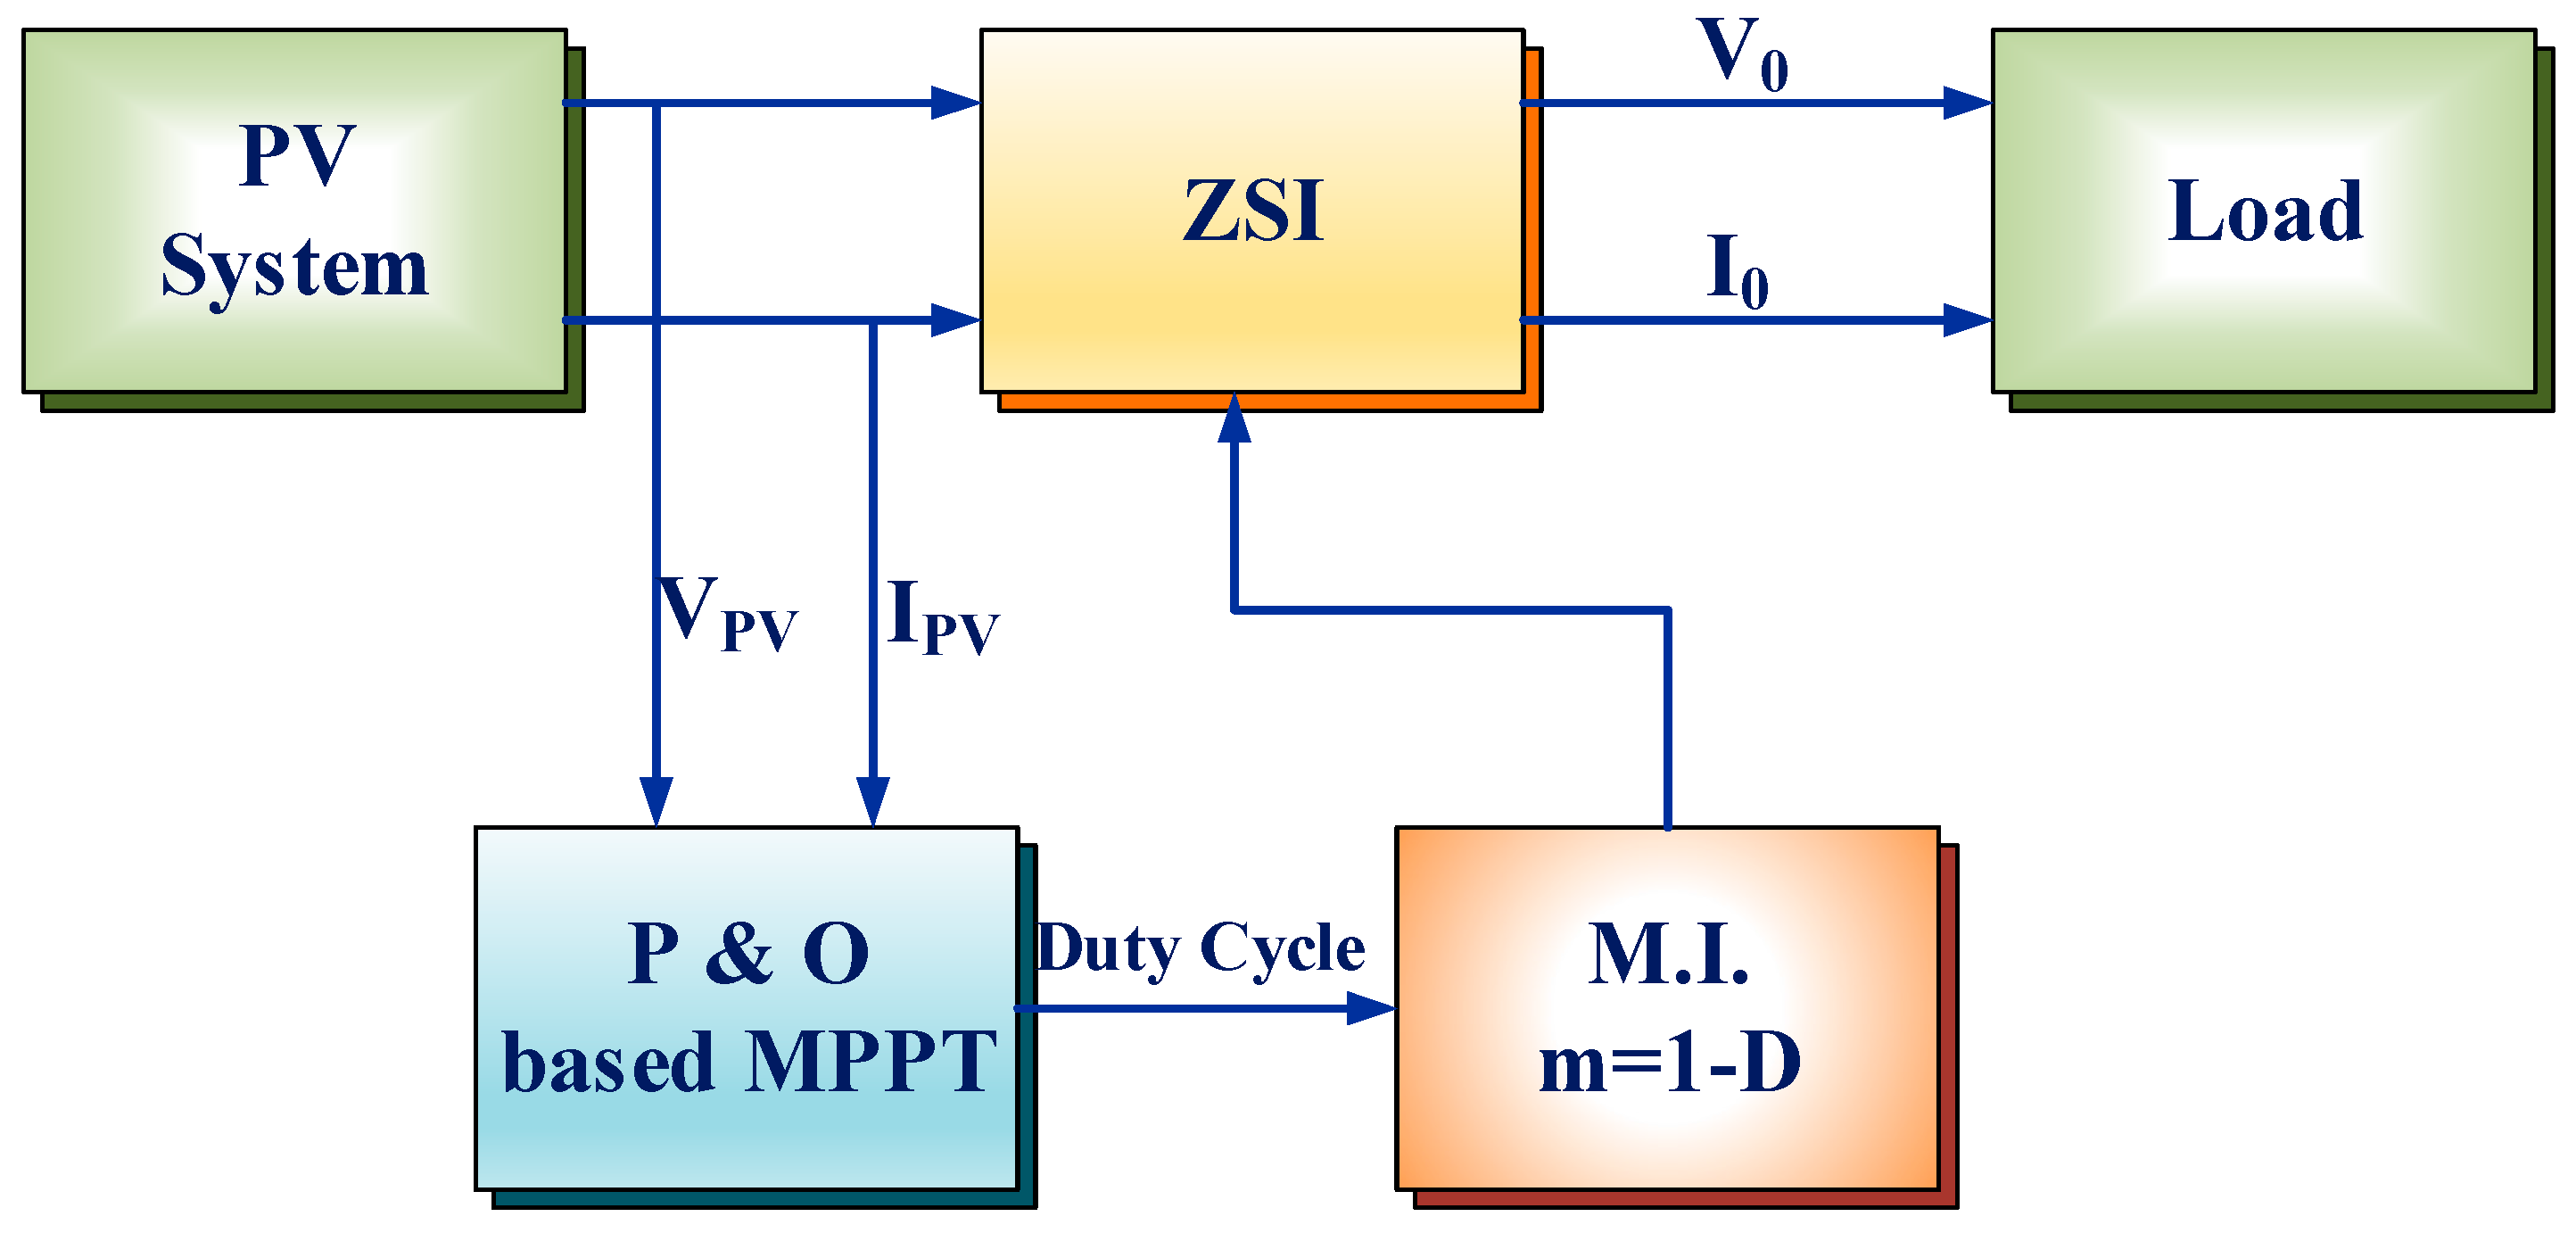
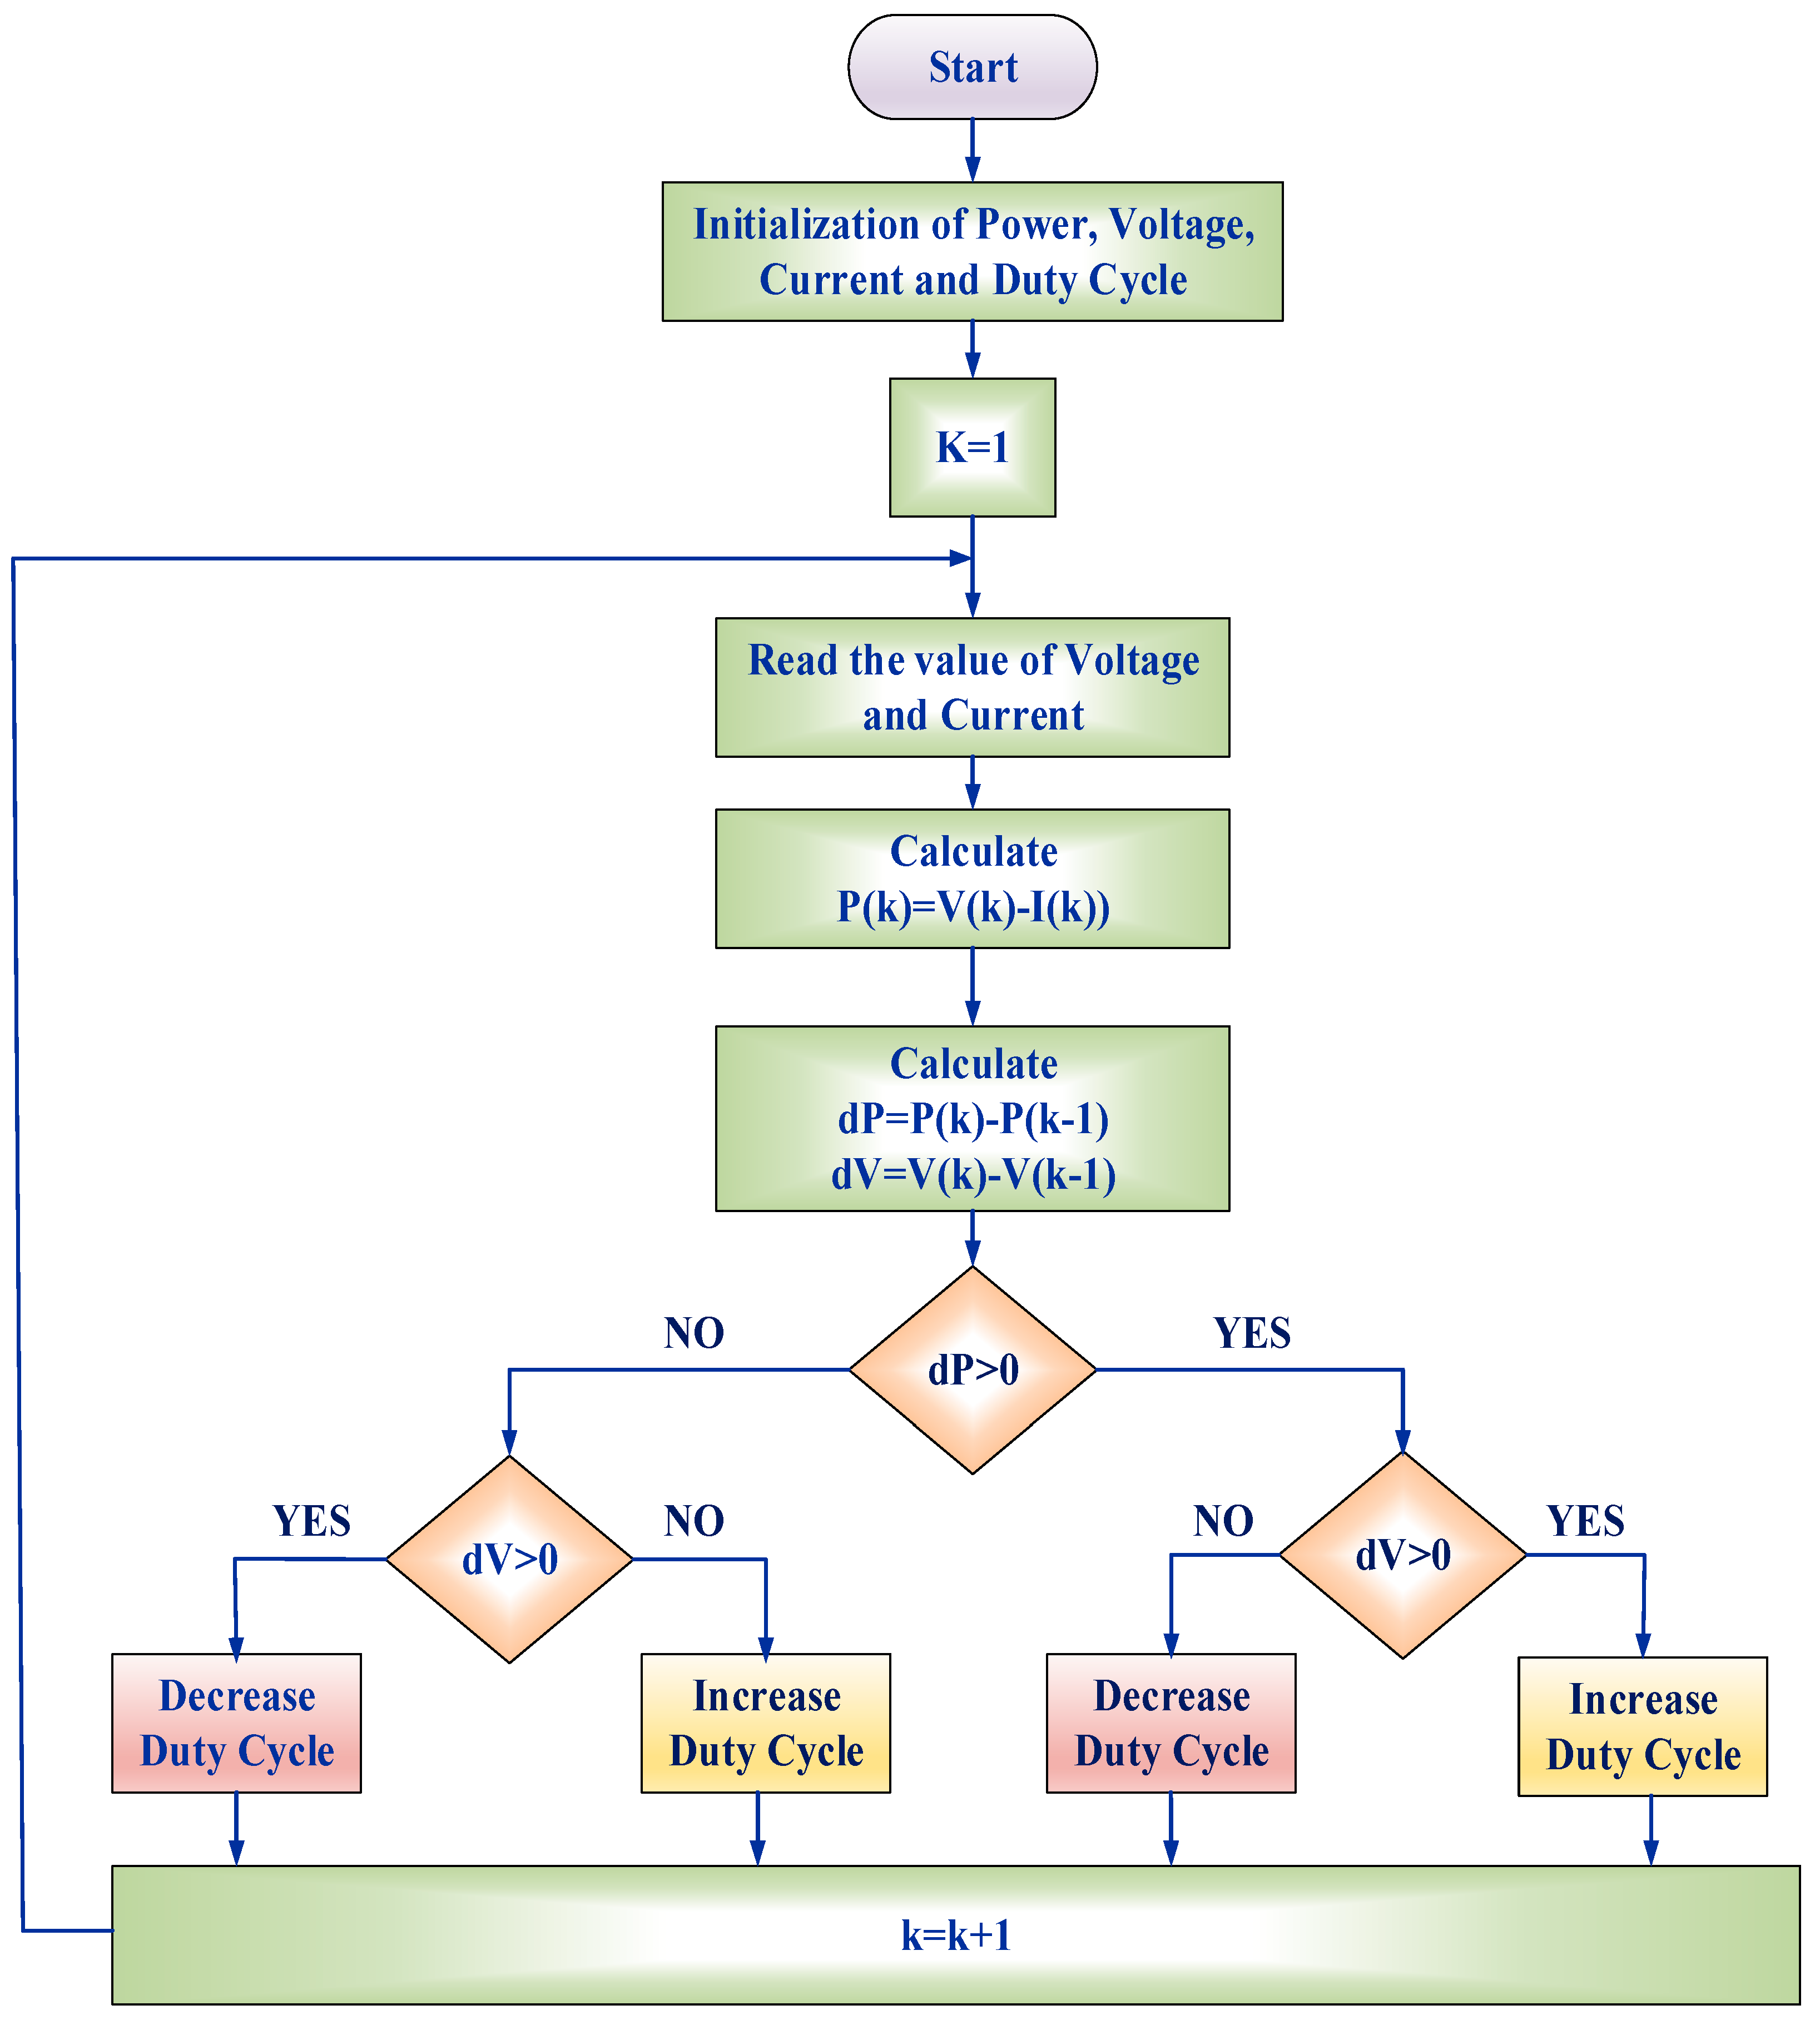
3.1. P&O Method

In perturb and observe method (P&O) a voltage perturbation is provided with respect to the change in the power of the panel. The conditions are, if dP/dV = 0, MPP is reached. Otherwise, dP/dV < 0, reduce the duty cycle by a value and dP/dV > 0, increase the duty cycle by a value [4,5,6]. Figure 4 represents the P&O based MPPT and step by step process of the P&O algorithm is depicted in the flowchart shown in Figure 5.

3.2. Hill Climbing Method

Hill Climbing (HC) method follows the same procedure as like of P&O method. The key difference between both methods is, in HC method perturb is used as duty ratio for power converter and in P&O method the working voltage of the PV array is perturbed [39].

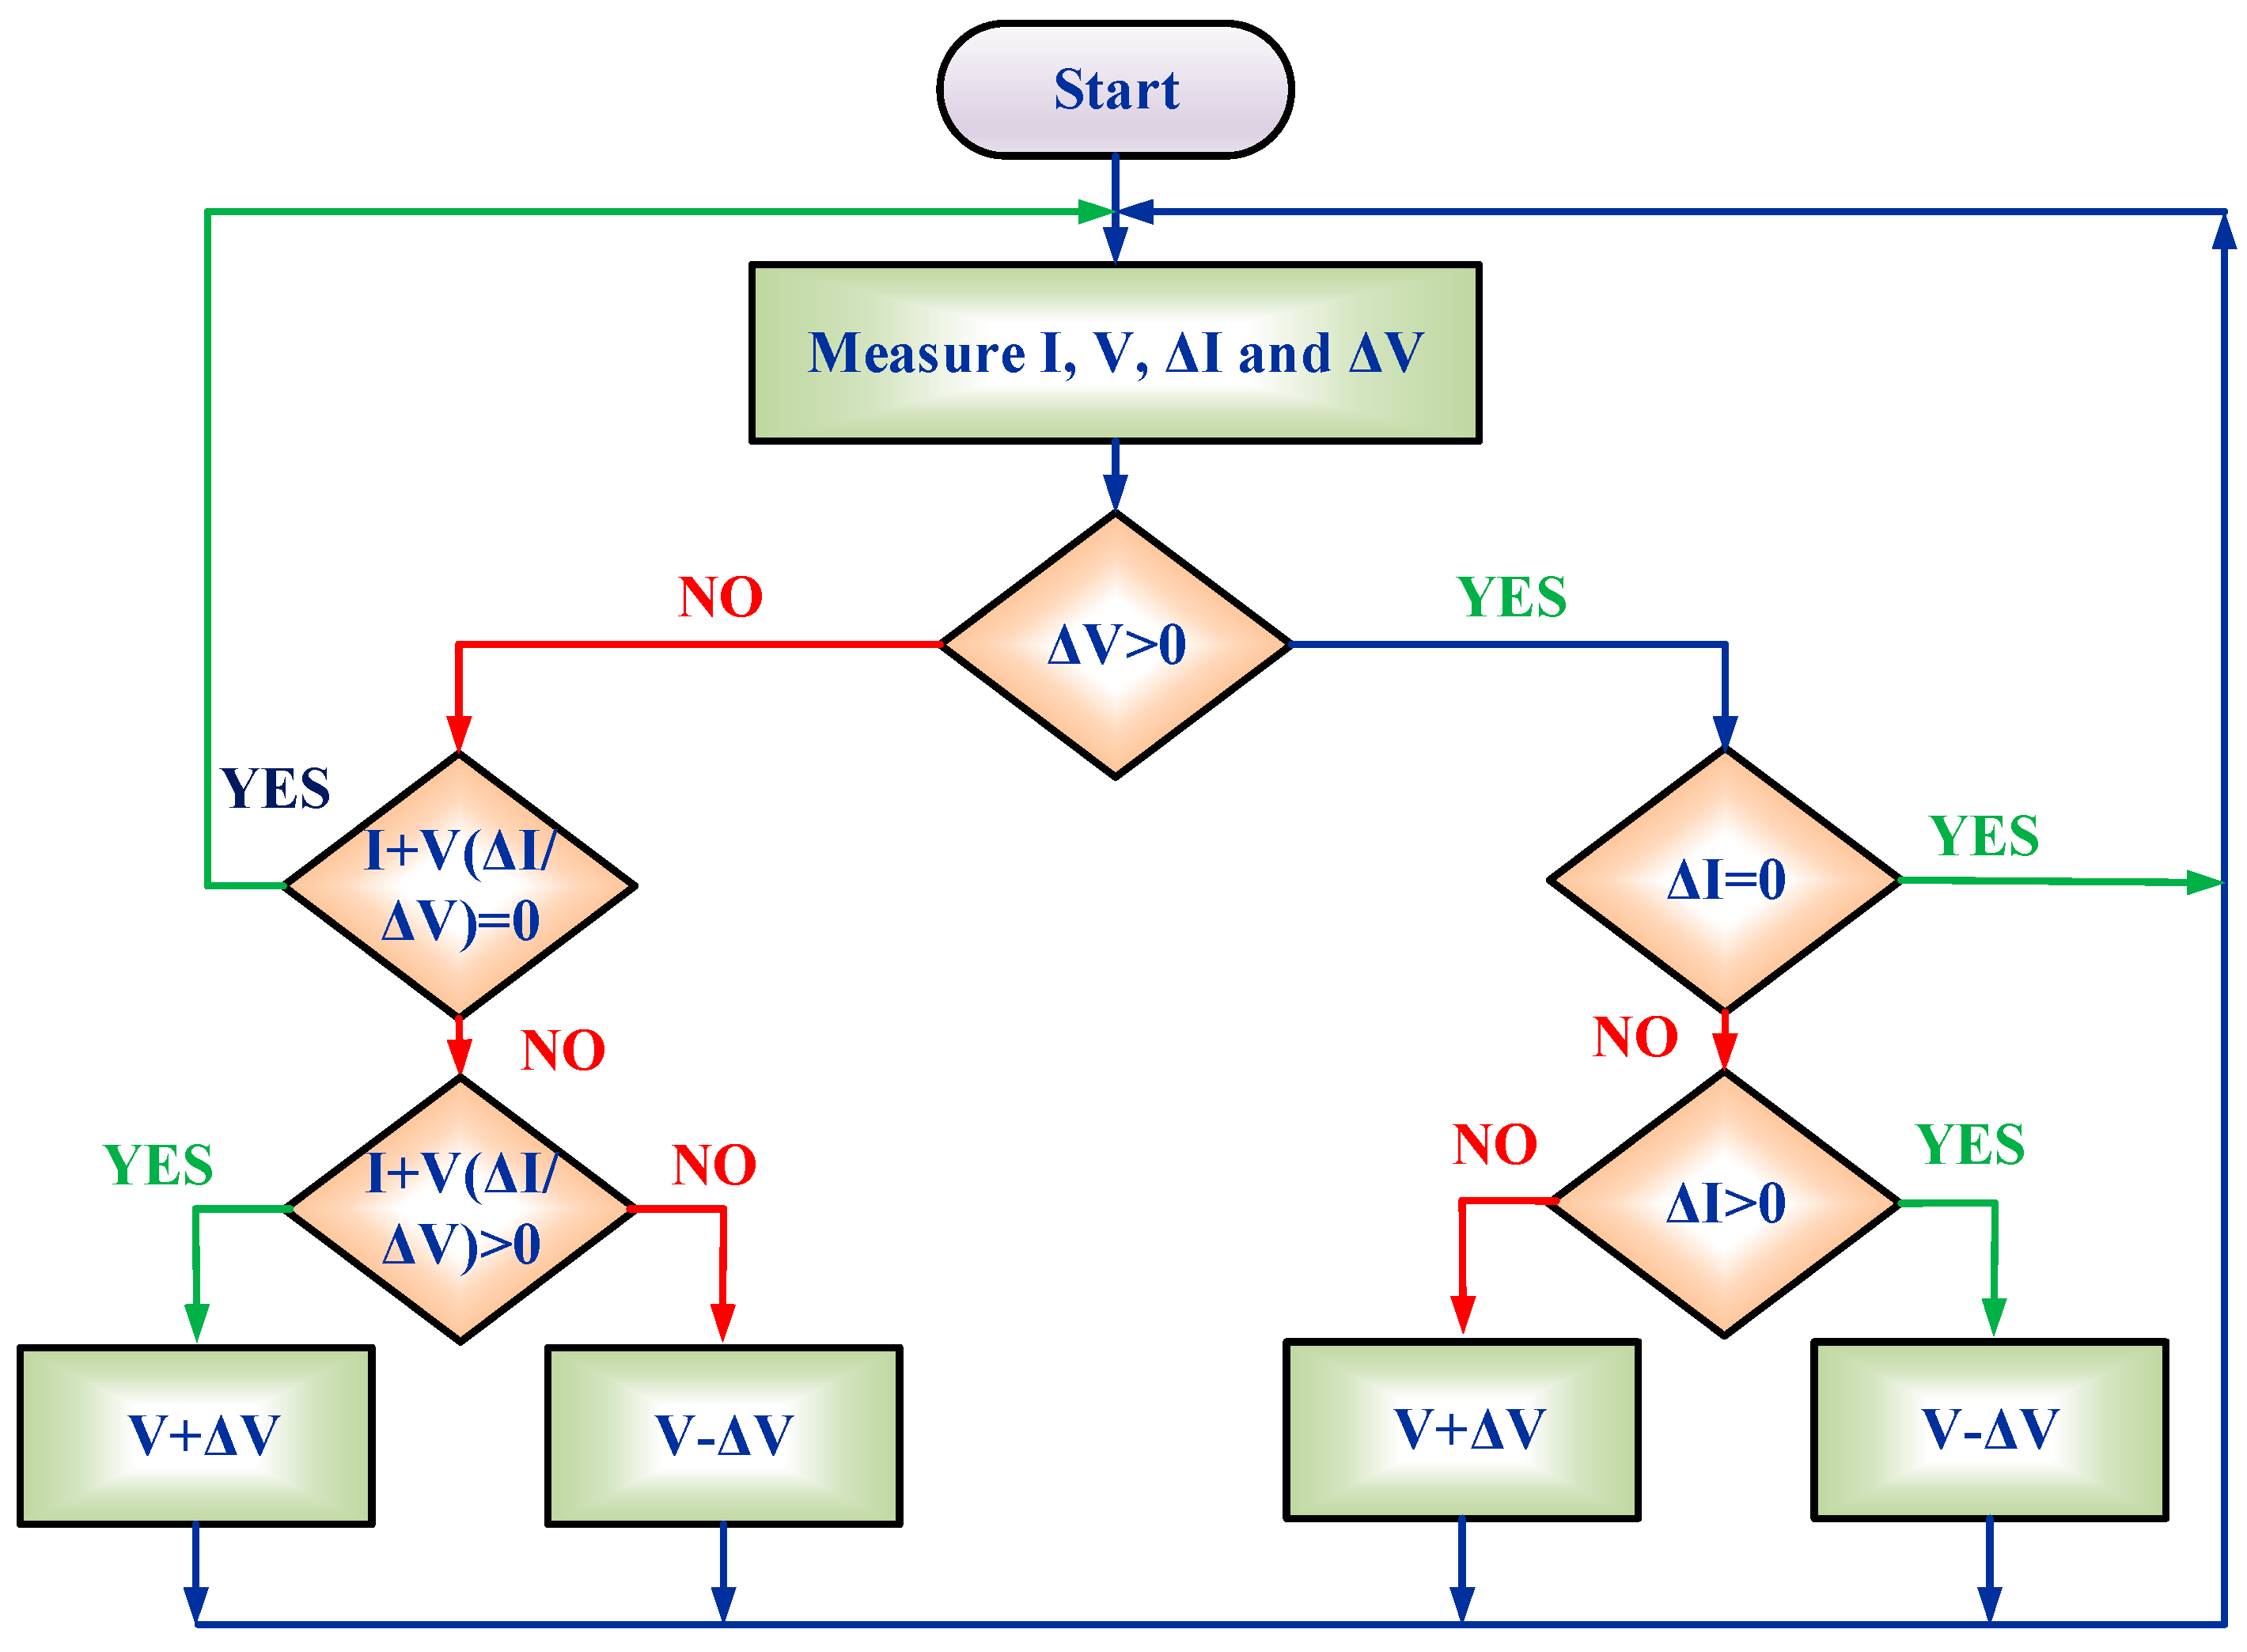
3.3. Incremental Conductance Method

The Incremental Conductance (INC) method is faster when compared to the HC and P&O method. The logic of INC method is at MPP, the derivative of power of PV with respective voltage is zero, negative on right of MPP and positive on left of MPP, on the P vs. V curve as expressed in Equation (5)
d P d V = d ( I V ) d V I + V Δ I Δ V
In INC method ΔV term play important role to decide the tracking speed [40]. The flow chart of INC method is shown in Figure 6.

3.4. Fuzzy Logic Based MPPT

The advantage of fuzzy logic is without dealing with nonlinearity and without precise mathematical model, it can work with inaccurate input. Fuzzification, rule base table and defuzzification, these are the steps involve in fuzzy logic. The input for fuzzy logic are error signal and change in CE which is given by Equations (6) and (7) and output is duty cycle.
E ( k ) = P p h ( k ) P p h ( k 1 ) i p h ( k ) i p h ( k 1 )
C E ( k ) = E ( k ) E ( k 1 )
The accuracy of fuzzy logic depends on the number of fuzzy level involved in algorithm. In algorithm, first E(k) and CE(k) is calculated. Based on these values, a rule based table is formed. The last stage in fuzzy algorithm is defuzzification in which linguistic variable is converter to numerical value with the help of membership function.

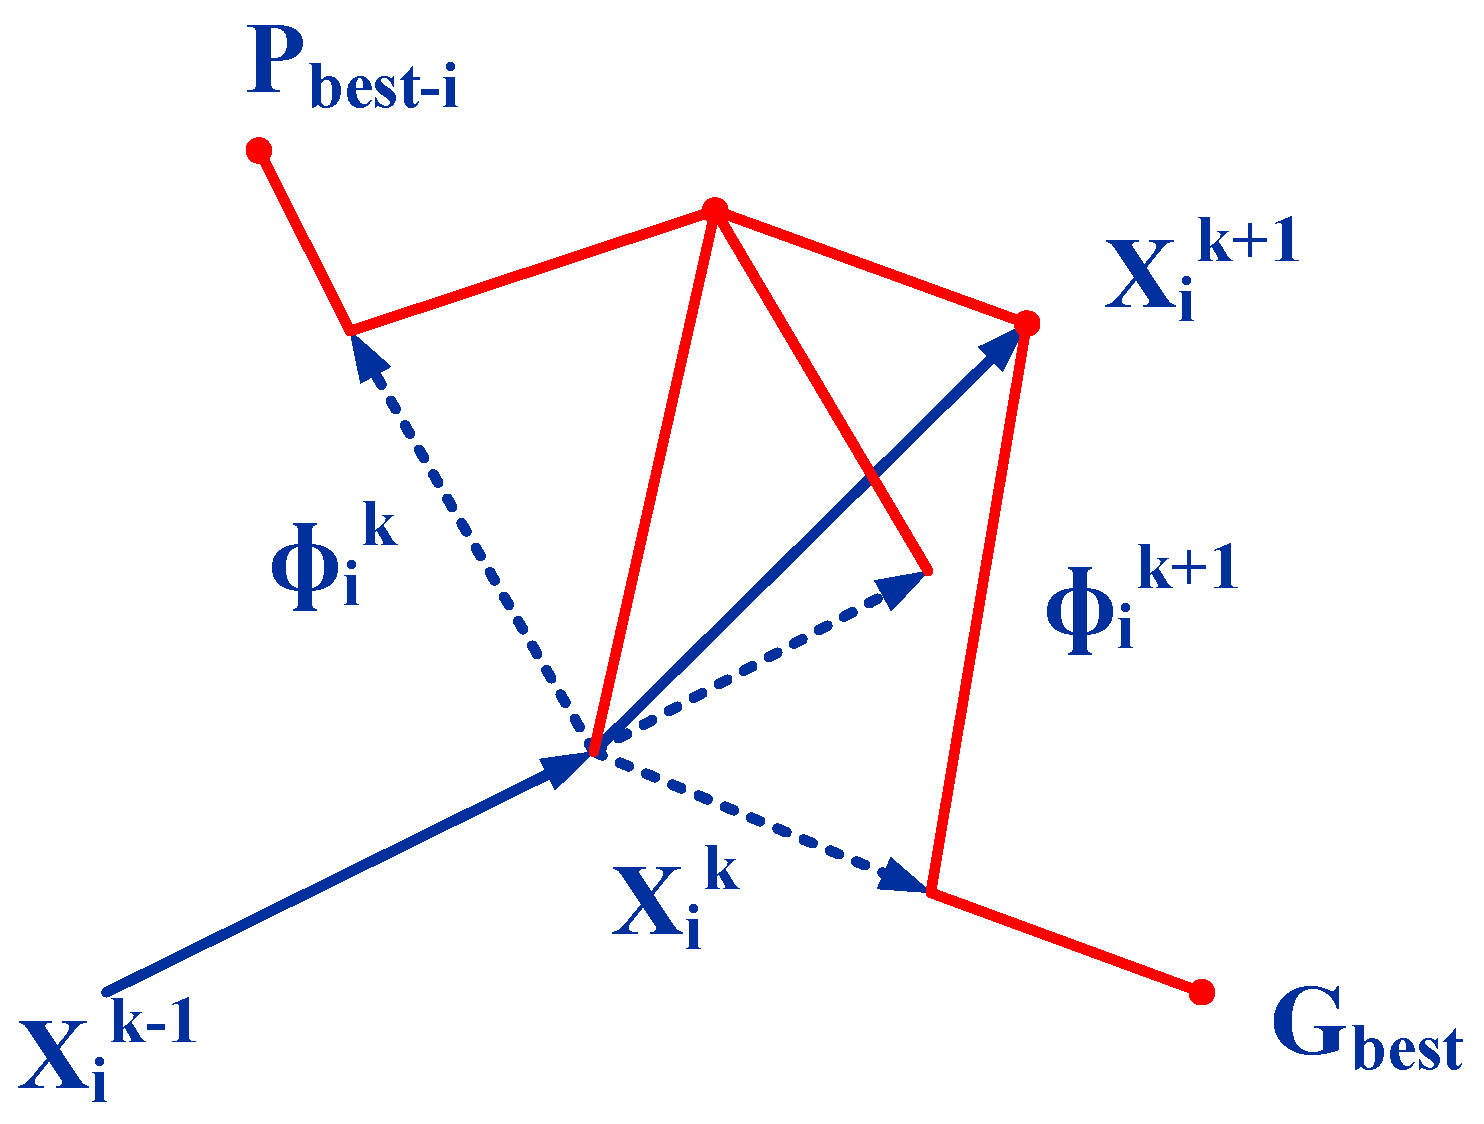
4. Particle Swarm Optimization (PSO) Algorithm

The PSO is an evolutionary algorithm that gives a better result with every iteration. It is based on bird flock concept where each bird follows the leader. In this case, each particle follows the best possible particle. In conventional PSO, there is a population of particles. The positions of these particles are compared with the local best position and the global best position, and accordingly these particles are moved in search space. The position of a particle is determined by the best particle in a region Pbest-i as well as the best solution found by all the particles in the total population Gbest-i. Movement of particles in the optimization process is shown in Figure 7 [8,20].
The particle position xi is adjusted using Equation (8)
x i k + 1 = x i k + φ i k + 1
where the velocity component ϕi represents the step size. The velocity is calculated by Equation (9)
φ i k + 1 = ω φ i k + c 1 r 1 { P b e s t i x i k } + c 2 r 2 { G b e s t i x i k }
where ω is the inertia weight, the acceleration coefficients are represented as c1 and c2, the random constants r1, r2 ∈ U(0, 1), Pbesti and Gbesti is the personal best position of particle i, and is the best position of the particles in the entire population respectively. Since the PSO algorithm is used to find the best duty cycle for switching the MOSFET of the ZSI. The position can be taken as duty cycle, and then Equation (10) can be rewritten as
d i k + 1 = d i k + φ i k + 1
In the PSO Algorithm, first the population of particles is formed and then the objective function is formed. Since it is implemented for Maximum Power Point Tracking (MPPT), the objective is to maximize the output power. The objective function of PSO is framed as max((P(k), P(k − 1)). In this work, the PSO Algorithm is implemented as a closed loop system for reducing the steady state oscillations and improving the tracking time to achieve maximum power. While forming the population of particles, it is necessary to bound them to a specific level. If not, the particles will lose their directions leading to the failure of the algorithm. The variation of the duty cycle is shown in Figure 8 with switching frequency of 10 kHz. Figure 9 represents the PSO based MPPT integrated through Z-Source inverter and Figure 10 represents the flowchart of PSO algorithm. According to Equation (14), the duty cycle is restricted to 0 to 0.5. The constraint for duty cycle is 0.1 to 0.4 is considered in the PSO algorithm.
When slow variation in irradiance, changes in duty cycle are small to track the MPP. Due to initialization, the change in duty cycle is large, then the particles will have large search area. So, some energy is wasted during the exploration process. If the above changes occur frequently, then the tracking needs to be fast to follow the change, but does not follow the MPP accurately. To overcome this issue modified PSO is used which is detailed in [20].
In modified PSO algorithm, the Gbest value is adjusted instead of varying the PSO parameter ω, C1, C2. The value of C1 = C2 = 2F, ω = 0.4. In slowly varying irradiance, the duty cycles are initialized in two phases. First, the duty cycle is adjusted by k1, using Equation (11) then perturbation of two extreme duty cycle with a constant value of k2, in both the direction shown in Equation (13).
d n e w = d o l d 1 k 1 ( P o l d M P P P M P P )
k 1 = Δ P M P P Δ d , k 1 = { k 1 if Δ P > 0 = { k 1 2 if Δ P < 0
d i , n e w k = [ d 1 k 2 ,   d 2 ,   d 3 + k 2 ]   for   k 2 0.05

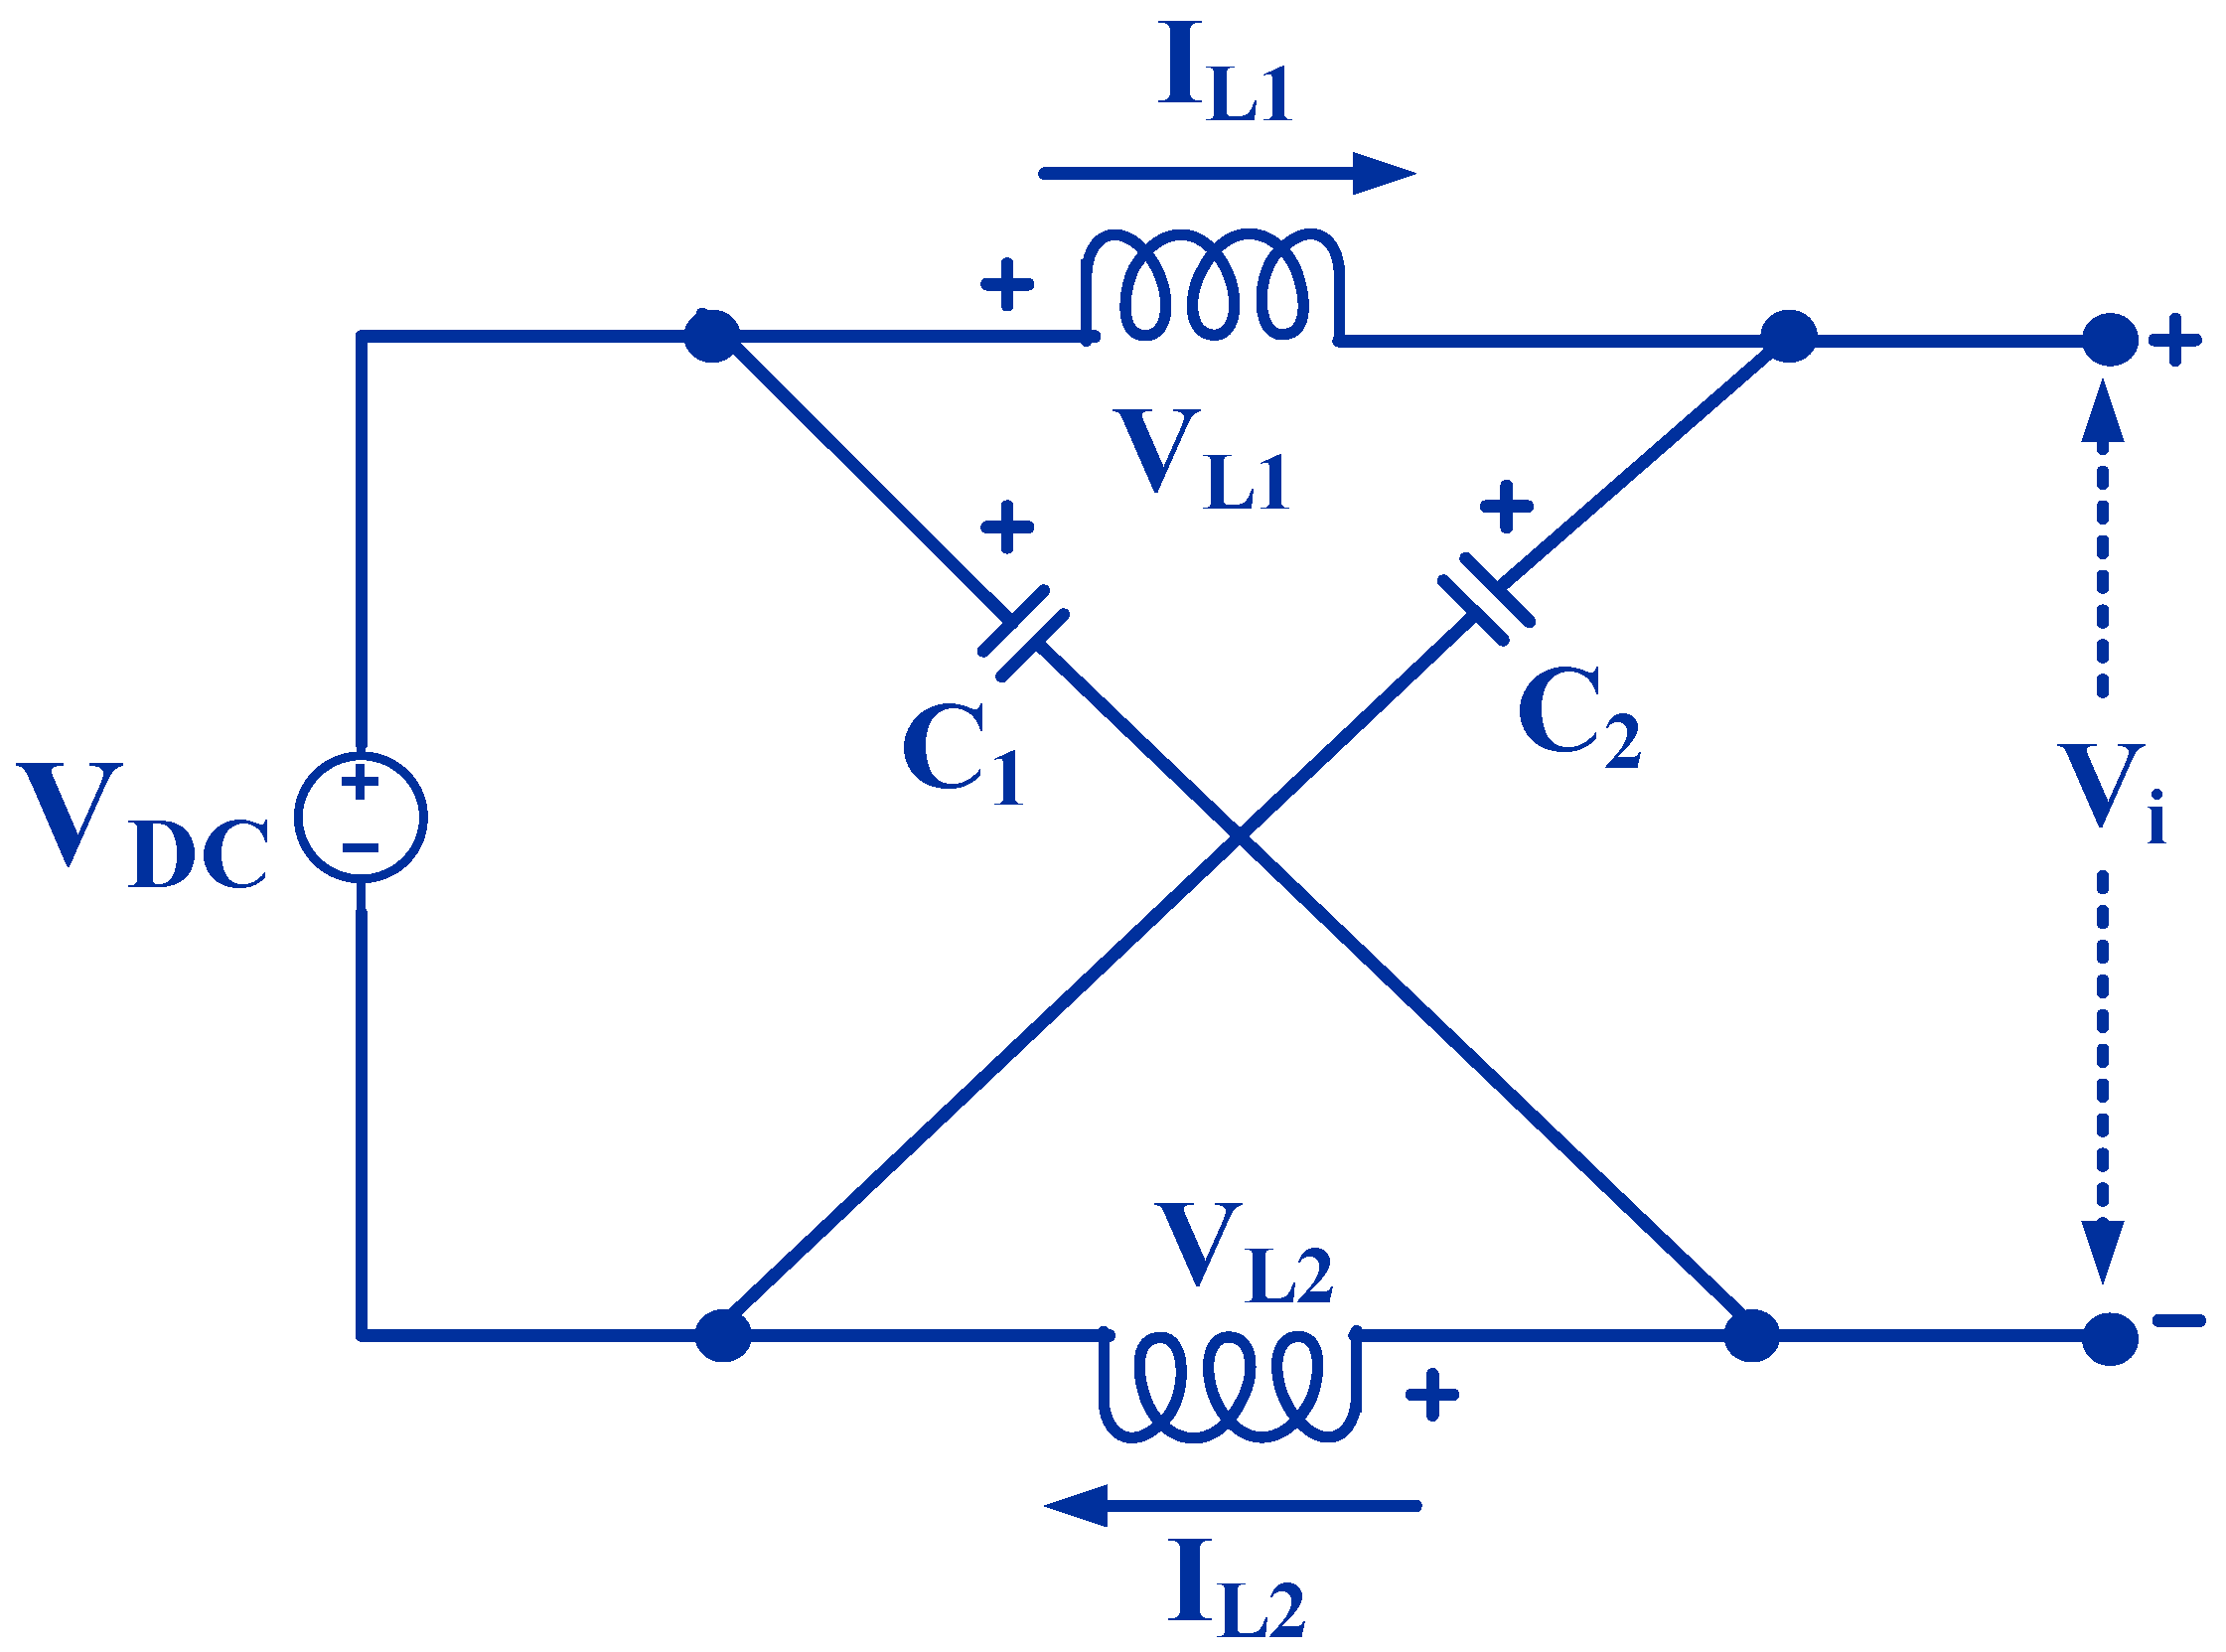
5. Z-Source Inverter

The split-inductor and capacitors are connected in ‘X’ shape to form the two-port impedance source. Impedance source inverter, which uses a unique impedance network connected between power source and an inverter circuit. It provides both voltage buck and boosts operations when compared with the traditional inverters. DC source can be a battery, fuel cell, PV cell, or output from the rectifier.
The circuit shown in Figure 11 has six switches with antiparallel diodes are used to provide bidirectional current flow and unidirectional voltage blocking capability [19,20,21,22].

5.1. Non-Shoot through State

In non-shoot through mode, the inverter is functioning in any one of the six traditional active vectors; the equivalent circuit is as exposed in Figure 12a.
V c 1 + V c 2 > V pv
V L 1 = V c 1 V L 2 = V c 2 }
The inverter acts as a current source when observed from the DC link. As shown in Figure 12a, the current in the inductor L1 and L2 are equal due to its symmetrical configuration. This feature increases the conducting interval of the inverter switches.
During non-shoot through state,
V d = V pv
B = 1 ( 1 2 D )
V C = ( 1 D ) ( 1 2 D ) V pv

5.2. Shoot through State

In the shoot through mode, the inverter operates in one of the seven shoot-through states. Here, the inductors L1 and L2 supply the inverter. The energy stored in the inductors during non-shoot through state is transferred to the inverter in this mode. The equivalent circuit of the inverter bridge in this mode is as shown in Figure 12b. The time period of the shoot through state is adjusted to obtain the required value of boost voltage. Generally, the shoot through interval is only a small portion of the switching interval.
During shoot through mode,
V d = 2 V c , V i = 0

5.3. Traditional Zero State

Figure 13 represents the equivalent circuit of the inverter in traditional zero states.
The upper or lower three switches of the inverter are operating causes the traditional zero state. During this time, the inverter acts as an open circuit viewed from the Z-source and inductor carries current, which strengthens the line current’s harmonic reduction.
Switching frequency of the inverter (fsw) is 10 kHz. By using Equation (20), L and C values are calculated and are used in hardware. Where D is shoot through duty ratio, VC-capacitor voltage, Iavg is the average inductor current and ∆ I is inductor current ripple.
L = D V C D V C f s w Δ I C = I a v g D 0.03 f s w V C }

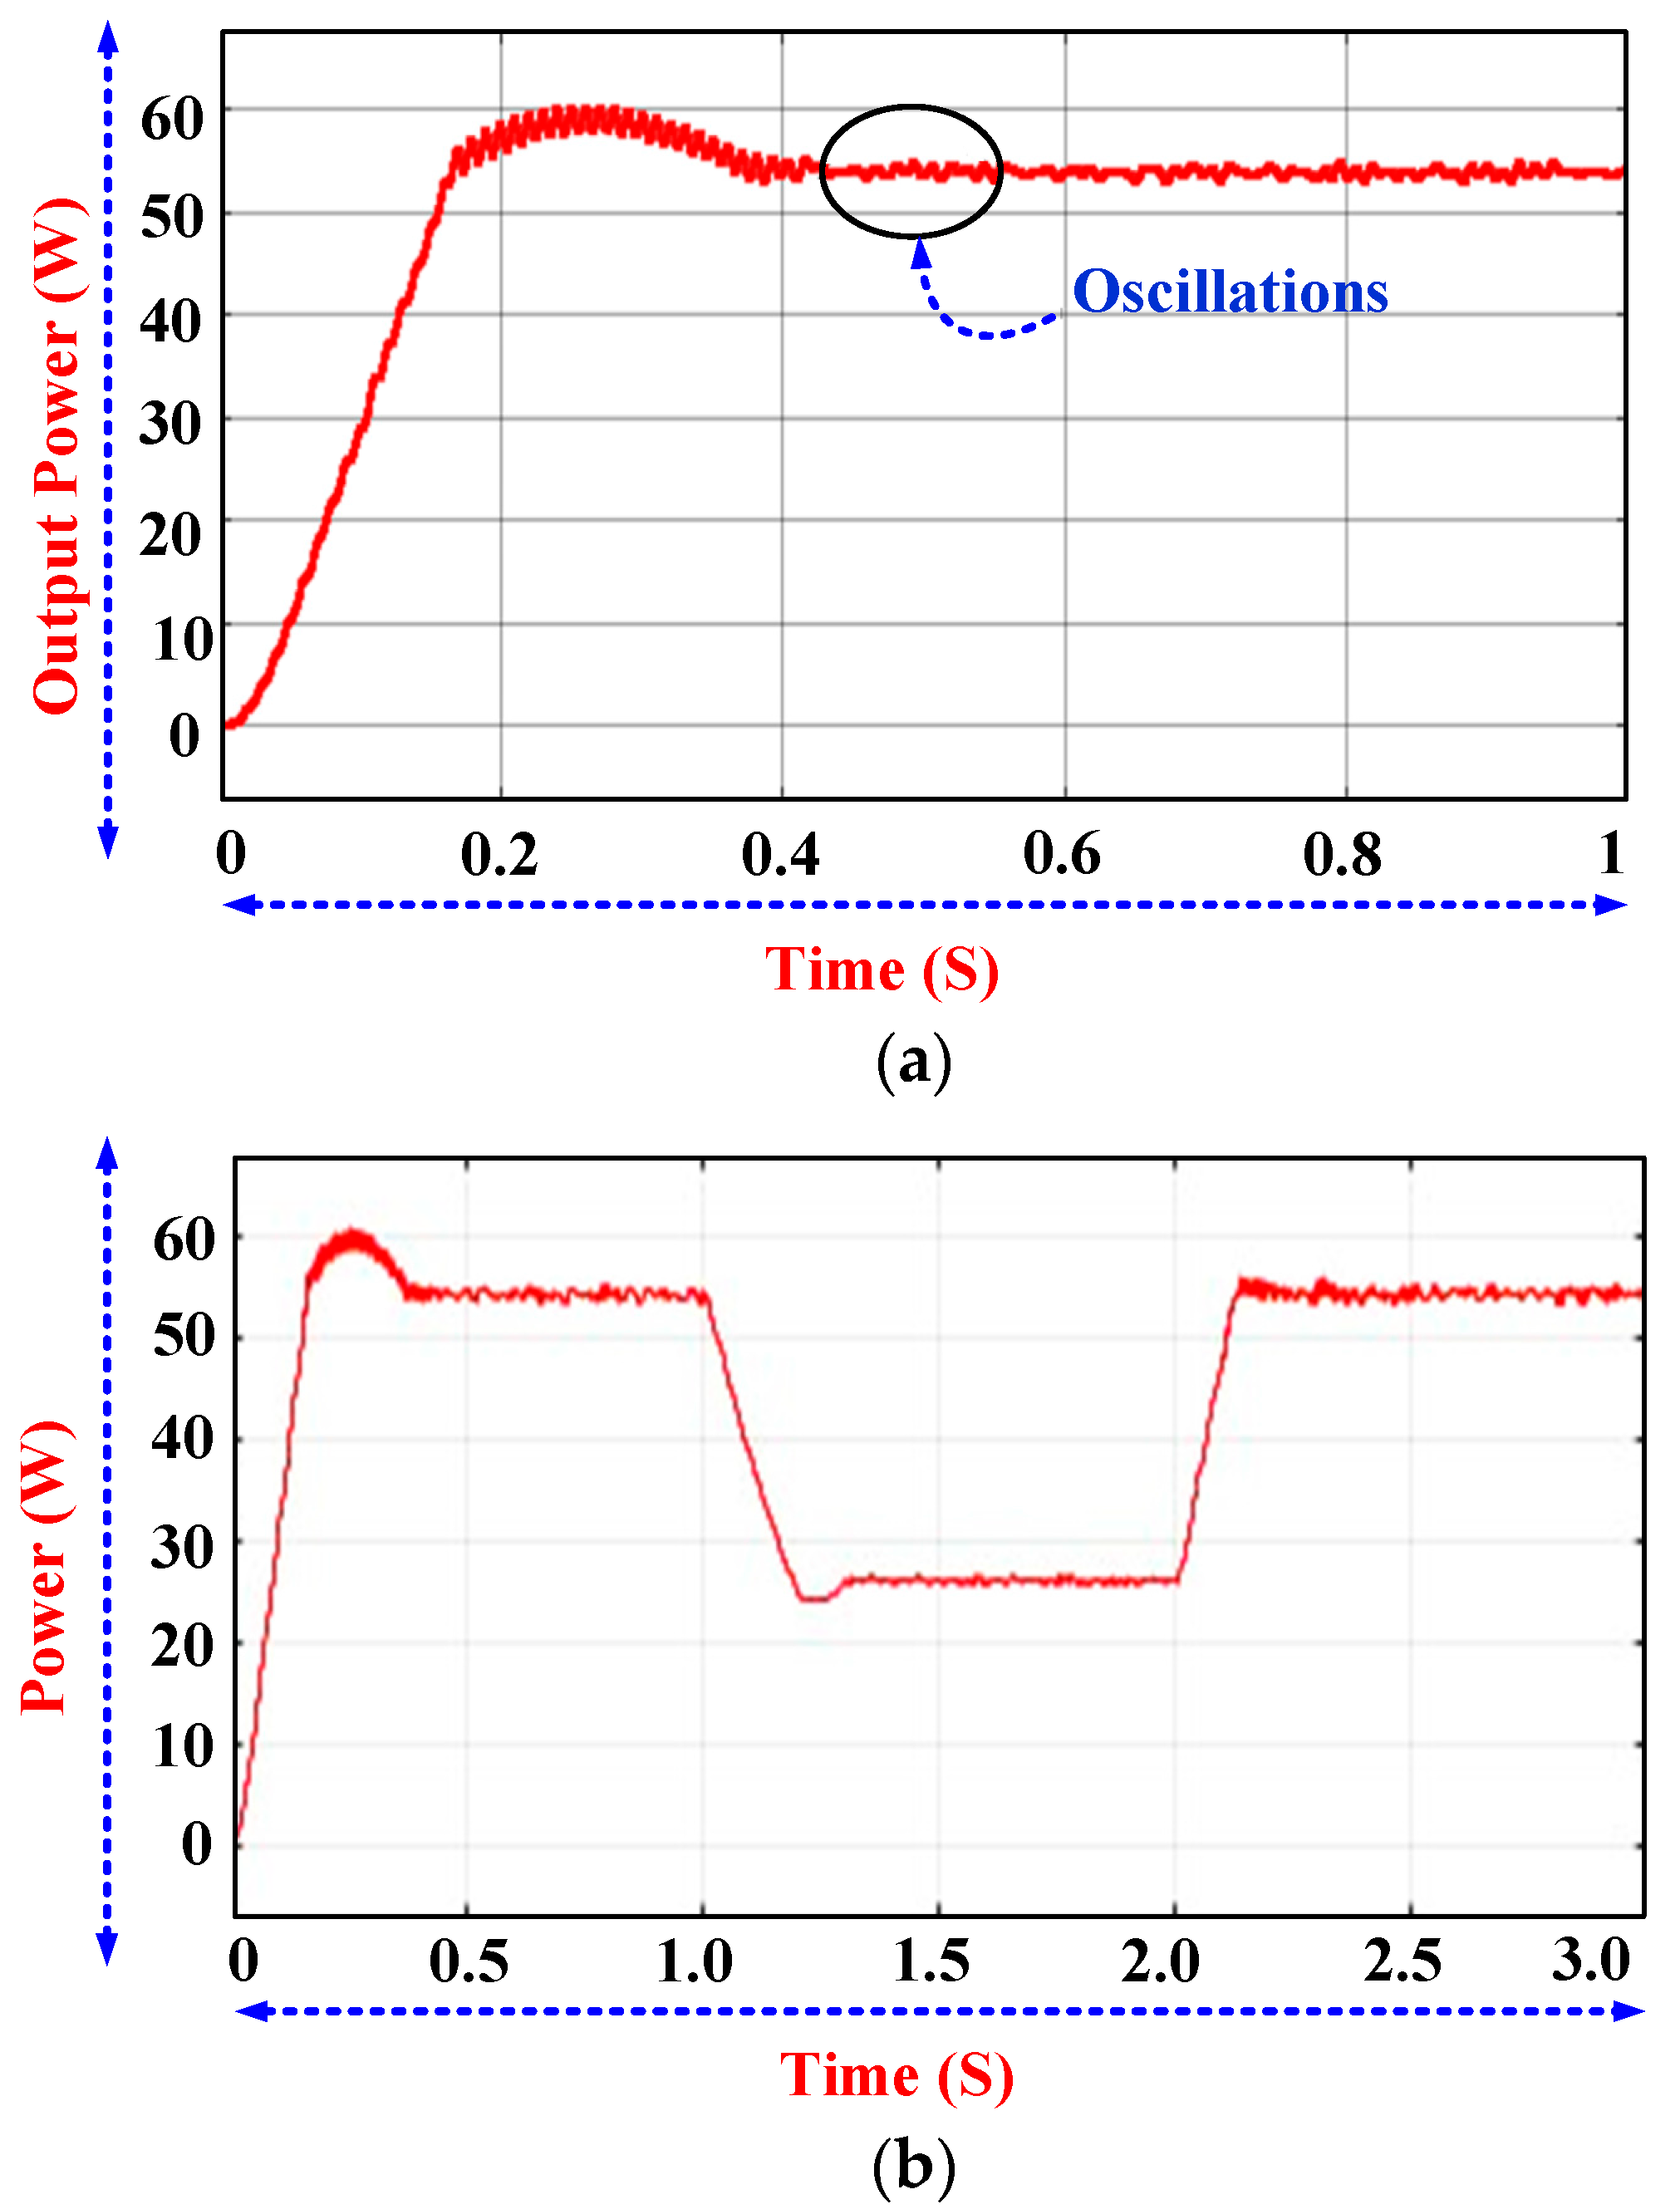
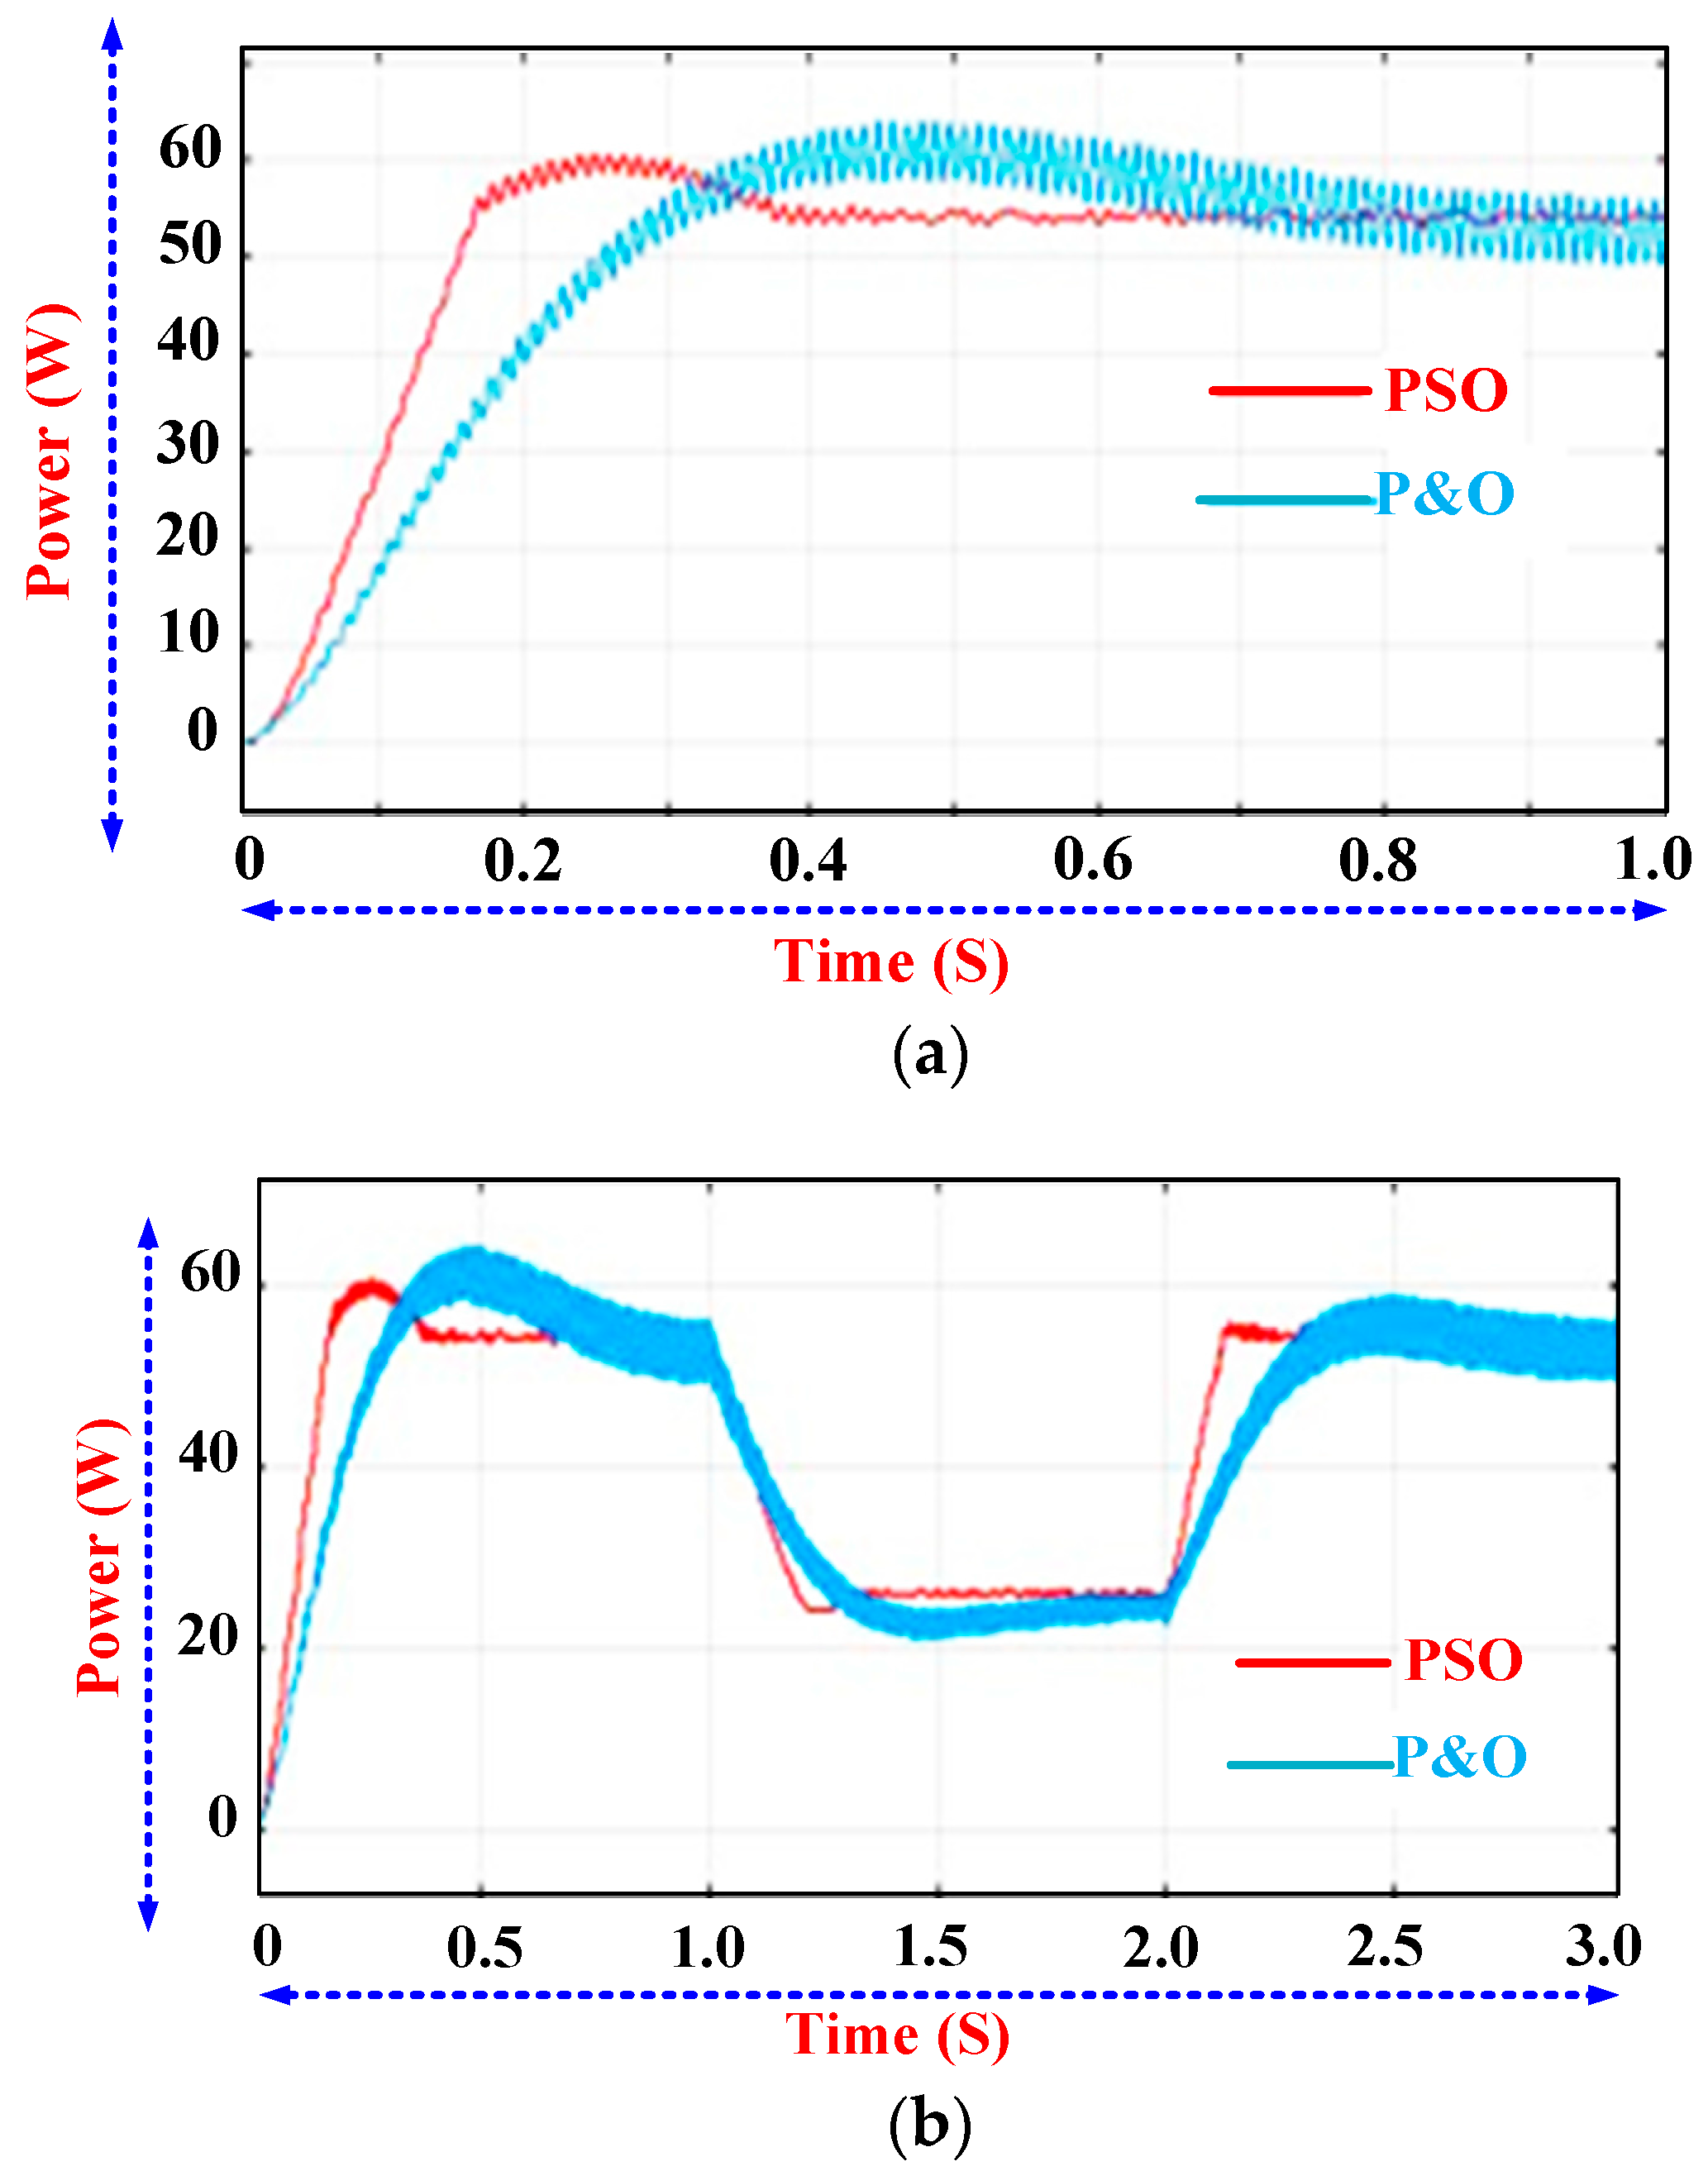
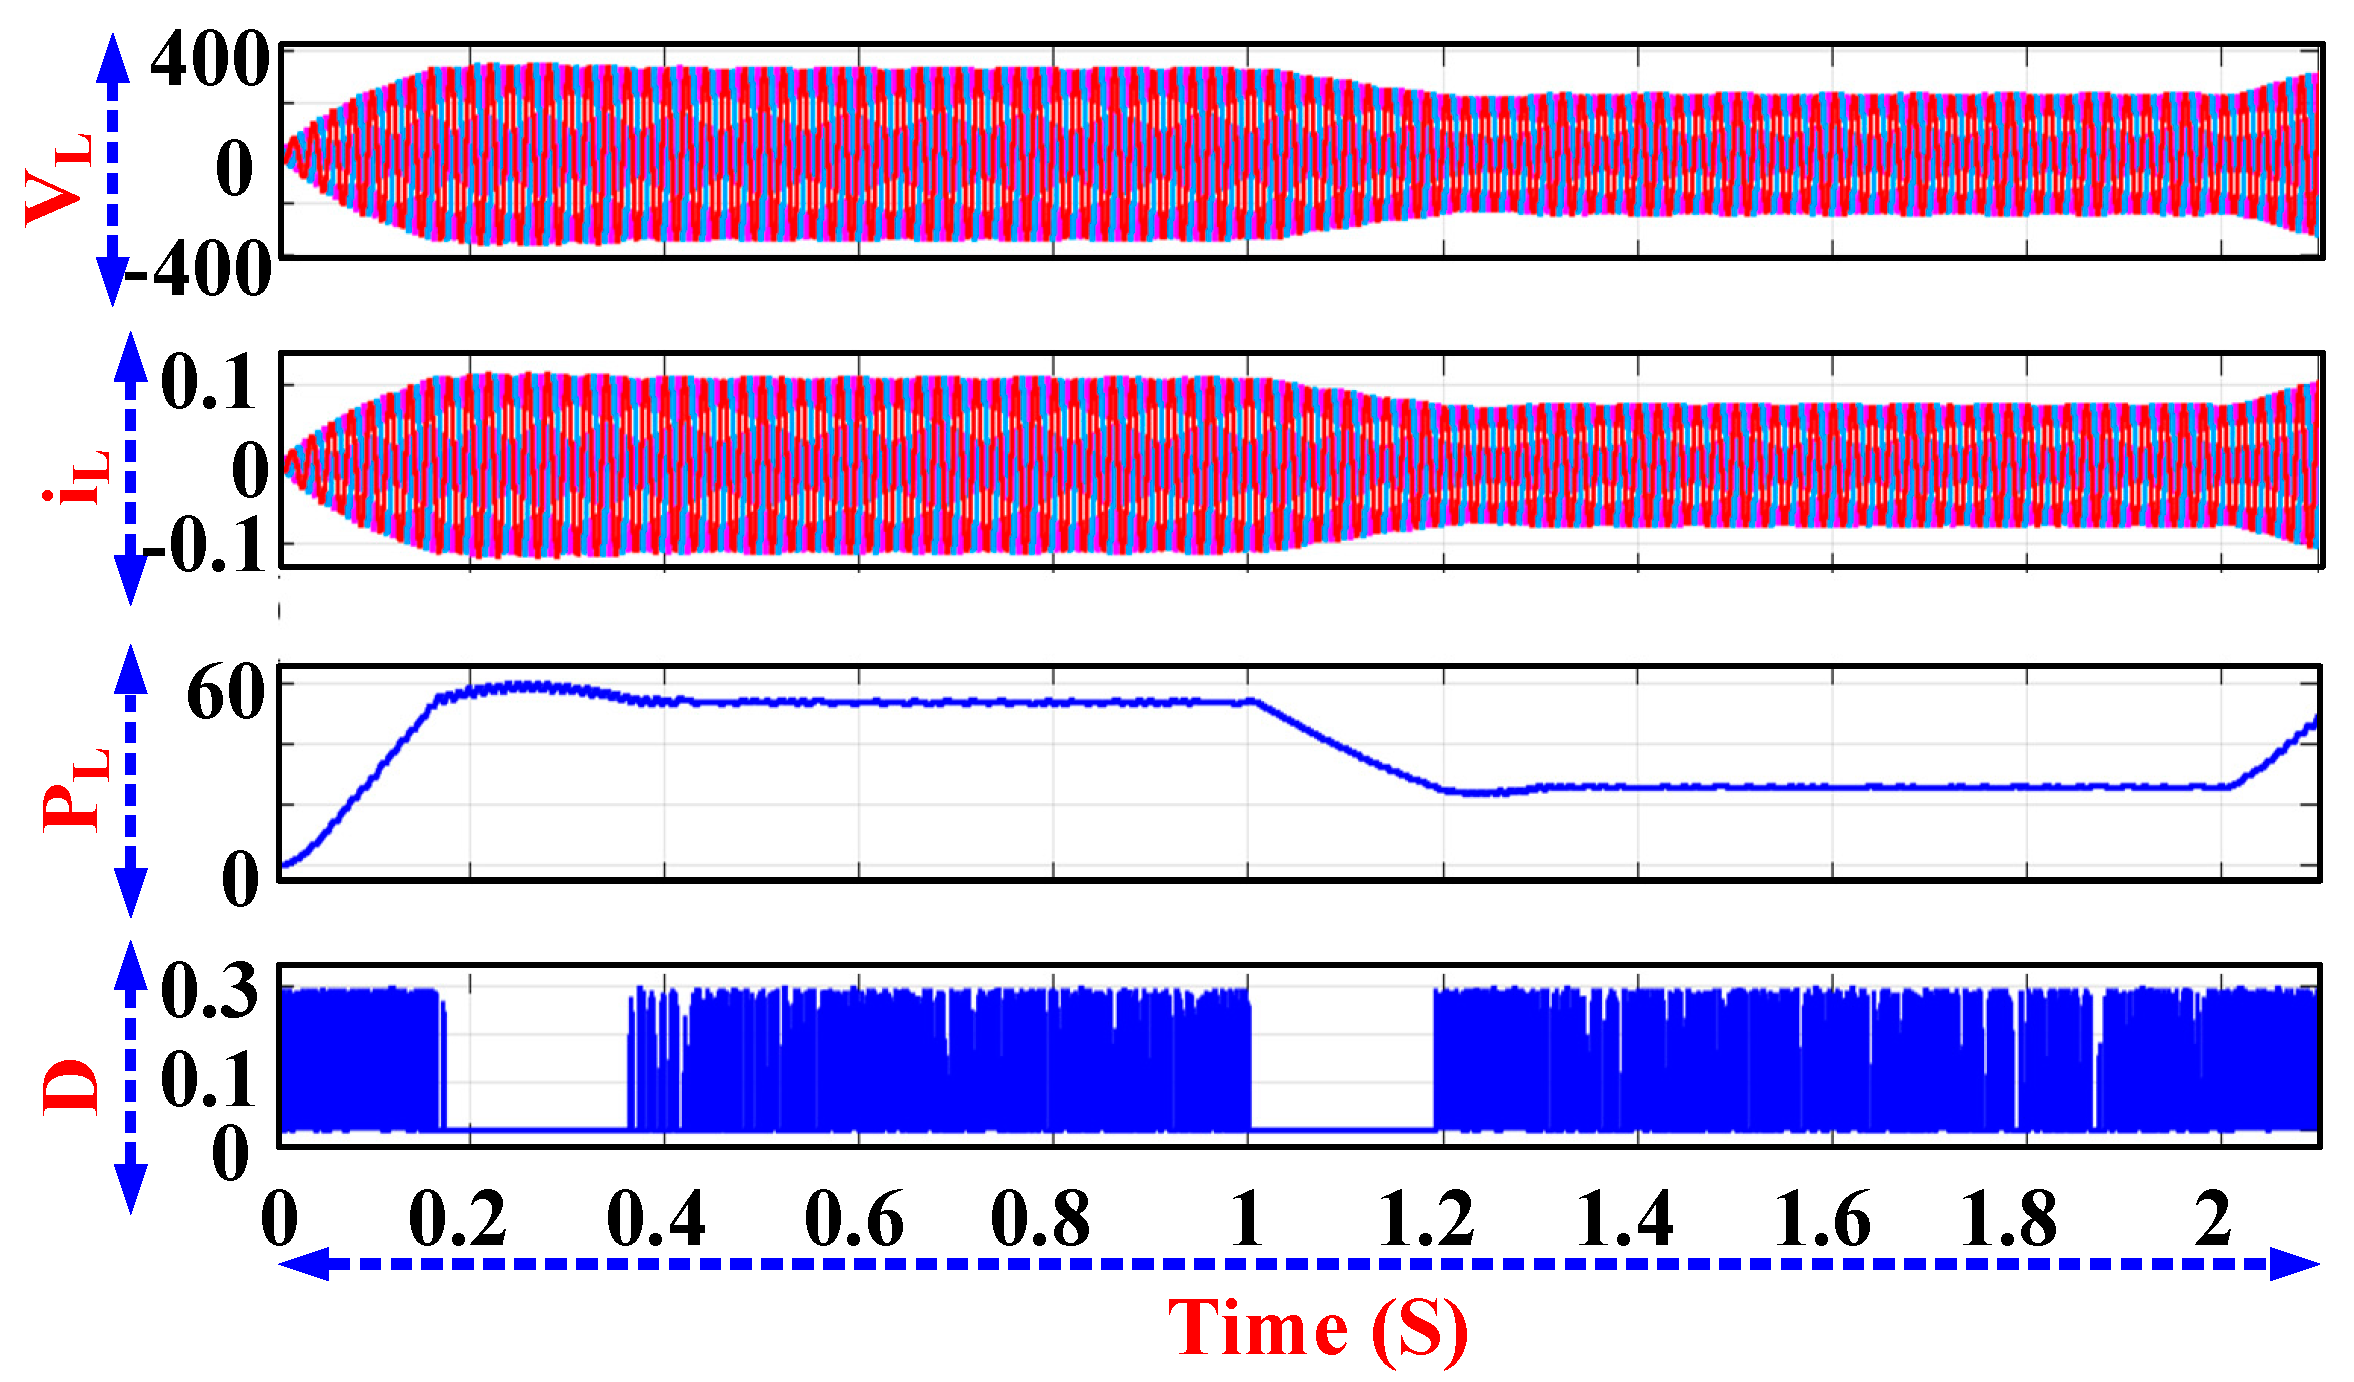
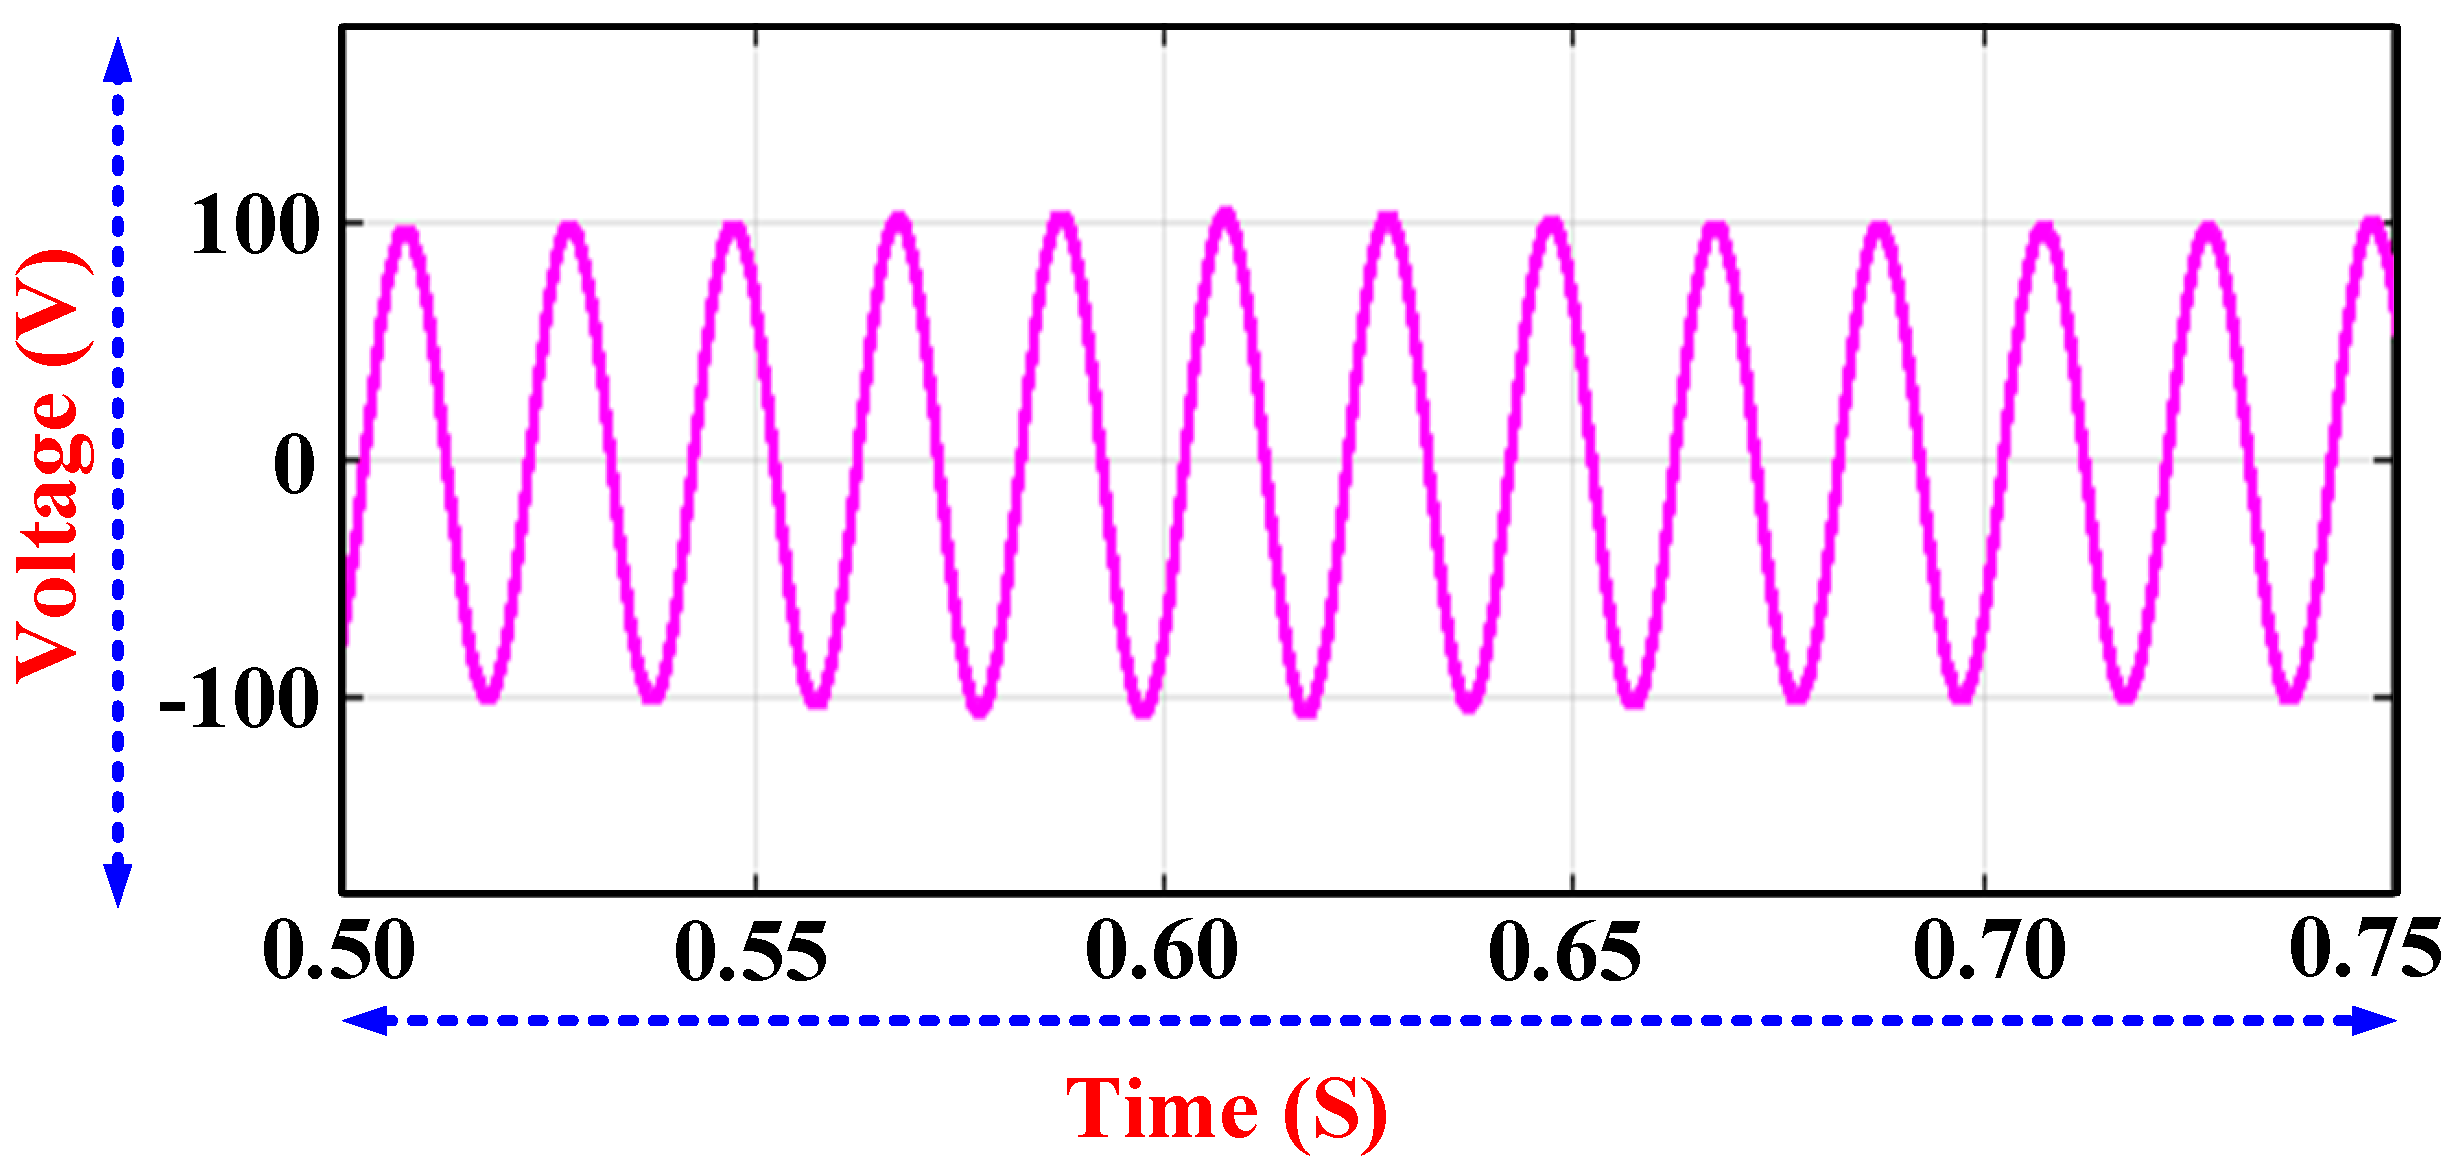
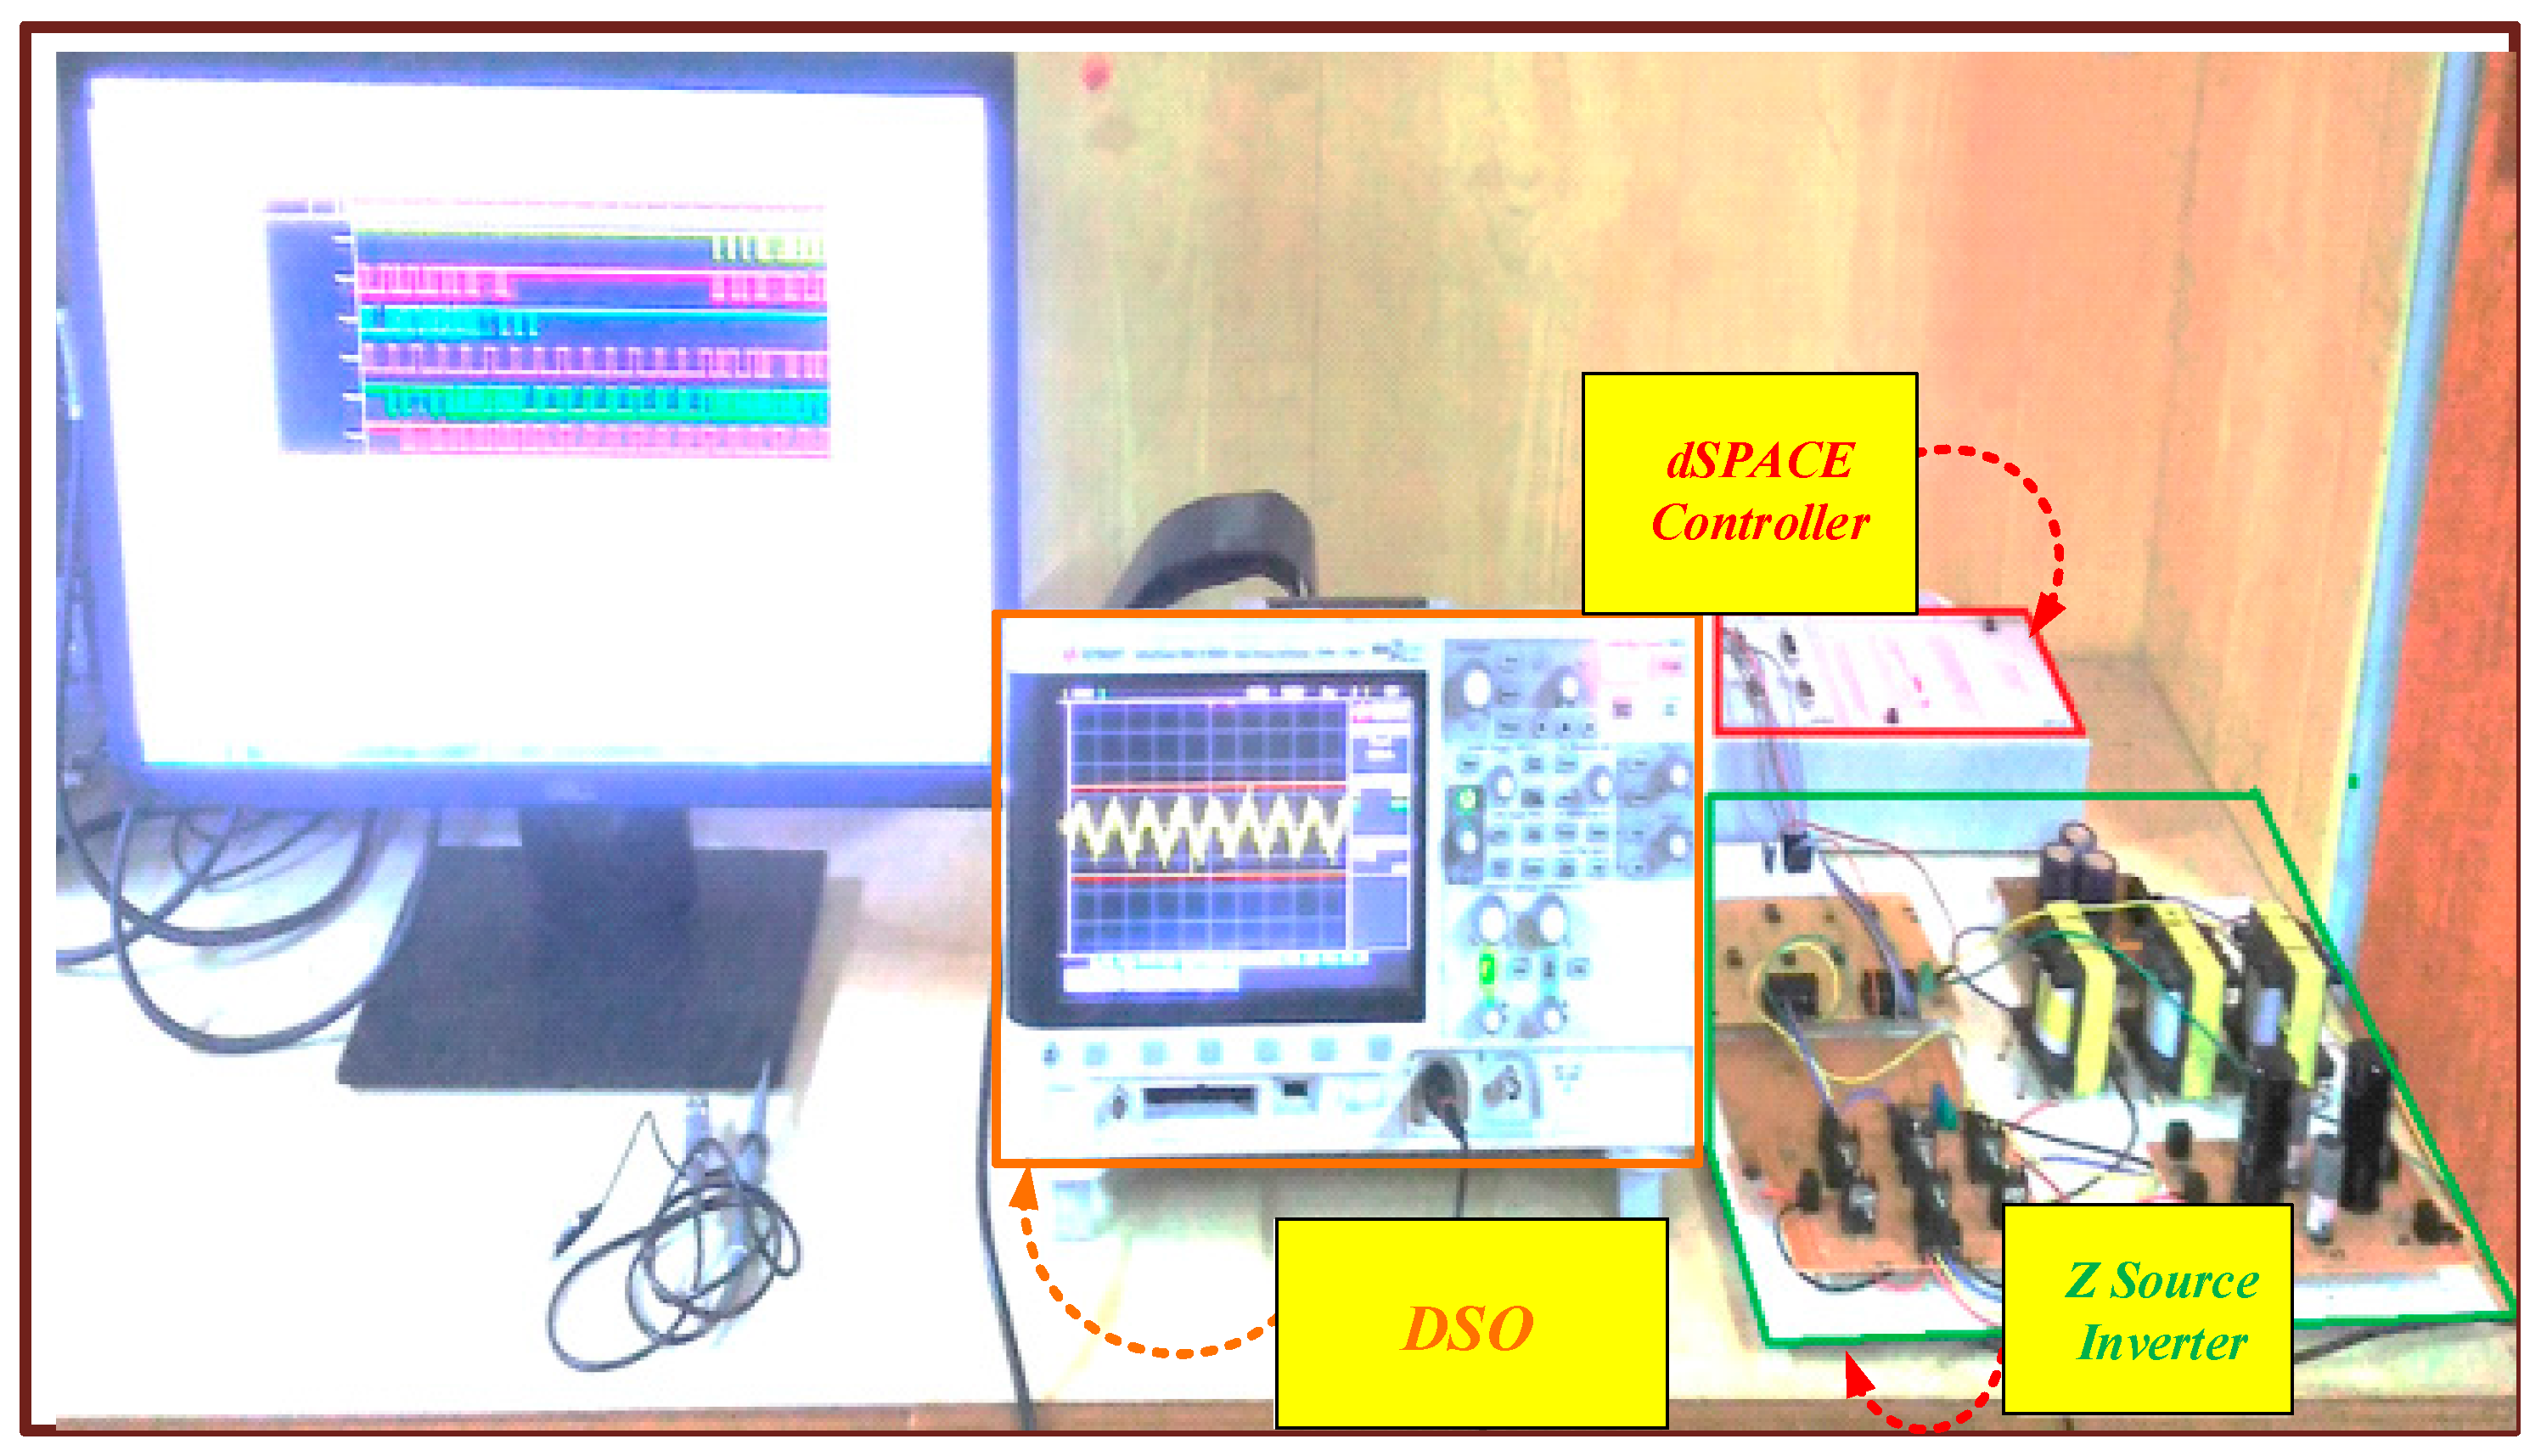
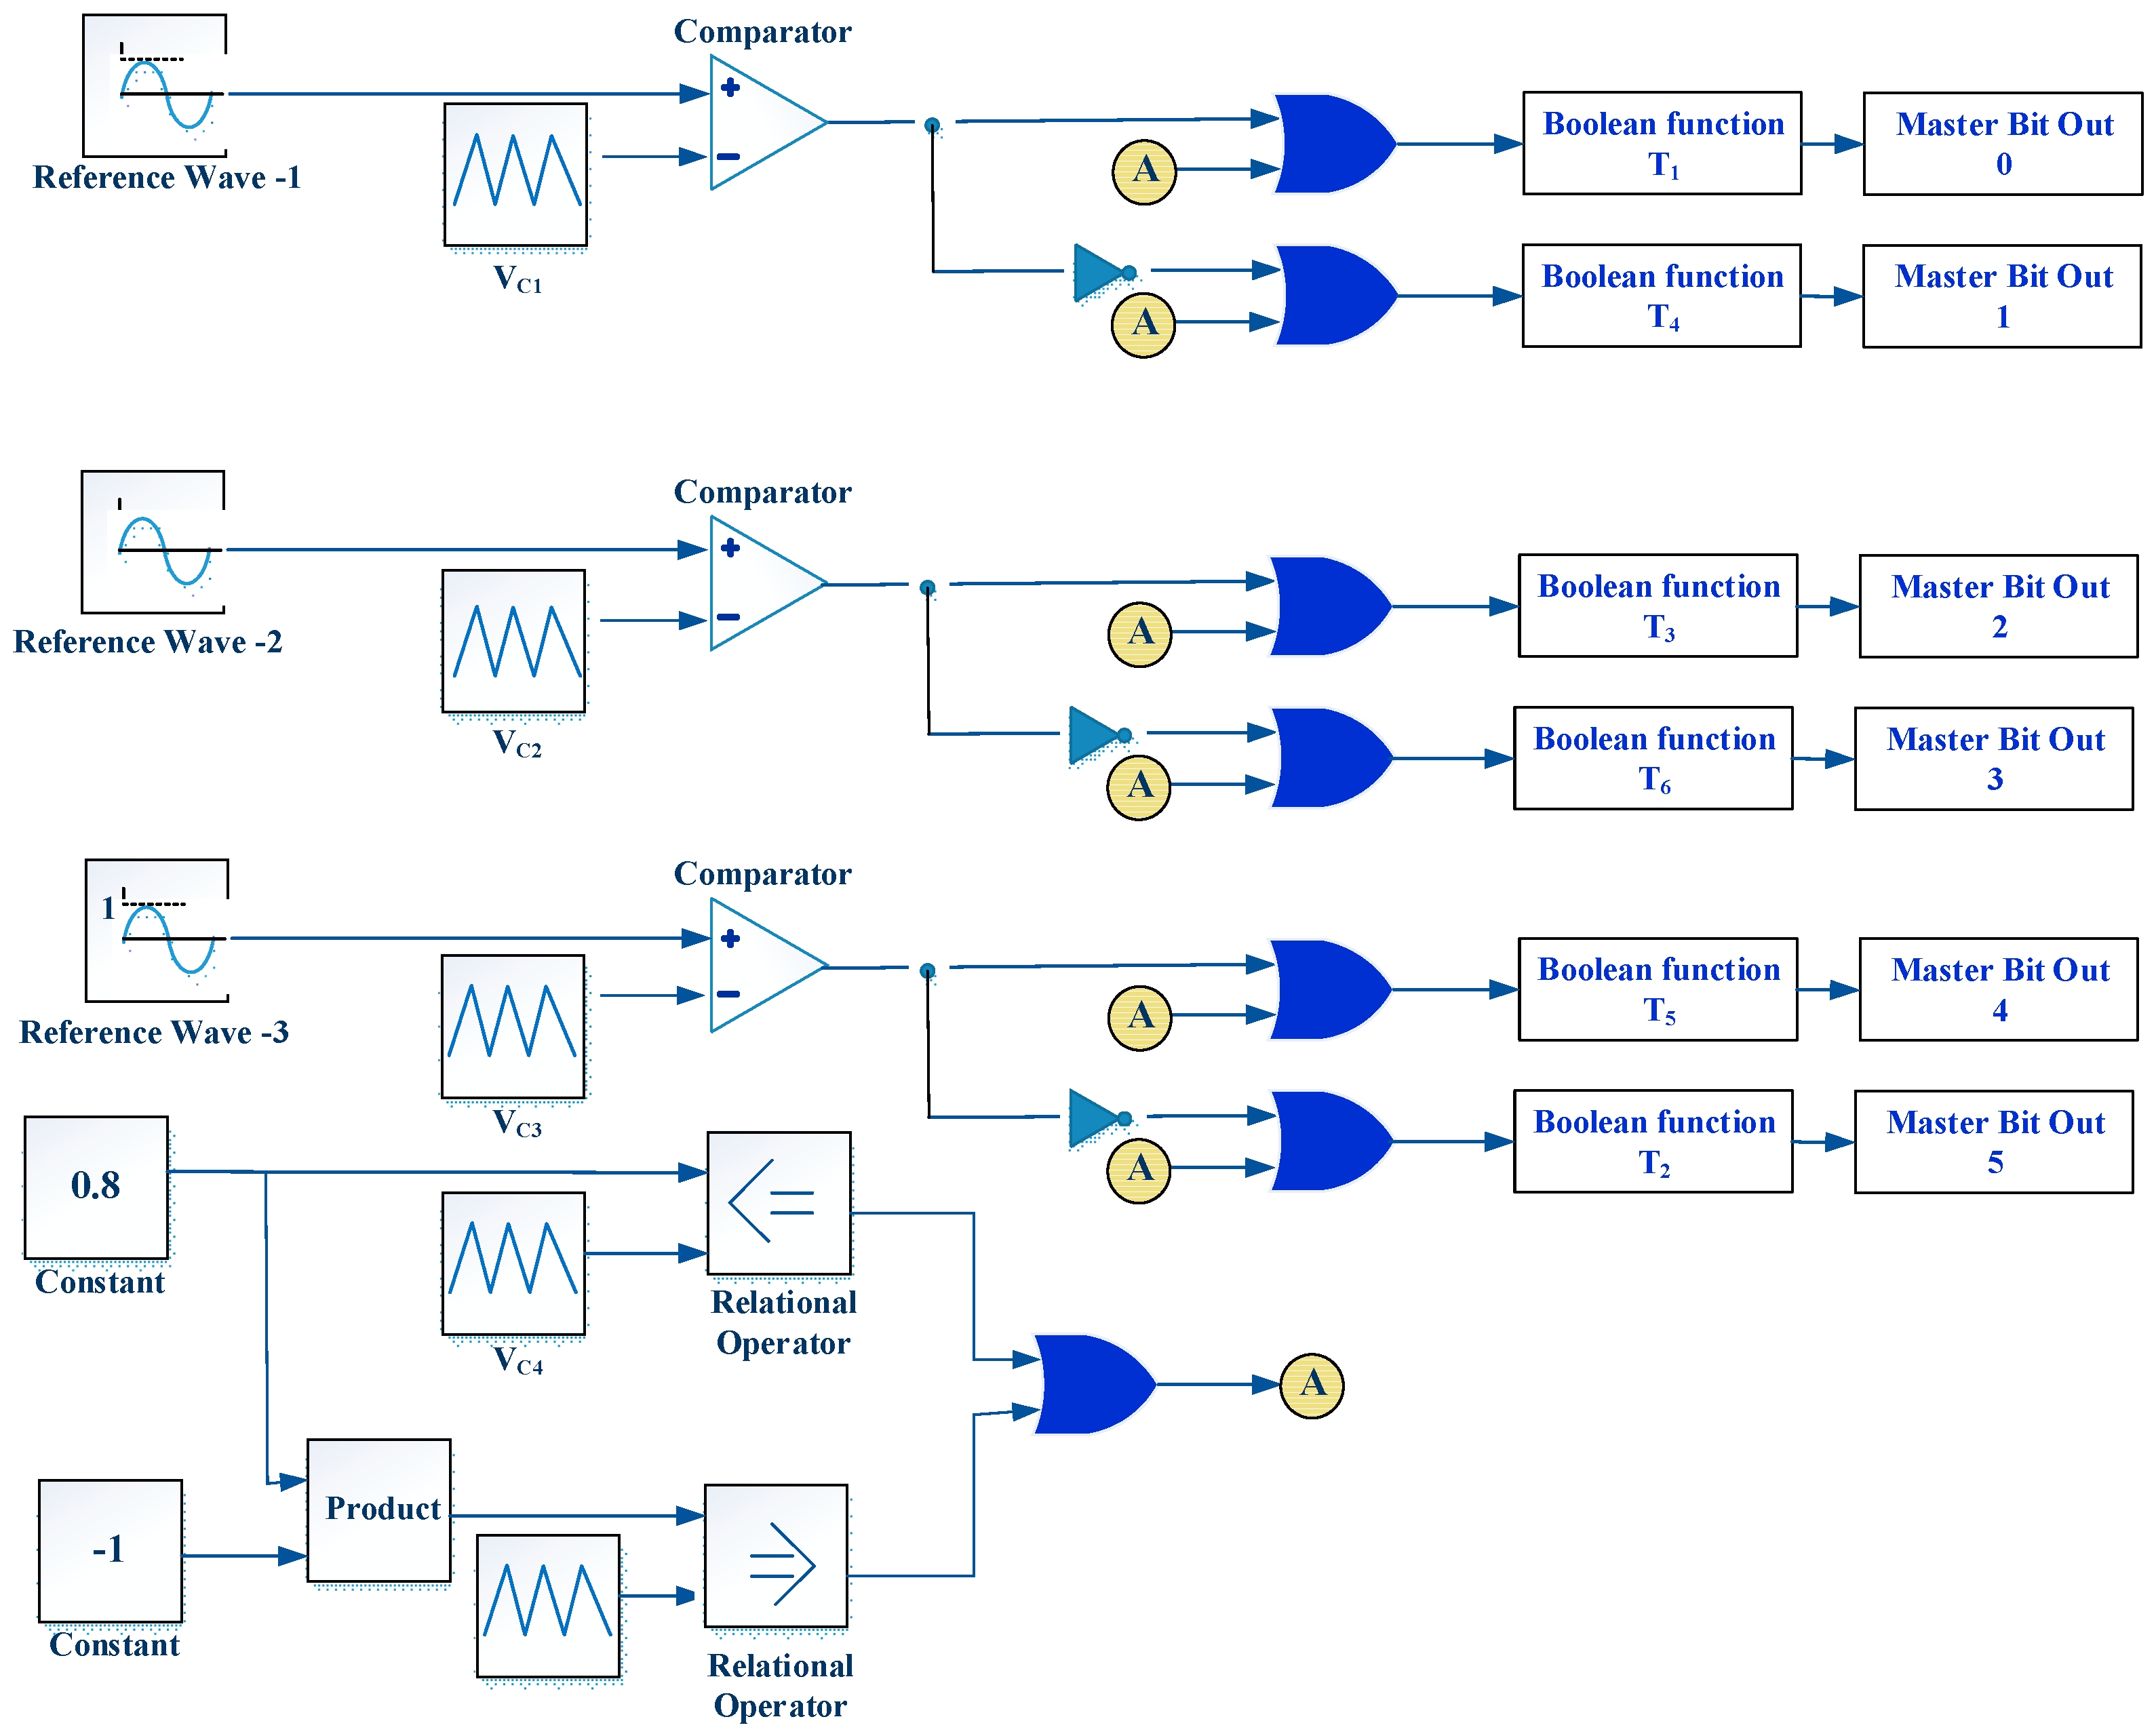
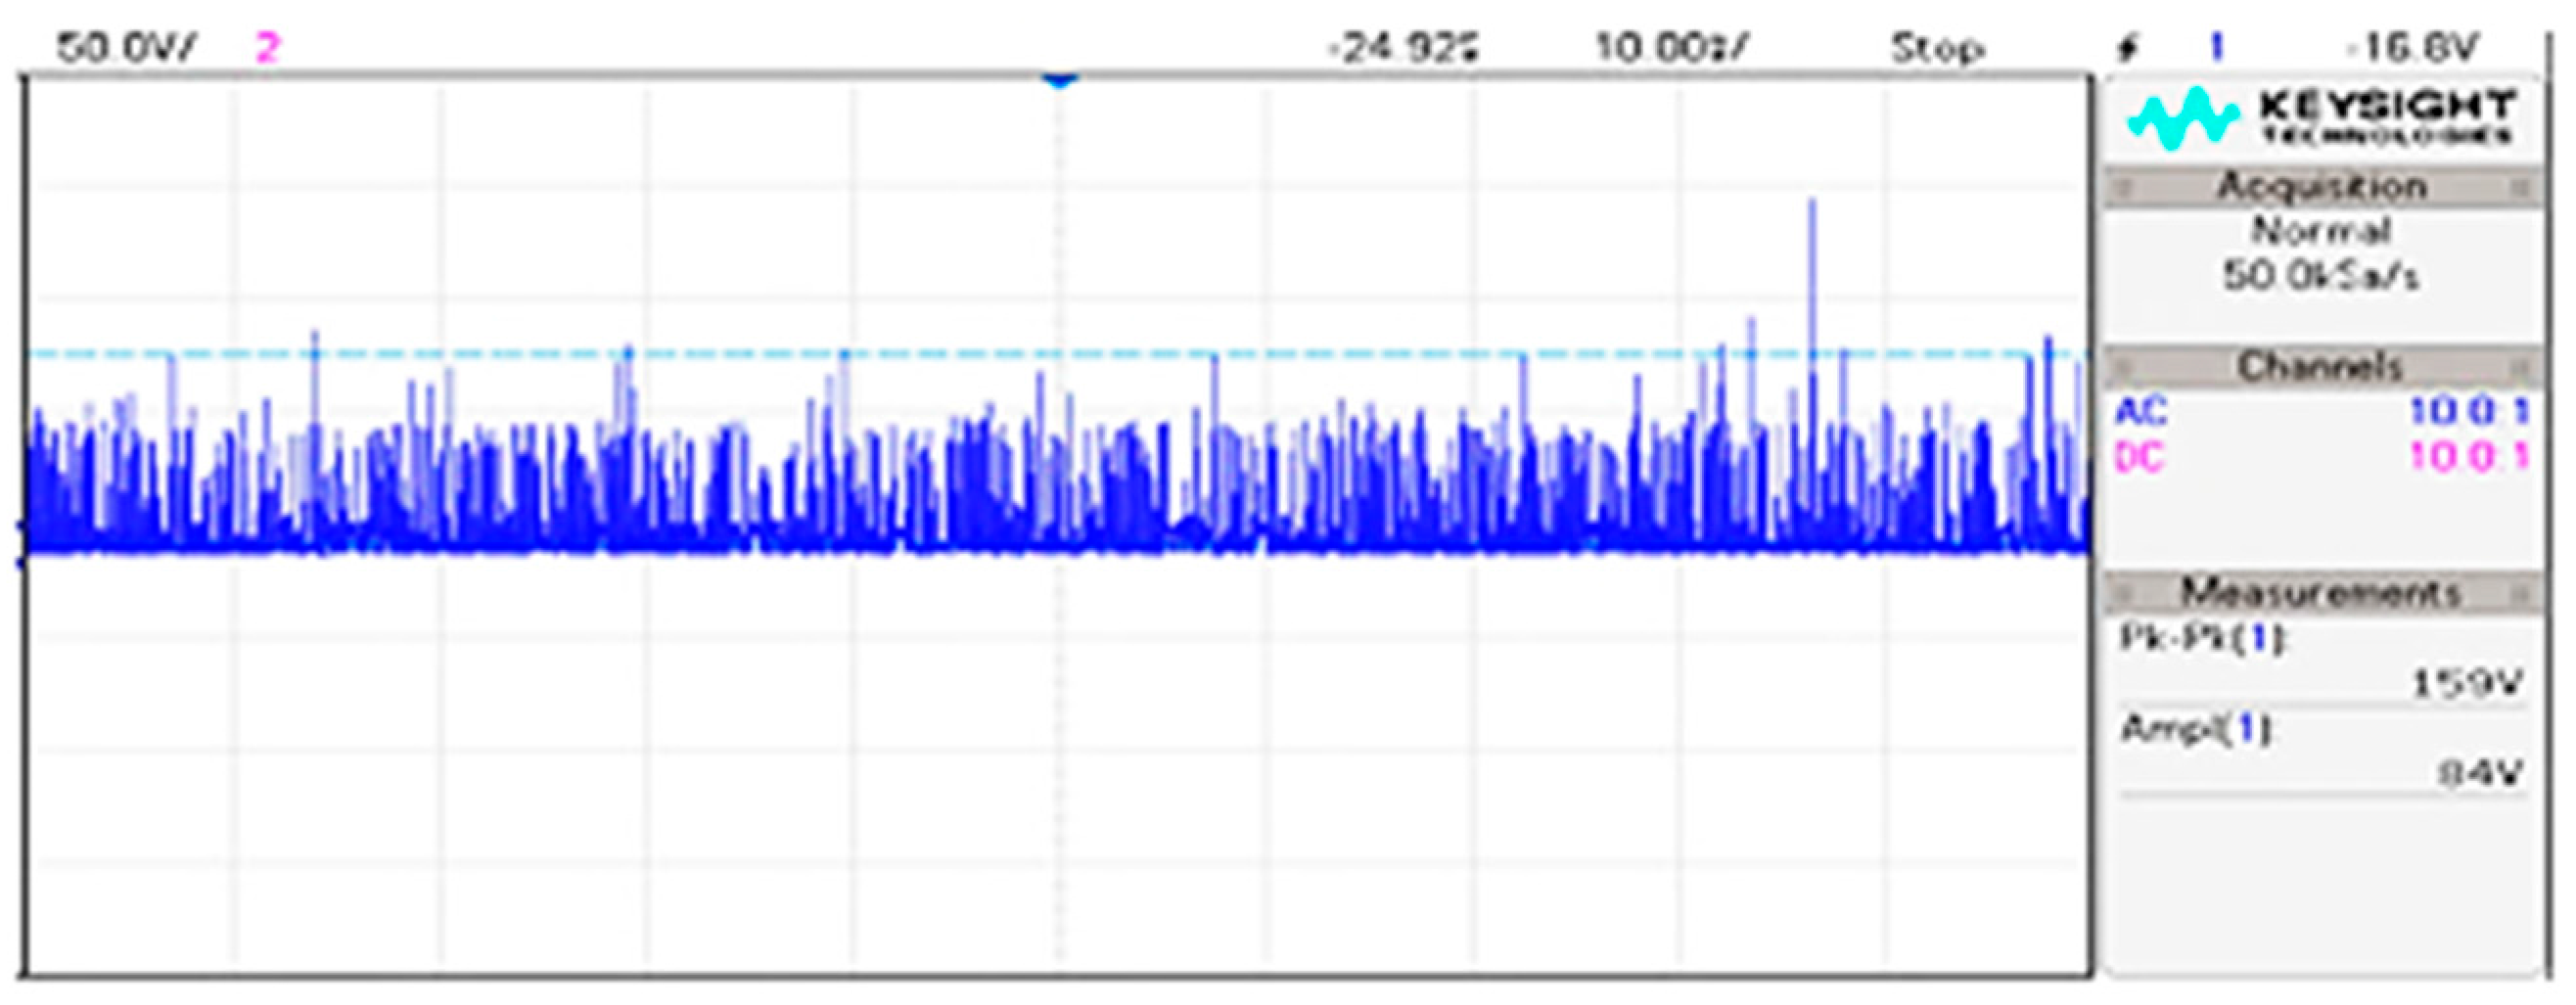
6. Results and Discussion
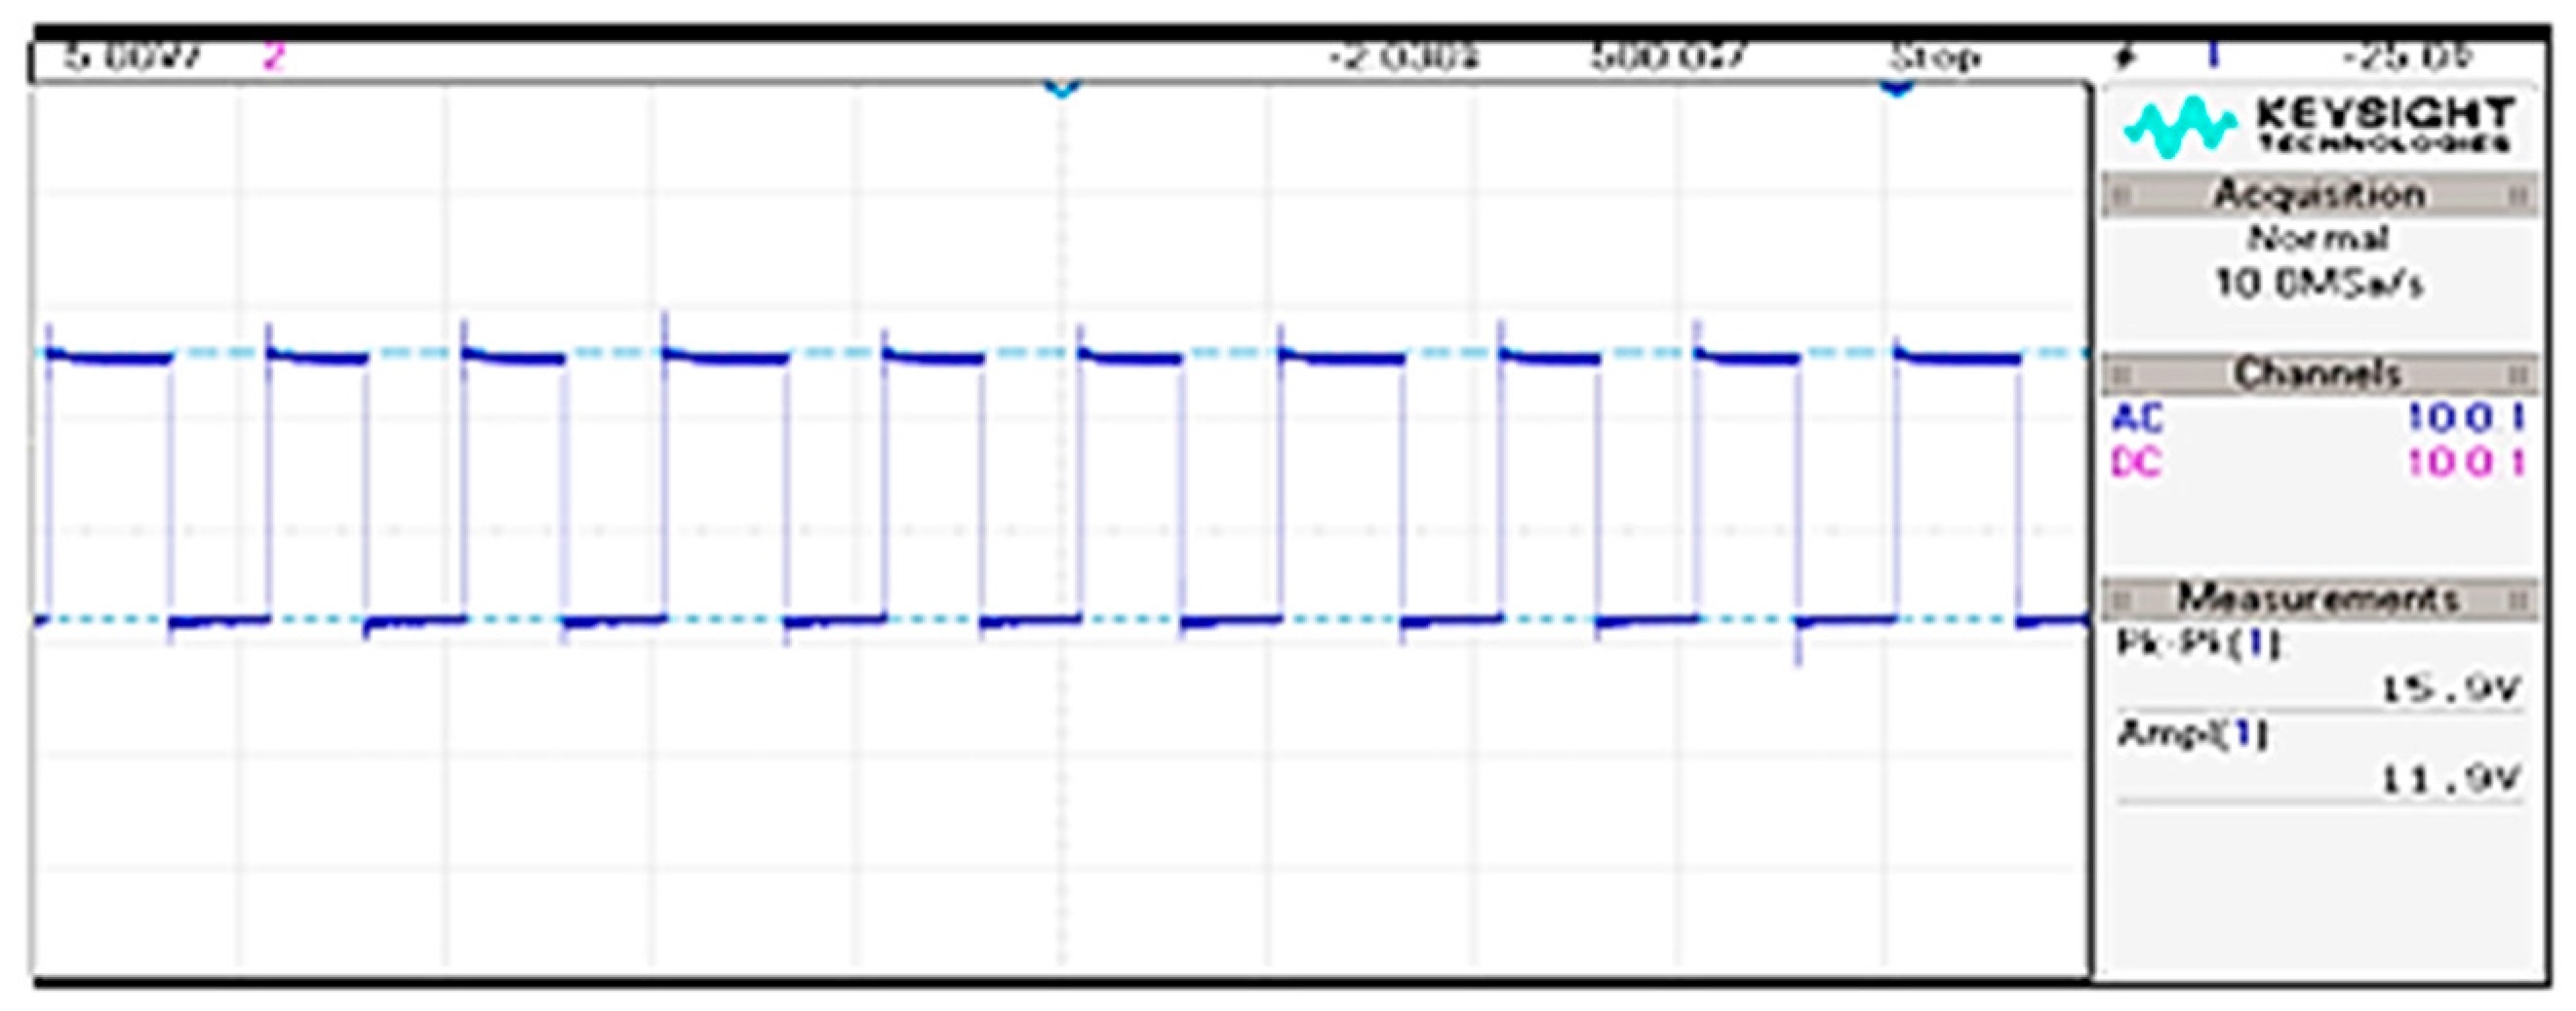
Under very challenging conditions, namely partial shading of the PV array, step changes in load, and step changes in irradiance, MATLAB simulations are carried out to evaluate the effectiveness of PSO method. Figure 14a,b represent the output power from PSO based MPPT. Figure 15a,b shows the comparison of PSO with conventional P&O algorithm. From Figure 14 and Figure 15a the output power settled after 0.4 s in PSO algorithm, but in P&O 0.75 s. The outputs of PSO and conventional P&O methods are compared to see the effectiveness of presented PSO based MPPT. From Figure 15, PSO based MPPT has less tracking time and steady state oscillations.
From Figure 14 and Figure 15, PSO based MPPT produces lesser oscillations and tracking time when compared to P&O algorithm. The tracking time of PSO algorithm is 0.2 s, but for the P&O algorithm, is 0.35 s. PSO algorithm decides the shoot through duty cycle for the Z-Source inverter, according to the PV voltage. Figure 16 shows the output voltage VL, current iL, power PL and shoot through duty cycle D of the Z-Source inverter. Figure 17 represents the phase to phase voltage of the Z-Source inverter.

Hardware Setup

Figure 18 shows the hardware setup of PSO based MPPT with Z-Source inverter. Here, dspace 1104 controller is used to obtain optimum duty cycle based upon the PSO algorithm and generate SPWM pulses, which are fed to MOSFET through a driver circuit. Voltage sensors and current sensors are used to sense the voltage and current coming from PV system. Based upon these values best duty cycle is calculated and SPWM pulses are generated. The MOSFET IRF840B is used in Z-Source inverter. The value of capacitors and inductors in the Z-Source network is 1200 μf, 220 V, and 50 μH, 5–6 A.
The dspace controller has two modes of operation, such as master PPC and slave mode for PWM generation. In slave mode, has only four channels and is used for fixed duty cycle. Implement the required algorithm in master PPC shown in Figure 19. The outputs are taken from CP17 connector from the pins 2, 3, 5, 21, 23, and 24 with respect to pin 1 (GND). The PWM generated from dspace controller is 5 V, this 5 V is not enough to drive the power Electronic devices. So, it is boosted through driver IC MIC4422. The PWM output from the driver is represented in Figure 20.
Figure 21 represents the voltage across cross coupled capacitor is 50 V, which is twice of the input supply. Output voltage across the load is shown in Figure 22 and Figure 23. The output peak to peak voltage is 98 V approximately equal to the simulation output shown in Figure 17.

7. Conclusions

This paper involves a dspace implementation of PSO based MPPT for obtaining optimum duty cycle for the Z-Source inverter. From the obtained duty cycle, the modulation index is estimated and given to the PWM generation circuit. PWM output from the dspace controller is 5 V, which is not enough to drive the MOSFET switches, so this 5 V is increased to 12 V using a driver circuit. The PSO algorithm locates the real MPP under a change in environmental conditions, provides better tracking speed, and fewer oscillations, to improve the stability of the system. So, the PSO algorithm overcomes the shortage of conventional MPPT algorithm. Practical experiments are conducted for 60 W PV panel with different irradiance condition. This tracking algorithm is further consistent method to locating the global MPP than a conventional MPPT algorithm, predominantly extreme change in environmental conditions and shaded PV modules.

Author Contributions

All authors contributed equally for the final decimation of the proposed research work as full article.

Conflicts of Interest

The authors declare that there is no conflict of interests regarding the publication of this paper.

References

  1. Esram, T.; Chapman, P.L. Comparison of photovoltaic array maximum power point tracking techniques. IEEE Trans. Energy Convers. 2007, 22, 439–449. [Google Scholar] [CrossRef]
  2. Saravanan, S.; Ramesh Babu, N.; Sanjeevikumar, P. Comparison and Analysis of DC/DC Converters with MPPT Techniques Based PV System. In Advances in Power Systems and Energy Management; Springer: Singapore, 2017; pp. 275–284. [Google Scholar]
  3. Jain, S.; Ramulu, C.; Padmanaban, S.; Ojo, J.O.; Ertas, A.H. Dual mppt algorithm for dual pv source fed open-end winding induction motor drive for pumping application. Sci. Technol. Int. J. 2016, 19, 1771–1780. [Google Scholar] [CrossRef]
  4. Anuradha, T.; Deiva Sundari, P.; Sanjeevikumar, P.; Pierluigi, S.; Zbigniew, L. Comparative Analysis of Common MPPT Techniques for Solar PV System with Soft Switched, Interleaved Isolated Converter. In Proceedings of the IEEE 1st Industrial and Commercial Power System Europe, 17th International Conference on Environment and Electrical Engg, IEEE-I&CPS/IEEE-EEEIC’17, Milan, Italy, 6–9 June 2017. [Google Scholar]
  5. Sanjeevikumar, P.; Grandi, G.; Patrick, W.; Frede, B.; Loncarski, J. A Simple MPPT Algorithm for Novel PV Power Generation system by High Output Voltage DC-DC Boost Converter. In Proceedings of the 24th IEEE International Symposium on Industrial Electronics, IEEE-ISIE’15, Rio de Janeiro, Brazil, 3–5 June 2015; pp. 214–220. [Google Scholar]
  6. Mellit, A.; Kalogirou, S.A. Artificial intelligence techniques for photovoltaic applications: A review. Prog. Energy Combust. Sci. 2008, 34, 574–632. [Google Scholar] [CrossRef]
  7. Khare, A.; Rangnekar, S. A review of particle swarm optimization and its applications in solar photovoltaic system. Appl. Soft Comput. 2013, 13, 2997–3006. [Google Scholar] [CrossRef]
  8. Geetha, M.; Natarajan, S.; Sanjeevikumar, P. Particle Swarm Optimization-Based Closed-Loop Optimal State Feedback Control for CSTR. In Advances in Power Systems and Energy Management; Springer: Singapore, 2017; pp. 469–479. [Google Scholar]
  9. Un-Noor, F.; Padmanaban, S.; Mihet-Popa, L.; Molla, M.N.; Hossain, E. A Comprehensive Study of Key Electric Vehicle (EV) Components, Technologies, Challenges, Impacts, and Future Direction of Development. Energies 2017, 10, 1217. [Google Scholar] [CrossRef]
  10. Hossain, E.; Perez, R.; Padmanaban, S.; Mihet-Popa, L.; Blaabjerg, F.; Ramachandaramurthy, V.K. Sliding Mode Controller and Lyapunov Redesign Controller to Improve Microgrid Stability: A Comparative Analysis with CPL Power Variation. Energies 2017, 10, 1959. [Google Scholar] [CrossRef]
  11. Suryavanshi, R.; Joshi, D.R.; Jangamshetti, S.H. PSO and P&O based MPPT technique for SPV panel under varying atmospheric conditions. In Proceedings of the 2012 International Conference on Power, Signals, Controls and Computation, Kerala, India, 3–6 January 2012. [Google Scholar]
  12. Abdelsalam, A.K.; Massoud, A.M.; Ahmed, S.; Enjeti, P.N. High-performance adaptive perturb and observe mppt technique for photovoltaic-based microgrids. IEEE Trans. Power Electron. 2011, 26, 1010–1021. [Google Scholar] [CrossRef]
  13. Femia, N.; Petrone, G.; Spagnuolo, G.; Vitelli, M. Optimization of perturb and observe maximum power point tracking method. IEEE Trans. Power Electron. 2005, 20, 963–973. [Google Scholar] [CrossRef]
  14. Sachin, J.; Ramulu, C.; Ramsha, K.; Sanjeevikumar, P. Effective Dual Solar PV Fed Three-Phase Open-End Winding Induction Motor Drive for Water Pumping System Application. J. Mod. Power Syst. Clean Energy 2017, 1771–1780. Available online: https://www.researchgate.net/publication/314721388_Effective_Dual_Solar_PV_Fed_Three-Phase_Open-End_Winding_Induction_Motor_Drive_for_Water_Pumping_System_Application (accessed on 22 January 2018).
  15. Padmanaban, S.; Blaabjerg, F.; Wheeler, P.; Ojo, J.O.; Ertas, A.H. High-voltage dc-dc converter topology for pv energy utilization—Investigation and implementation. Electron. Power Compon. Syst. 2016, 45, 221–232. [Google Scholar] [CrossRef]
  16. Ji, Y.; Jung, D.; Kim, J.; Kim, J.; Lee, T.; Won, C. A real maximum power point tracking method for mismatching compensation in PV array under partially shaded conditions. IEEE Trans. Power Electron. 2011, 26, 1001–1009. [Google Scholar] [CrossRef]
  17. Patel, H.; Agarwal, V. Maximum power point tracking scheme for PV systems operating under partially shaded conditions. IEEE Trans. Ind. Electron. 2008, 55, 1689–1698. [Google Scholar] [CrossRef]
  18. Masoum, M.A.; Dehbonei, H.; Fuchs, F.H. Theoretical and experimental analysis of photovoltaic systems with voltage and current-based maximum power point tracking. IEEE Power Eng. Rev. 2002, 22, 62. [Google Scholar] [CrossRef]
  19. Subudhi, B.; Pradhan, R. A Comparative Study on Maximum Power Point Tracking Techniques for Photovoltaic Power Systems. IEEE Trans. Sustain. Energy 2013, 4, 89–98. [Google Scholar] [CrossRef]
  20. Ishaque, K.; Salam, Z.; Amjad, M.; Mekhilef, S. An improved particle swarm optimization (PSO)—Based MPPT for PV with reduced steady-state oscillation. IEEE Trans. Power Electron. 2012, 27, 3627–3638. [Google Scholar] [CrossRef]
  21. Renaudineau, H.; Donatantonio, F. A PSO-Based Global MPPT Technique for Distributed PV Power Generation. IEEE Trans. Ind. Electron. 2015, 62, 1047–1058. [Google Scholar] [CrossRef]
  22. Chao, K. A High Performance PSO-Based Global MPP Tracker for a PV Power Generation System. Energies 2015, 8, 6841–6858. [Google Scholar] [CrossRef]
  23. Mughal, M.A.; Ma, Q.; Xiao, C. Photovoltaic cell Parameter Estimation using Hybrid Particle Swarm Optimization and Simulated Annealing. Energies 2017, 10, 1213. [Google Scholar] [CrossRef]
  24. Cheng, P.; Peng, B.; Liu, Y.; Cheng, Y.; Huang, J. Optimization of a Fuzzy-Logic-Control-Based MPPT Algorithm Using the Particle Swarm Optimization Technique. Energies 2015, 8, 5338–5360. [Google Scholar] [CrossRef]
  25. Sanjeevikumar, P.; Thiagarajan, Y.; Sivakumaran, T.S. Design of fuzzy logic controller for a DC-AC converter for a grid connected system using PV cell. In Proceedings of the IEEE International Conference on Computing, Communication and Networking, IEEE-ICCCNET’08, Tamilnadu, India, 18–20 December 2008; pp. 1–6. [Google Scholar]
  26. Swaminathan, G.; Ramesh, V.; Umashankar, S.; Sanjeevikumar, P. Fuzzy-Based Microgrid Energy Management System Using Interleaved Boost Converter and Three-Level NPC Inverter with Improved Grid Voltage Quality. In Advances in Power Systems and Energy Management; Springer: Singapore, 2017; pp. 325–337. [Google Scholar]
  27. Tiwari, R.; Babu, N.R.; Sanjeevikumar, P. Fuzzy Logic-Based Pitch Angle Controller for PMSG-Based Wind Energy Conversion System. In Advances in Power Systems and Energy Management; Springer: Singapore, 2017; pp. 277–286. [Google Scholar]
  28. Tiwari, R.; Babu, N.R.; Sanjeevikumar, P. Comparison Between PI Controller and Fuzzy Logic-Based Control Strategies for Harmonic Reduction in Grid-Integrated Wind Energy Conversion System. In Advances in Power Systems and Energy Management; Springer: Singapore, 2017; pp. 297–306. [Google Scholar]
  29. Ishaque, K.; Salam, Z.; Taheri, H. Accurate matlab simulink pv system simulator based on a two-diode model. J. Power Electron. 2011, 11, 179–187. [Google Scholar] [CrossRef]
  30. Koad, R.B.A.; Zobaa, A.F.; El-Shahat, A. A novel MPPT Algorithm based on Particle Swarm. IEEE Trans. Sust. Energy 2017, 8, 468–476. [Google Scholar] [CrossRef]
  31. Kuo, Y.C.; Liangand, T.J.; Cben, J.F. Novel Maximum Power Point Tracking Controller for Photovoltaic Energy Conversion system. IEEE Trans. Ind. Electron. 2001, 48, 594–601. [Google Scholar]
  32. Chen, Z.; Xiong, R.; Wang, K.; Jiao, B. Optimal energy management strategy of a plug-in hybrid electric vehicle based on a particle swarm optimization algorithm. Energies 2015, 8, 3661–3678. [Google Scholar] [CrossRef]
  33. Xu, P.; Zhang, X.; Cao, C.Z.R.; Chang, L. Study of Z-Source Inverter for Grid-Connected PV Systems. In Proceedings of the IEEE Power Electronics Specialist Conference, Jeju, Korea, 18–22 June 2006. [Google Scholar]
  34. Tang, Y.; Xie, S.J.; Zhang, C.H.; Xu, Z.G. Improved Z-source inverter with reduced capacitor voltage stress and soft-start capability. IEEE Trans. Power Electron. 2009, 24, 409–415. [Google Scholar] [CrossRef]
  35. Siwakoti, Y.P.; Peng, F.S.; Blabbjerg, F.; Loh, P.C.; Town, G.E. Impedance Source Networks for Electric Power Conversion Part I: A Topological Review. IEEE Trans. Power Electron. 2015, 30, 669–716. [Google Scholar] [CrossRef]
  36. Nguyen, M.; Choi, Y. Maximum Boost Control Method for Single-Phase Quasi Switched Boost and Quasi-Z-Source Inverters. Energies 2017, 10, 553. [Google Scholar] [CrossRef]
  37. Sunder, P.G.; Shanthi, B.; Nachiappan, A.; Natarajan, S.P.; Sanjeevikumar, P. Single Phase Asymmetric Switched-Inductor Quasi-Z-Source CHB Multilevel Inverter. In Advances in Power Systems and Energy Management; Springer: Singapore, 2017; pp. 285–294. [Google Scholar]
  38. Pandav, K.M.; Mahajan, S.B.; Sanjeevikumar, P.; Badave, S.M.; Pachagade, R. 2.4 kW Three-Phase Inverter for Aircraft Application-Hardware Implementation. In Advances in Power Systems and Energy Management; Springer: Singapore, 2017; pp. 325–335. [Google Scholar]
  39. Xiao, X.; Huang, X.; Kang, Q. A hill-climbing-method-based maximum-power-point-tracking strategy for direct-drive wave energy converters. IEEE Trans. Ind. Electron. 2016, 63, 257–267. [Google Scholar] [CrossRef]
  40. Sera, D.; Mathe, L.; Kerekes, T.; Spataru, S.V.; Teodorescu, R. On the Perturb-and-Observe and Incremental Conductance MPPT Methods for PV Systems. IEEE J. Photovolt. 2013, 3, 1070–1078. [Google Scholar] [CrossRef]
Figure 1. The equivalent circuit of photovoltaic (PV) cell.
Applsci 08 00145 g001
Figure 2. PV characteristics of MSX 60W PV panel for (a) varying irradiance (b) varying temperature.
Applsci 08 00145 g002
Figure 3. I-V characteristics of MSX 60W PV panel for (a) varying irradiance (b) varying temperature.
Applsci 08 00145 g003
Figure 4. Block diagram of Perturb and Observe method.
Applsci 08 00145 g004
Figure 5. Flowchart of Perturb and Observe method.
Applsci 08 00145 g005
Figure 6. Flowchart of incremental conductance (INC) method.
Applsci 08 00145 g006
Figure 7. Movement of particles in the optimization process.
Applsci 08 00145 g007
Figure 8. Varying duty cycle of Particle Swarm Optimization (PSO) algorithm.
Applsci 08 00145 g008
Figure 9. Closed loop model of proposed PSO method.
Applsci 08 00145 g009
Figure 10. Flowchart of PSO algorithm.
Applsci 08 00145 g010
Figure 11. Circuit diagram of ZSI.
Applsci 08 00145 g011
Figure 12. Equivalent Circuit of the ZSI in (a) Non-Shoot through States; and, (b) Shoot-Through State.
Applsci 08 00145 g012
Figure 13. Equivalent Circuit of the ZSI in traditional zero states.
Applsci 08 00145 g013
Figure 14. Output power from PSO for (a) 1000W/m2; (b) irradiance is varied from 1000 W/m2 to 500 W/m2 at 1 s then increased to 1000 W/m2 at 2 s.
Applsci 08 00145 g014
Figure 15. Comparison of output power from PSO based MPPT and P&O based MPPT for (a) 1000 W/m2; (b) irradiance is varied from 1000 W/m2 to 500 W/m2.
Applsci 08 00145 g015
Figure 16. Output of Z-Source inverter with PSO based Maximum Power Point Tracking (MPPT).
Applsci 08 00145 g016
Figure 17. Phase to phase voltage of Z-Source inverter across resistive load.
Applsci 08 00145 g017
Figure 18. Hardware setups of PSO based MPPT with ZSI.
Applsci 08 00145 g018
Figure 19. SPWM generation in dspace.
Applsci 08 00145 g019
Figure 20. SPWM generated after driver circuit.
Applsci 08 00145 g020
Figure 21. Voltage across cross-coupled capacitors of ZSI (50 V/Div).
Applsci 08 00145 g021
Figure 22. Phase to phase voltage across resistive load.
Applsci 08 00145 g022
Figure 23. Phase to phase voltage across resistive load (20 Volts/Div).
Applsci 08 00145 g023
Table 1. MSX-60W PV Module Specifications.
Parameter SpecificationValues
Peak power, Pmpp60 W
Peak Power voltage, Vmpp17.1 V
Peak Power Current, Impp3.5 A
Short-circuit current, Isc3.8 A
Open circuit voltage, Voc21.1 V
Temperature co-efficient of current, Ki0.003 (mA/°C)
Temperature co-efficient of voltage, KV−0.08 (mV/°C)
Solar irradiation at STC1000 W/m2
Temperature at STC25 °C
Electron charge, q1.6 × 10−19 C
Number of cells connected in series, Ns36
Number of cells connected in parallel, Np1
Ideality factor of the diode, n1.3
Boltzmann’s constant, k1.3805 × 10−23 J/K
Band gap energy, Ego1.12 eV
Series resistance, Rs0.0018 Ω
Shunt resistance, Rsh400 Ω

