Measurement of Static Stiffness after Motion on a Three-Axis CNC Milling Table


1
Department of Manufacturing Machinery, Faculty of Mechanical Engineering, The Technical University of Kosice, Letná 9, 04001 Košice, Slovakia
2
Department of Biomedical Engineering and Measurement, Faculty of Mechanical Engineering, The Technical University of Kosice, Letná 9, 04001 Košice, Slovakia
3
Prototype and Innovation Centre, Faculty of Mechanical Engineering, The Technical University of Kosice, Letná 9, 04001 Košice, Slovakia
*
Author to whom correspondence should be addressed.
Appl. Sci. 2018, 8(1), 15; https://doi.org/10.3390/app8010015
Submission received: 15 November 2017
/
Revised: 5 December 2017
/
Accepted: 11 December 2017
/
Published: 23 December 2017
Abstract
:This paper deals with a modified methodology for measuring the static stiffness of the machine tool. Inspiration to modify the commonly used expanded method of static stiffness measurement resulted from considerably different experimentally measured static stiffness values in the simulated process of load application under laboratory conditions compared to the standard method. An important takeaway from the measurements is that the measured static stiffness of the table depends greatly on the previous work performed thereon and on the method of the load application onto the table. This modified view of the static stiffness of the machine can have an impact on the increased emphasis on eliminating the phenomena related thereto. It is applicable in engineering practice, in particular in the field of machine tool design, where it will ensure higher machining precision under comparable conditions. In the experiments performed, deformations and displacements were measured with a laser interferometer.
1. Introduction
The overall working accuracy of the machine tool mechanics is determined in particular by the precision of positioning of its slides, static stiffness, dynamic stiffness, thermal stability and geometric accuracy of components. Typical sources of working inaccuracy are kinematic deviations, thermo-mechanical deviations, static and dynamic forces [1], the manner of motion control and the control software [2]. The issue of TCP (Tool Center Point) dynamics is addressed by [3]. In addition, working precision is also given by the appropriate choice of technological conditions and required work performance [4].
After a period in operation, the accuracy starts to change, the possible causes being that of wear and tear of the contact surfaces, which can be successfully diagnosed with different diagnostic methods [5]. Vibrodiagnostics also contributes to addressing the issue of application of technical diagnostics tools in verifying the technical condition, which affects the resulting accuracy [6].
A true position of the moving part of the machine with respect to its base even under static load application is influenced by three basic drive nonlinearities. These are friction, backlash and pliability [7].
Many papers [8,9,10,11,12] state the temperature factor as the major influence on the TCP position. The stiffness experiments show that in addition to temperature, the delimitation of clearance or the manifestation of the stiffness in the guides, the bearings and the ball screw also play their respective roles in the accuracy of the machine tool.
The temperature influence during machining is very difficult to simulate with a mathematical model. The machine is practically never thermally stabilized. Thermal expansions vary over a range of many hours and are largely dependent on the work program. This is the main unpredictable factor. Properly executed simulation identifies imperfection within the machine’s design. This way, erroneous TCP specification can be minimized by design adjustments [13].
The design arrangement of the mechanics of a node has a significant influence on the behavior of the motion system and it merits further scrutiny [14].
It is generally assumed that the working precision and performance of a machine tool depends to a large extent on the static stiffness of the machine in the workspace. Practical experience confirms this fact. Drawing on this basis, many papers are concerned with calculating stiffness by the method of finite elements [15,16].
The classic static stiffness measurement is performed on the stationary machine most often at the point where the tool is clamped against the workpiece clamping point. The loader is gradually applied to and then retracted from the working space in the direction of the main machine axes. The deformation at a given location in the direction of load is measured by the dial micrometer indicator. Based on measured values, stiffness is determined in the given location. At the same time, deformations are measured outside the load area. This determines a degree to which deformations change stiffness brought about by individual machine components. Such measurement is of great importance in prototype tests. Based on the measurement of the degree to which stiffness is changed, the shortcomings in the machine design are revealed. Some parts need to be reinforced to increase their respective stiffness. Thus, an acceptable machine stiffness is achieved. Typically, such measurements are rarely performed with the machine in operation.
The stiffness measurement depends on appropriate loaders and in many cases, the experimenter is struggling with inadequate access to the place of measurement. Even so, the load is usually applied to the middle of the work area. At prototype tests, the table is loaded against the spindle. The stiffness measurement is not standardized. Stiffness information is generally given only from a single load location. Only load directions vary. This, however, offers only limited information, because stiffness values are different at different positions of the spindle with respect to the table.
A progressive method of measuring the stiffness of milling machines is the measurement in which the load is applied to a machine and measured by “ball bar”, the so-called LDBB (Loaded Double Ball Bar) [17,18,19]. The principle lies in that a ball bar is attached between the spindle and the table, subjected to a force applied to the ball bar by means of a pneumatic cylinder, while measurement of deformation of the table against the spindle is done simultaneously therewith. The measurement is carried out in motion along the specified trajectory. Thus, it is possible to simultaneously determine the positioning accuracy and the stiffness of the workspace. The published results of measuring the stiffness of the milling spindle against the table showed very low values in this case (in the order of 10 N/µm). The experimental results presented in this paper indicate a possible explanation for low stiffness.
Recently, progressive methods of measuring machine stiffness have been introduced based on camera measurement of 3D optical distortions of points in space [20,21]. This system is used, for example, to determine the technical condition of the forming machine and the tool. Early identification of wear or incorrect adjustment greatly reduces additional maintenance and operating costs. An advantage is that the measurement can also be carried out during machine in operation. High-speed cameras thus also make dynamic analysis possible.
There are many compensating techniques for improving the behavior of the required machining properties of a CNC (Computer Numerical Control) machine, such as [22,23]. Nevertheless, these compensatory techniques, however perfect, cannot replace the essential requirements for the required static stiffness and its diagnostics. The static stiffness of the entire system of the locomotive mechanism will always be the basic requirement for the overall accuracy of the product, which depends on it to the greatest degree.
The motivation of the authors of this paper was not only an improvement of the classic method of static stiffness measurement. Classic measurement focuses primarily on development fostering environment. The main motivation of the authors was to use the stiffness measurement to achieve greater precision in defining the machine condition. Many error conditions of machines are accompanied by a change in stiffness. For example, wear and tear of the guide will not only result in increased noise and vibration, but also in a changed stiffness of the machine frame. Similarly, it also applies to wear of spindle bearings [24]. By measuring stiffness, incorrect assembly operations may also be revealed. For example, misalignment of the bearing preload. A deviation from guide parallelism allowance is manifested by a change in stiffness, too. It is therefore appropriate to develop modified, new compensation and measurement methods for the above ways of determining the stiffness of machines in practice [25].
One of the probable reasons why the stiffness measurement in practice is little used is the absence of compact portable equipment with the appropriate products on the market. This situation should be improved in the future.
Progressive compensation methods may significantly contribute to the overall suitable characteristics (e.g., by compensation for vibrations [26], by predicting deviations from the exact path [27] and by subsequent controlled alignment, or calibration [28,29,30,31]) but all the experts agree on the need to achieve the highest static stiffness of the base frame and the slide mechanisms of manufacturing machines.
As experience shows, the machine stiffness characteristics are of a complex nature. Therefore, the commonly used simplified view of static stiffness of machines in their designing process is not sufficient. These reasons have been the main motive for research in this field.
The method for determining the modified static stiffness SSaS (Static Stiffness after Sliding) by sliding the machine slide into the measured position is based on the measurement methodology for positioning accuracy. The main difference between the standard method and the modified method is that the load is applied to the positional table during its assumption of the program position by a unilateral static force acting in the direction or against the direction of the motion.
The premise is a verified finding that positions assumed load-free and position assumed under the load show different values. The difference between these values corresponds to the deformation from the load force. From the known force and deformation, it is possible to determine the stiffness of the table against the base in the given programmed position of the slide.
An advantage of this modified stiffness measurement methodology is the simplicity of measurement preparation, the relatively fast course of measurement, and the mapping of stiffness over the entire range of slide motion.
A disadvantage of this modified methodology is the need to eliminate thermal deformations and random effects on measurement.
The static stiffness immediately after the sliding was experimentally verified in two different ways. From this point of view, for the sake of clarity, the static stiffness measured after the sliding will be expressed as SSaS. In the respective literature, expressions such as Transfer Stiffness [32] or Transport Stiffness [33] are used, but they denote totally different physical phenomena. In the first case (Transfer Stiffness), it is the dynamic stiffness of the suspension springs of the compressor, and in the latter case (Transport Stiffness) the term is used in the theory of plasma processes. The turbulent flow of electrons that are sensitive to the transfer of free energy through waves is referred to as Transport Stiffness. This parameter is used to determine the performance of combustion plasma equipment.
The classic static stiffness measurement was performed by gradual load application, without the milling table moving.
2. Proposed Measurement Schemes
The aim of the experiments is to measure the static stiffness of the table in the direction of the +X axis, using both the classic and the modified method. Three different methods will be used. In all experiments, a one-sided load will be applied by the Fr force while the Fa force will be applied in the opposite direction. In the following three experiments (2.1–2.3) only the load of the Fr force will be applied to the table. In the additional verification experiments (3.6), the load of the applied Fa force will also be checked.
The actual position of the table, in addition to temperature influences, is also determined by the contact stiffness and the degree of backlash delimitation in the critical places of the cross table. Critical locations in Figure 1 are marked with a circle.
2.1. First Experiment (Scenario)—Static Stiffness Measured by the Classic Method
Measurement of static stiffness by a conventional method consists of gradual application of force and its subsequent relief, all happening in the same position. After measuring the first cycle, the table moves to a new position, where it is gradually loaded down and relieved. The next procedure is repeated periodically until the prescribed number of measurements is completed.
Measuring scenario, see in Figure 2:
- Application of the first load to one position (Fr11)
- Measurement of displacements
- Gradual load addition (Fr12, Fr13, …)
- Measurement of displacements
- Gradual load removal
- Measurement of static stiffness
- Repeating previous steps at the given position
- Sliding to a new position
2.2. Second Experiment (Scenario)—Modified Static Stiffness Measurement across All Positions
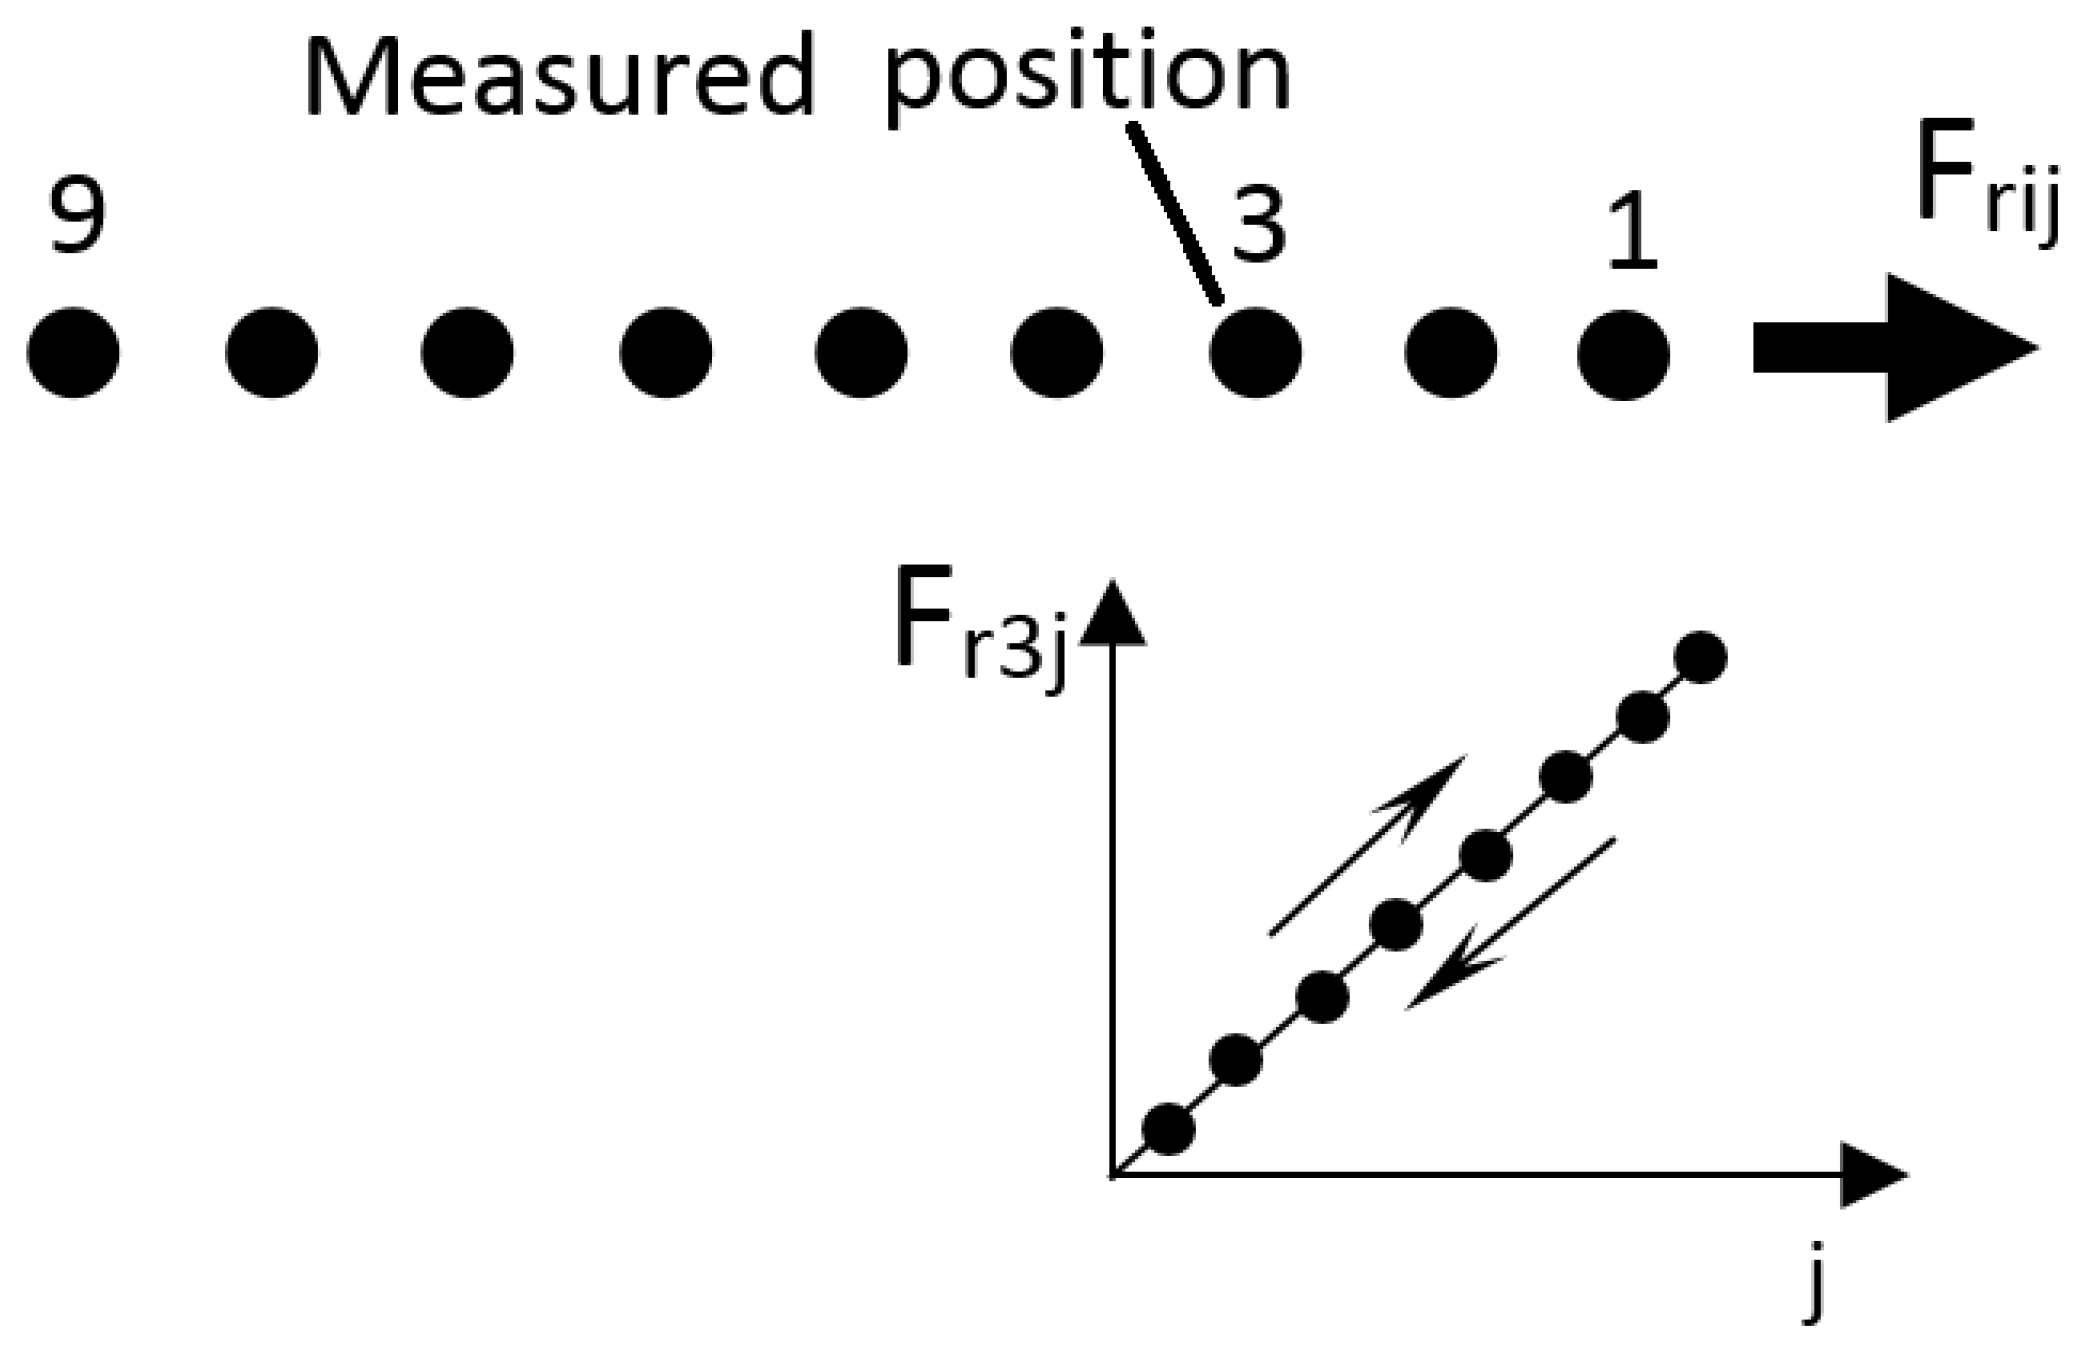
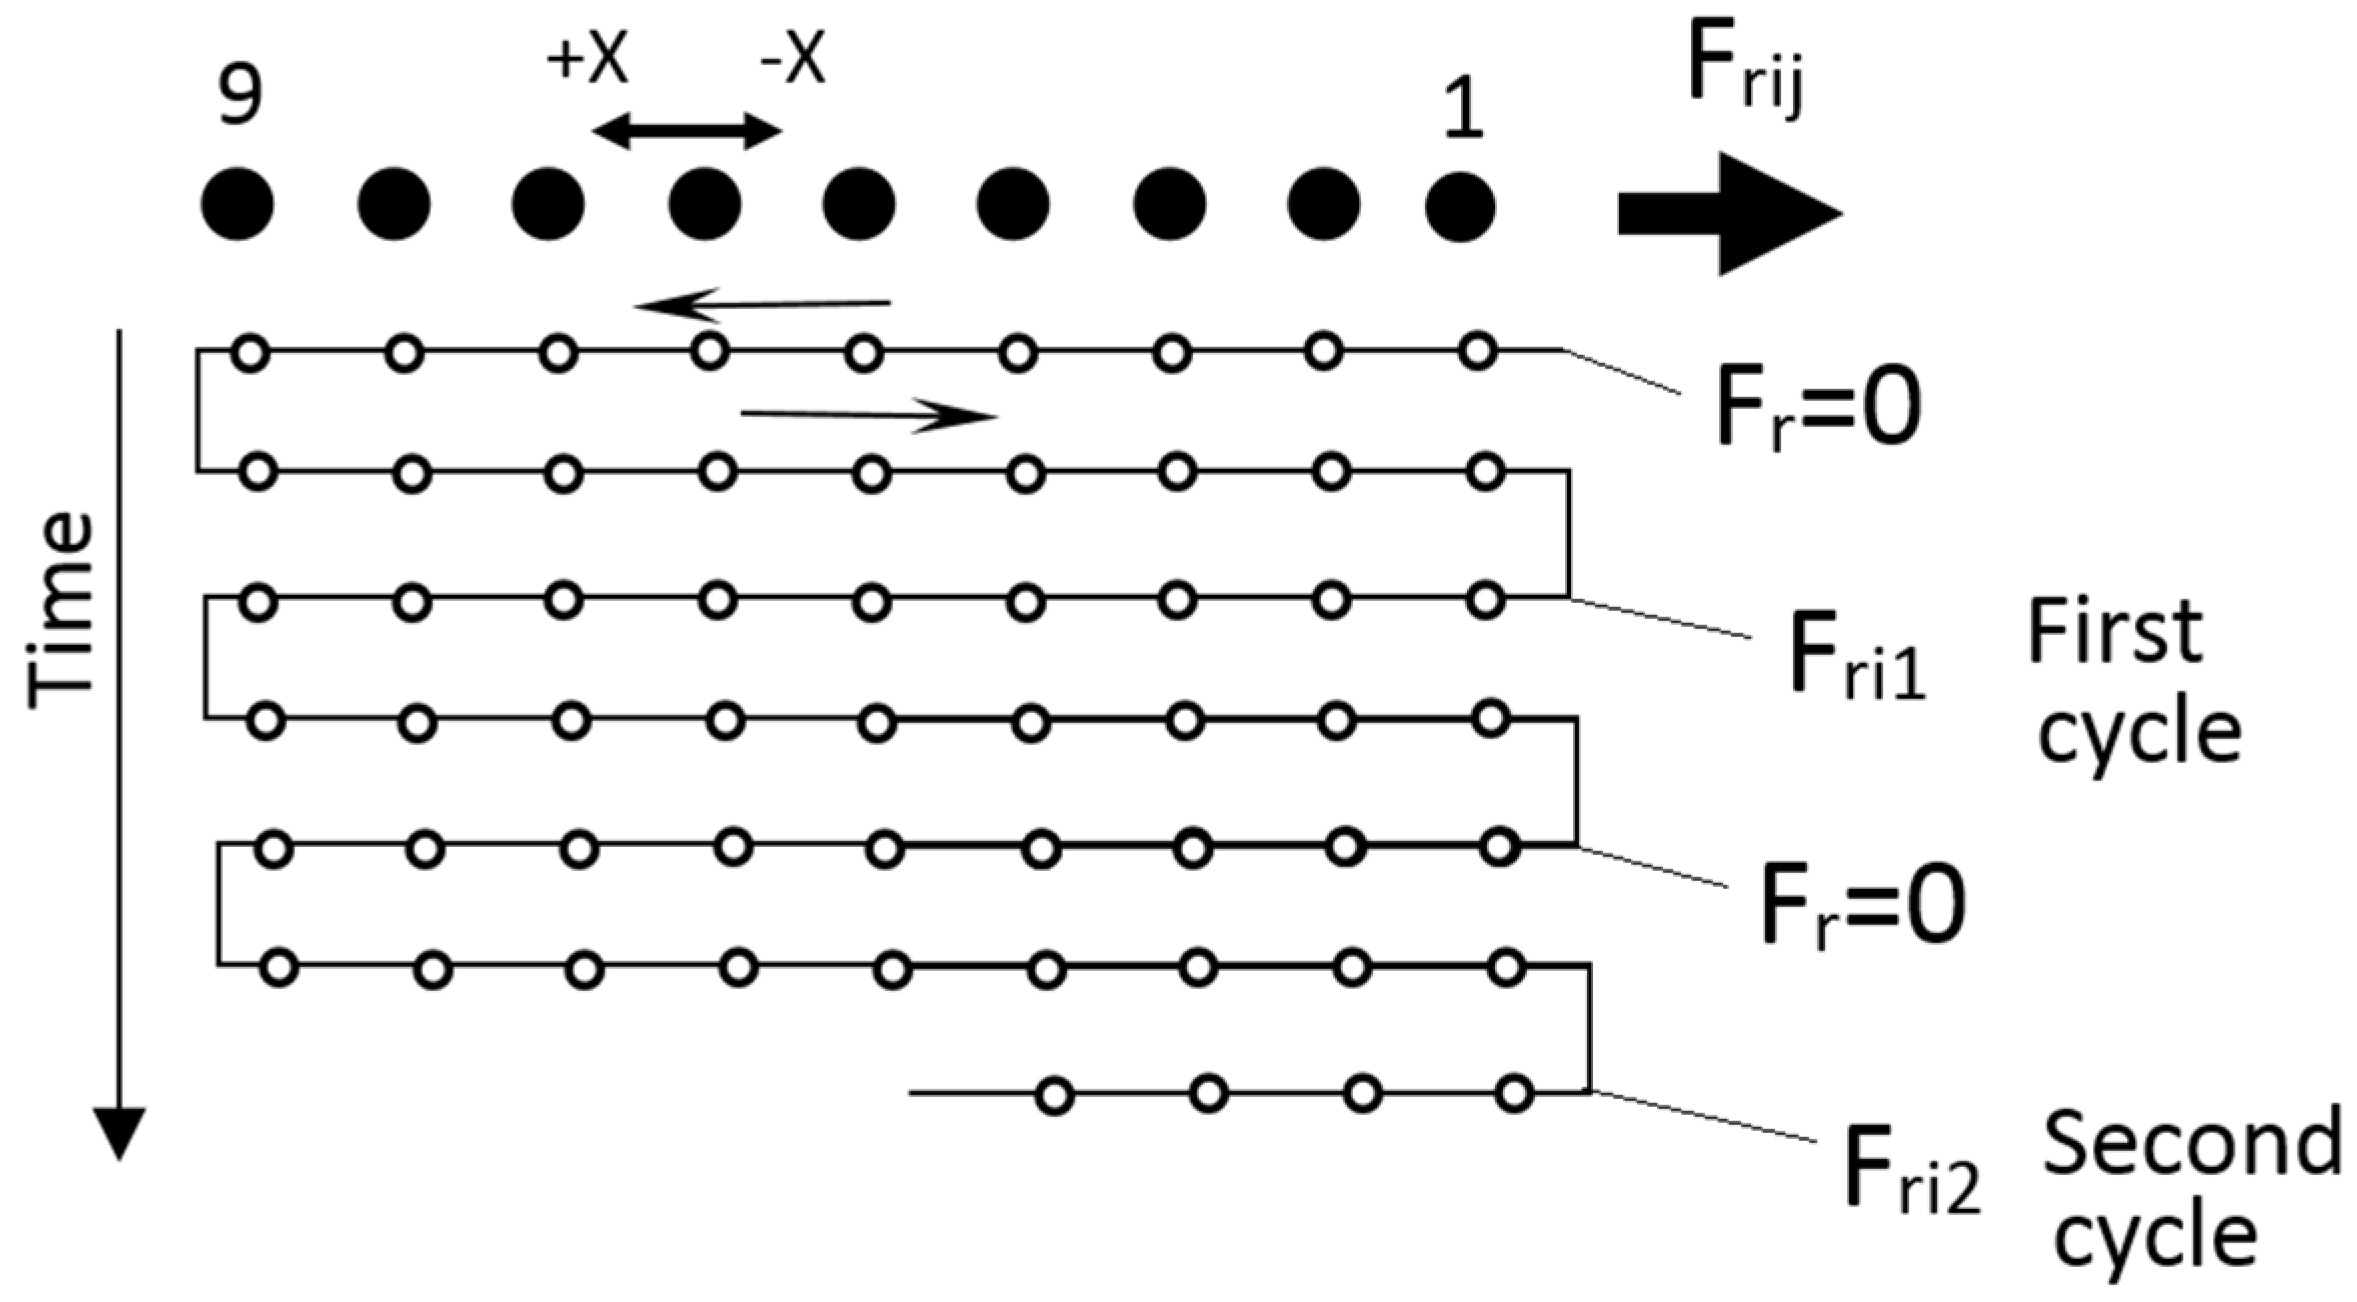
When applying load to positions on the table, the work procedure will involve alternating load and load-free cycles. The reason for such a procedure was to estimate the thermal expansion of the table against the base during one cycle. During the cycle under load both, deformation by force and by the change in temperature, is likely to occur. During the load-free cycle, only the deformation resulting from temperature change is likely to occur. Figure 5 shows that one cycle consists of a gradual sliding of the table from position 1 to position 9 and back to position 1. Using the laser interferometer, the exact position will be captured. During the load cycle, a fixed static force Fr will be applied to the table by means of a string transmission. The applied load will gradually increase with every other cycle. Table sliding working speed rate was the same in all experiments (F = 300 mm/min). The distances between individual positions are the same (l = 75 mm).
Measuring scenario, see in Figure 5:
- Running of one cycle over all positions load-free (Fr = 0)
- SSaS stiffness measurement
- Running of one cycle over all positions with the application of load (Fri1)
- SSaS stiffness measurement
- Repeating of previous steps under increased load (Fri2, Fri3, …)
2.3. Third Experiment (Scenario)—Measurement by Repeated Application of Load to the Table Position with Small Back Slidings
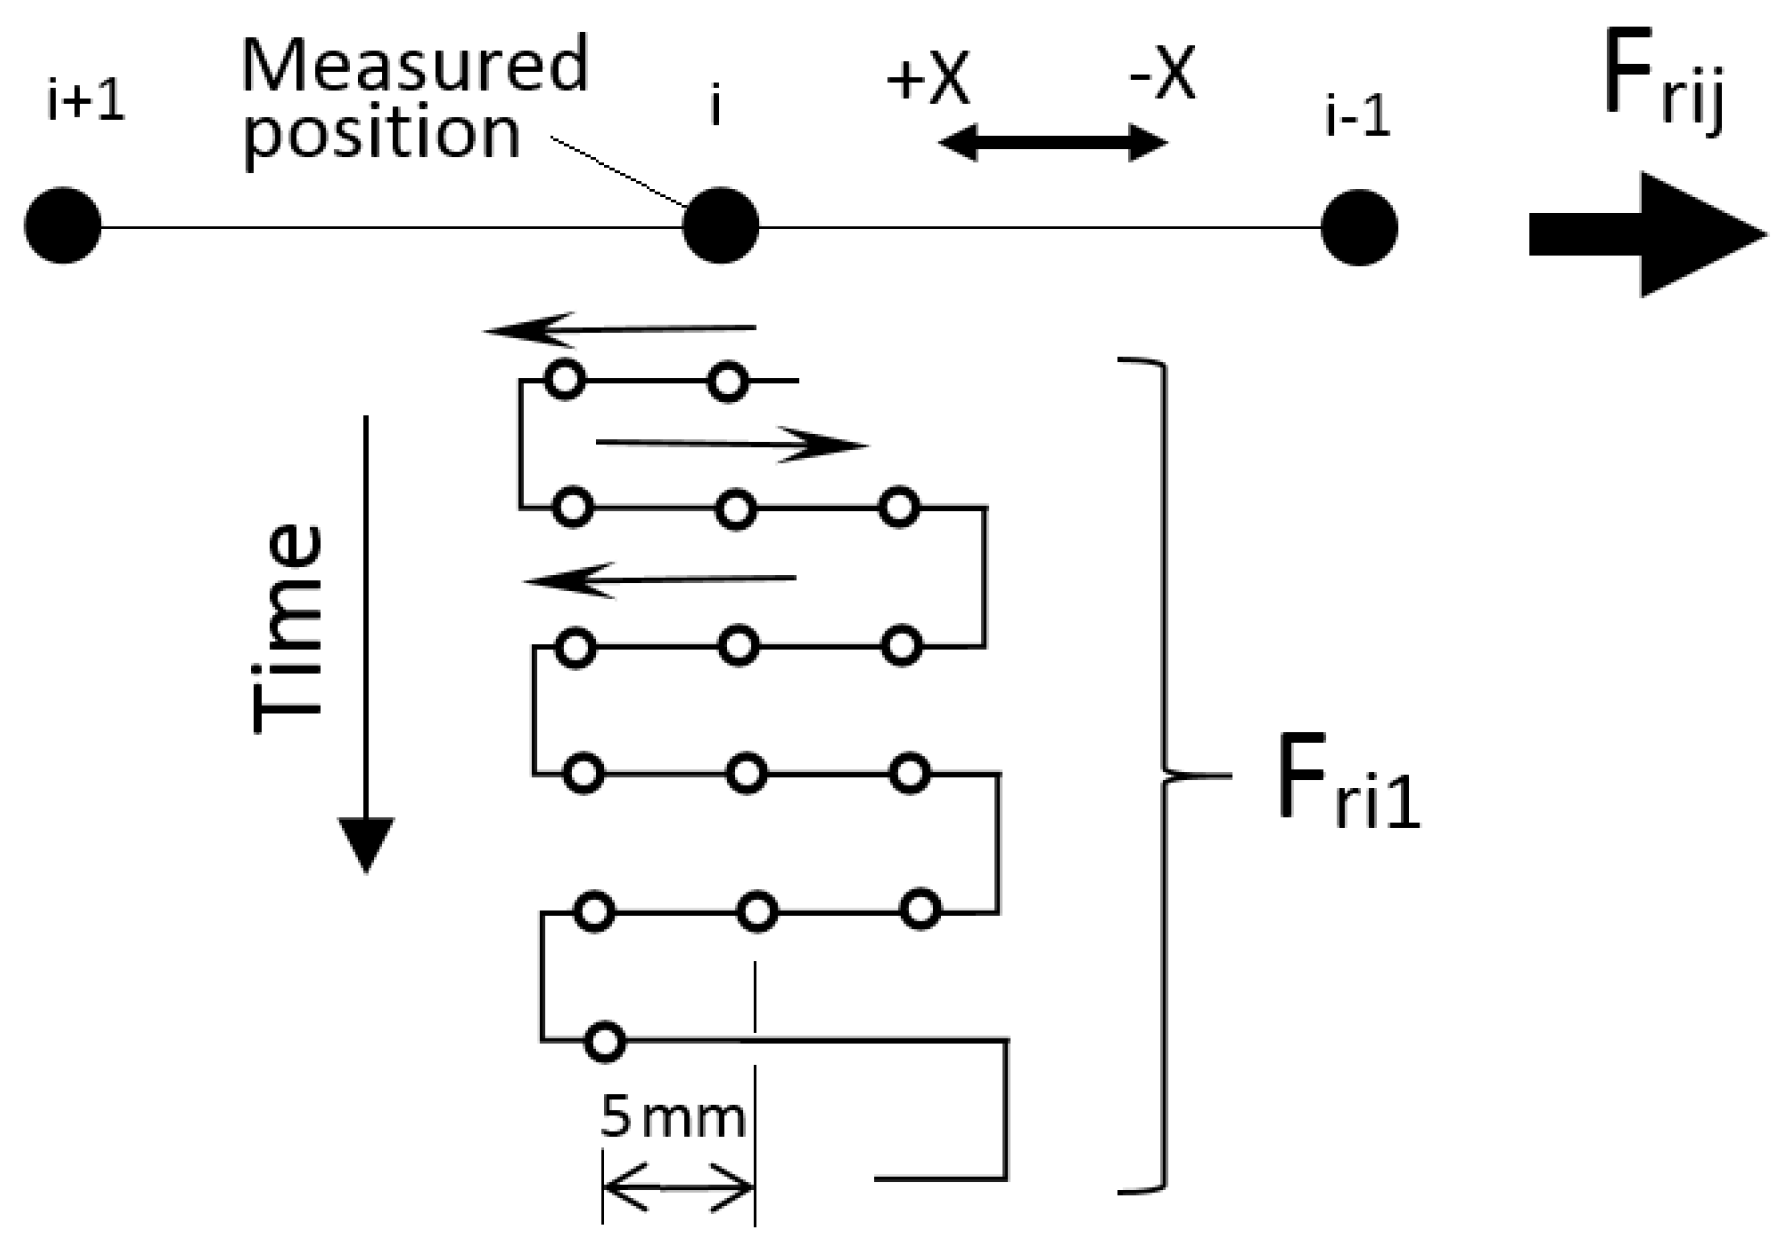
With the third stiffness measurement method, several repetitive return slidings at the given position of the table from both sides in the +X and −X axis will be done. Figure 6 shows that the runs will start 5 mm apart from each other and they will be executed in immediate succession alternately from both directions. A load will be added after each cycle. The maximum load was Fr = 126 N. This repeated measurement procedure is the shortest in time. Therefore, the impact of temperature on the measurement is smaller compared to the first experiment.
Each point of load is obtained as the mean of deviations from the five alternating runs. Thus, the stiffness course is obtained. As in previous cases of experiments number 1 and 2 respectively, the trend line slope here, too, indicates stiffness. The courses in these experiments are likely to be approximately linear. Therefore, a single value is sufficient to define the SSaS stiffness.
Measuring scenario, see in Figure 6:
- Forward and backward motion around one position with application of the first load (Fri1)
- SSaS stiffness measurement
- Repeating of the first step with gradual load addition around the position (Fri2, Fri3, …)
- SSaS stiffness measurement
- Sliding to a new position and repeating the procedure
3. Experimental Comparison of Static Stiffness Measurement Methods
3.1. Materials and Methods
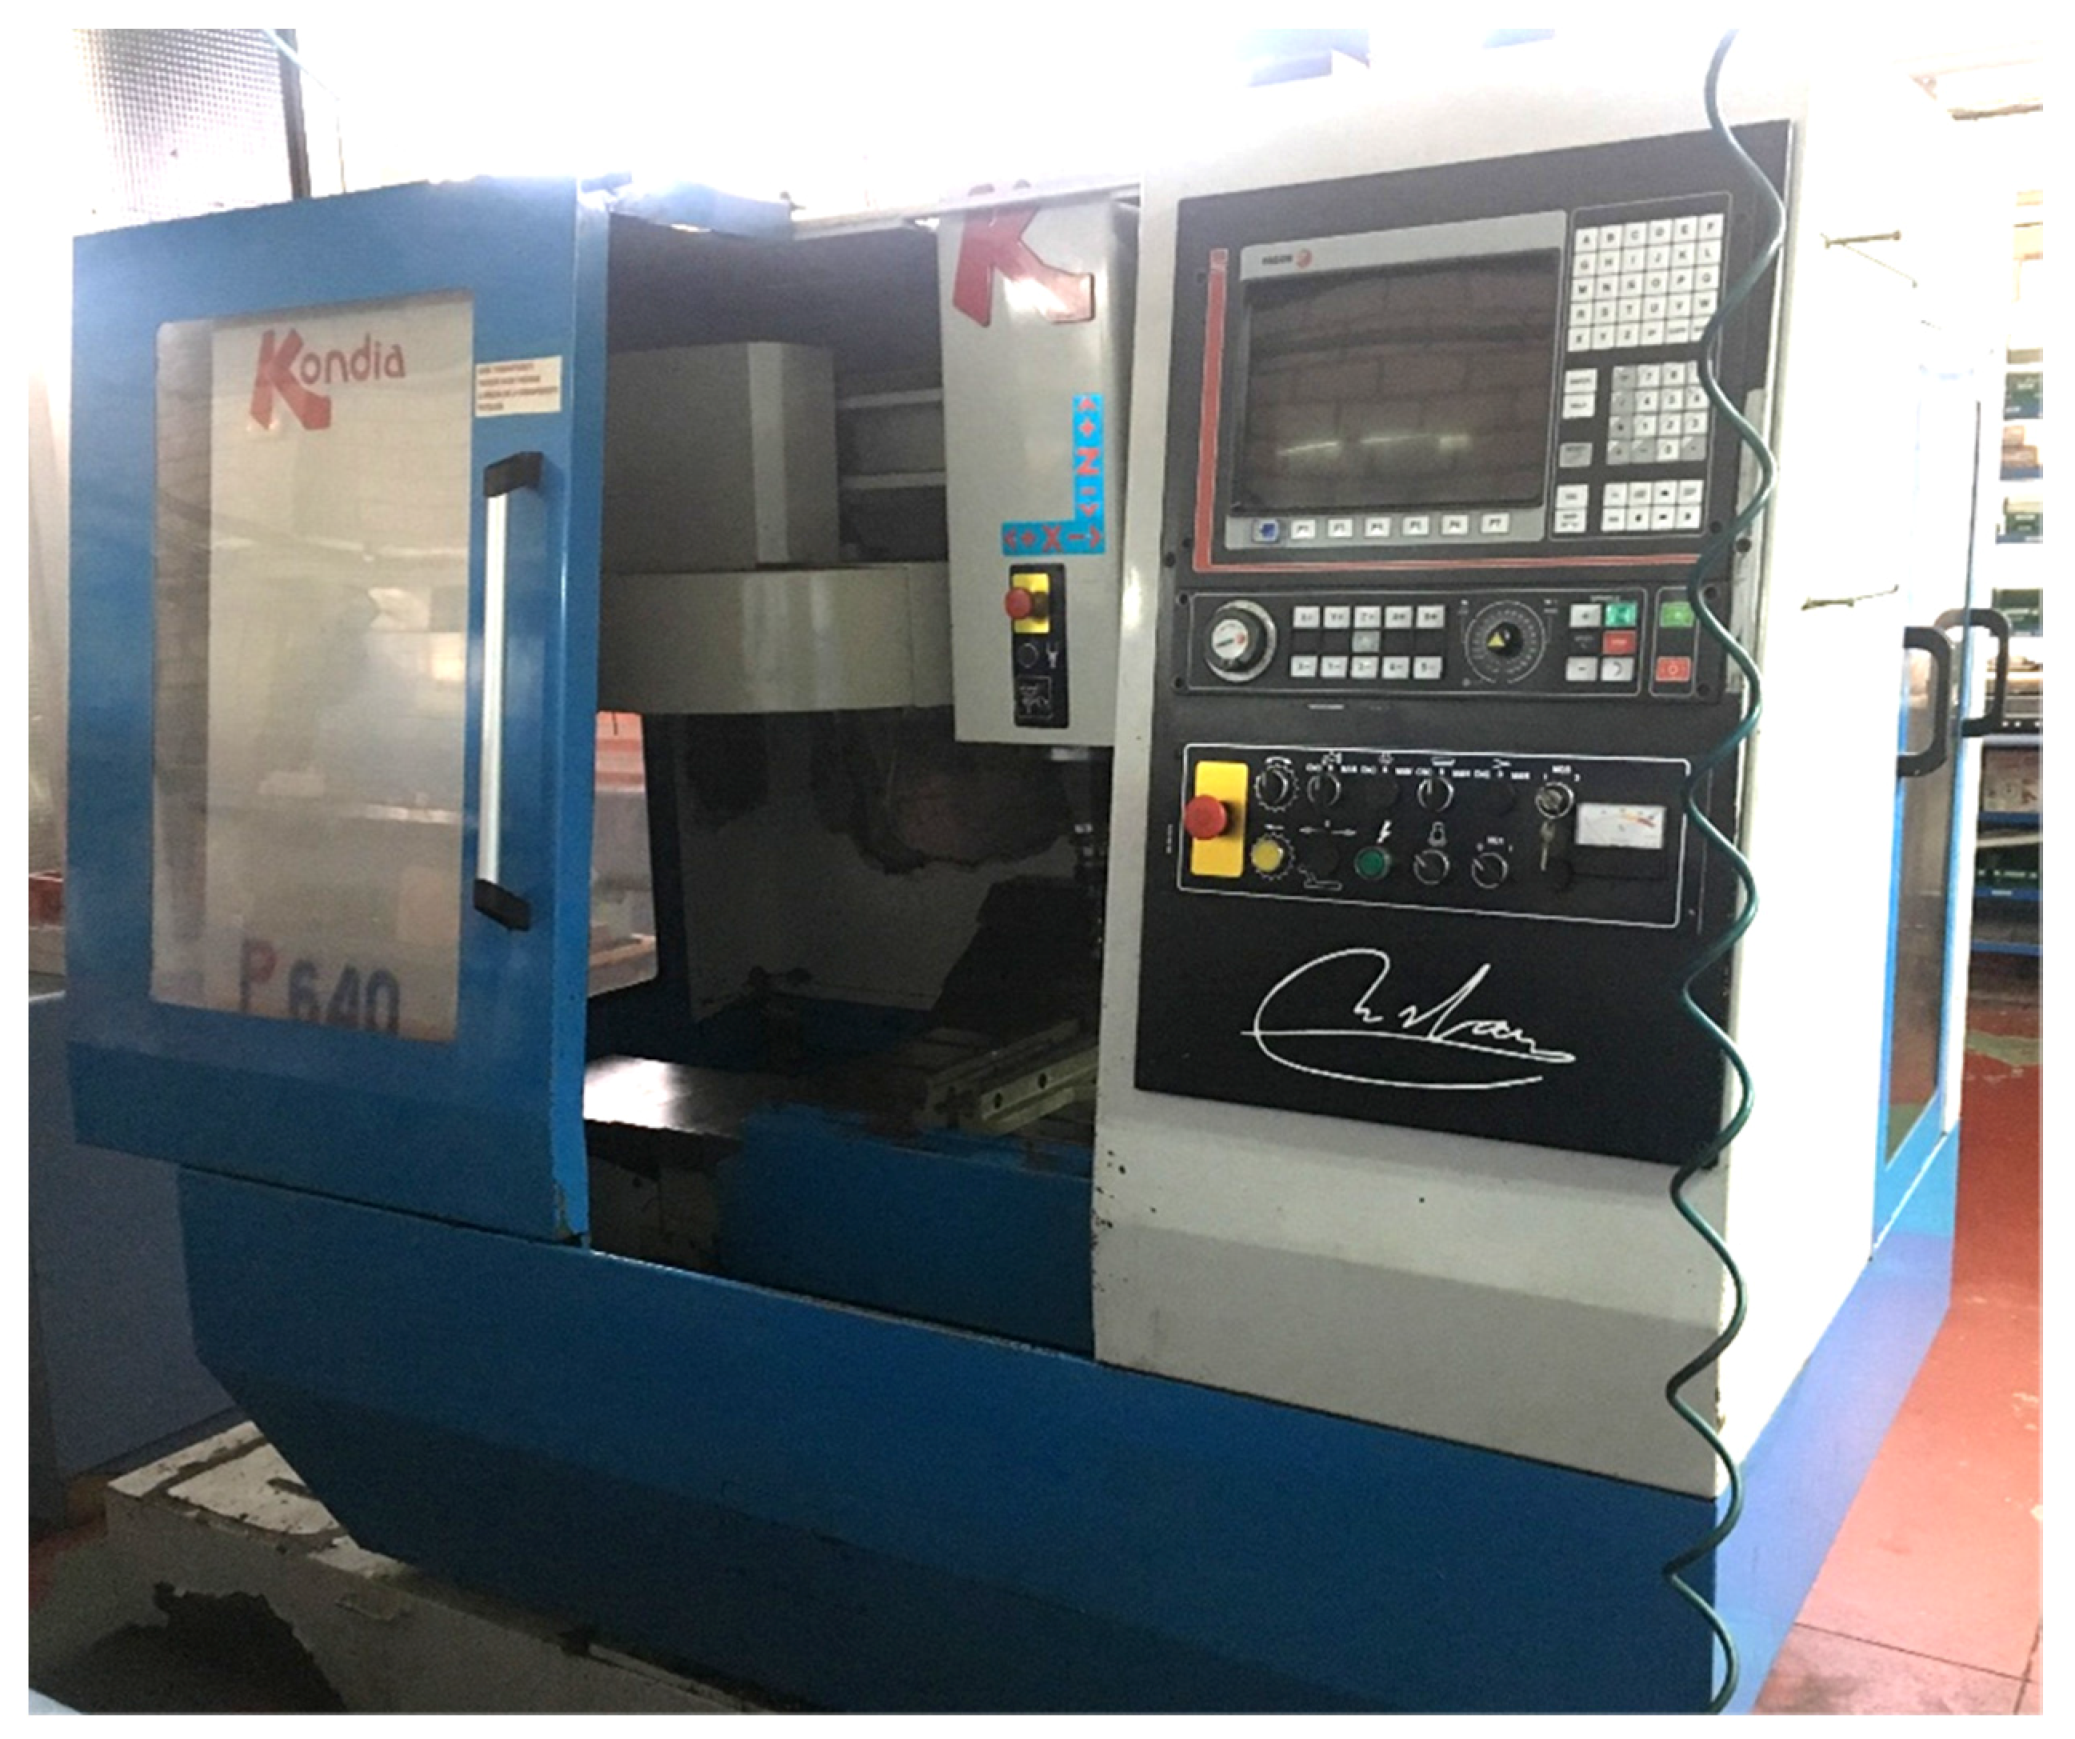
For experimental static stiffness measurement, the CNC Vertical Milling Machine (Kondia, Elgoibar, Spain), model “B 640” was used as a production machine with three fully controlled axes of the following parameters:
- –
- Machine Weight: 3600 kg,
- –
- Max. load capacity of the table: 300 kg,
- –
- Max. Spindle Speed: 6000 r/min,
- –
- Spindle Motor Power: 7.5 kW,
- –
- Working Room: Movement (x/y/z): 600/400/510 mm
- –
- Year of manufacture: 2003
- –
- Declared accuracy: ±0.005 mm
- –
- Control: Fagor (Mondragón, Spain), model 8055
Figure 7 shows the Kondia B 640 CNC Vertical Milling Machine.
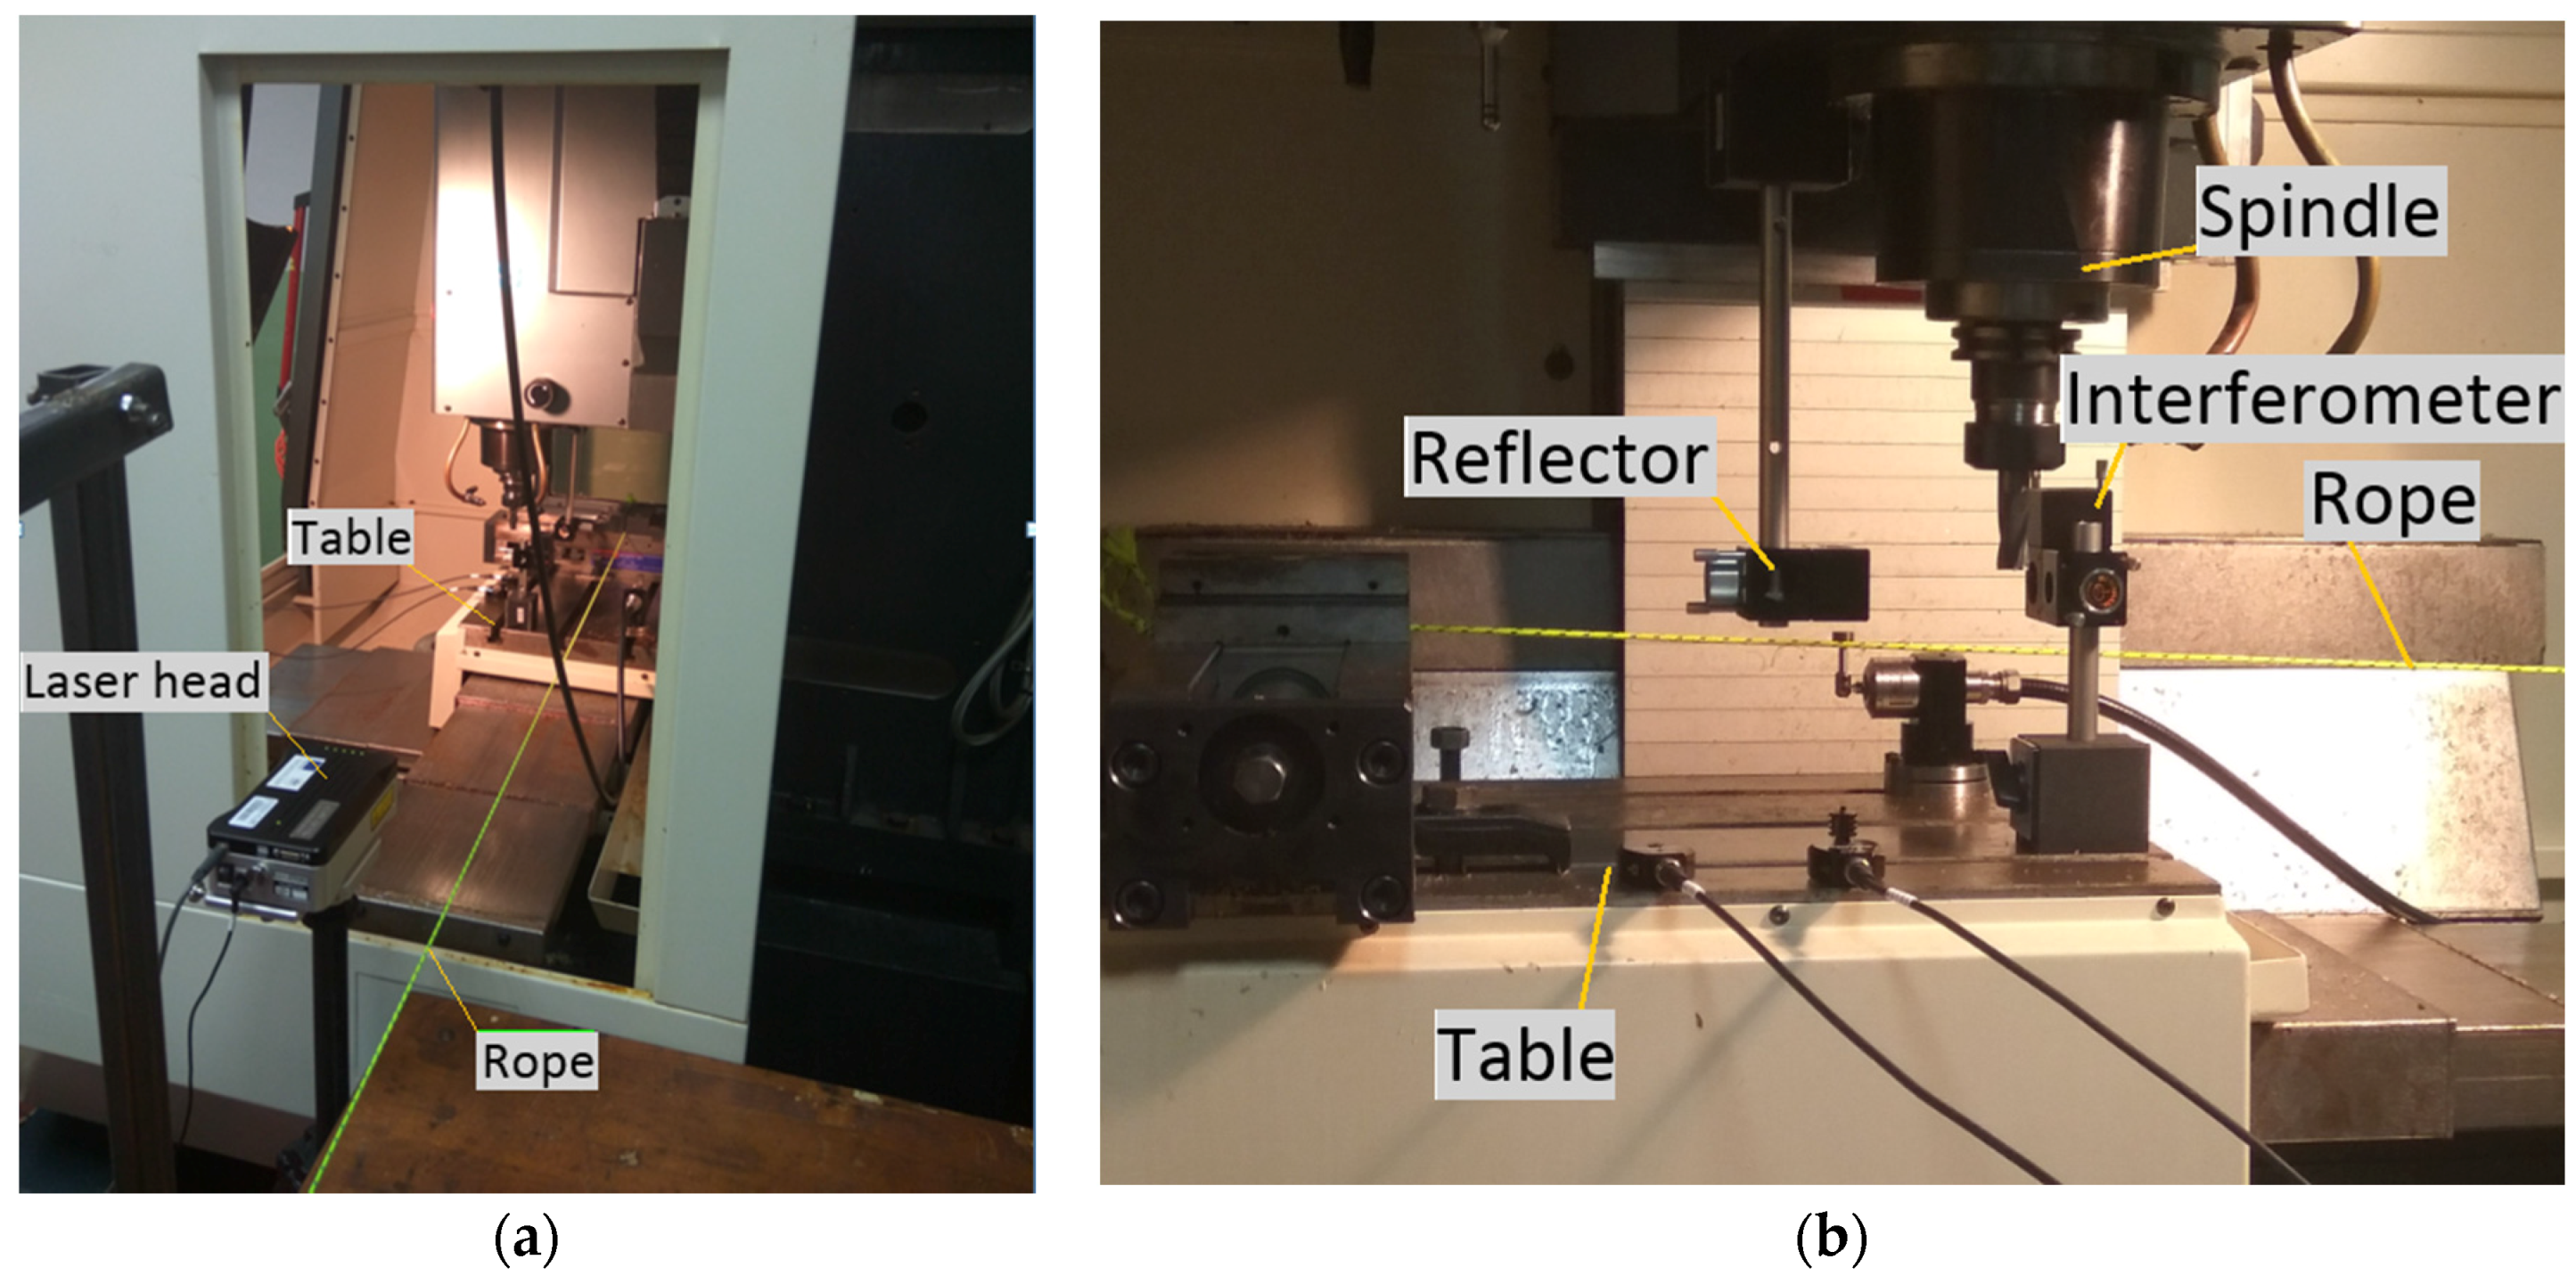
Deviation measurement was performed by Laser interferometer, type “XL80”, from Renishaw plc Company (Gloucestershire, UK). The manufacturer guarantees the measuring accuracy greater than 0.5 µm/m. The force of nine weights was applied as the load, the value of which was determined with the accuracy of ±1 g. Relevant loads are shown in Table 1.
3.2. First Experiment (Measurement)—Static Stiffness by Classic Method
The working procedure consisted of first moving the table into the measured position, load-free. In the given position, the Fr force was gradually applied to it to be subsequently removed. The loading and unloading cycle was repeated twice in each position. The reason was that the backlash to load in the given direction was only determined at the second round of load application. Figure 8 shows how the stiffness of the system at position no. 8 was determined from the direction of the chart.
This method of stiffness measurement can practically be considered classic. Therefore, the static stiffness of the system equals to direction of the trend line. The trend line was experimentally derived from measurement in the selected relevant position on the slide table.
A total of 9 loads with different weights were performed in the experiment. Load sizes are listed in Table 1.
3.3. Second Experiment (Measurement)—Modified Static Stiffness Measurement across All Positions
The duration of one cycle was approximately 5 min. Over that time, the individual parts of the kinematic chain were heated and caused a thermal expansion of the table. With acceptable accuracy, the increase in expansion over the measured period can be considered linear. For example, in Figure 9, it is visible that after 9 load-free cycles, the first position shifted by about 10 micrometers. An average shift from the direction of the position change can be calculated at each position. The calculation procedure involving the direction is important in order to eliminate deviations caused by other random effects as much as possible. For example, in Figure 9, it is visible that in position 1, the temperature slope is 1.1283. This value is given by the trend line equation obtained by the least squares method.
By the same procedure, the maximum thermal deviations for the load cycles at each position were determined. The difference between the maximum load-free and load displacement value yields a real deformation by the maximum load force. In Table 1, the maximum load force was 173 N. From this, the stiffness was determined at each position in both directions of the table’s assumption of that position.
The greatest stiffness was demonstrated at position 8. This corresponds to the fact that there is a small distance between the bearing and the nut in this position. The sliding screw is least likely to cause stiffness deterioration at this position, as its active distance is shorter.
3.4. Third Experiment (Measurement)—Modified Static Stiffness Measurement of a Stand-Alone Position
3.5. Comparison of Experiments
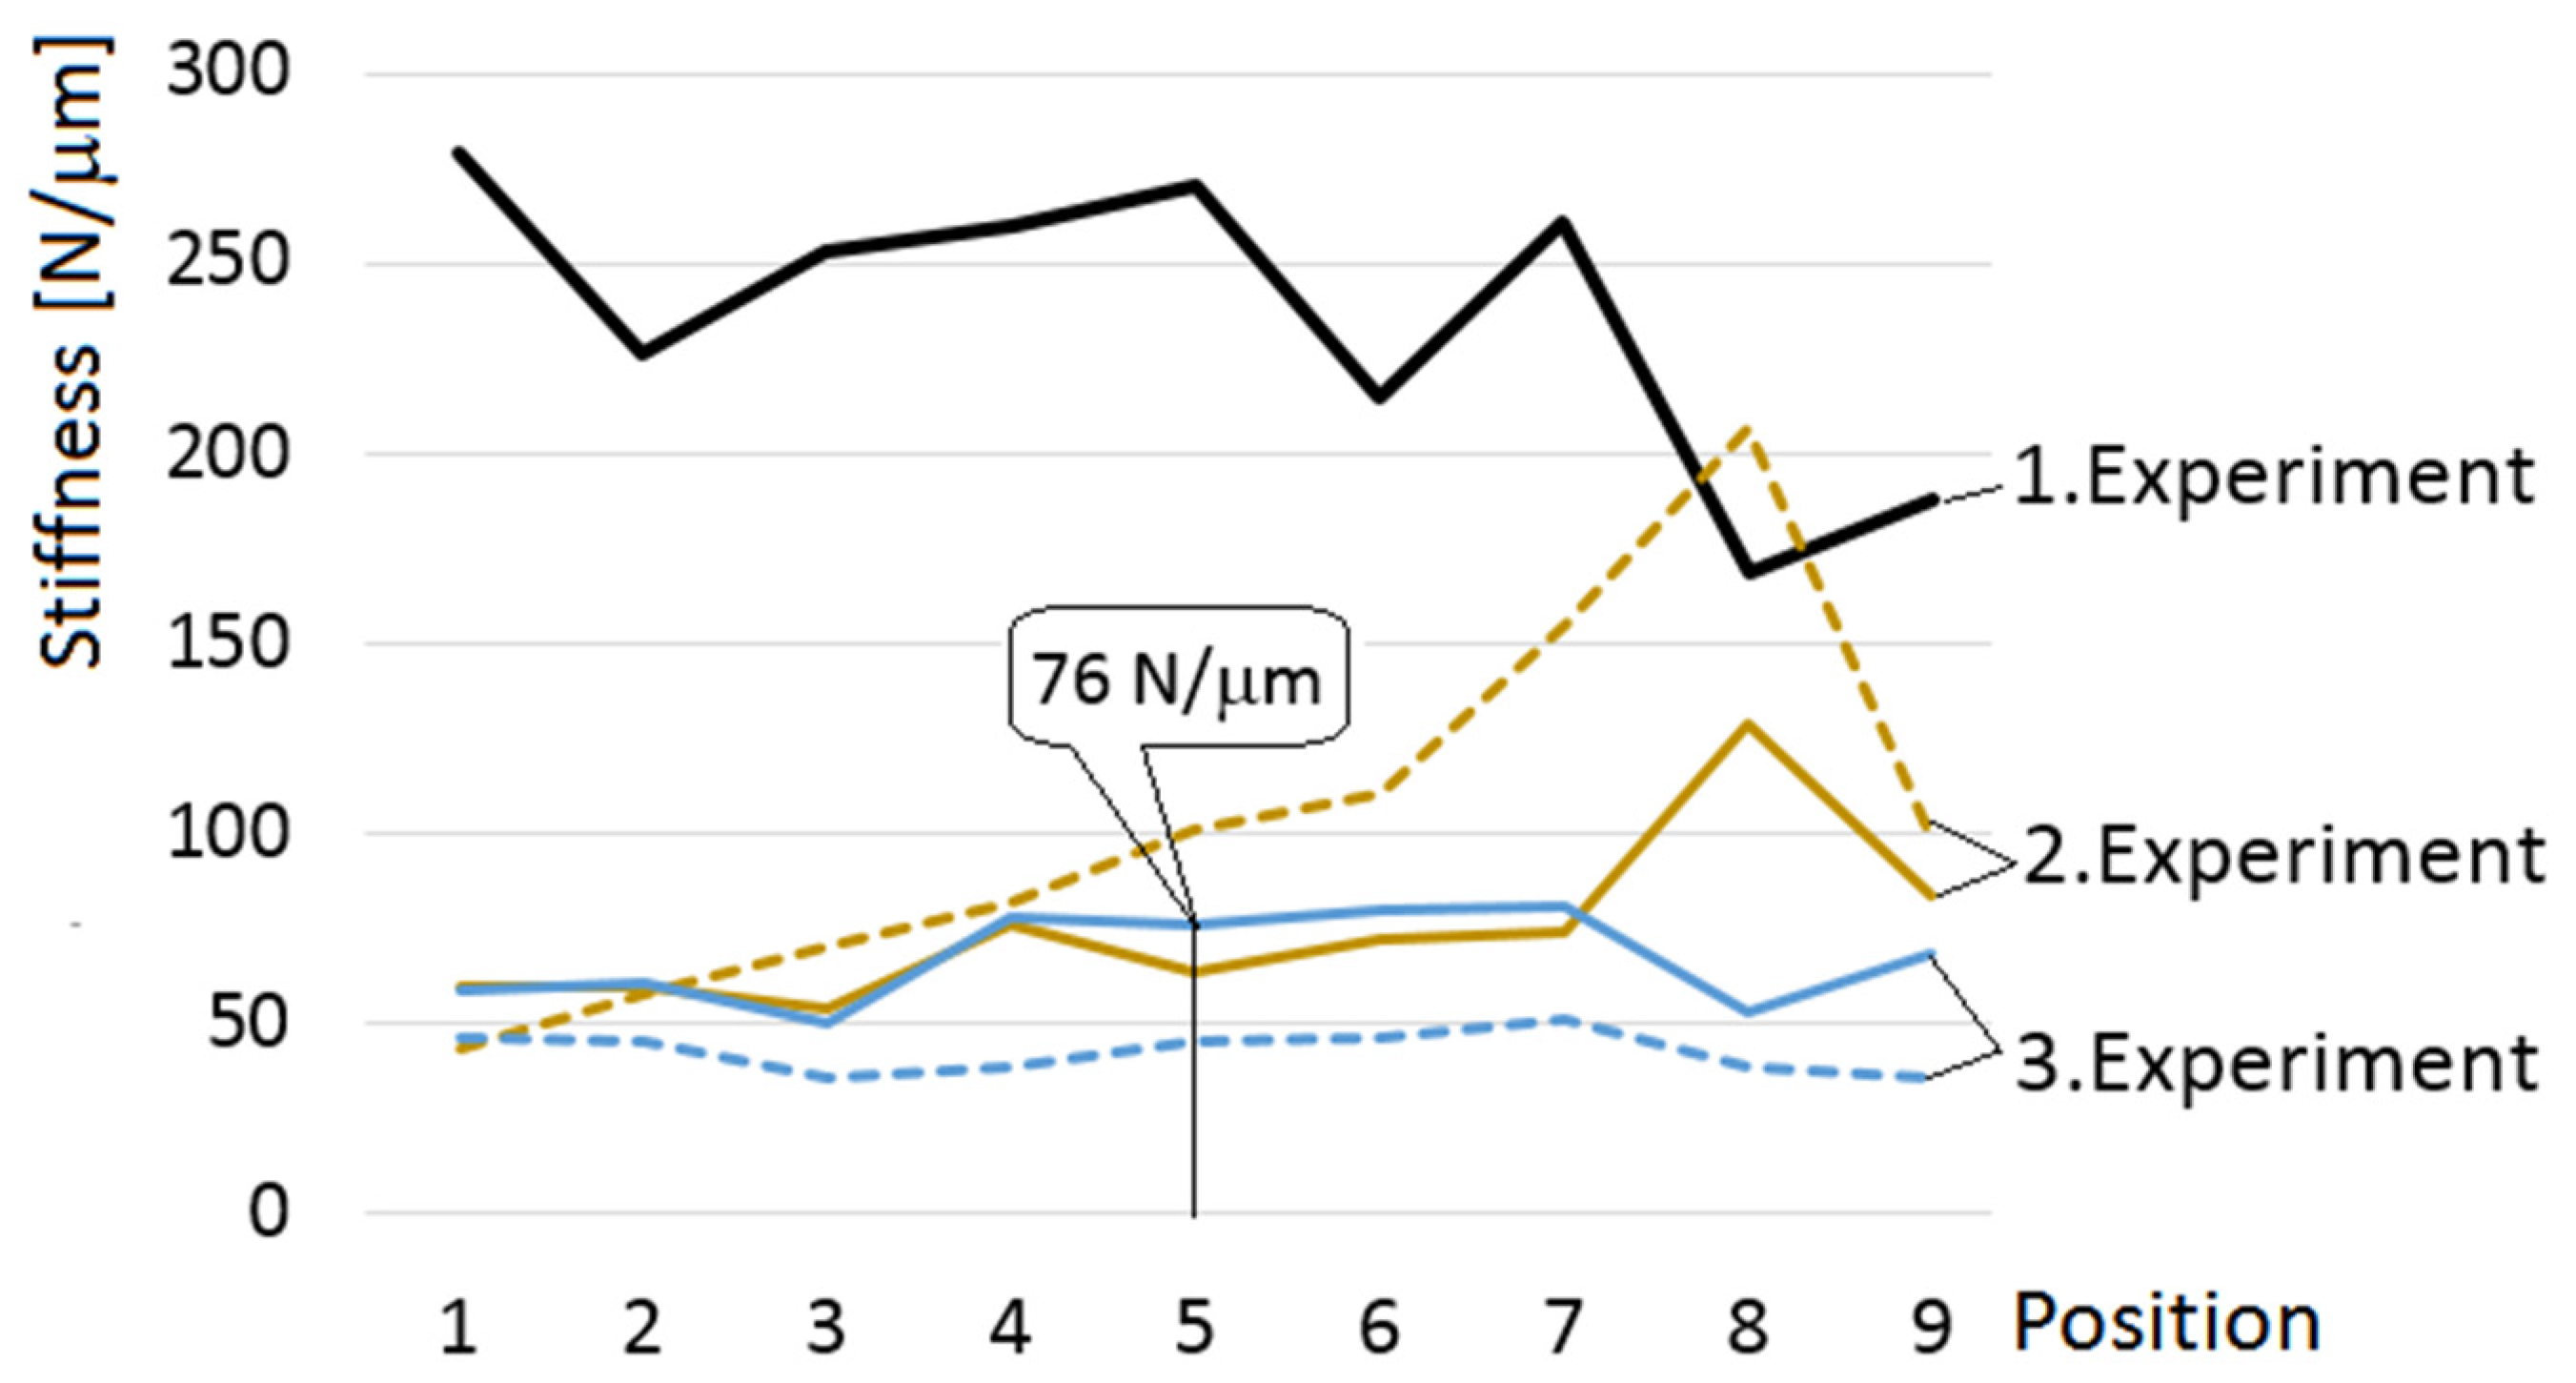
Figure 11 presents a comparison of all stiffness types and shows that the measured values match. Only at position 8 the difference is more significant. By comparing the position assumptions from the opposite −X direction, the differences are considerably larger.
In this direction, the SSaS stiffness, yielded by the local measurement method, was even smaller. A significant difference is seen at position 8 and its surroundings. This difference is not due to a measurement error, but points to the real cause of the low SSaS stiffness. The real cause lies in the oil bearing lubrication layer and the degree of clearance adjustment or preload at all critical locations (in Figure 1, they are marked with a circle). When changing the position, the slide system changes the direction of the load and does not have enough time or energy to delimit the backlash in that position. This is a serious fact because the overall stiffness is then not determined by the machine’s solid parts but by its moving kinematic bonds. The static and the SSaS stiffness is three to four times different in each position.
3.6. Control Measurements of Experiments 1 and 3 under Steady Load in the Opposite Direction
In the opposite direction (force Fa), the stiffness characteristics of other surfaces are shown. This is also confirmed by the experiments, because in this direction, the table showed higher stiffness at all positions. Figure 12 compares the static and the SSaS stiffness.
As can be seen, here, too, the difference between the static and the SSaS stiffness is considerable. However, the case is a little more complicated. The stiffness of SSaS from the −X running direction is slightly greater than from the +X direction. Under opposite load application, this was reversed. What is more important to note, however, is that the sliding characteristic of stiffness showed considerable non-linearity when the load was applied in this direction. Therefore, describing stiffness with a single value is not quite right.
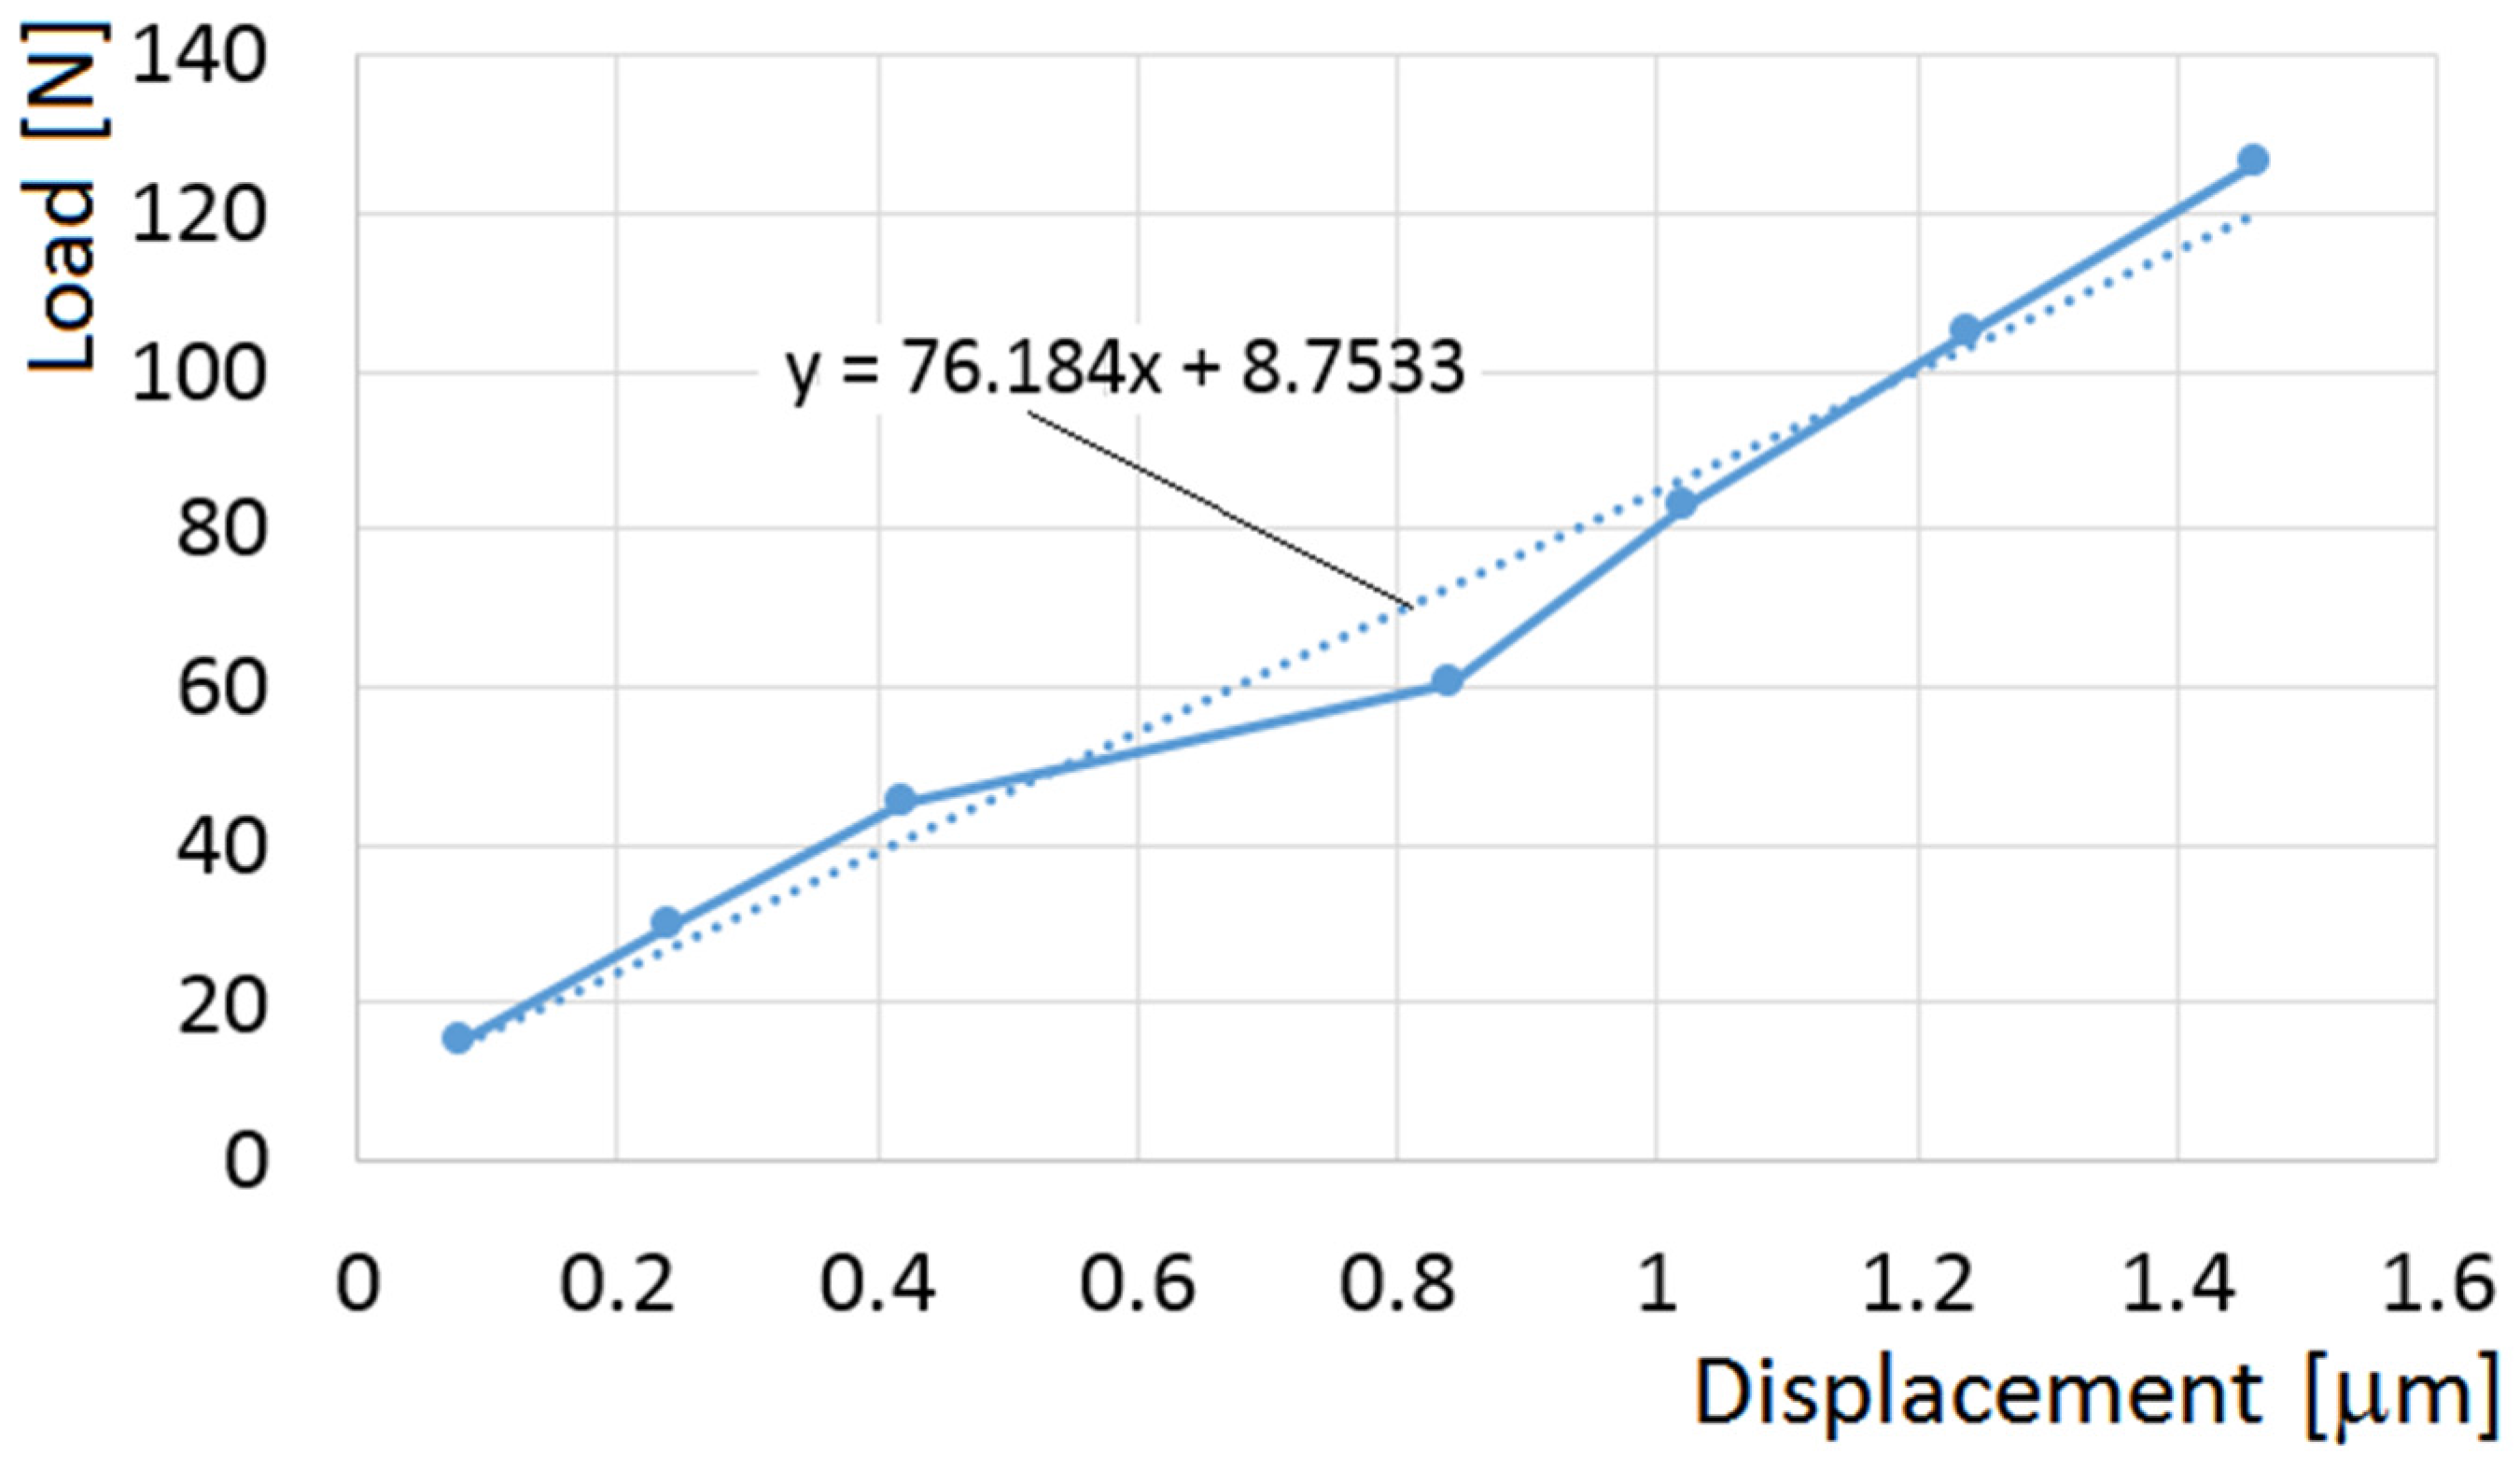
For example, upon running to position 8, the SSaS stiffness from the −X direction is described by the value of 63 N/µm as shown in Figure 13. The trend line’s course is exponential. The resulting stiffness value was determined from the linear trend on the exponential curve by the least squares method. When looking at the stiffness characteristics, the stiffness is lower under application of a lesser load, and considerably greater under application of a greater load.
In this case, another phenomenon occurs. That is, if the motion axis in the correct direction is preloaded, the motion stiffness value approaches the static stiffness one. From the point of view of machine precision, this is an advantage.
Application of load in two different directions shows essentially similar outcomes, but there are also significant differences. These differences arise from the fact that in the application of reverse load, the respective force impacts the opposite support surfaces of the kinematic members. These surfaces can be of different size, structure and surface quality, which is the reason why different results are generated.
4. Model of Positioning Experiments
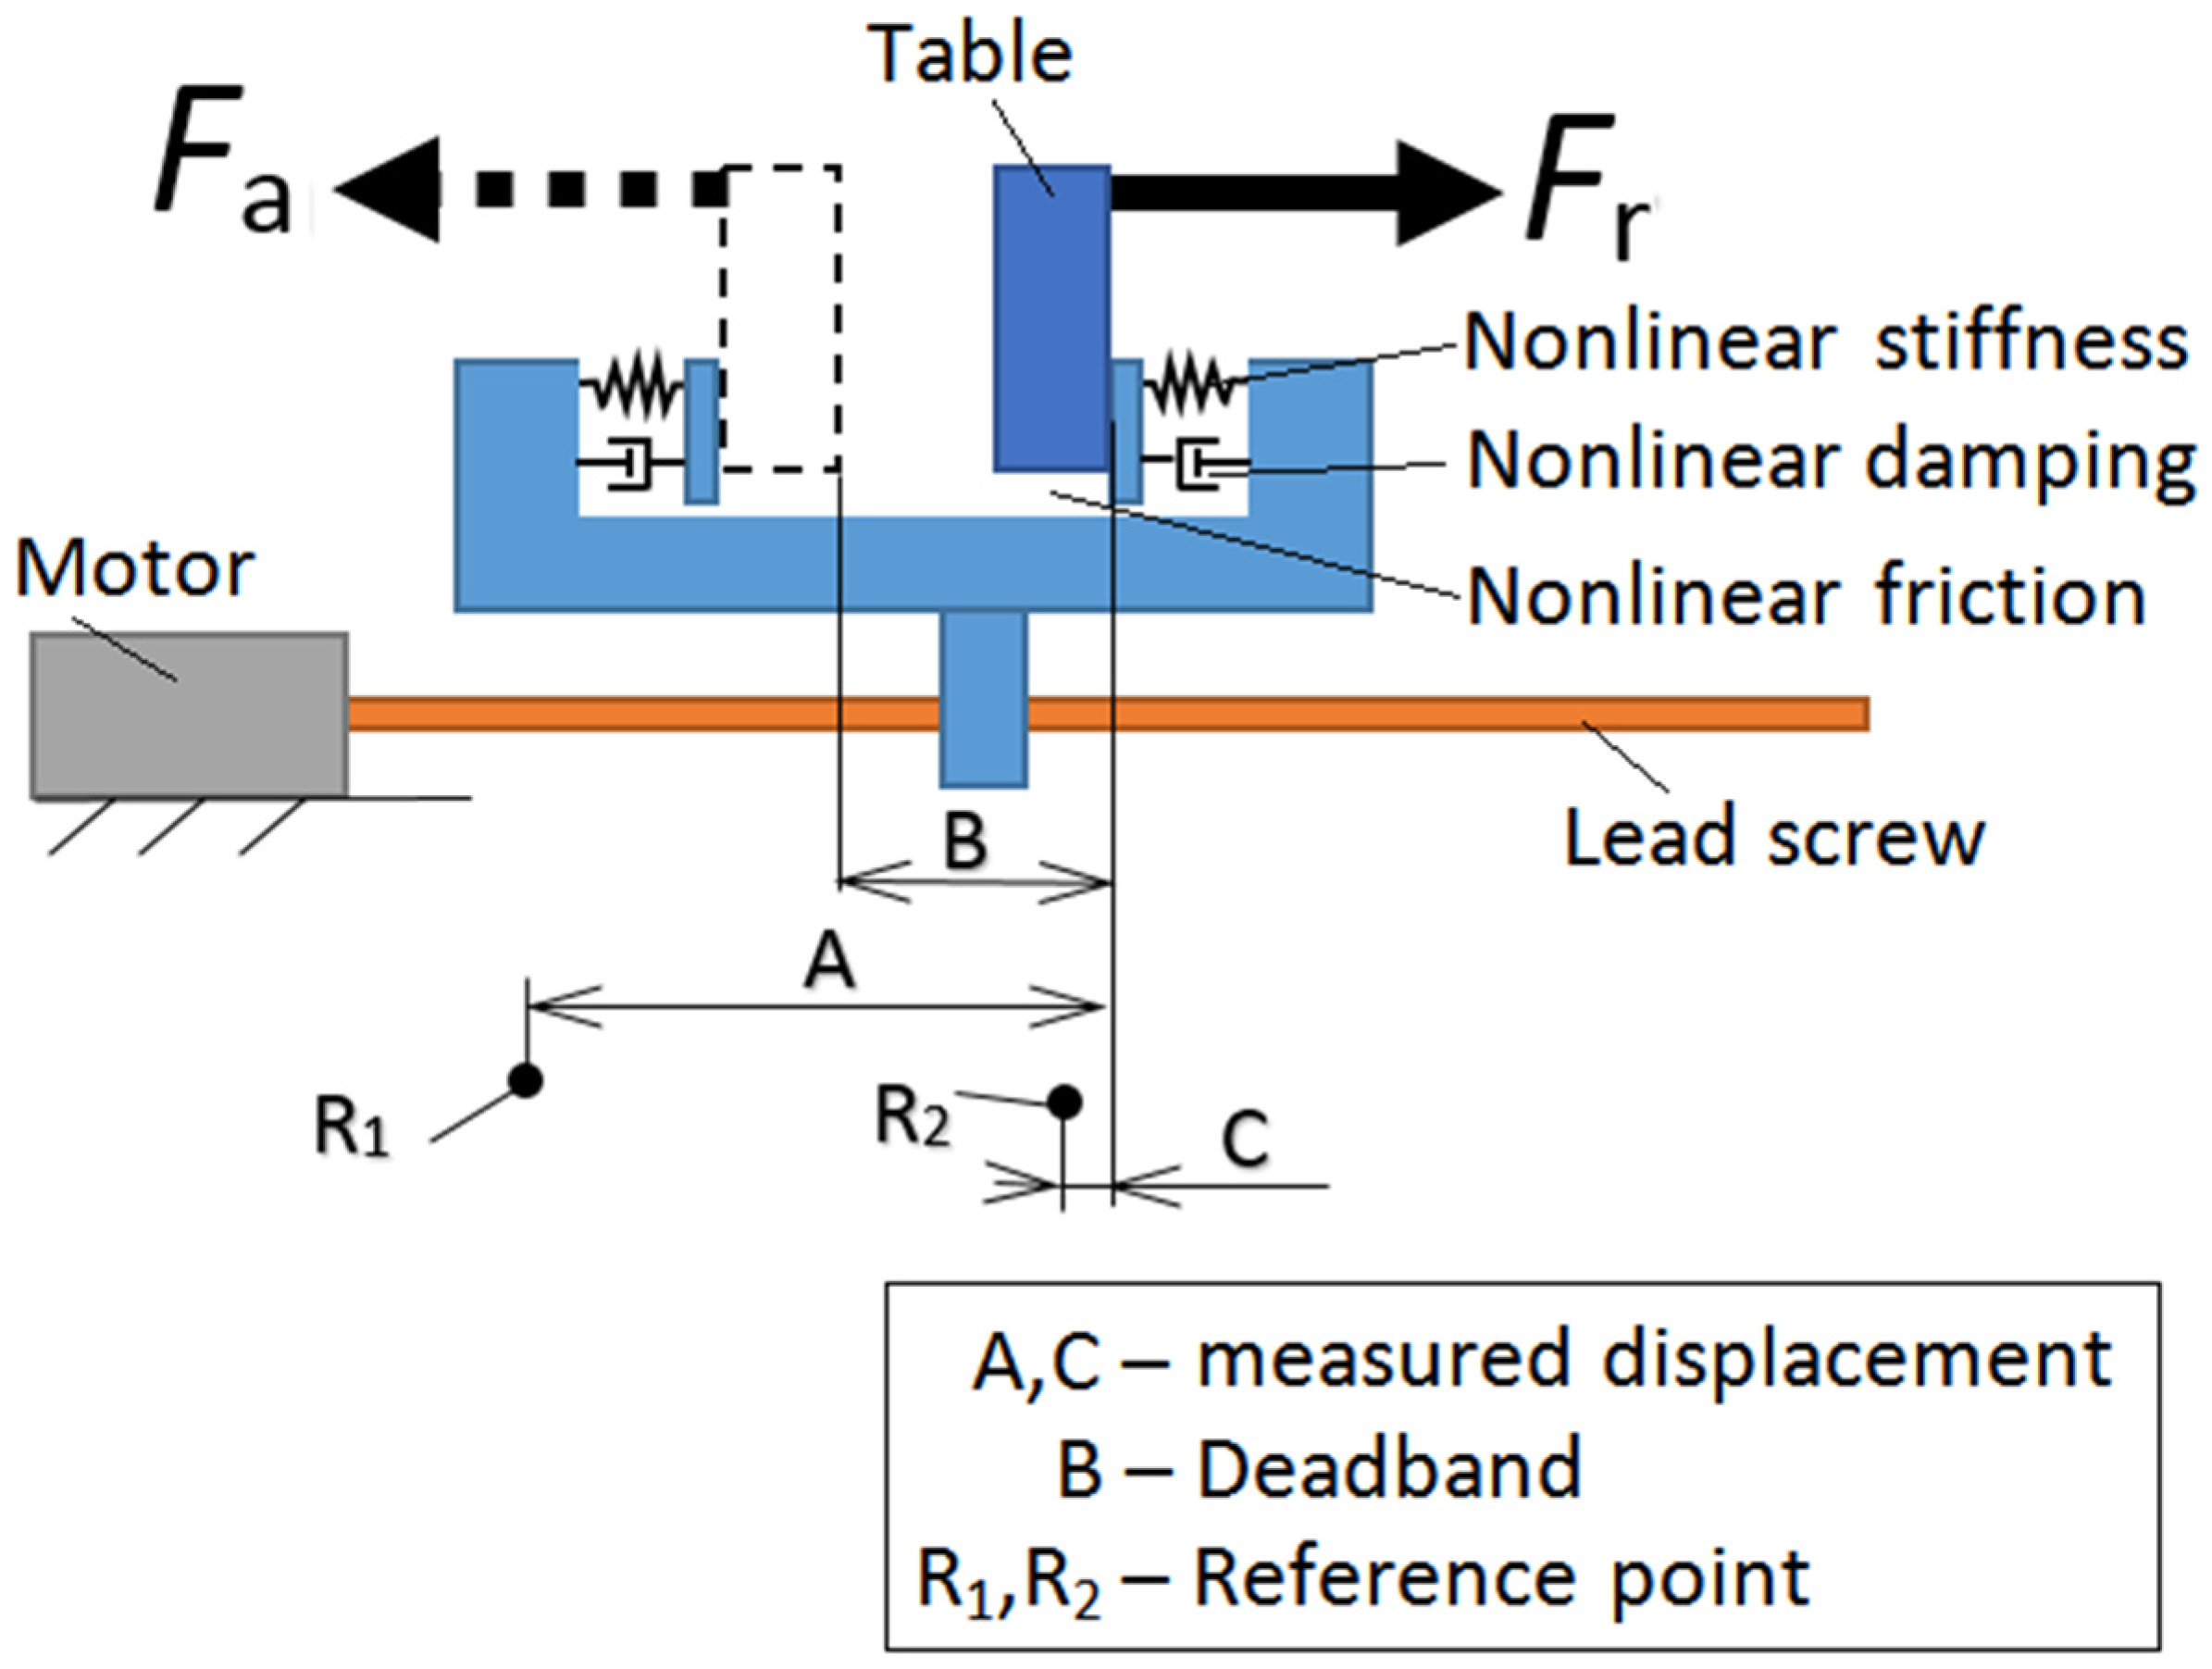
As experiments show, the actual table position depends on the previous load application method used. Immediate static load affects the assumed position only partially. This fact presents special demands on the mathematical model. Common mathematical models yield unequivocal results from the input values entered therein. This is not the case. We did not build the mathematical model for that reason. Only a schematic model has been built, as shown in Figure 14.
The model is based on the sources of resistance to motion. These are friction, deformation of the contact surfaces and elastic deformation of the machine structure. All three sources cause non-linearity between load and position change [7].
In the general case of loading, the mean position of all components is considered. In this case, the sliding determined by friction resistance is completed first. With increased load, the contact surfaces with an oil layer in between are starting to deform. Finally, the support parts are elastically deformed. This holds when the table does not move and the load is applied gradually. Following relieving and reloading in the same direction, the stiffness is considerably greater (Experiment 1). This is due to the fact that the effect of friction and contact surfaces is considerably smaller in the second round of load application. Delimitation of backlash and deformation of the contact surfaces has a certain capacity for pliability, which has decreased with the load. This capacity can be restored only by moving the elements to which the load is applied.
A significant difference is the case with the table assuming a given position under the load (Experiments 2 and 3). In this case, the effect of friction and contact surfaces is greater. The capacity for pliability is not reduced as much as in the case of a stationary load. The stiffness is lower despite the fact that the direction of constant load (for example Fr) has not changed.
In the first experiment, a reference point R1, which remains unchanged with respect to the machine’s co-ordinate system, was used. Measured displacement values A also included the influence of temperature, drive non-linearity, control errors, and the like. To assess stiffness, the slope of the load trend was essential. The absolute deviation value from that of the reference value for stiffness is irrelevant.
In the second and third experiments the reference point R2 was used. This eliminated the effects of some sources of inaccuracy. In particular, the effect of the thermal shift was reduced.
Measurement of the dead zone B was not investigated. Although this component has a considerable effect on accuracy, its effect on stiffness is minimal. The dead band is measured according to the ISO 230-2 [34] standard.
5. Discussion
It follows from the experiments that the classic measurement of machine stiffness does not reveal deficiencies of structure in terms of the quality of the guides and the arrangement of the machine. Obtained stiffness values are in the order of three times higher than those measured in course of sliding into the measured value. Yet the method of sliding the moving parts to which the load is applied models the real state of matters during machining clearly better.
Experiments show that, for example, the pair of machines compared with the same stiffness values obtained by classic measurement may have significantly different SSaS stiffness values. The experimental verification measurement of this sliding stiffness can be performed as shown above. Thus, the potential customer is able to verify the static stiffness of the machine in more realistic conditions.
The SSaS stiffness measurements show that in order to delimit the backlash, the previous load must be applied in the same direction. In that case, the stiffness will be higher even after the sliding. Frequent changes in the direction of load applied during machining will keep the machine system much less rigid than the measured data on static stiffness suggest. The findings of the machine’s actual behavior can be used in designing new design concepts.
In order to best capture the measured variables and all aspects of the effects on stiffness, it is appropriate to look for progressive methods and devices capable of capturing maximum optimization variables, such as those described in [35].
5.1. Proposed Design Concepts of High-Precision Machines
The design concept of high-precision machines is based on experimental findings. The measurements showed a low stiffness of the table due to lack of backlash delimitation. In practice, this problem is addressed by preloaded guides and preloaded ball screws. This, however, is not enough. In addition, the preload increases the dimensioning requirements, the quality of the materials used, the accuracy and the service life of the components to which the load is applied. They increase resistance to motion and thus they are a greater source of heat, and at the same time aggravate the absorptive properties. Proposed measures:
- (a)
- All instances of load application during machining should be only in one direction (described in Section 5.1.1).
- (b)
- Preload should be applied only where higher demands are placed on the production accuracy (described in Section 5.1.2).
In connection with the proposed measures, we present the following suggestions for structural modifications.
5.1.1. A One-Sided Preload in Machine Guide
The guide preload force in the sliding part of the machine is exerted only in one direction by the system of weights, as shown in Figure 15. Instead of the system of weights, another system may also be used, for example, a pneumatic system; but where the uplift is large, additional structural problems arise. The preload should be greater than the cutting forces emerging during machining. This will ensure that even in the opposite direction of the cutting action the direction of the preload does not change.
The preload is necessary to make use of a steeper part of the stiffness characteristics if the stiffness of the work space is non-linear.
During the motion of the slide as well as immediately after their motion is completed, the preload reduces the negative impact of the low stiffness of the surfaces on which the load is applied.
5.1.2. Preload Control Where Higher Demands Are Placed on Production Precision
In order for this idea to materialize, it is necessary to create a structural device which engages and disengages the loads designated to generate preload in the guides. The importance of solving this point is mainly due to energy savings during machining. The basic principle lies in the idea that if weights are involved, energy consumption increases when the table is moving. At the same time the preload is higher, translating into higher stiffness and accuracy.
6. Conclusions
Measurement of static stiffness is performed under load during positioning of the working axis. Measurement was performed on a tri axis CNC milling machine tool. Since the modified measurement of static stiffness takes place immediately after the start of the programmed position, the stiffness measurement results reflect the actual circumstances occurring during machining more faithfully.
The classic stiffness measurement returned stiffness values up to three times greater than those yielded by the modified method using identical instruments and conditions. The reasons for such a considerable difference in stiffness stem from the arrangement of the structure and the influence of non-linearities on the contact surfaces of the sliding table components. The measurement is performed immediately after the movement. It can be stated that the measurement is carried out in the static load area. During the measurement, all parts of the machine were stationary.
The SSaS stiffness concept is introduced to make a difference between static stiffness and stiffness in motion, or immediately upon the completion of the machine’s sliding. This is not a dynamic stiffness measurement, so it is appropriate to introduce a new concept of distinction.
Measurement of stiffness by laser interferometer brings new possibilities of evaluation, which are not feasible in case of classic measurement by dial micrometer indicator. As it follows from the measured results, the static stiffness depends on both, the previous manner of load application and the direction in which the measured position is assumed. The proposed SSaS stiffness measurement methodology allows for a better assessment of the machine’s working ability. It also allows for detection of faults caused by, for example, incorrect assembly of machine components. The method also points to the machine’s design deficiencies, which would not demonstrate in classic stiffness measurement.
Due to a considerable difference between the SSaS and static stiffness, a conceptual design of new types of high-precision machine structure has been executed and introduced.
Acknowledgments
This research work was supported by projects: APVV-15-0149 “Research of new measuring methods of machine condition”, VEGA 1/0437/17 “Research and development of rotary module with an unlimited degree rotation”, KEGA 039TUKE-4/2016 “Creating of virtual laboratories based on WEB technologies to support the educational process in the field of Manufacturing Machinery”, VEGA 1/0224/18 Research and development of testing and measuring methods in coordinate metrology and VEGA 1/124/15 “Research and development of advanced methods for virtual prototyping of manufacturing machines”.
Author Contributions
Tomáš Stejskal suggested the concept of rigidity after shifts; Ján Kráľ and Peter Demeč performed experimental measurements; Tomáš Stejskal and Jozef Svetlík analyzed the measured data; Tomáš Stejskal and Miroslav Dovica proposed a concept for the use of high-precision machinery; Tomáš Stejskal and Jozef Svetlík wrote the paper.
Conflicts of Interest
The authors declare no conflict of interest. The founding sponsors had no role in the design of the study; in the collection, analyses, or interpretation of data; in the writing of the manuscript, and in the decision to publish the results.
References
- Šooš, L. Dynamic Analysis Spindel-Bearings System (SBS) of the Headstock Machine Tools. In 14th Conference on Applied Mathematics, Proceedings of the APLIMAT 2015—14th Conference on Applied Mathematics, Bratislava, Slovakia, 3–5 February 2015; Slovak University of Technology in Bratislava: Bratislava, Slovakia, 2015. [Google Scholar]
- Chen, X.B.; Geddam, A.; Yuan, Z.J. Accuracy improvement of three-axis CNC machining centers by quasi-static error compensation. J. Manuf. Syst. 1997, 16, 323–336. [Google Scholar] [CrossRef]
- Lin, M.T.; Wu, S.K. Modeling and improvement of dynamic contour errors for five-axis machine tools under synchronous measuring paths. Int. J. Mach. Tools Manuf. 2013, 72, 58–72. [Google Scholar] [CrossRef]
- Panda, A.; Duplák, J.; Vasilko, K. Comprehensive Identification of Durability for Selected Cutting Tool Applied on the Base of Taylor Dependence. In ICMST 2013, Proceedings of the 2nd International Conference on Materials Science and Technology, Hong Kong, China, 11–12 April 2013; Advanced Materials Research: Hong Kong, China, 2013. [Google Scholar]
- Baron, P.; Kočiško, M.; Dobránsky, J.; Pollák, M.; Telišková, M. Research and application of methods of technical diagnostics for the verification of the design node. Measurement 2016, 96, 245–253. [Google Scholar] [CrossRef]
- Baron, P.; Kočiško, M.; Blaško, L.; Szentivanyi, P. Verification of the operating condition of stationary industrial gearbox through analysis of dynamic signal, measured on the pinion bearing housing. Measurement 2017, 96, 24–33. [Google Scholar] [CrossRef]
- De Marchi, J.A. Modeling of Dynamic Friction, Impact Backlash and Elastic Compliance Nonlinearities in Machine Tools, with Applications to Asymmetric Viscous and Kinetic Friction Identification. Ph.D. Thesis, Rensselear Polytechnic Institute, New York, NY, USA, December 1998. [Google Scholar]
- Mayr, J.; Jedrzejewski, J.; Uhlmann, E.; Donmez, M.A.; Mayr, J.; Jedrzejewski, J.; Uhlmann, E.; Donmez, M.A.; Brecher, C.; Wurz, T.; et al. Thermal issues in machine tools. CIRP Ann. Manuf. Technol. 2012, 61, 771–791. [Google Scholar] [CrossRef]
- Brecher, C.; Wissmann, A. Modelling of Thermal Behaviour of a Milling Machine due to Spindle Load. In Proceedings of the 12th CIRP Conference on Modelling of Machining Operations 2009, Donostia-San Sebastián, Spain, 7–8 May 2009; Arrazola, P.J., Ed.; Mondragon University: Arrasate-Mondragón, Spain, 2009. [Google Scholar]
- Wang, Y.; Zhang, G.; Moon, K.S.; Sutherland, J.W. Compensation for the thermal error of a multi-axis machining center. J. Mater. Process. Technol. 1998, 75, 45–53. [Google Scholar] [CrossRef]
- Donmez, M.A.; Hahn, M.H.; Soons, J.A. A Novel Cooling System to Reduce Thermally-Induced Errors of Machine Tools. CIRP Ann. Manuf. Technol. 2007, 56, 521–524. [Google Scholar] [CrossRef]
- Gebhardt, M.; Mayr, J.; Furrer, N.; Widmer, T.; Weikert, S.; Knapp, W. High precision grey-box model for compensation of thermal errors on five-axis machines. CIRP Ann. Manuf. Technol. 2014, 63, 509–512. [Google Scholar] [CrossRef]
- Mayr, J.; Ess, M.; Weikert, S.; Wegener, K. Comparing Different Cooling Concepts for Ball Screw Systems. In Proceedings of the 25th Annual Meeting of the American Society for Precision Engineering, Atlanta, United States, 31 October–4 November 2010; Institute of Machine Tools and Manufacturing and Swiss Federal Institute of Technology: Zurich, Switzerland, 2010. [Google Scholar]
- Šooš, Ľ.; Križan, P.; Matúš, M.; Beniak, J. New design of the headstock—Generator for creating folded rotary motion. Int. J. Mech. 2015, 9, 246–251. [Google Scholar]
- Huang, D.T.-Y.; Lee, J.-J. On obtaining machine tool stiffness by CAE techniques. Int. J. Mach. Tools Manuf. 2001, 41, 1149–1163. [Google Scholar] [CrossRef]
- Altintas, Y.; Brecher, C.; Weck, M.; Witt, S. Virtual machine tool. CIRP Ann. 2005, 54, 115–138. [Google Scholar] [CrossRef]
- Archenti, A.; Nicolescu, M. A top-down equivalent stiffness approach for prediction of deviation sources in machine tool joints. CIRP Ann. Manuf. Technol. 2017, 66, 487–490. [Google Scholar] [CrossRef]
- Archenti, A.; Nicolescu, C.M.; Hjelm, S.; Johansson, S. Loaded double ball bar for capability testing of NC machine tools. Mech. Syst. Signal Process. 2010. [Google Scholar]
- Archenti, A. Model-Based Investigation of Machining Systems Characteristics: Static and Dynamic Stability Analysis. Licentiate Thesis, Royal Institute of Technology, Stockholm, Sweden, 15 December 2008. [Google Scholar]
- Hufenbach, W.; Adam, F.; Pohl, M.; Spitzer, S.; Weck, D. Conception and Manufacturing of a Lightweight Leaf Spring with Adjustable Spring Rate. In Proceedings of the 18th International Conference on Composites Materials, Jeju, Korea, 21–26 August 2011; Technische Universität: Dresden, Germany, 2011. [Google Scholar]
- Behrens, B.A.; Bouguecha, A.; Krimm, R.; Matthias, T.; Salfeld, V. Characterization of Horizontal Loads in the Production of Asymmetrical Parts. In Key Engineering Materials, Proceedings of the 14th International Conference on Sheet Metal, Leuven, Belgium, 18–20 April 2011; Trans Tech Publications: Zurich, Switzerland, 2011. [Google Scholar]
- Lee, R.M.; Chen, T.C. Adaptive Control of Active Magnetic Bearing against Milling Dynamics. Appl. Sci. 2016, 6. [Google Scholar] [CrossRef]
- Huang, T.; Chen, Z.; Zhang, H.T.; Ding, H. Active Control of an Active Magnetic Bearings Supported Spindle for Chatter Suppression in Milling Process. J. Dyn. Syst. Meas. Control-Trans. ASME 2015, 137, 111003. [Google Scholar] [CrossRef]
- Zhang, Y.; Li, X.; Hong, J.; Yan, K.; Wang, S. Investigation of multiple spindle characteristics under non-uniform bearing preload. Adv. Mech. Eng. 2016, 8, 1–12. [Google Scholar] [CrossRef]
- Takabi, J.; Khonsari, M.M. On the thermally-induced failure of rolling element bearings. Tribol. Int. 2016, 94, 661–674. [Google Scholar] [CrossRef]
- Mundim, R.B.; Borille, A.V. An approach for reducing undesired vibrations in milling of low rigidity structures. Int. J. Adv. Manuf. Technol. 2017, 88, 971–983. [Google Scholar] [CrossRef]
- Božek, P.; Lozkin, A.; Gorbushin, A. Geometrical Method for Increasing Precision of Machine Building Parts. In Procedia Engineering, Proceedings of the International Conference on Manufacturing Engineering and Materials, Nový Smokovec, Slovakia, 6–10 June 2016; Hloch, S., Krolczyk, G., Eds.; Elsevier Ltd.: Amsterdam, The Netherlands, 2016. [Google Scholar]
- Ratchev, S.; Liu, S.; Huang, W.; Becker, A.A. Milling error prediction and compensation in machining of low-rigidity parts. Int. J. Mach. Tools Manuf. 2004, 44, 1629–1641. [Google Scholar] [CrossRef]
- Ratchev, S.; Govender, E.; Nikov, S.; Phuah, K.; Tsiklos, G. Force and deflection modelling in milling of low-rigidity complex parts. J. Mater. Process. Technol. 2003, 143, 796–801. [Google Scholar] [CrossRef]
- Ratchev, S.; Govender, E.; Nikov, S. Towards deflection prediction and compensation in machining of low-rigidity parts. Proc. Inst. Mech. Eng. Part B-J. Eng. Manuf. 2002, 216, 129–134. [Google Scholar] [CrossRef]
- Nikitin, Y.; Turygin, Y.; Sosnovich, E.; Bozek, P. Trends in Control of NC Machines. In Procedia Engineering, Proceedings of the International Conference on Manufacturing Engineering and Materials, Nový Smokovec, Slovakia, 6–10 June 2016; Hloch, S., Krolczyk, G., Eds.; Elsevier: Amsterdam, The Netherlands, 2016. [Google Scholar]
- Svendsen, C.; Thomsen, J.; Nielsen, S.E. Dynamic Transfer Stiffness of Suspension Springs and Discharge Tubes in Hermetic Reciprocating Compressors. In Proceedings of the International Compressor Engineering Conference, Flensburg, Germany, 12–15 July 2010; Purdue University: Flensburg, Germany, 2010. [Google Scholar]
- Holland, C.; Kinsey, J.E.; Deboo, J.C.; Burrell, K.H.; Luce, T.C.; Smith, S.P.; Petty, C.C.; White, A.E.; Rhodes, T.L.; Schmitz, L.; et al. Validation studies of gyrofluid and gyrokinetic predictions of transport and turbulence stiffness using the DIII-D tokamak. Nucl. Fusion 2013, 53, 083027. [Google Scholar] [CrossRef]
- ISO 230-2. In Machine Tools—Test Code for Machine Tools—Part 2: Determination of Accuracy and Repeatability of Positioning of Numerically Controlled Axes, 4th ed.; ISO: Geneva, Switzerland, 2014; p. 43.
- Qin, Y.; Zhao, Y.; Li, Y.; Zhao, Y.; Wang, P. A novel dynamometer for monitoring milling process. Int. J. Adv. Manuf. Technol. 2017, 92, 2535–2543. [Google Scholar] [CrossRef]
Figure 1.
Diagram of the kinematic chain of the cross table with critical contact points marked with a circle.
Figure 1.
Diagram of the kinematic chain of the cross table with critical contact points marked with a circle.
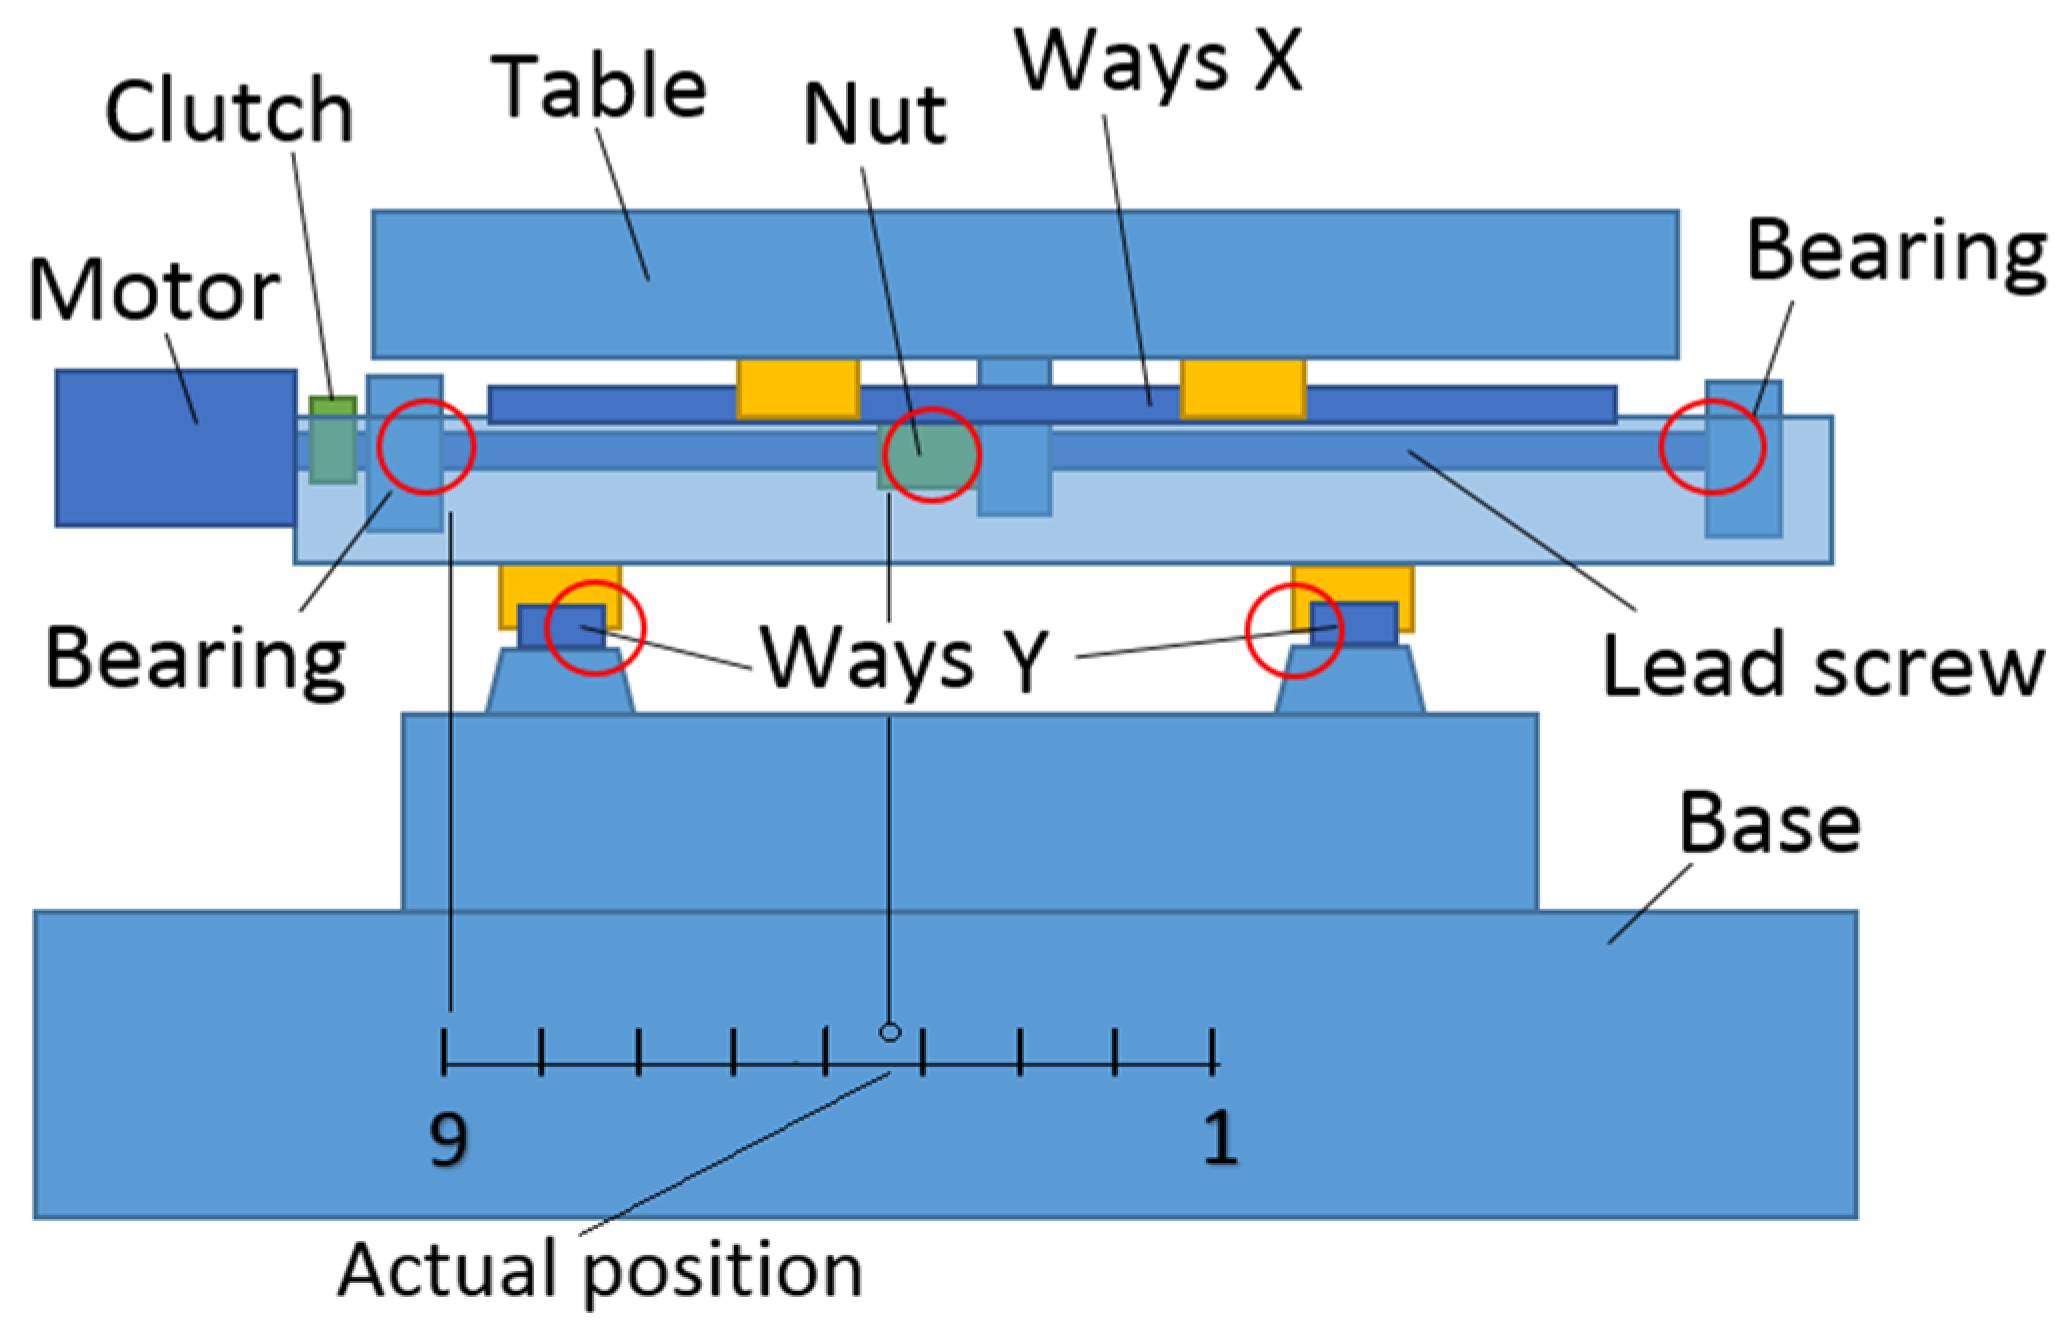
Figure 2.
The first measurement scenario scheme. Frij—Force in the “r” direction, applied in the “i” position, with the load “j”. Fr3j—Force in third position, applied and relieved.
Figure 2.
The first measurement scenario scheme. Frij—Force in the “r” direction, applied in the “i” position, with the load “j”. Fr3j—Force in third position, applied and relieved.

Figure 3.
Measurement layout in the X axis direction on the sliding (cross) table of the milling machine.
Figure 3.
Measurement layout in the X axis direction on the sliding (cross) table of the milling machine.
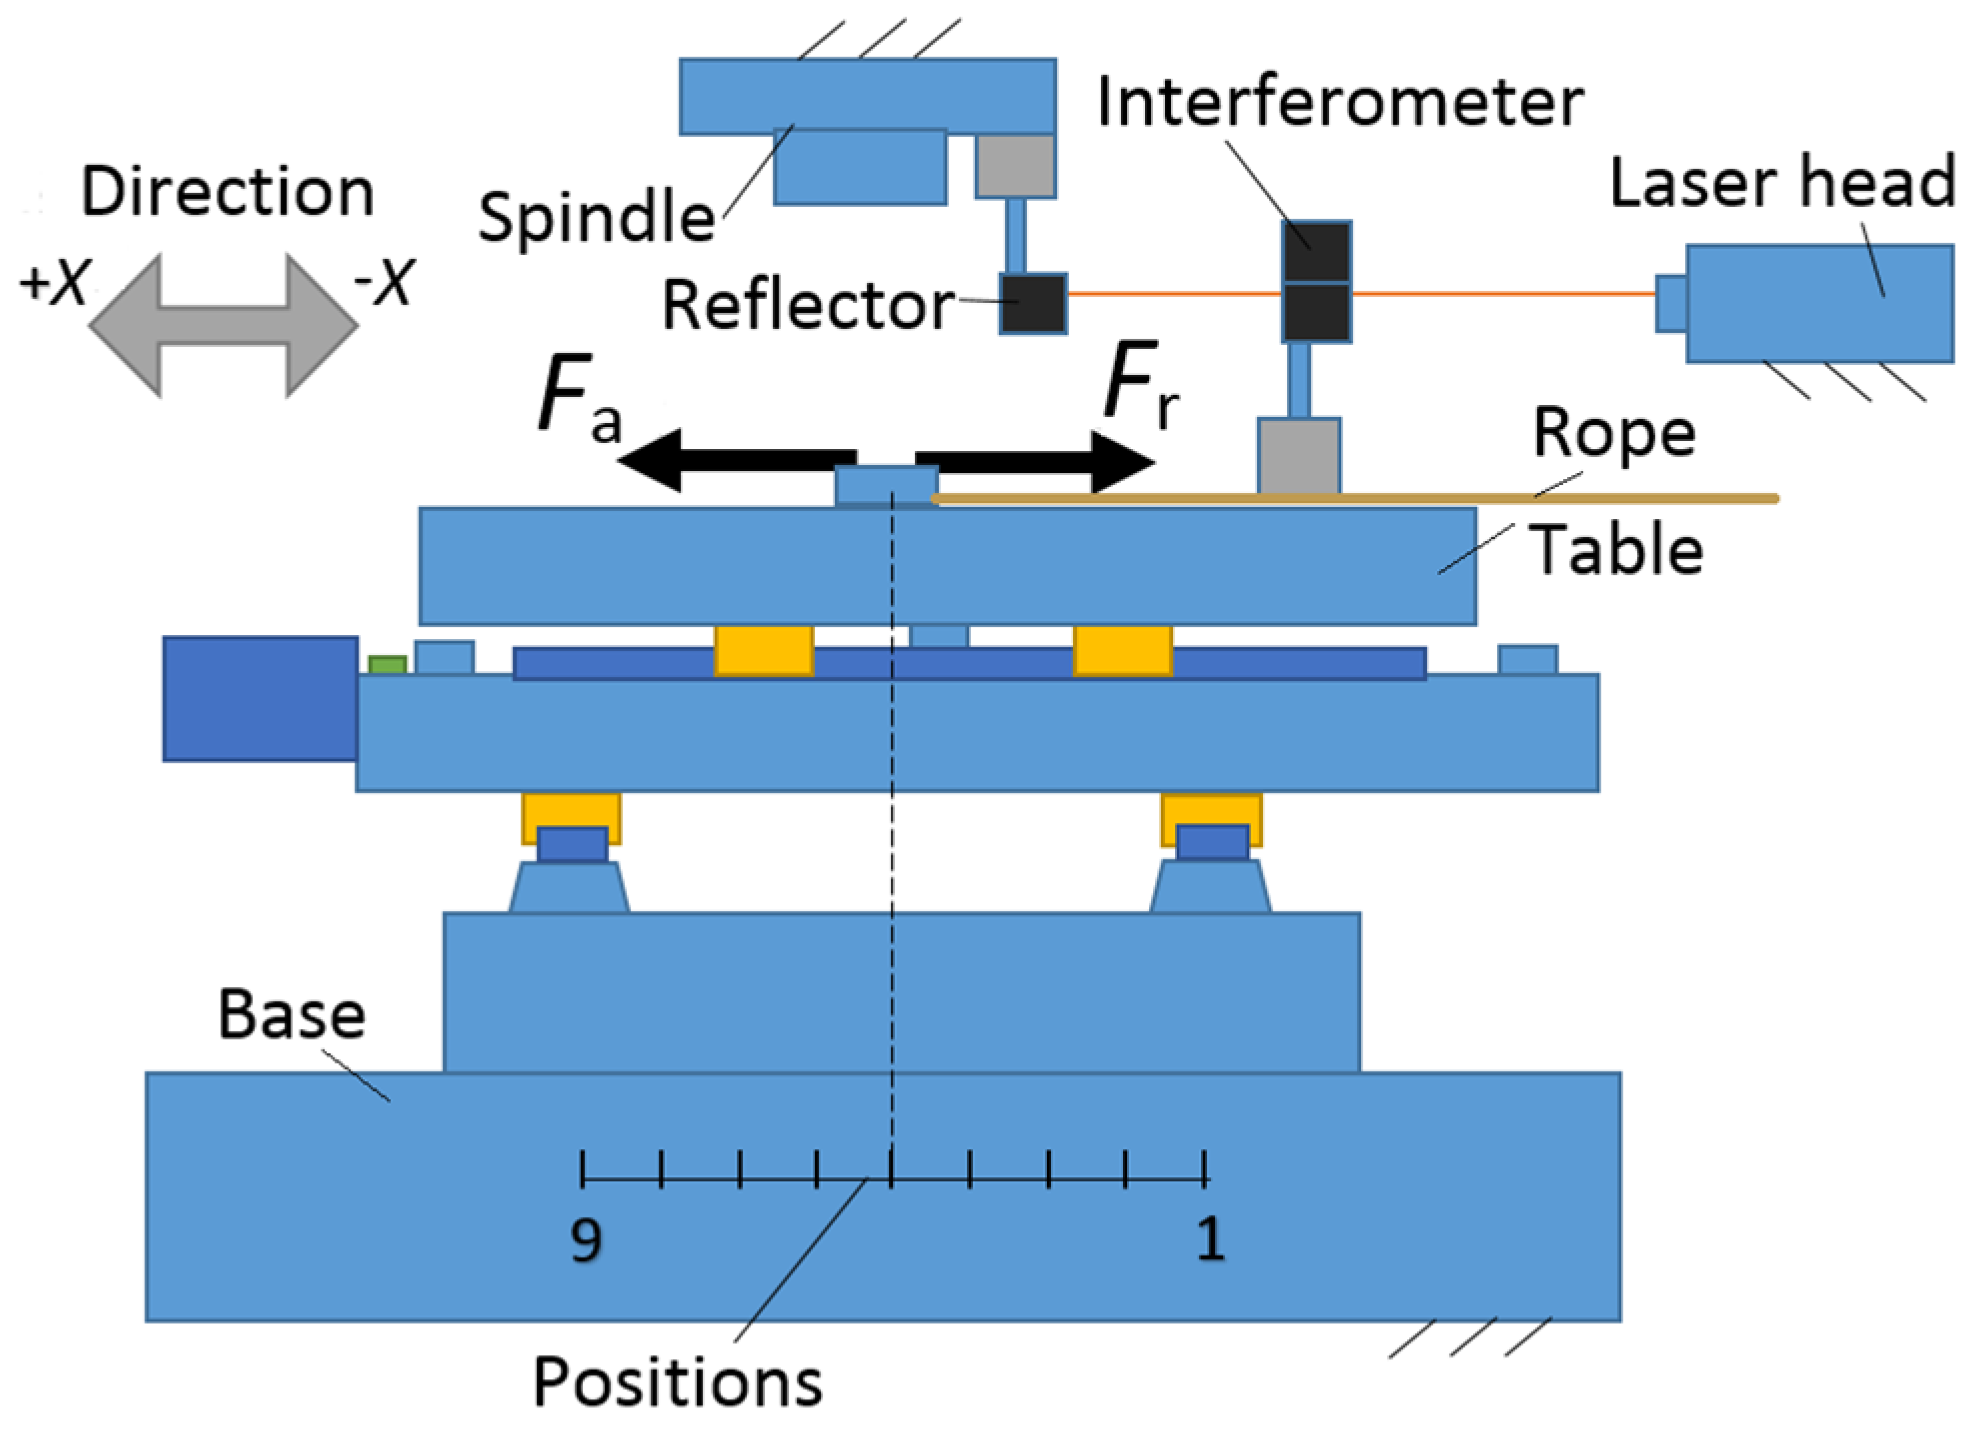
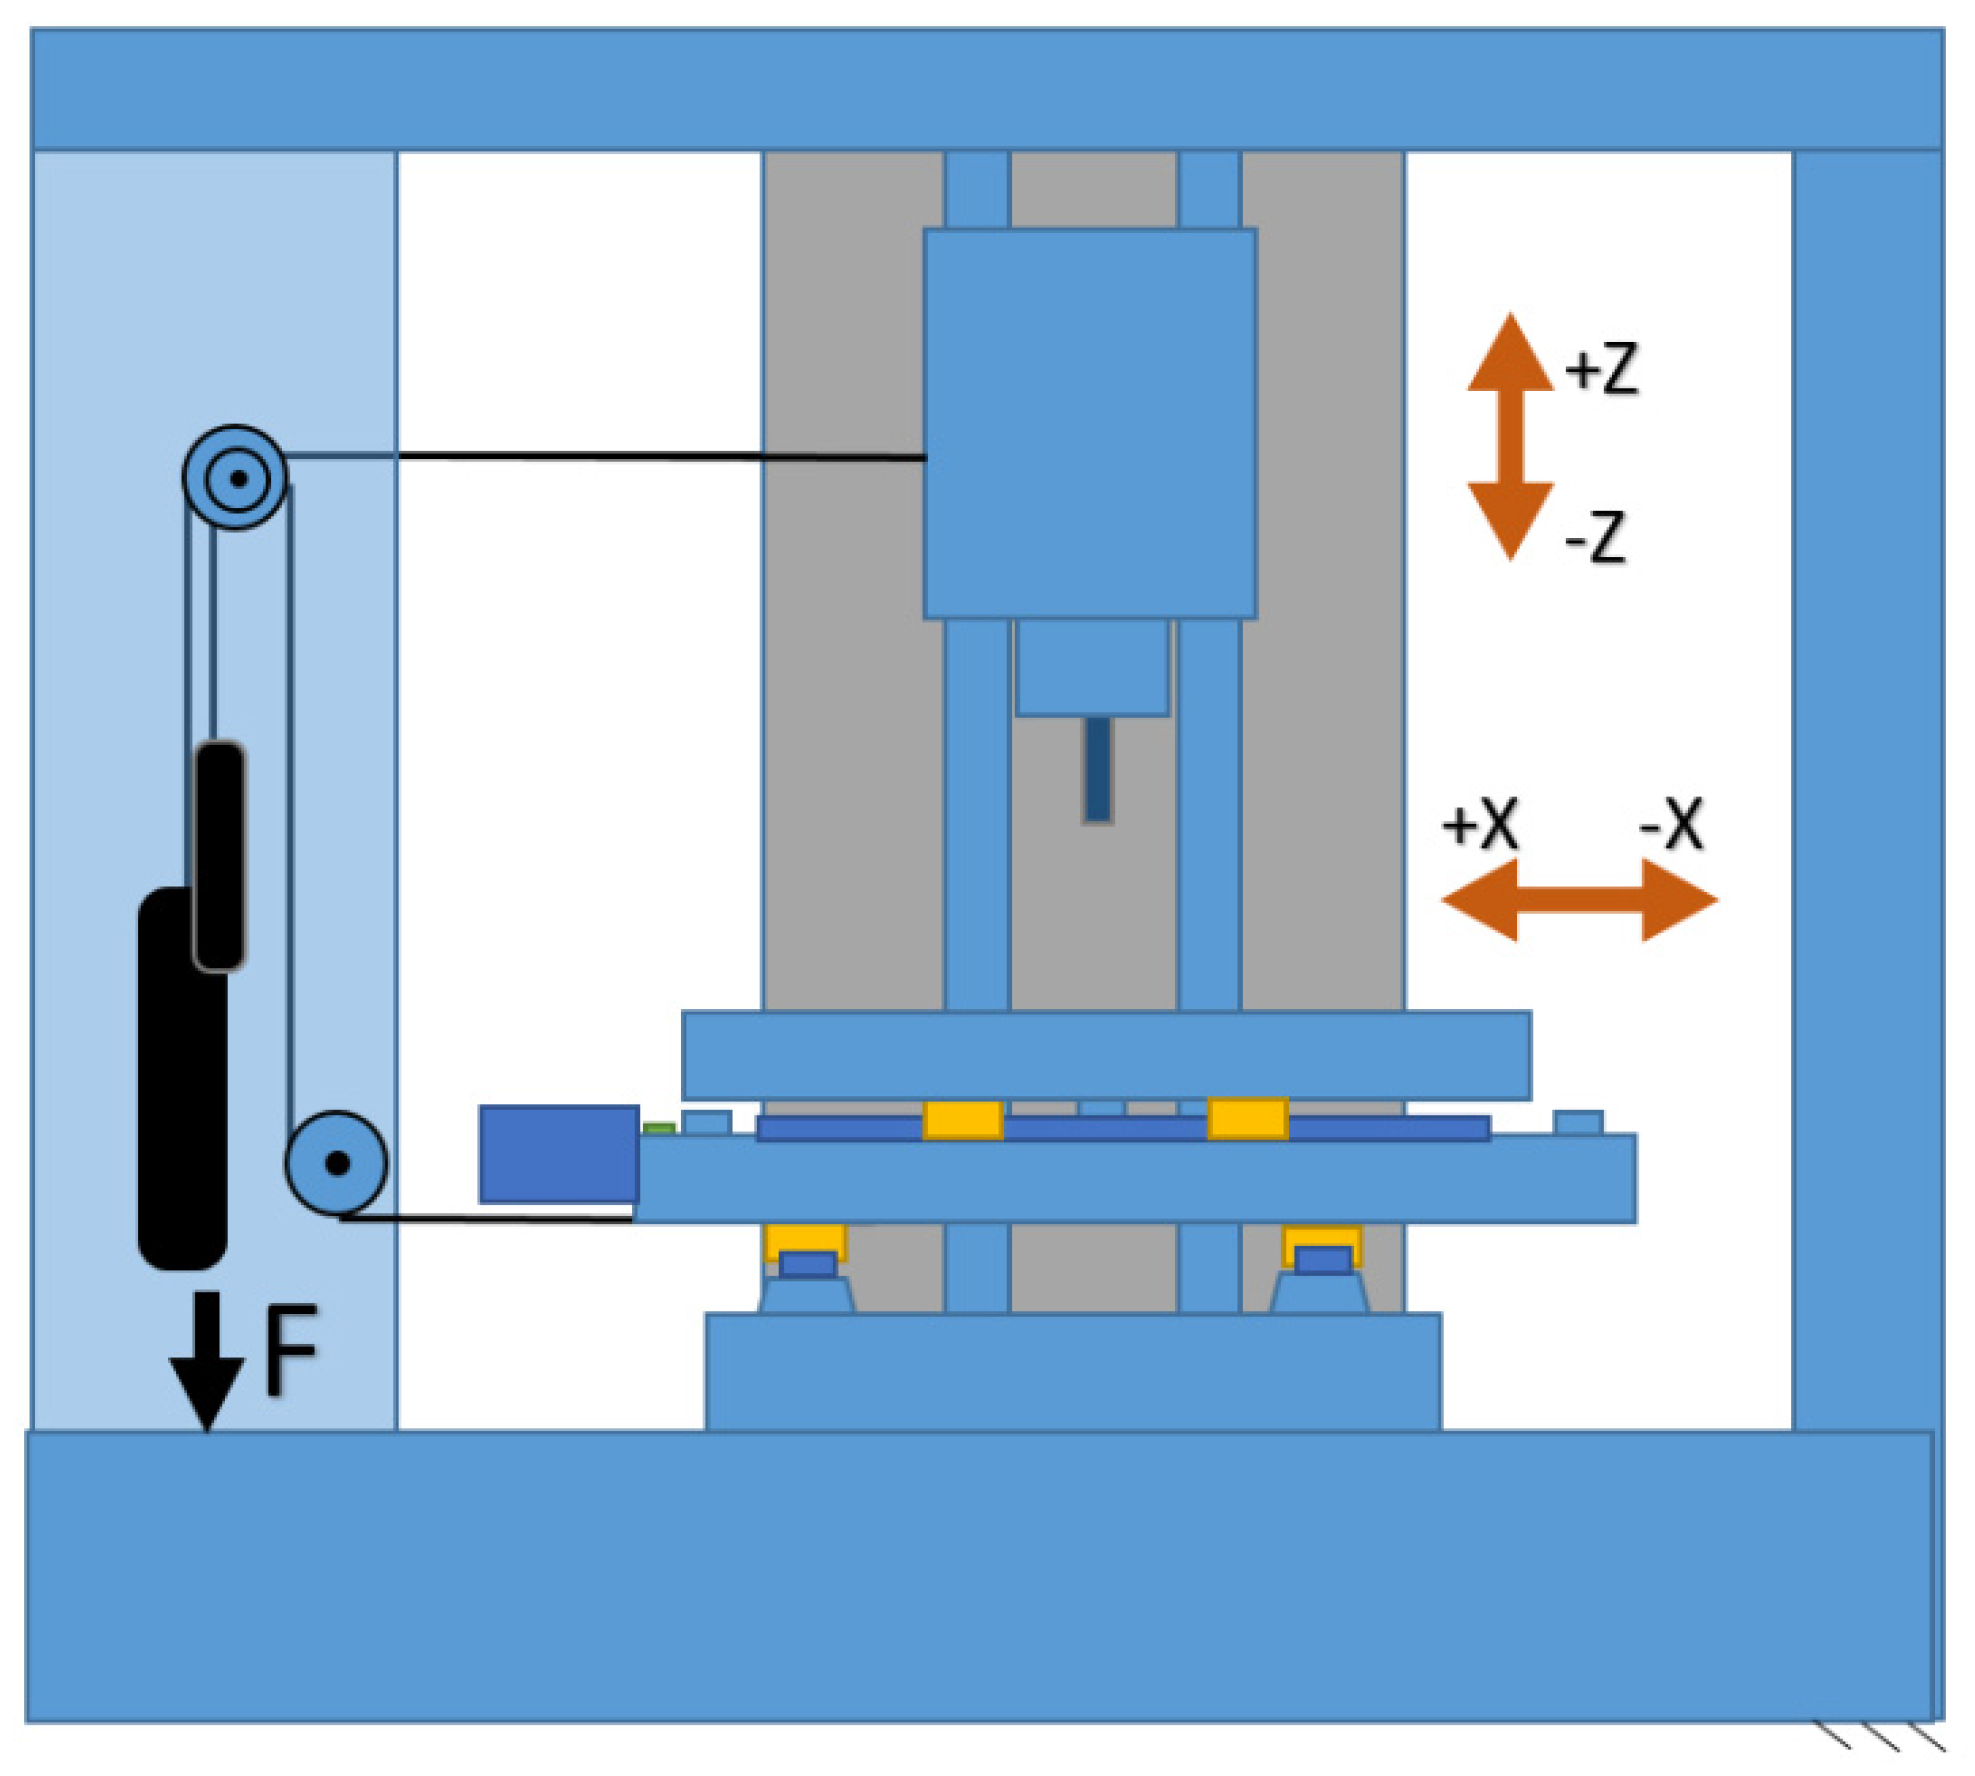
Figure 4.
(a) Application of the load to the table through a rope mechanism—axis X; (b) Reflector and interferometer arrangement in the workspace of the milling machine.
Figure 4.
(a) Application of the load to the table through a rope mechanism—axis X; (b) Reflector and interferometer arrangement in the workspace of the milling machine.

Figure 5.
Second measurement scenario scheme. Frij—Force in the “r” direction, in the “i” position, with the load “j”. Fri1—Load value as a force applied in the first cycle.
Figure 5.
Second measurement scenario scheme. Frij—Force in the “r” direction, in the “i” position, with the load “j”. Fri1—Load value as a force applied in the first cycle.

Figure 6.
The third measurement scenario scheme. Frij—Force in the “r” direction, in the “i” position, with the load “j”. Fri1—Force applied in the first cycle, demonstrated as the first load value.
Figure 6.
The third measurement scenario scheme. Frij—Force in the “r” direction, in the “i” position, with the load “j”. Fri1—Force applied in the first cycle, demonstrated as the first load value.

Figure 7.
Vertical milling machine Kondia B 640 CNC.

Figure 8.
Stiffness measurement at position 8 (second round of load application). Trend line slope defines stiffness (169 N/μm).
Figure 8.
Stiffness measurement at position 8 (second round of load application). Trend line slope defines stiffness (169 N/μm).
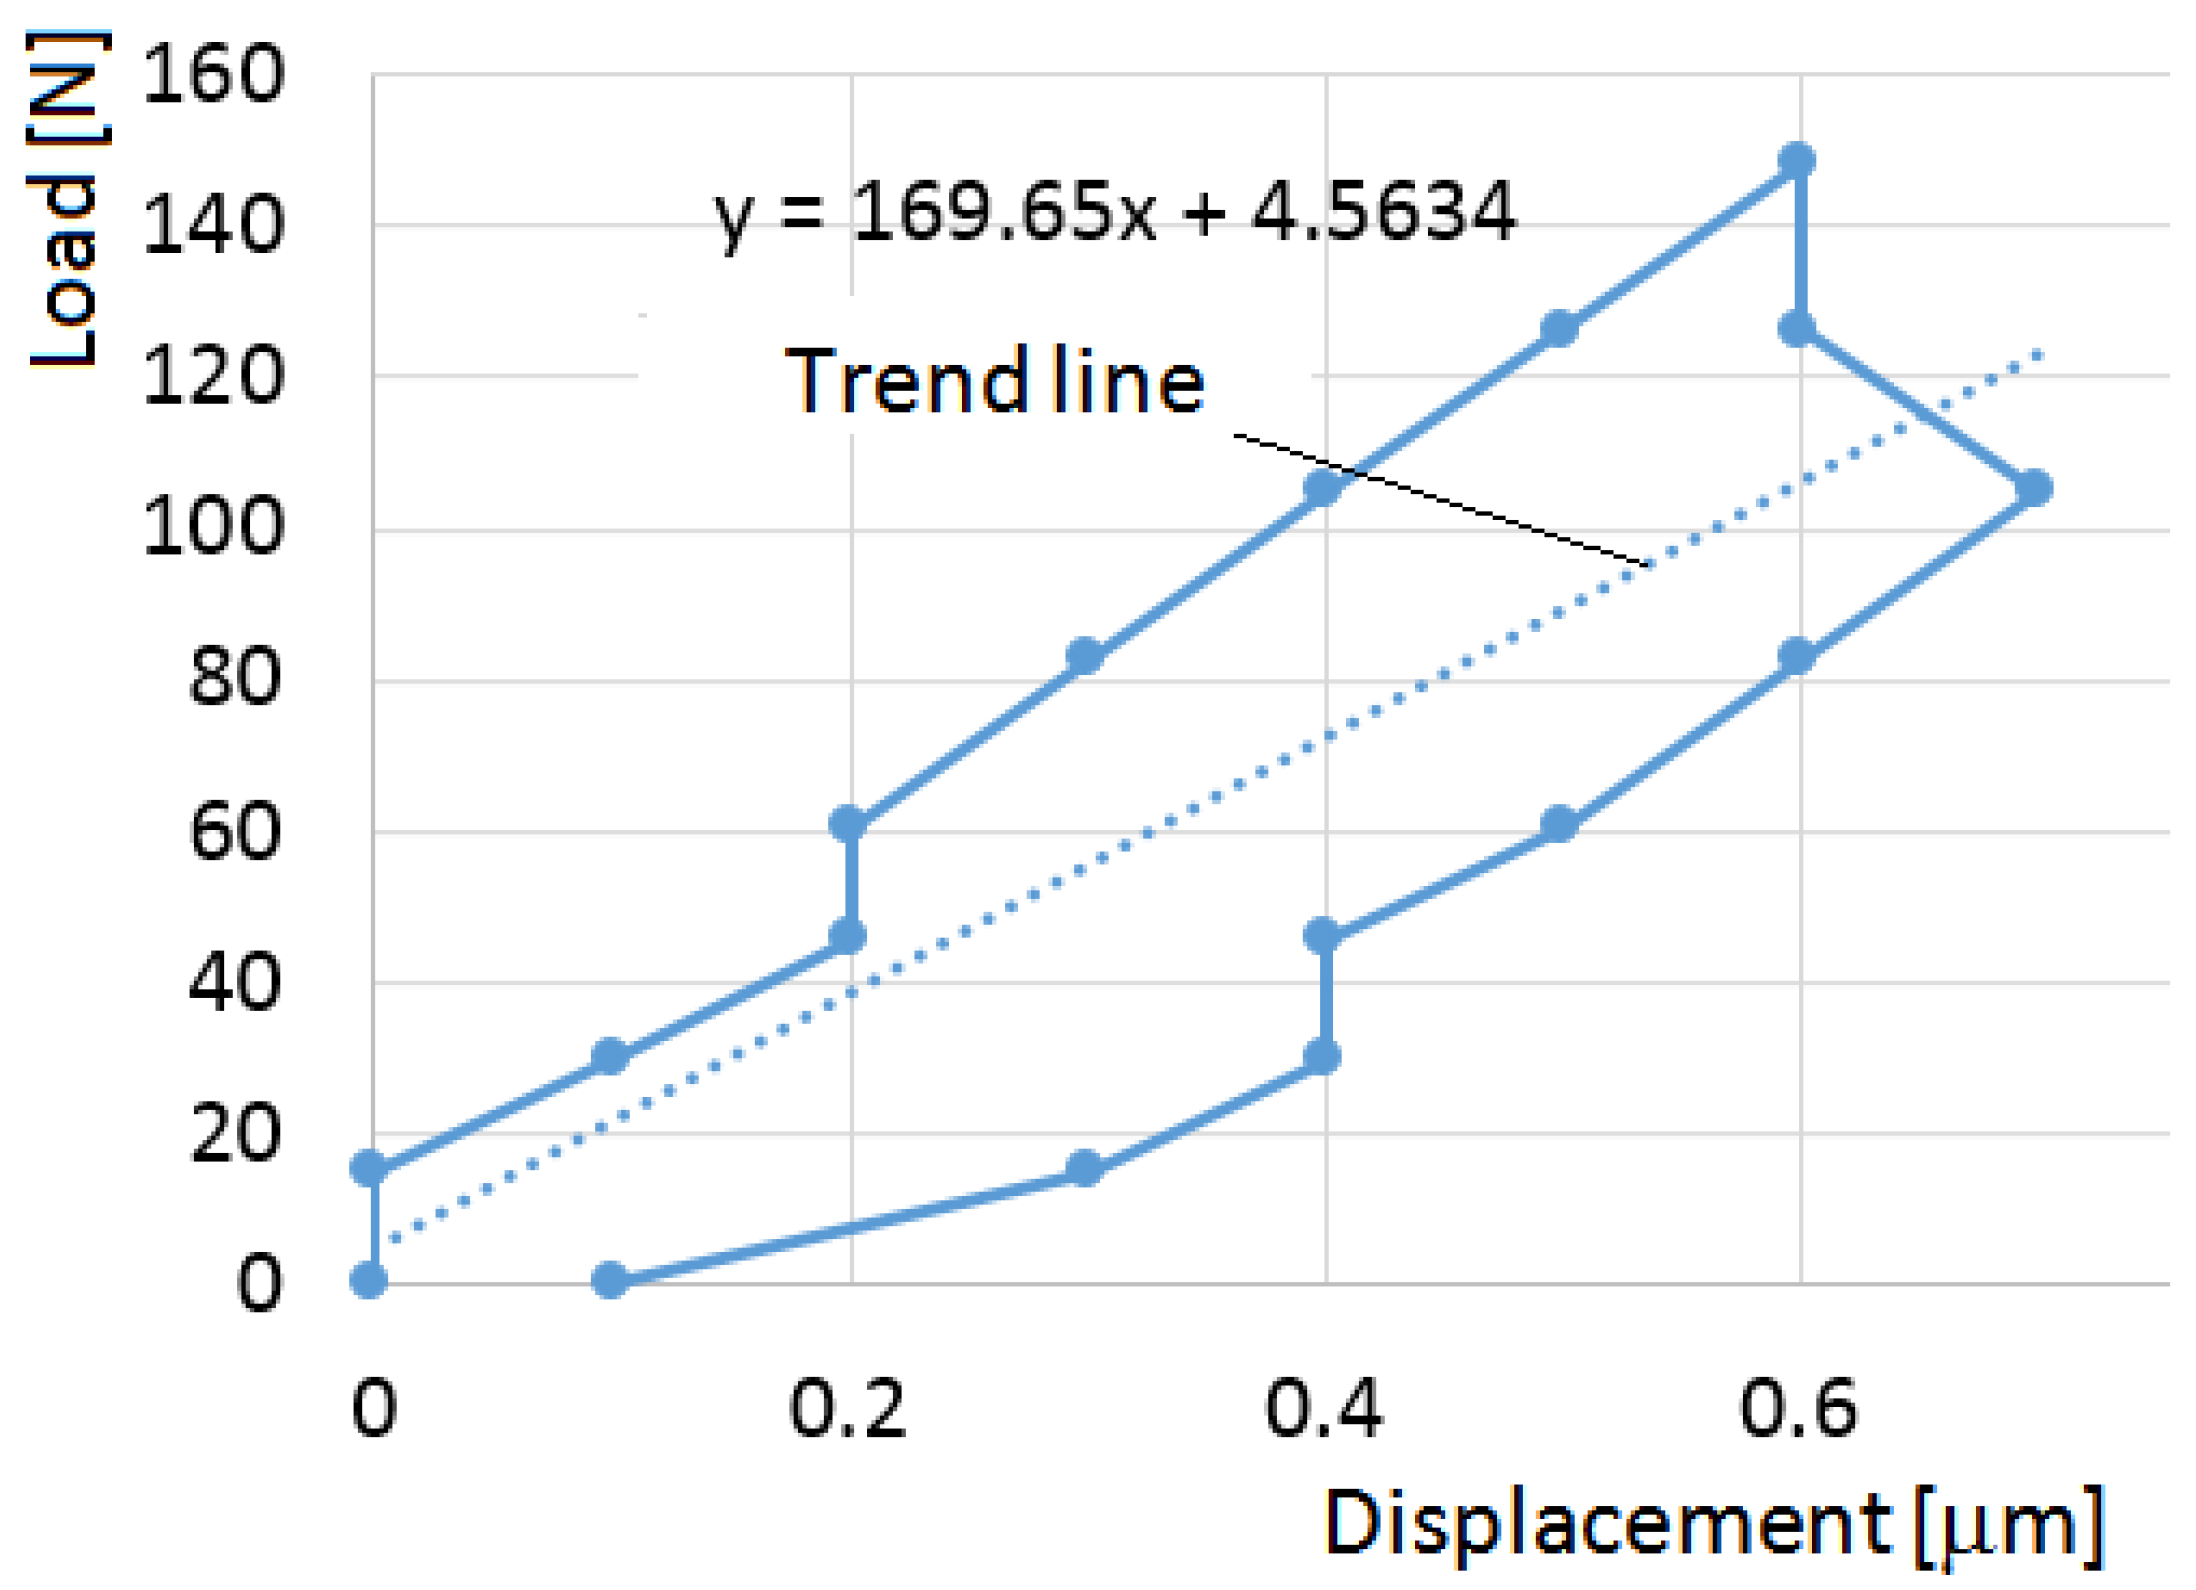
Figure 9.
Gradual thermal shift of the first position during 9 load-free cycles. The trend line equation determines the direction.
Figure 9.
Gradual thermal shift of the first position during 9 load-free cycles. The trend line equation determines the direction.

Figure 10.
Static stiffness characteristic at position 5 in the run in +X direction.

Figure 11.
The stiffness course under all three methods with Fr force in the +X direction (full line), −X (dotted line).
Figure 11.
The stiffness course under all three methods with Fr force in the +X direction (full line), −X (dotted line).

Figure 12.
Comparison of the degree of (a) static stiffness; (b) Experiment 3—Static Stiffness after Sliding (SSaS) in +X direction; (c) Experiment 3—SSaS stiffness in the X-direction (force Fa).
Figure 12.
Comparison of the degree of (a) static stiffness; (b) Experiment 3—Static Stiffness after Sliding (SSaS) in +X direction; (c) Experiment 3—SSaS stiffness in the X-direction (force Fa).
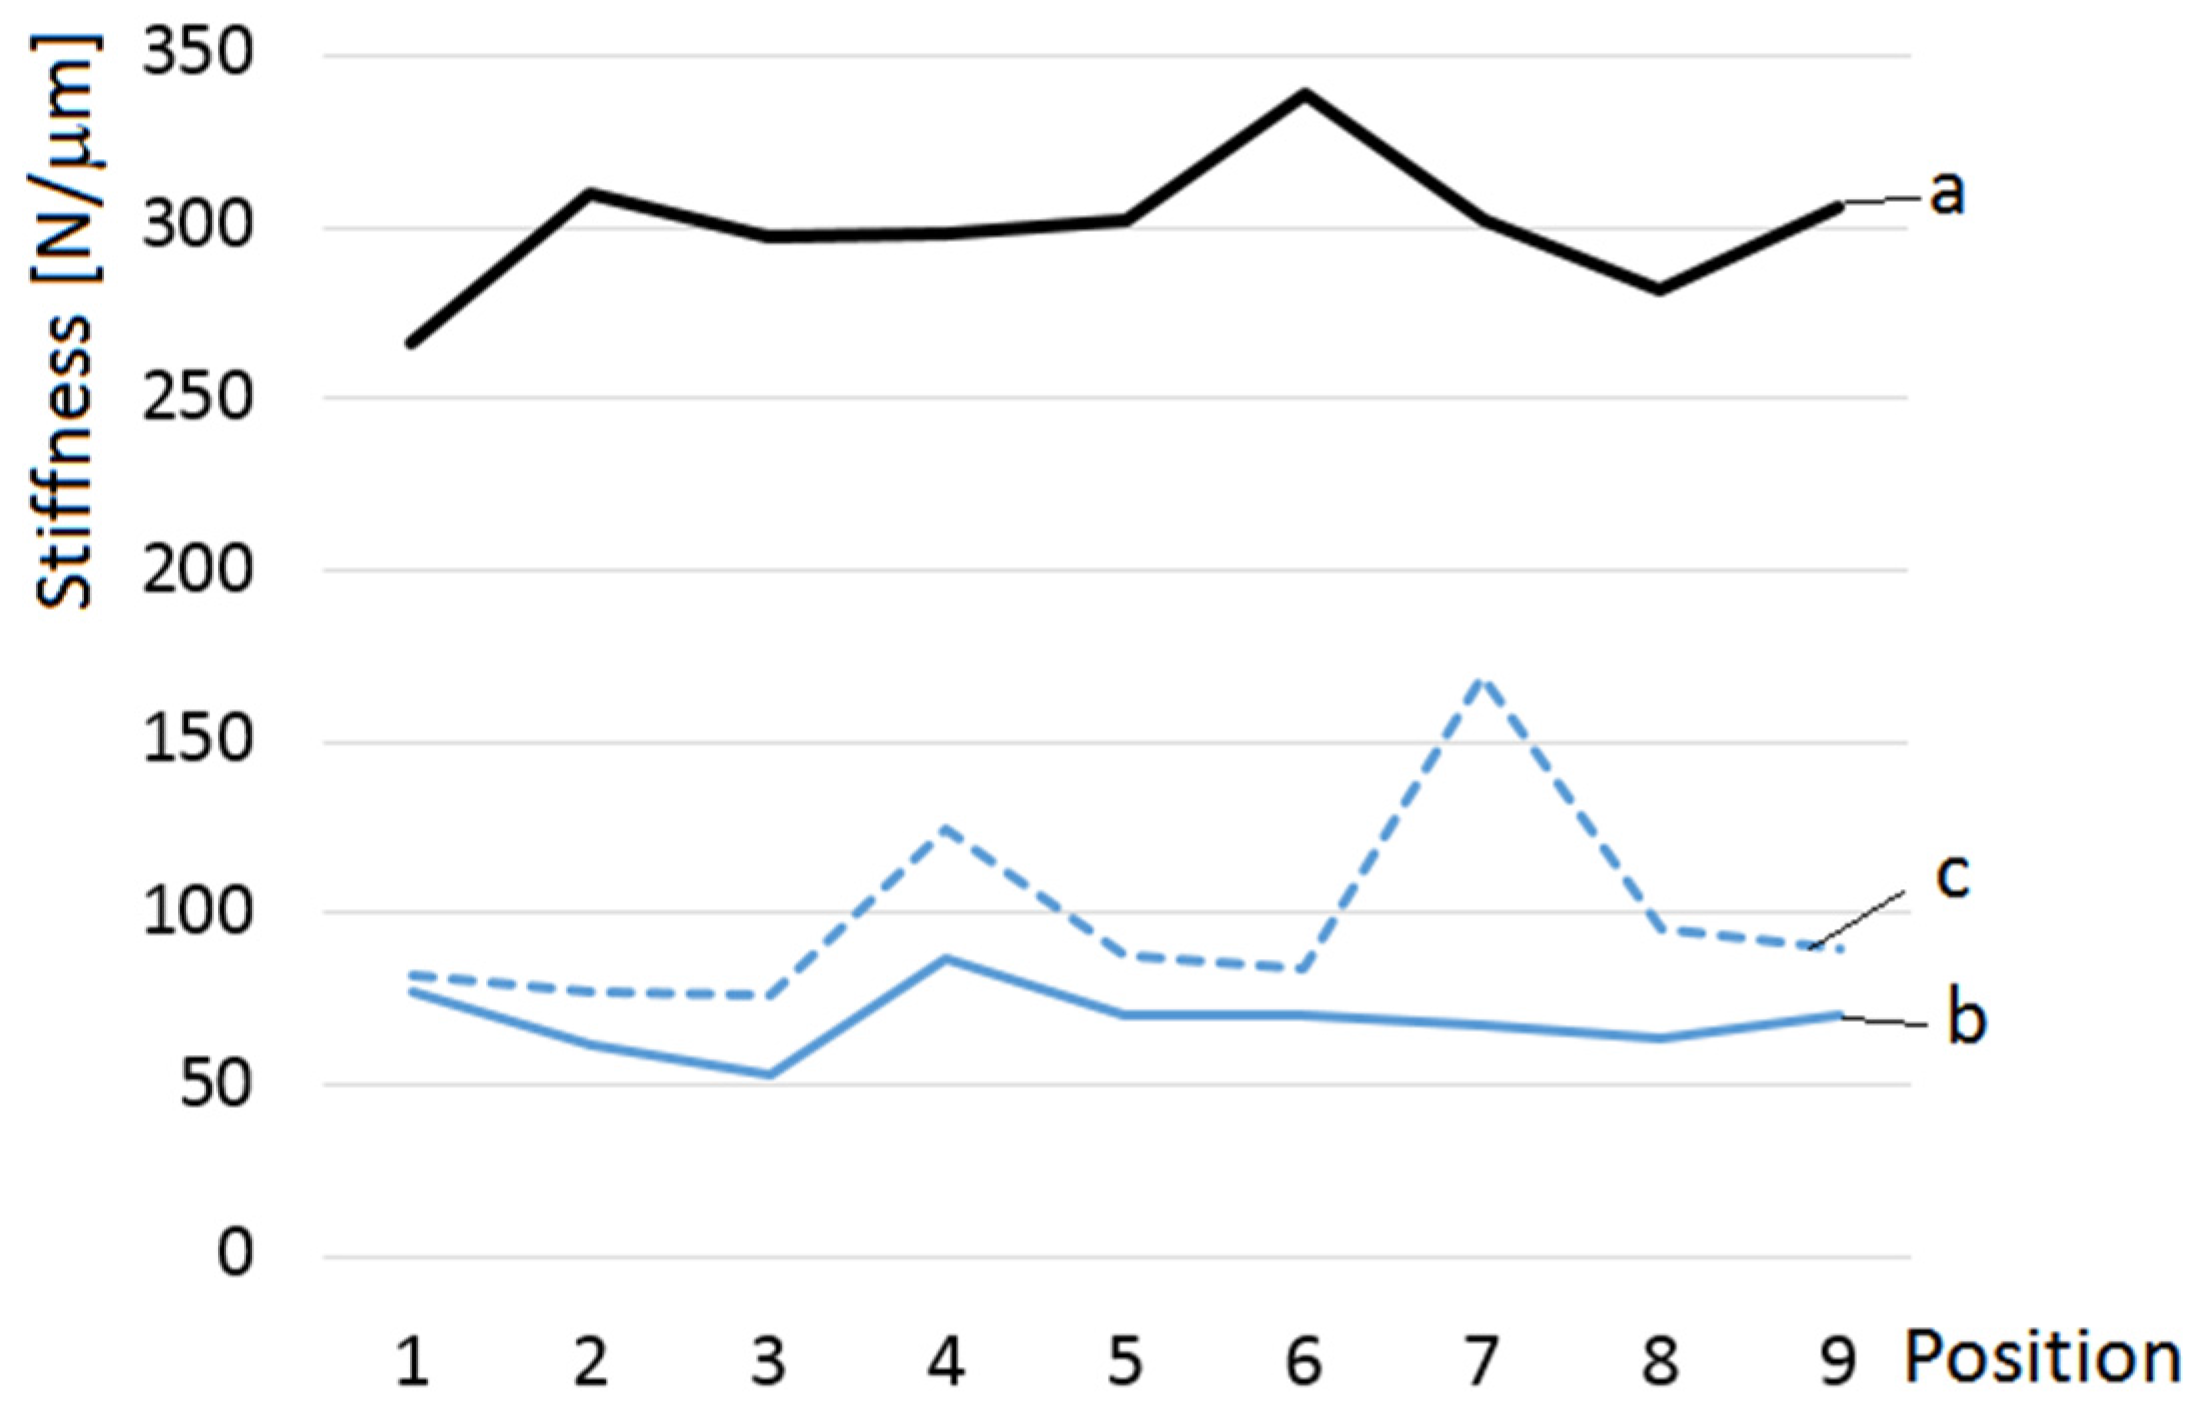
Figure 13.
Static stiffness characteristic at position 8 when the latter is assumed in the −X direction (force Fa).
Figure 13.
Static stiffness characteristic at position 8 when the latter is assumed in the −X direction (force Fa).
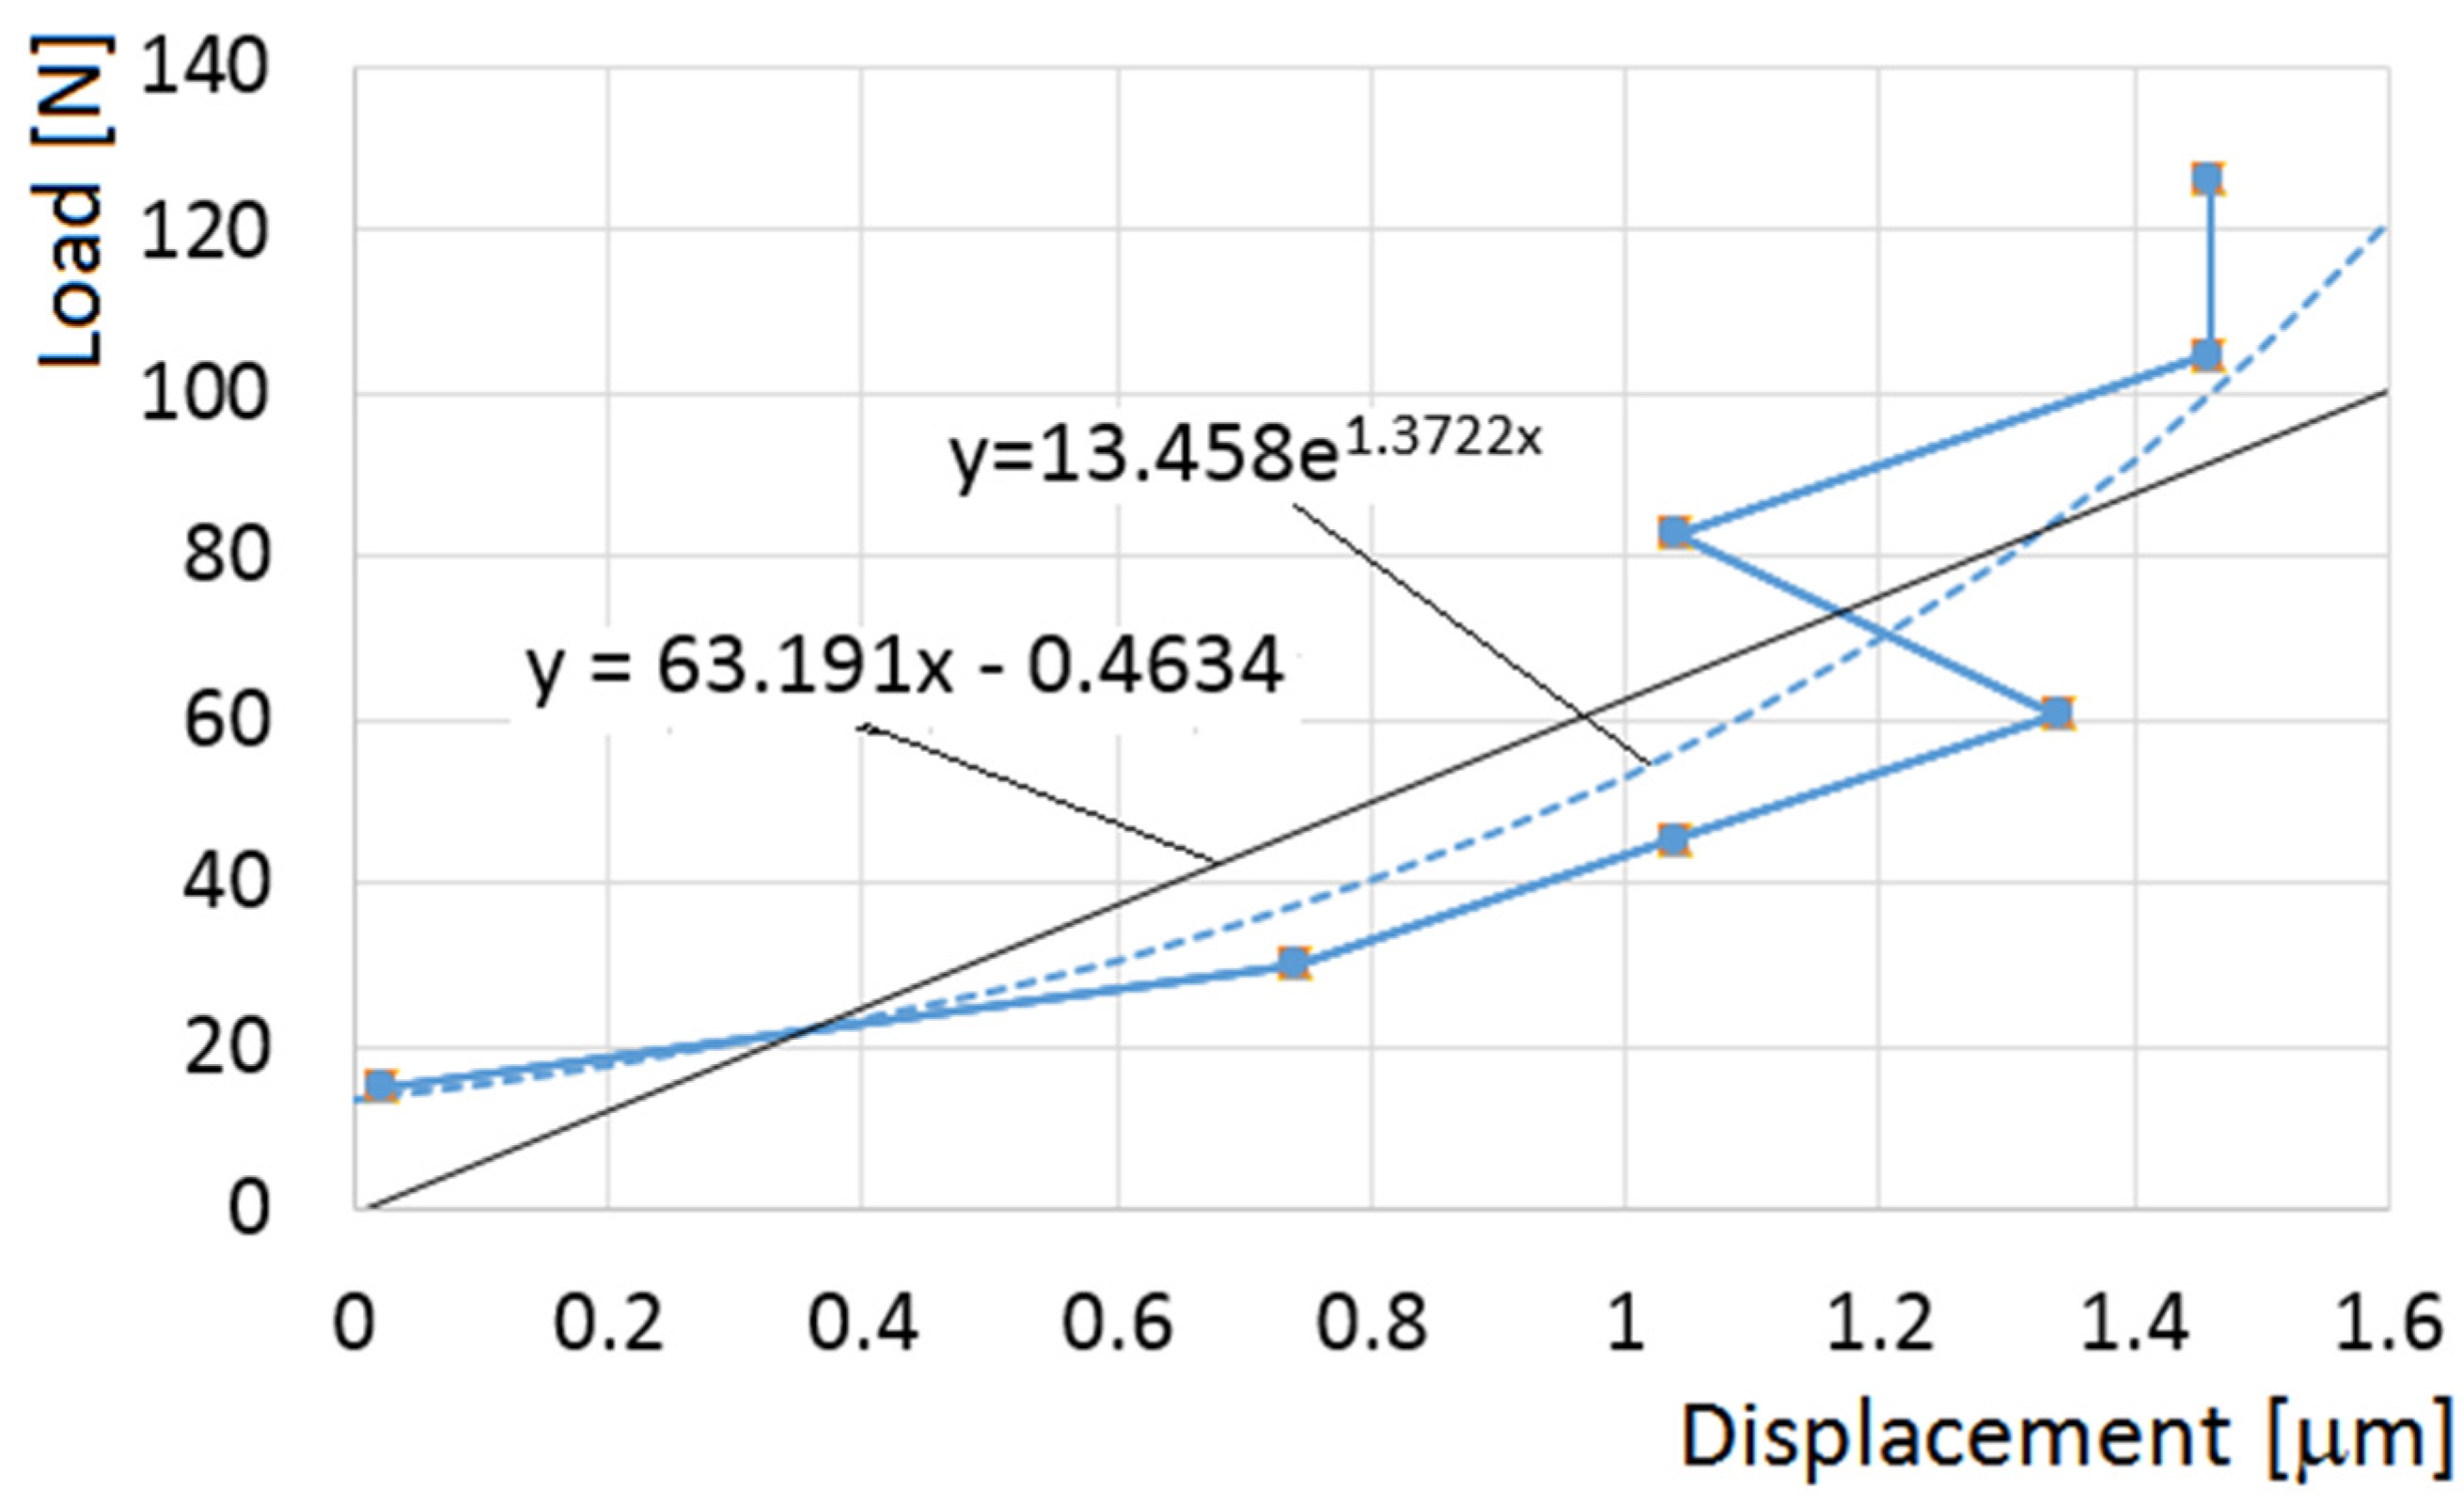
Figure 14.
Table Positioning Model, inspired by the ISO 230-2 [34] standard.
Figure 14.
Table Positioning Model, inspired by the ISO 230-2 [34] standard.

Figure 15.
The principle of preloading in the +X direction.

Table 1.
Load by application of the Fr force.
| Order j | Force [N] |
|---|---|
| 1 | 15.01 |
| 2 | 29.98 |
| 3 | 45.48 |
| 4 | 60.62 |
| 5 | 82.93 |
| 6 | 104.78 |
| 7 | 126.26 |
| 8 | 148.42 |
| 9 | 173.70 |
© 2017 by the authors. Licensee MDPI, Basel, Switzerland. This article is an open access article distributed under the terms and conditions of the Creative Commons Attribution (CC BY) license (http://creativecommons.org/licenses/by/4.0/).
Share and Cite
MDPI and ACS Style
Stejskal, T.; Svetlík, J.; Dovica, M.; Demeč, P.; Kráľ, J. Measurement of Static Stiffness after Motion on a Three-Axis CNC Milling Table. Appl. Sci. 2018, 8, 15. https://doi.org/10.3390/app8010015
AMA Style
Stejskal T, Svetlík J, Dovica M, Demeč P, Kráľ J. Measurement of Static Stiffness after Motion on a Three-Axis CNC Milling Table. Applied Sciences. 2018; 8(1):15. https://doi.org/10.3390/app8010015
Chicago/Turabian StyleStejskal, Tomáš, Jozef Svetlík, Miroslav Dovica, Peter Demeč, and Ján Kráľ. 2018. "Measurement of Static Stiffness after Motion on a Three-Axis CNC Milling Table" Applied Sciences 8, no. 1: 15. https://doi.org/10.3390/app8010015
Note that from the first issue of 2016, this journal uses article numbers instead of page numbers. See further details here.