Estimate of Passive Time Reversal Communication Performance in Shallow Water


1
Department of Marine Science and Convergence Engineering, Hanyang University, Ansan 15588, Gyeonggi, Korea
2
Agency for Defense Development, Jinhae, P.O. Box 18, Changwon 51678, Gyeongsangnamdo, Korea
*
Author to whom correspondence should be addressed.
Appl. Sci. 2018, 8(1), 23; https://doi.org/10.3390/app8010023
Submission received: 21 November 2017
/
Revised: 20 December 2017
/
Accepted: 21 December 2017
/
Published: 25 December 2017
(This article belongs to the Special Issue Underwater Acoustics, Communications and Information Processing)
Abstract
:Time reversal processes have been used to improve communication performance in the severe underwater communication environment characterized by significant multipath channels by reducing inter-symbol interference and increasing signal-to-noise ratio. In general, the performance of the time reversal is strongly related to the behavior of the -function, which is estimated by a sum of the autocorrelation of the channel impulse response for each channel in the receiver array. The -function depends on the complexity of the communication channel, the number of channel elements and their spacing. A -function with a high side-lobe level and a main-lobe width wider than the symbol duration creates a residual ISI (inter-symbol interference), which makes communication difficult even after time reversal is applied. In this paper, we propose a new parameter, , to describe the performance of time reversal communication. is an estimate of how much of the -function lies within one symbol duration. The values of were estimated using communication data acquired at two different sites: one in which the sound speed ratio of sediment to water was less than unity and one where the ratio was higher than unity. Finally, the parameter was compared to the bit error rate and the output signal-to-noise ratio obtained after the time reversal operation. The results show that these parameters are strongly correlated to the parameter .
1. Introduction
Underwater acoustic communication presents a challenging problem arising from the environmental properties of underwater acoustic waveguides. Acoustic waves propagating through shallow-water channels experience multiple interactions with the sea surface and ocean bottom. This causes a significant, time-varying delay spread called ISI (inter-symbol interference) [1]. ISI results in serious distortion of communication signals and makes demodulation difficult [2]. Thus, the ISI causes significant degradation in communication performance [3,4,5,6]. In addition, the temporal variations in communication channels resulting from sea surface movement and source/receiver movements result in a short coherent time and large Doppler spread, which degrade communication performance [7,8,9].
Up to the 1990s, a channel equalization process was mainly used in coherent acoustic communication to compensate for the ISI [2,10,11,12]. Furthermore, a single-channel receiver was extended to the multichannel receiver system to improve the communication performance. However, there is a significant shortcoming that means multichannel equalization requires the high computational complexity [5,12,13]. In the early 2000s, the time reversal technique was introduced as an alternative to the equalization process [14,15,16]. Although the time reversal technique also employs an array of spatially separated receivers, it is relatively simple, effectively reduces the ISI in a multipath environment, and restores the original communication signal, thereby increasing the signal-to-noise ratio (SNR). Recently, passive time reversal processes have been widely used in underwater communication due to the simplicity of the system, in which an array is required only at the receiver [17,18,19]. Passive time reversal is related to the reciprocity of the active time reversal. Thus, the two methods are theoretically equivalent except that the direction of the communication link is reversed [19]. Recently, passive time reversal has been applied on a block-by-block basis and was combined with a phase lock loop (PLL) to overcome the difficulties caused by the time-varying characteristics of the channel [20,21].
The performance of the time reversal can be characterized by the behavior of the -function, which is the sum of the autocorrelation of each channel impulse response (CIR) for each receiver [18,19]. The passive time reversal is expressed by the equation below.
Here, is a signal transmitted from a source. and are the CIR at the i-th receiver and its time reversed form, respectively. N is the number of receivers. The expression inside the bracket is defined as the -function. In general, the -function depends on the complexity of the communication channel, the number of receivers in the array, and their spacing [19]. In an ideal case in which the estimated CIR has infinite bandwidth and no multipath, the -function becomes a delta function, and the time reversal process recovers the exact original communication signal [14,15,16,17,18,19]. However, in a real ocean waveguide, the -function is no longer the delta function, but has a main lobe and side lobes, producing a residual ISI of time compressed signal. As the energy of the side lobes becomes larger or the width of main lobe becomes wider, the bit error rate (BER) of the communication signal after the time reversal process tends to increase. Therefore, if the residual ISI is not negligible even after the time reversal process, additional equalization processes, such as an adaptive decision feedback equalizer, are needed to eliminate the residual ISI. Such properties of the -function affecting communication performance were investigated by Yang [18]. However, the parameter describing quantitatively the relation between the -function and communication performance was not proposed in his work.
In this paper, we propose a new parameter, , which describes the performance of passive time reversal communication using the -function. The parameter can be used to quickly assess the symbol rate of a coherent underwater communication system using the time reversal technique, and it can be used to determine the optimal number of receiver elements required to meet the BER requirement. Here, we estimate and compare it to other communication parameters such as the BER and output SNR using the communication data acquired at two experimental sites. These sites have different bottom sediment compositions, which is a main factor that influences CIR in shallow water when the experimental geometries are the same.
The paper is organized as follows. The parameter is introduced in Section 2. Section 3 provides a description of the underwater acoustic communication experiments. The estimates of for two different sites and comparisons with other communication parameters are made in Section 4. Finally, a summary and discussion are given in Section 5.
2. Parameter
During passive time reversal communication, the probe signal and the subsequent communication stream are transmitted by a source and are received at multiple receivers after propagating through a multipath ocean channel. The CIR at each receiver position is estimated by a matched filtering of the received probe signal at each receiver element with a replica of the emitted probe signal. The -function is estimated by summing the autocorrelation of as given inside the bracket of Equation (1).
Dahl and Choi [22] suggested the parameter to describe a shallow-water multipath channel. is a normalized, cumulative, time-integrated form of the channel intensity impulse response function. The parameter estimates the relative energy contribution of the multipath with respect to time. After that, Son et al. [23] suggested the parameter by applying the concept of the , which is an energy fraction of the channel impulse response over one symbol duration. They showed that the overall BER performance improved as increased.
The new parameter proposed here () uses an idea similar to in which the channel intensity impulse response in is replaced by the right-hand side of the -function as given by
Here, is the right-hand side of the -function and is one symbol duration. In general, communication BER increases as the side-lobe magnitude and the main-lobe width of the -function increase [18,19]. The higher side lobes and wider main-lobe width augment the energy fraction of -function positioning outside of one symbol duration and consequently create a significant ISI. In this case, a decrease in is expected. Therefore, might be used as a parameter to describe the performance of time reversal communication and can be applied to determine the symbol rate and/or optimal receiver number and spacing using time reversal communication. In addition, it can be used as a parameter to determine the need for additional equalization for a given ocean environment and the fixed receiver array system.
3. Experiment and Site
The passive time reversal communication data used in this paper were acquired at two different sites having different sediment compositions (Figure 1a). The first experiment was conducted in May 2012 at a site located off the southeast coast of Korea (henceforth called ‘site 1’), at location 35°0.48′ N, 129°1.39′ E in waters 45 m in depth. This location was characterized by a sandy clay sediment having a mean grain size of 7 φ (where φ = (/), is the grain diameter in millimeters, and is a reference length of 1 mm). A detailed description of the experiment is provided in reference [23]. The second experiment was conducted off the east coast of Korea at the location 37°14.47′ N, 129°23.40′ E (henceforth called ‘site 2’) in waters 60 m deep in April 2015. The sediment of site 2 was very fine sand having a mean grain size of 2.7 φ based on a grab sample.
The geometries of the two experiments were very similar except for the water depth (Figure 1b,c for sites 1 and 2, respectively). An omnidirectional transducer (NEPTUNE D-17, Neptune Sonar, East Yorkshire, UK) was deployed at depths of 32 m and 30 m at sites 1 and 2, respectively, from small fishing vessels. A uniformly spaced four-channel vertical receiving array (RESON TC-4014, Teledyne RESON, Frederikssund, Denmark), which covers a water column between 5 and 35 m in depth, was deployed from the side of the R/V Tamyang and another small fishing vessel at sites 1 and 2, respectively. The measurements were made at nominal source-receiver ranges of about 100, 500, and 1000 m for both sites. The sound speed profiles (SSP) during the measurements were measured by conductivity-temperature-depth (CTD) casts (AML, Sidney, BC, Canada), which are shown in Figure 1b,c. The SSP in site 2 has a more negative gradient when compared to that in site 1, and this causes the ray to refract downward to the bottom.
The surficial sediment sound speeds for sites 1 and 2 were expected to be about 1478 and 1645 m/s based on the empirical relationship between the mean grain size and the sediment sound speed given in reference [24]. Therefore, (where and are the sound speeds at the surficial sediment and water above the bottom, respectively) for site 1, which corresponds to an acoustically slow bottom condition, whereas for site 2, which corresponds to a fast bottom condition. The properties of acoustic propagation in two different bottom conditions are very different from each other. The bottom loss is defined as where is the plane wave reflection coefficient for the seabed. The bottom loss was much larger for the slow bottom than the fast bottom. Most acoustic energy incident on the fast bottom at grazing angles smaller than the critical angle are reflected to the water medium, while most energy incident on the slow bottom at grazing angles near the angle of intromission are transmitted into the sediment. Therefore, communication channels in the fast bottom condition are much more reverberant than those in the slow bottom condition.
The communication sequence consisted of a 20-ms-long linear frequency-modulated (LFM) pulse with a bandwidth of 13–17 kHz as a probe signal, followed by a pause lasting 0.5 s, followed by binary phase shift keying (BPSK) sequences lasting 3.5 s with a center frequency of 15 kHz. The symbol rate was 1000 symbols per second, and the signal bandwidth was 2 kHz. The pulse-shaping filter was a root raised cosine (RRC) filter with a roll-off factor of . Communication data packets were transmitted every 10 s and were repeated 15 times for each source-receiver range.
4. Results
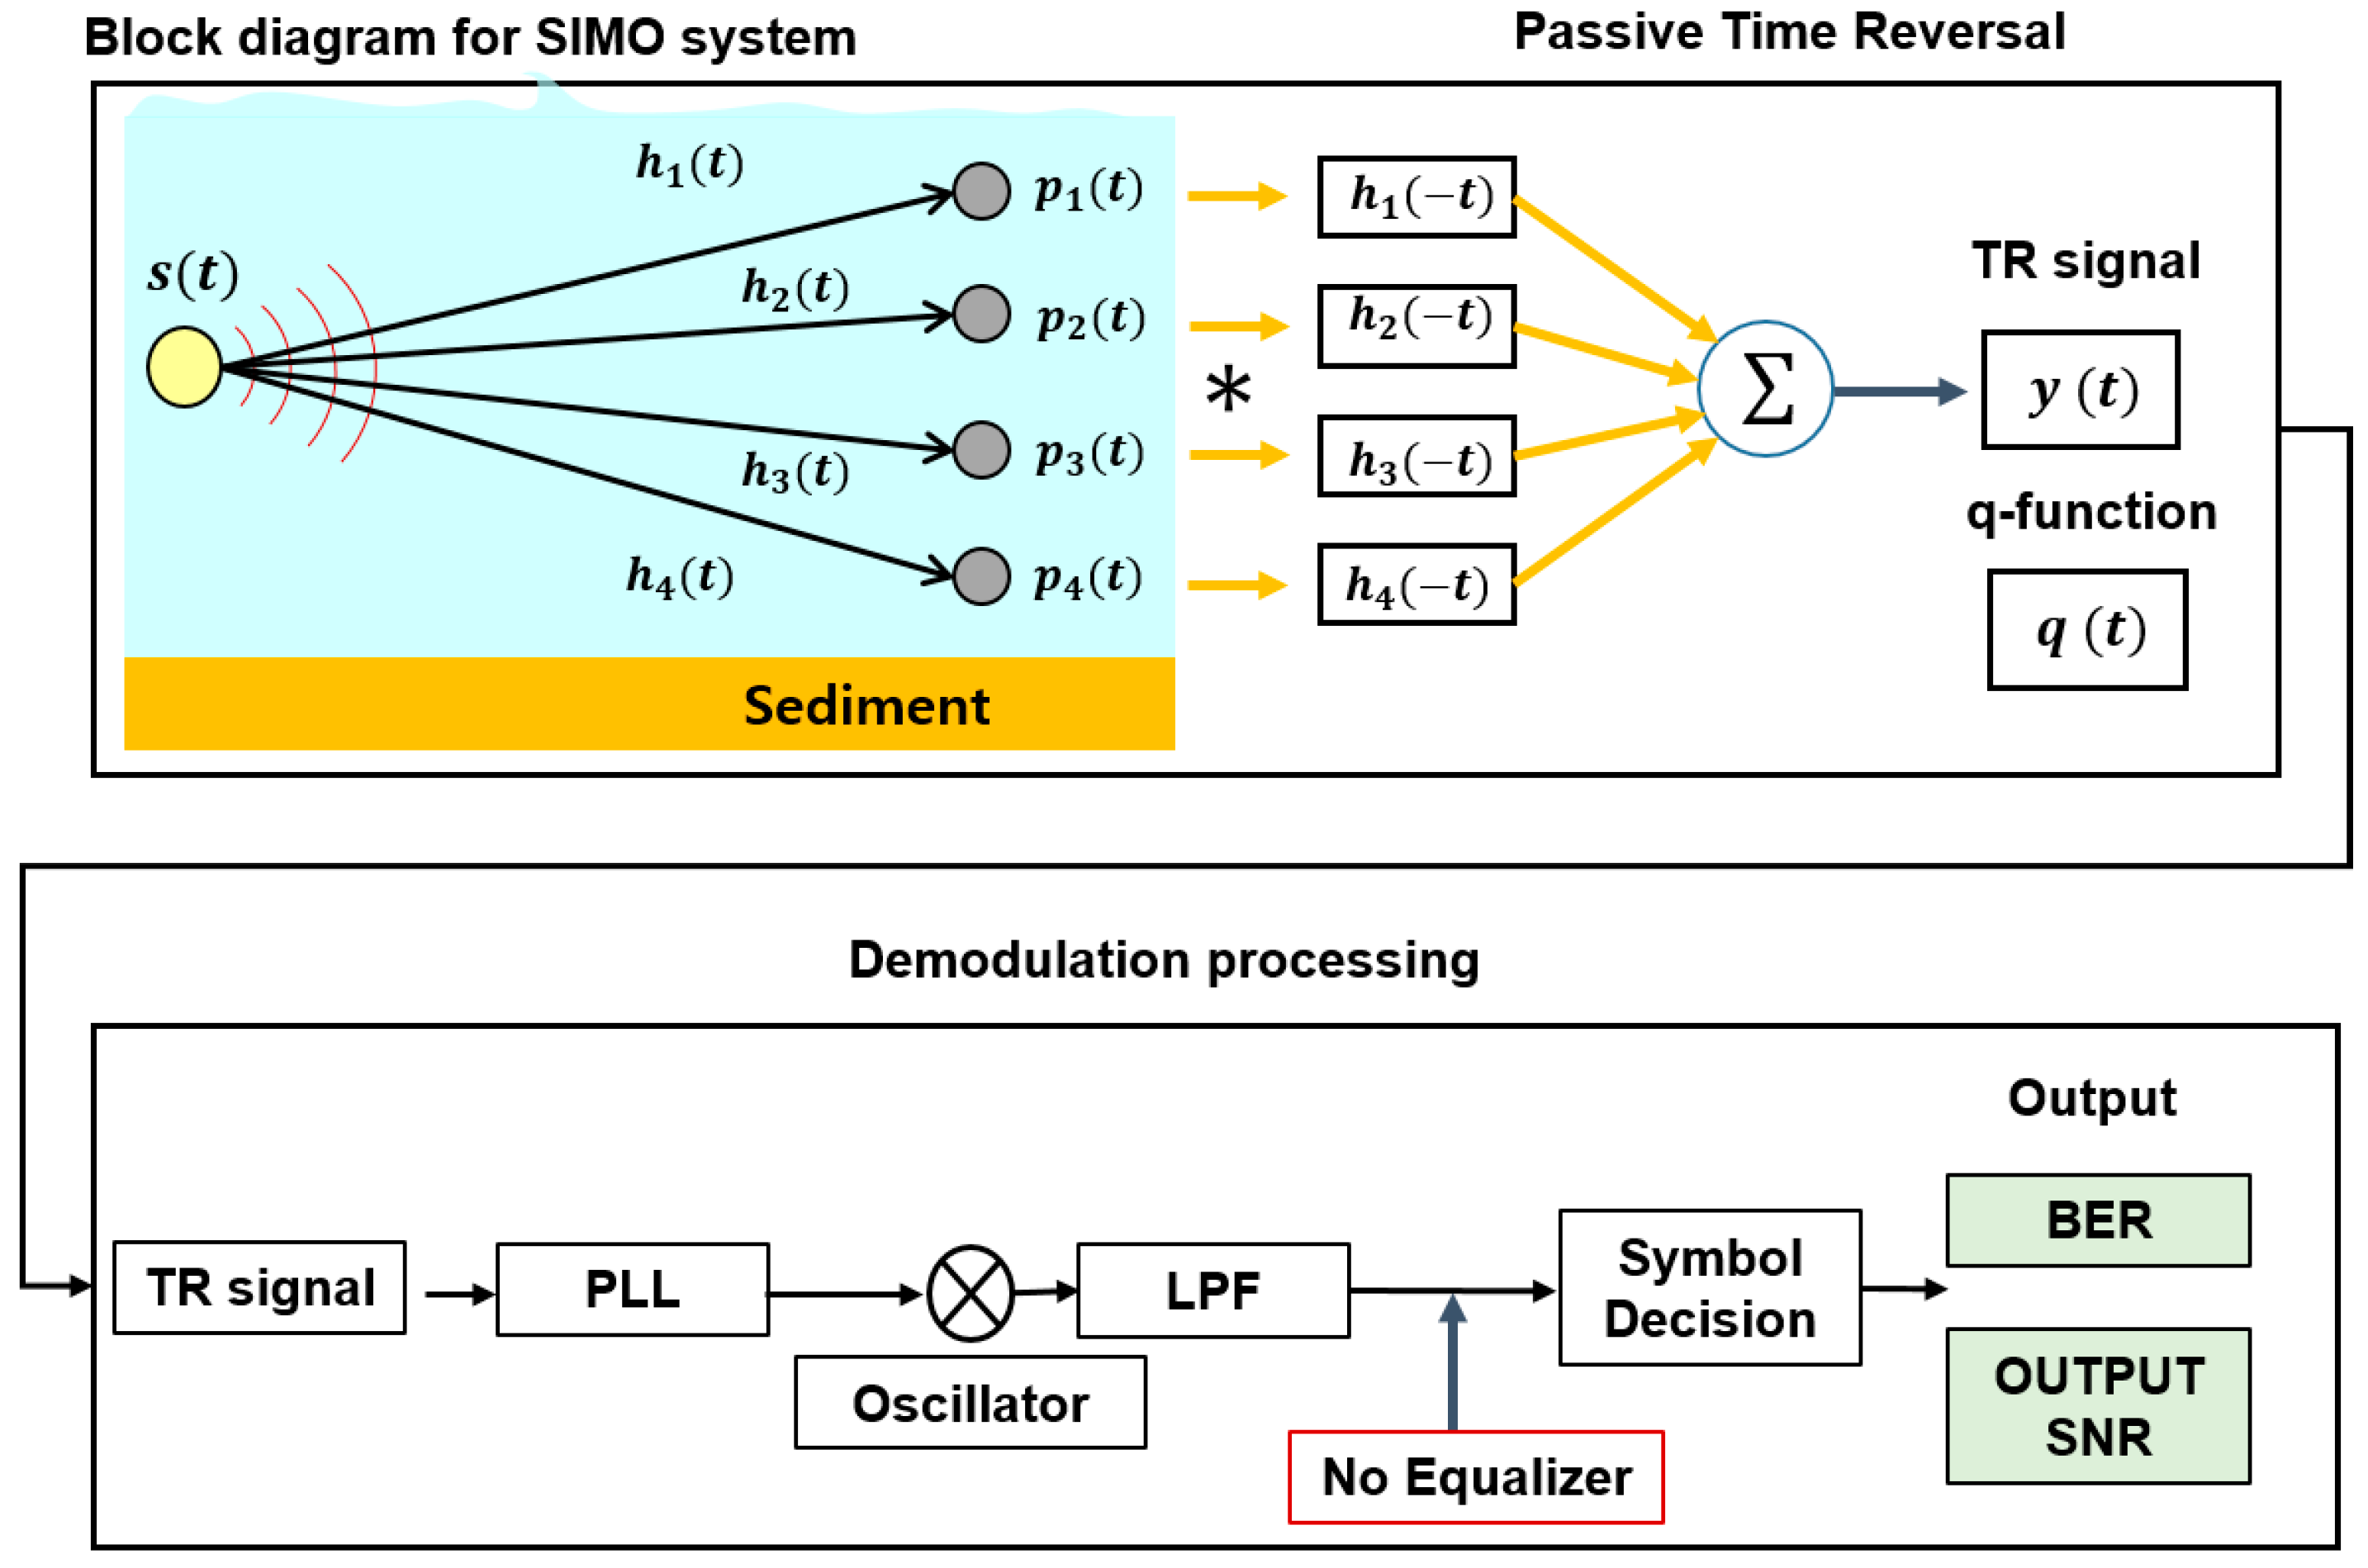
Figure 2 shows a block diagram of the four-channel single-input multiple-output(SIMO) system for passive time reversal communication. First, the CIR at each receiver position was estimated by matched filtering of a replica of the LFM probe signal with its measurement by each receiver. The communication data stream and the received at each receiver were matched filtered with the and were coherently summed to make a focused communication stream and -function. The was passed through the PLL to compensate for the phase distortion of the signal. It was multiplied by ( is an angular frequency) to recover the baseband waveform and was then low-pass filtered. Finally, symbol decision was performed, and the BER and the output SNR were estimated. The goal of this paper was to investigate the correlation between the performance of passive time reversal communication and the parameter , therefore no additional equalization process was used to eliminate the residual ISI in the receiver system.
4.1. Channel Characteristics at the Experimental Sites
Figure 3 and Figure 4 show the measured CIRs and their corresponding eigenrays at a receiver depth of 15 m for the nominal source-receiver ranges of 100 m (top), 500 m (middle) and 1 km (bottom) at sites 1 and 2, respectively. The arrival time of each CIR was aligned based on the first arrival, and its timing was normalized to that of the peak of the first arrival. The eigenrays were calculated using a ray-based acoustic propagation model BELLHOP [25] using the sound speed profiles shown in Figure 1b,c.
The CIRs of the two different sites have very different characteristics; for example, the CIRs at site 1 are less reverberant, whereas those at site 2 are highly reverberant, having strong multipaths following the first arrival. This difference is mainly attributed to the difference in the bottom loss as mentioned in Section 3. At site 1 (where the bottom is considered an acoustically slow bottom and the angle of intromission was estimated to be about 18.2°), most energy incident on the bottom was transmitted into the sediment, resulting in a large bottom loss. See Reference [23] for a detailed discussion of the channel characteristics of site 1. In contrast, the bottom of site 2 is considered to be a relatively fast bottom, and the critical grazing angle was estimated to be about 24°. The rays incident on the bottom interface at grazing angles less than 24° were totally reflected into the water medium, producing strong multipaths. As shown in Figure 4, strong multipaths persist for even 50 symbols in time (one symbol duration is 1 ms). Thus, one can anticipate that site 2 is in a severe ISI environment when compared to site 1.
4.2. Performance Analysis of Passive Time Reversal Communication
Figure 5a,b show examples of the normalized -functions estimated using a single channel (N = 1) and the summation for four channels (N = 4), respectively. These values were estimated using the data measured in the source-receiver range of 109 m at site 2. For the case of N = 1, the -function has many side lobes, of which the highest magnitude corresponds to ~0.3 of the main-lobe level. The non-negligible side lobes spread over 30 symbol durations from the main lobe. The parameter was estimated to be 0.5 for this case. In contrast, in the case of N = 4, the side lobe of -function was suppressed, the magnitudes of most side lobes were less than 0.1 of the main-lobe level, and the estimated was 0.85.
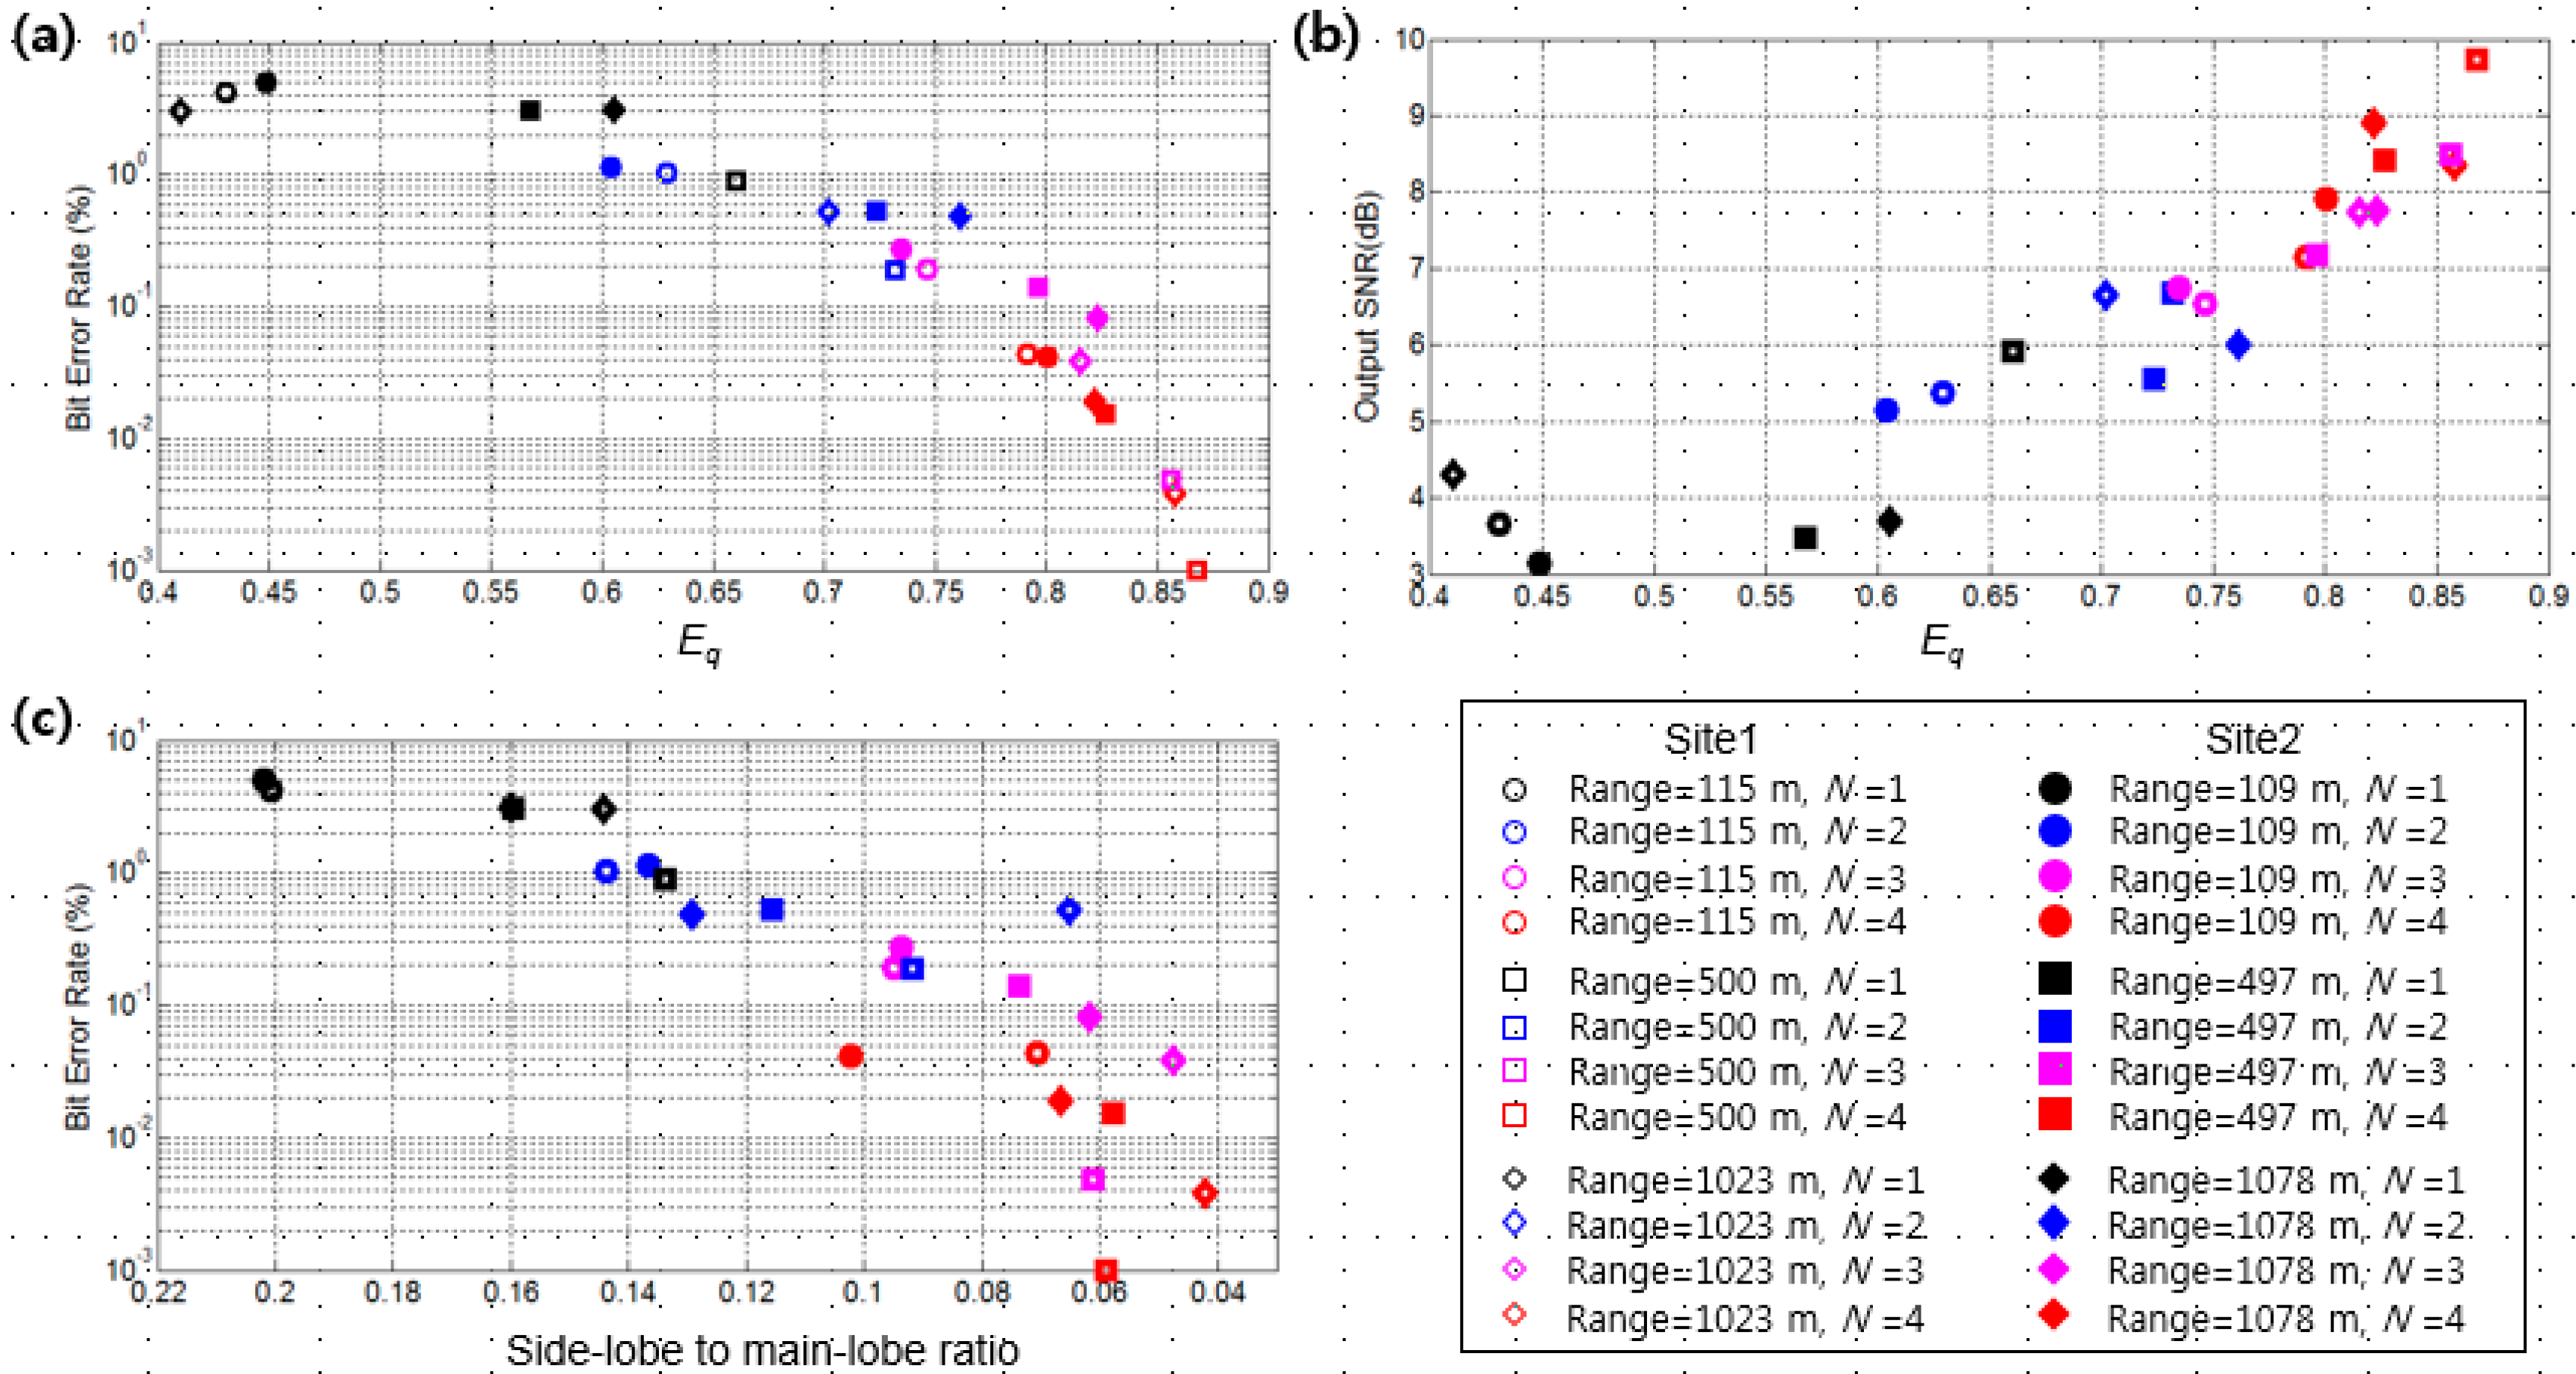
Figure 6a,b show comparisons of the estimates of with the BER and the output SNR, respectively. The symbol color and shape indicate the number of channel summations, source-receiver range and the site. This information is listed in the box at the lower right of Figure 6. The output SNR can be estimated by the reciprocal of the mean-squared error [19,26], which is given by
Here, denotes the expectation, and and are the original data symbols and their estimates. For both sites, overall the BER and the output SNR improved as the increased. It is interesting to note that the best communication performance was achieved at site 1 (having an acoustically slow bottom) when N = 4, and in this case the value of was highest, showing > 0.85. On the other hand, site 2 (having an acoustically fast bottom) showed a limit to communication performance improvement due to the residual ISI of the -function, and the values were less than 0.83 even in case of N = 4. Overall, the performance improved as N increased. Also, as the source-receiver range increased, the performance improved except for ranges of 500 and 1000 m in site 1, in which the performance at a range of 500 m was better than that at a range of 1000 m. For every case, the parameter showed a strong correlation with the BER and the output SNR. A criterion for the best communication performance may be proposed using the parameter . For example, if a BER of 1% is chosen as a tolerance for communication, the value is about 0.67 in our case, and a BER of 0.1% results in an of about 0.78. However, it may change if other techniques (such as adaptive time reversal or additional equalization) are applied to the time reversal process. Finally, Figure 6c shows a comparison between the BER and the maximum side-lobe level normalized to main-lobe level. Overall, the BER also improved as the side-lobe level decreased. In reference 18, the side-lobe to main-lobe ratio of 0.1 was roughly suggested as a criterion to minimize BER. However, large variation of BER is observed in the case of side-lobe to main-lobe ratio less than 0.1, which implies that the parameter is more suitable as a parameter to describe the performance of time reversal communication.
5. Summary and Discussion
Passive time reversal can be used in underwater acoustic communications that are severely affected by multipaths because it reduces the ISI and increases the SNR. In general, the time reversal performance totally depends on the behavior of the -function, which is the sum of the autocorrelation of the CIR for each channel. High side-lobe level and main-lobe width wider than the symbol duration produce a significant residual ISI, which degrades underwater communication even after the time reversal operation.
In this paper, the parameter was proposed as a factor to estimate the performance of the time reversal, which is an estimate of how strong tails of the -function are distributed outside one symbol duration. Passive time reversal communication experiments were performed at two different sites characterized by either acoustically fast or slow bottom conditions. The parameter was estimated and compared to the BER performance and the output SNR. Although the CIRs estimated at the two sites were significantly different and the estimated -functions also differed from each other, the parameter accurately reflected the performance of the passive time reversal communication, showing a strong correlation with the BER and the output SNR. In conclusion, the parameter may be used to determine the following parameters for designing time reversal communication systems.
- Quick assessment of symbol rate of time reversal communication system
- Determination of receiver array dimension required to meet the BER requirement, including the optimal number of channel elements and their spacing
- Decision of need for additional equalization
Acknowledgments
This work was supported by the Agency for Defense Development, Korea, under Grant UD170022DD, the Ministry of Oceans and Fisheries (in a project titled the development of distributed underwater monitoring & control networks) and the National Research Foundation of Korea, under Grant NRF-2016R1D1A1B03930983.
Author Contributions
Jee Woong Choi conceived and designed the research; Sunhyo Kim played a key role in the data analysis; Sunhyo Kim, Su-Uk Son, Hyeonsu Kim, Kang-Hoon Choi and Jee Woong Choi performed the experiments and discussed the results; Sunhyo Kim and Jee Woong Choi wrote the paper.
Conflicts of Interest
The authors declare no conflict of interest.
References
- Yang, T.C. Properties of underwater acoustic communication channels in shallow water. J. Acoust. Soc. Am. 2012, 131, 129–145. [Google Scholar] [CrossRef] [PubMed]
- Kilfoyle, D.B.; Baggeroer, A.B. The State of the Art in Underwater Acoustic Telemetry. IEEE J. Ocean. Eng. 2000, 25, 4–27. [Google Scholar] [CrossRef]
- Rouseff, D.; Badiey, M.; Song, A. Effect of reflected and refracted signals on coherent underwater acoustic communication: Results from the Kauai experiment (KauaiEx 2003). J. Acoust. Soc. Am. 2009, 126, 2359–2366. [Google Scholar] [CrossRef] [PubMed]
- Song, A.; Badiey, M.; Song, H.C.; Hodgkiss, S.; Porter, M.B. Impact of ocean variability on coherent underwater acoustic communications during the Kauai experiment (KauaiEx). J. Acoust. Soc. Am. 2008, 123, 856–865. [Google Scholar] [CrossRef] [PubMed]
- Stojanovic, M.; Catipovic, J.A.; Proakis, J.G. Adaptive multichannel combining and equalization for underwater acoustic communication. J. Acoust. Soc. Am. 1993, 94, 1621–1631. [Google Scholar] [CrossRef]
- Siderius, M.; Porter, M.B.; Hursky, P.; McDonald, V. Effects of ocean thermocline variability on noncoherent underwater acoustic communications. J. Acoust. Soc. Am. 2007, 121, 1895–1908. [Google Scholar] [CrossRef] [PubMed]
- Walree, P.A. Propagation and Scattering Effects in Underwater Acoustic Communication Channels. IEEE J. Ocean. Eng. 2013, 38, 614–631. [Google Scholar] [CrossRef]
- Badiey, M.; Mu, Y.; Simmen, J.A.; Forsythe, S.E. Signal Variability in Shallow-Water Sound Channels. IEEE J. Ocean. Eng. 2000, 25, 492–500. [Google Scholar] [CrossRef]
- Yang, T.C. Measurements of temporal coherence of sound transmissions through shallow water. J. Acoust. Soc. Am. 2006, 120, 2595–2614. [Google Scholar] [CrossRef]
- Hirsch, D.; Wolf, B. A simple adaptive equalizer for efficient data transmission. IEEE J. Trans. Commun. 1970, 18, 5–12. [Google Scholar] [CrossRef]
- Proakis, J.G.; Miller, J.H. An adaptive receiver for digital signaling though channel with intersymbol interference. IEEE J. Trans. Inf. Theory 1969, 15, 484–497. [Google Scholar] [CrossRef]
- Proakis, J.G. Digital Communications; McGraw-Hill: New York, NY, USA, 1989; pp. 680–693. [Google Scholar]
- Balaban, P.; Salz, J. Optimum diversity combining and equalization in digital data transmission with applications to cellular mobile radio. IEEE J. Trans. Commun. 1992, 40, 885–895. [Google Scholar] [CrossRef]
- Rouseff, D.; Jackson, D.R.; Fox, W.L.J.; Jones, C.D.; Ritcey, J.A.; Dowling, D.R. Underwater Acoustic Communication by Passive-Phase Conjugation: Theory and Experimental Results. IEEE J. Ocean. Eng. 2001, 26, 821–831. [Google Scholar] [CrossRef]
- Edelmann, G.F.; Akal, T.; Hodgkiss, W.S.; Kim, S.; Kuperman, W.A.; Song, H.C. An Initial Demonstration of Underwater Acoustic Communication Using Time Reversal. IEEE J. Ocean. Eng. 2002, 27, 602–609. [Google Scholar] [CrossRef]
- Edelmann, G.F.; Song, H.C.; Kim, S.; Hodgkiss, W.S.; Kuperman, W.A.; Akal, T. Underwater Acoustic Communications Using Time Reversal. IEEE J. Ocean. Eng. 2005, 30, 852–864. [Google Scholar] [CrossRef]
- Song, H.C.; Hodgkiss, W.S.; Kuperman, W.A.; Stevenson, M.; Akal, T. Improvement of Time-Reversal Communications Using Adaptive Channel Equalizers. IEEE J. Ocean. Eng. 2006, 31, 487–496. [Google Scholar] [CrossRef]
- Yang, T.C. Temporal Resolutions of Time-Reversal and Passive-Phase Conjugation for Underwater Acoustic Communications. IEEE J. Ocean. Eng. 2003, 28, 229–245. [Google Scholar] [CrossRef]
- Song, H.C.; Hodgkiss, W.S.; Kuperman, W.A.; Higley, W.J.; Raghukumar, K.; Akal, T. Spatial diversity in passive time reversal communications. J. Acoust. Soc. Am. 2006, 120, 2067–2076. [Google Scholar] [CrossRef]
- Song, H.C.; Kuperman, W.A.; Hodgkiss, W.S. Basin-scale time reversal communications. J. Acoust. Soc. Am. 2009, 125, 212–217. [Google Scholar] [CrossRef] [PubMed]
- Song, H.C. Time reversal communication in a time-varying sparse channel. J. Acoust. Soc. Am. 2011, 130, EL161–EL166. [Google Scholar] [CrossRef] [PubMed]
- Dahl, P.H.; Choi, J.W. The East China Sea as an Underwater Acoustic Communication Channel: Measurements of the Channel Impulse Response (U). U. S. Navy J. Underw. Acoust. 2006, 56, 1–12. [Google Scholar]
- Son, S.U.; Kim, H.; Joo, J.; Choi, J.W. Multipath Effects on High-Frequency Coherent Acoustic Communications in Shallow Water. Jpn. J. Appl. Phys. 2013, 52, 07HG03. [Google Scholar] [CrossRef]
- Jackson, D.R.; Richardson, M.D. High-Frequency Seafloor Acoustics; Springer: New York, NY, USA, 2006; pp. 313–314. [Google Scholar]
- Porter, M.B.; Bucker, H.P. Gaussian beam tracing for computing ocean acoustic fields. J. Acoust. Soc. Am. 1987, 82, 1349–1359. [Google Scholar] [CrossRef]
- Stojanovic, M.; Catipovic, J.A.; Proakis, J.G. Phase-Coherent Digital Communications for Underwater Acoustic Channels. IEEE J. Ocean. Eng. 1994, 19, 100–111. [Google Scholar] [CrossRef]
Figure 1.
(a) Sites of the passive time reversal communication experiments; (b) The experimental geometry and the sound speed profile at site 1 (having a relatively slow bottom) and (c) those at site 2 (having a relatively fast bottom).
Figure 1.
(a) Sites of the passive time reversal communication experiments; (b) The experimental geometry and the sound speed profile at site 1 (having a relatively slow bottom) and (c) those at site 2 (having a relatively fast bottom).
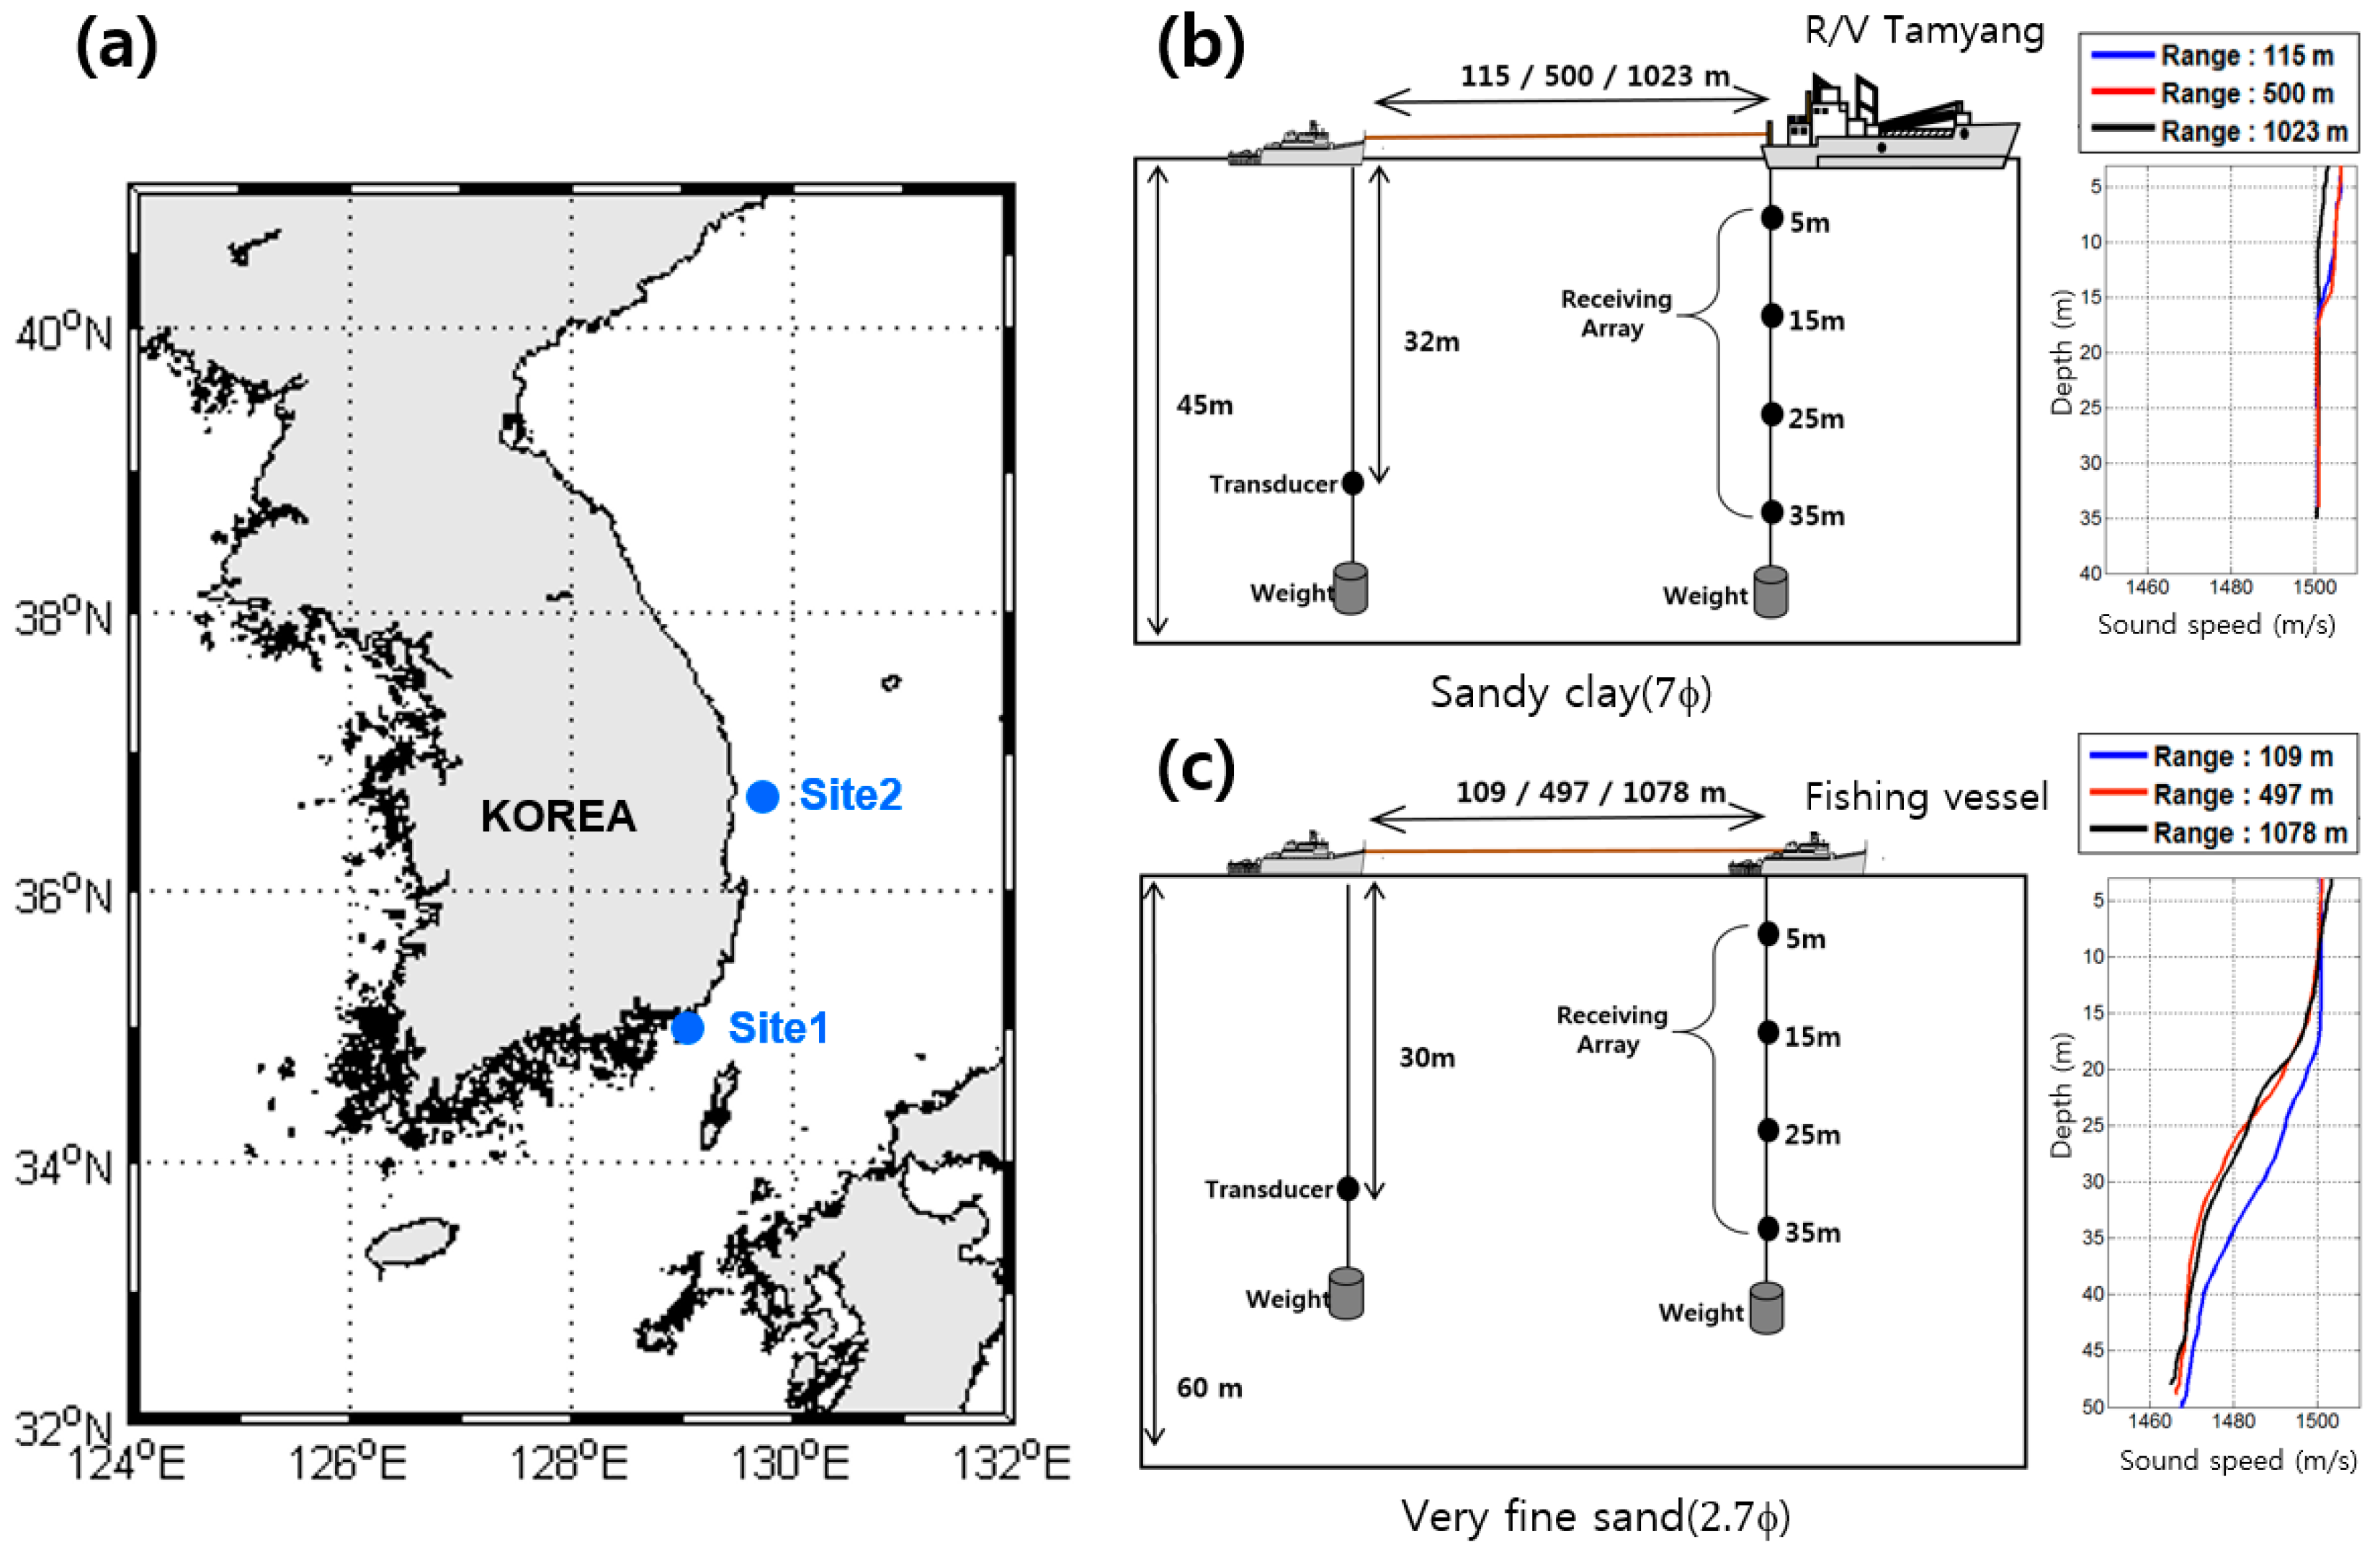
Figure 2.
Block diagram of the single-input multiple-output (SIMO) passive time reversal communication system using four vertically separated receiver array. TR: time reversal; PLL: phase lock loop; LPF: low-pass filter; BER: bit error rate; SNR: signal-to-noise ratio.
Figure 2.
Block diagram of the single-input multiple-output (SIMO) passive time reversal communication system using four vertically separated receiver array. TR: time reversal; PLL: phase lock loop; LPF: low-pass filter; BER: bit error rate; SNR: signal-to-noise ratio.

Figure 3.
Channel intensity impulse responses measured at a source depth of 32 m and a receiver depth of 15 m and their eigenray tracing outputs for source-receiver ranges of (a) 115 m; (b) 500 m and (c) 1023 m at site 1. D, B, and S in eigenray tracing outputs indicate direct, bottom and sea surface paths. The combinations of S and B mean multi-bounce paths. For example, SB is surface-bottom path. The seabed-grazing angle is noted for the B path.
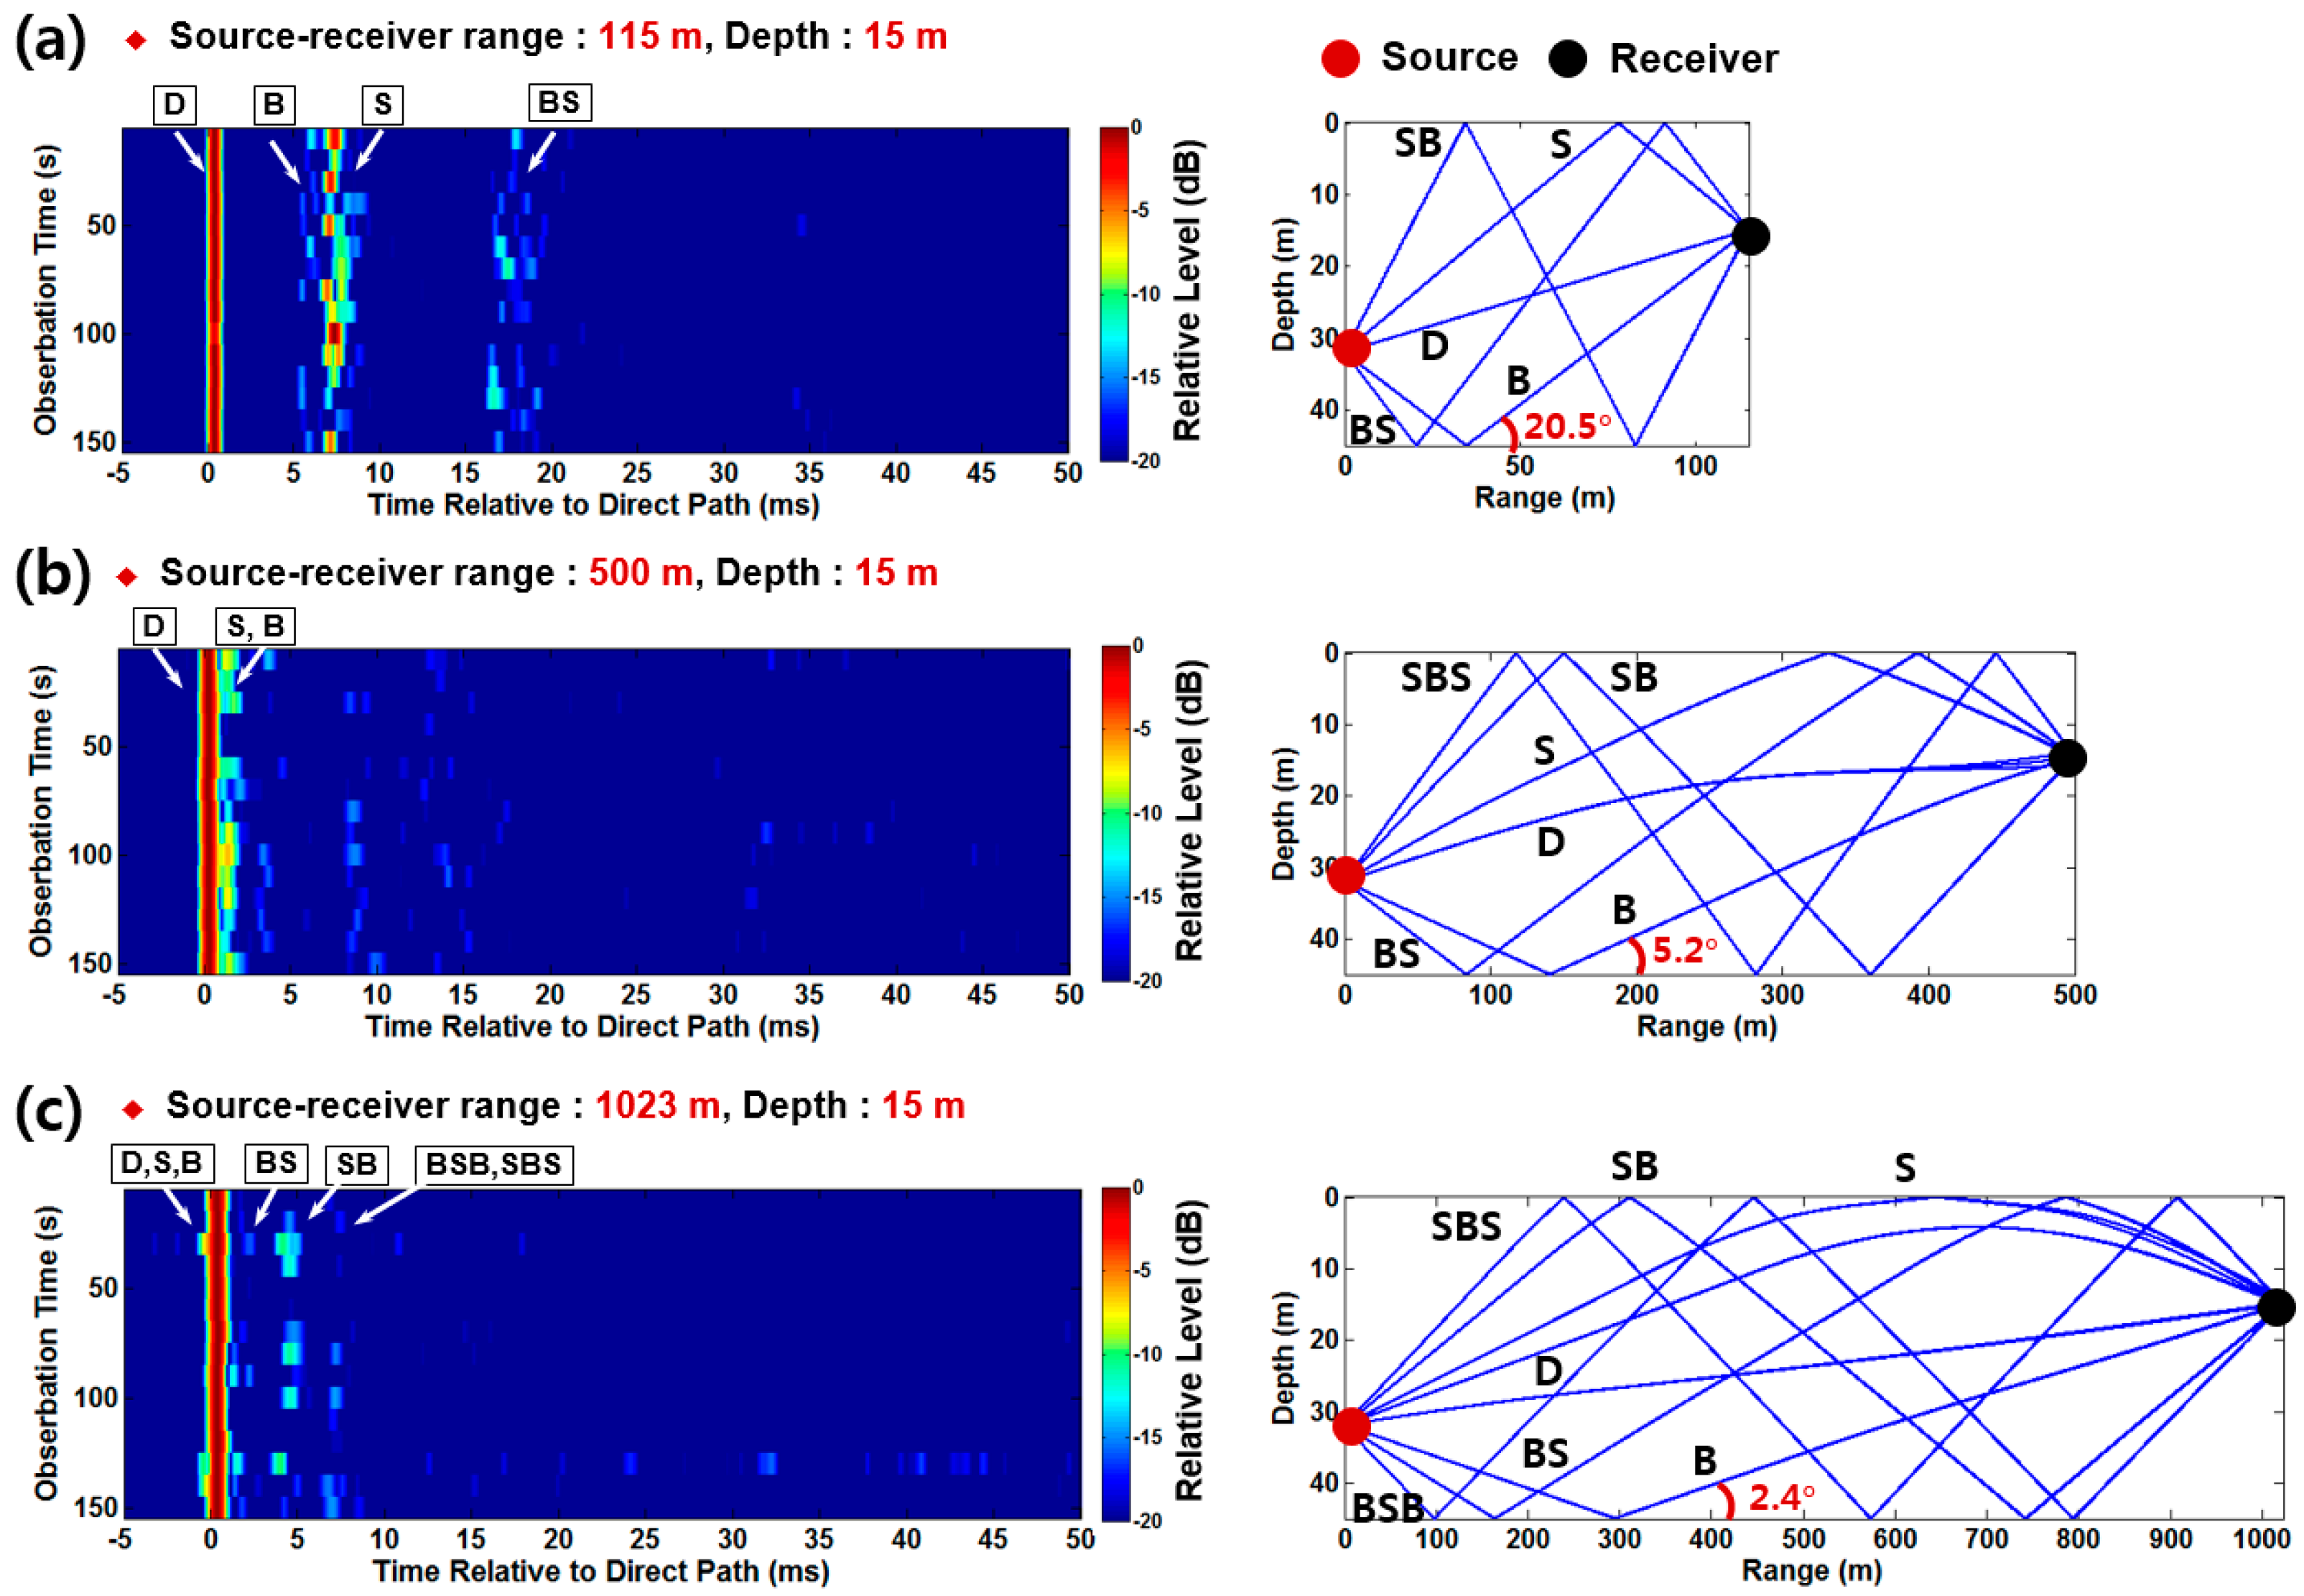
Figure 4.
Channel intensity impulse responses measured at a source depth of 30 m and a receiver depth of 15 m and their eigenray tracing outputs for source-receiver ranges of (a) 109 m; (b) 497 m and (c) 1078 m at site 2. The seabed-grazing angle is noted for the B path.
Figure 4.
Channel intensity impulse responses measured at a source depth of 30 m and a receiver depth of 15 m and their eigenray tracing outputs for source-receiver ranges of (a) 109 m; (b) 497 m and (c) 1078 m at site 2. The seabed-grazing angle is noted for the B path.
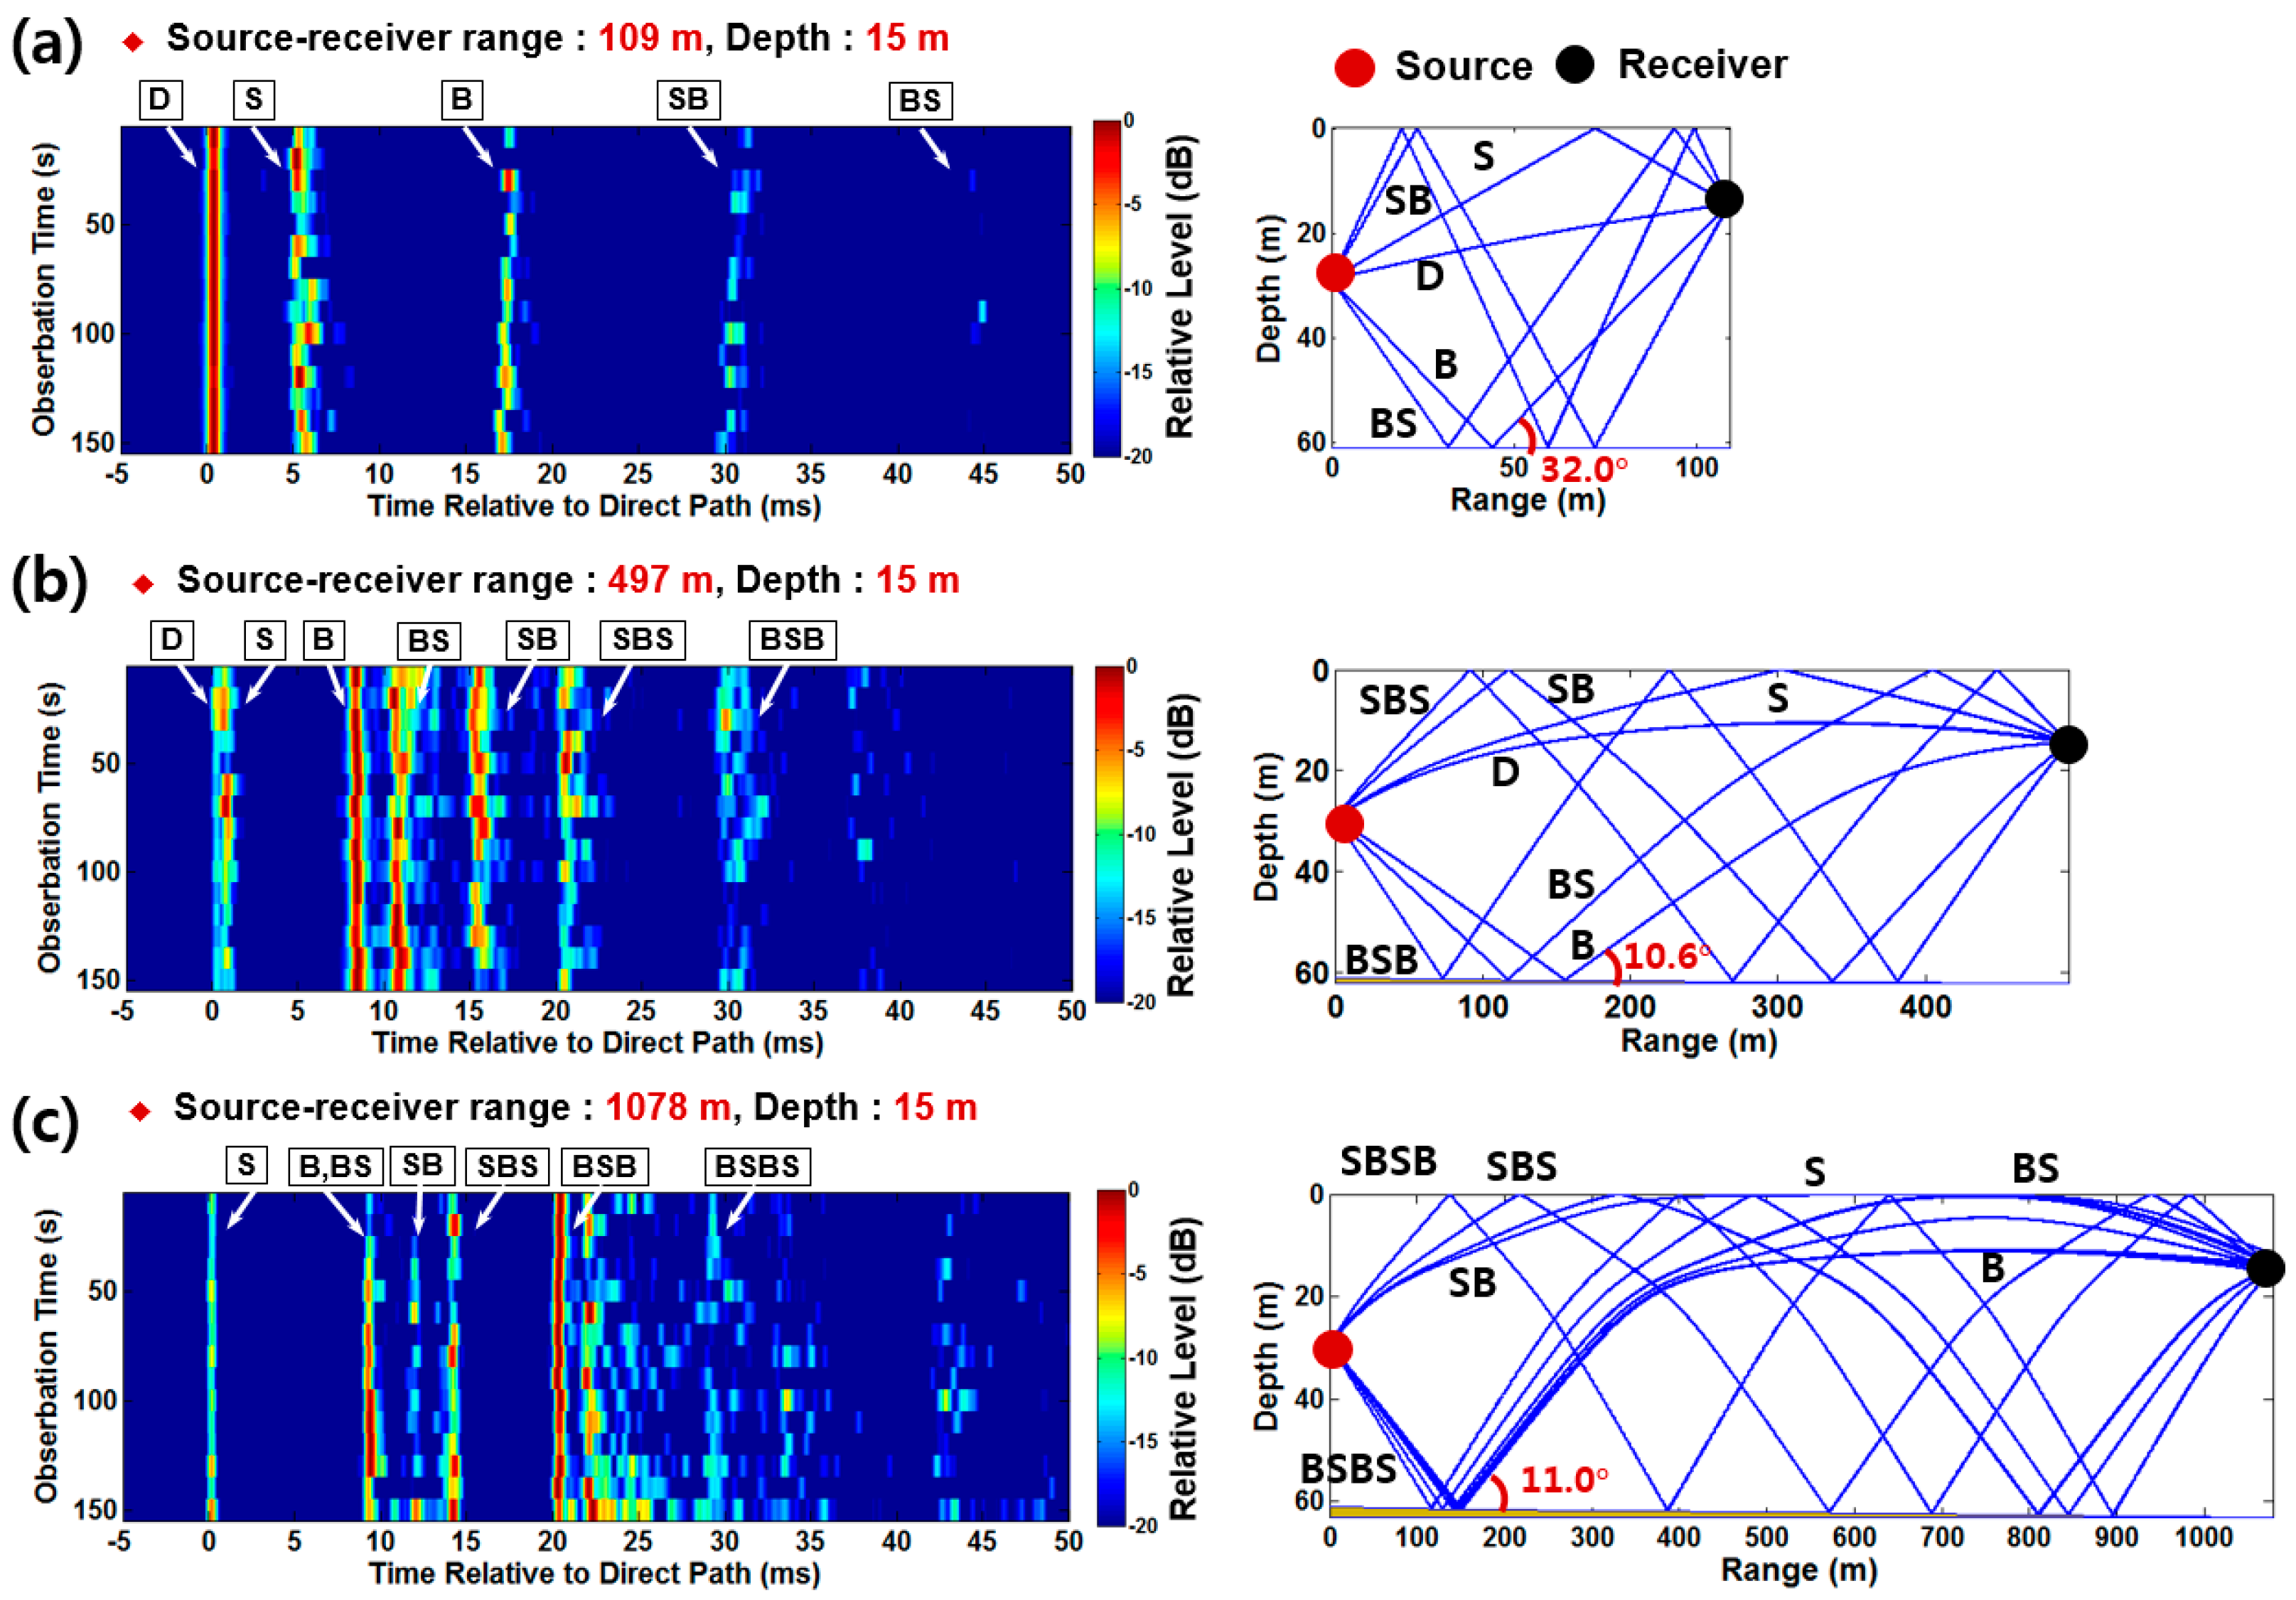
Figure 5.
Right-hand side of the -function obtained using (a) a single receiver and (b) four receivers.
Figure 5.
Right-hand side of the -function obtained using (a) a single receiver and (b) four receivers.
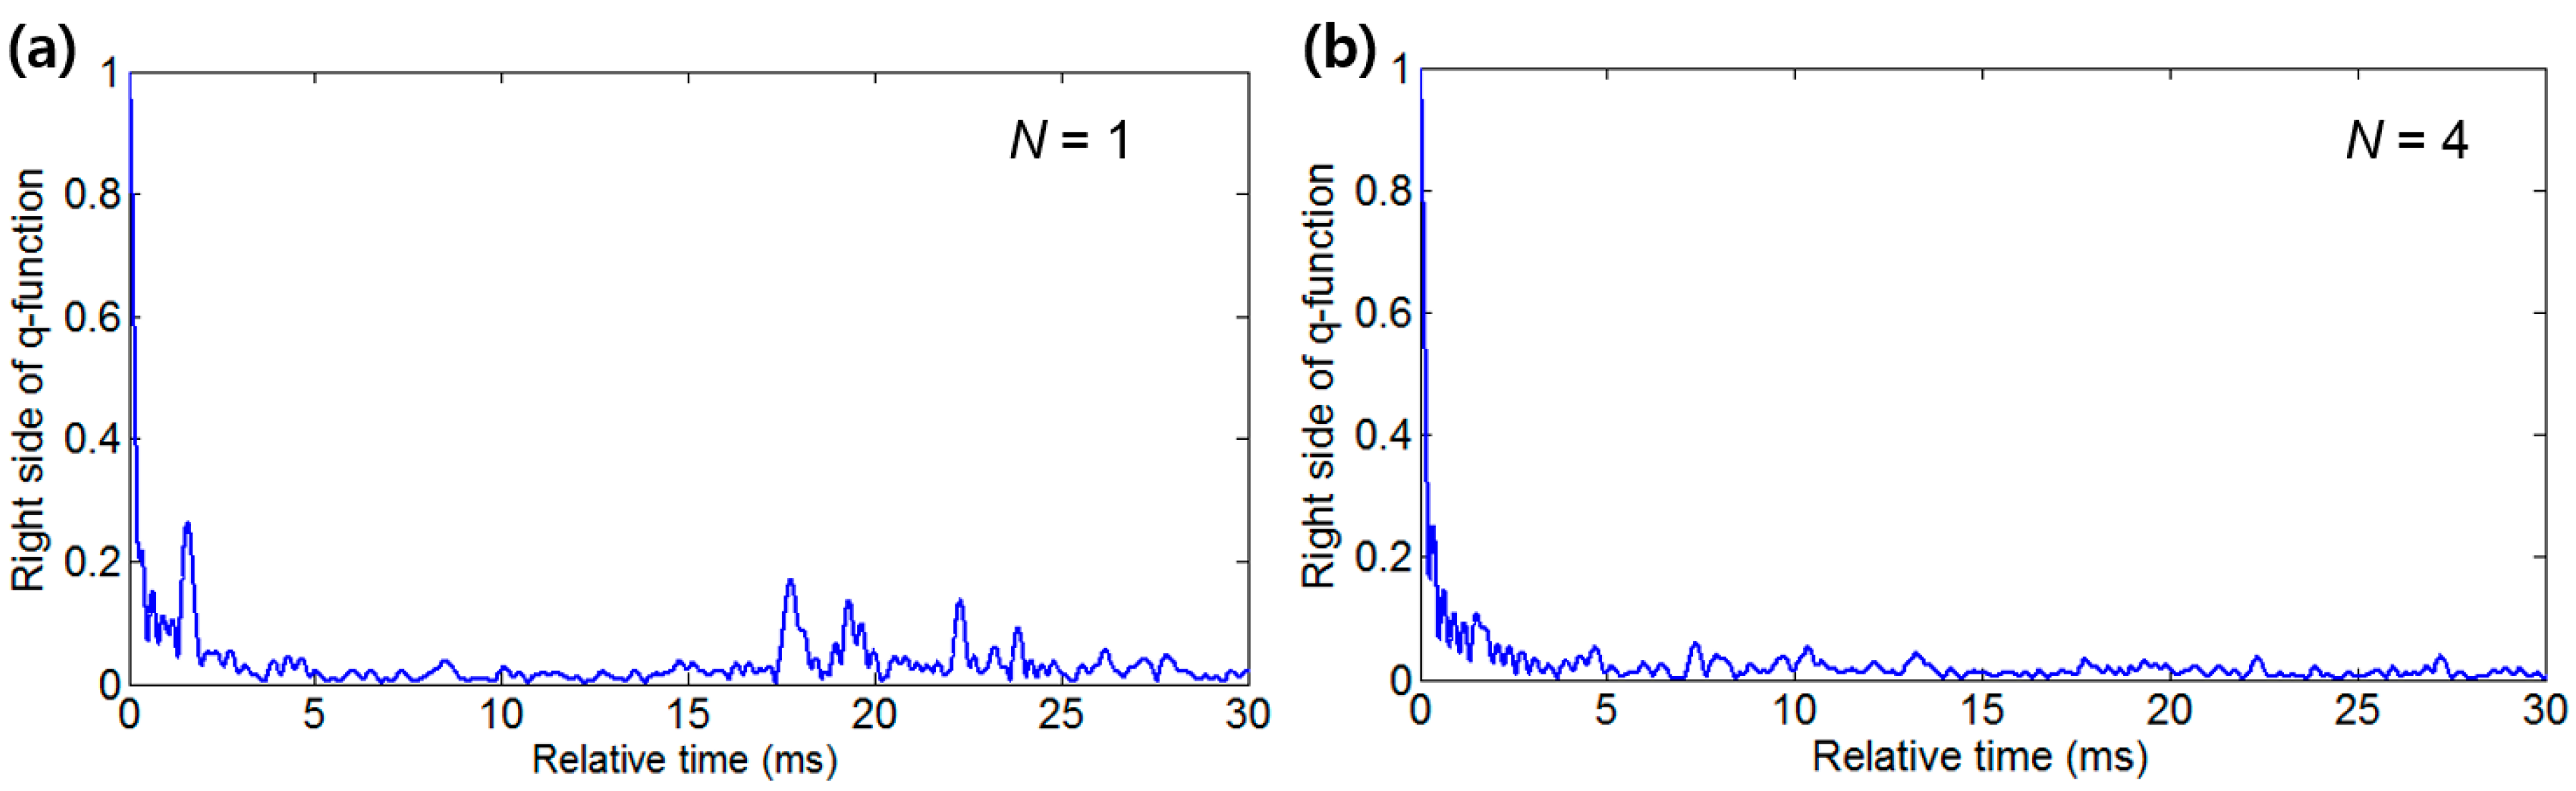
Figure 6.
Comparisons of the to (a) the BER and (b) the output SNR for sites 1 and 2; Comparison between the BER and the side-lobe to main-lobe ratio is shown in (c).
Figure 6.
Comparisons of the to (a) the BER and (b) the output SNR for sites 1 and 2; Comparison between the BER and the side-lobe to main-lobe ratio is shown in (c).

© 2017 by the authors. Licensee MDPI, Basel, Switzerland. This article is an open access article distributed under the terms and conditions of the Creative Commons Attribution (CC BY) license (http://creativecommons.org/licenses/by/4.0/).
Share and Cite
MDPI and ACS Style
Kim, S.; Son, S.-U.; Kim, H.; Choi, K.-H.; Choi, J.W. Estimate of Passive Time Reversal Communication Performance in Shallow Water. Appl. Sci. 2018, 8, 23. https://doi.org/10.3390/app8010023
AMA Style
Kim S, Son S-U, Kim H, Choi K-H, Choi JW. Estimate of Passive Time Reversal Communication Performance in Shallow Water. Applied Sciences. 2018; 8(1):23. https://doi.org/10.3390/app8010023
Chicago/Turabian StyleKim, Sunhyo, Su-Uk Son, Hyeonsu Kim, Kang-Hoon Choi, and Jee Woong Choi. 2018. "Estimate of Passive Time Reversal Communication Performance in Shallow Water" Applied Sciences 8, no. 1: 23. https://doi.org/10.3390/app8010023
Note that from the first issue of 2016, this journal uses article numbers instead of page numbers. See further details here.