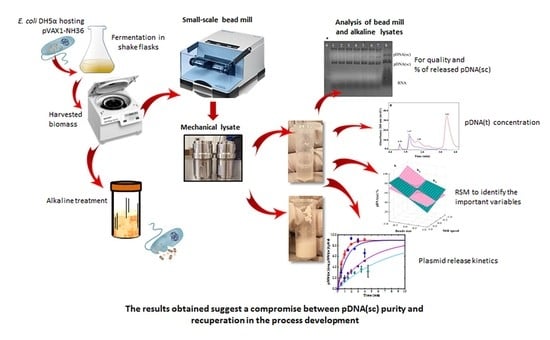
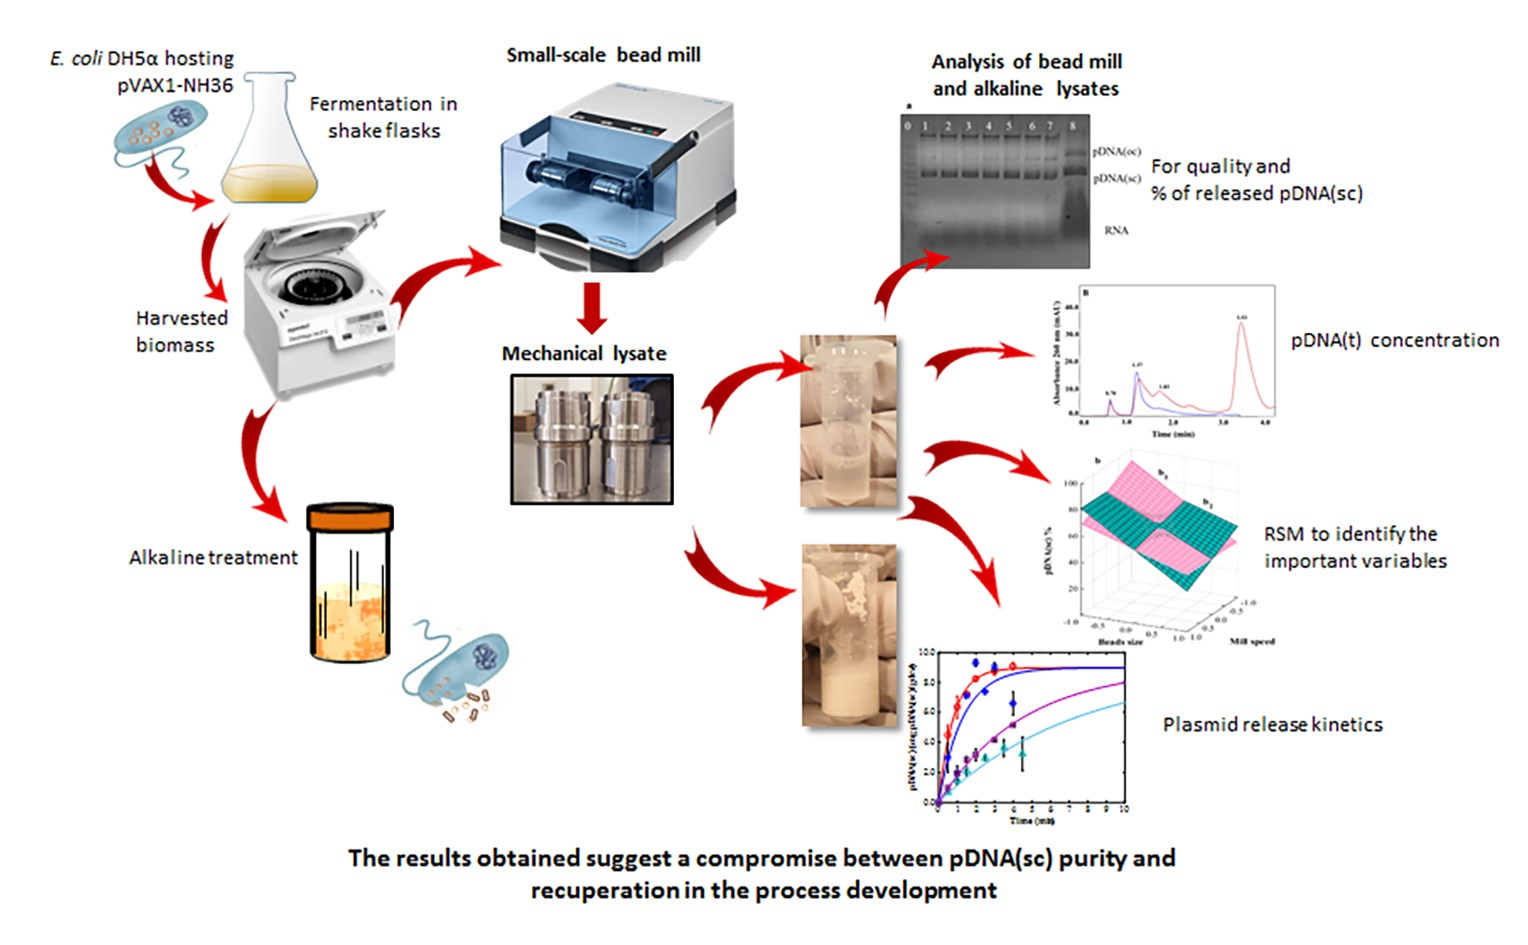
Efficient Disruption of Escherichia coli for Plasmid DNA Recovery in a Bead Mill

 , ,
, ,
Abstract
:Featured Application
Abstract
1. Introduction
2. Materials and Methods
2.1. Fermentation
2.2. Primary Recovery
2.2.1. Mechanical Lysis
2.2.2. Alkaline Treatment
2.3. Sample Analysis
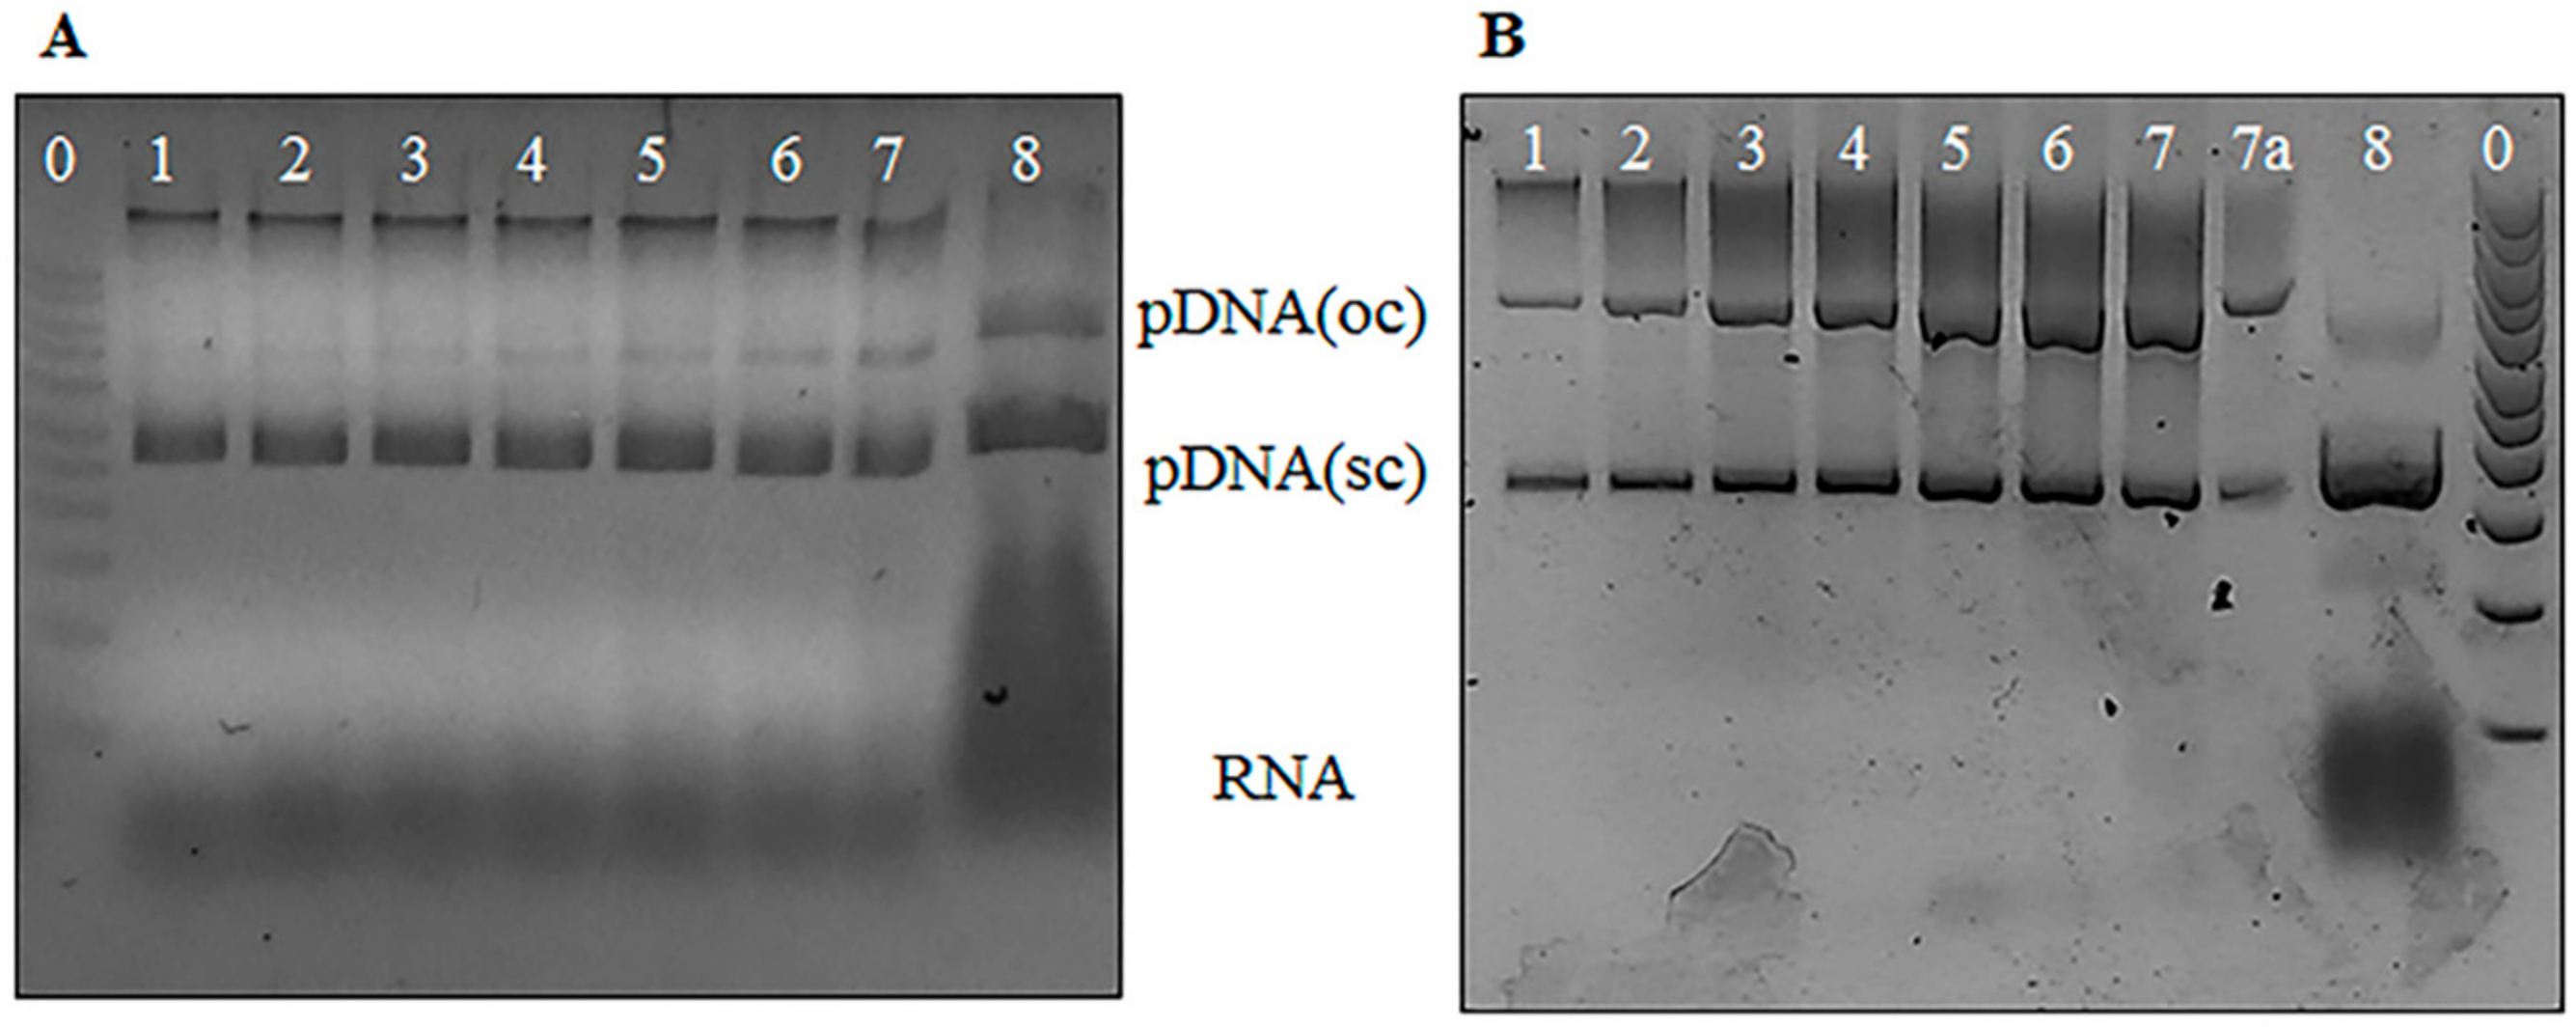
2.3.1. Agarose Gel Electrophoresis Analysis
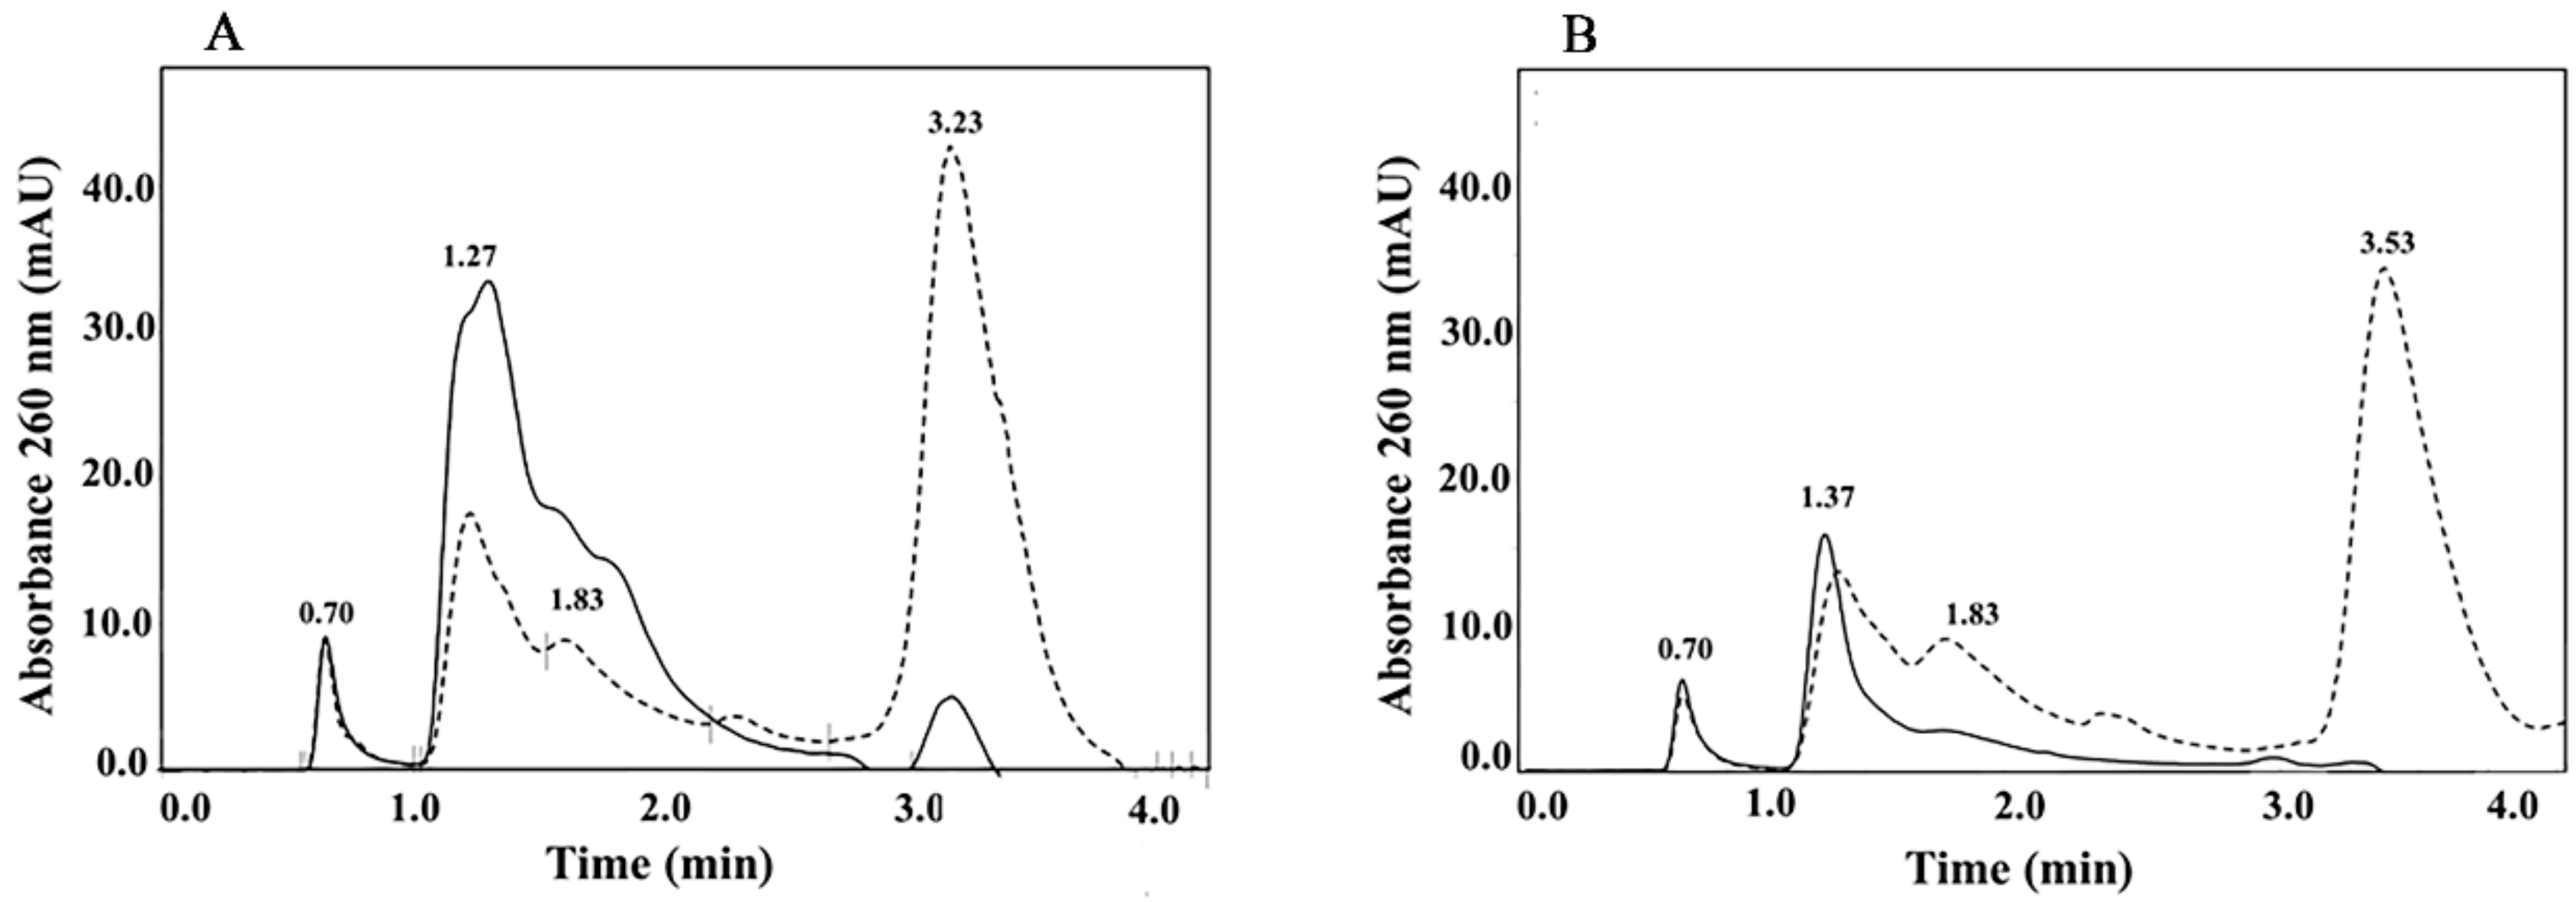
2.3.2. High Performance Hydrophobic Interaction Chromatography
2.4. Response Surface Methodology
2.5. Plasmid Release Kinetics
3. Results and Discussion
3.1. Agarose Gel Electrophoresis Analysis
3.2. High Performance Hydrophobic Interaction Chromatography
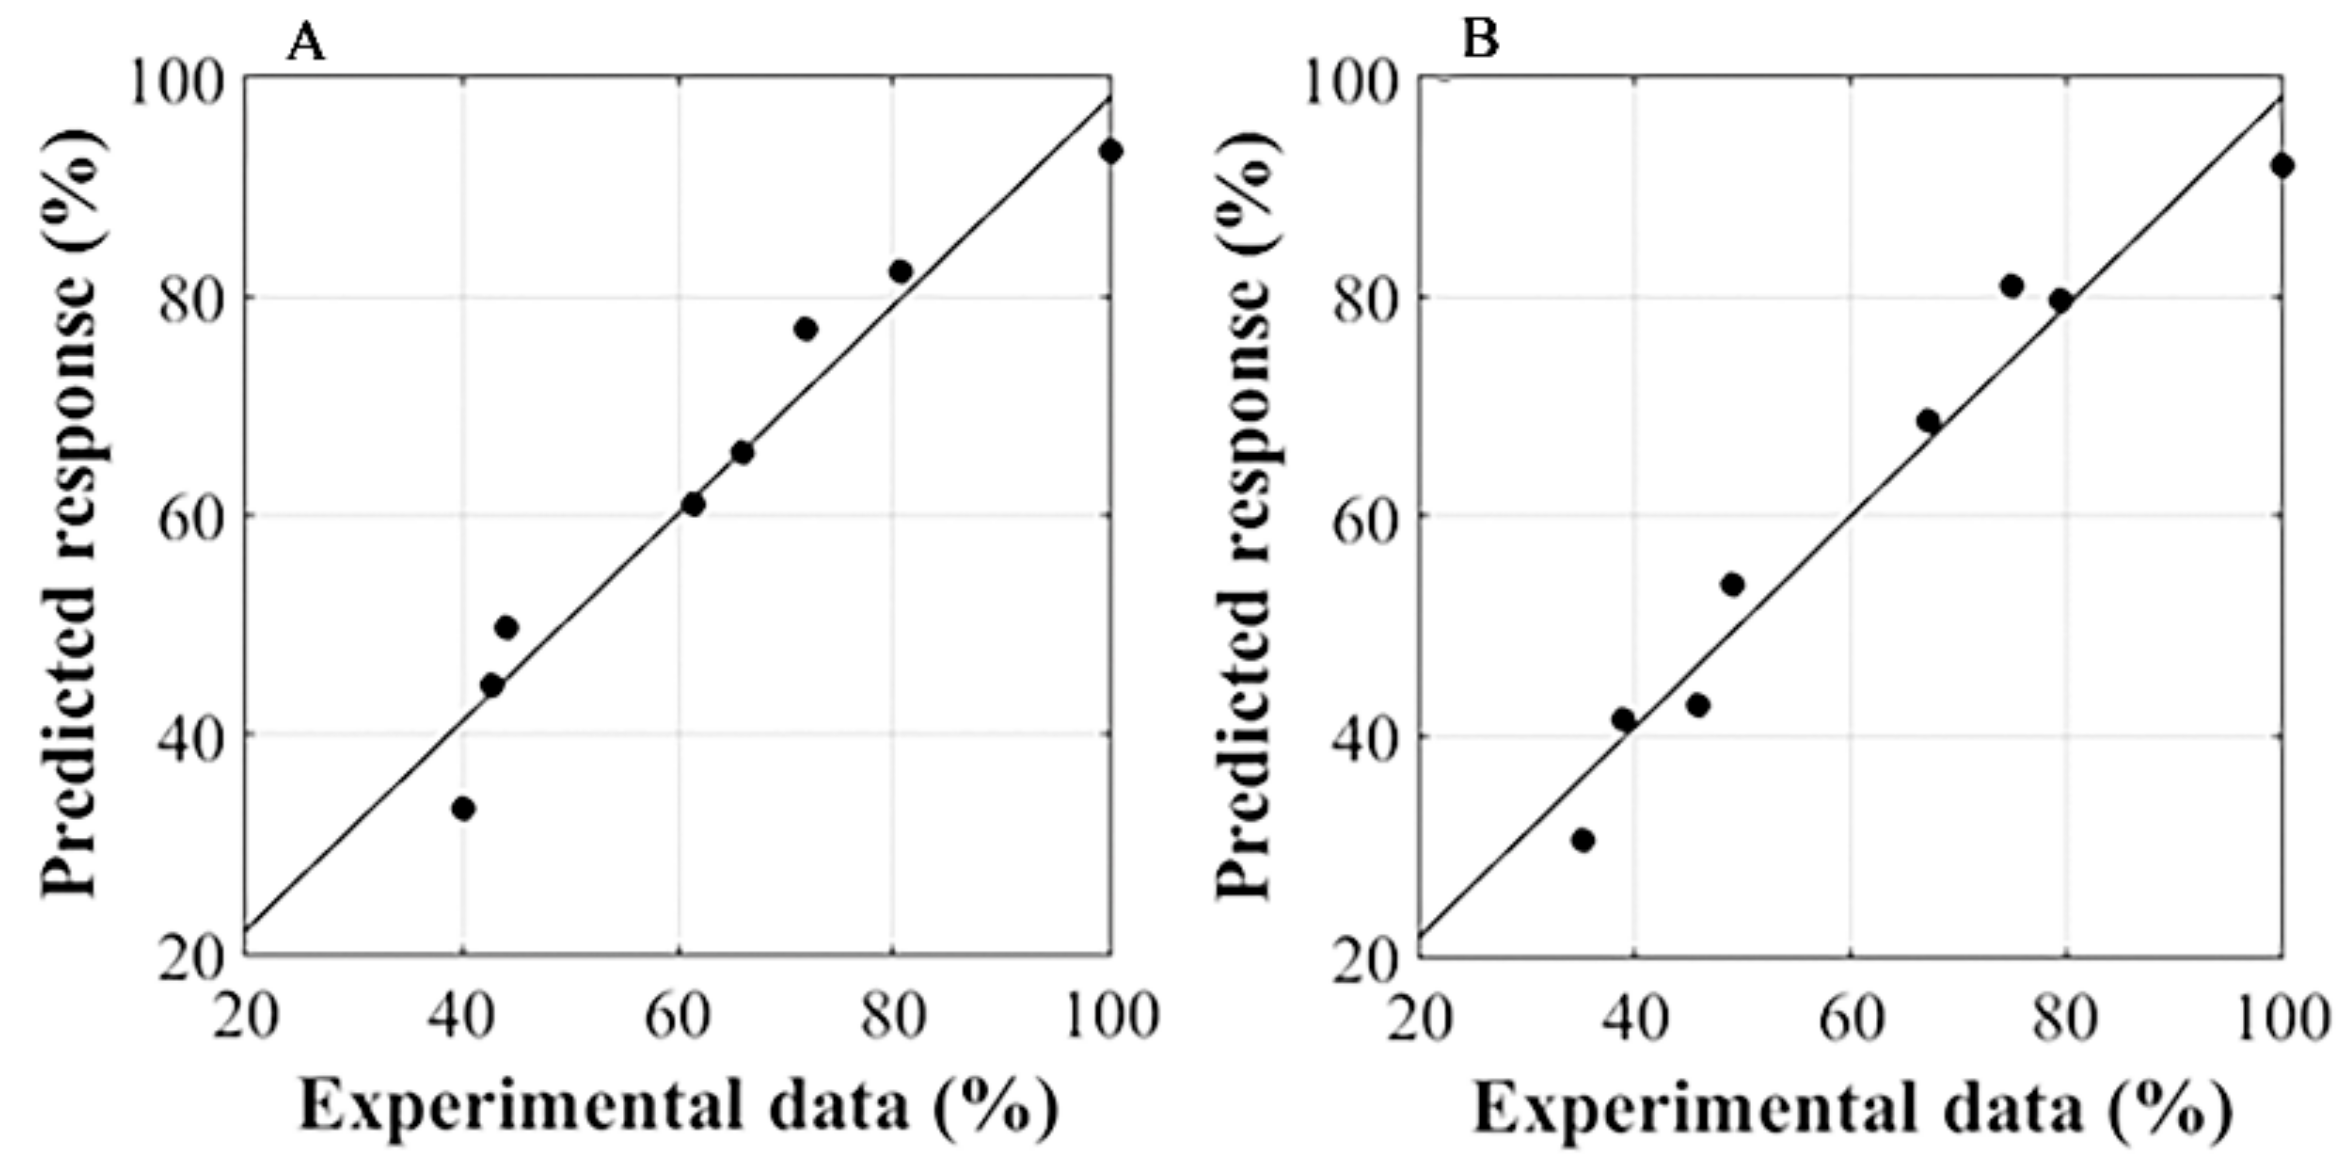
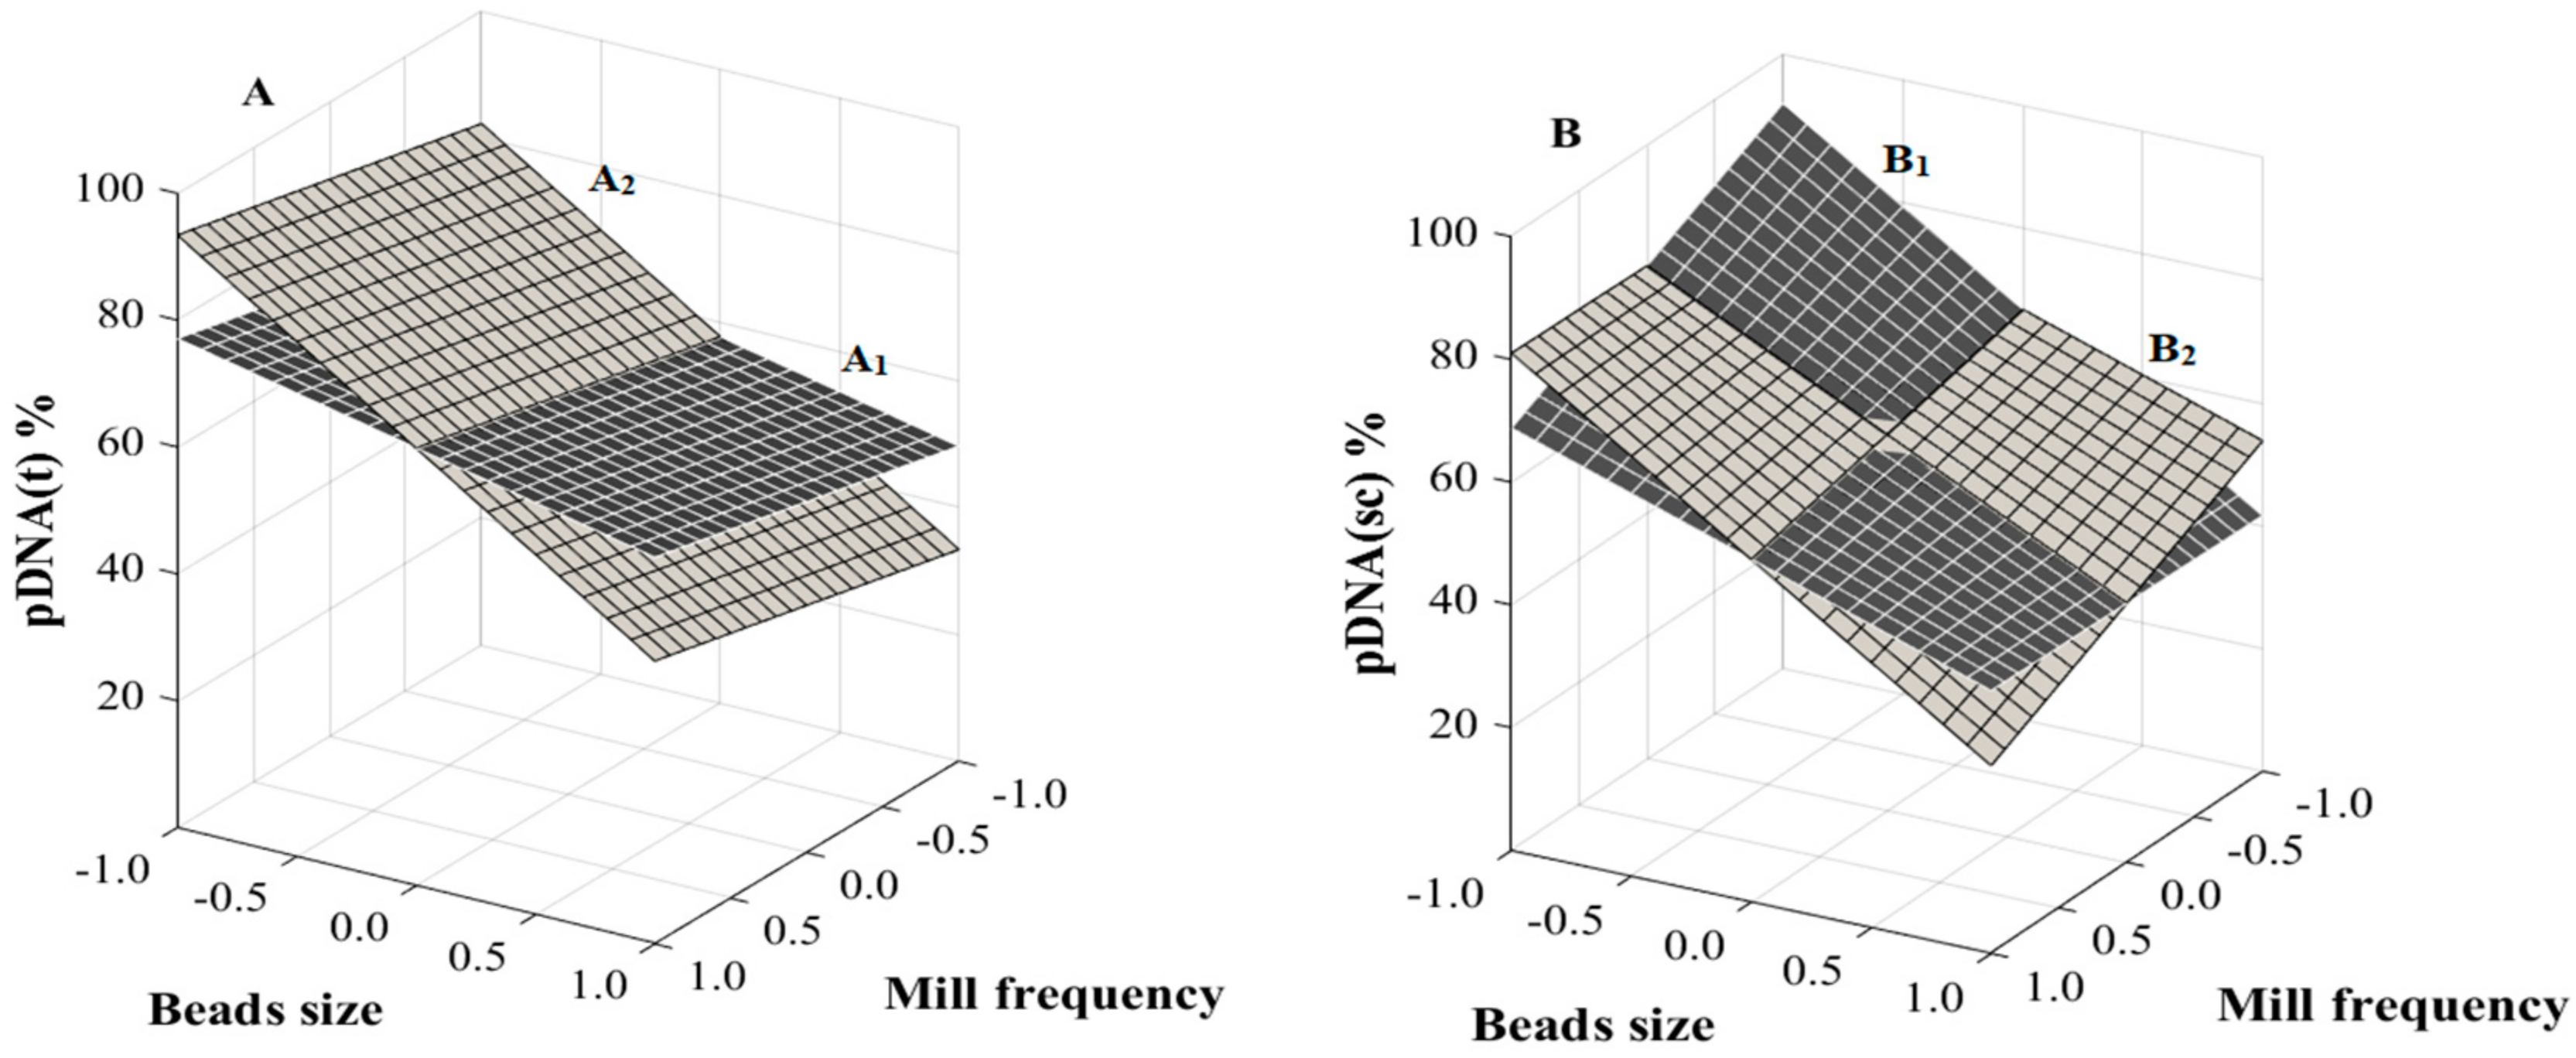
3.3. RSM Analysis
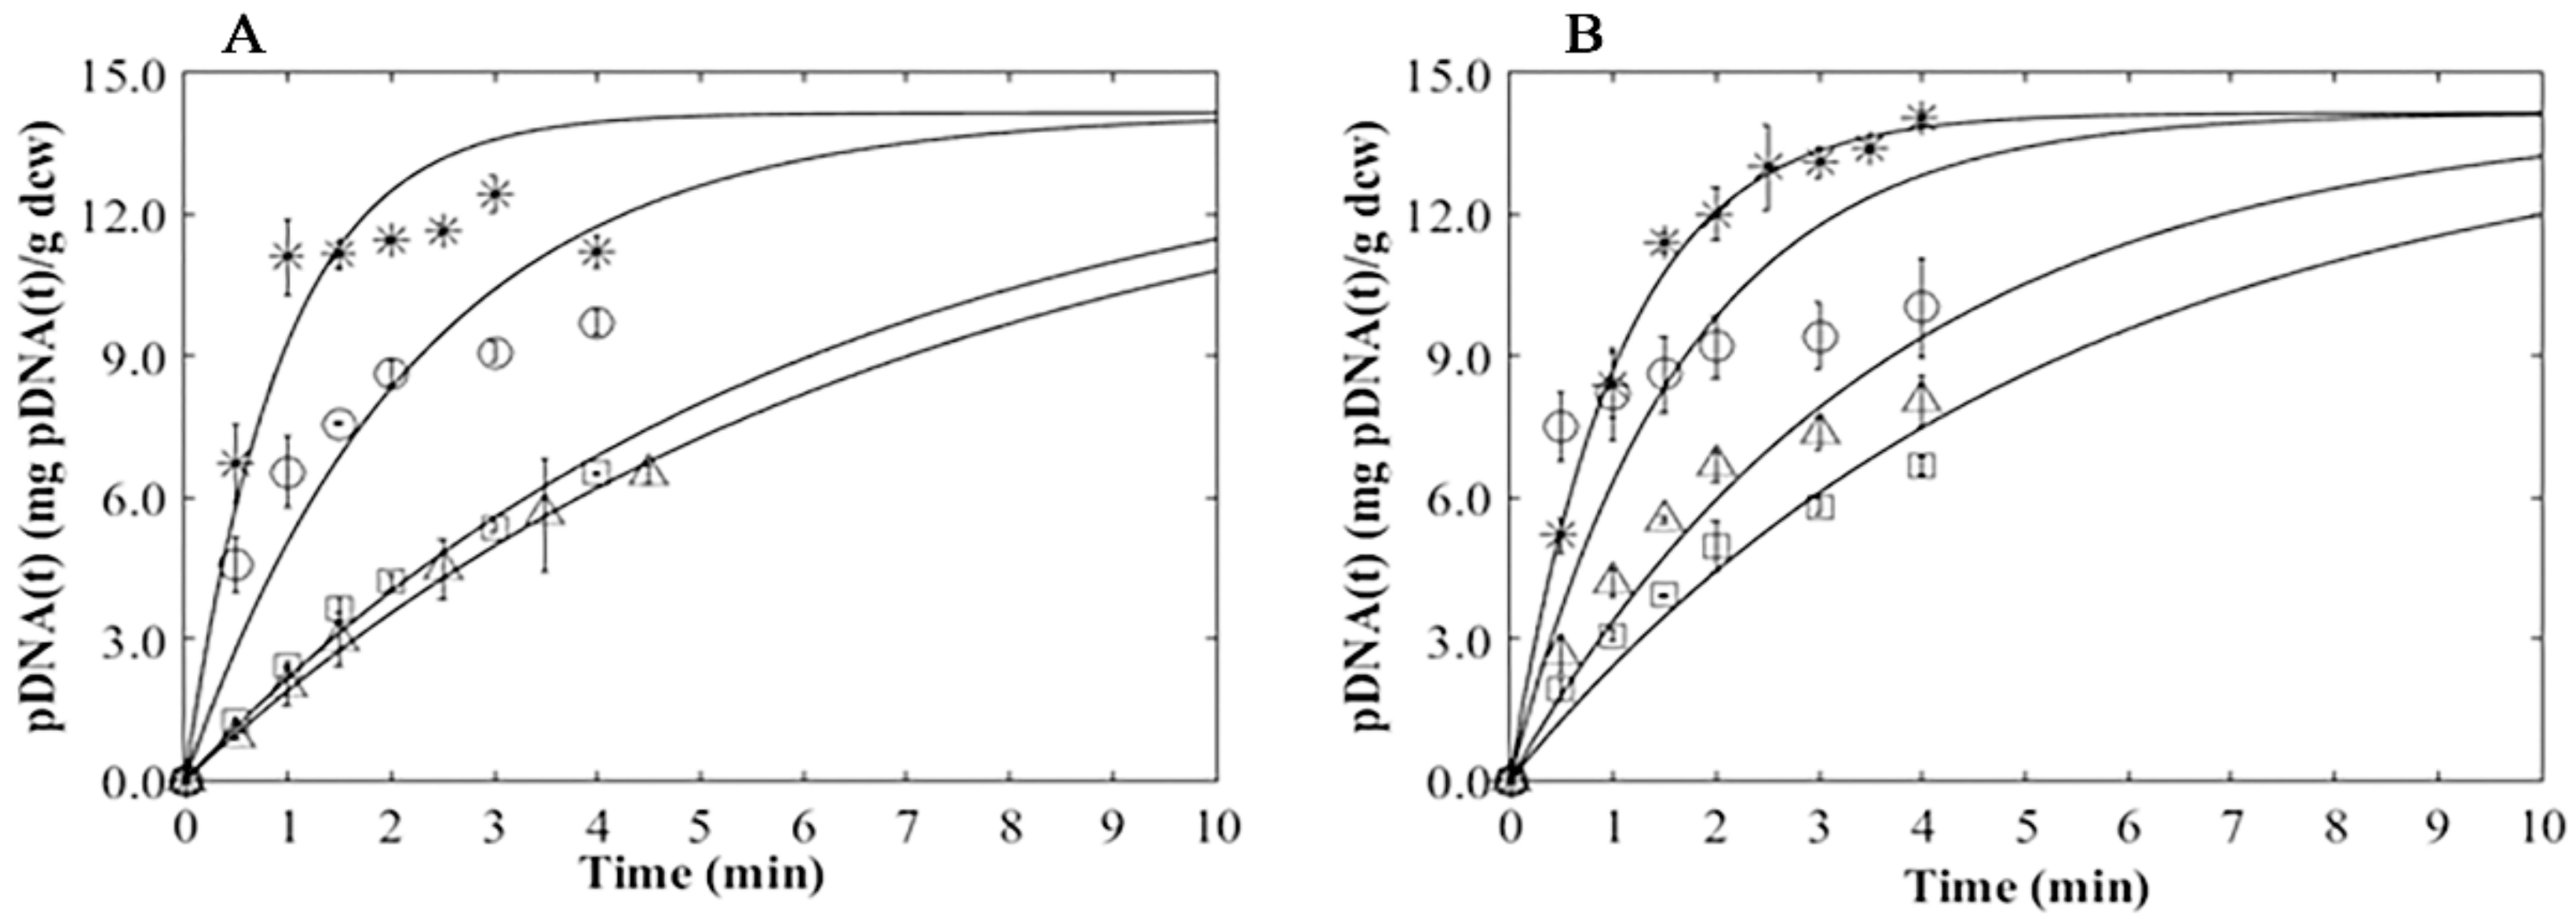
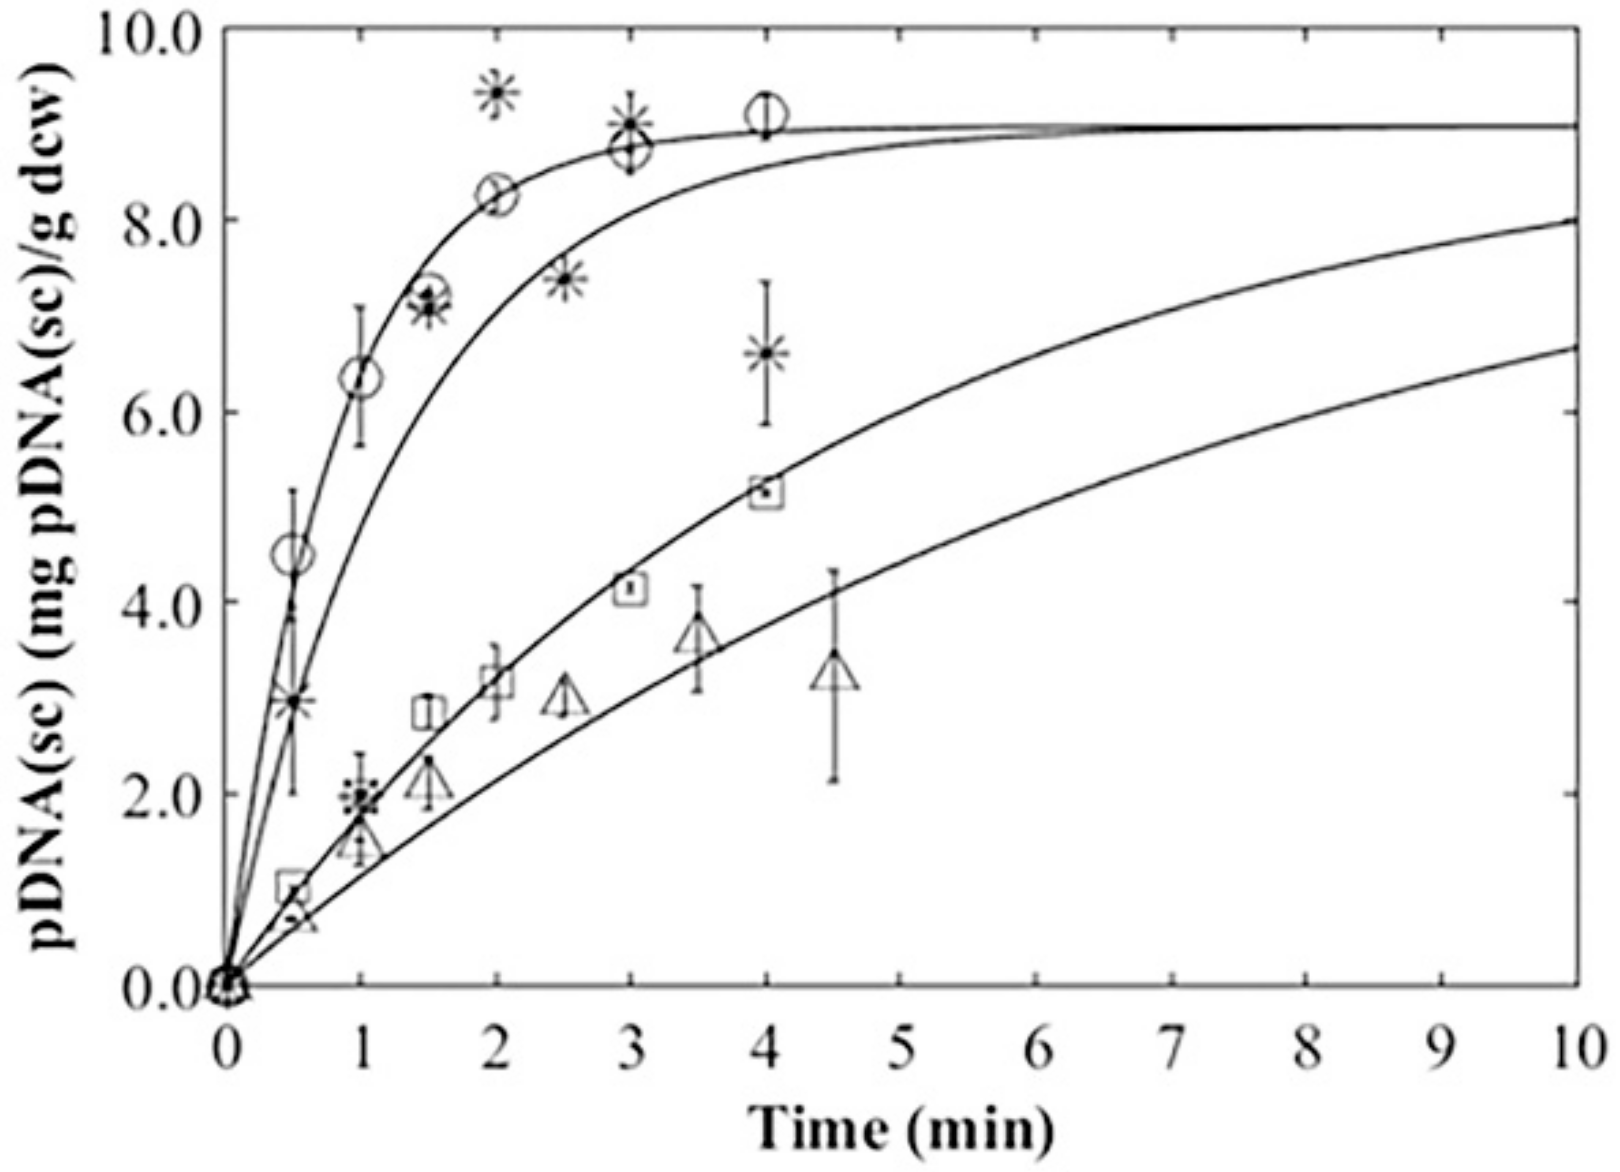
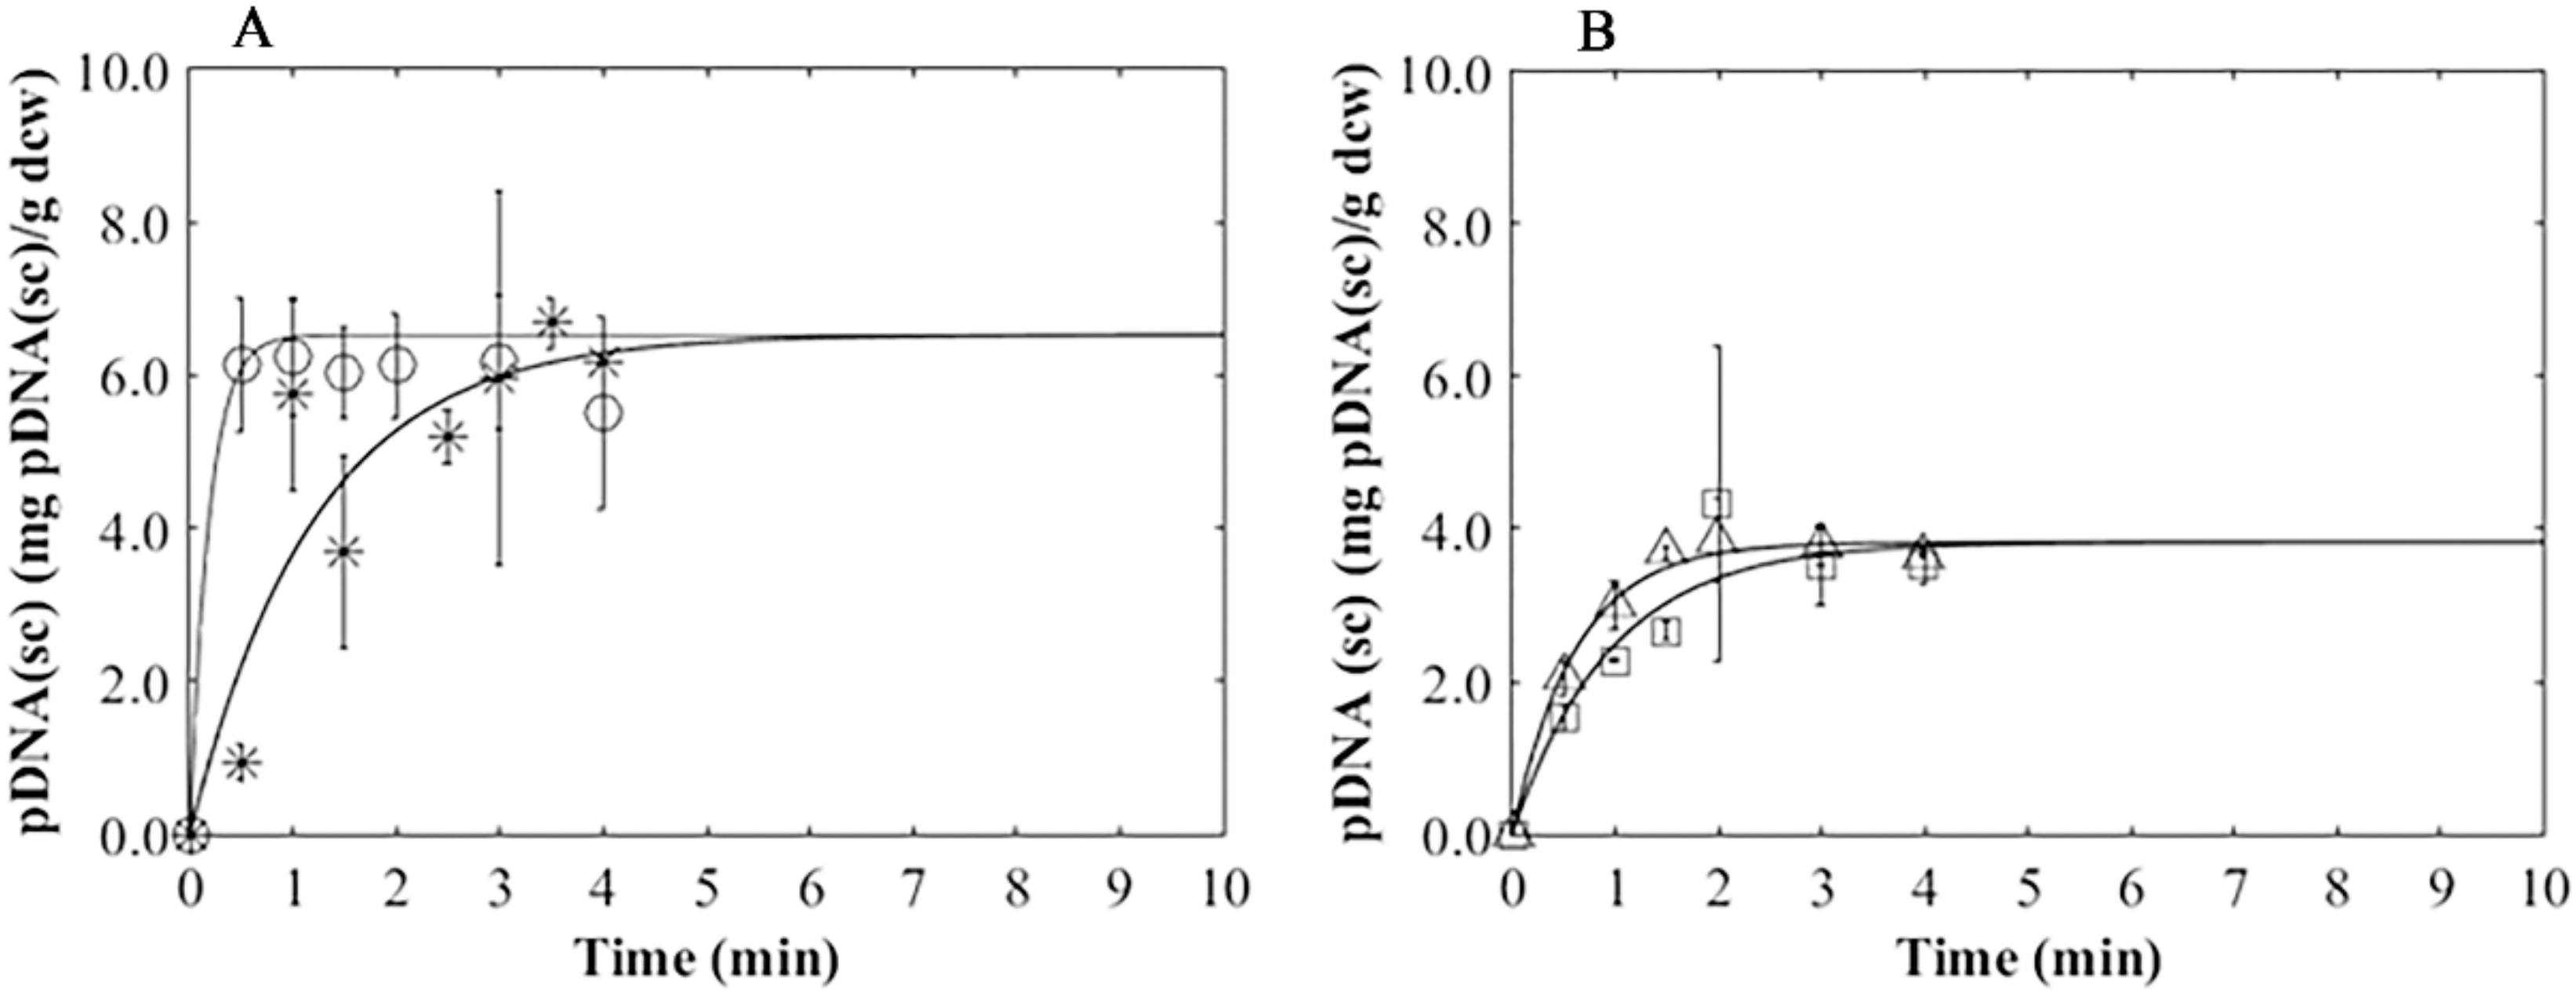
3.4. Plasmid Release Kinetics
4. Conclusions
Acknowledgments
Author Contributions
Conflicts of Interest
References
- Li, L.; Saade, F.; Petrovsky, N. The future of human DNA vaccines. J. Biotechnol. 2012, 162, 171–182. [Google Scholar] [CrossRef] [PubMed]
- Bohle, K.; Ross, A. Plasmid DNA production for pharmaceutical use: Role of specific growth rate and impact on process design. Biotechnol. Bioeng. 2011, 108, 2099–2106. [Google Scholar] [CrossRef] [PubMed]
- Anderson, R.J.; Schneider, J. Plasmid DNA and viral vector-based vaccines for the treatment of cancer. Vaccine 2007, 25, B24–B34. [Google Scholar] [CrossRef] [PubMed]
- Prazeres, D.M.F.; Monteiro, G.A.; Ferreira, G.N.M.; Diogo, M.M.; Ribeiro, S.C.; Cabral, J.M.S. Purification of plasmids for gene therapy and DNA vaccination. In Biotechnology Annual Review; Elsevier: Amsterdam, The Netherlands, 2001; Volume 7, pp. 1–30. [Google Scholar]
- Prazeres, D.M.F. Plasmid Biopharmaceuticals: Basics, Applications, and Manufacturing; John Wiley & Sons: Hoboken, NJ, USA, 2011. [Google Scholar]
- Song, D.D.; Jacques, N.A. Cell disruption of escherichia coli by glass bead stirring for the recovery of recombinant proteins. Anal. Biochem. 1997, 248, 300–301. [Google Scholar] [CrossRef] [PubMed]
- Carnes, A.E.; Williams, J.A. Plasmid DNA manufacturing technology. Recent Pat. Biotechnol. 2007, 1, 151–166. [Google Scholar] [CrossRef] [PubMed]
- Birnboim, H.C.; Doly, J. A rapid alkaline extraction procedure for screening recombinant plasmid DNA. Nucleic Acids Res. 1979, 7, 1513–1523. [Google Scholar] [CrossRef] [PubMed]
- Wahlund, P.O.; Gustavsson, P.E.; Izumrudov, V.A.; Larsson, P.O.; Galaev, I.Y. Precipitation by polycation as capture step in purification of plasmid DNA from a clarified lysate. Biotechnol. Bioeng. 2004, 87, 675–684. [Google Scholar] [CrossRef] [PubMed]
- Lezin, G.; Kosaka, Y.; Yost, H.J.; Kuehn, M.R.; Brunelli, L. A one-step miniprep for the isolation of plasmid DNA and lambda phage particles. PLoS ONE 2011, 6, e23457. [Google Scholar] [CrossRef] [PubMed]
- Bag, S.; Saha, B.; Mehta, O.; Anbumani, D.; Kumar, N.; Dayal, M.; Pant, A.; Kumar, P.; Saxena, S.; Allin, K.H.; et al. An improved method for high quality metagenomics DNA extraction from human and environmental samples. Sci. Rep. 2016, 6, 26775. [Google Scholar] [CrossRef] [PubMed]
- Escobedo, C.; Burgel, S.C.; Kemmerling, S.; Sauter, N.; Braun, T.; Hierlemann, A. On-chip lysis of mammalian cells through a handheld corona device. Lab Chip 2015, 15, 2990–2997. [Google Scholar] [CrossRef] [PubMed]
- Holmes, D.S.; Quigley, M. A rapid boiling method for the preparation of bacterial plasmids. Anal. Biochem. 1981, 114, 193–197. [Google Scholar] [CrossRef]
- Williams, J.A.; Hodgson, C.P.; Carnes, A.E. E. coli Plasmid DNA Production. U.S. Patent 20100184157, 22 July 2010. [Google Scholar]
- Thatcher, D.R.; Hitchcock, A.; Hanak, J.A.J.; Varley, D.L. Method of Plasmid DNA Production and Purification. U.S. Patent 5981735, 7 January 2003. [Google Scholar]
- Byreddy, A.; Gupta, A.; Barrow, C.; Puri, M. Comparison of cell disruption methods for improving lipid extraction from thraustochytrid strains. Mar. Drugs 2015, 13, 5111–5127. [Google Scholar] [CrossRef] [PubMed]
- Middelberg, A.P.J. Process-scale disruption of microorganisms. Biotechnol. Adv. 1995, 13, 491–551. [Google Scholar] [CrossRef]
- Haque, S.; Khan, S.; Wahid, M.; Mandal, R.K.; Tiwari, D.; Dar, S.A.; Paul, D.; Areeshi, M.Y.; Jawed, A. Modeling and optimization of a continuous bead milling process for bacterial cell lysis using response surface methodology. RSC Adv. 2016, 6, 16348–16357. [Google Scholar] [CrossRef]
- Liu, D.; Ding, L.; Sun, J.; Boussetta, N.; Vorobiev, E. Yeast cell disruption strategies for recovery of intracellular bio-active compounds—A review. Innov. Food Sci. Emerg. Technol. 2016, 36, 181–192. [Google Scholar] [CrossRef]
- Limon-Lason, J.; Hoare, M.; Orsborn, C.B.; Doyle, D.J.; Dunnill, P. Reactor properties of a high-speed bead mill for microbial cell rupture. Biotechnol. Bioeng. 1979, 21, 745–774. [Google Scholar] [CrossRef]
- Geciova, J.; Bury, D.; Jelen, P. Methods for disruption of microbial cells for potential use in the dairy industry—A review. Int. Dairy J. 2002, 12, 541–553. [Google Scholar] [CrossRef]
- Dubey, K.K.; Jawed, A.; Haque, S. Enhanced extraction of 3-demethylated colchicine from fermentation broth of bacillus megaterium: Optimization of process parameters by statistical experimental design. Eng. Life Sci. 2011, 11, 598–606. [Google Scholar] [CrossRef]
- Akbari, V.; Sadeghi, H.M.; Jafarian-Dehkordi, A.; Chou, C.P.; Abedi, D. Optimization of a single-chain antibody fragment overexpression in escherichia coli using response surface methodology. Res. Pharm. Sci. 2014, 10, 75–83. [Google Scholar]
- Piccolomini, A.A.; Fiabon, A.; Borrotti, M.; De Lucrezia, D. Optimization of thermophilic trans-isoprenyl diphosphate synthase expression in escherichia coli by response surface methodology. Biotechnol. Appl. Biochem. 2017, 64, 70–78. [Google Scholar] [CrossRef] [PubMed]
- Morin, A.; Leblanc, D.; Roy, D. Laboratory scale disruption of microorganisms with a 180 ml grinding vessel adapted to a commercial mixer mill. J. Microbiol. Methods 1992, 15, 17–23. [Google Scholar] [CrossRef]
- Diogo, M.M.; Queiroz, J.A.; Prazeres, D.M. Assessment of purity and quantification of plasmid DNA in process solutions using high-performance hydrophobic interaction chromatography. J. Chromatogr. A 2003, 998, 109–117. [Google Scholar] [CrossRef]
- Ushijima, Y.; Ohniwa, R.L.; Morikawa, K. In vitro DNA protection assay using oxidative stress. Bio-Protocol 2015, 5, 1–5. [Google Scholar] [CrossRef]
- Sabirova, J.S.; Hernalsteens, J.-P.; De Backer, S.; Xavier, B.B.; Moons, P.; Turlej-Rogacka, A.; De Greve, H.; Goossens, H.; Malhotra-Kumar, S. Fatty acid kinase a is an important determinant of biofilm formation in staphylococcus aureus usa300. BMC Genom. 2015, 16, 861. [Google Scholar] [CrossRef] [PubMed]
- Islas-Lugo, F.; Vega-Estrada, J.; Alvis, C.A.; Ortega-López, J.; del Carmen Montes-Horcasitas, M. Developing strategies to increase plasmid DNA production in escherichia coli dh5α using batch culture. J. Biotechnol. 2016, 233, 66–73. [Google Scholar] [CrossRef] [PubMed]
- Trujillo-Ortiz, A.R.; Hernandez-Walls, F.A. Trujillo-Perez. 23fd:2^3 Factorial Design Analysis; A MATLAB file; Matlab Central: Natick, MA, USA, 2005; Available online: http://www.mathworks.com/matlabcentral/fileexchange/loadFile.do?objectId=9448% (accessed on 29 May 2017).
- Ramanan, R.N.; Ling, T.C.; Ariff, A.B. The performance of a glass bead shaking technique for the disruption of escherichia coli cells. Biotechnol. Bioprocess Eng. 2008, 13, 613–623. [Google Scholar] [CrossRef]
- Rivera, M.C.; Maguire, B.; Lake, J.A. Isolation of ribosomes and polysomes. Cold Spring Harb. Protoc. 2015, 2015, 293–299. [Google Scholar] [CrossRef] [PubMed]
- Franco-Medrano, D.I.; Guerrero-Germán, P.; Montesinos-Cisneros, R.M.; Ortega-López, J.; Tejeda-Mansir, A. Plasmid pvax1-nh36 purification by membrane and bead perfusion chromatography. Bioprocess Biosyst. Eng. 2017, 40, 463–471. [Google Scholar] [CrossRef] [PubMed]
- Guerrero-German, P.; Prazeres, D.M.; Guzman, R.; Montesinos-Cisneros, R.M.; Tejeda-Mansir, A. Purification of plasmid DNA using tangential flow filtration and tandem anion-exchange membrane chromatography. Bioprocess Biosyst. Eng. 2009, 32, 615–623. [Google Scholar] [CrossRef] [PubMed]
- Sousa, F.; Freitas, S.; Azzoni, A.R.; Prazeres, D.M.F.; Queiroz, J. Selective purification of supercoiled plasmid DNA from clarified cell lysates with a single histidine–agarose chromatography step. Biotechnol. Appl. Biochem. 2006, 45, 131–140. [Google Scholar] [PubMed]
- Carlson, A.; Signs, M.; Liermann, L.; Boor, R.; Jem, K.J. Mechanical disruption of escherichia coli for plasmid recovery. Biotechnol. Bioeng. 1995, 48, 303–315. [Google Scholar] [CrossRef] [PubMed]
- Haque, S.; Khan, S.; Wahid, M.; Dar, S.A.; Soni, N.; Mandal, R.K.; Singh, V.; Tiwari, D.; Lohani, M.; Areeshi, M.Y.; et al. Artificial intelligence vs. Statistical modeling and optimization of continuous bead milling process for bacterial cell lysis. Front. Microbiol. 2016, 7, 1852. [Google Scholar] [CrossRef] [PubMed]
- Gers, R.; Climent, E.; Legendre, D.; Anne-Archard, D.; Frances, C. Numerical modelling of grinding in a stirred media mill: Hydrodynamics and collision characteristics. Chem. Eng. Sci. 2010, 65, 2052–2064. [Google Scholar] [CrossRef] [Green Version]
- Prather, K.J.; Sagar, S.; Murphy, J.; Chartrain, M. Industrial scale production of plasmid DNA for vaccine and gene therapy: Plasmid design, production, and purification. Enzyme Microb. Technol. 2003, 33, 865–883. [Google Scholar] [CrossRef]
- Belo, I.; Santos, J.A.L.; Cabral, J.M.S.; Mota, M. Optimization study of escherichia colitb1 cell disruption for cytochrome b5 recovery in a small-scale bead mill. Biotechnol. Progr. 1996, 12, 201–204. [Google Scholar] [CrossRef] [PubMed] [Green Version]


| Exp. No. | Treatment | (1) Mill Frequency | (2) Cell Concentration | (3) Bead Size |
|---|---|---|---|---|
| 1 | (1) | − | − | − |
| 2 | E1 | + | − | − |
| 3 | E2 | − | + | − |
| 4 | E12 | + | + | − |
| 5 | E3 | − | − | + |
| 6 | E13 | + | - | + |
| 7 | E23 | − | + | + |
| 8 | E123 | + | + | + |
| Level (−) | 15 Hz | 10 g wcw/L | 0.10–0.25 mm | |
| Level (+) | 30 Hz | 20 g wcw/L | 0.25–0.50 mm |
| Experiment | pDNA(t) % | pDNA(sc) % |
|---|---|---|
| 1 | 66.06 | 100.00 |
| 2 | 71.87 | 67.30 |
| 3 | 80.56 | 79.52 |
| 4 | 100.00 | 74.93 |
| 5 | 44.26 | 38.94 |
| 6 | 61.37 | 45.90 |
| 7 | 40.20 | 48.94 |
| 8 | 42.80 | 35.20 |
| Avg | 63.39 | 61.34 |
© 2017 by the authors. Licensee MDPI, Basel, Switzerland. This article is an open access article distributed under the terms and conditions of the Creative Commons Attribution (CC BY) license (http://creativecommons.org/licenses/by/4.0/).
Share and Cite
Padilla-Zamudio, A.; Lucero-Acuña, J.A.; Guerrero-Germán, P.; Ortega-López, J.; Tejeda-Mansir, A. Efficient Disruption of Escherichia coli for Plasmid DNA Recovery in a Bead Mill. Appl. Sci. 2018, 8, 30. https://doi.org/10.3390/app8010030
Padilla-Zamudio A, Lucero-Acuña JA, Guerrero-Germán P, Ortega-López J, Tejeda-Mansir A. Efficient Disruption of Escherichia coli for Plasmid DNA Recovery in a Bead Mill. Applied Sciences. 2018; 8(1):30. https://doi.org/10.3390/app8010030
Chicago/Turabian StylePadilla-Zamudio, Adriana, J. Armando Lucero-Acuña, Patricia Guerrero-Germán, Jaime Ortega-López, and Armando Tejeda-Mansir. 2018. "Efficient Disruption of Escherichia coli for Plasmid DNA Recovery in a Bead Mill" Applied Sciences 8, no. 1: 30. https://doi.org/10.3390/app8010030