Forced Response Prediction of Turbine Blades with Flexible Dampers: The Impact of Engineering Modelling Choices


1
Politecnico di Torino, Corso Duca degli Abruzzi 24, 10129 Torino, Italy
2
Imperial College London, South Kensington Campus, London SW7 2AZ, UK
*
Author to whom correspondence should be addressed.
Appl. Sci. 2018, 8(1), 34; https://doi.org/10.3390/app8010034
Submission received: 2 December 2017
/
Revised: 19 December 2017
/
Accepted: 23 December 2017
/
Published: 27 December 2017
(This article belongs to the Section Mechanical Engineering)
Abstract
:This paper focuses on flexible friction dampers (or “strips”) mounted on the underside of adjacent turbine blade platforms for sealing and damping purposes. A key parameter to ensure a robust and trustworthy design is the correct prediction of the maximum frequency shift induced by the strip damper coupling adjacent blades. While this topic has been extensively addressed on rigid friction dampers, both experimentally and numerically, no such investigation is available as far as flexible dampers are concerned. This paper builds on the authors’ prior experience with rigid dampers to investigate the peculiarities and challenges of a robust dynamic model of blade-strips systems. The starting point is a numerical tool implementing state-of-the-art techniques for the efficient solution of the nonlinear equations, e.g., multi-harmonic balance method with coupled static solution and state-of-the-art contact elements. The full step-by-step modelling process is here retraced and upgraded to take into account the damper flexibility: for each step, key modelling choices (e.g., mesh size, master nodes selection, contact parameters) which may affect the predicted response are addressed. The outcome is a series of guidelines which will help the designer assign numerical predictions the proper level of trust and outline a much-needed experimental campaign.
1. Introduction
Turbine blades do not benefit significantly from material hysteresis and aerodynamic damping [1,2,3]. Therefore, in order to prevent high vibration amplitude, the best option is to add external sources of damping, e.g., in the form of dry friction devices [1,4]. Dry friction can be incorporated into the blade design, in the form of shrouds [5,6,7,8], interlocked contact surfaces [9], lacing wires or zigzag pins. Alternatively, external devices such as solid dampers (available in several designs, namely cylindrical, curved flat, wedge damper, etc. [10,11,12,13,14,15,16] or thin-strip dampers [17] can be added to minimize the resonant blade response. These external dry friction dampers are extensively used in turbine designs because they are easy to manufacture, install and substitute, relatively inexpensive and can withstand high temperatures.
Among external dry friction dampers, the strip (or seal) dampers are thin flexible metallic strips which are positioned under the blade platforms of turbine bladed disks and their primary function is for cooling-air sealing purpose. They are pushed against the blade platforms by the centrifugal force. When relative motion takes place between strip and blade platforms, the friction forces dissipate vibrational energy and consequently the dynamic response of the system is damped. In this way the strips act both as friction dampers and as an additional constraint affecting the blade natural frequencies. The design of the strips, not only for sealing, but also for damping purpose, represents a topic of recent interest for the turbine designers, as very few studies can be found in literature [4,17].
In the past 15 years, the so-called solid underplatform dampers (UPDs) have been extensively investigated [18,19,20,21,22,23,24]. Most of the proposed calculation methodologies for bulk UPDs use simplifying assumptions, such as neglecting the damper inertia or flexibility [11,19,25]. However, these assumptions, perfectly adequate for solid UPDs, cannot be applied to model strip dampers, as they are highly flexible and consequently their flexible vibrational modes need to be taken into account in the modelling process through FE modelling [17].
In the present work the strip damper is in fact modelled using Finite Elements. Furthermore, the most advanced state-of-the-art calculation methods are here applied to predict the dynamic of two blades and a strip damper between them. In detail, the nonlinear forced response is calculated with high computational efficiency in the frequency domain using the multi-harmonic balance method (MHBM) [26,27,28], a reduction method is adopted to decrease the size of the blades [29] and the nonlinear equations are solved by an iterative solver using the analytical computation of the Jacobian matrix [28,30,31]. Lastly a novel technique presented in [32] ensures that the MHBM (an approximate method) offers results with an accuracy above a user-defined threshold. The key features of the numerical tool used in this paper are summarized in Section 2.
Even if preliminary calculations of the blade forced responses show the expected trend with excitation force and centrifugal force, it is shown that the natural frequency and vibration amplitude strongly depend on the choice of some key parameters. Purpose of this paper is to address the choice of these key parameters and explore the consequences of each choice on the predictions offered by the numerical simulation tool. The following key topics are addressed.
- The strip damper is modelled using finite elements given its high flexibility. Does the mesh discretization, especially around the contact area, significantly affect results?
- A subset of nodes is selected on the strip damper contact area and contact elements are applied to take into account the presence of friction. A uniform distribution of contact elements seems to be the most logical choice, but does the selected pattern (and number of contact elements) affect the position of the resonant frequencies?
- Each contact element requires calibration parameters (e.g., contact stiffness). Under which conditions do these elements most significantly affect results?
It should be noted that point 3 has been thoroughly addressed in the case of rigid dampers [33,34], however the different kinematics of the typical blade-strip system require an ad-hoc discussion. On the other hand, points 1–2 may become especially relevant in case of flexible structures such as the strip damper and no record of a thorough analysis on this subject could be found by the authors.
The main outcome of the paper is a set of guidelines and “warnings” intended for the designer of flexible dampers, found in Section 4. Some of the challenges outlined above will be entirely solved only with the help of dedicated experimental investigation. However this paper constitutes the first necessary step: gain a complete awareness of the level of adequacy of the numerical tools at hand and of the key parameters whose effect on the results is stronger.
2. Numerical Model
Blades and strip are separate structures that interact with each other only through the contact friction forces. From a dynamic point of view, the blades with a strip damper can be considered as a unique system [35,36] described by the following dynamic balance equations:
where:
- M, C, and K are the mass, damping stiffness matrices of the system respectively. They are obtained by combining the mass, damping and stiffness matrices of both strip and blades. Usually these matrices are extracted from the FE models of strip and blades after a Craig Bampton-Component Mode Synthesis (CB-CMS) reduction;
- is the vector of the DOFs of strip and blades. Due to the CB-CMS reduction, this vector includes both modal DOFs and the physical DOFs which are the displacements of the master nodes retained in the reduction.
- is the vector of external forces acting on the system, i.e., the sum of the external excitation vector , acting on the blade airfoil, and the centrifugal force vector , pushing the strip against the blade platform as shown in Figure 1.
- is the vector of friction nonlinear forces generated between the blade-strip coupled nodes by their relative displacements. Equation (1) is nonlinear due to the presence of that depends on the relative displacement between strip and blades.
Equation (1) is written in the time domain and can be converted in frequency domain and solved by the well-known multi-harmonic balance method (MHBM) [26,27,28].
In detail forces and displacements of Equation (1) are approximated by Fourier series as expressed below.
where:
- is the fundamental frequency of the excitation force.
- is the number of harmonics that approximate the functions. More the harmonics, better the approximation, but larger the computational time.
- The subscript n refers to the harmonic Fourier coefficient.
- ℜ indicates the real part of forces and displacements.
Note the composition of the external forces :
- The centrifugal forces , acting on the strip nodes, are static forces and therefore they appear only in the zero-order harmonic .
- The external excitations are approximated from the first harmonic onwards as , for .
By substituting Equations (2)–(4) into the set of balance Equation (1) a new set of algebraic complex equations is deduced:
where:
- is the dynamic stiffness matrix of the system, corresponding to the harmonic. The 0th order represents the static balance equation, where only the centrifugal forces are considered.
- The vectors , and represent the Fourier coefficients of the harmonic.
The solution of Equation (5) requires an iterative method since the contact forces depend on the relative displacements between strip and blade platforms. The objective of the iterative method is to minimize the value of the residual , which is computed as the difference between the first and the second member of the balance algebraic Equation (5) and it is expressed for each harmonic n as:
The nonlinear forces depend on the relative displacements between strips and blade platforms according to the relationships imposed by the contact model which is described in the next paragraph. The iterative procedure starts with the assumption of an initial guess displacement . Then, the corresponding force is computed. Finally, the residual is evaluated and if its value is below the chosen tolerance, then is a solution, otherwise a new displacement has to be guessed, where the subscript i refers to the iteration. The new guess displacement is obtained through the computation of the Jacobian matrix [28,30,31], which is not described in the present work . The algorithm is implemented through a Matlab code developed at Politecnico di Torino [32].
2.1. Contact Model
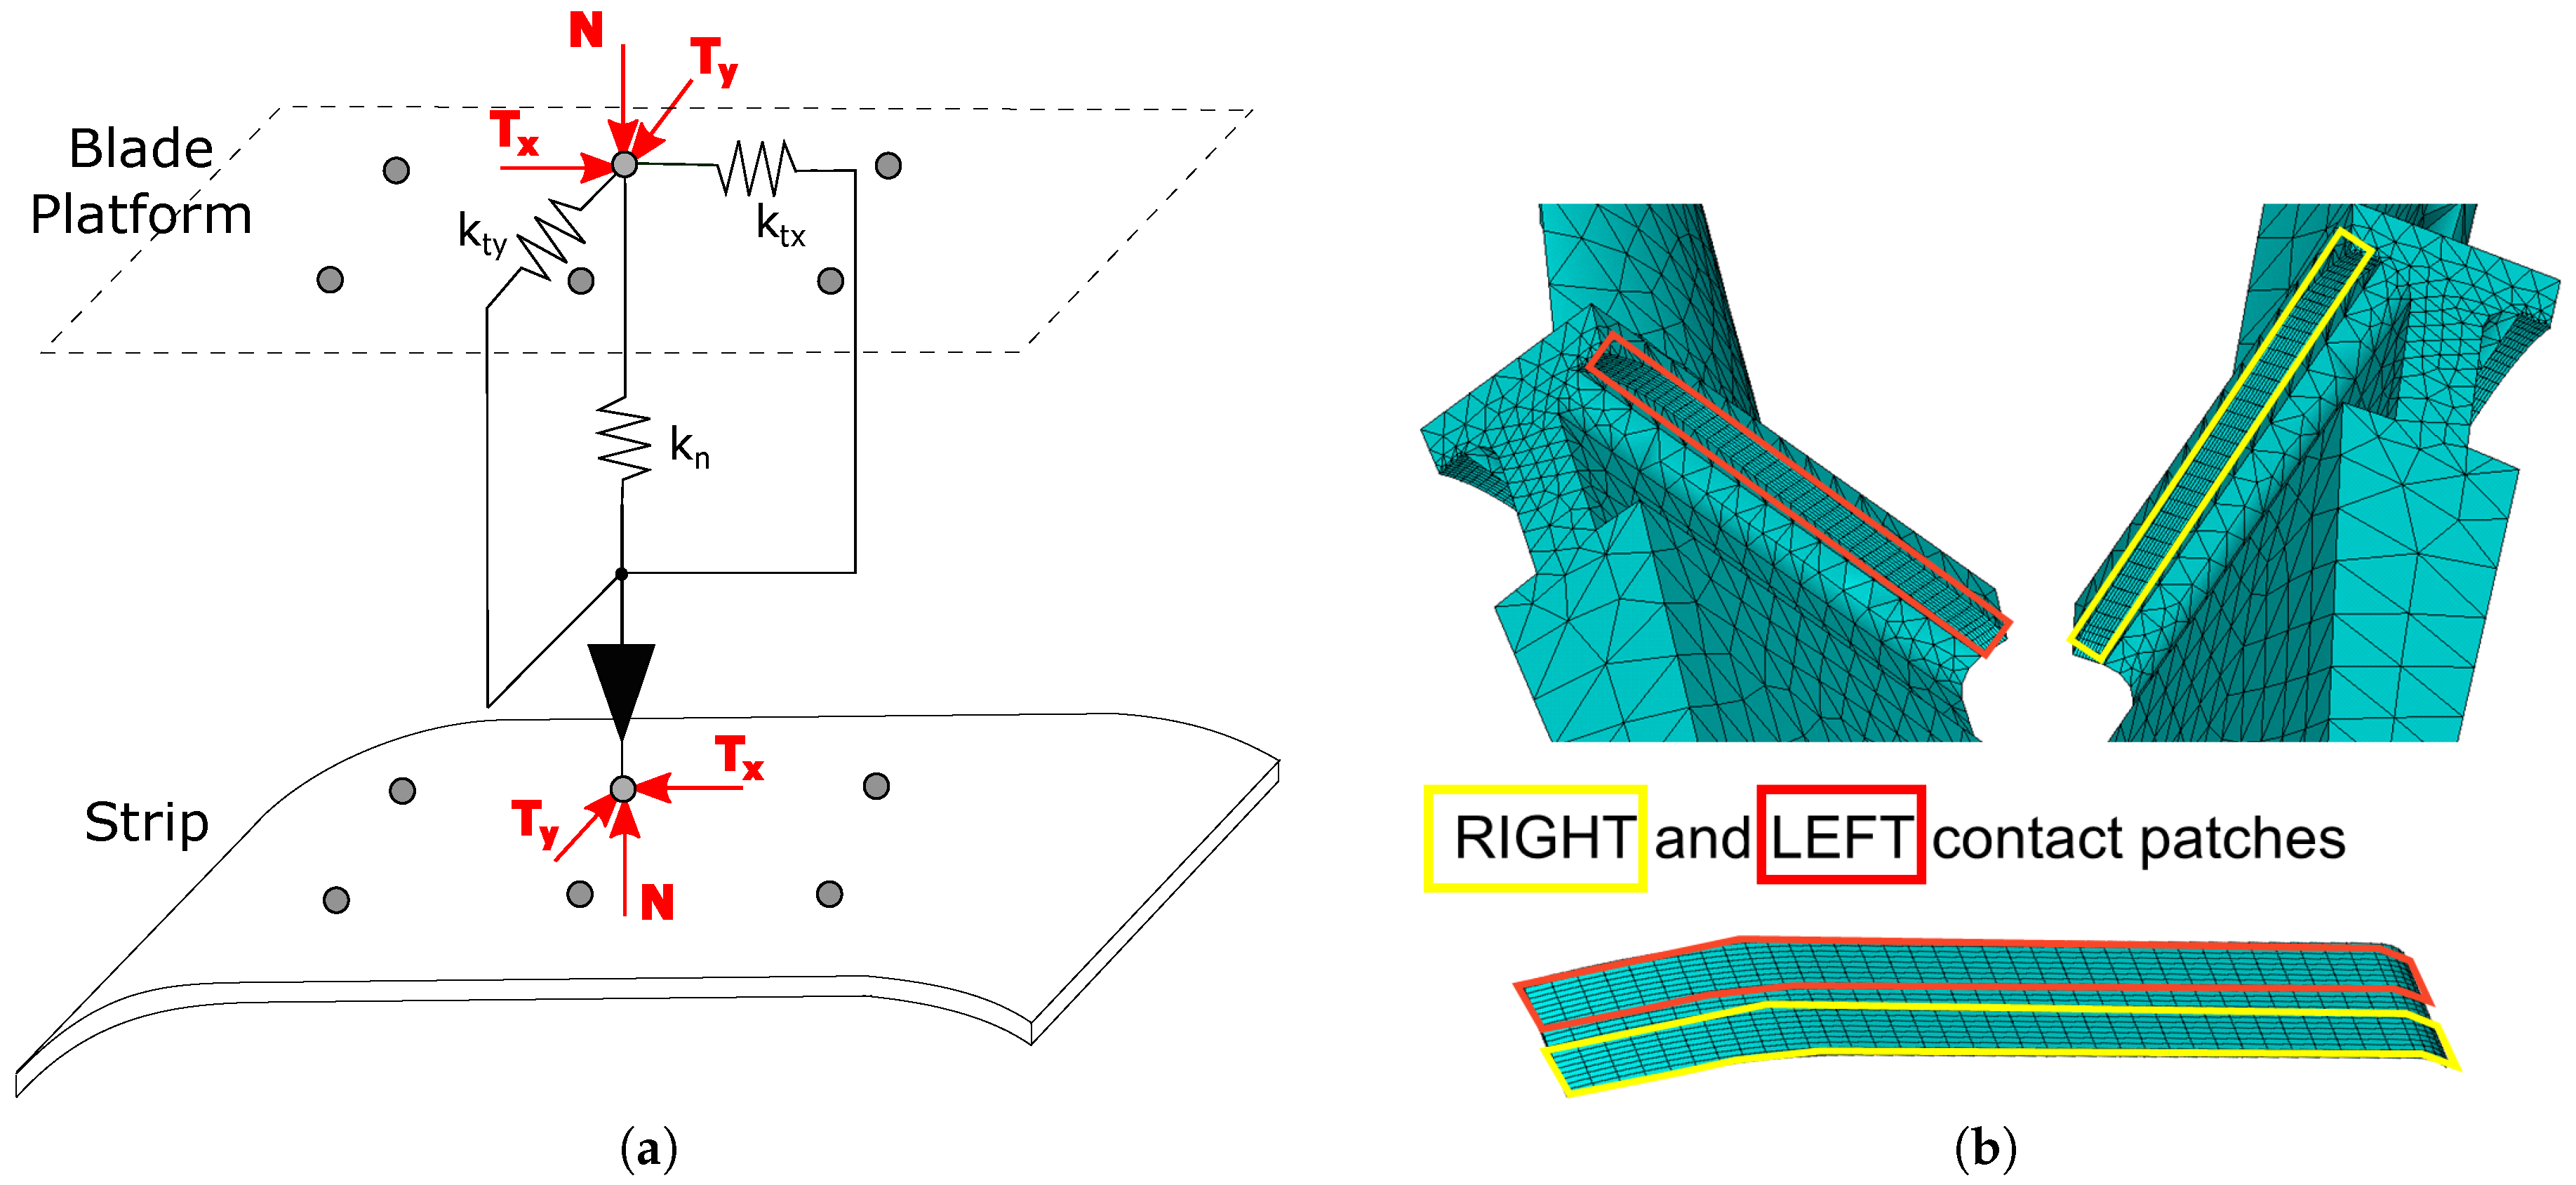
The contact model allows computing the nonlinear forces generated by the relative displacements between strip and blade nodes. A 3D contact model [37] is generally adopted in literature, in which the contact elasticity is approximated with three springs acting between each node respectively of the strip and of the blade as shown in Figure 2a,b.
The contact stiffness values assigned to each contact node (i.e., “local” contact stiffness) , and depend on the global contact stiffnesses of the strip and on the number of contact nodes chosen to represent the contact. For instance, for : , where and are the local and global contact normal stiffness respectively, and is the total number of the couples of nodes which approximate the contact between strip and blade platforms. The same relationship holds for and . A uniform distribution of contact parameters among the different contact nodes is typically adopted under the assumption of a uniform contact patch (different assumptions can be considered if experimental evidence, i.e., wear trace, suggests a non-uniform contact [38]). The global contact stiffness values used for this investigation have been taken from experimental results on a rigid damper undergoing contact pressures in the range of those experienced by the strip damper [39], since no direct experimental investigation is available on the blade-strip contact.
The relation between forces and displacements at the contact depends on the contact state: if the contact is stuck this relation is linear and governed by the contact springs described above. If the contact state is slip, normal and tangential forces are proportional (i.e., Coulomb’s law of friction). If the contact state is lift-off contact forces are null as the contact nodes are separated.
2.2. Numerical Calculation
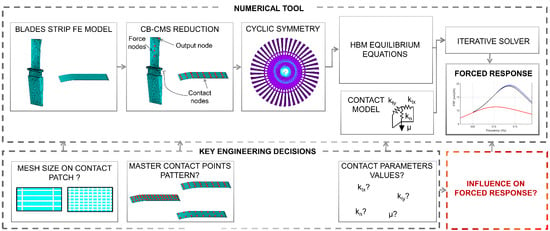
The numerical calculation is performed through a state-of-the-art numerical code based on the MHBM for an efficient solution of the equilibrium equations. A full description of this numerical tool can be found in [32]. The code, developed for solid dampers considered as a rigid body, was here adapted for strip dampers modelled using FE. A representative scheme of the code is shown in Figure 3. A few notable features of the code are:
The main output of the numerical tool is the forced response of the structure under different excitation levels, a vital indication in the blade-strip design process.
3. Influence of Key Parameters on the Response
The ultimate goal and output of the numerical tool is the forced response prediction of the blade-strip system. In detail, designers are particularly interested in the amplitude and frequency position of the resonance point (maximum of the Frequency Response Function (FRF) curve). Out of these two parameters, the frequency position is particularly relevant. In fact, the resonance frequency is used by designers to determine how likely that resonance is to be excited by the engine order excitation applied to the disk, and, for this reason, it is the main focus of this investigation.
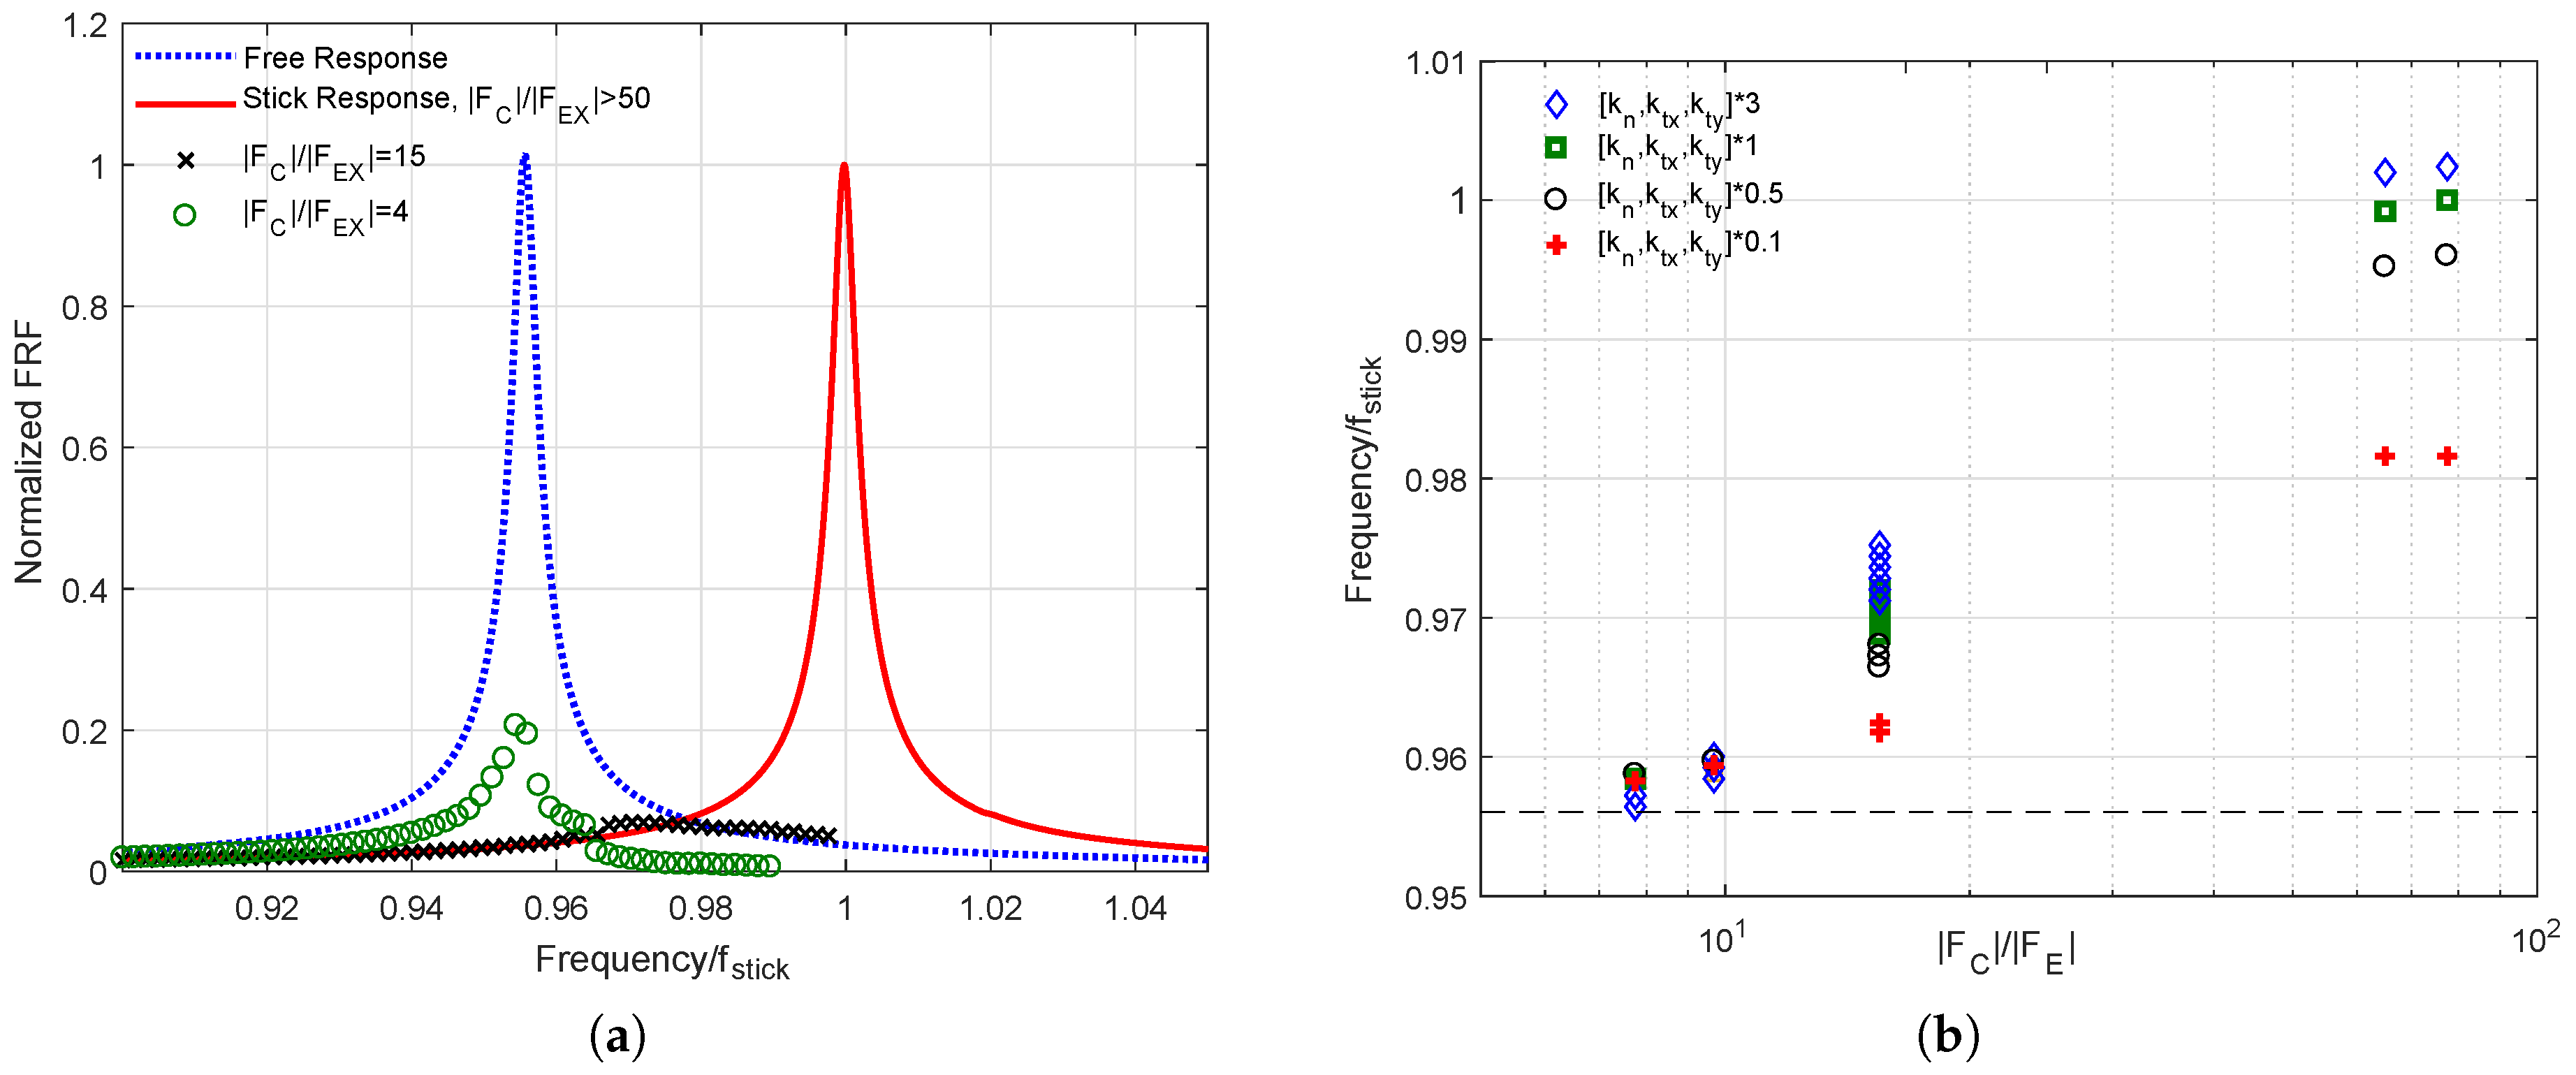
An example of forced response curves is shown in Figure 4a. The blue dotted curve, here termed “Free”, refers to the linear case of the blades without strip dampers to act as additional constraints and is typically estimated faultlessly using commercial FE codes. The presence of the strip damper requires instead an ad-hoc numerical tool, described in Section 2 and represented in Figure 3.
The red solid curve, here termed “Stick”, is another linear limit case where the strip damper is stuck to the corresponding blade platforms and the relative motion is allowed only by the elastic deformation at the contact through the contact stiffnesses (it is nevertheless a coupled mode). The full stick condition is not only a “limit case” but is encountered for low excitation levels (high ratio). In the full stick condition, the presence of the strip dampers reduces (in this case in a negligible manner) the amplitude of the response and shifts the peak to a higher frequency. Being able to predict effectively the frequency shift is paramount to a safe and robust design.
As the level of excitation increases (and the ratio decreases) the relative displacement at the contact will exceed the friction limit and contacts will start to slip. As a result, part of the global contact stiffness is lost and the resonant frequency shifts to lower values (i.e., it moves back towards the “Free” condition). Furthermore, friction-induced dissipation limits the FRF amplitude (the peak will appear as “less sharp”, as shown in the = 15 case in Figure 4a). For extremely high excitation levels (e.g., = 4) the strip will lose contact with the blade platforms during vibration and the resonance frequency and amplitude will draw even closer to the “Free” condition.
The resonance frequency is depicted in Figure 4b as a function of the excitation level. As observed above, the frequency is maximum in “Stick condition” ( > 50) and gradually moves towards the “Free frequency” for decreasing ratios. It is here shown that the way the contact is modelled has a large impact on the frequency shift prediction. Figure 4b shows how different contact parameters used as input to the contact model will lead to different FRF peaks. The largest difference can be found, unsurprisingly, in the linear/weakly nonlinear regime, where the complete contact stiffness is at play. Conversely, in the nonlinear regime, the influence of different modelling choices (i.e., in this case different contact parameter values) is less severe. The present investigation will therefore focus on the linear/weakly nonlinear regime.
It should be noted that the value of contact parameters is not the only modelling choice that affects the resonance frequency prediction. As shown in Figure 3, the designer has to face a series of modelling decisions when it comes to representing the strip damper and the blade-strip contact interface. The full list of the key parameters to be chosen at the different design/modelling steps is found below.
- (1)
- The mesh size in the FE model of the contact areas.
- (2)
- The number of master contact nodes retained in the CB-CMS reduction.
- (3)
- The contact parameters values in the contact model (contact stiffness values as described above).
For each parameter (1 to 3), a set of different “engineering choices” will be explored (i.e., different values of a given parameter): different choices can be equally “reasonable” and “defendable”. Yet, it will be shown that in some cases different choices lead to markedly different forced response predictions. Purpose of this section is to identify the parameters whose influence on the response is stronger.
3.1. Definition of the Nominal Parameter Values and of the Benchmark Case
As stated above, the purpose of this section is to analyse the effect that variations of single parameters have on the resulting frequency shift produced by the strip. This investigation starts from a set of nominal values for each of the three parameter choices outlined above. The “nominal values” and the correspondent explored variations are summarized in Table 1. It should be noted that the nominal values related to mesh size and number of master contact points (points 1 and 2) were chosen in order to ensure a high-fidelity representation of the contact patches. These values are the result of a convergence study whose outcome is summarized in Figure 5 and Figure 6 and which will be further commented upon in the following sections. Deviations from the nominal values are investigated with the intent of assessing whether designers can achieve an adequate representation even if requirements on mesh size and number of retained contact nodes are relaxed.
On the other hand, the contact parameter values were chosen based on the authors’ previous experience on rigid dampers subjected to contact pressures similar to the strip’s [39]. Since no experimental data on strip dampers is available, the influence of contact parameter variations will be explored both by increasing and decreasing the contact parameters’ nominal values.
The benchmark case is the bladed disk shown in Figure 1. The disk, whose diameter is approximately 800 mm, belongs to a turbine for power generation and, as such, it is rotating at 3600 rpm. The disk is excited, unless stated otherwise, along the second bending mode (i.e., neck-bending mode which sees the blade bending about its axis while remaining within the disk plane). In this condition, the strip influence on the frequency shift is maximum. The frequency of this second bending mode, obtained in stick condition and using the “Nominal values” from Table 1, = 1320 Hz is here used as a reference to normalize other frequency values.
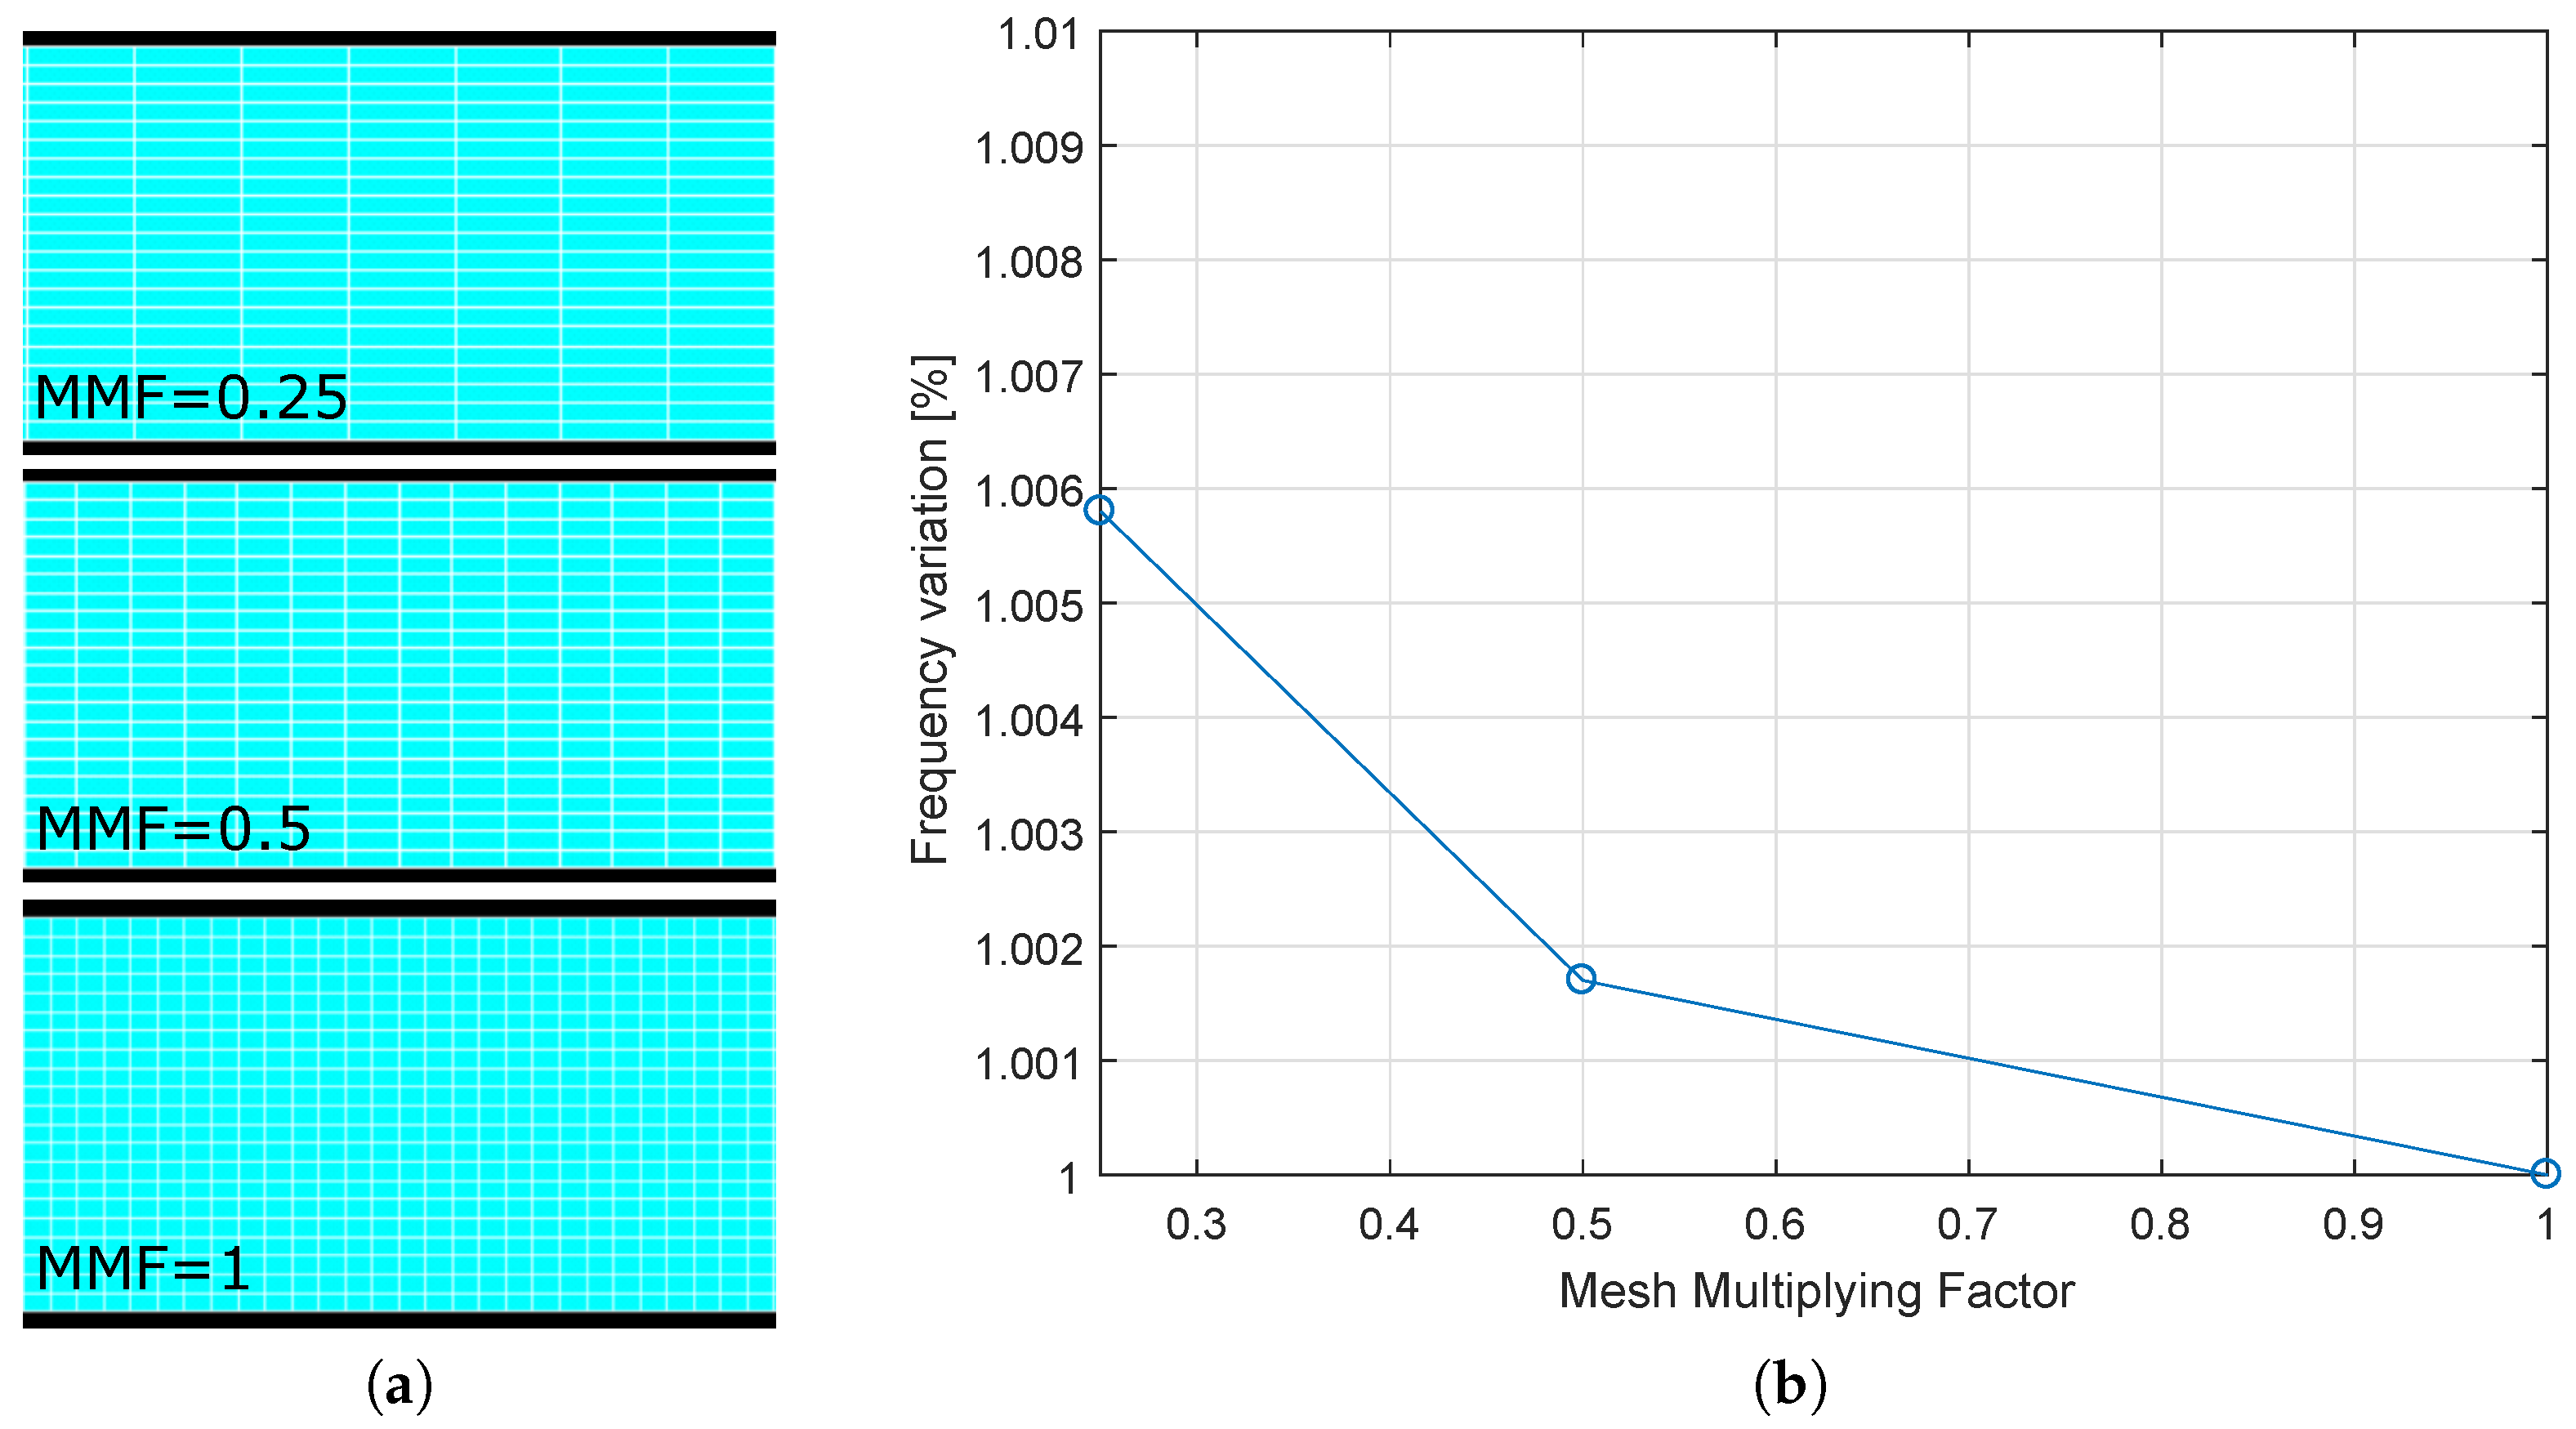
3.2. FE Model: Influence of Mesh Size in the Contact Area
In this section the effects of the mesh size of the contact patch are assessed. Different FE models have been created varying the mapped mesh at the blade-strip contact interfaces and keeping unchanged the remaining model mesh discretization (see nominal values in Table 1). Three models were created: as shown in Figure 5a, the contact patches are modeled with different levels of accuracy. In the full stick linear analysis, the three contact springs (with stiffness , and ) are inserted between each couple of blade-strip master contact nodes as shown in Figure 2. The results of the full stick linear analysis are summarized in Figure 5b.
By increasing the mesh refinement, the system natural frequency decreases. This is to be expected since the refined mesh takes into account local flexibility and, as a result, the model becomes less stiff as the number of finite elements is increased.
The effect of the mesh refinement is minor (lower than a +0.6% increment with a = 0.25) because the compliance of the contact springs is definitely higher than that of the mesh.
3.3. Craig-Bampton Reduction: Influence of the Retained Contact Nodes
After meshing the FE model, a CB-CMS reduction is performed. This reduction technique requires the selection of master (i.e., physical) and slave (i.e., modal) degrees of freedom. Most of the selected physical DOFs are located on the blade-strip contact area: this selection is particularly relevant as only the retained physical DOFs allow for the application of the contact model.
Ensuring an adequate representation of the contact of a flexible structure typically requires a high number of contact nodes. If the selected contact nodes are too few the local contact stiffnesses , and will be unnaturally high (see Section 2.1) and the dynamic behavior of the strip will be modified. Consider, as an example, a strip constrained at its four corners by very stiff contact springs: the inner unconstrained portion of the blade-strip contact will be free to move and deform.
Conversely if a large number of uniformly distributed contact elements is applied, the additional stiffness at each contact node will be smaller, and the strip/platform contact will be continuous.
For this reason, the present investigation takes as a benchmark choice a uniform fine discretization, under the hypothesis of non-deformed conforming contact surfaces. In detail each blade-strip contact patch (10 × 100 mm) is represented using a density of 11 contact nodes/cm along the short edge dimension and 6.5 contact nodes/cm along the long-edge dimension (i.e., 11 rows and 65 columns of contact nodes respectively, for a total of 715 contact nodes, as summarized in Table 1). The concept of contact patch discretization into rows and columns of nodes is depicted in Figure 6a: rows refer to contact nodes density along Y direction, while columns refer to nodes’ density along X direction. In all cases, the distribution of contact nodes is uniform.
As discussed in Section 2.1 efforts were made to maintain the global contact stiffness equal in all investigated cases even if the number of contact elements and the pattern varies. Although the global stiffness is kept constant, the natural frequency of the predicted forced response varies considerably, as shown in Figure 6b. As discussed above, this influence is investigated in the full stick regime as contact springs are fully active during a complete period of vibration.
A careful observation of Figure 6b allows to draw the following caveats:
- If a sufficiently high contact nodes density is adopted (i.e., 4.5 node columns per cm and 7 node rows per cm respectively) the predicted frequency reaches an asymptotic value.
- If the number of node rows decreases below its threshold value, the frequency starts increasing.
- If the number of node columns decreases below its threshold value, the frequency starts decreasing.
It can, therefore, be concluded that using a rough discretization of the contact patch may lead both to an underestimation or an overestimation of the frequency shift. Furthermore, the trend may change depending on the specific mode under investigation. It is, therefore, worth investigating the reason behind this trend in order to provide the designer with a general “rule of conduct”, independent of the specific mode under investigation.
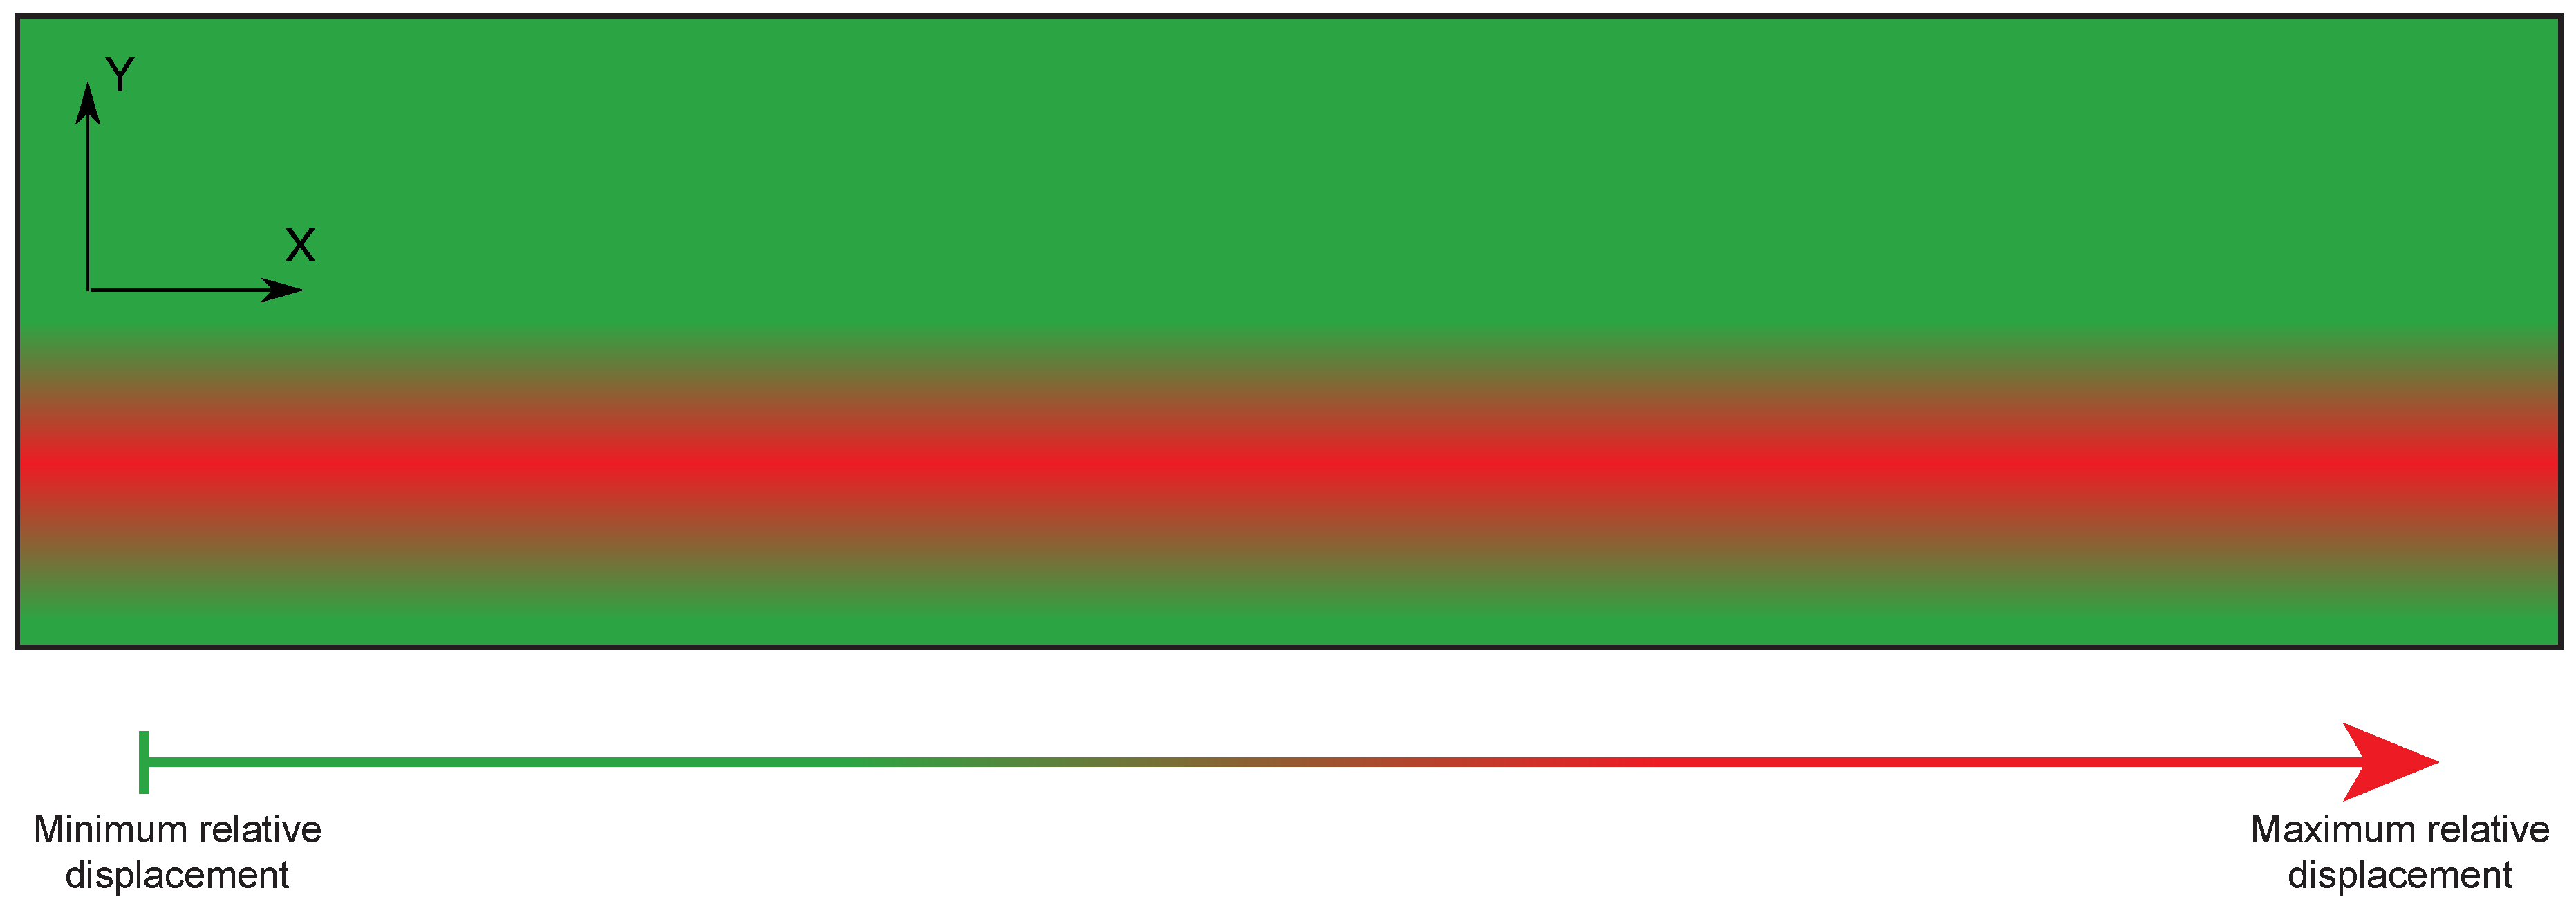
The strong influence of the pattern and number of retained contact nodes is due mainly to the kinematics of the blade-strip interfaces. In detail, the numerical analysis performed in the “asymptotic region” (sufficient number of node rows and columns) has shown that, for a given mode, there are regions of the blade-strip contact patches where relative displacement is maximum. These regions are here termed high mobility regions. An example of high mobility region is shown in Figure 7 for the reference bending mode (i.e., neck-bending). The red areas are high mobility regions where the blade-strip relative displacement is maximum.
The predicted forced response may vary depending on whether or not the retained nodes (i.e., where the contact elements are applied) fall in such regions. In the next two subparagraphs, the effects of the patterns of retained nodes will be analyzed in detail. It will be shown how the density of retained nodes along the strip long-edge (X) direction and the short-edge (Y) one affects the predicted forced response.
3.3.1. Density of Nodes Incremented Along the Strip Long-Edge Direction X
This section aims at investigating the two questions outlined below:
- Does the method (or pattern) the designer uses to refine its contact node selection affect results?
- Why does the frequency decrease if the contact nodes density decreases?
To answer question (1), the density of the retained contact nodes along the strip long-edge direction (i.e., node columns along the X axis in Figure 8a) is varied using different “patterns”. Figure 8a shows patterns A and B. For a given pattern, nodes’ density along the X direction is progressively doubled (for each increment the distance between neighboring nodes along the X direction is halved), while node rows along Y direction are kept fixed (in the present case to 3). Five different patterns have been investigated under low excitations (i.e., full stick case), and they are summarized in Table 2.
Figure 8b plots the frequency variation as a function of the number of node columns for the patterns in Table 2. The results shown in Figure 8b confirm those in Figure 6b: by increasing the number of node columns the natural frequency of the system increases with a decreasing growth rate (i.e., moves closer to the asymptotic region). Conversely, for a low number of node columns the frequency plunges to low values (down to 92% of the asymptotic value).
The position of the nodes in different patterns (A…E) has a negligible impact on the resulting full-stick frequency, especially if compared to other sources of uncertainty (e.g., contact parameter values, number of retained contact nodes etc.).
To answer question (2), the constraint level of the high mobility region shown in Figure 7 is considered. It is observed that only the “lower” node rows intercept the high mobility region which propagates along the long-strip edge. If the number of constrained nodes belonging to the high mobility region increases, the relative displacement of each node is reduced, as the mobility of each node is progressively impaired by the neighboring (constrained) points. This overall mobility reduction leads to a system stiffening. Such a concept is depicted in Figure 9.
Lastly, it should be noted that with increasing node density the local contact stiffness is reduced (see Section 2.1), however the overall stiffness connected to the high mobility region (i.e., the sum of the local stiffnesses along the lower node rows) is not modified.
3.3.2. Density of Nodes Incremented Along the Strip Short-Edge Direction Y
The purpose of this section is to show why a higher density of retained nodes not always results in a stiffer system. In detail, by increasing the number of retained nodes along Y direction, i.e., increasing node rows, (while keeping the same number of nodes along the X direction, i.e., unchanged node columns), the system natural frequency decreases (see Figure 6b). This apparently strange phenomenon can be easily explained by considering the following:
- as more rows of nodes are retained, the local contact stiffness values at each node are reduced (see Section 2.1);
- as a result, the rows of springs connected to the high mobility region will progressively offer a weaker constraint;
- conversely, the additional rows created far from the high mobility region do not significantly modify the stiffness of the system as the nodes they are connected to are not very mobile.
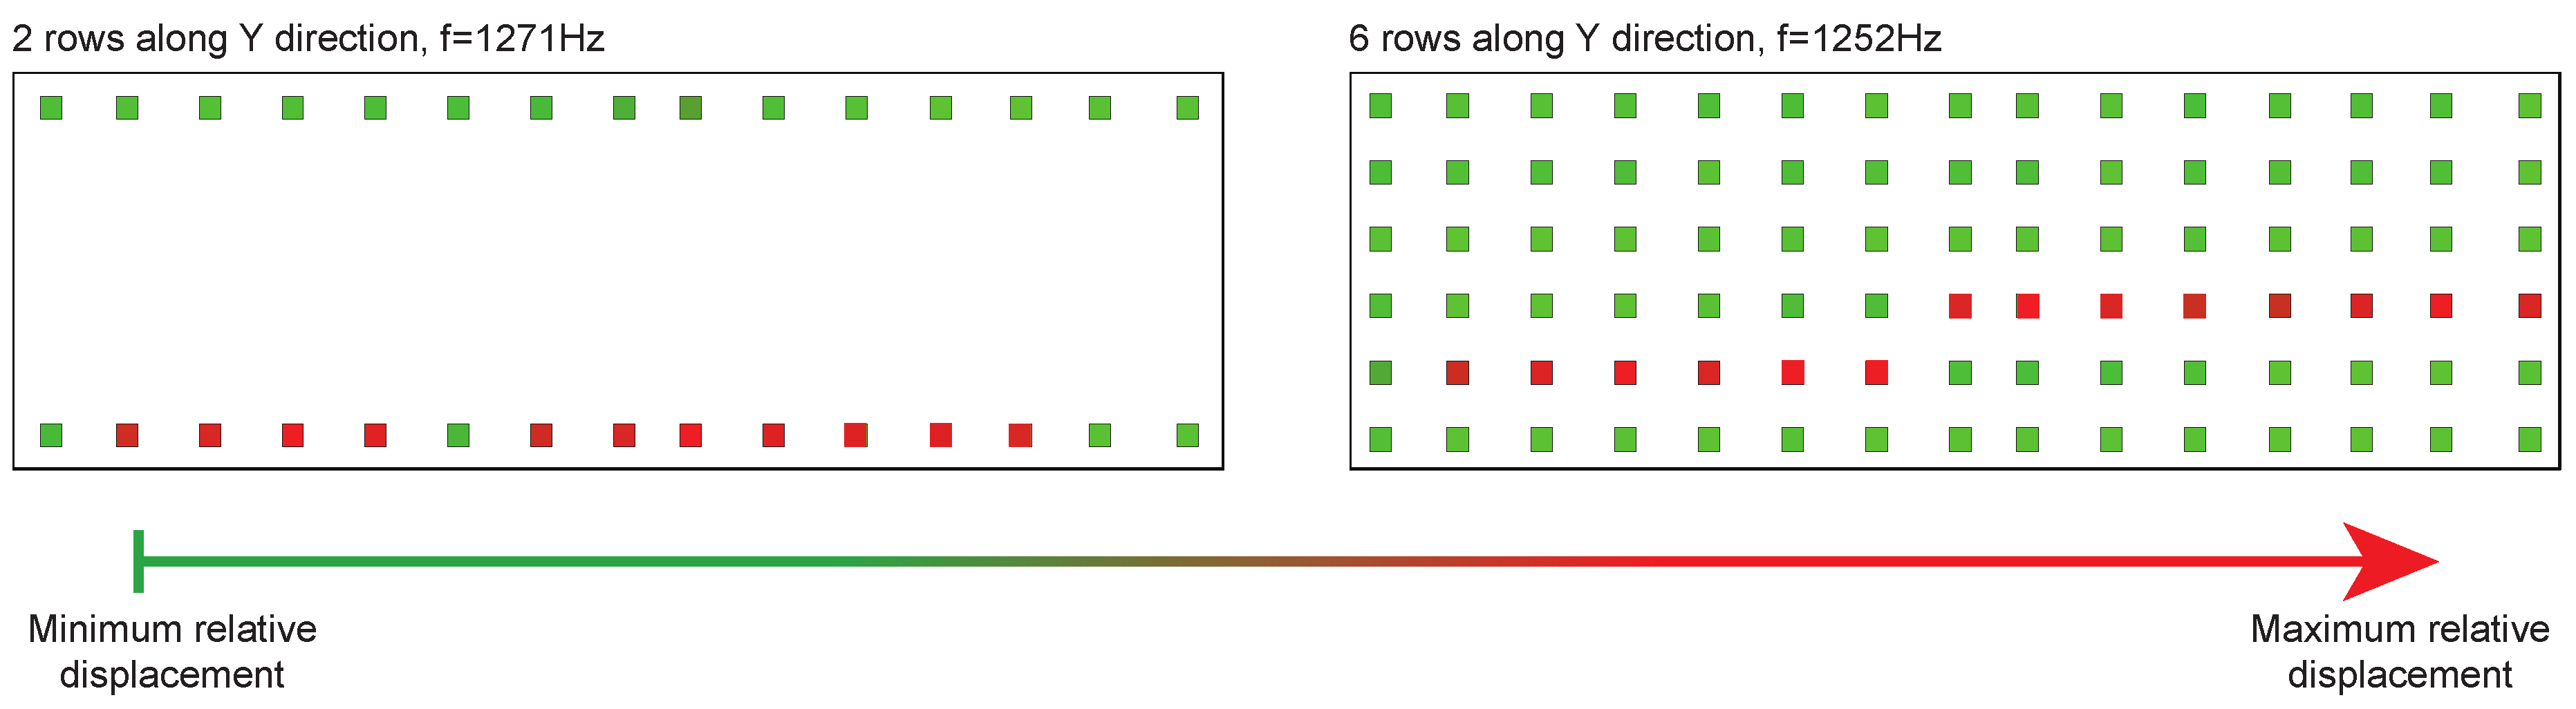
This behavior is well represented in Figure 10 where the blade-strip contact patch, already shown at “high resolution” in Figure 7, is discretized with 2 rows of elements (on the left) and with 6 rows (on the right). As expected, most of the “additional” nodes introduced with the 6 rows are positioned in low mobility regions (low relative displacement, represented in green), that means that their constraints do not contribute significantly to the overall stiffness. At the same time the nodes in high mobility region (represented in red) see a reduced stiffness (each one has a local stiffness 1/90 of the total stiffness vs. 1/30 for the two-rows case represented on the left). The result is a global weaker constraint and a decrease of the natural frequency.
In conclusion, Figure 6b suggests that it is important to retain a sufficiently high number of nodes to capture effectively the dynamic behavior of the system. This is due to the kinematic of the strip/blade contact interfaces, as shown with the high mobility region. Therefore, despite the effort in keeping the global contact stiffness to the same value, reducing below a given threshold the contact nodes density (and thus introducing high “concentrated” constraints) is not a viable alternative. The contact nodes density which guarantees a proper representation is fixed as the boundary of the asymptotic region in Figure 6b (i.e., approximately 4.5 node columns per cm and 7 node rows per cm respectively) and can be used as a starting point for cases addressing strip dampers of similar thickness. This topic will be addressed further in Section 4.
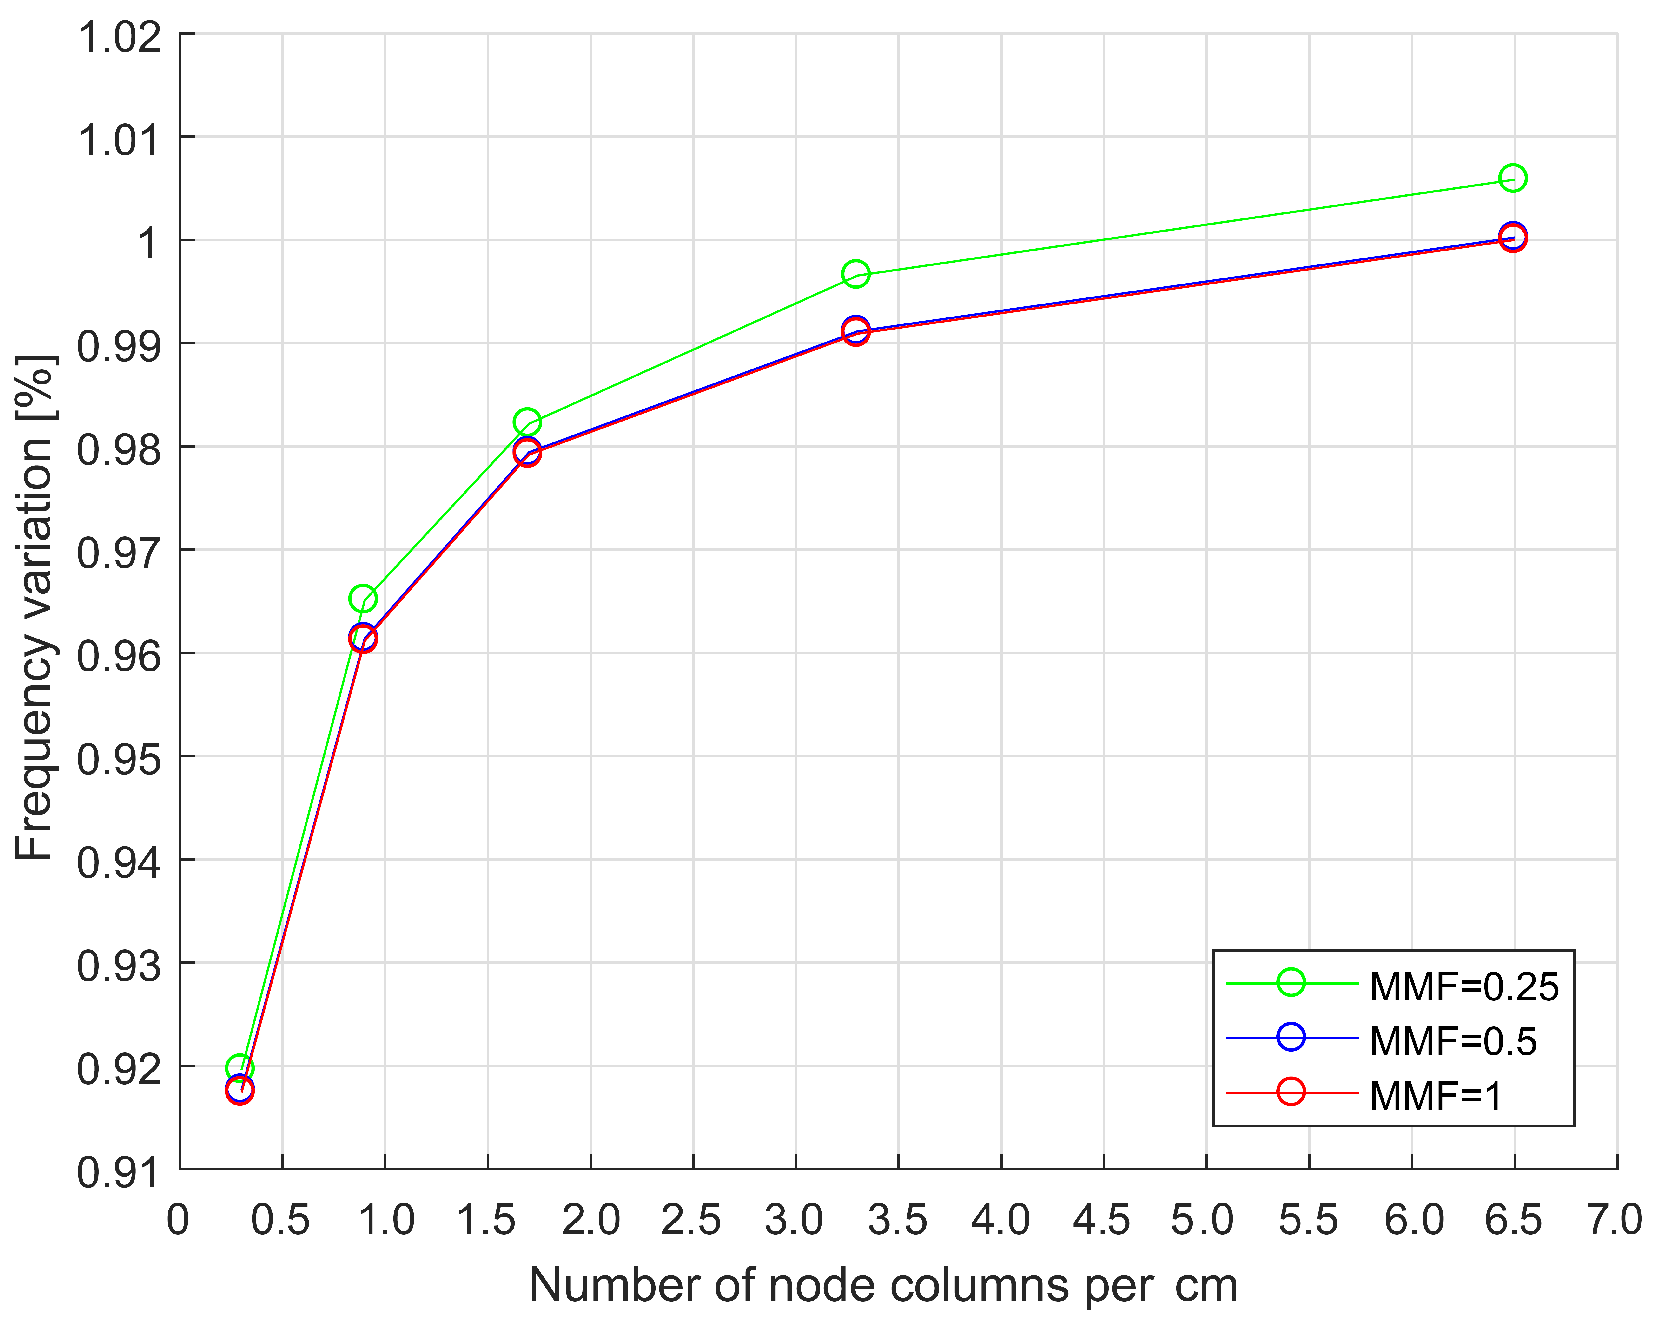
3.3.3. On the Cross-Influence between Retained Nodes Number and FE Model Mesh Refinement
This subsection aims at finding out whether the number of retained nodes and the mesh refinement have independent effects on the forced response prediction. To reach this goal different cases have been investigated by varying the number of retained nodes along X direction (i.e., number of columns) and, at the same time, the mesh size. It was decided to address the node density variation along X direction since, from the investigation in Section 3.3.1 and Section 3.3.2, it was observed to be the most influential. Pattern A (see Figure 8b) has been analyzed for different values of Mesh Multiplying Factor. The results of this investigation are shown in Figure 11. It is observed that the two effects (mesh size and total number of retained contact nodes) are independent and additive in nature. Also, the influence of the is much smaller than the influence of the number of retained contact nodes. In fact, if the blade mesh is fine enough (), a further decrease of the mesh size does not induce a variation in the natural frequency value (see overlapping red and blue curves in Figure 11).
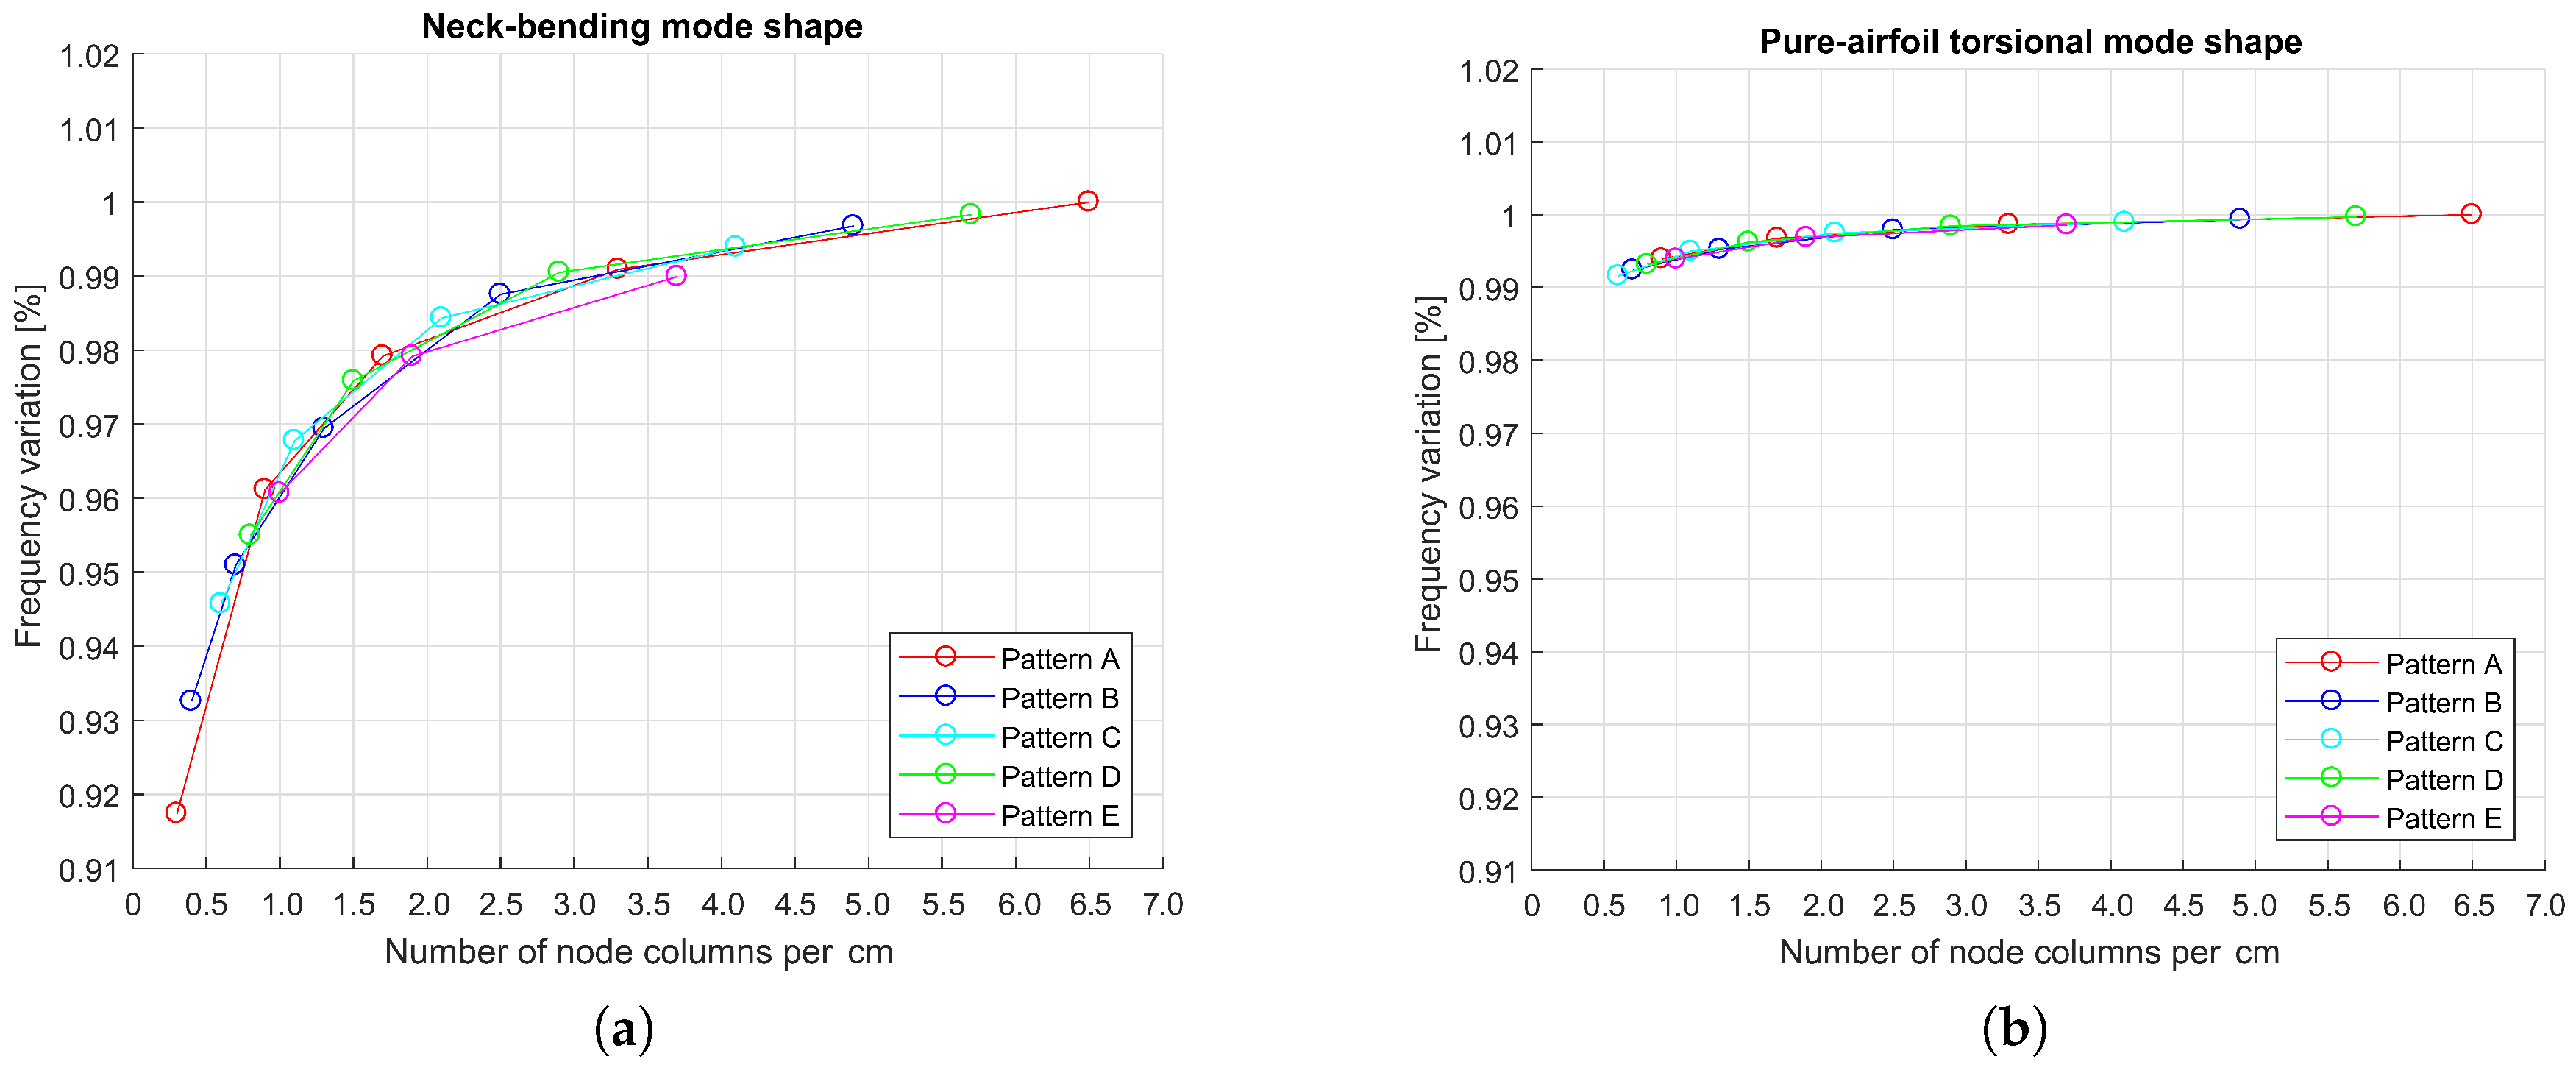
3.4. On the Cross-Influence between Retained Nodes Number and Mode Shape under Investigation
It is also interesting to investigate whether the effect of retained contact nodes density changes, depending on specific mode under investigation. In Figure 12 the variation of the natural frequency versus the number of retained contact nodes along X direction, is shown for two different mode shapes. It is observed that the natural frequency variation of the blade neck-bending mode is almost 10 times larger than the one of pure-airfoil torsion.
This is not surprising since, in the case of neck bending, the strip acts as a constraint under the blade platform and consequently it affects significantly the motion of the neck. Therefore, the way the damper is modelled has a large influence on the system stiffness. Instead, in case of pure airfoil torsion, the strip is almost completely irrelevant to the dynamic of the structure (i.e., the platforms are “overall” in a low mobility state even without the damper). As a result, not only the strip will have a lower influence over the system response (low frequency shift between “free curve without strip” and “full stick curve with strip”), but also the effect of changing the number of retained contact nodes will be limited.
3.5. Contact Model: Influence of Contact Parameters
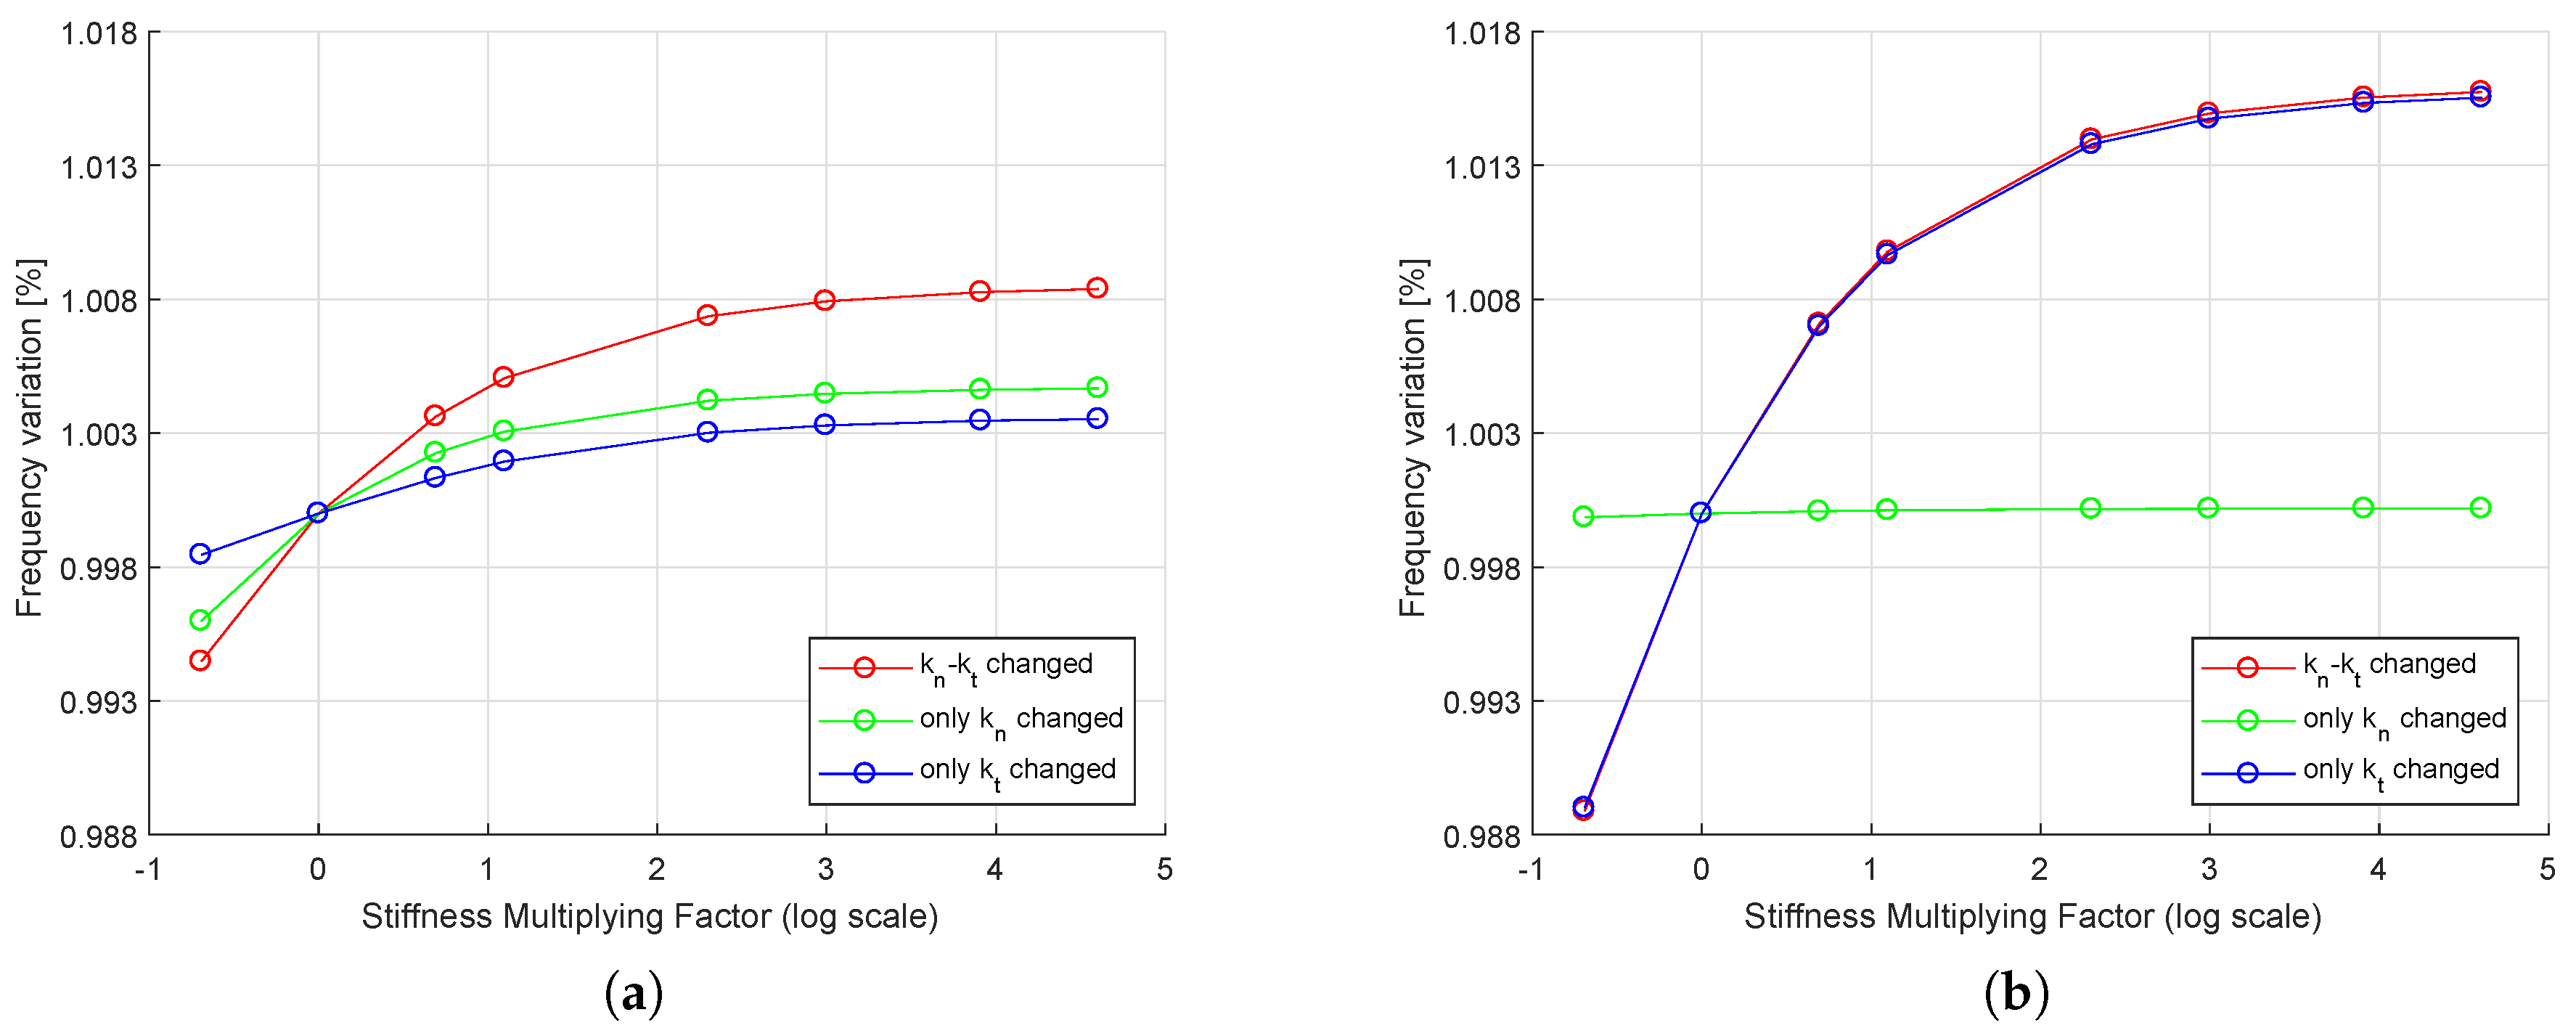
Another important factor influencing the forced response prediction is the choice of contact model parameters. As stated before, a contact model is adopted to approximate the contact between strip and blade platforms. The contact model consists of springs (normal, , and tangential stiffnesses, , ) acting between the contact nodes of the strip and the blade. The “nominal” values come from an extensive experimental campaign performed on rigid dampers experiencing contact pressures in the range of those experienced by the present strip damper [39] and are reported in Table 1. However, the different contact conditions, kinematics and compliance of the strip damper may result in changes of the contact model calibration parameters. An ad-hoc investigation has been performed to investigate the influence of the contact parameters: resonance frequency predictions are plotted as function of a stiffness multiplying factor ().
As shown in Figure 13 different simulations were run considering the neck-bending mode shape at two different (extreme) exciting Engine Order (EO) (The engine order (EO) is an integer indicating the number of times each blade is excited during each complete rotation of the disk. A different EO excites a different nodal diameter, inducing a different vibration phase among two consecutive blades). In detail:
- EO = 0 means that the blades vibrate with the same phase, that is In-Phase (IP).
- EO = 22 (that is the number of the blades 44 divided by two) means that the blades vibrate with opposite phase, that is Out-of-Phase (OOP).
Both Figure 13a and b show that, by increasing the contact stiffnesses values, the natural frequency of the system increases. This is not surprising since, if the springs are stiffer, the nodes are less able to vibrate.
Moreover, the effect of normal and tangential stiffnesses depends on the phase between the consecutive blades connected by the strip. For the IP mode (EO = 0), the normal stiffness has higher influence. This can be explained considering that, during the IP mode, the blade-strip relative displacement is mainly along the vertical direction (i.e., normal stiffness direction), as sketched in Figure 14. Conversely, for the OOP mode (EO = 22) has no influence and only the tangential stiffness affects the dynamic behavior. The reason is that, for the OOP mode, the strip slips mainly along the tangential direction, as sketched in Figure 14.
The authors are aware that the determination of the true contact stiffness values to be used in the numerical calculation is still an open question. A dedicated experimental campaign, similar to the one performed for rigid dampers [42] is underway. Still gaining a full awareness of the influence each parameter has on the numerical prediction is a necessary step in the creation of a meaningful experimental campaign.
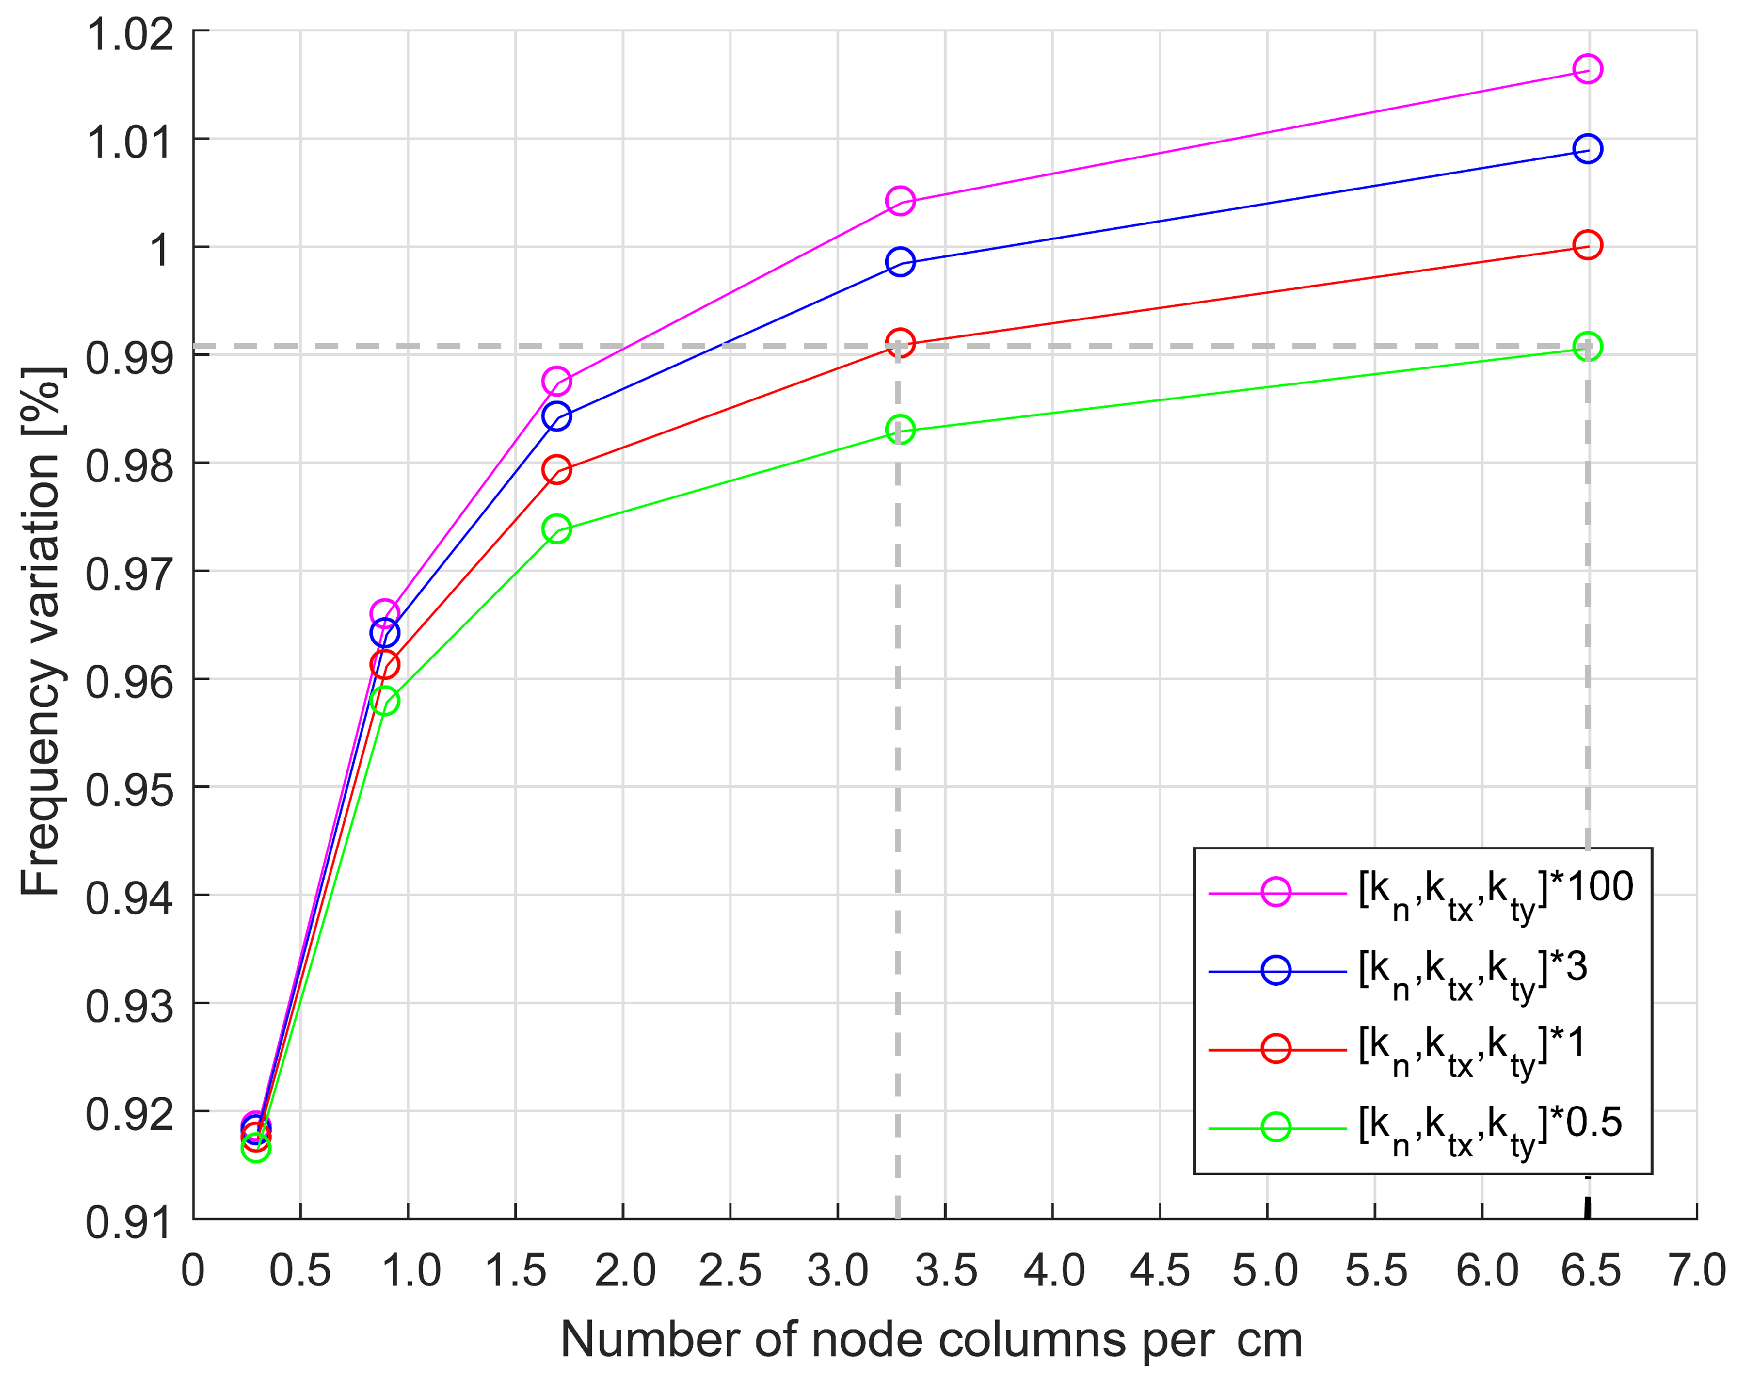
3.6. On the Cross-Influence between Retained Nodes Number and the Contact Stiffness Values
Section 3.3.3 proved that the effect of the mesh discretization is negligible with respect to the effect of the number of retained contact nodes. In addition, this section aims at comparing the effect of the retained contact nodes density with that of the global contact stiffness variation. To achieve this goal a cross-comparison of different cases displaying an increasing number of retained nodes along X direction (pattern A) and different values of contact stiffness was performed. In Figure 15, it is shown that the change of the contact stiffness values leads to effects comparable to the ones obtained by changing the number of contact nodes. For instance, as highlighted in Figure 15, the model with a 3.3 node columns/cm and stiffness multiplied by 1 has almost the same frequency of the model with a 6.5 node columns/cm density and stiffness multiplied by 0.5.
This observation should serve as a warning to the designer: the contact parameter problem is under-determined as multiple contact parameter combinations can lead to the same result.
4. Engineering Choices: Guidelines for the Designer
The previous section showed all the modeling choices the designer of a blade array with strip dampers has to face, and the effects these choices have on the numerical tool results/prediction. It was shown that even if linear and nonlinear state-of-the-art codes are available, an accurate prediction of the blade response with strips and friction is still not assured.
On the basis of the study of the influence of different modelling choices, spanning different parameters and modeling steps, this paper aims at offering a set of guidelines in order to raise awareness on the possible sources of errors.
Some main guidelines for the designer are summarized below and further condensed in Table 3.
- There are no particular requirements for the blade and strip FE models. “Standard” accuracy levels (typical of industrial FE models, i.e., mesh grid size on contact patch ≈ 1 mm) are quite sufficient. The mesh size does not have a significant influence on the results in terms of dynamic response. This low sensitivity is easily explained, since the additional compliance offered by a very fine mesh is still orders of magnitude higher than expected values of stiffness at the contact. This is especially true in the case of flexible dampers, as the centrifugal force is limited and, as a result, expected contact stiffness values are moderate [38]. The authors advise designers to adopt, as a good practice, a regular mesh both on the blade and on the strip contact patches. This choice will ensure an easy selection of the contact nodes to be retained in the CB-CMS condensation procedure.
- If the mode of interest is a bending mode where the platform of the blade is moving during vibration, the number and location of contact master nodes retained in the CB reduction has critical effects on the numerical prediction. Ensuring a fine discretization of the contact patch is paramount to mimicking the real contact conditions (conforming surfaces and uniform centrifugal pressure application). The asymptotic behavior evidenced in Figure 6b suggests that a convergence study in the linear regime can easily identify the number of contact nodes which will ensure a trustworthy representation of the contact patch at the minimum computational cost. In the present case, the application of 4.5 node columns per cm (in the X strip longest edge direction) and 7 node rows per cm (in the Y strip shortest edge direction) ensured predicted frequency values which did not change even if the contact node density increased further.
- Assigning each contact node an equal fraction of the global contact stiffness is a standard practice, typically adopted for rigid dampers. This investigation shows that this uniform division does not ensure an equal equivalent stiffness (i.e., equal stick resonance frequency) if the number of contact nodes varies. This is due to the fact that the contact patch is characterized by a nonuniform kinematics (caused by the damper flexibility). As a result, a portion of the contact patch (in the present case aligned along the strip longest edge), here termed high mobility region, will display a higher relative blade-strip displacement. The “local” value of the contact springs of the nodes belonging to the high mobility region will strongly influence the response prediction, while the values assigned to nodes located elsewhere will have negligible effect. Locating the shape and position of the high mobility region becomes relevant if the designer is forced to reduce the number of contact nodes (e.g., in the nonlinear calculation) to limit the required computational capabilities. Having knowledge of the shape and position of the high mobility region will enable the designer to reduce the number of contact points in such a way as to provide a conservative estimate of the frequency shift, rather than an overestimation.
- The contact stiffness values need to be determined through a direct experimental investigation. They could be derived from an ad-hoc campaign on a tribology experimental test rig or by tuning contact stiffness values to obtain experimental natural frequency in stick condition for different EO excitations. If the second option was to be preferred, the low sensitivity of the response to variations of values during IP vibration and the low sensitivity to variations in case of OOP vibration evidenced in Section 3.5 could be exploited. This set of observations, involving experiments at different EO excitations, could help identify a unique set of contact parameters and thus overcome the multiplicity of solutions identified in Section 3.6. This second option has another important advantage: it automatically takes into account the flexibility of the mesh at the contact (albeit in this paper negligible, with respect to other parameters). In this way, the contact stiffness values and will be defined as the additional stiffness contribution (e.g., due to local asperities) that the standard FE mesh is unable to model.
5. Conclusions
The aim of this paper is to highlight the challenges and peculiarities that modelling flexible friction dampers entails. Flexible dampers, also known as “strips”, are a relatively new research topic in the field and very limited literature on their influence on the dynamic behavior of turbines is available.
One key parameter needed for a robust blade/damper design is the maximum frequency shift induced by the presence of the strip damper between adjacent blades. While extensive experimental investigation and industrial practices are available for rigid dampers, flexible dampers are still understudied.
This paper builds on the authors’ previous experience with rigid dampers: in detail, a state-of-the-art validated numerical code for the prediction of the dynamic behavior of bladed disks coupled by rigid dampers has been purposely modified to accommodate flexible dampers as well. The upgrade included:
- introduction of the FE model of the strip damper (rigid/solid dampers are modeled using a rigid body assumption);
- contact parameters determined for lower values of contact pressure are used (strip dampers, given their limited mass generate a moderate centrifugal force).
The authors’ effort did not stop to the simple application of this new and upgraded numerical tool. Rather, for each modeling step, several possible modeling choices were explored and a sensitivity analysis for key parameters performed. The outcome of this analysis is a set of guidelines to help the designer identify the most critical points when modelling flexible dampers. The main outcomes of this analysis are outlined below.
- Mesh size, provided it meets a minimum quality standard, does not critically influence the response.
- The flexibility of the strip generates complex kinematics at the contact. In detail, portions of the contact patch display higher relative displacements. As a result, only a high density of contact points will ensure an adequate representation of the contact conditions. The minimum density which ensures an adequate representation of the contact patch can be found through a convergence study in the low excitation (i.e., linear regime).
- Contact stiffness values can strongly influence the response, depending on the relative displacement at the contact (i.e., produced by different EO excitation). In detail, the influence will be at its maximum if the contact spring is parallel to the blade-strip relative displacement, while contact springs whose direction is orthogonal to the relative blade-strip relative displacement will have a negligible effect on the predicted response.
- Multiple combinations of contact parameters can lead to the same predicted response (i.e., multiple solutions to the contact parameter problem).
Some of the challenges outlined in the paper (e.g., point 4.) will be entirely solved only with the help of dedicated experimental investigation. However, being aware of which parameters play a key role under which conditions is paramount in designing and performing meaningful experimental investigations. For instance, the under-determinacy of the contact parameter problem highlighted in point 4. could be easily solved by performing standard FRF measurements under different EO excitations. Then, using the observations summarized in point 3., it will be possible to determine a unique and true set of contact parameters.
The authors are confident that the numerical evidence collected and analysed within this paper will serve a double purpose. In the short term, it will serve as a reference to guide designers in the modelling process and raise their awareness on the level of trust they can place on their predictions. In the medium run, it will constitute a solid starting point to design and perform a dedicated experimental campaign to collect missing relevant information and thus create and validate a robust and predictive design tool.
Author Contributions
The three authors contributed equally to this paper.
Conflicts of Interest
The authors declare no conflict of interest.
Abbreviations
The following abbreviations are used in this manuscript:
| CB-CMS | Craig Bampton-Component Mode Synthesis |
| DOF(s) | Degree(s) Of Freedom |
| EO | Engine Order |
| FE | Finite Elements |
| FRF | Frequency Response Function |
| MHBM | Multi-Harmonic Balance Method |
| Mesh Multiplying Factor | |
| Stiffness Multiplying Factor |
References
- Griffin, J.H. Friction Damping of Resonant Stresses in Gas Turbine Airfoils. J. Eng. Power 1980, 102, 329–333. [Google Scholar] [CrossRef]
- Aeromechanics Design of Turbine Blades (ADturB). Result in Brief: High Cycle Fatigue under High Profile Study; Techreport, Project ID: BRPR950124; European Union: City of Brussels, Belgium, 2000.
- Szwedowicz, J. Bladed disks: Non linear dynamics. In Structural Design of Aircraft Engines: Key Objectives and Techniques; Seinturier, E., Paniagua, G., Eds.; von Karman Institute for Fluid Dynamics: Sint-Genesius-Rode, Belgium, 2008. [Google Scholar]
- Petrov, E.P. Explicit Finite Element Models of Friction Dampers in Forced Response Analysis of Bladed Disks. J. Eng. Gas Turbines Power 2008, 130, 022502. [Google Scholar] [CrossRef]
- Yang, B.D.; Chen, J.J.; Menq, C.H. Prediction of resonant response of shrouded blades with three-dimensional shroud constraint. J. Eng. Gas Turbines Power 1999, 121, 523–529. [Google Scholar] [CrossRef]
- Shi, Y.; Hong, J.; Shan, Y.; Zhu, Z. Forced response analysis of shrouded blades by an alternating frequency/time domain method. In Proceedings of the ASME Turbo Expo: Power for Land, Sea, and Air, Barcelona, Spain, 8–11 May 2006. [Google Scholar] [CrossRef]
- Szwedowicz, J.; Visser, R.; Sextro, W.; Masserey, P.A. On Nonlinear Forced Vibration of Shrouded Turbine Blades. J. Turbomach. 2007, 130, 011002. [Google Scholar] [CrossRef]
- Gu, W.; Xu, Z.; Liu, Y. A method to predict the nonlinear vibratory response of bladed disc system with shrouded dampers. Proc. Inst. Mech. Eng. Part C J. Mech. Eng. Sci. 2011, 226, 1620–1632. [Google Scholar] [CrossRef]
- Berruti, T.; Maschio, V. Experimental Investigation on the Forced Response of a Dummy Counter-Rotating Turbine Stage With Friction Damping. J. Eng. Gas Turbines Power 2012, 134, 1–8. [Google Scholar] [CrossRef]
- Yanq, B.D.; Menq, C.H. Characterization of contact kinematics and application to the design of wedge dampers in turbomachinery application: Part2—Prediction of forced response and experimental verification. J. Eng. Gas Turbines Power 1998, 120, 418–423. [Google Scholar] [CrossRef]
- Panning, L.; Sextro, W.; Popp, K. Optimization of interblade friction damper design. In Proceedings of the ASME Turbo Expo 2000: Power for Land, Sea, and Air, Munich, Germany, 8–11 May 2000. [Google Scholar]
- Panning, L.; Sextro, W.; Popp, K. Spatial dynamics of tuned and mistuned bladed disks with cylindrical and wedge-shaped friction dampers. J. Rotat. Mach. 2003, 9, 219–228. [Google Scholar] [CrossRef]
- Petrov, E.P.; Ewins, D.J. Advanced modeling of underplatform friction dampers for analysis of bladed disk vibration. J. Turbomach. 2007, 129, 143–150. [Google Scholar] [CrossRef]
- Berruti, T.; Firrone, C.M.; Pizzolante, M.; Gola, M.M. Fatigue damage prevention on turbine blades: Study of underplatform damper shape. Key Eng. Mater. 2007, 347, 159–164. [Google Scholar] [CrossRef]
- Sever, I.A.; Petrov, E.P.; Ewins, D.J. Experimental and Numerical Investigation of Rotating Bladed Disk Forced Response Using Underplatform Friction Dampers. J. Eng. Gas Turbines Power 2008, 130, 042503. [Google Scholar] [CrossRef]
- Cigeroglu, E.; An, N.; Menq, C.H. Forced response prediction of constrained and unconstrained structures coupled through friction contacts. J. Eng. Gas Turbines Power 2008, 131, 1–11. [Google Scholar]
- Afzal, M.; Lopez Arteaga, I.; Kari, L. Investigation of damping potential of strip damper on a real turbine blade. In Proceedings of the ASME Turbo Expo 2016: Turbomachinery Technical Conference and Exposition, Seoul, South Korea, 13–17 June 2016. [Google Scholar]
- Sanliturk, K.Y.; Ewins, D.J.; Stanbridge, A.B. Underplatform dampers for turbine blades: Theoretical modeling, analysis and comparison with experimental data. J. Eng. Gas Turbines Power 2001, 123, 919–929. [Google Scholar] [CrossRef]
- Panning, L.; Popp, K.; Sextro, W.; Gotting, F.; Kayser, A.; Wolter, I. Asymmetrical Underplatform Dampers in Gas Turbine Bladings: Theory and Application. In Proceedings of the ASME Turbo Expo 2004: Power for Land, Sea, and Air, Vienna, Austria, 14–17 June 2004; pp. 269–280. [Google Scholar]
- Berruti, T.; Gola, M.M.; Zucca, S. Underplatform Damper Performance with Turbine Blades. In Proceedings of the NATO AVT-121 Symposium on Evaluation, Control and Prevention of High Cycle Fatigue, Granada, Spain, 3–7 October 2005. [Google Scholar]
- Zucca, S.; Borrajo, J.; Gola, M.M. Forced Response of Bladed Disks in Cyclic Symmetry with Underplatform Dampers. In Proceedings of the ASME Turbo Expo 2006: Power for Land, Sea and Air, Barcelona, Spain, 8–11 May 2006. [Google Scholar]
- Koh, K.H.; Griffin, J.H. Dynamic Behavior of Spherical Friction Dampers and its Implication to Damper Contact Stifness. J. Eng. Gas Turbines Power 2007, 129, 511–521. [Google Scholar] [CrossRef]
- Firrone, C.M.; Zucca, S.; Gola, M.M. The effect of underplatform dampers on the forced response of bladed disks by a coupled static/dynamic harmonic balance method. J. Non-Linear Mech. 2011, 46, 363–375. [Google Scholar] [CrossRef]
- Berruti, T.; Firrone, C.M.; Gola, M.M. A Test Rig for Noncontact Traveling Wave Excitation of a Bladed Disk with Underplatform Dampers. J. Eng. Gas Turbines Power 2011, 133, 1–7. [Google Scholar] [CrossRef]
- Gastaldi, C.; Berruti, T.; Gola, M.M. The relevance of damper pre-optimization and its effectiveness on the forced response of blades. In Proceedings of the ASME Turbo Expo 2017: Power for Land, Sea and Air, Charlotte, NC, USA, 26–30 June 2017. [Google Scholar]
- Cardona, A.; Coune, T.; Lerusse, A. A multi-harmonic method for nonlinear vibration analysis. J. Numer. Methods Eng. 1998, 217, 1593–1608. [Google Scholar]
- Sanliturk, K.Y.; Ewins, D.J. Modelling two-dimensional friction contact and its application using harmonic balance method. J. Sound Vib. 1996, 193, 511–523. [Google Scholar] [CrossRef]
- Siewert, C.; Panning, L.; Wallaschek, J.; Richter, C. Multiharmonic forced response analysis of a turbine blading coupled by nonlinear contact forces. J. Eng. Gas Turbines Power 2010, 132, 1–9. [Google Scholar] [CrossRef]
- Craig, R.R.; Bampton, M.C.C. Coupling of substructures for dynamic analyses. AIAA J. 1968, 6, 1313–1319. [Google Scholar]
- Petrov, E.P.; Ewins, D.J. Analytical Formulation of Friction Interface Elements for Analysis on Nonlinear Multi-Harmonic Vibrations of Bladed Disks. J. Turbomach. 2003, 125, 364–371. [Google Scholar] [CrossRef]
- Borrajo, J.M.; Zucca, S.; Gola, M.M. Analytical formulation of the Jacobian matrix for non-linear calculation of the forced response of turbine blade assemblies with wedge friction dampers. J. Non-Linear Mech. 2006, 41, 1118–1127. [Google Scholar] [CrossRef]
- Gastaldi, C.; Berruti, T.M. A method to solve the efficiency accuracy trade-off of multi-harmonic balance calculation of structures with friction contacts. J. Non-Linear Mech. 2017, 129, 25–40. [Google Scholar] [CrossRef]
- Schwingshackl, C.W.; Petrov, E.P.; Ewins, D.J. Effects of contact interface parameters on vibration of turbine bladed disks with underplatform dampers. J. Eng. Gas Turbines Power 2012, 134, 032507. [Google Scholar] [CrossRef]
- Gastaldi, C.; Gola, M.M. A random sampling stregy for tuning contact parameters of underplatform dampers. In Proceedings of the ASME Turbo Expo 2015: Power for Land, Sea and Air, Montreal, QC, Canada, 15–19 June 2015. [Google Scholar]
- Zucca, S.; Firrone, C.M.; Gola, M. Modeling underplatform dampers for turbine blades: A refined approach in the frequency domain. J. Vib. Control 2012, 19, 1087–1102. [Google Scholar] [CrossRef]
- Firrone, C.M.; Zucca, S. Modeling Friction Contacts in Structural Dynamics and its Application to Turbine Bladed Disks. Numer. Anal. Theory Appl. 2011, 14, 301–334. [Google Scholar]
- Yang, B.D.; Menq, C.H. Characterization of 3D contact kinematics and prediction of resonant response of structures having 3D frictional constraint. J. Sound Vib. 1998, 217, 909–925. [Google Scholar] [CrossRef]
- Gastaldi, C. Vibration Control and Mitigation in Turbomachinery. Ph.D. Thesis, Politecnico di Torino, Turin, Italy, 2017. [Google Scholar]
- Gastaldi, C.; Gola, M. Pre-optimization of asymmetrical underplatform dampers. J. Eng. Gas Turbines Power 2016, 139, 012504. [Google Scholar] [CrossRef]
- Cameron, T.; Griffin, J. An alternating frequency/time domain method for calculating the steady-state response of nonlinear dynamic system. J. Appl. Mech. 1989, 56, 149–154. [Google Scholar] [CrossRef]
- Lavella, M. Contact properties and wear behaviour of nickel based superalloy ren 80. Metals 2016, 6, 159. [Google Scholar] [CrossRef]
- Botto, D.; Gastadi, C.; Gola, M.M.; Umer, M. An Experimental Investigation of the Dynamics of a Blade with Two Under-Platform Dampers. ASME. J. Eng. Gas Turbines Power 2017, 140, 032504-9. [Google Scholar] [CrossRef]
Figure 1.
Finite Elements (FE) model of blades and strip damper, full disk obtained through cyclic symmetry and relevant external forces applied on blades and strip dampers. The cyan symbols represent the boundary conditions imposed to the disk sector: each sector is tangentially linked to the neighbouring ones and is rigidly connected to the disk hub, not shown in the picture.
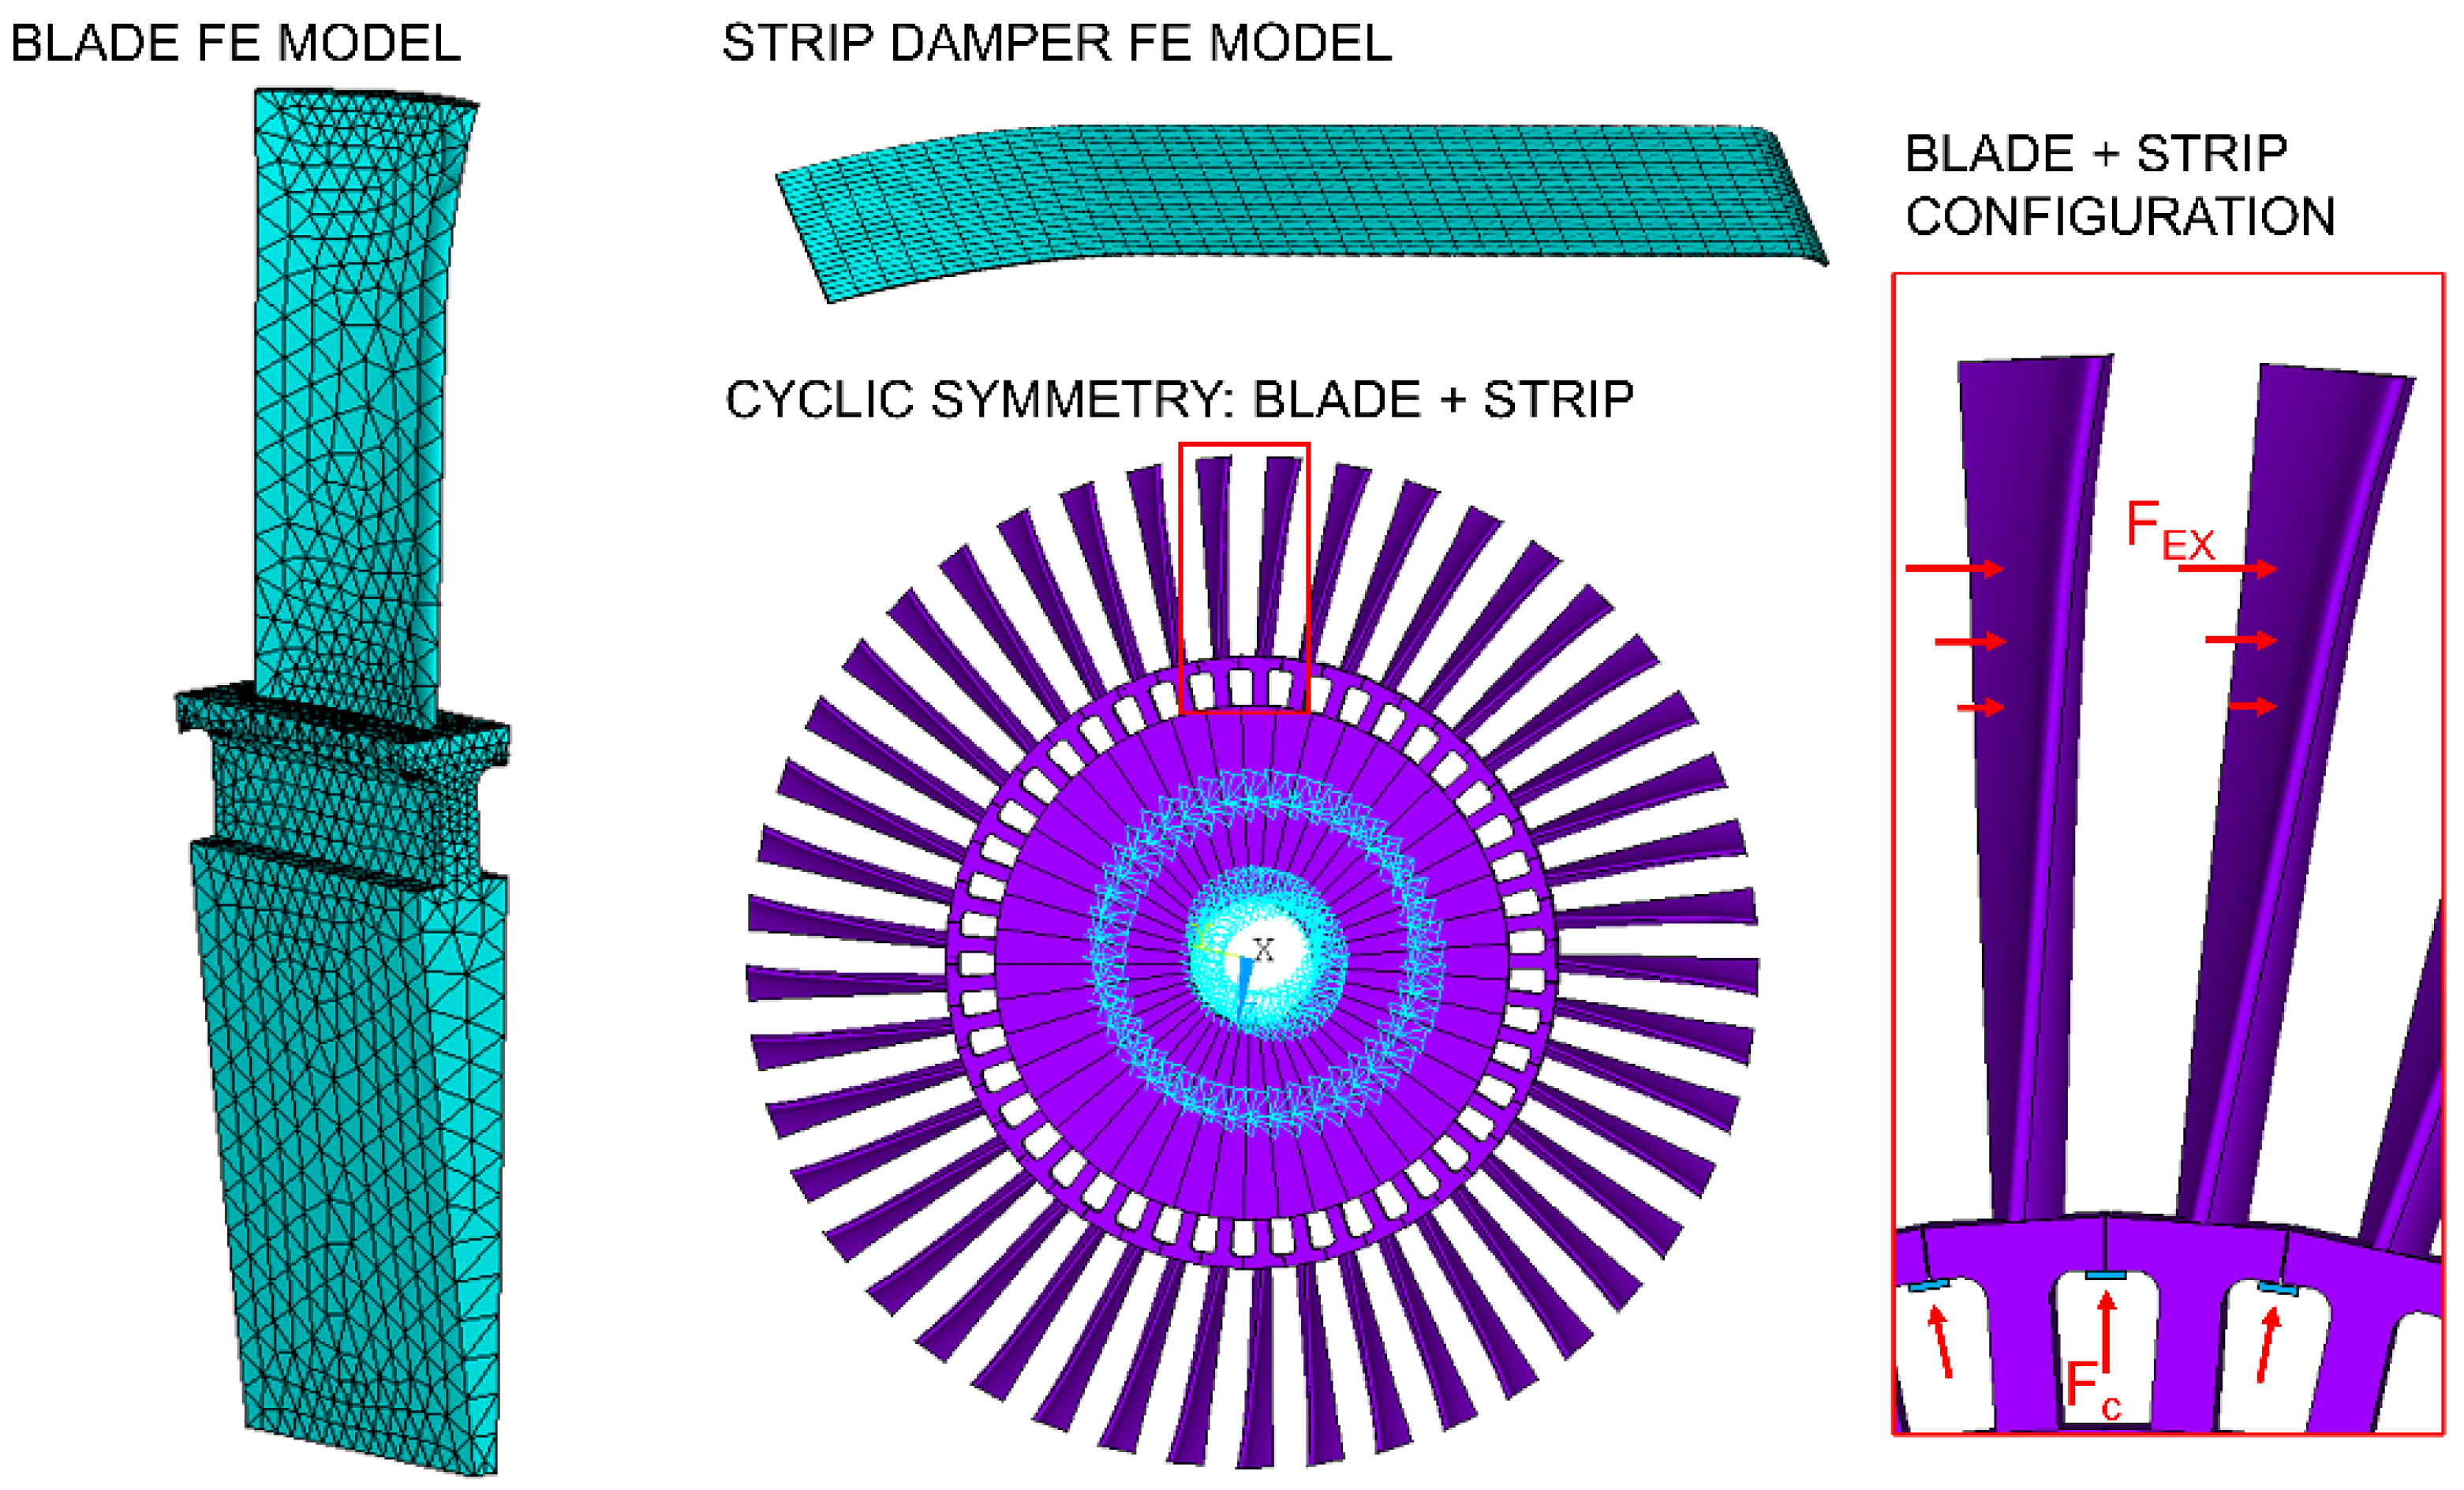
Figure 2.
(a) Contact model with three contact springs. (b) Contact patches on the blade platforms and on the strip damper.
Figure 2.
(a) Contact model with three contact springs. (b) Contact patches on the blade platforms and on the strip damper.

Figure 3.
Scheme of the solving procedure and corresponding key engineering/modelling decisions.
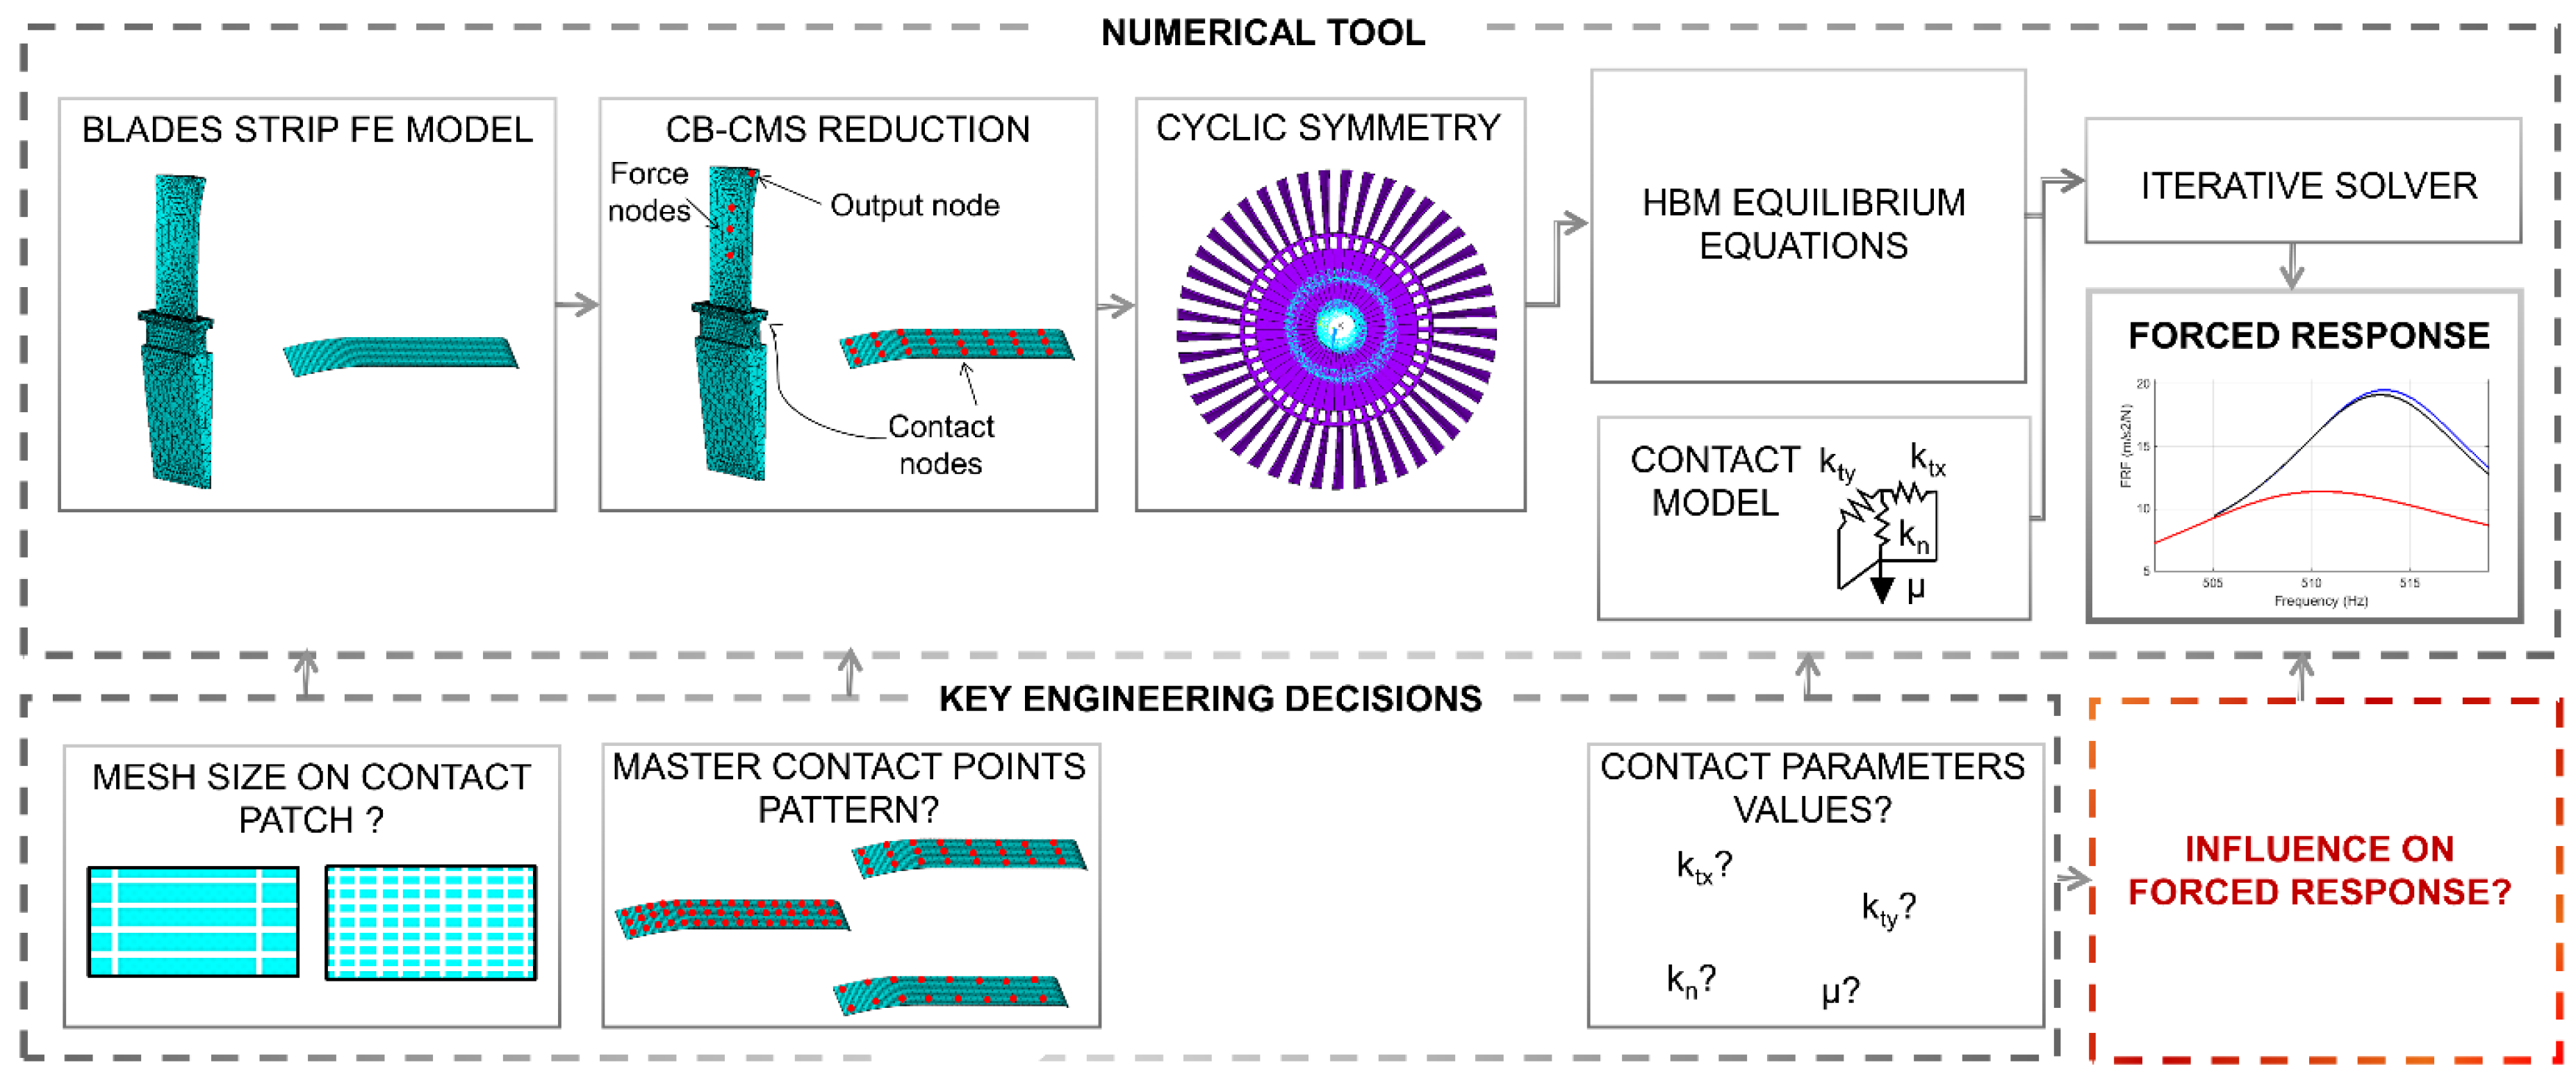
Figure 4.
(a) Example of Free, Full Stick and Nonlinear forced response of the blade-strip system. (b) Resonance frequency values as a function of the excitation level . For = 15, the peak is flat and multiple values are plotted in the figure to reflect this multiplicity.
Figure 4.
(a) Example of Free, Full Stick and Nonlinear forced response of the blade-strip system. (b) Resonance frequency values as a function of the excitation level . For = 15, the peak is flat and multiple values are plotted in the figure to reflect this multiplicity.

Figure 5.
(a) Blade-strip contact interface with different mesh multiplying factors (). (b) Frequency increment produced by mesh size variations expressed through the .
Figure 5.
(a) Blade-strip contact interface with different mesh multiplying factors (). (b) Frequency increment produced by mesh size variations expressed through the .

Figure 6.
(a) Blade-strip contact patch discretization. (b) Frequency variation produced by variable number of master contact nodes.
Figure 6.
(a) Blade-strip contact patch discretization. (b) Frequency variation produced by variable number of master contact nodes.
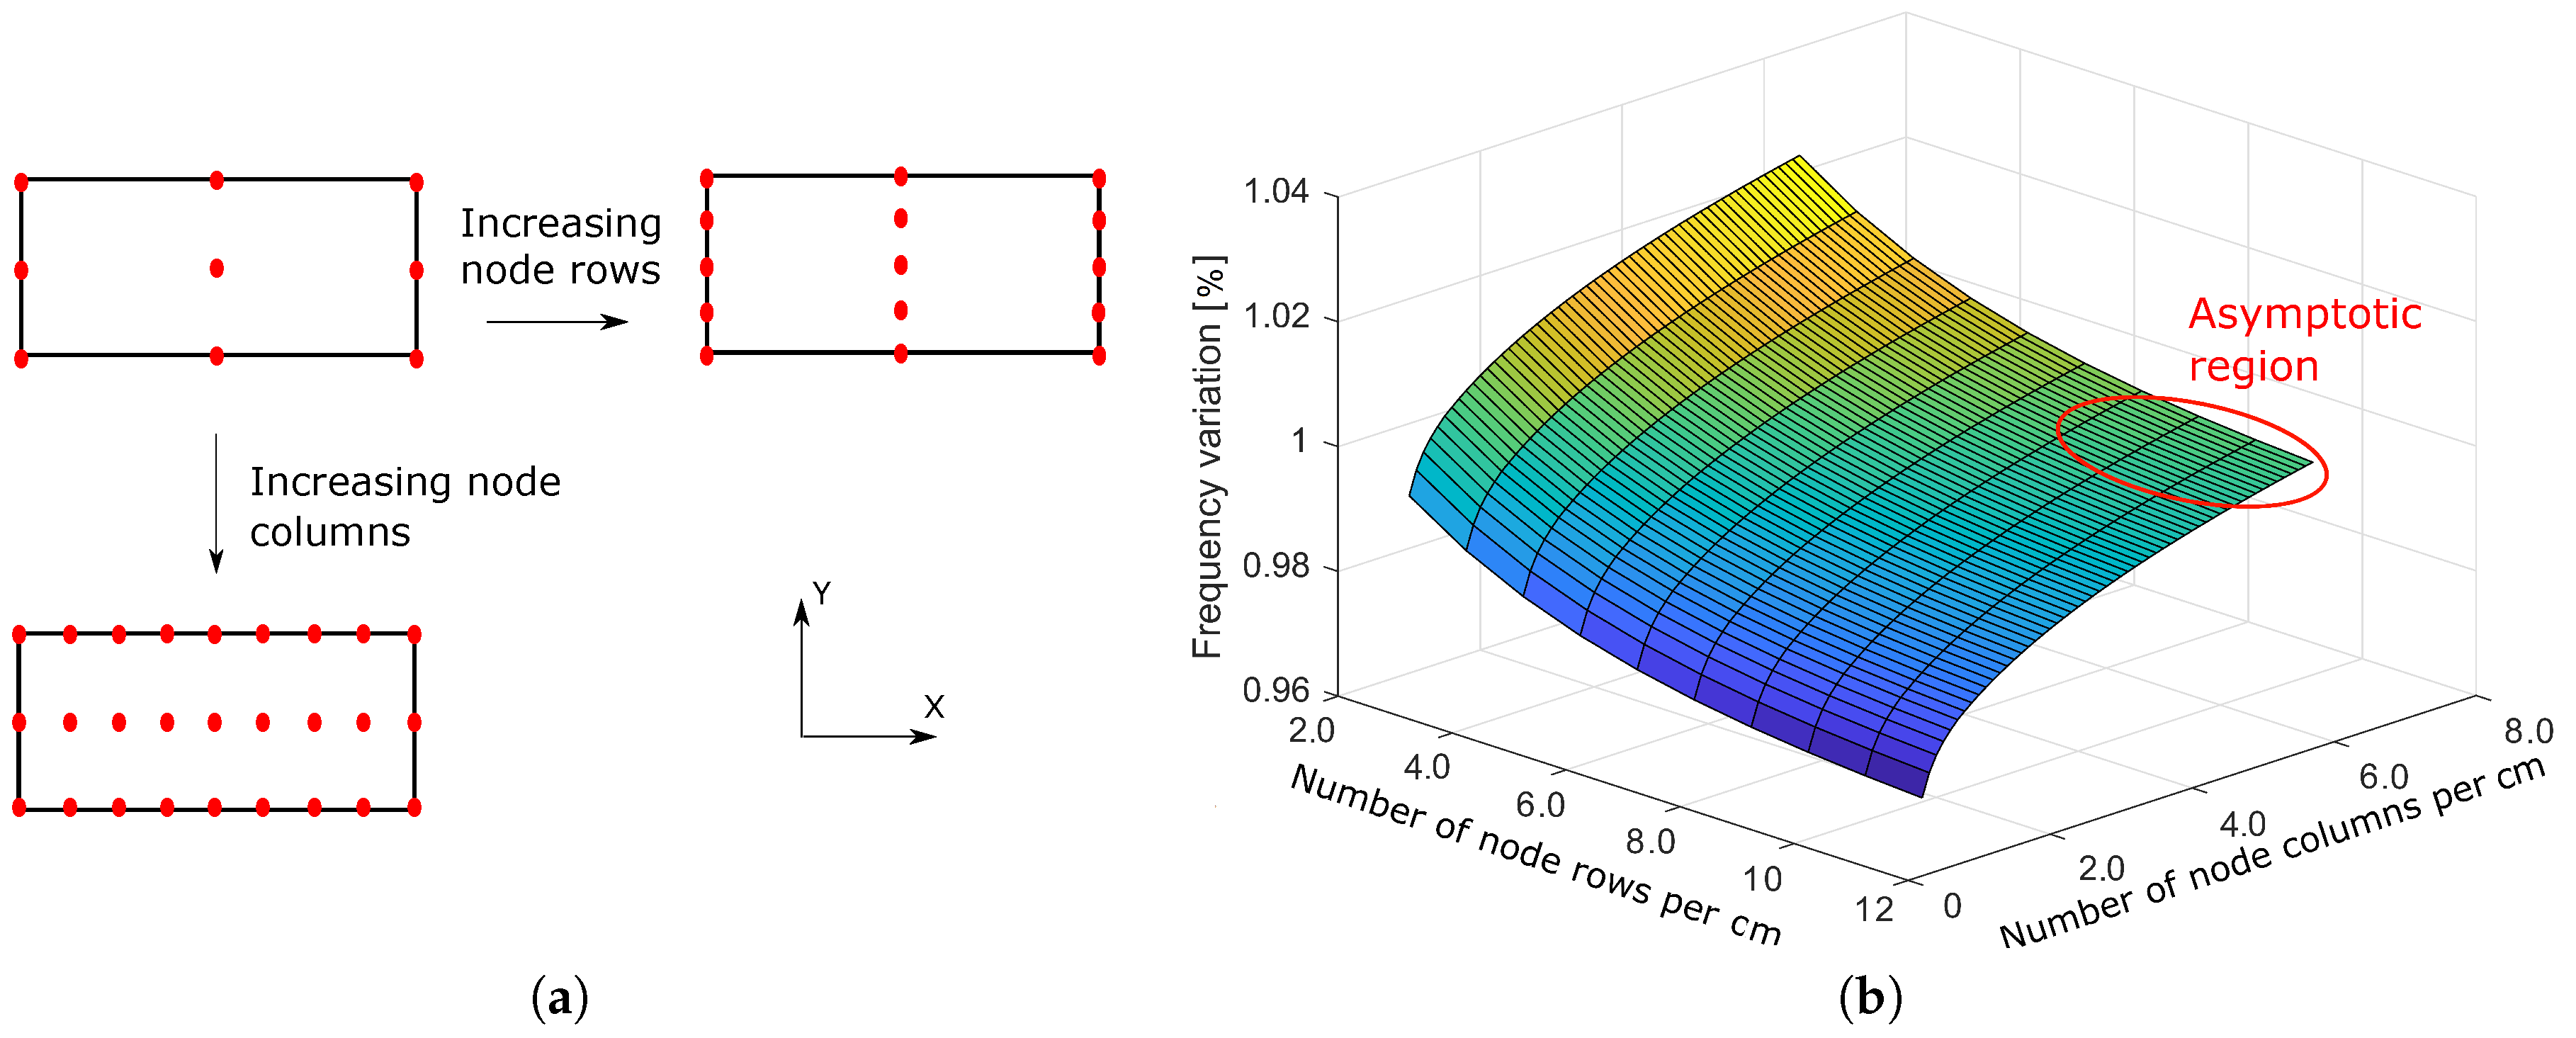
Figure 7.
Top blade-strip contact patch view: high mobility region (red) with the largest relative displacement.
Figure 7.
Top blade-strip contact patch view: high mobility region (red) with the largest relative displacement.

Figure 8.
(a) Blade-strip contact patch discretization. (b) Frequency variation produced by variable number of master contact nodes.
Figure 8.
(a) Blade-strip contact patch discretization. (b) Frequency variation produced by variable number of master contact nodes.
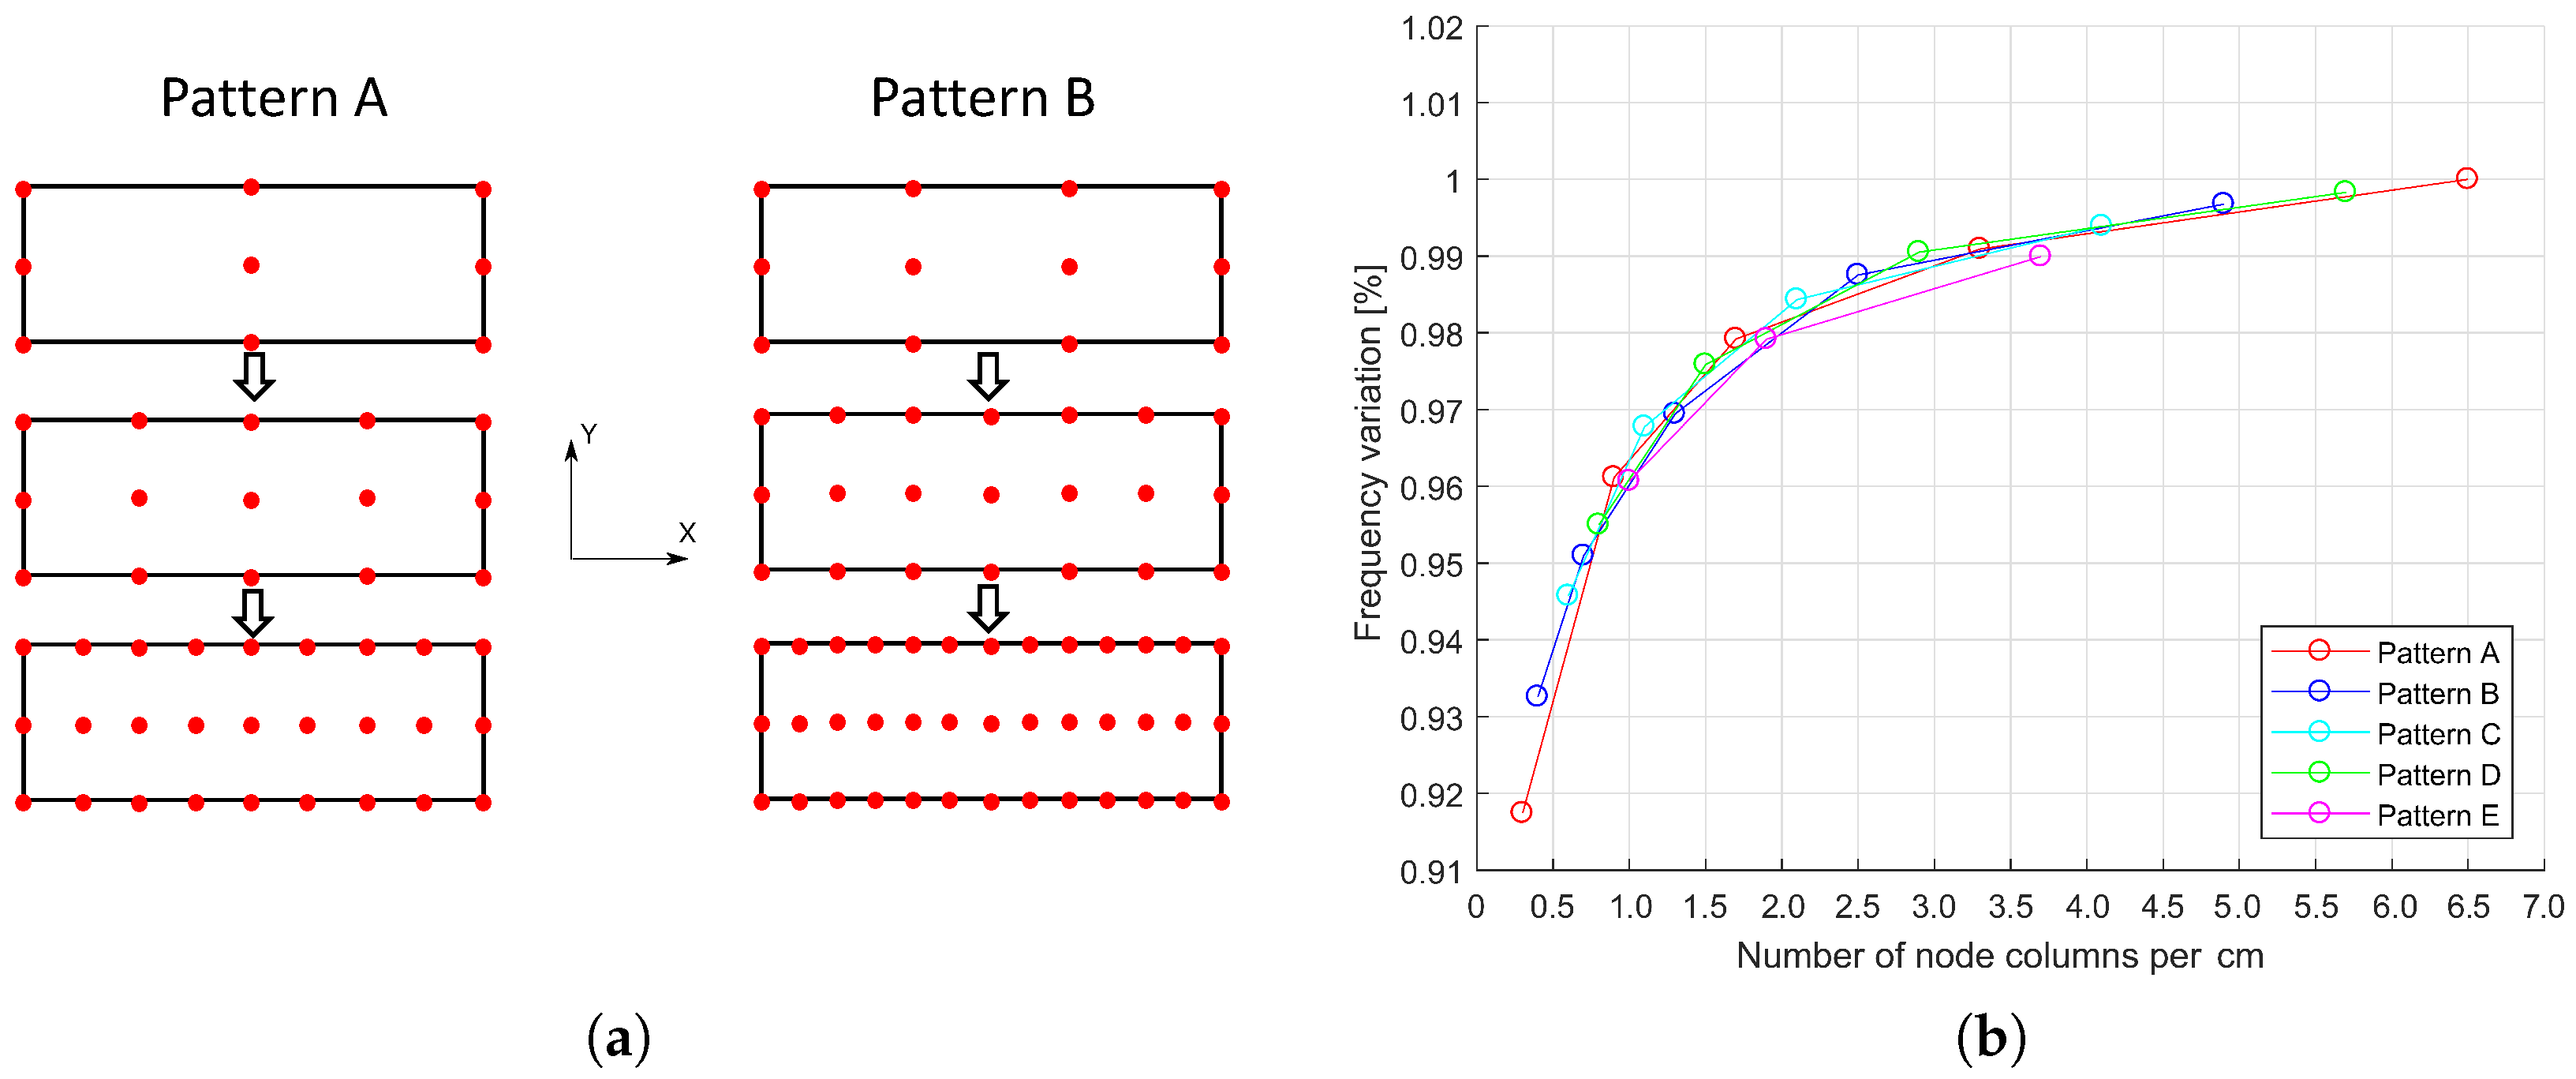
Figure 9.
Effects of retained nodes on the model stiffness.
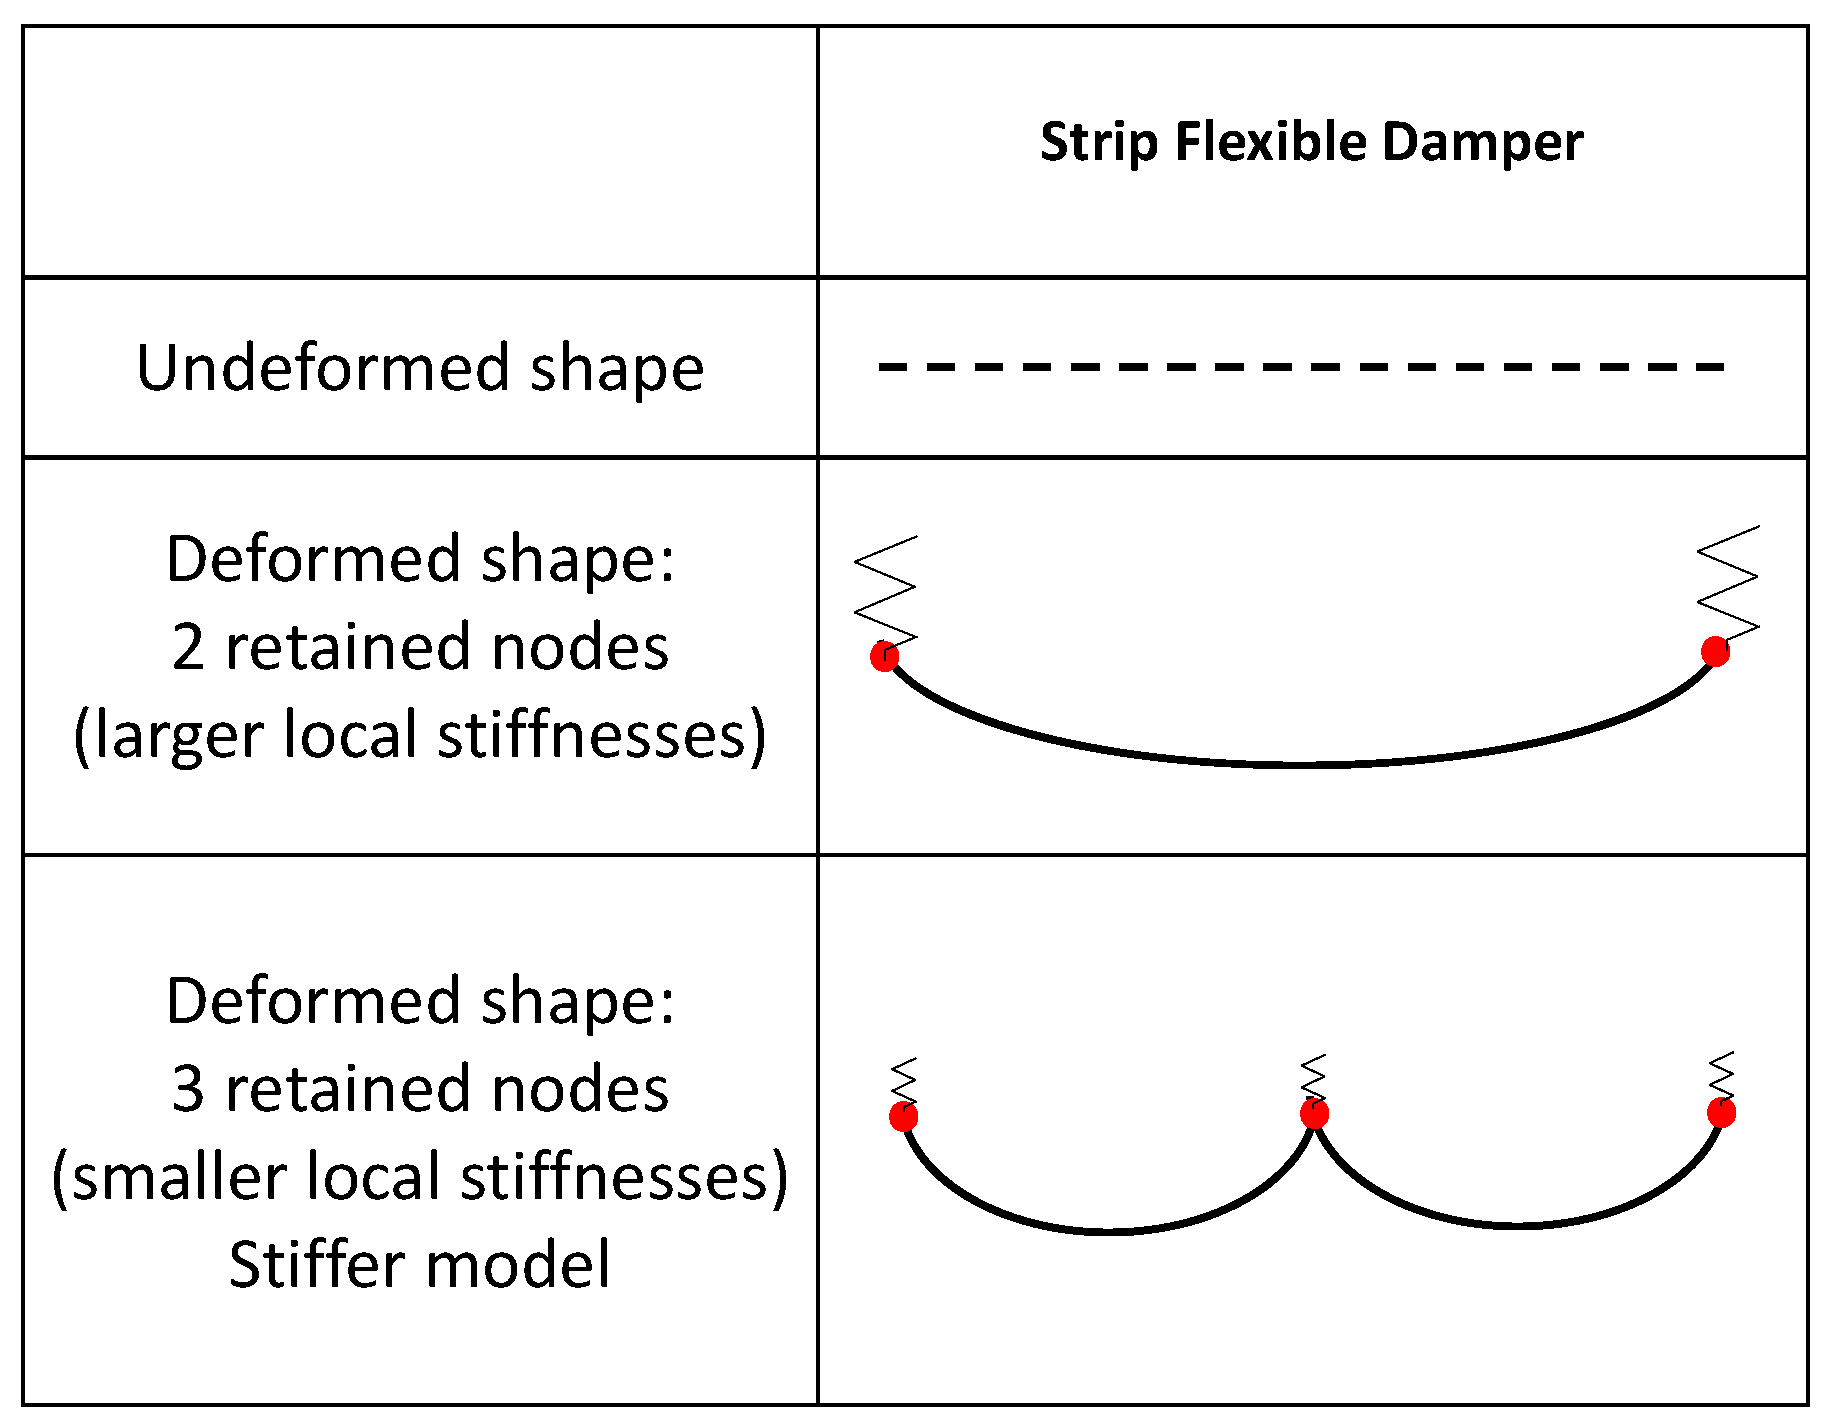
Figure 10.
Blade-strip contact patch top view: relative displacements along X direction for two different combinations of condensation nodes: 15 node columns along X, and 2 or 6 rows along Y direction.
Figure 10.
Blade-strip contact patch top view: relative displacements along X direction for two different combinations of condensation nodes: 15 node columns along X, and 2 or 6 rows along Y direction.

Figure 11.
Influence of mesh discretization and of contact node density along X direction.

Figure 12.
Variation of natural frequency versus the number of retained contact nodes. (a) Neck-bending mode (reference frequency = 1320 Hz). (b) Airfoil torsional mode (reference frequency = 1372 Hz).
Figure 12.
Variation of natural frequency versus the number of retained contact nodes. (a) Neck-bending mode (reference frequency = 1320 Hz). (b) Airfoil torsional mode (reference frequency = 1372 Hz).

Figure 13.
Neck-bending mode shape. (a) Influence of contact stiffnesses for In-Phase (IP) (1320 Hz) motion. (b) Influence of contact stiffnesses for Out-of-Phase (OOP) (1366 Hz) motion.
Figure 13.
Neck-bending mode shape. (a) Influence of contact stiffnesses for In-Phase (IP) (1320 Hz) motion. (b) Influence of contact stiffnesses for Out-of-Phase (OOP) (1366 Hz) motion.

Figure 14.
In-phase and out-of-phase behaviors.
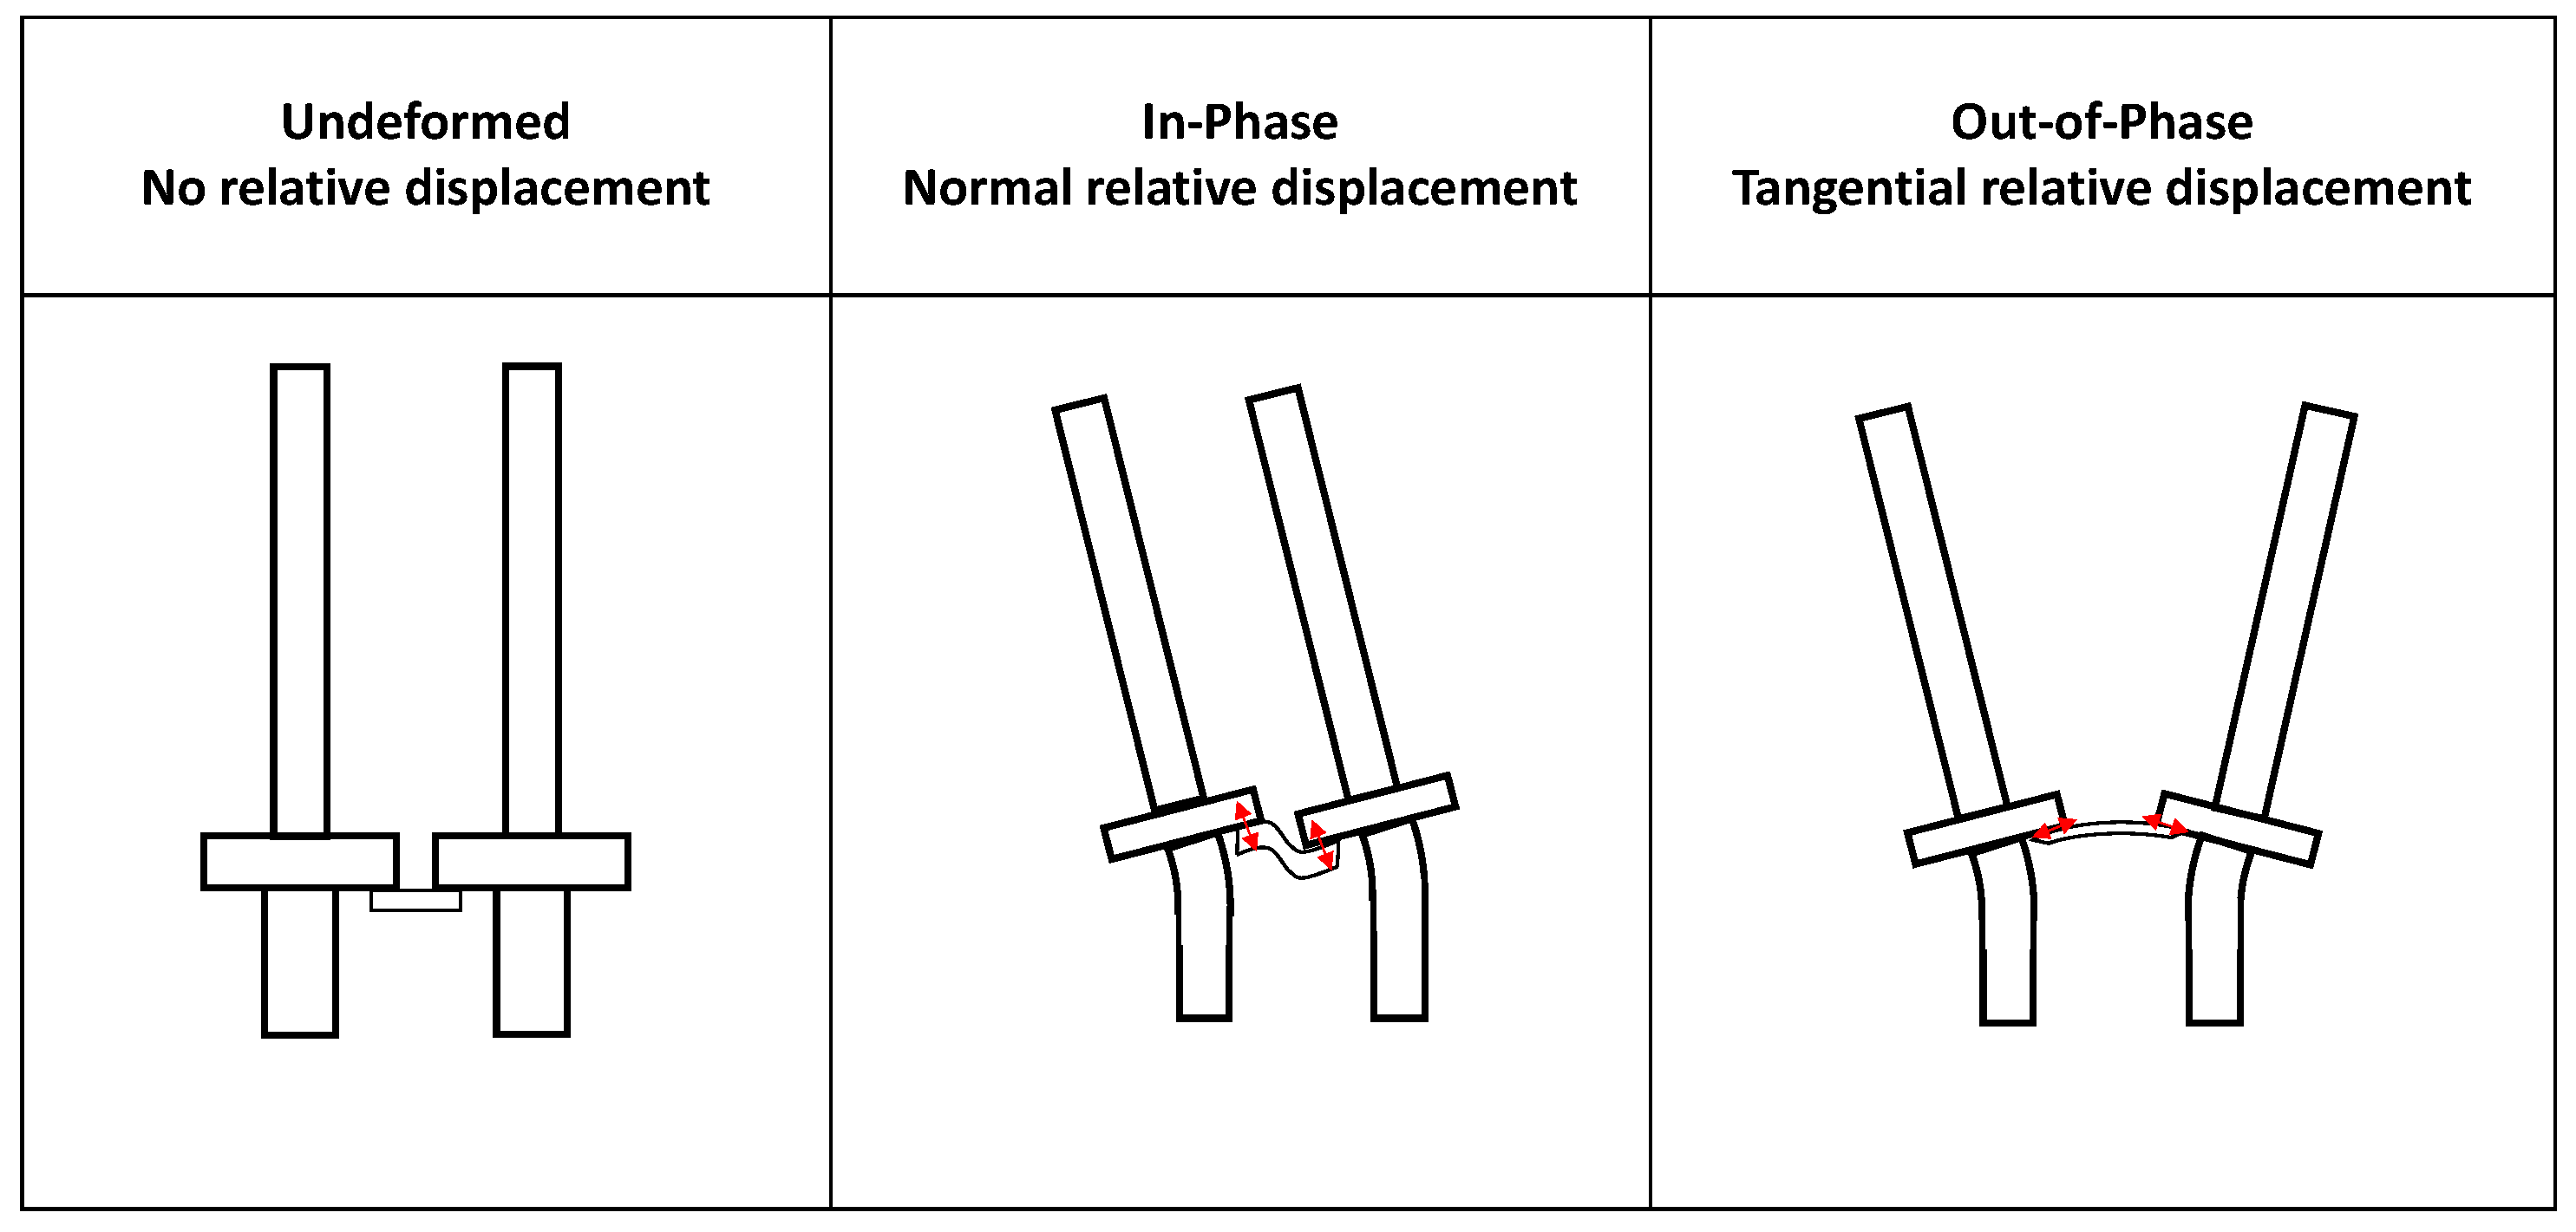
Figure 15.
Natural frequency versus the number of retained nodes for different contact stiffness values.
Figure 15.
Natural frequency versus the number of retained nodes for different contact stiffness values.


Table 1.
Definition of “nominal” key modelling choices and investigated variations.
| Mesh Size | Number of Master Contact Nodes | Contact Parameter Values | |
|---|---|---|---|
| Nominal value | Rectangular grid , [2.5 × 1] mm elements | 715 nodes per contact patch | = 1000 N/μm k = 233 N/μm |
| Explored variation | MMF = 1, [2.5 × 1] mm elements = 0.5, [1.25 × 1] mm elements = 0.25, [0.63 × 1] mm elements | 2 to 715 nodes per contact patch | 0.5 for for |
Size of contact patch: [100 × 10] mm; Mesh Multiplying Factor (); Stiffness Multiplying Factor ().
Table 2.
Pattern of nodes retained during the reduction procedure.
| Patterns | Number of Node Columns (Corresponding Node Density [nodes/cm]) | |||||
|---|---|---|---|---|---|---|
| A | 3 (0.3) | 5 (0.5) | 9 (0.9) | 17 (1.7) | 33 (3.3) | 65 (6.5) |
| B | 4 (0.4) | 7 (0.7) | 13 (1.3) | 25 (2.5) | 49 (4.9) | - |
| C | 6 (0.6) | 11 (1.1) | 21 (2.1) | 41 (4.1) | - | - |
| D | 8 (0.8) | 15 (1.5) | 29 (2.9) | 57 (5.7) | - | - |
| E | 10 (1.0) | 19 (1.9) | 37 (3.7) | 73 (7.3) | - | - |
Table 3.
Guidelines in a nutshell.
| Key parameters | Guidelines |
|---|---|
| Mesh size | Regular mesh on the blade and strip contact surfaces, grid size approximately 1 mm. |
| Master contact nodes density | 4.5 nodes/cm along the contact long edge, 7 nodes/cm along the contact short edge. A convergence study in linear regime (springs between contact nodes), see Figure 6b, is suggested to ensure an accurate choice if different modes (e.g., torsional) are investigated. |
| Contact stiffness values | To be determined experimentally. In the present case = 1000 N/μm and = 233 N/μm were assumed from experiments performed on rigid dampers having the same geometry, material and contact pressure as the strip object of this investigation. |
© 2017 by the authors. Licensee MDPI, Basel, Switzerland. This article is an open access article distributed under the terms and conditions of the Creative Commons Attribution (CC BY) license (http://creativecommons.org/licenses/by/4.0/).
Share and Cite
MDPI and ACS Style
Gastaldi, C.; Fantetti, A.; Berruti, T.M. Forced Response Prediction of Turbine Blades with Flexible Dampers: The Impact of Engineering Modelling Choices. Appl. Sci. 2018, 8, 34. https://doi.org/10.3390/app8010034
AMA Style
Gastaldi C, Fantetti A, Berruti TM. Forced Response Prediction of Turbine Blades with Flexible Dampers: The Impact of Engineering Modelling Choices. Applied Sciences. 2018; 8(1):34. https://doi.org/10.3390/app8010034
Chicago/Turabian StyleGastaldi, Chiara, Alfredo Fantetti, and Teresa M. Berruti. 2018. "Forced Response Prediction of Turbine Blades with Flexible Dampers: The Impact of Engineering Modelling Choices" Applied Sciences 8, no. 1: 34. https://doi.org/10.3390/app8010034
Note that from the first issue of 2016, this journal uses article numbers instead of page numbers. See further details here.