Characterizing the Dissolution Rate of CO2-Brine in Porous Media under Gaseous and Supercritical Conditions

 ,
, 
Abstract
:1. Introduction
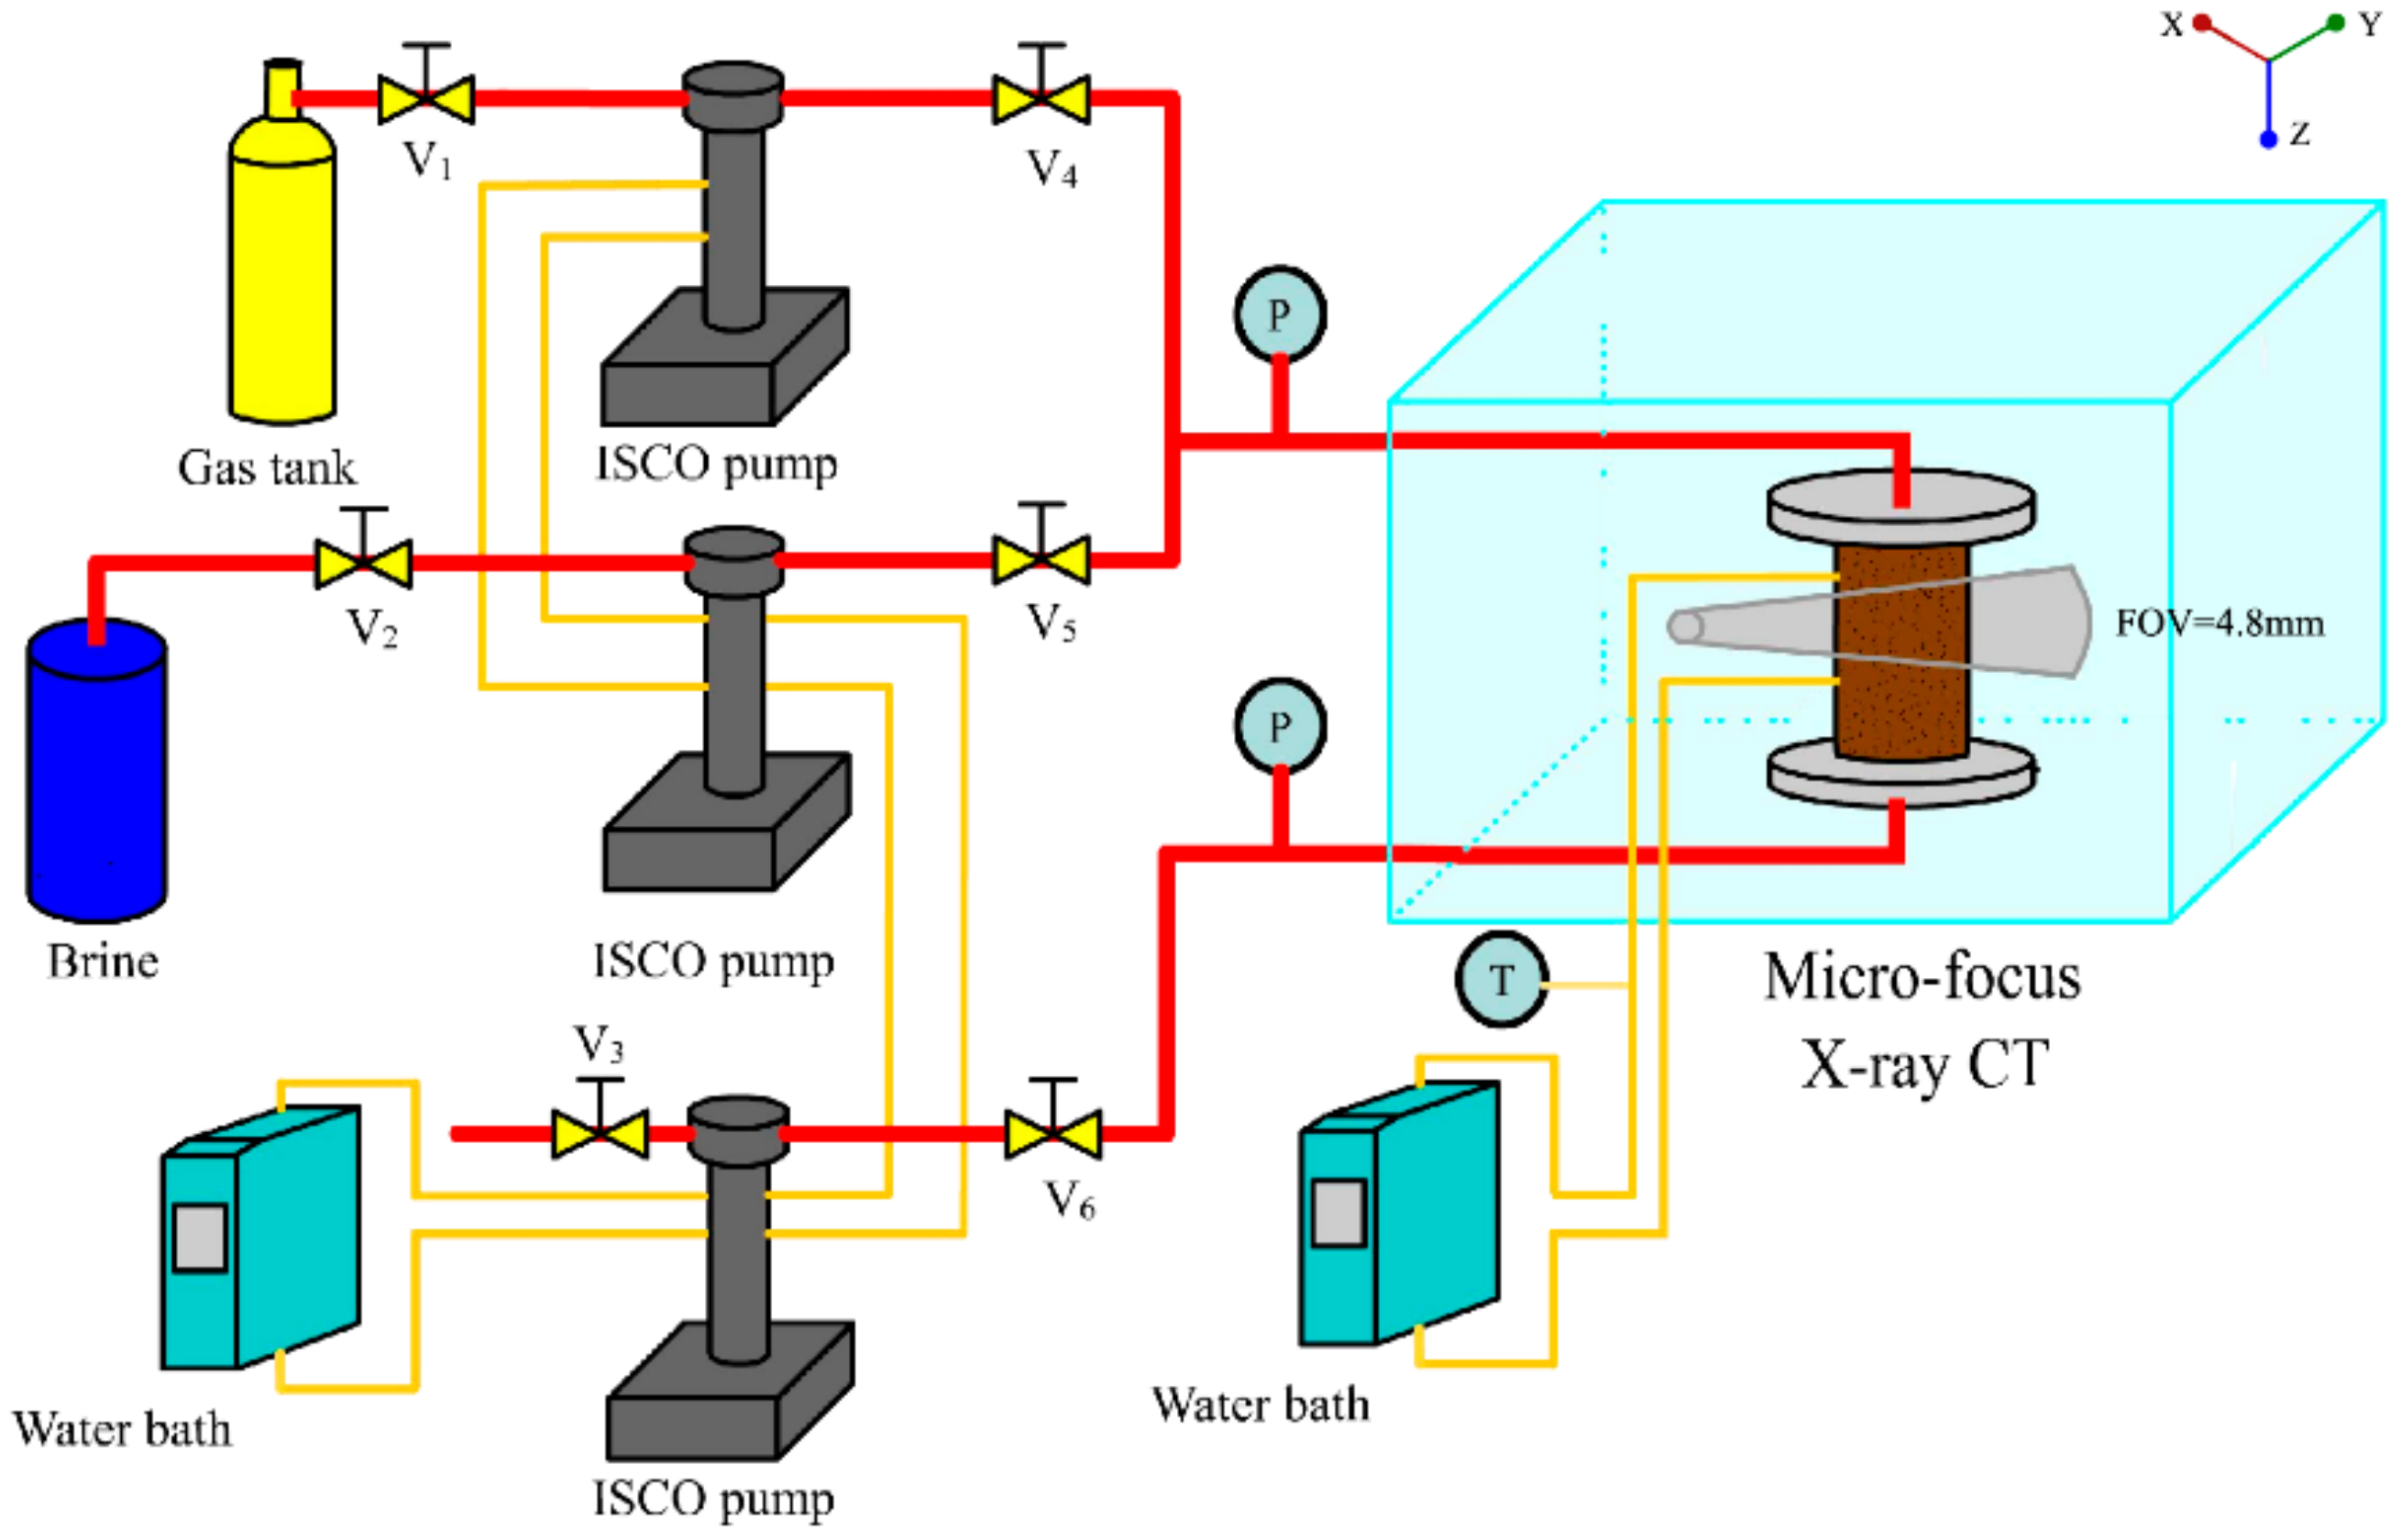
2. Materials and Methods
2.1. Experimental Material and Performance
2.2. Experimental Produce
3. Results and Discussion
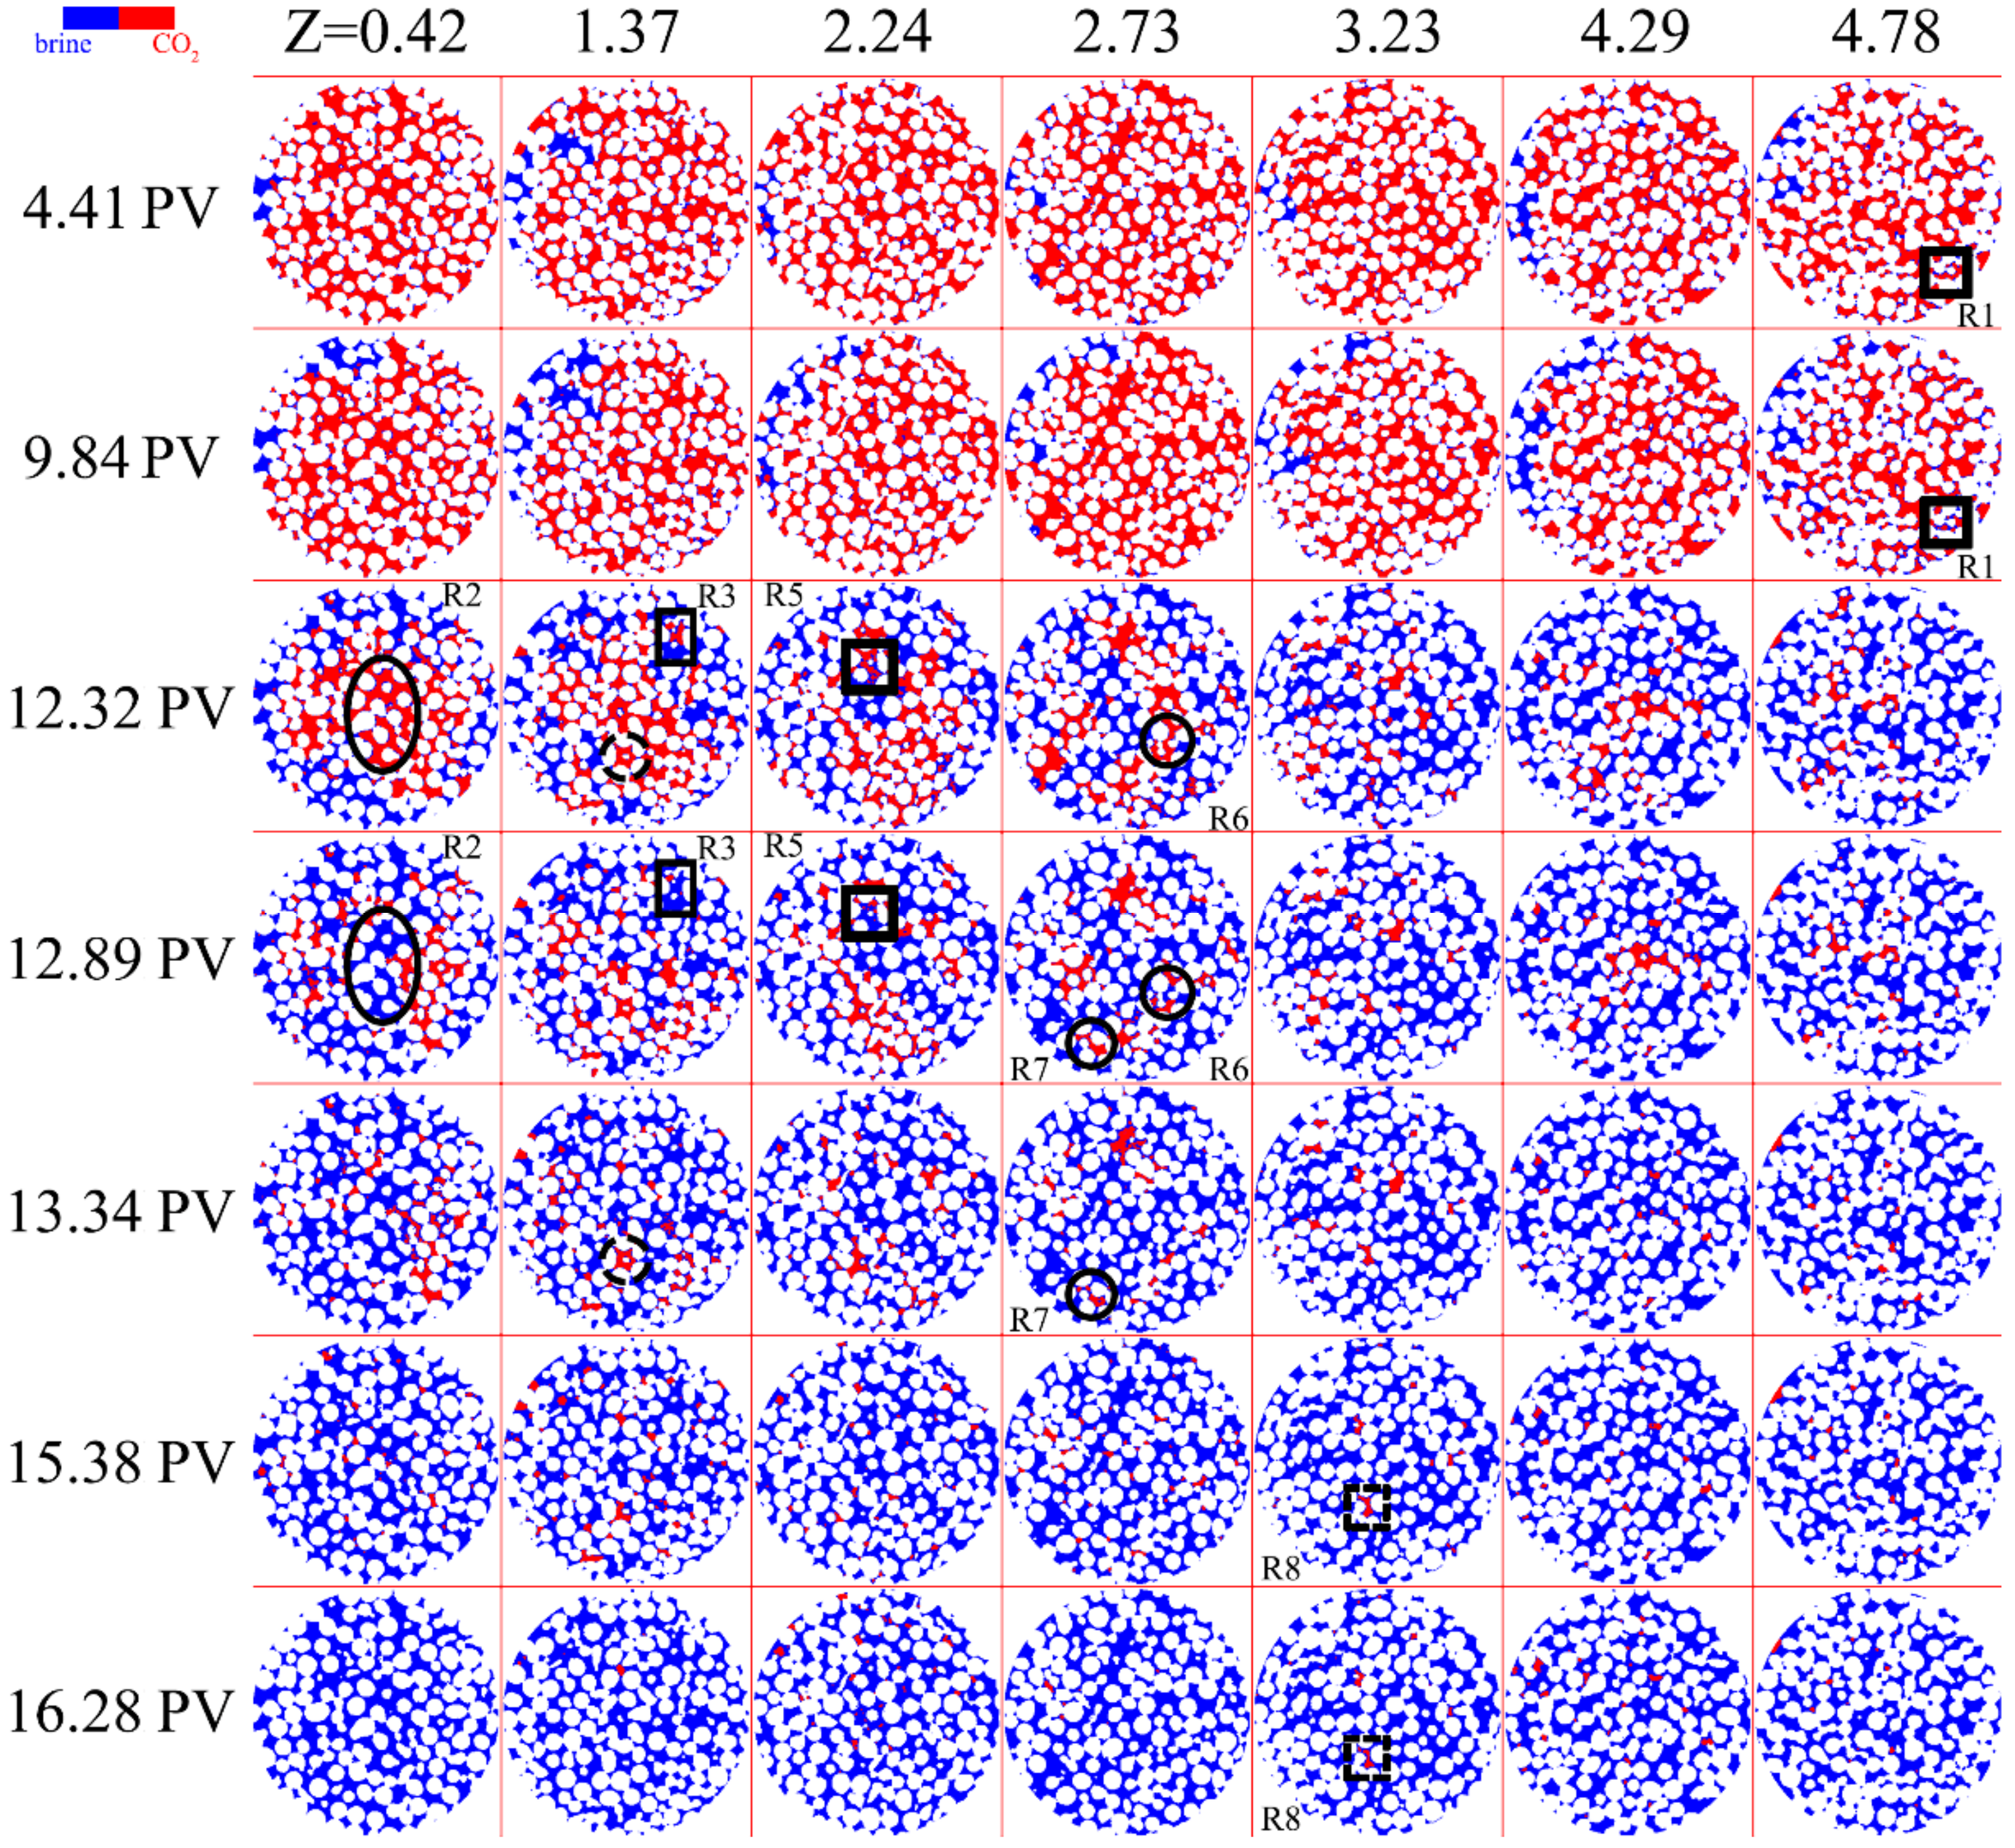
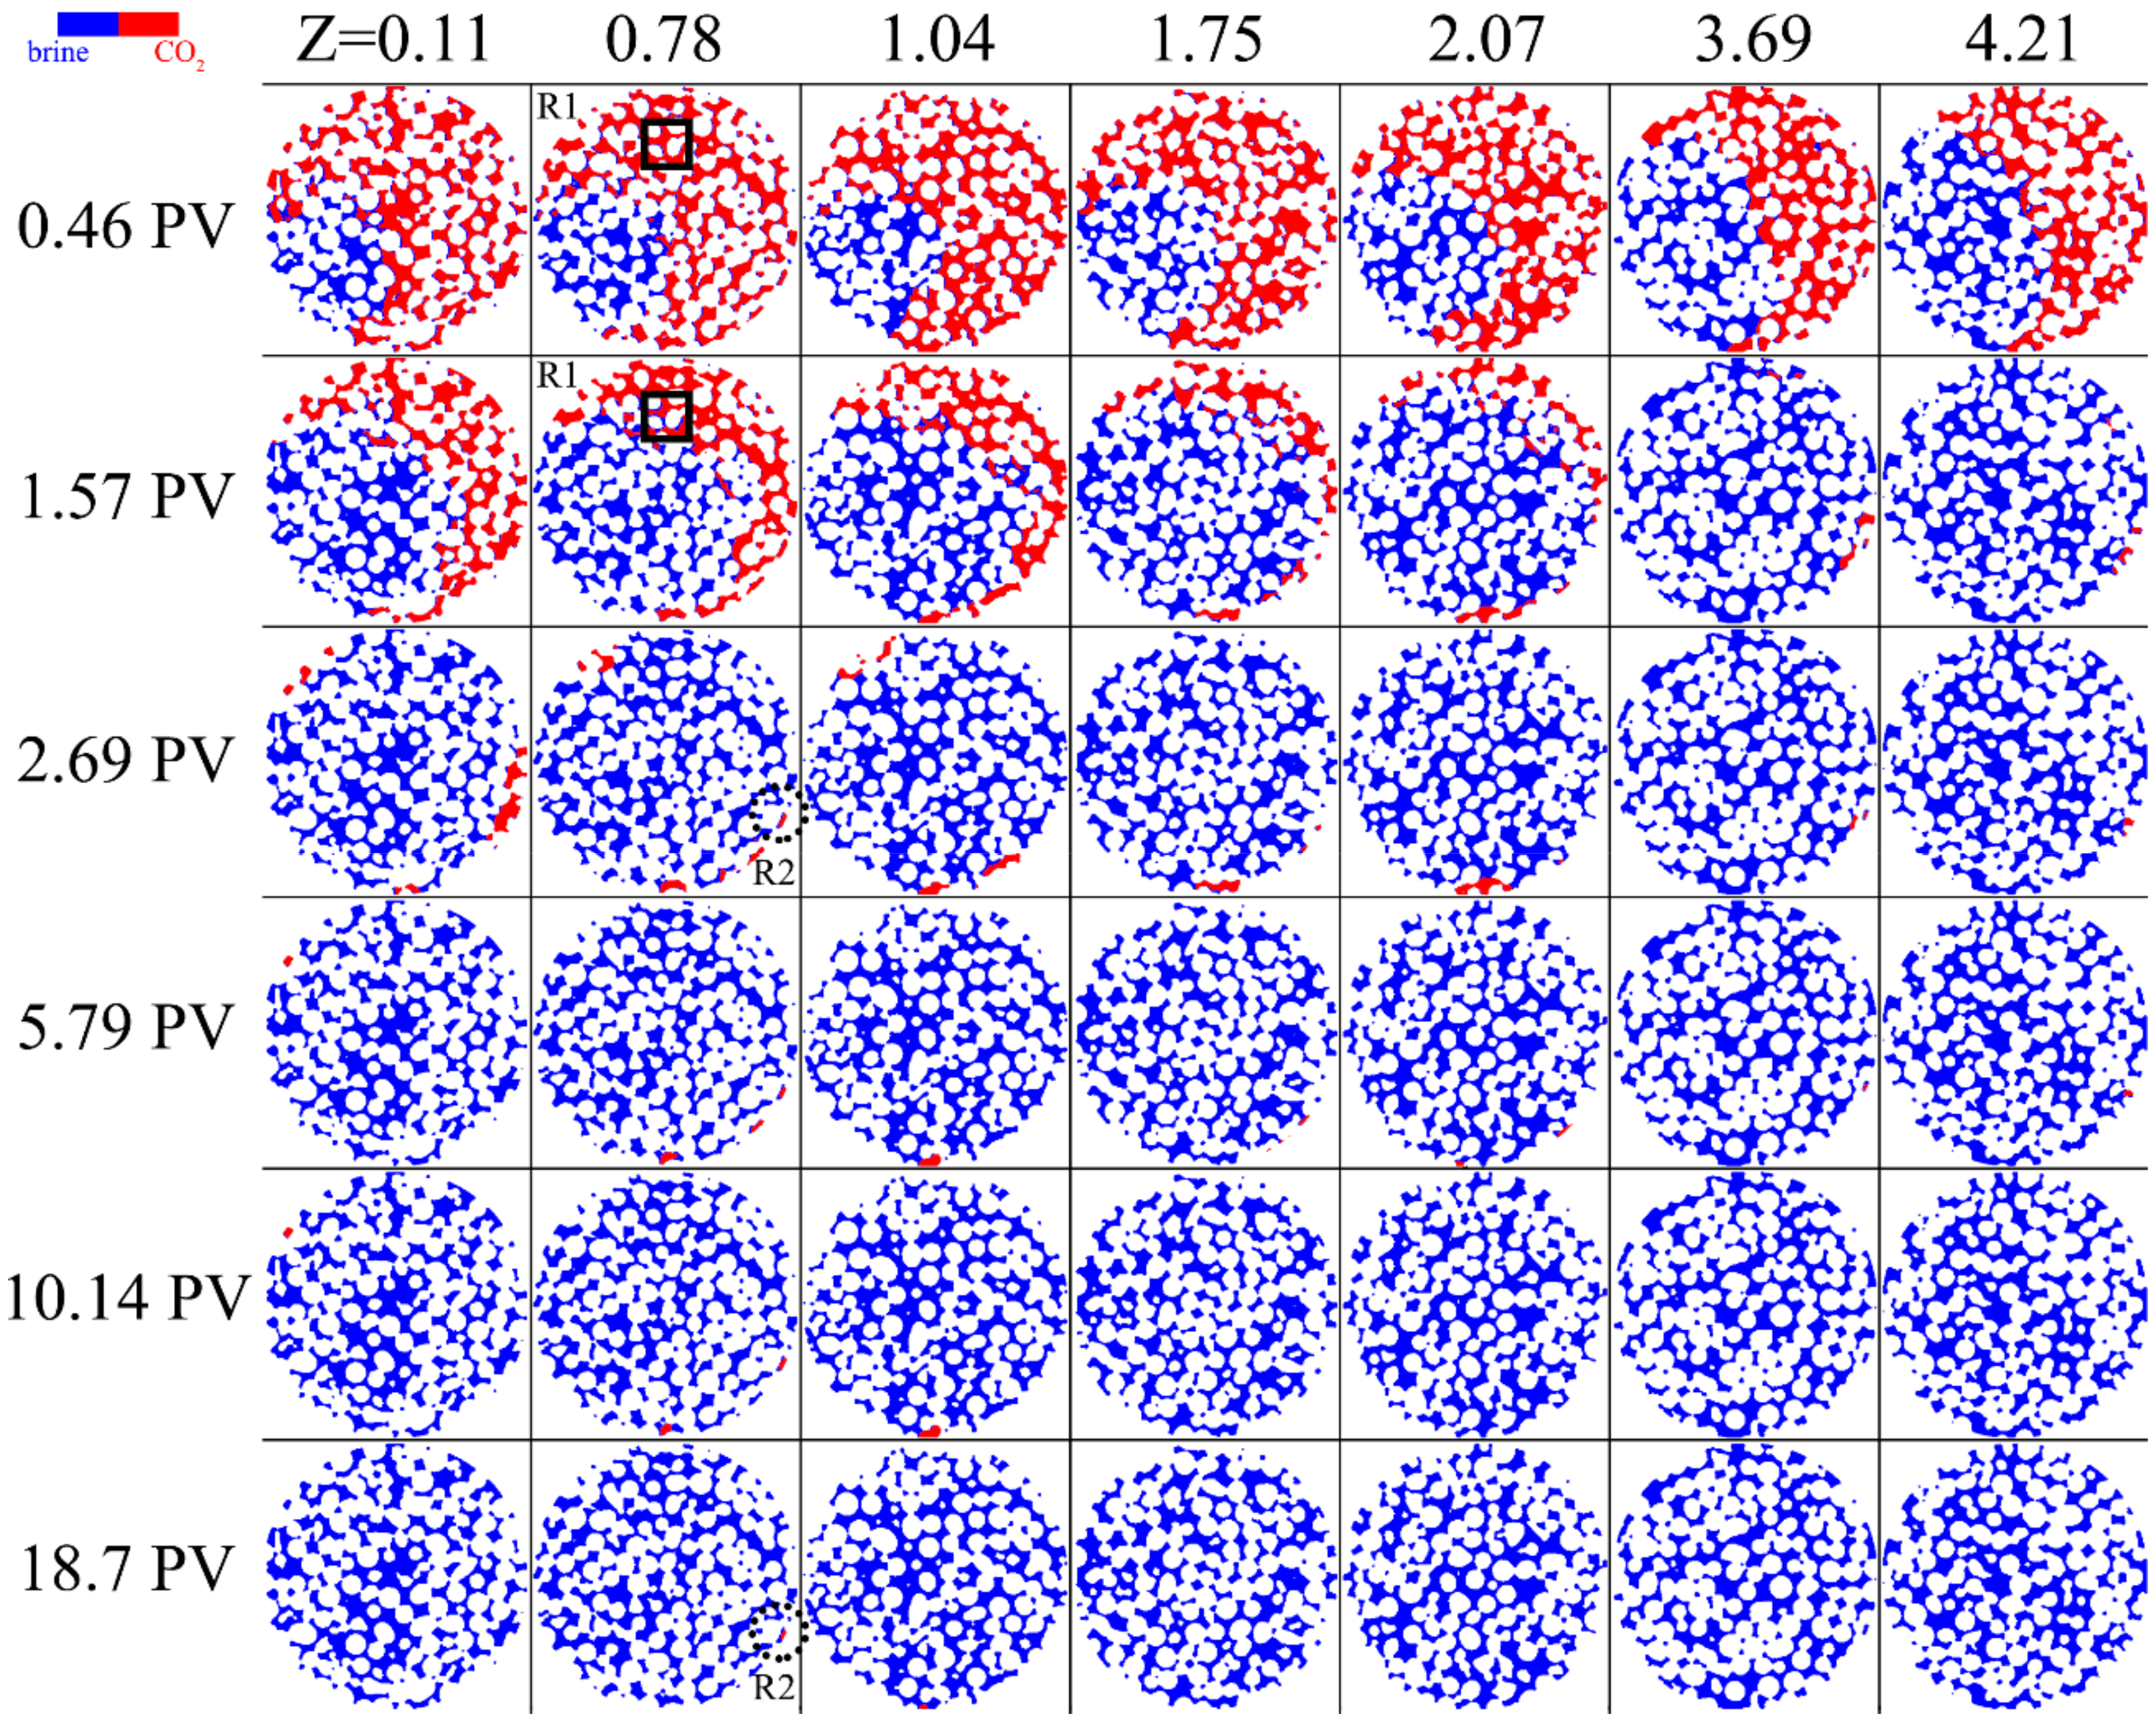
3.1. Pore-Scale CO2 Dissolution and Flow Development
3.2. Porosity and Saturation Influence
3.3. Reynolds Number-Dissolution Rate Relationships
4. Conclusions
- For flow development under a supercritical CO2 state, high contact between the brine and CO2 resulted in a greater CO2 dissolution rate, while the flow bypassing restrained the dissolution rate with CO2 confined to the central region. The detached part of the bubbles which happened to snap-off rapidly dissolved. The isolated bubbles reduced the overall CO2 dissolution rate and prolonged the depletion time due to the slow diffusion. For gaseous CO2, the flow development was limited due to the greater density difference, implying lower dissolution rates and a lower probability of dissolution events. The isolated gaseous CO2 existed for much longer and significantly prolonged the duration of the dissolution.
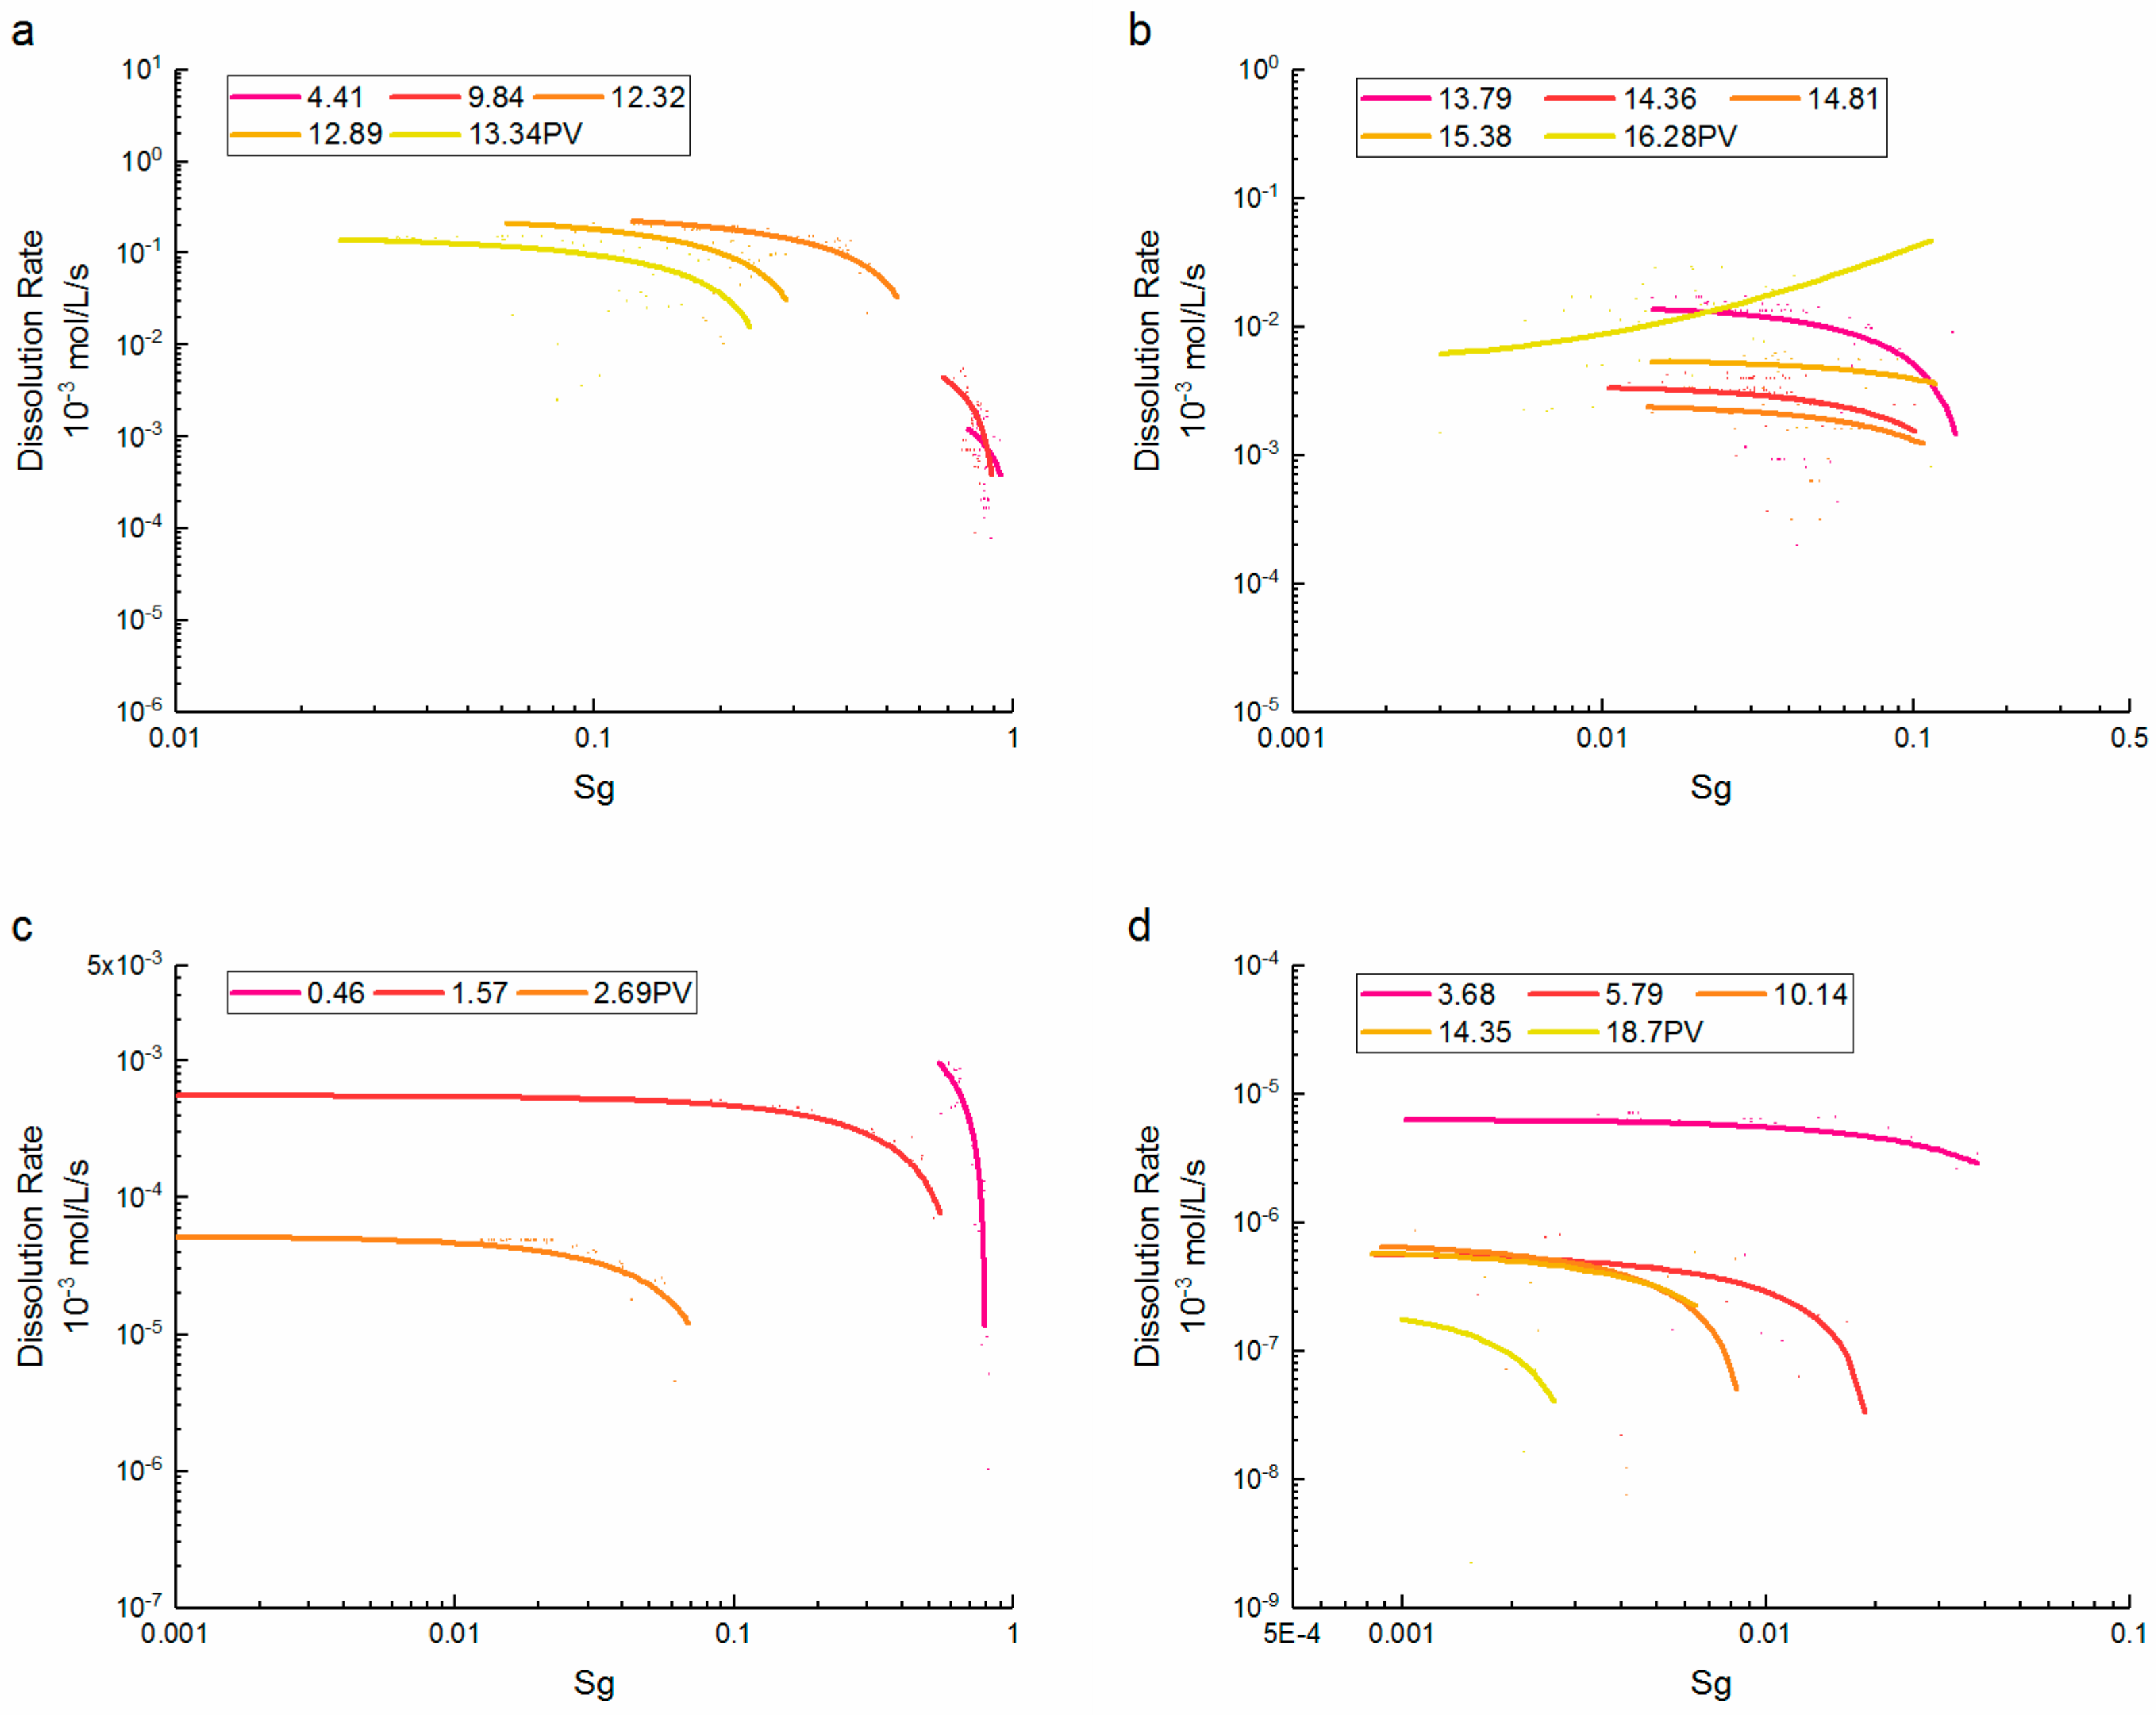
- The dissolution rate of supercritical CO2 was about two or three orders of magnitude greater than that of gaseous CO2, while the value distributions both spanned about four orders of magnitude. The dissolution rate of gaseous CO2 decreased more dramatically because of the diverse number of residual CO2 bubbles.
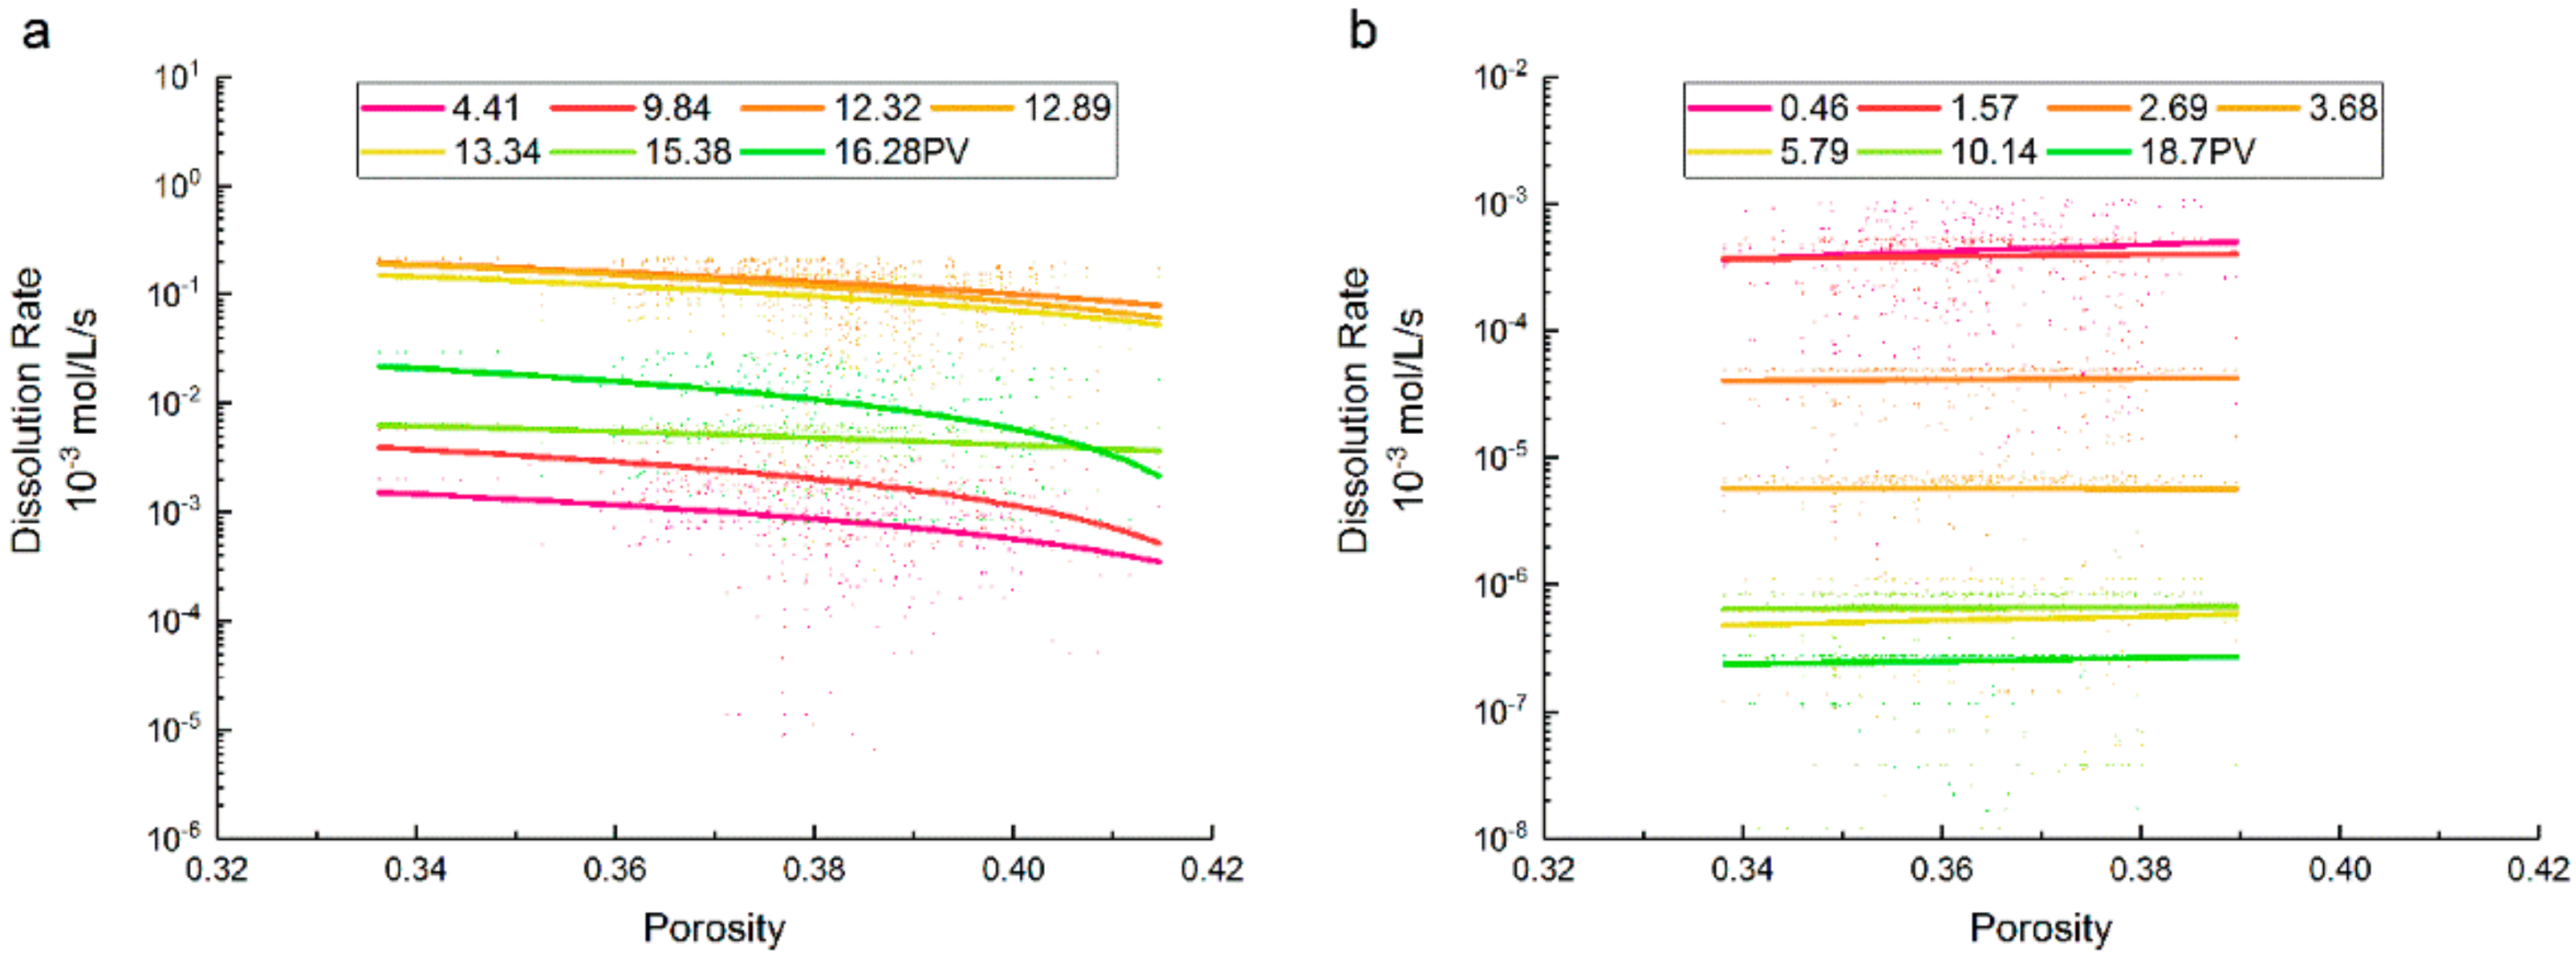
- The dissolution rate of supercritical CO2 decreased as the porosity increased, and this trend increased with the increment of porosity. The dissolution rate of gaseous CO2 gradually increased with porosity, which showed no obvious effect on the variation of the dissolution rate. When the porosity is between 0.36 and 0.38, the value ranges of dissolution rates under a supercritical state were greater.
- At high CO2 saturation, the dissolution rate of supercritical CO2 increased rapidly with the saturation reduction. At low CO2 saturation, the correlation between the dissolution rate and saturation was inverted at later PVs, and was controlled by the location and quantity of the dissolution events. By contrast, the dissolution rate of gaseous CO2 remained inversely proportional to the saturation. However, the relationships were close to supercritical CO2 after saturations were less than 0.5.
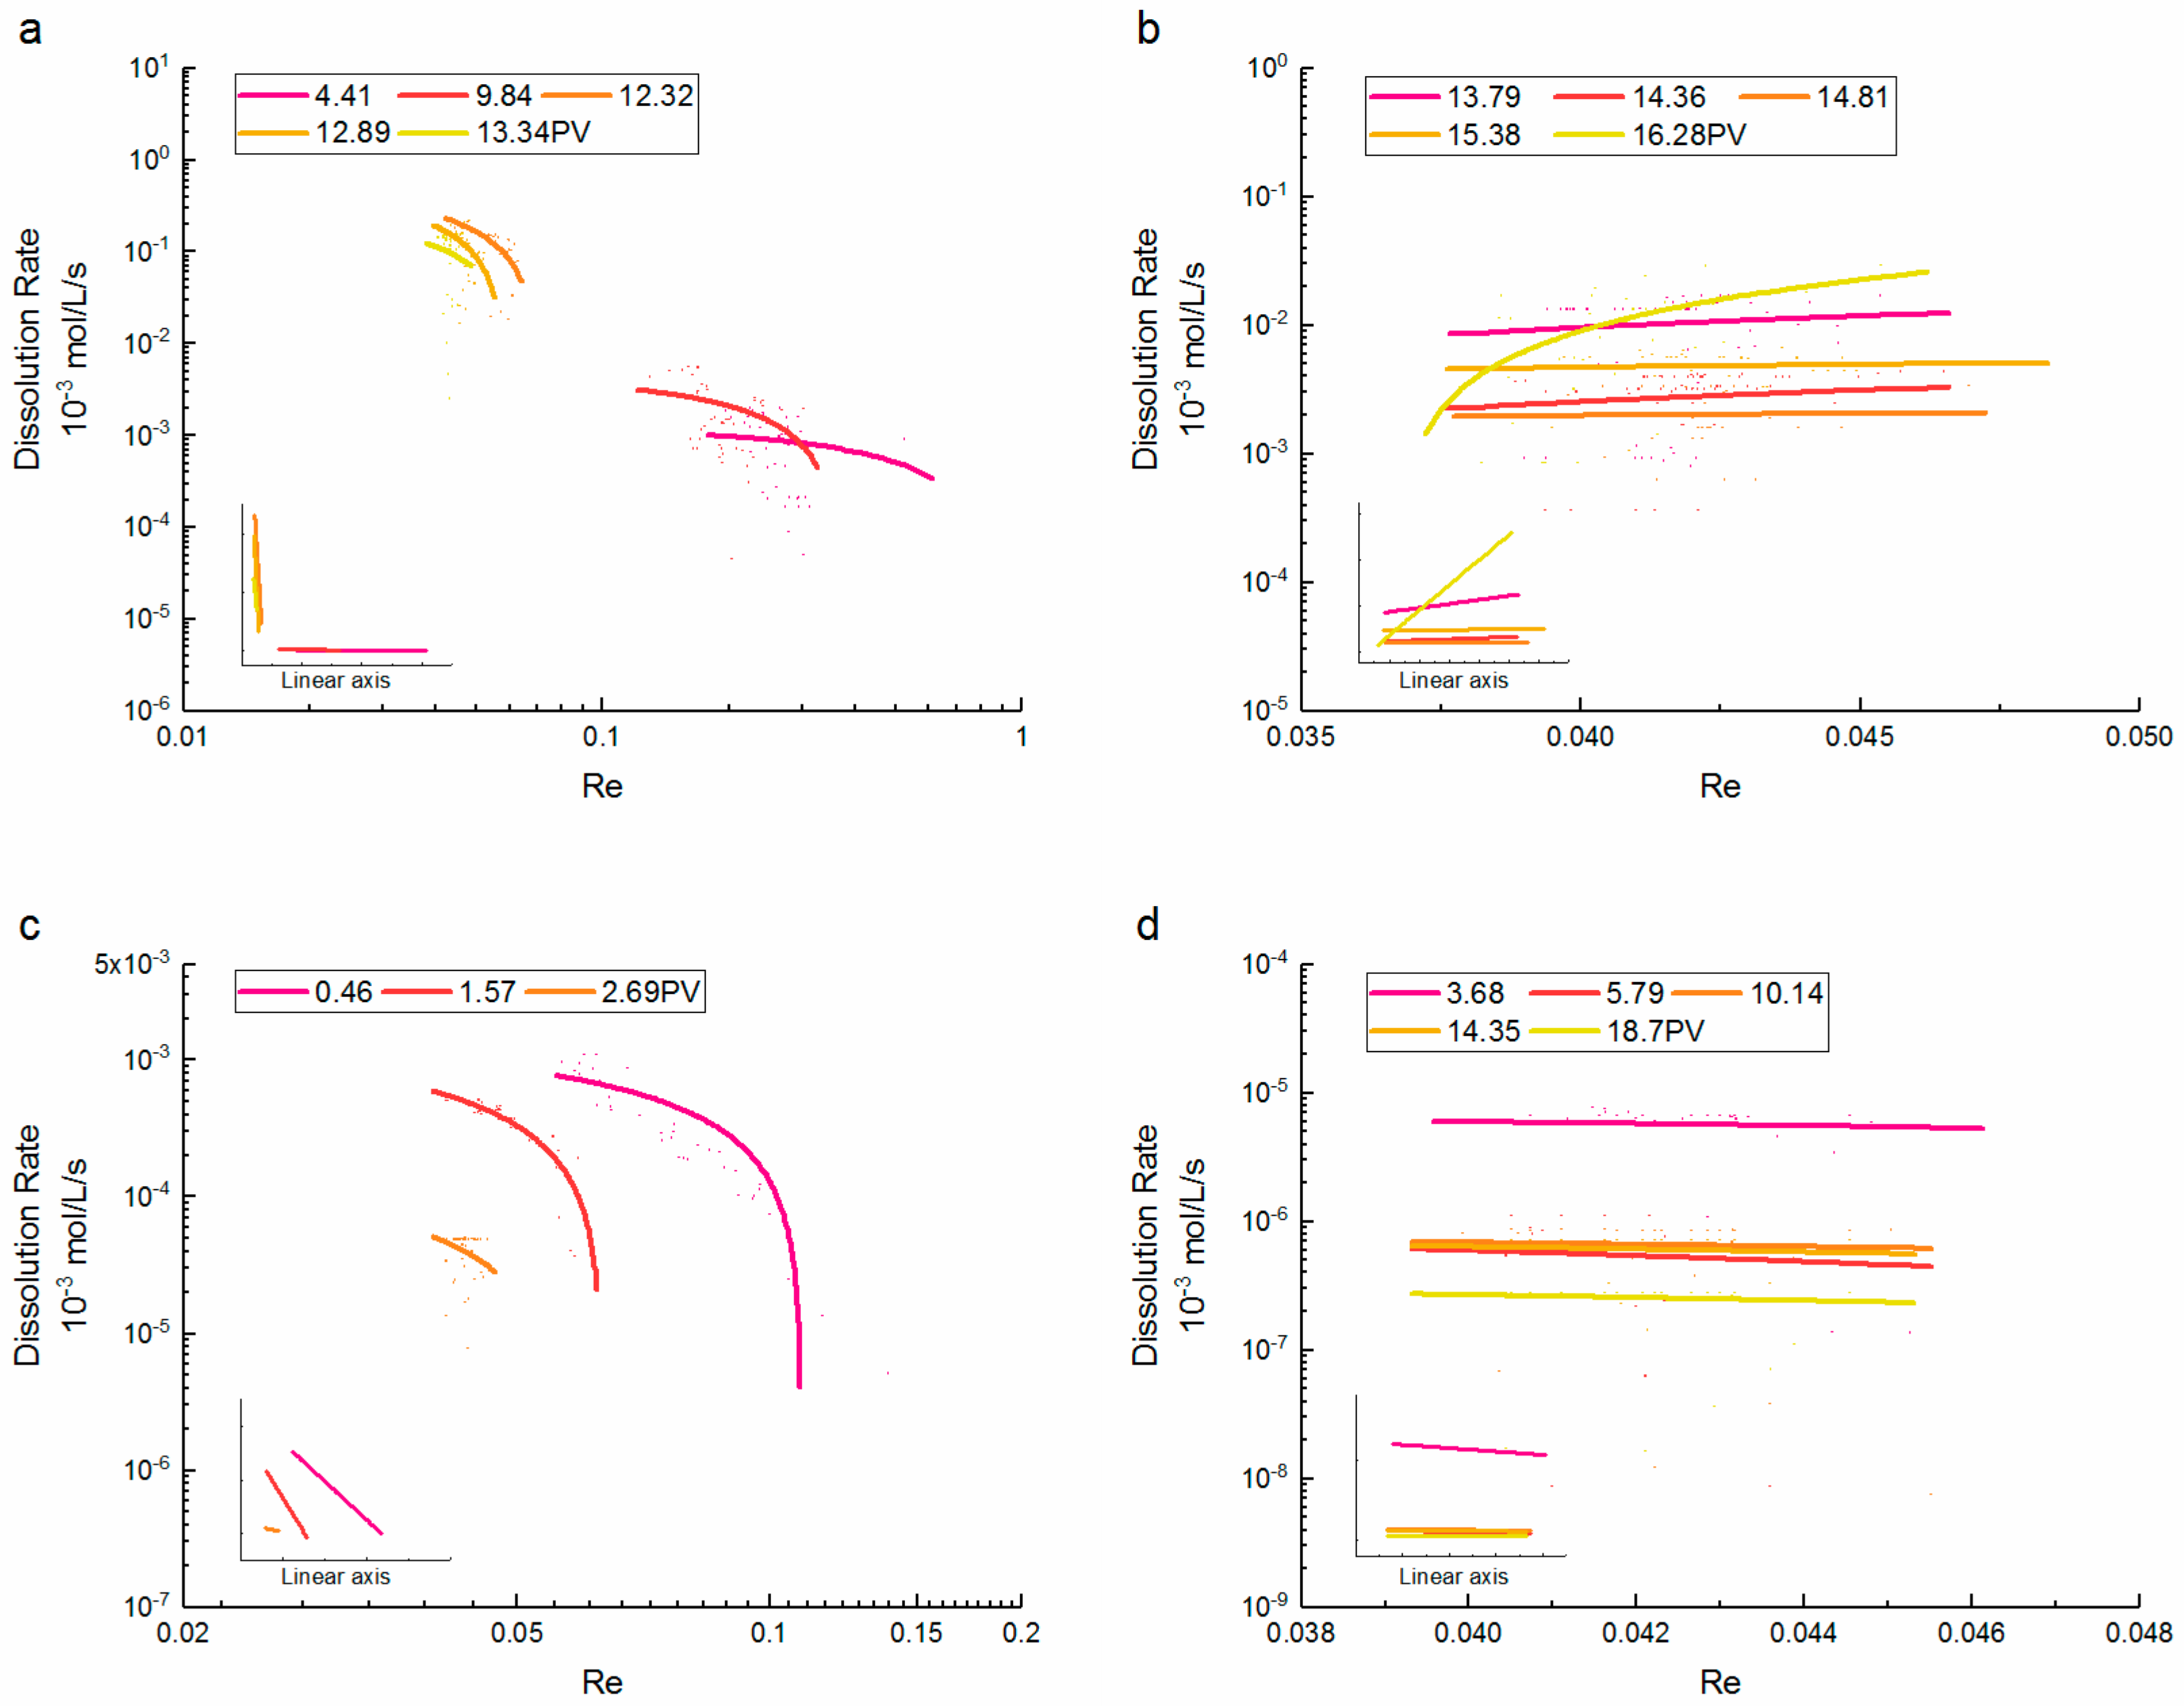
- During the dissolution expansion, the dissolution rate of supercritical CO2 increased rapidly as the Re decreased, and the differences between Re were about one order of magnitude. At later PVs, the dissolution rate gradually increased with the Re, and the trend was not correlated with the injected PV. By contrast, the dissolution rate of gaseous CO2 significantly decreased with the increase of Re. As most CO2 was dissolved, the dissolution rate decreased slightly at larger Re values, whereas the differences between Re were inconspicuous.
Acknowledgments
Author Contributions
Conflicts of Interest
References
- Woods, A.W. Flow in Porous Rocks: Energy and Environment Applications; Cambridge University Press: Cambridge, UK, 2015; pp. 1–289. [Google Scholar]
- Zhang, S.; Xian, X.; Zhou, J.; Zhang, L. Mechanical behaviour of longmaxi black shale saturated with different fluids: An experimental study. RSC Adv. 2017, 7, 42946–42955. [Google Scholar] [CrossRef]
- Wanniarachchi, W.; Gamage, R.; Perera, M.; Rathnaweera, T.; Gao, M.; Padmanabhan, E. Investigation of depth and injection pressure effects on breakdown pressure and fracture permeability of shale reservoirs: An experimental study. Appl. Sci. 2017, 7, 664. [Google Scholar] [CrossRef]
- Mackay, D.; Matsugu, R.S. Evaporation rates of liquid hydrocarbon spills on land and water. Can. J. Chem. Eng. 1973, 51, 434–439. [Google Scholar] [CrossRef]
- Guo, H.; Zhou, Q.; Wang, Z.; Huang, Y. Soret effect on the diffusion of CO2 in aqueous solution under high-pressure. Int. J. Heat Mass Transf. 2018, 117, 966–971. [Google Scholar] [CrossRef]
- Li, D.; Jiang, X.; Meng, Q.; Xie, Q. Numerical analyses of the effects of nitrogen on the dissolution trapping mechanism of carbon dioxide geological storage. Comput. Fluids 2015, 114, 1–11. [Google Scholar] [CrossRef]
- Jiang, L.; Wu, B.; Song, Y.; Yang, M.; Wang, D.; Liu, Y.; Xue, Z. Mass transfer coefficient measurement during brine flush in a CO2-filled packed bed by X-ray CT scanning. Int. J. Heat Mass Transf. 2017, 115, 615–624. [Google Scholar] [CrossRef]
- Dou, B.; Zhang, H.; Cui, G.; Wang, Z.; Jiang, B.; Wang, K.; Chen, H.; Xu, Y. Hydrogen production and reduction of Ni-based oxygen carriers during chemical looping steam reforming of ethanol in a fixed-bed reactor. Int. J. Hydrog. Energy 2017, 42, 26217–26230. [Google Scholar] [CrossRef]
- Chang, C.; Zhou, Q.; Kneafsey, T.J.; Oostrom, M.; Wietsma, T.W.; Yu, Q. Pore-scale supercritical CO2 dissolution and mass transfer under imbibition conditions. Adv. Water Resour. 2016, 92, 142–158. [Google Scholar] [CrossRef]
- Abidoye, L.K.; Khudaida, K.J.; Das, D.B. Geological carbon sequestration in the context of two-phase flow in porous media: A review. Crit. Rev. Environ. Sci. Technol. 2015, 45, 1105–1147. [Google Scholar] [CrossRef] [Green Version]
- Zhao, J.; Wang, J.; Liu, W.; Song, Y. Analysis of heat transfer effects on gas production from methane hydrate by thermal stimulation. Int. J. Heat Mass Transf. 2015, 87, 145–150. [Google Scholar] [CrossRef]
- Zhao, J.; Yu, T.; Song, Y.; Liu, D.; Liu, W.; Liu, Y.; Yang, M.; Ruan, X.; Li, Y. Numerical simulation of gas production from hydrate deposits using a single vertical well by depressurization in the Qilian Mountain permafrost, Qinghai-Tibet Plateau, China. Energy 2013, 52, 308–319. [Google Scholar] [CrossRef]
- Zhao, J.; Zhu, Z.; Song, Y.; Liu, W.; Zhang, Y.; Wang, D. Analyzing the process of gas production for natural gas hydrate using depressurization. Appl. Energy 2015, 142, 125–134. [Google Scholar] [CrossRef]
- Sun, R.; Cubaud, T. Dissolution of carbon dioxide bubbles and microfluidic multiphase flows. Lab Chip 2011, 11, 2924–2928. [Google Scholar] [CrossRef] [PubMed]
- Song, Y.; Chen, B.; Nishio, M.; Akai, M. Experimental study of dissolution rate of a CO2 droplet and CO2 solubility in high pressure and low temperature seawater with hydrate free. In Proceedings of the ASME 2004 23rd International Conference on Offshore Mechanics and Arctic Engineering, Vancouver, BC, Canada, 20–25 June 2004; American Society of Mechanical Engineers: New York, NY, USA; pp. 301–307. [Google Scholar]
- Ozgur, E.; Gümrah, F. Analytical and numerical modeling of CO2 sequestration in deep saline aquifers. Energy Sources Part A Recover. Util. Environ. Eff. 2010, 32, 674–687. [Google Scholar] [CrossRef]
- Ghesmat, K.; Hassanzadeh, H.; Abedi, J. The effect of anisotropic dispersion on the convective mixing in long-term CO2 storage in saline aquifers. AIChE J. 2011, 57, 561–570. [Google Scholar] [CrossRef]
- Pu, W.; Wei, P.; Sun, L.; Wang, S. Stability, CO2 sensitivity, oil tolerance and displacement efficiency of polymer enhanced foam. RSC Adv. 2017, 7, 6251–6258. [Google Scholar] [CrossRef]
- Ranganathan, P.; Farajzadeh, R.; Bruining, H.; Zitha, P.L.J. Numerical simulation of natural convection in heterogeneous porous media for CO2 geological storage. Transp. Porous Media 2012, 95, 25–54. [Google Scholar] [CrossRef]
- Kokkinaki, A.; O’Carroll, D.M.; Werth, C.J.; Sleep, B.E. Coupled simulation of dnapl infiltration and dissolution in three-dimensional heterogeneous domains: Process model validation. Water Resour. Res. 2013, 49, 7023–7036. [Google Scholar] [CrossRef]
- Dou, B.; Zhang, H.; Cui, G.; Wang, Z.; Jiang, B.; Wang, K.; Chen, H.; Xu, Y. Hydrogen production by sorption-enhanced chemical looping steam reforming of ethanol in an alternating fixed-bed reactor: Sorbent to catalyst ratio dependencies. Energy Convers. Manag. 2018, 155, 243–252. [Google Scholar] [CrossRef]
- Sahloul, N.A.; Ioannidis, M.A.; Chatzis, I. Dissolution of residual non-aqueous phase liquids in porous media: Pore-scale mechanisms and mass transfer rates. Adv. Water Resour. 2002, 25, 33–49. [Google Scholar] [CrossRef]
- Green, C.P.; Ennis-King, J. Steady dissolution rate due to convective mixing in anisotropic porous media. Adv. Water Resour. 2014, 73, 65–73. [Google Scholar] [CrossRef]
- Imhoff, P.T.; Miller, C.T. Dissolution fingering during the solubilization of nonaqueous phase liquids in saturated porous media: 1. Model predictions. Water Resour. Res. 1996, 32, 1919–1928. [Google Scholar] [CrossRef]
- Farthing, M.W.; Seyedabbasi, M.A.; Imhoff, P.T.; Miller, C.T. Influence of porous media heterogeneity on nonaqueous phase liquid dissolution fingering and upscaled mass transfer. Water Resour. Res. 2012, 48. [Google Scholar] [CrossRef]
- Agaoglu, B.; Scheytt, T.; Copty, N.K. Impact of napl architecture on interphase mass transfer: A pore network study. Adv. Water Res. 2016, 95, 138–151. [Google Scholar] [CrossRef]
- Sell, A.; Fadaei, H.; Kim, M.; Sinton, D. Measurement of CO2 diffusivity for carbon sequestration: A microfluidic approach for reservoir-specific analysis. Environ. Sci. Technol. 2013, 47, 71–78. [Google Scholar] [CrossRef] [PubMed]
- Nazari Moghaddam, R.; Rostami, B.; Pourafshary, P.; Fallahzadeh, Y. Quantification of density-driven natural convection for dissolution mechanism in CO2 sequestration. Transp. Porous Media 2012, 92, 439–456. [Google Scholar] [CrossRef]
- Wang, C.; Li, T.; Gao, H.; Zhao, J.; Li, H.A. Effect of asphaltene precipitation on CO2-flooding performance in low-permeability sandstones: A nuclear magnetic resonance study. RSC Adv. 2017, 7, 38367–38376. [Google Scholar] [CrossRef]
- Aggelopoulos, C.A.; Tsakiroglou, C.D. Effects of micro-heterogeneity and hydrodynamic dispersion on the dissolution rate of carbon dioxide in water-saturated porous media. Int. J. Greenh. Gas Control 2012, 10, 341–350. [Google Scholar] [CrossRef]
- Johns, M.L.; Gladden, L.F. Magnetic resonance imaging study of the dissolution kinetics of octanol in porous media. J. Colloid Interface Sci. 1999, 210, 261–270. [Google Scholar] [CrossRef] [PubMed]
- Emmanuel, S.; Ague, J.J.; Walderhaug, O. Interfacial energy effects and the evolution of pore size distributions during quartz precipitation in sandstone. Geochim. Cosmochim. Acta 2010, 74, 3539–3552. [Google Scholar] [CrossRef]
- Nambi, I.M.; Powers, S.E. Napl dissolution in heterogeneous systems: An experimental investigation in a simple heterogeneous system. J. Contam. Hydrol. 2000, 44, 161–184. [Google Scholar] [CrossRef]
- Zhang, C.; Werth, C.J.; Webb, A.G. A magnetic resonance imaging study of dense nonaqueous phase liquid dissolution from angular porous media. Environ. Sci. Technol. 2002, 36, 3310–3317. [Google Scholar] [CrossRef] [PubMed]
- Karpyn, Z.T.; Piri, M.; Singh, G. Experimental investigation of trapped oil clusters in a water-wet bead pack using X-ray microtomography. Water Resour. Res. 2010, 46. [Google Scholar] [CrossRef]
- Sale, T.C.; McWhorter, D.B. Steady state mass transfer from single-component dense nonaqueous phase liquids in uniform flow fields. Water Resour. Res. 2001, 37, 393–404. [Google Scholar] [CrossRef]
- Lemke, L.D.; Abriola, L.M. Modeling dense nonaqueous phase liquid mass removal in nonuniform formations: Linking source-zone architecture and system response. Geosphere 2006, 2, 74–82. [Google Scholar] [CrossRef]
- Johns, M.L.; Gladden, L.F. Surface-to-volume ratio of ganglia trapped in small-pore systems determined by pulsed-field gradient nuclear magnetic resonance. J. Colloid Interface Sci. 2001, 238, 96–104. [Google Scholar] [CrossRef] [PubMed]
- Zendehboudi, S.; Khan, A.; Carlisle, S.; Leonenko, Y. Ex situ dissolution of CO2: A new engineering methodology based on mass-transfer perspective for enhancement of CO2 sequestration. Energy Fuels 2011, 25, 3323–3333. [Google Scholar] [CrossRef]
- Elhalwagy, M.M.; Straatman, A.G. Dynamic coupling of phase-heat and mass transfer in porous media and conjugate fluid/porous domains. Int. J. Heat Mass Transf. 2017, 106, 1270–1286. [Google Scholar] [CrossRef]
- Powers, S.E.; Abriola, L.M.; Weber, W.J. An experimental investigation of nonaqueous phase liquid dissolution in saturated subsurface systems: Steady state mass transfer rates. Water Resour. Res. 1992, 28, 2691–2705. [Google Scholar] [CrossRef]
- Oltéan, C.; Golfier, F.; Buès, M.A. Numerical and experimental investigation of buoyancy-driven dissolution in vertical fracture. J. Geophys. Res. Solid Earth 2013, 118, 2038–2048. [Google Scholar] [CrossRef]
- Woods, A.W.; Espie, T. Controls on the dissolution of CO2 plumes in structural traps in deep saline aquifers. Geophys. Res. Lett. 2012, 39. [Google Scholar] [CrossRef]
- Kumar, G.S. Mathematical modelling on transport of petroleum hydrocarbons in saturated fractured rocks. Sadhana 2014, 39, 1119–1139. [Google Scholar] [CrossRef]
- McDonnell, D.; D’Arcy, D.M.; Crane, L.J.; Redmond, B. A mathematical analysis of drug dissolution in the usp flow through apparatus. Heat Mass Transf. 2017. [Google Scholar] [CrossRef]


© 2017 by the authors. Licensee MDPI, Basel, Switzerland. This article is an open access article distributed under the terms and conditions of the Creative Commons Attribution (CC BY) license (http://creativecommons.org/licenses/by/4.0/).
Share and Cite
Wu, B.; Li, X.; Teng, Y.; Lv, P.; Liu, Y.; Luo, T.; Zheng, J.; Wang, D.; Jiang, L. Characterizing the Dissolution Rate of CO2-Brine in Porous Media under Gaseous and Supercritical Conditions. Appl. Sci. 2018, 8, 4. https://doi.org/10.3390/app8010004
Wu B, Li X, Teng Y, Lv P, Liu Y, Luo T, Zheng J, Wang D, Jiang L. Characterizing the Dissolution Rate of CO2-Brine in Porous Media under Gaseous and Supercritical Conditions. Applied Sciences. 2018; 8(1):4. https://doi.org/10.3390/app8010004
Chicago/Turabian StyleWu, Bohao, Xingbo Li, Ying Teng, Pengfei Lv, Yu Liu, Tingting Luo, Jianan Zheng, Dayong Wang, and Lanlan Jiang. 2018. "Characterizing the Dissolution Rate of CO2-Brine in Porous Media under Gaseous and Supercritical Conditions" Applied Sciences 8, no. 1: 4. https://doi.org/10.3390/app8010004