An Efficient Numerical Approach for Field Infrared Smoke Transmittance Based on Grayscale Images

State Key Laboratory of Explosion Science and Technology, Beijing Institute of Technology, Beijing 100081, China
*
Author to whom correspondence should be addressed.
Appl. Sci. 2018, 8(1), 40; https://doi.org/10.3390/app8010040
Submission received: 9 December 2017
/
Revised: 26 December 2017
/
Accepted: 26 December 2017
/
Published: 29 December 2017
(This article belongs to the Special Issue Novel Ideas for Infrared Thermography also Applied in Integrated Approaches)
Abstract
:Infrared smoke screen has been playing an important role in electro-optical countermeasures on the battlefield. Smoke transmittance is one of the most important parameters which can evaluate the obscuration performance of smoke. In this paper, an efficient numerical approach for field infrared smoke transmittance based on grayscale images is presented. Firstly, a field trial experimental setup is introduced. Then a grayscale smoke transmittance mathematical model is deduced and built. In addition, an image processing algorithm is used to extract the gray values of certain pixel points from grayscale images, and the positions of the selected points are discussed. Lastly, a field trial sample calculation is included to illustrate the procedure of the proposed method. The results prove to be of enough precision for engineering applications, and the method has greatly simplified the field trial process, thus improving efficiency.
1. Introduction
A smoke screen is a cloud of smoke released into the air to mask the movement or location of military units such as infantry, tanks, aircraft, or ships. Smoke screens are usually either deployed by a canister (such as a grenade) or generated by a vehicle (such as a tank or a warship) [1,2]. As a practical and cost-effective countermeasure on battlefield operations, the infrared smoke screen, has long been employed tactically to protect land and naval targets from hostile threats [1,2,3,4,5]. With the rapid development of smoke techniques, questions arise as to the performance of smoke against electro-optical equipment in general [6,7,8]. Therefore, methods that can practically evaluate the effectiveness of a smoke screen, especially in the field trial, are of great interest.
Smoke transmittance, which provides an objective and quantitative evaluation criterion, is a key parameter for evaluating the interference capability of smoke screen [9,10,11,12]. In previous smoke transmittance measurement studies, traditional methods rely on a spectrometer to receive point-to-point target radiation in line of sight, so field of view is limited to a narrow area due to equipment specifications [13,14,15,16]. However, the dynamic smoke cloud in the field trial usually covers a wide area and diffuses with atmospheric turbulence over time. Thus, in order to evaluate smoke screening performance comprehensively, infrared imaging techniques, which are extensively applied in electro-optical instrumentations, have been introduced to facilitate smoke research. Infrared imaging techniques have the advantages of a larger field of view, simulating the actual combat scene and allowing us to handle heterogeneous smoke clouds and smoke diffusion [17]. With the grayscale images provided by a thermal infrared imager, we can analyze the target radiance by extracting the pixel gray value and thus evaluate screening performance of the smoke. Until now, there has not been a universal and convincing method to assess the overall field trial smoke screen performance in any open literature.
The approach introduced in this paper utilizes a thermal infrared imager to output real-time grayscale images of target scene. An infrared target array is set to provide target radiance information. According to the theory of infrared transmission and infrared imaging calibration, a grayscale smoke transmittance model is then put forward. By analyzing the images frame by frame, field smoke transmittance can finally be calculated using the mathematical model.
2. Experimental Setup
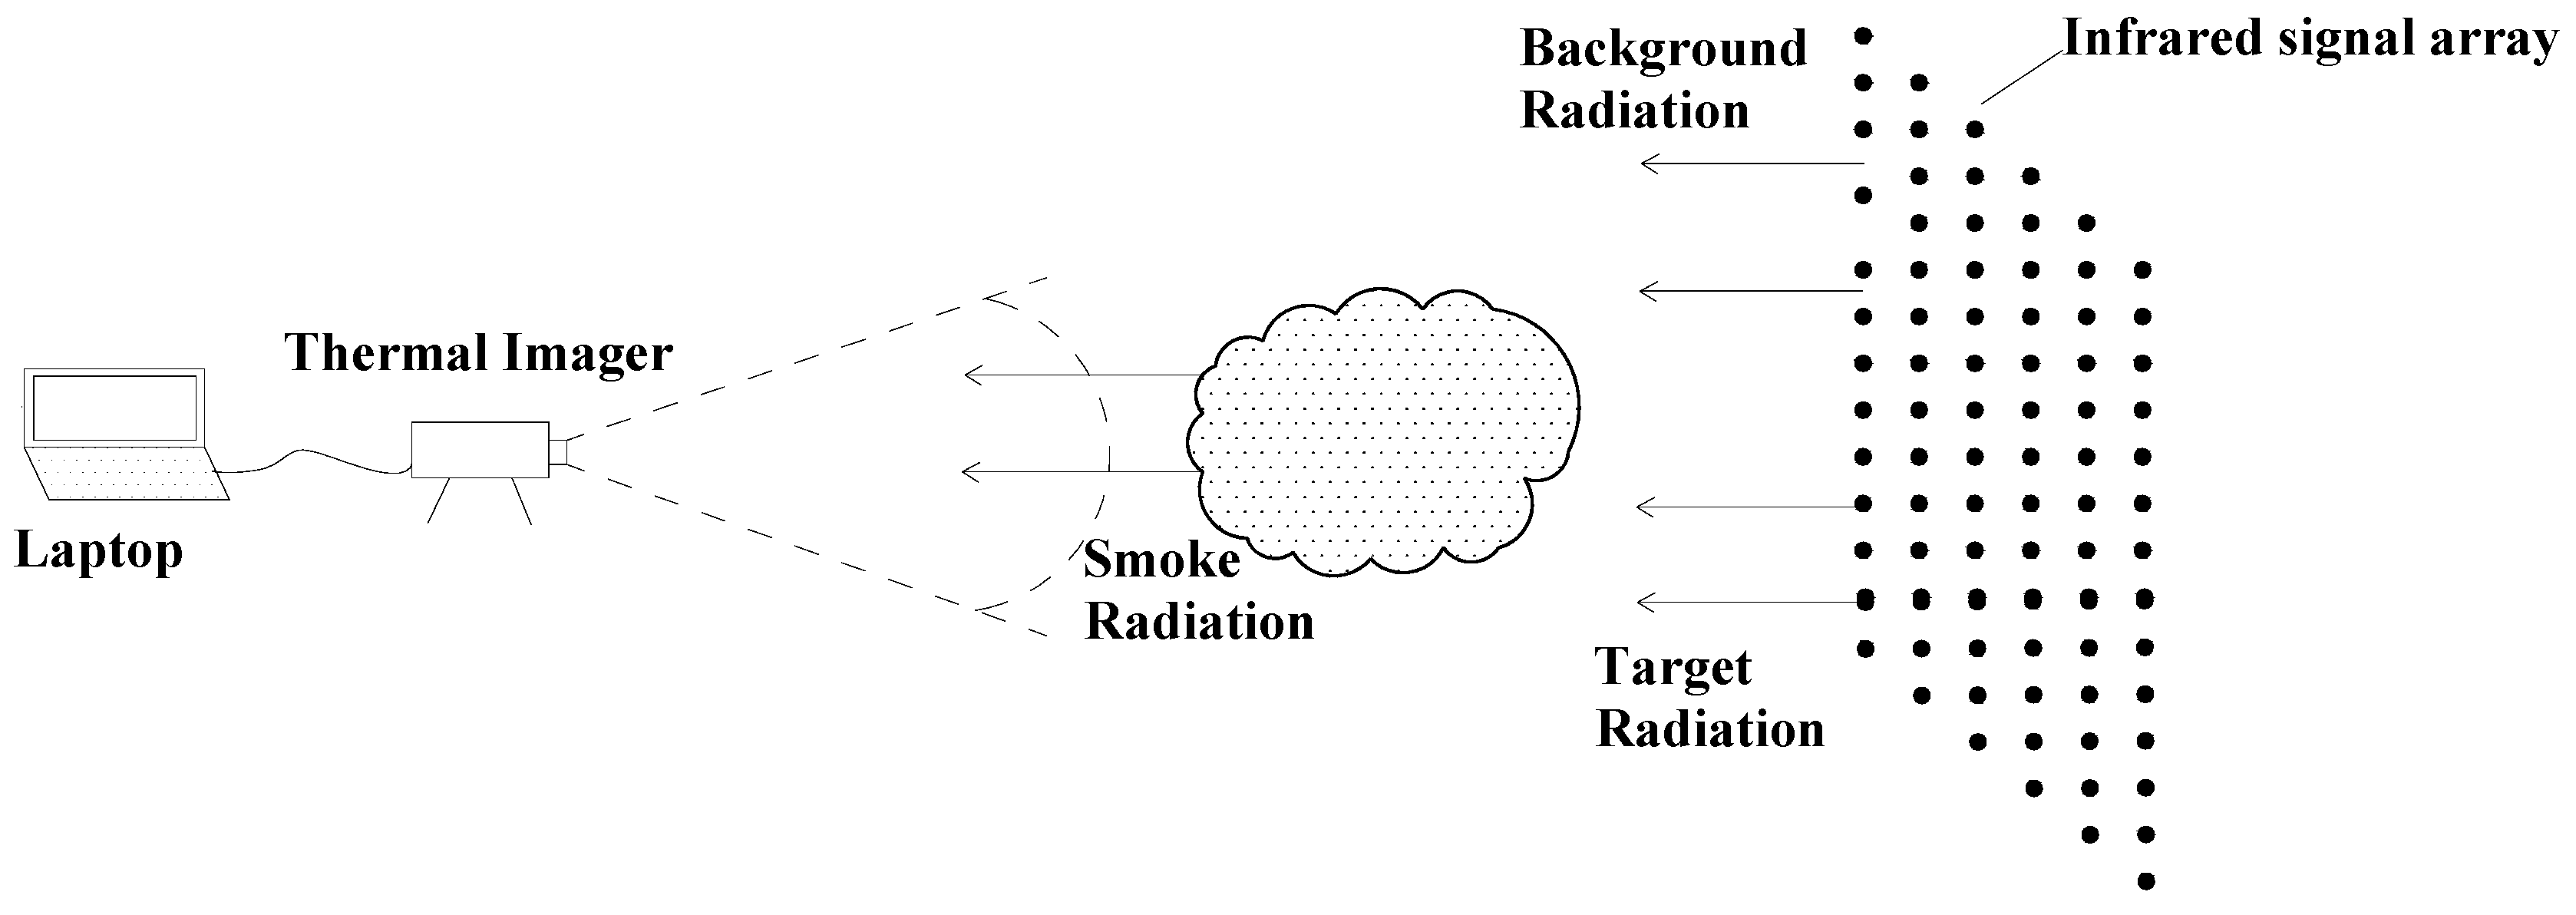
The field trial described in this paper is illustrated in Figure 1 below. The experiment site consists of three parts: an infrared radiation target array, a smoke release site, and an observation site.
Standard blackbodies, which can emit electromagnetic radiation as targets, were placed in lines and columns vertically to form an infrared signal array. Here, stands for the number of columns in the target array, and means the number of lines. The infrared signal array intends to cover most of the smoke diffusion path to provide more target information. In order to determine the size of infrared signal array, the size of the smoke cloud and atmospheric turbulence at the scene need to be taken into account.
According to the infrared blackbody calibration theory, the geometrical resolution on the blackbodies at the given range should be at least twice but preferably four to five times the geometrical resolution of the system (IFOV) [18]. Therefore, the distance between two blackbodies in the infrared signal array was set to be five times the geometrical resolution of the system.
The distance between the observation site and the smoke release site was selected to get the optimum spatial resolution for imaging systems. At the observation site, images of the infrared signal array during the smoke diffusion process were recorded by a thermal infrared imager. When the smoke cloud covers certain targets, the smoke transmittance can be evaluated by comparing the targets radiation before and after smoke release.
3. Principles of Numerical Approach
3.1. Grayscale Smoke Transmittance Model
The fundamental equation of smoke transmittance is shown below, according to the theory of infrared radiation transmission [19].
where means smoke transmittance, refers to the infrared radiance of the target that the infrared detector receives before the attenuation of smoke, stands for the residue target radiance that infrared detector receives under the attenuation of the smoke screen.
Theoretically, smoke transmittance can be accurately calculated based on Equation (1). However, it is impractical to measure and directly in the field trial due to environmental factors. As evident, every nonzero temperature object in nature will emit electromagnetic energy spontaneously [20]. Thus, targets, background, and smoke cloud itself are all electromagnetically radiant. The incident radiation that thermal infrared imager receives is the total amount of radiation in line of sight, and the infrared detector cannot quantitatively distinguish the amount of radiation from the target. In order to obtain the true value of and in Equation (1), some other parameters are introduced to represent them as below.
The total radiance that the infrared detector receives before smoke interference in line of sight can be obtained from
where stands for the total radiance that the infrared detector receives before smoke interference in line of sight. This not only includes the radiation from the target but also consists of radiation from the surrounding , such as the background, the sun, and the sky.
The total radiance that the infrared imager receives after the release of smoke in line of sight can be obtained from
where refers to the total radiance that the infrared imager receives after the release of smoke in line of sight, and it contains the target remaining radiance after attenuation by the smoke and surroundings radiance . In addition, the radiation from the smoke itself is also included.
Substituting Equations (2) and (3) into Equation (1), the smoke transmittance calculation equation is expressed as follows:
For the purpose of calculating smoke transmittance, five radiance variables in Equation (4) have to be determined first. With the field trial images provided by the infrared imager, the gray value of each pixel in the image can be extracted by an image processing algorithm. Consequently, a method of converting the radiance to a corresponding gray value in infrared images is proposed here.
According to the infrared radiance calibration and the relevant infrared physics information, the relationship between the target’s radiance in the field and its corresponding gray value in the image is as follows [21]:
where stands for target’s radiance, is the corresponding gray value in the infrared image, is a coefficient relating radiance to gray level, and refers to the radiance offset. For the same model of thermal infrared imager equipment, and are constants.
Substituting Equation (5) into Equation (4), the mathematical model of smoke transmittance based on gray value can be finally concluded as
where is the total gray value of the target before smoke interference in line of sight; is the total gray value of the target under the interference of smoke in line of sight; is the gray value of the target’s surrounding background before the interference of the smoke screen; is the gray value of the surrounding background under the influence of smoke; is the gray value of the smoke itself.
3.2. Selections of Positions
Once the coordinates of the points in an image are determined, the gray value of each points can be obtained by the image processing method [22]. In Equation (6), and can be directly obtained by extracting the gray value of the corresponding target pixel point in the image. and need to be estimated by extracting the gray value of the surrounding points of the target, which will be disscussed in this section.
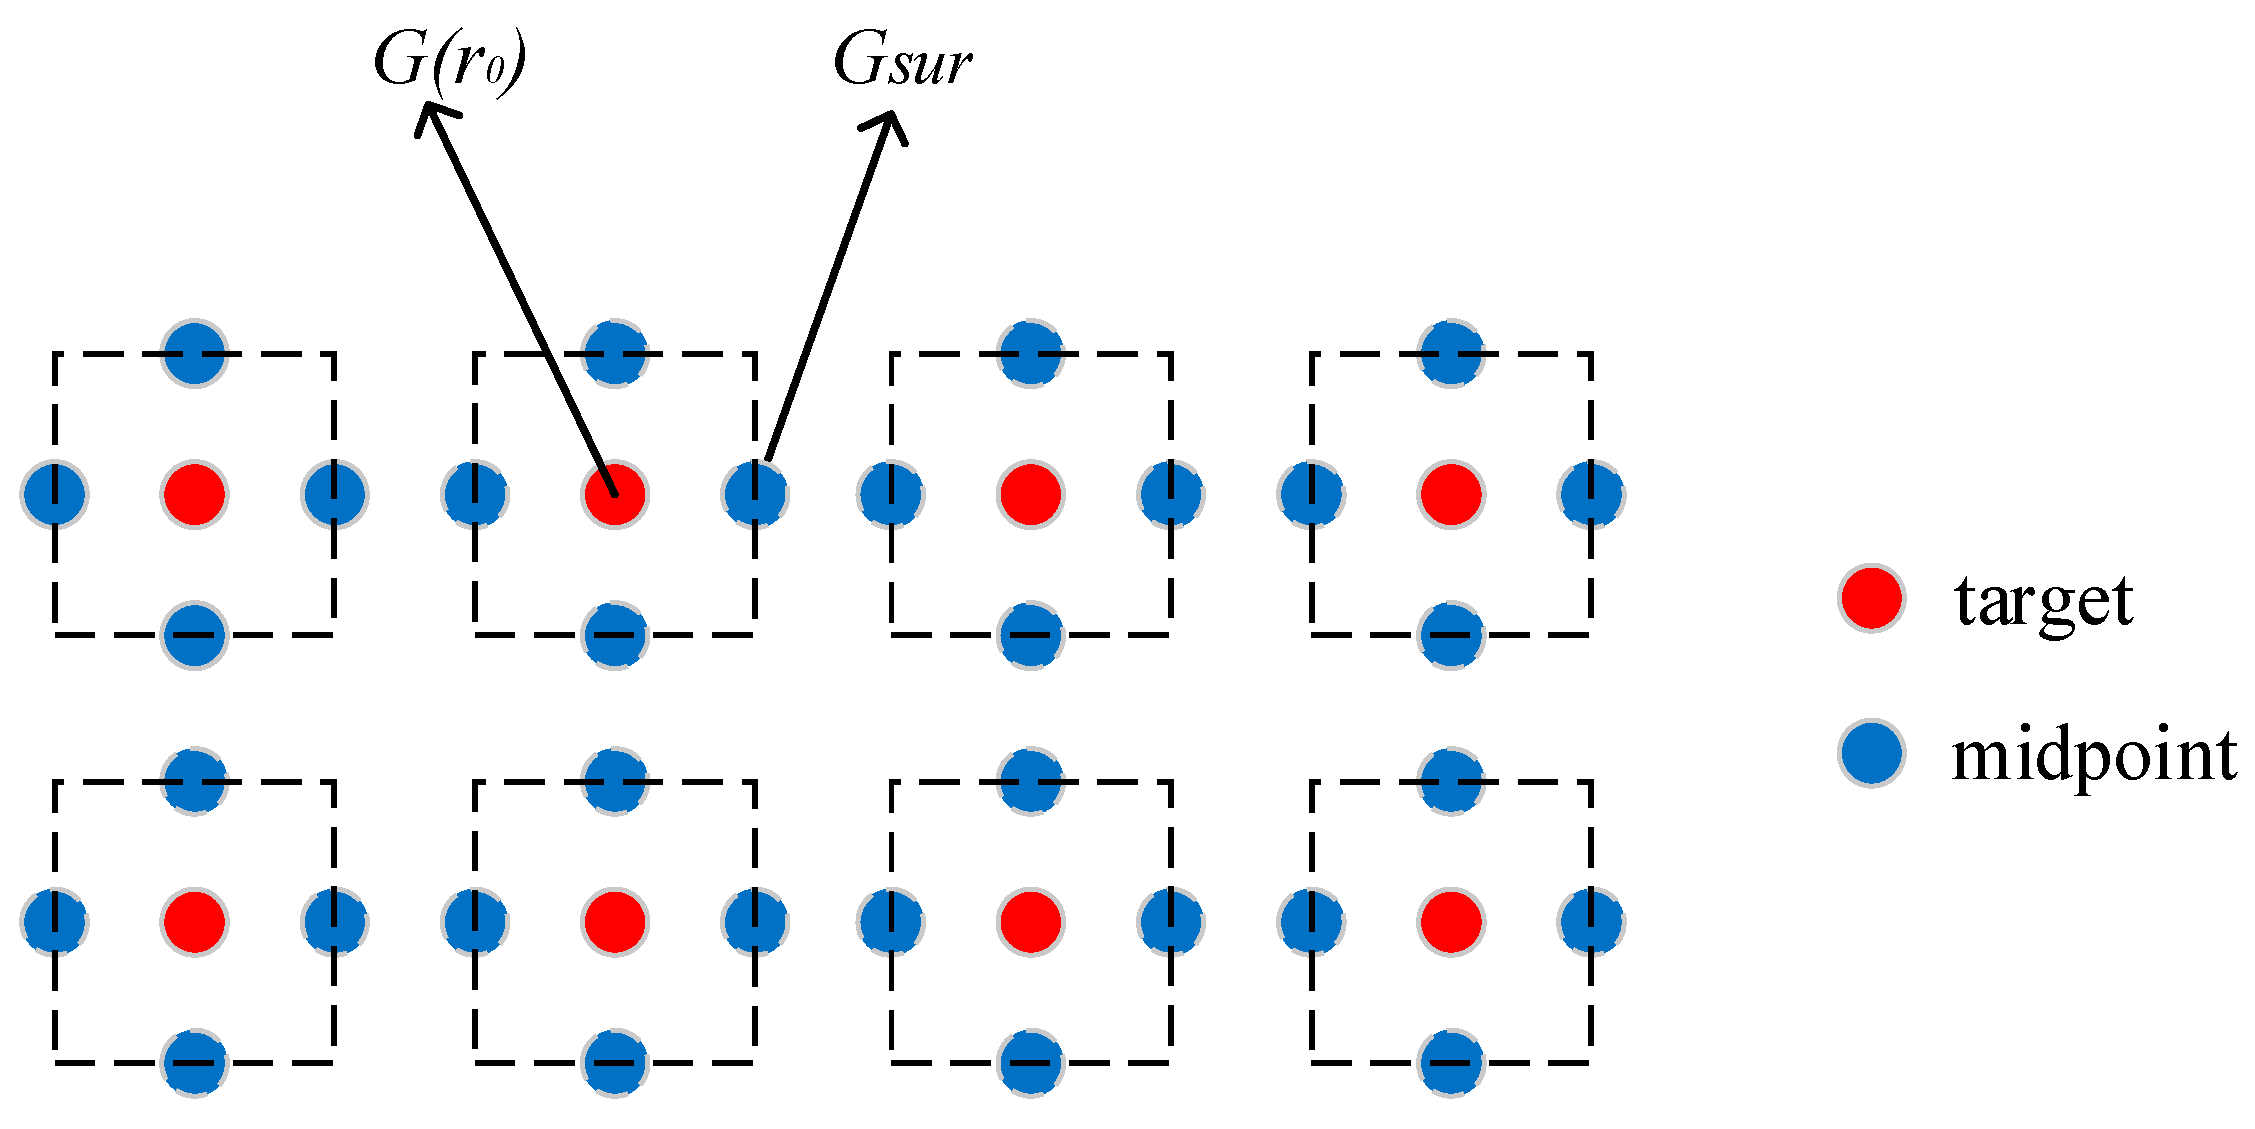
The principle of selecting positions of and is based upon the theory that choosing the surrounding points of targets that can represent the background conditions of targets. The midpoint between targets was set to be twice the geometrical resolution of the system (IFOV) away from the target. In this way, the midpoint is close enough to the target to represent its background condition.
Figure 2 below shows the schematic picture for the selection of positions without a smoke screen. In Figure 2, the red points stand for standard blackbodies used as targets, and blue points represent the midpoints near targets. The total gray value of each target can be directly obtained by extracting the pixel gray value of the corresponding red point in the infrared image. In addition, the environmental condition of nearby blue points is similar to that of the target, so the gray value from the environment of each target can then be estimated by the gray value of a certain nearby blue point, or the mean gray value of the surrounding blue points in the image. By the method mentioned above, and can be obtained, and the denominator in Equation (6) remains a constant value during the calculation process.
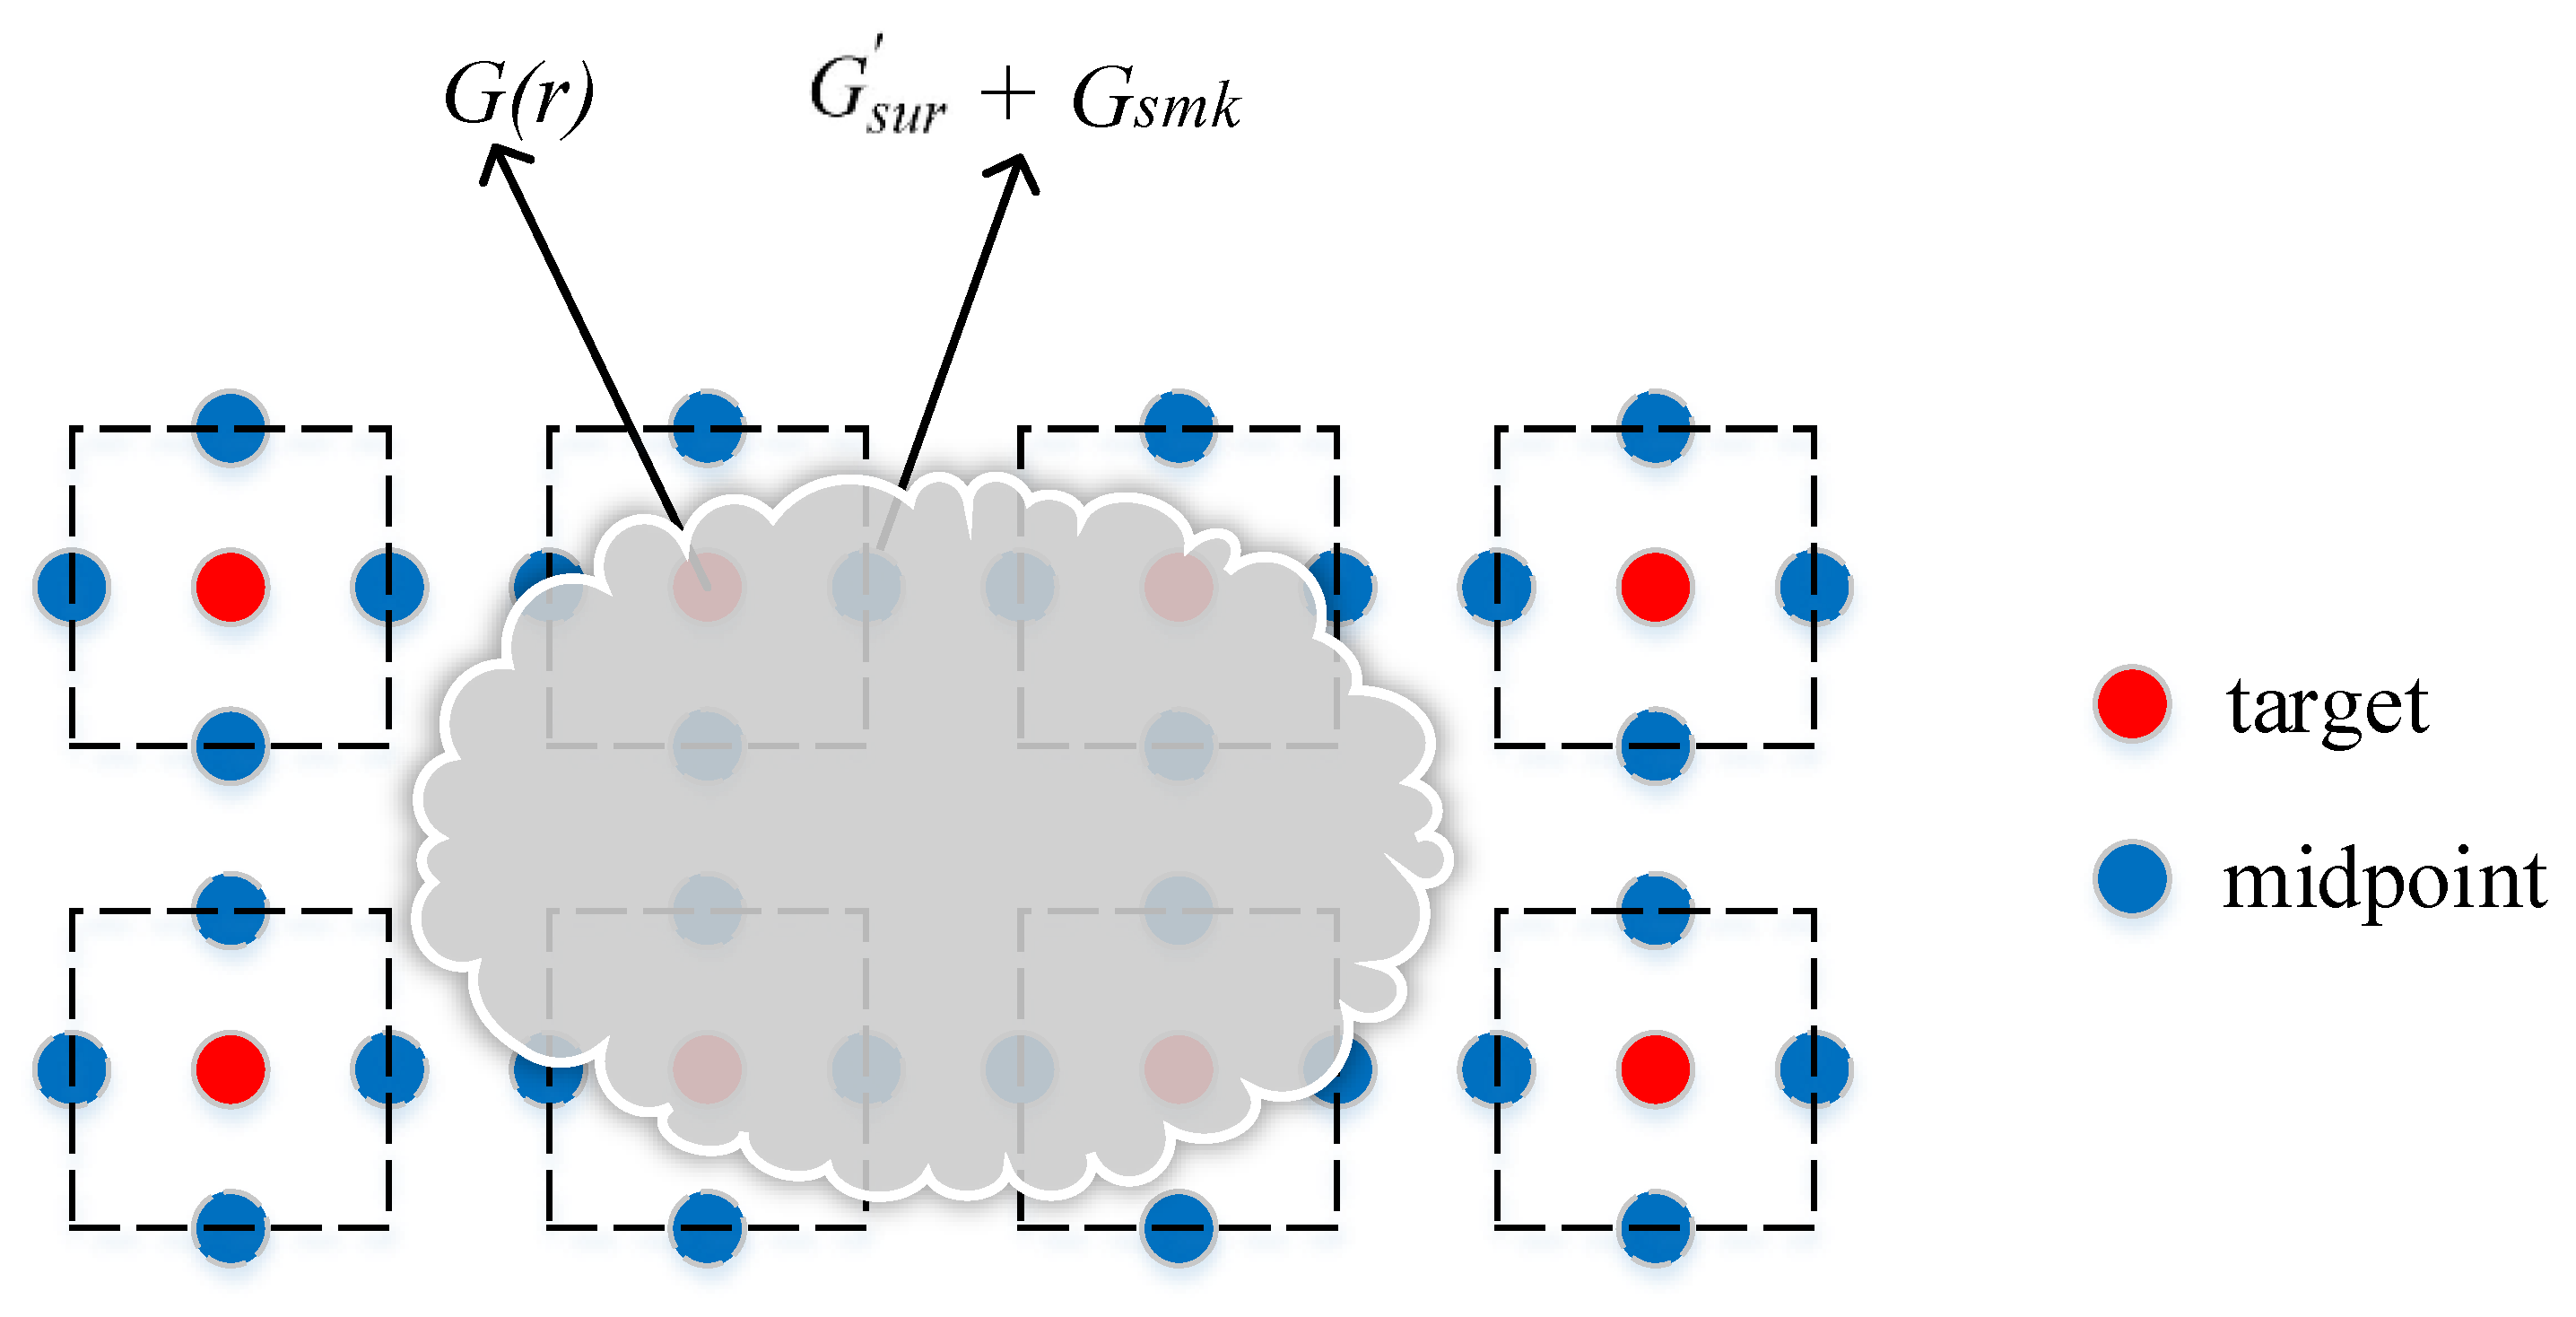
Figure 3 shows the schematic picture of the selection of positions under the influence of smoke. After being released, smoke spreads out gradually and starts to obscure certain targets. In this circumstance, the total gray value of target can be acquired by extracting the gray value of the red point in the infrared image. In addition, the gray value of the environment and smoke itself under the influence of smoke can also be estimated by the gray value of a certain nearby blue point, or the mean gray value of the surrounding blue points in the image.
Provided that all the variables required in Equation (6) are all obtained by the method mentioned above, the infrared smoke transmittance of each obscured target during the smoke diffusion process can then be calculated.
Moreover, the number of surrounding midpoints to represent target background condition also needs further study. In this paper, we propose three different algorithms to calculate the background condition of the target. The three value computing methods are shown in Figure 4 as follows:
- (a)
- choose one midpoint beside the target;
- (b)
- choose the mean value of four midpoints surrounding the target;
- (c)
- choose the mean value of the points circled around the target.
4. Results and Discussion
With the field experiment setup and grayscale smoke transmittance model introduced above, a field trial example is illustrated and discussed in this section. A flow chart of the approach is shown in Figure 5 below.
First of all, a video of the target scene is input into the Matlab computer software (R2012a, Mathworks, Natick, MA, USA); secondly, the grayscale image is converted into a binary image for the convenience of target positioning; thirdly, the motion path of dynamic smoke is tracked and recorded in the image; lastly, the smoke transmittance of each target is calculated based on the grayscale smoke transmittance model, and an smoke transmittance matrix can be output at each image frame. Thus, a smoke transmittance matrix cube containing a smoke transmittance matrix of each frame is formed in the end. Combined with the transmittance threshold, we can demonstrate whether the target is efficiently obscured by a smoke screen during anytime of the smoke diffusion process.
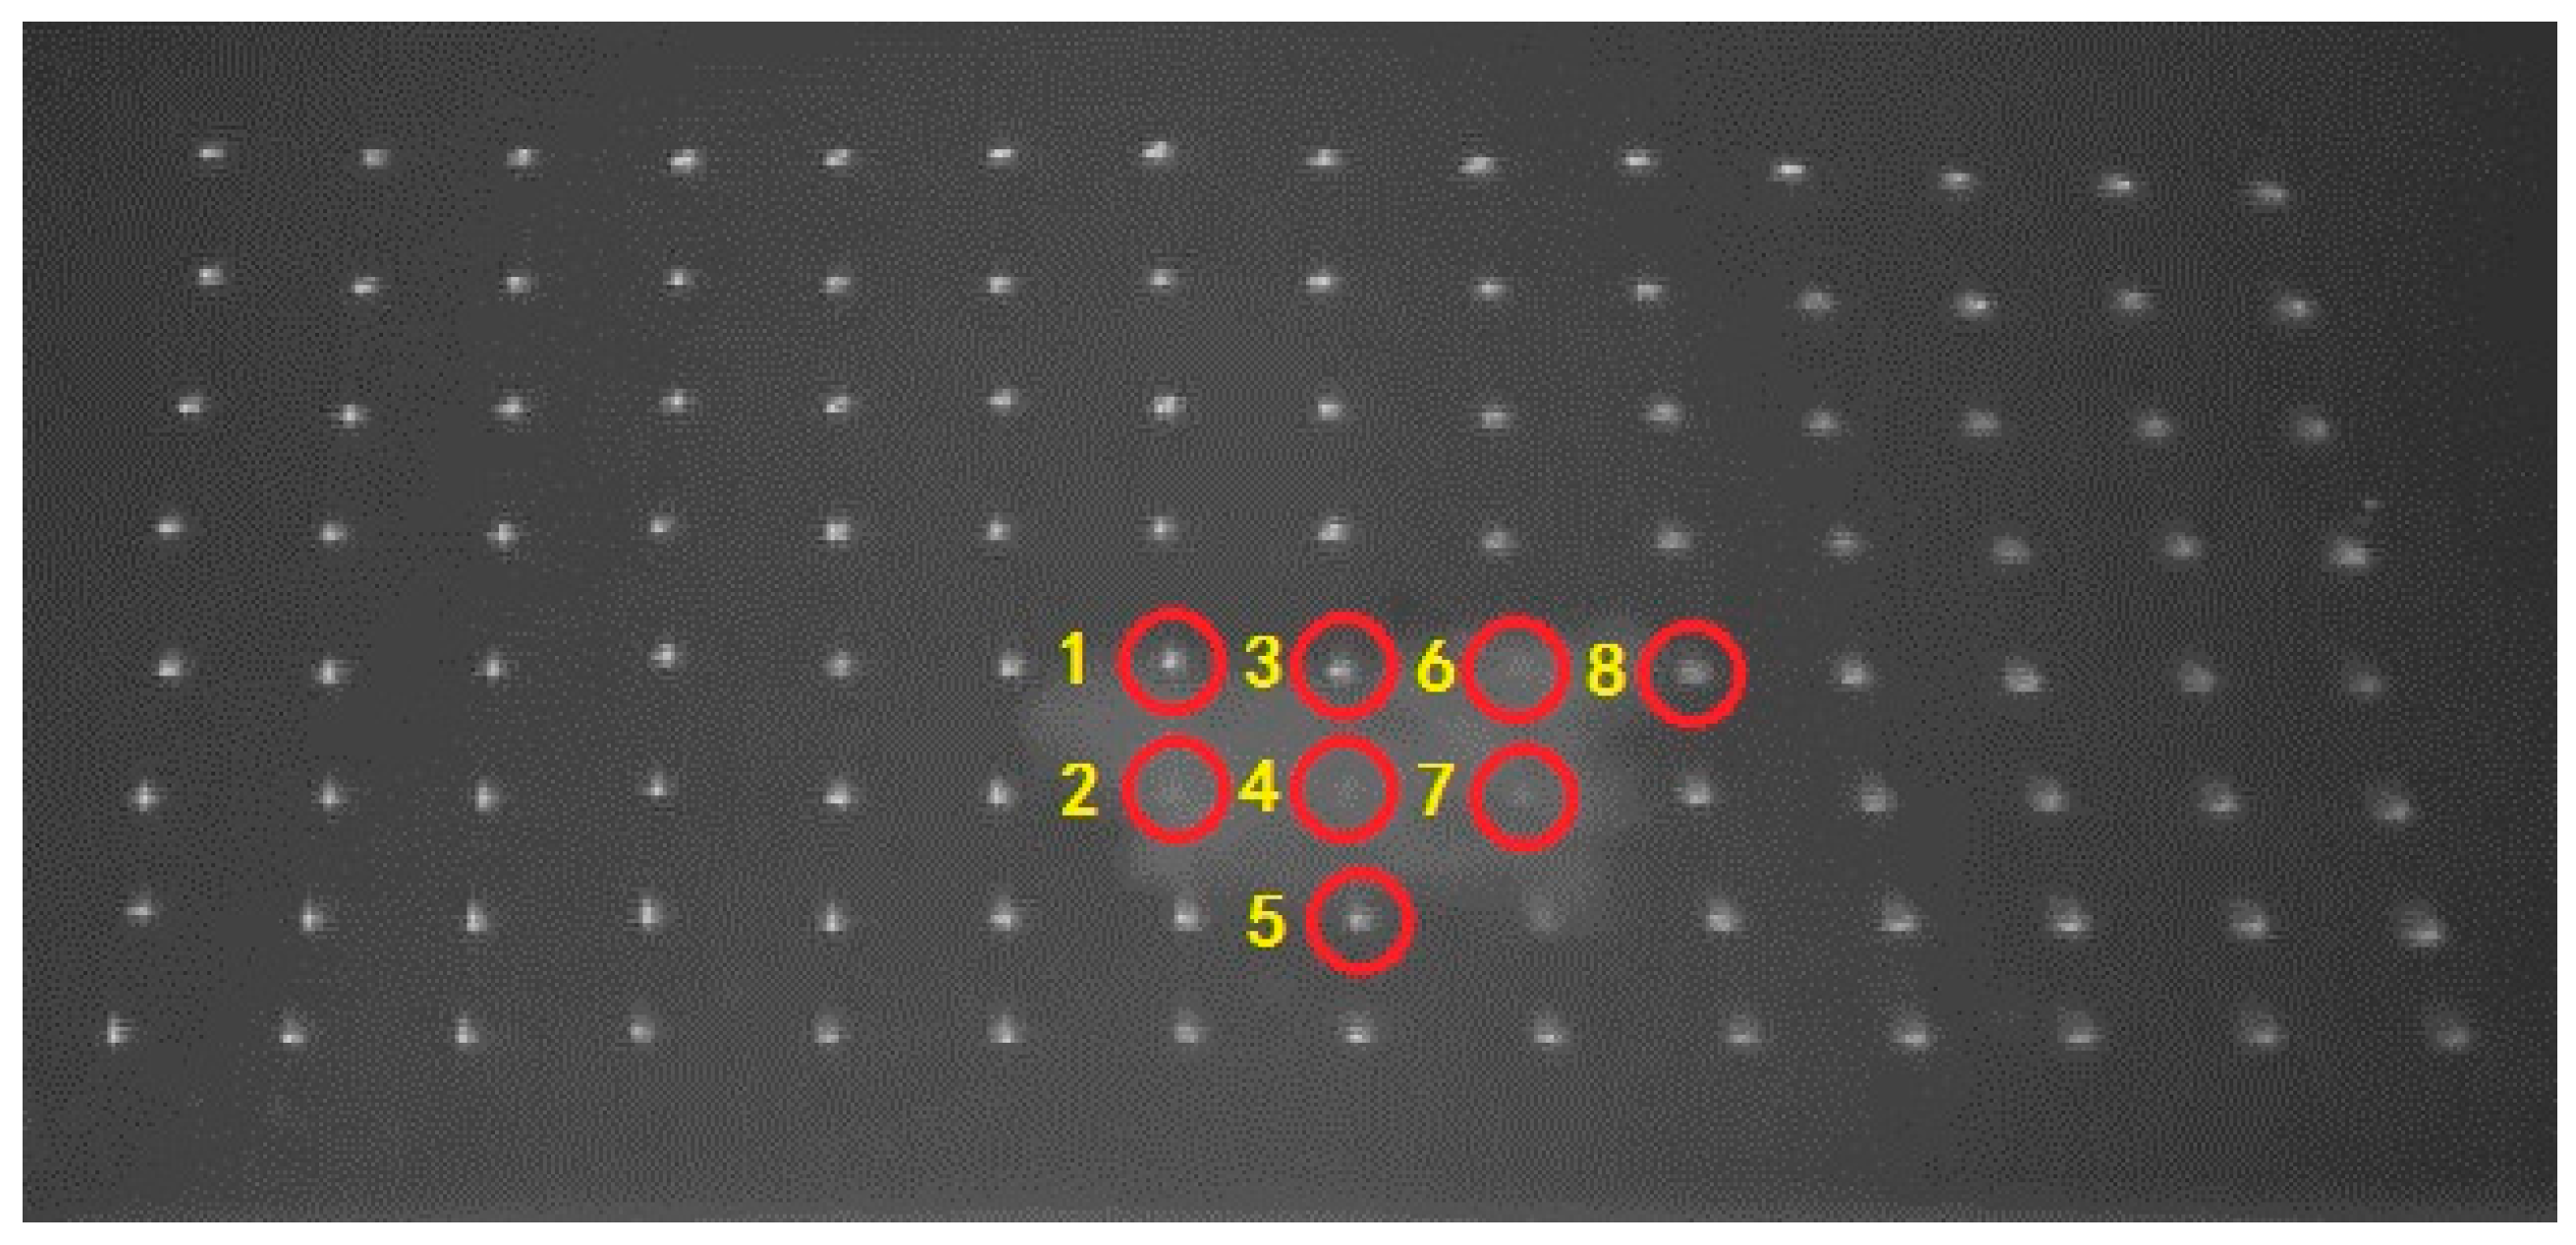
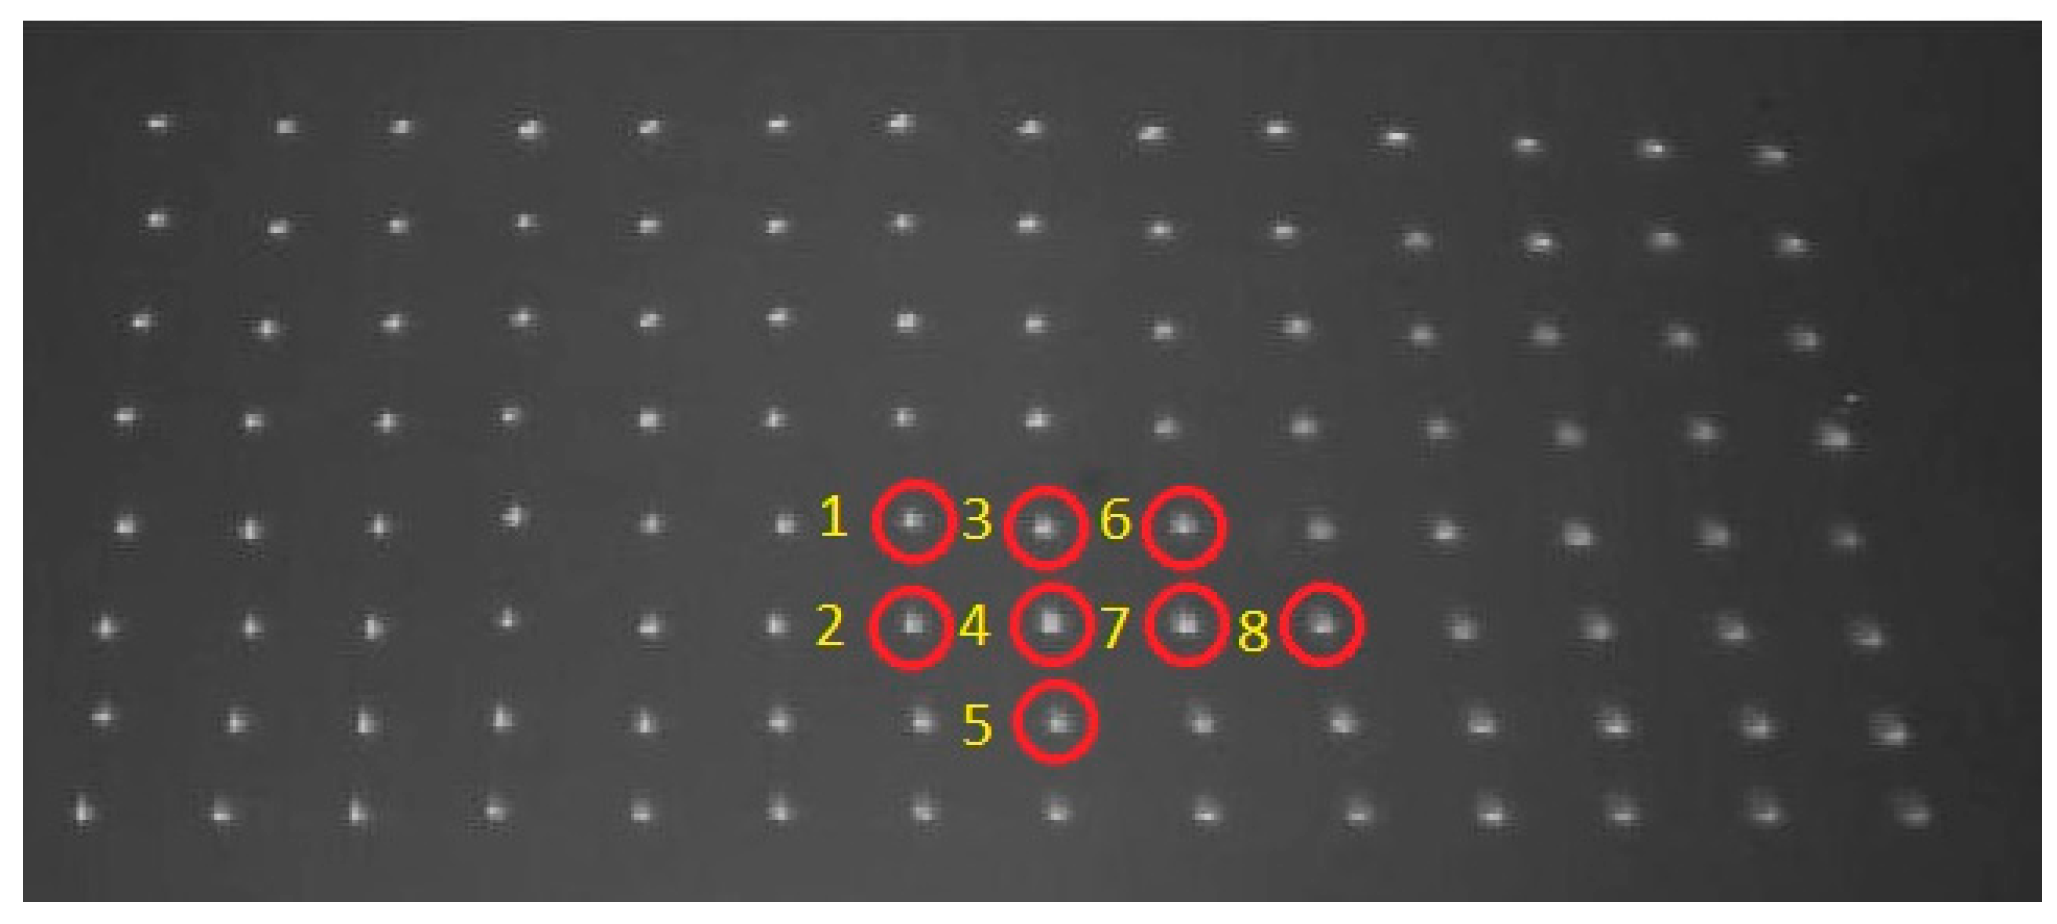
In order to observe the variation trend of smoke transmittance, we chose 8 targets that were exactly within the smoke transport and diffusion path as study objects according to the video. In Figure 6, targets circled in red are the selected study objects to output its smoke transmittance variation graph. By using the three value computing methods mentioned in Section 3, smoke transmittance curves were obtained and are shown in Figure 7.
In Figure 7, calculation curves are almost consistent with the theory analysis. The smoke transmittance remains 1 at first, when there is no block of radiation in line of sight. After the release of smoke, smoke transmittance gradually drops to nearly 0 due to the obscuration effect of the smoke cloud. When the smoke cloud continues to drift out of the target area with the wind, the transmittance finally recovers to 1 again.
In theory, the true value of transmittance should be between 0 and 1. According to the three value computing methods shown in Figure 7, methods (a) and (b) have large relative errors compared with method (c). For example, in (5) and (8) of Figure 7, the value of transmittance by method (a) even reaches −0.3 and 1.3 at 5 s, respectively. This is because a smoke cloud forms and has very intense infrared radiance. Since method (c) extracts more samples adjacent to the target, the value it calculates is closer to the true value of the background condition. Thus, it is suggested that method (c) be applied to calculate the background condition of targets.
5. Conclusions
This study investigated the numerical approach of field infrared smoke transmittance based on grayscale images. Experiment results show that this approach can provide great help in the evaluation work of field smoke performance. According to the findings of the study, the following conclusions can be made:
- (1)
- With the help of the field target array and one thermal infrared imager, a method for testing smoke transmittance is put forward, which efficiently solves the difficulty of measuring smoke transmittance in the field trial.
- (2)
- The infrared radiance of the target and the background in the field trial can be expressed by a corresponding gray value in the infrared image to some extent.
- (3)
- The selection of positions of and is discussed. Three different value computing methods of the background position are compared, which provides a recommendation of choosing the mean value of midpoints circled around the target to represent the background gray value.
Acknowledgments
The authors gratefully acknowledge the support from the State Key Laboratory of Explosion Science and Technology, Beijing Institute of Technology, and the National Natural Science Foundation of China (Grant No. 11672041).
Author Contributions
Zunning Zhou conceived and designed the experiments; Runze Tang and Xuebin Wei performed the experiments; Runze Tang built the mathematical model and wrote the paper. Tonglai Zhang supervised the entire work.
Conflicts of Interest
The authors declare that there are no conflicts of interest.
References
- Titterton, D.H. A review of the development of optical countermeasures. In Proceedings of the European Symposium on Optics and Photonics for Defence and Security, London, UK, 29–31 December 2004. [Google Scholar]
- Cudziło, S. Studies of IR-screening smoke clouds. Propellants Explos. Pyrotech. 2001, 26, 12–16. [Google Scholar] [CrossRef]
- Rose, A.H.; Nader, J.S. Field evaluation of an improved smoke inspection guide. J. Air Pollut. Control Assoc. 1958, 8, 117–119. [Google Scholar] [CrossRef]
- Milham, M.E.; Anderson, D.H.; Frickel, R.H. Infrared optical-properties of phosphorus-derived smoke. Appl. Opt. 1982, 21, 2501–2507. [Google Scholar] [CrossRef] [PubMed]
- Kleindienst, S.; Dimmeler, A.; Clement, D. Obscuration effects of smoke clouds, Targets and Backgrounds: Characterization and Representation. In Proceedings of the SPIE’s 1995 Symposium on OE/Aerospace Sensing and Dual Use Photonics, Orlando, FL, USA, 2–7 June 1995. [Google Scholar]
- Tomescu, M.; Marginean, R.; Nitis, E.; Negosanu, M.; Vizireanu, M. Evaluating smoke screens’ masking ability in infrared using thermovision equipment. In Proceedings of the SIOEL: Sixth Symposium on Optoelectronics, Bucharest, Romania, 23–28 February 2000. [Google Scholar]
- Singh, A.; Kamale, P.J.; Joshi, S.A.; Bankar, L.K. Bursting smoke as an infrared countermeasure. Def. Sci. J. 1998, 48, 297–301. [Google Scholar] [CrossRef]
- Singh, A.; Avachat, S.G.; Joshi, S.A.; Singh, H. Evaluation of pyrotechnic smoke for anti-infrared and anti-laser roles. Propellants Explos. Pyrotech. 1995, 20, 16–20. [Google Scholar] [CrossRef]
- Wu, X.; Zhang, J.Q.; Huang, X.; Liu, D. Gpu-accelerated real-time IR smoke screen simulation and assessment of its obscuration. Infrared Phys. Technol. 2012, 55, 150–155. [Google Scholar] [CrossRef]
- Ensor, D.S.; Sparks, L.E.; Pilat, M.J. Light transmittance across smoke plumes downwind from point sources of aerosol emissions. Atmos. Environ. 1973, 7, 1267–1277. [Google Scholar] [CrossRef]
- Cook, C.S.; Conner, W.D.; Bethke, G.W. Remote measurement of smoke plume transmittance using lidar. Appl. Opt. 1972, 11, 1742–1749. [Google Scholar] [CrossRef] [PubMed]
- Gao, L.X.; Wang, Q.; Xiong, L.Y.; Bao, J.A.; Wang, J.Z. Research on multi-channel smoke screen infrared transmittance measurement. In Proceedings of the 2009 2nd IEEE International Conference on Computer Science and Information Technology, Beijing, China, 8–11 August 2009. [Google Scholar]
- Butters, B.; Walmsley, R. Use of a transmissometer model for infrared smoke model validation and assessment of obscuration and detection times. In Proceedings of the SPIE Security + Defense: Technologies for Optical Countermeasures V, Cardiff, UK, 2–5 October 2008. [Google Scholar]
- Farmer, W.M.; Davis, R.E.; DeAntonio, M.; Rust, L. An evaluation of transmissometer systems used to measure smoke screen performance. In Proceedings of the 1988 Technical Symposium on Optics, Electro-Optics, and Sensors, Orlando, FL, USA, 10 August 1988. [Google Scholar]
- Wang, N.; Wang, Z.; Dong, H.; Zhang, G.; Liu, Y. The application of fourier transform infrared spectrometer to the smoke determination. Chin. J. Anal. Chem. 2001, 29, 443–445. [Google Scholar]
- Huang, W.; Ji, H.H.; Ren, S. Non-uniformity correction for the measurement results of ftir spectrometer. Laser Infrared 2015, 45, 400–405. [Google Scholar]
- Laubscher, B.E.; Borel, C.C.; Lomheim, T.S. Methodology for rapid infrared multispectral electro-optical imaging system performance analysis and synthesis. In Proceedings of the Aerospace/Defense Sensing and Controls, Orlando, FL, USA, 10–13 June 1996. [Google Scholar]
- Pollock, D.H. Countermeasure Systems, Volume 7, Infrared and Electro-Optical Systems Handbook; SPIE Optical Engineering Press: Bellingham, WA, USA, 1993; pp. 362–363. [Google Scholar]
- Oliveros, C.S.; Sánchez, G.S.-M.; Pérez, C.R. Field trials for determining the visible and infrared transmittance of screening smoke. In Proceedings of the SPIE Security + Defence: Technologies for Optical Countermeasures VI, Berlin, Germany, 26–29 September 2009. [Google Scholar]
- Rogalski, A. Recent progress in infrared detector technologies. Infrared Phys. Technol. 2011, 54, 136–154. [Google Scholar] [CrossRef]
- Jacobs, P.A. Thermal Infrared Characterization of Ground Targets and Backgrounds, 2nd ed.; SPIE Press: Bellingham, WA, USA, 2006; pp. 86–89. [Google Scholar]
- Gonzalez, R.C.; Woods, R.E. Digital Image Processing, 4th ed.; Pearson/Prentice Hall: Upper Saddle River, NJ, USA, 2010; pp. 60–232. [Google Scholar]
Figure 1.
Schematic diagram of field trial.

Figure 2.
The selection of positions of and (no smoke).

Figure 3.
The selection of positions of and (with smoke).

Figure 4.
Schematic picture of three value computing methods.
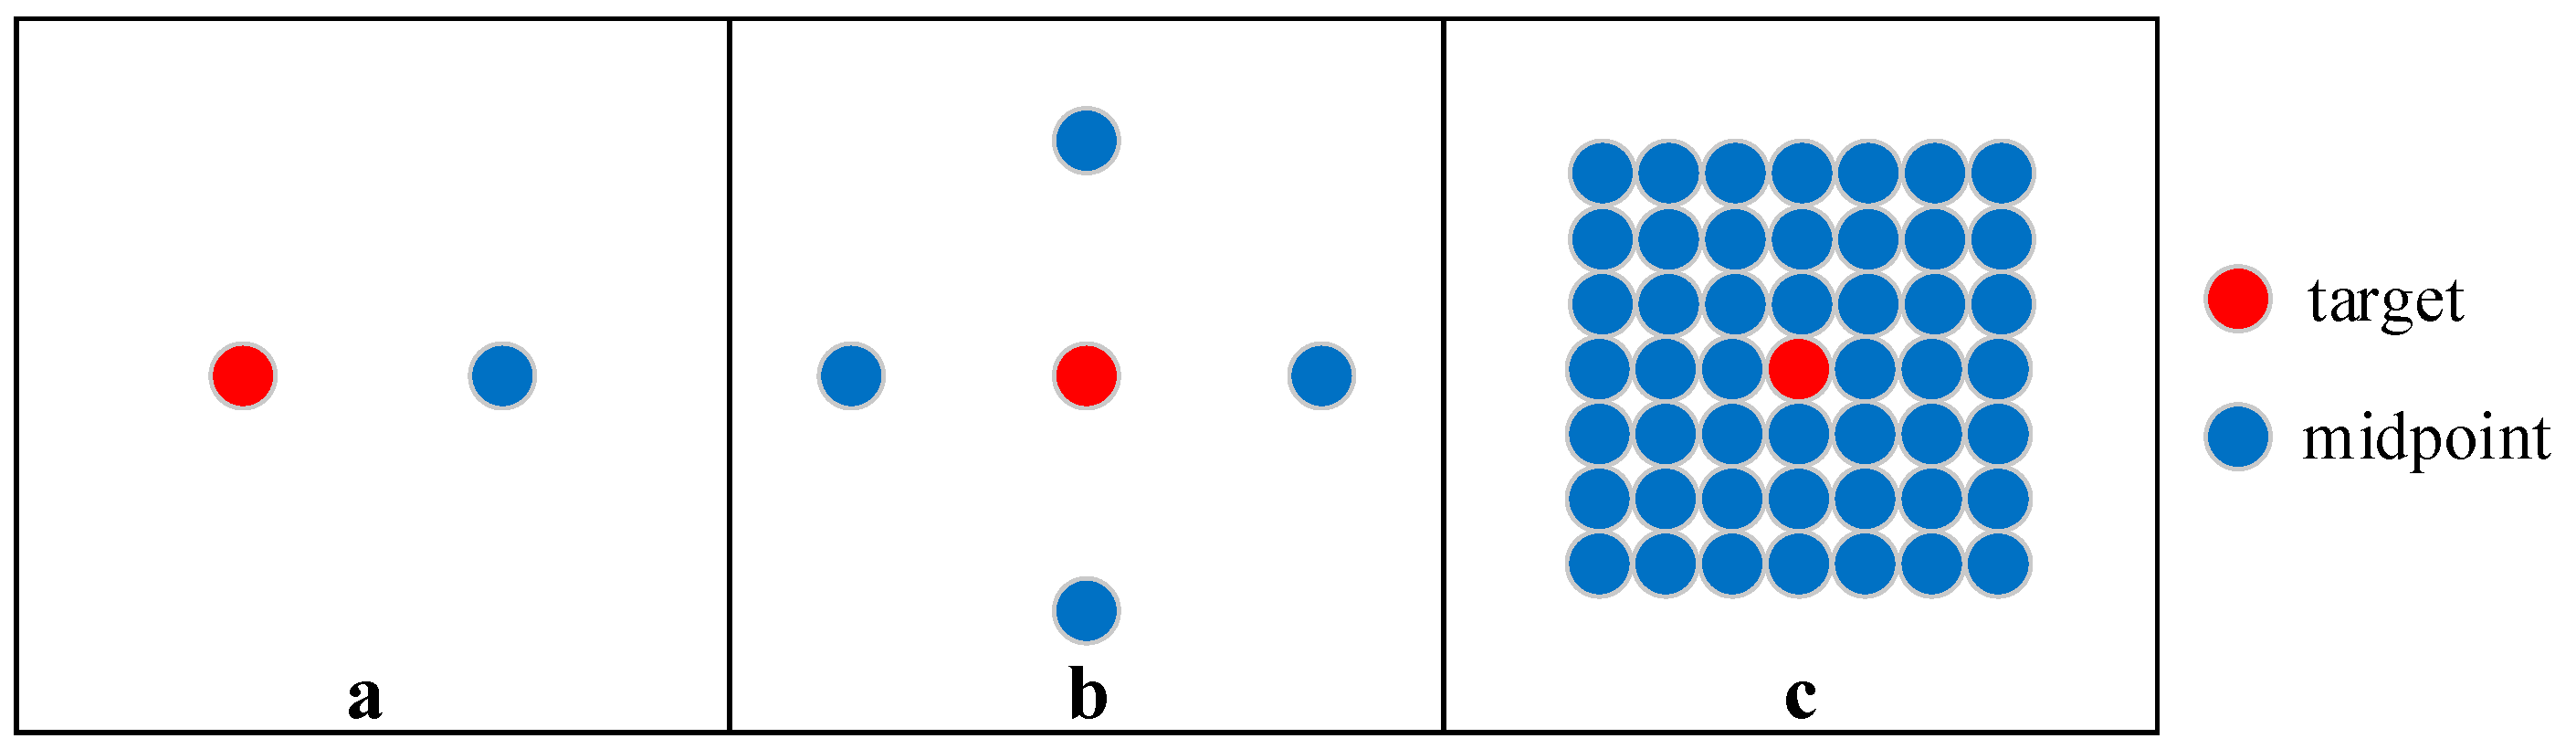
Figure 5.
Field smoke transmittance trial flow chart.
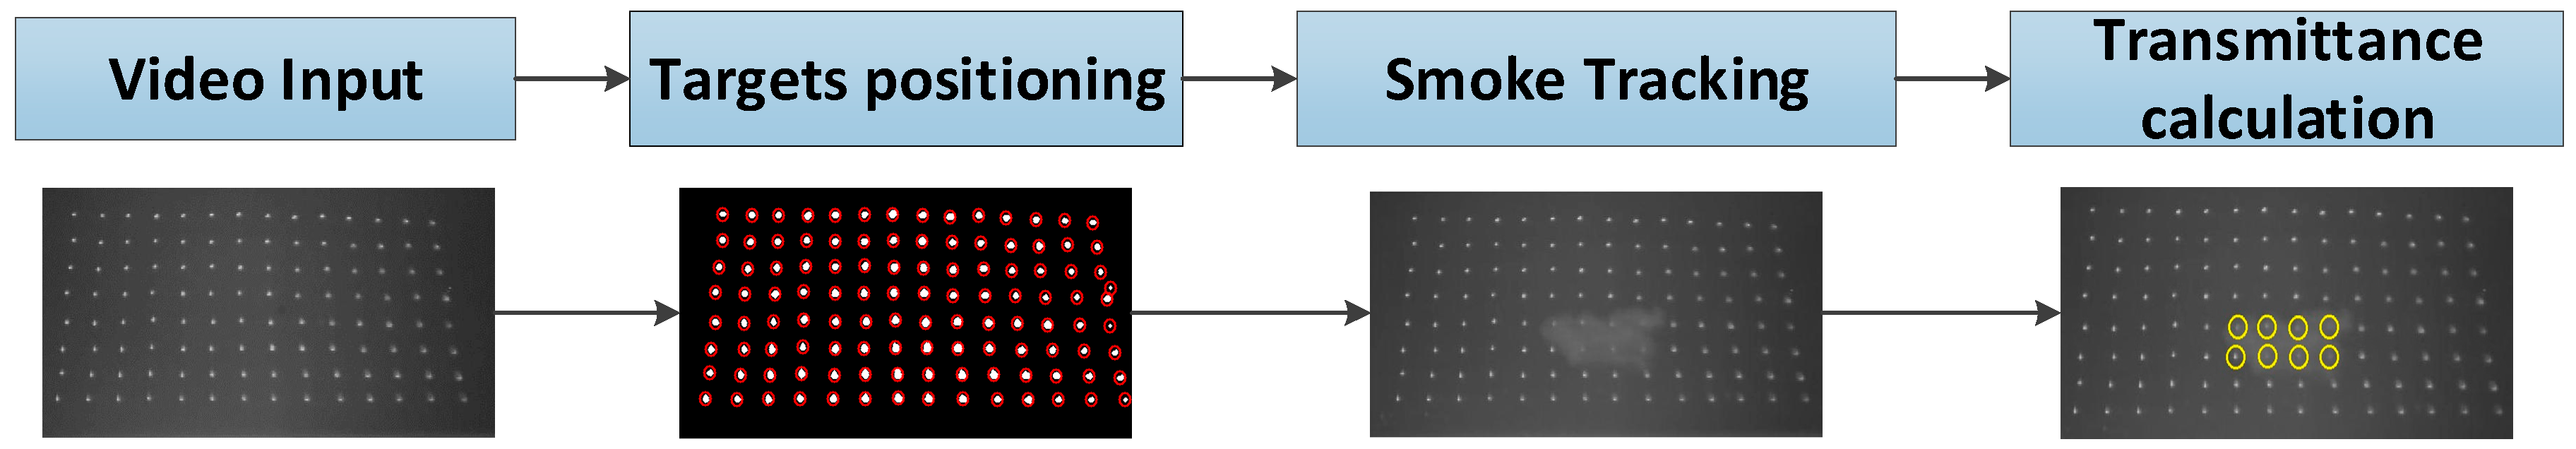
Figure 6.
Study objects in infrared target array.

Figure 7.
Smoke transmittance curves of eight study objects shown in Figure 6 during the smoke diffusion process. Ta, Tb, and Tc represent transmittance results from three different methods mentioned in Section 3.
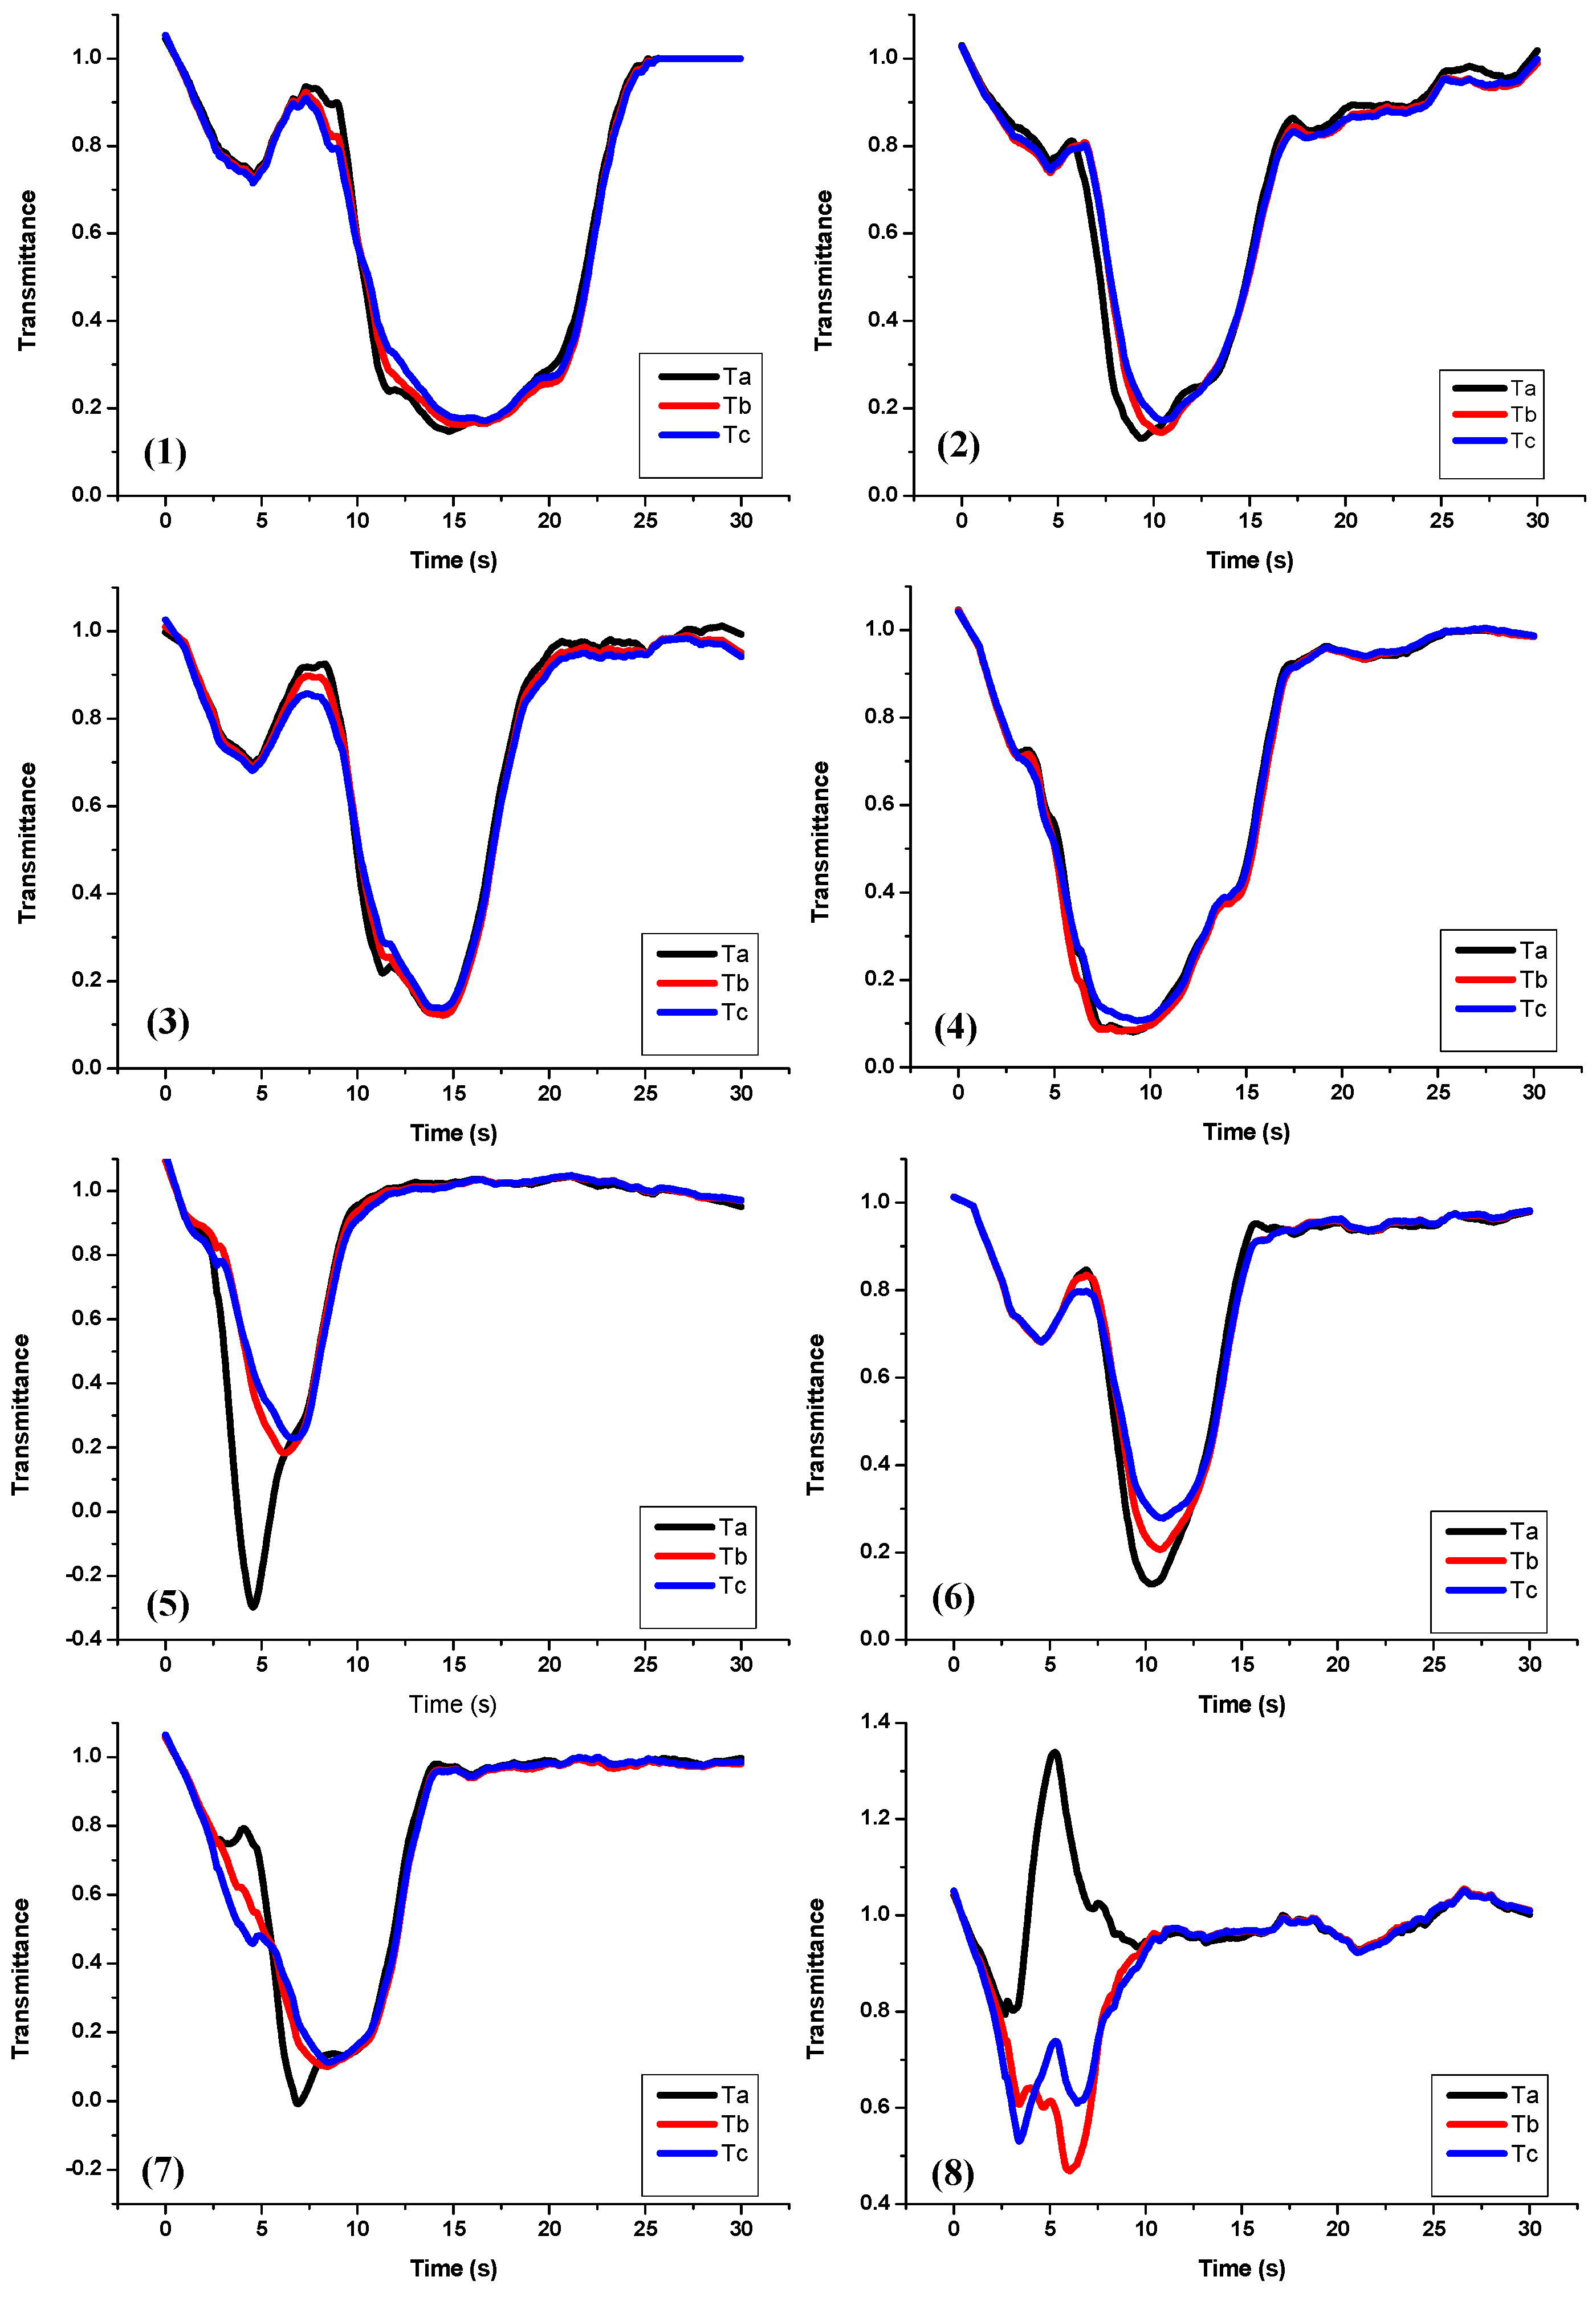
Figure 8.
Image of target infrared array at 9.72 s.

Table 1.
Smoke transmittance of study objects at 9.72 s.
| Number | 1 | 2 | 3 | 4 | 5 | 6 | 7 | 8 |
| Transmittance | 0.66 | 0.19 | 0.59 | 0.11 | 0.89 | 0.12 | 0.19 | 0.98 |
© 2017 by the authors. Licensee MDPI, Basel, Switzerland. This article is an open access article distributed under the terms and conditions of the Creative Commons Attribution (CC BY) license (http://creativecommons.org/licenses/by/4.0/).
Share and Cite
MDPI and ACS Style
Tang, R.; Zhang, T.; Wei, X.; Zhou, Z. An Efficient Numerical Approach for Field Infrared Smoke Transmittance Based on Grayscale Images. Appl. Sci. 2018, 8, 40. https://doi.org/10.3390/app8010040
AMA Style
Tang R, Zhang T, Wei X, Zhou Z. An Efficient Numerical Approach for Field Infrared Smoke Transmittance Based on Grayscale Images. Applied Sciences. 2018; 8(1):40. https://doi.org/10.3390/app8010040
Chicago/Turabian StyleTang, Runze, Tonglai Zhang, Xuebin Wei, and Zunning Zhou. 2018. "An Efficient Numerical Approach for Field Infrared Smoke Transmittance Based on Grayscale Images" Applied Sciences 8, no. 1: 40. https://doi.org/10.3390/app8010040
Note that from the first issue of 2016, this journal uses article numbers instead of page numbers. See further details here.