Article

IR Reflectography and Active Thermography on Artworks: The Added Value of the 1.5–3 µm Band

by
Jeroen Peeters
1,*,
Gunther Steenackers
1,
Stefano Sfarra
3,†,
Stijn Legrand
2,
Clemente Ibarra-Castanedo
4,
Koen Janssens
2 and
Geert Van der Snickt
2
1
Electro Mechanic Department, University of Antwerp, Op3Mech Research Group, Groenenborgerlaan 171, B-2020 Antwerp, Belgium
2
Chemistry Department, University of Antwerp, AXES Research Groep, Groenenborgerlaan 171, B-2020 Antwerp, Belgium
3
Las.E.R. Laboratory, Department of Industrial and Information Engineering and Economics (DIIIE), University of L’Aquila, Piazzale E. Pontieri 1, Loc. Monteluco di Roio, Roio Poggio, 67100 L’Aquila, Italy
4
Electrical and Computer Engineering Department, Computer Vision and Systems Laboratory, Laval University, 1065 av de la Medecine, QC G1V 0A6, Canada
*
Author to whom correspondence should be addressed.
Additional affiliation: Thermal Control Methods Lab No. 34, Tomsk Polytechnic University, Lenin Av., 30, Tomsk 634050, Russia.
Appl. Sci. 2018, 8(1), 50; https://doi.org/10.3390/app8010050
Submission received: 11 December 2017 / Revised: 28 December 2017 / Accepted: 29 December 2017 / Published: 1 January 2018

Abstract

:

Featured Application

The work described in this study can assist in the selection of an appropriate tool for art work inspection. In addition, the authors hope to provide an overview of potential application areas for the different measurement instruments discussed within the manuscript.

Abstract

Infrared Radiation (IR) artwork inspection is typically performed through active thermography and reflectography with different setups and cameras. While Infrared Radiation Reflectography (IRR) is an established technique in the museum field, exploiting mainly the IR-A (0.7–1.4 µm) band to probe for hidden layers and modifications within the paint stratigraphy system, active thermography operating in the IR-C range (3–5 μ m) is less frequently employed with the aim to visualize structural defects and features deeper inside the build-up. In this work, we assess to which extent the less investigated IR-B band (1.5–3 μ m) can combine the information obtained from both setups. The application of IR-B systems is relatively rare as there are only a limited amount of commercial systems available due to the technical complexity of the lens coating. This is mainly added as a so-called broadband option on regular Mid-wave infrared radiation (MWIR) (IR-C’/3–5 μ m) cameras to increase sensitivity for high temperature applications in industry. In particular, four objects were studied in both reflectographic and thermographic mode in the IR-B spectral range and their results benchmarked with IR-A and IR-C images. For multispectral application, a single benchmark is made with macroscopic reflection mode Fourier transform infrared (MA-rFTIR) results. IR-B proved valuable for visualisation of underdrawings, pencil marks, canvas fibres and wooden grain structures and potential pathways for additional applications such as pigment identification in multispectral mode or characterization of the support (panels, canvas) are indicated.

1. Introduction

Artworks are continuously subjected to external influences, such as temperature and humidity variations, condensation–vaporisation cycli, biological attacks, (Ultraviolet (UV)) -radiation that lead both to internal and surface alterations and eventually damage [1]. In relation to the degradation processes, each layer of the artwork itself can be affected. The most important artworks (i.e., canvas paintings, mural paintings, panel paintings, inlay works, icons) can be considered as multi-layer structures, in which each layer fulfills a key role. Therefore, important remnants of the history of the artefact may be partially lost in time. At this point, the use of techniques which improve the readability of artefacts undetectable to the naked eye is highly desirable.
Using radiation outside the visible range, different characteristics of the inspected artwork may be revealed according to the bandwidth in which images are acquired. Beyond the traditional diagnostic methods such as reflectography and thermography, selective multi-spectral analysis in the near-infrared region (IR-A) has recently been demonstrated to be a promising tool for investigating pictorial layers [2,3]. Within this work, infrared radiation is divided according to the international Commission on Illumination (CIE) and sensor response scheme as presented in Table 1 [4].
Non-destructive testing (NDT) methods are based on physical principles and, from their specific application, the necessary information is obtained to establish a diagnosis of the test object’s integrity and quality. They help to establish the origin and period of manufacture of the piece of art [5]. Imaging data integration provides a multi-layered and multi-spectral representation of the painting that yields a comprehensive diagnosis, confirms or denies the anomalies individuation, by minimizing in the same time the ambiguities of information based on a single diagnostic method [6].
Falco used a high-resolution IR-A camera to capture photographs (“reflectograms”) of hundreds of paintings in over a dozen museums on three continents. In some cases, these IR-A reflectograms have provided new insights into the artists’ creative process while creating the final images that are possible to see in the visible [7]. Sfarra et al. studied an integrated approach based on traditional and innovative techniques (i.e., holographic interferometry, pulsed thermography (IR-C) and near-infrared reflectography (IR-A)) applied on poplar wood with a complex surface shape containing artificial defects positioned at several depths and linked to the influence of the support on the upper layers up to the external coating [8]. In [9], the authors applied high resolution IR-A reflectography and IR-C’ imaging to characterize the superficial layer of a fresco and to analyse the stratigraphy of different pictorial layers. IR-C” thermography in the 7–14 μ m band was also used to understand the nature of the support. Sandu et al. provided a review centred on the characterization via NDT and micro-DT of artistic gilded objects for establishing the compositional, structural, morphological and physical-chemical parameters useful for monitoring the conservation state, behaviour and evolution in time of their aging/degradation/deterioration processes, the restoration treatments influencing the conservation state of the original materials and also for a rational choice of methods and materials of intervention, compatible with the original ones [10]. In 2012, a new imaging tool in art conservation called thermal quasi-reflectography (TQR) [11] was proposed and demonstrated. It is based on the recording by suitable procedures, of reflected infrared radiation in the mid-wave infrared band (IR-C’); it was applied to the analysis of painting surfaces. Paintings on canvas were also studied in [12] thanks to different physical techniques; in particular, the stretcher effect and subsurface anomalies were analysed and detected with the aim to improve the conservator’s knowledge concerning the defect’s detection and defect’s propagation in acrylic paintings characterized by underdrawings and pentimenti.
On one hand, mobile non-destructive subsurface imaging and depth profiling techniques that allow in situ investigation of easel paintings, i.e., paintings on a portable support were summarized in depth in [13]. On the other hand, chemical and physical analyses can be used together on polychromatic objects in order to approximately date unknown and ancient restorations via x-ray fluorescence (XRF) spectroscopy and SEM-EDX (energy-dispersive X-ray spectroscopy coupled to scanning electron microscopy) techniques [14,15].
The non-invasive methods near-infrared (IR-A), short-wave infrared (IR-A) and thermographic inspection (IR-C) of artworks were described in [16] and also compared in terms of their ability to reveal both hidden graphite-containing underdrawings and subsurface degradations. The performance of transient thermography, three optical methods and ultrasonic testing applied together on a veneered wood sample with real and fabricated defects were explored in [17]. Contextually, the theory of colour in IR was in-depth described in [18]. In this work, the authors observed a different transparency on several areas of the painting analysed via IR LED illumination at 1.2 μ m , indicating touch-ups and reparations after the creation of the original art piece.
A non-simultaneous multi-spectral inspection using a set of detectors covering from the ultraviolet to the terahertz spectra was performed on a panel painting in [19,20]. It was observed that underdrawings contrast increases with wavelength up to 1700 nm and, then, gradually decreases. It should be clearly marked that, within this research, an essential gap occurred between the spectral range of the Short-wave infrared (SWIR)/IR-A camera (0.9–1.7 μ m ) and the Mid-wave infrared (MWIR)/IR-C’ cameras (3–5 μ m ). In addition, it is shown that IR thermography can be considered an alternative technique for the detection of underdrawings. The work of Walmsley et al. and van Asperen de Boer both suggest that the ideal wavelength band for observation of underdrawings should be located around 2 μ m (IR-B) [21,22], which will be investigated in depth within the current manuscript using a high-end combined camera, which is sensitive in IR-B and IR-C’.
From this summary centred on the visualization of unknown and not visible features, it is possible to notice how the integration between different techniques is of paramount of interest to reach an accurate inspection. The strong aspects of a certain technique may be the weak points of another, and vice versa. A multi-spectral inspection in different regions of the electromagnetic spectrum, above all if the results are corroborated with chemical analyses, is a clever idea in order to integrate the best sources of knowledge. This direction was followed in the present work. In particular, our attention was focused on the detection of underdrawings, splitting, pencil marks, wooden grain structures and differentiation of canvas fibres in four real and reproduction objects. In addition, with the implementation of multi-spectral filtering, pigments were identified in a fast and non-destructive modality.

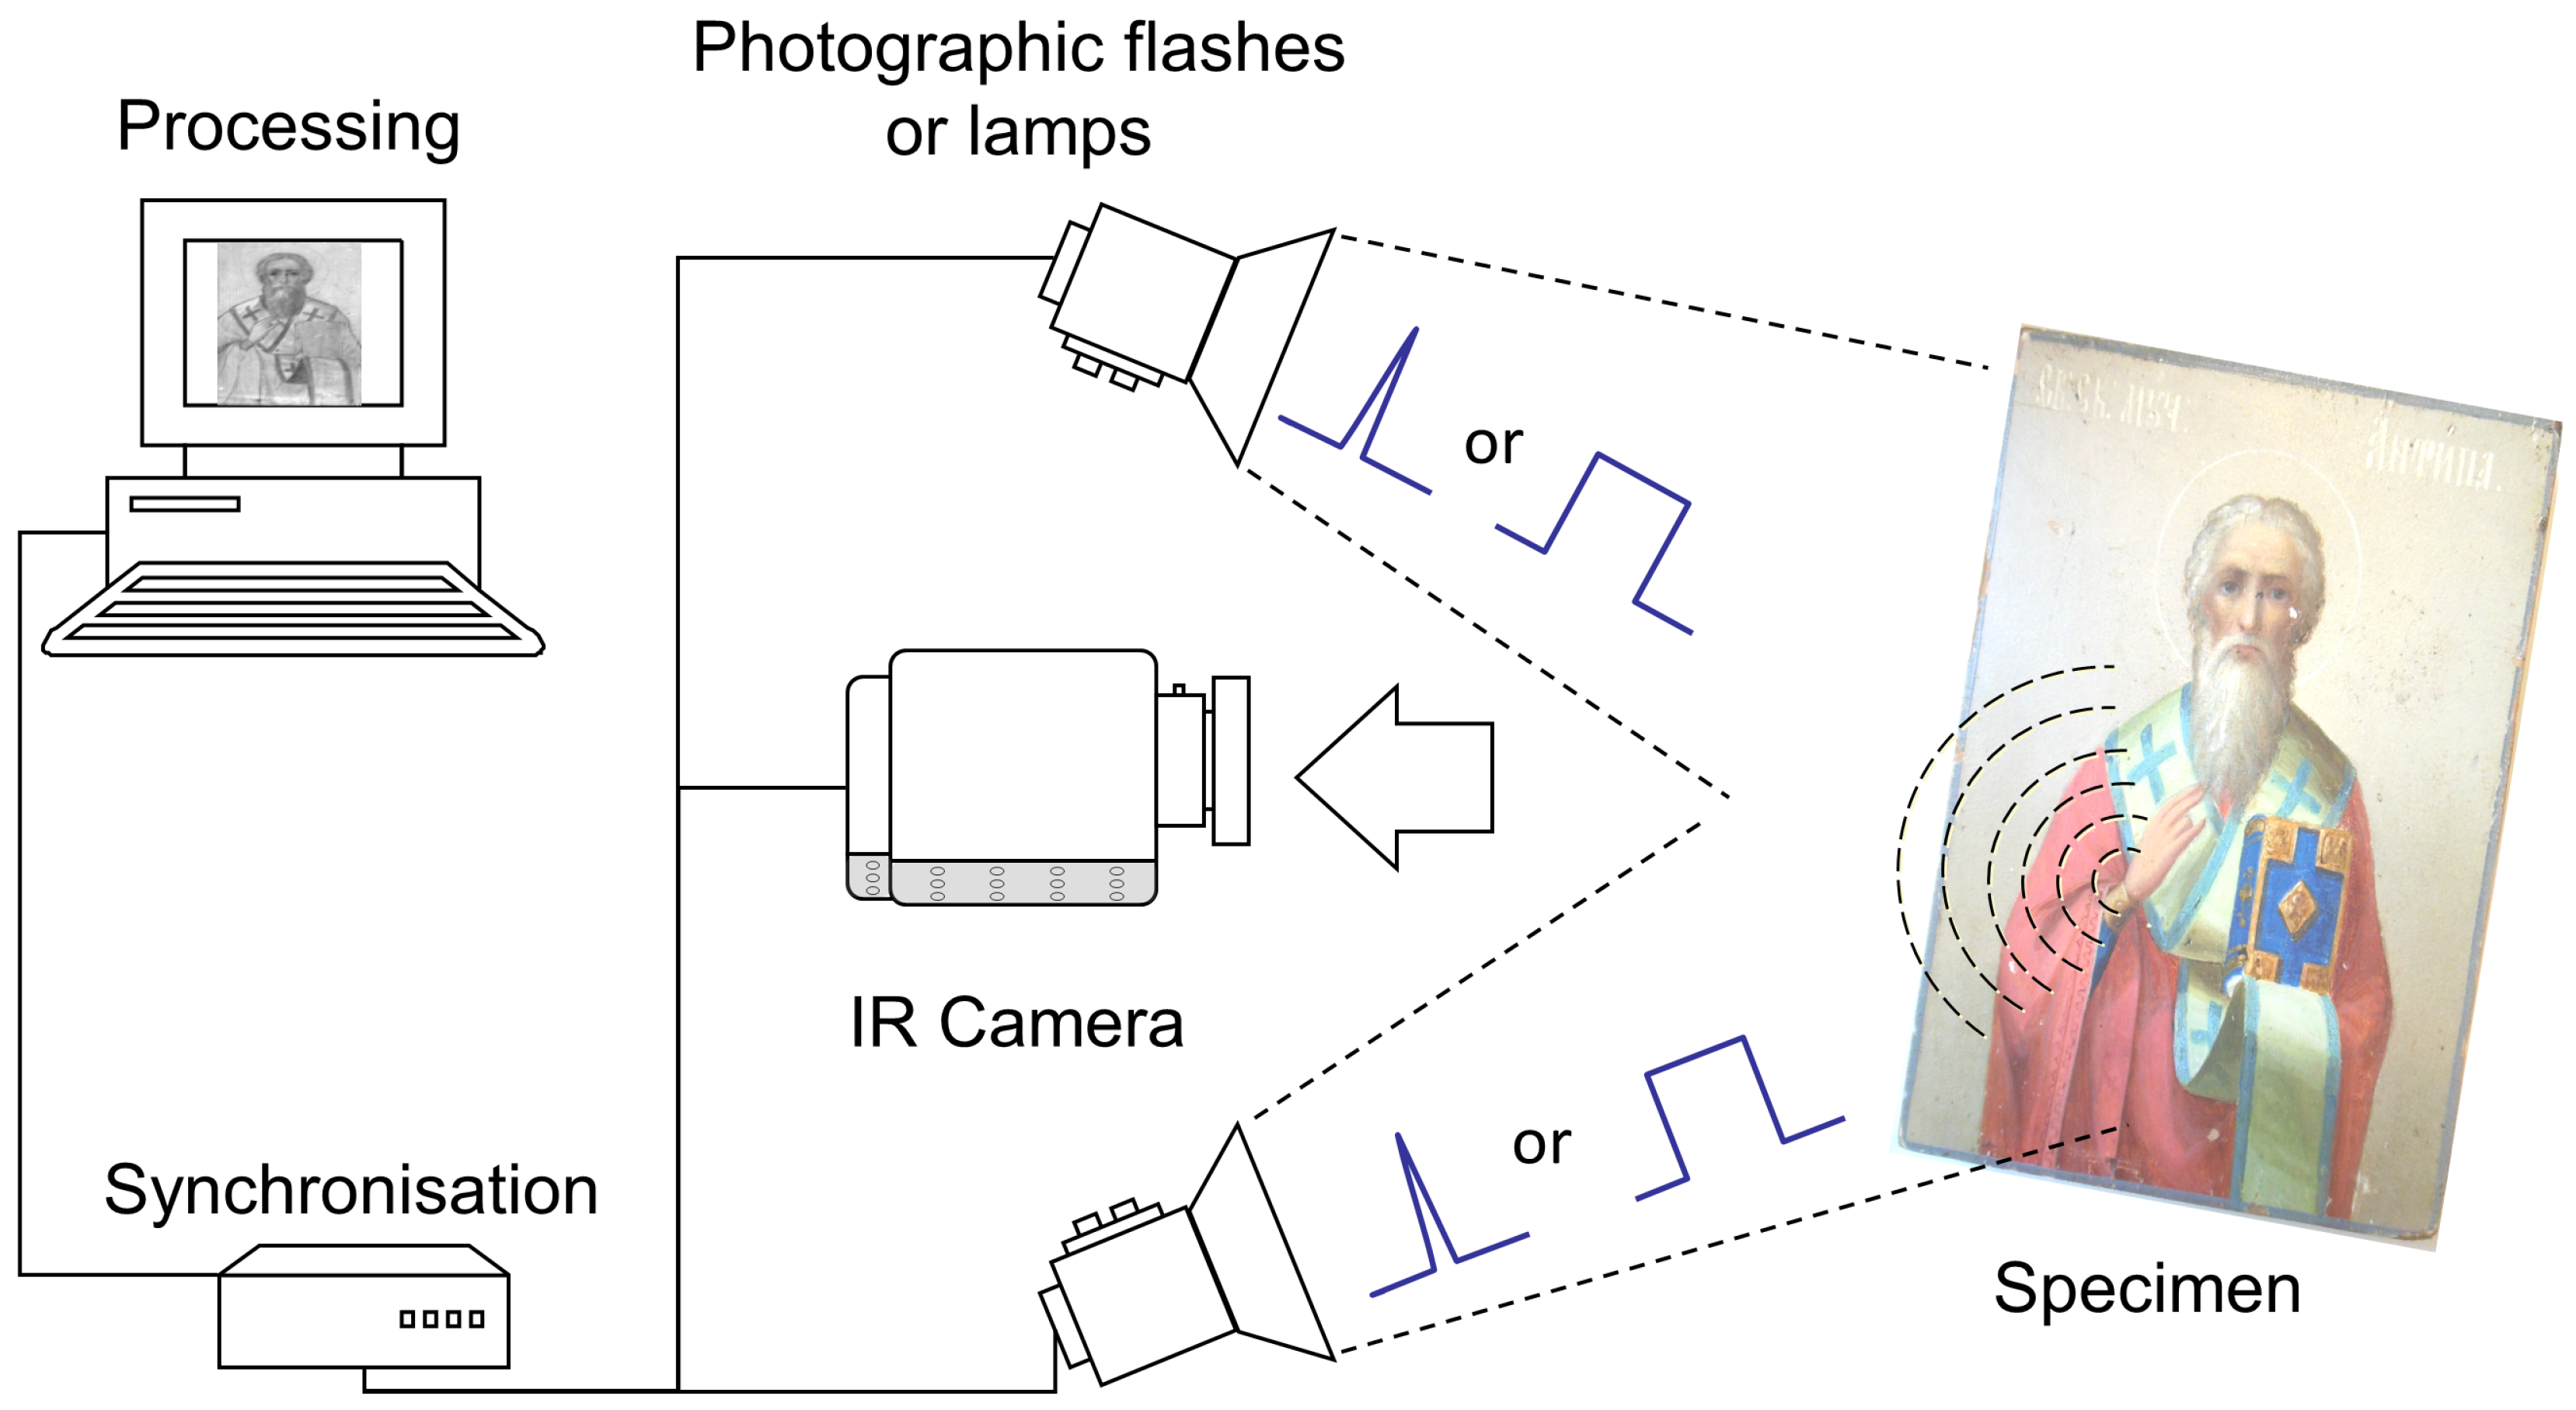
2. Materials and Methods

A broad range of measurements is performed within this contribution, mainly focused on the IR-B spectral range (between 1.5–3 μ m ) as it is less frequently investigated for artwork inspection but promising results are expected. A first subdivision of the measurements can be made within a measurement technique:
Infrared reflectography is well-established for art work inspection, in order to reveal pentimenti, touch-ups and other artefacts [16]. It is a photographic technique at a longer wavelength, which makes it feasible to use the transparency of most of the pigments in this spectral range to evaluate the layers underneath optical opaque layers. The technique is mostly performed in the IR-A spectrum, but it is possible in the IR-B spectrum as well. The degree of paint opacity is mostly determined by two factors: the absorption of light by the pigment and the scattering of light by pigment particles [23]. A full description can be found in the work of Gavrilov et al. [23]. Within the measurement set-up, a halogen float lamp of 1000 W or IR LED 940 nm with a power of 800 W is made use of as an illumination source. The acquired measurement data is not further post-processed before interpretation.
Active thermography uses the transient behaviour of the response on a thermal excitation (heating or cooling) of the object to identify anomalies within the structure as shown in Figure 1. The study of active thermography has become an important Non-Destructive Evaluation technique (NDE) for damage detection and material updating in metallic structural components [24,25,26], as well as CFRP (Carbon Fiber Reinforced Polymer) and GFRP (Glass Fiber Reinforced Polymer) composites [27]. In state-of-the-art research, the technique is upcoming for the inspection of art works in the IR-C spectrum [16].
Thermography has many advantages including operating in a non-contact mode, it can be performed in situ, it can cover large areas and it is a quantitative method [28,29]. The disadvantages are that anomalies deeper in the structure are more difficult to inspect [30] and that the results are highly dependent on the used experimental set-up conditions, for example emissivity variations and non-homogeneous surface heating. Efficient signal processing and filtering of the anomaly information in the field of active thermography methods are very important. With the help of adapted image- and signal processing algorithms, it is possible to detect small discontinuities inside structures or extract material characteristic information. By reducing the amount of acquired data, the process is accelerated, but a certain decrease in accuracy has to be kept in mind. Within this work, two main post-processing techniques are used based on image correlation and principal component analysis [31] using the IR-View software (V2015.5.29, VisiooImage, Quebec-City, QC., Canada, 2015), described in [32].
  • SWIR: Short Wave Infrared radiation, only for reflectography measurements. spectral range: 0.9–1.7 μ m (IR-A), measurements performed with a Goodrich SU640SDWH-1.7 RT camera, CMOS InGaAs uncooled sensor and a spatial resolution of 640 × 512.
  • MWIR: Mid-wave Infrared radiation. Global spectral range of 1.5–5 μ m (IR-B+C’), measurements performed with FLIR X6540sc camera with a cooled InSb sensor, Noise Equivalent Temperature Difference (NETD) of 20 mK and a spatial resolution of 640 × 512. The IR-C’ measurements are compared with a FLIR Phoenix camera, which is only sensitive in the IR-C’ spectrum:
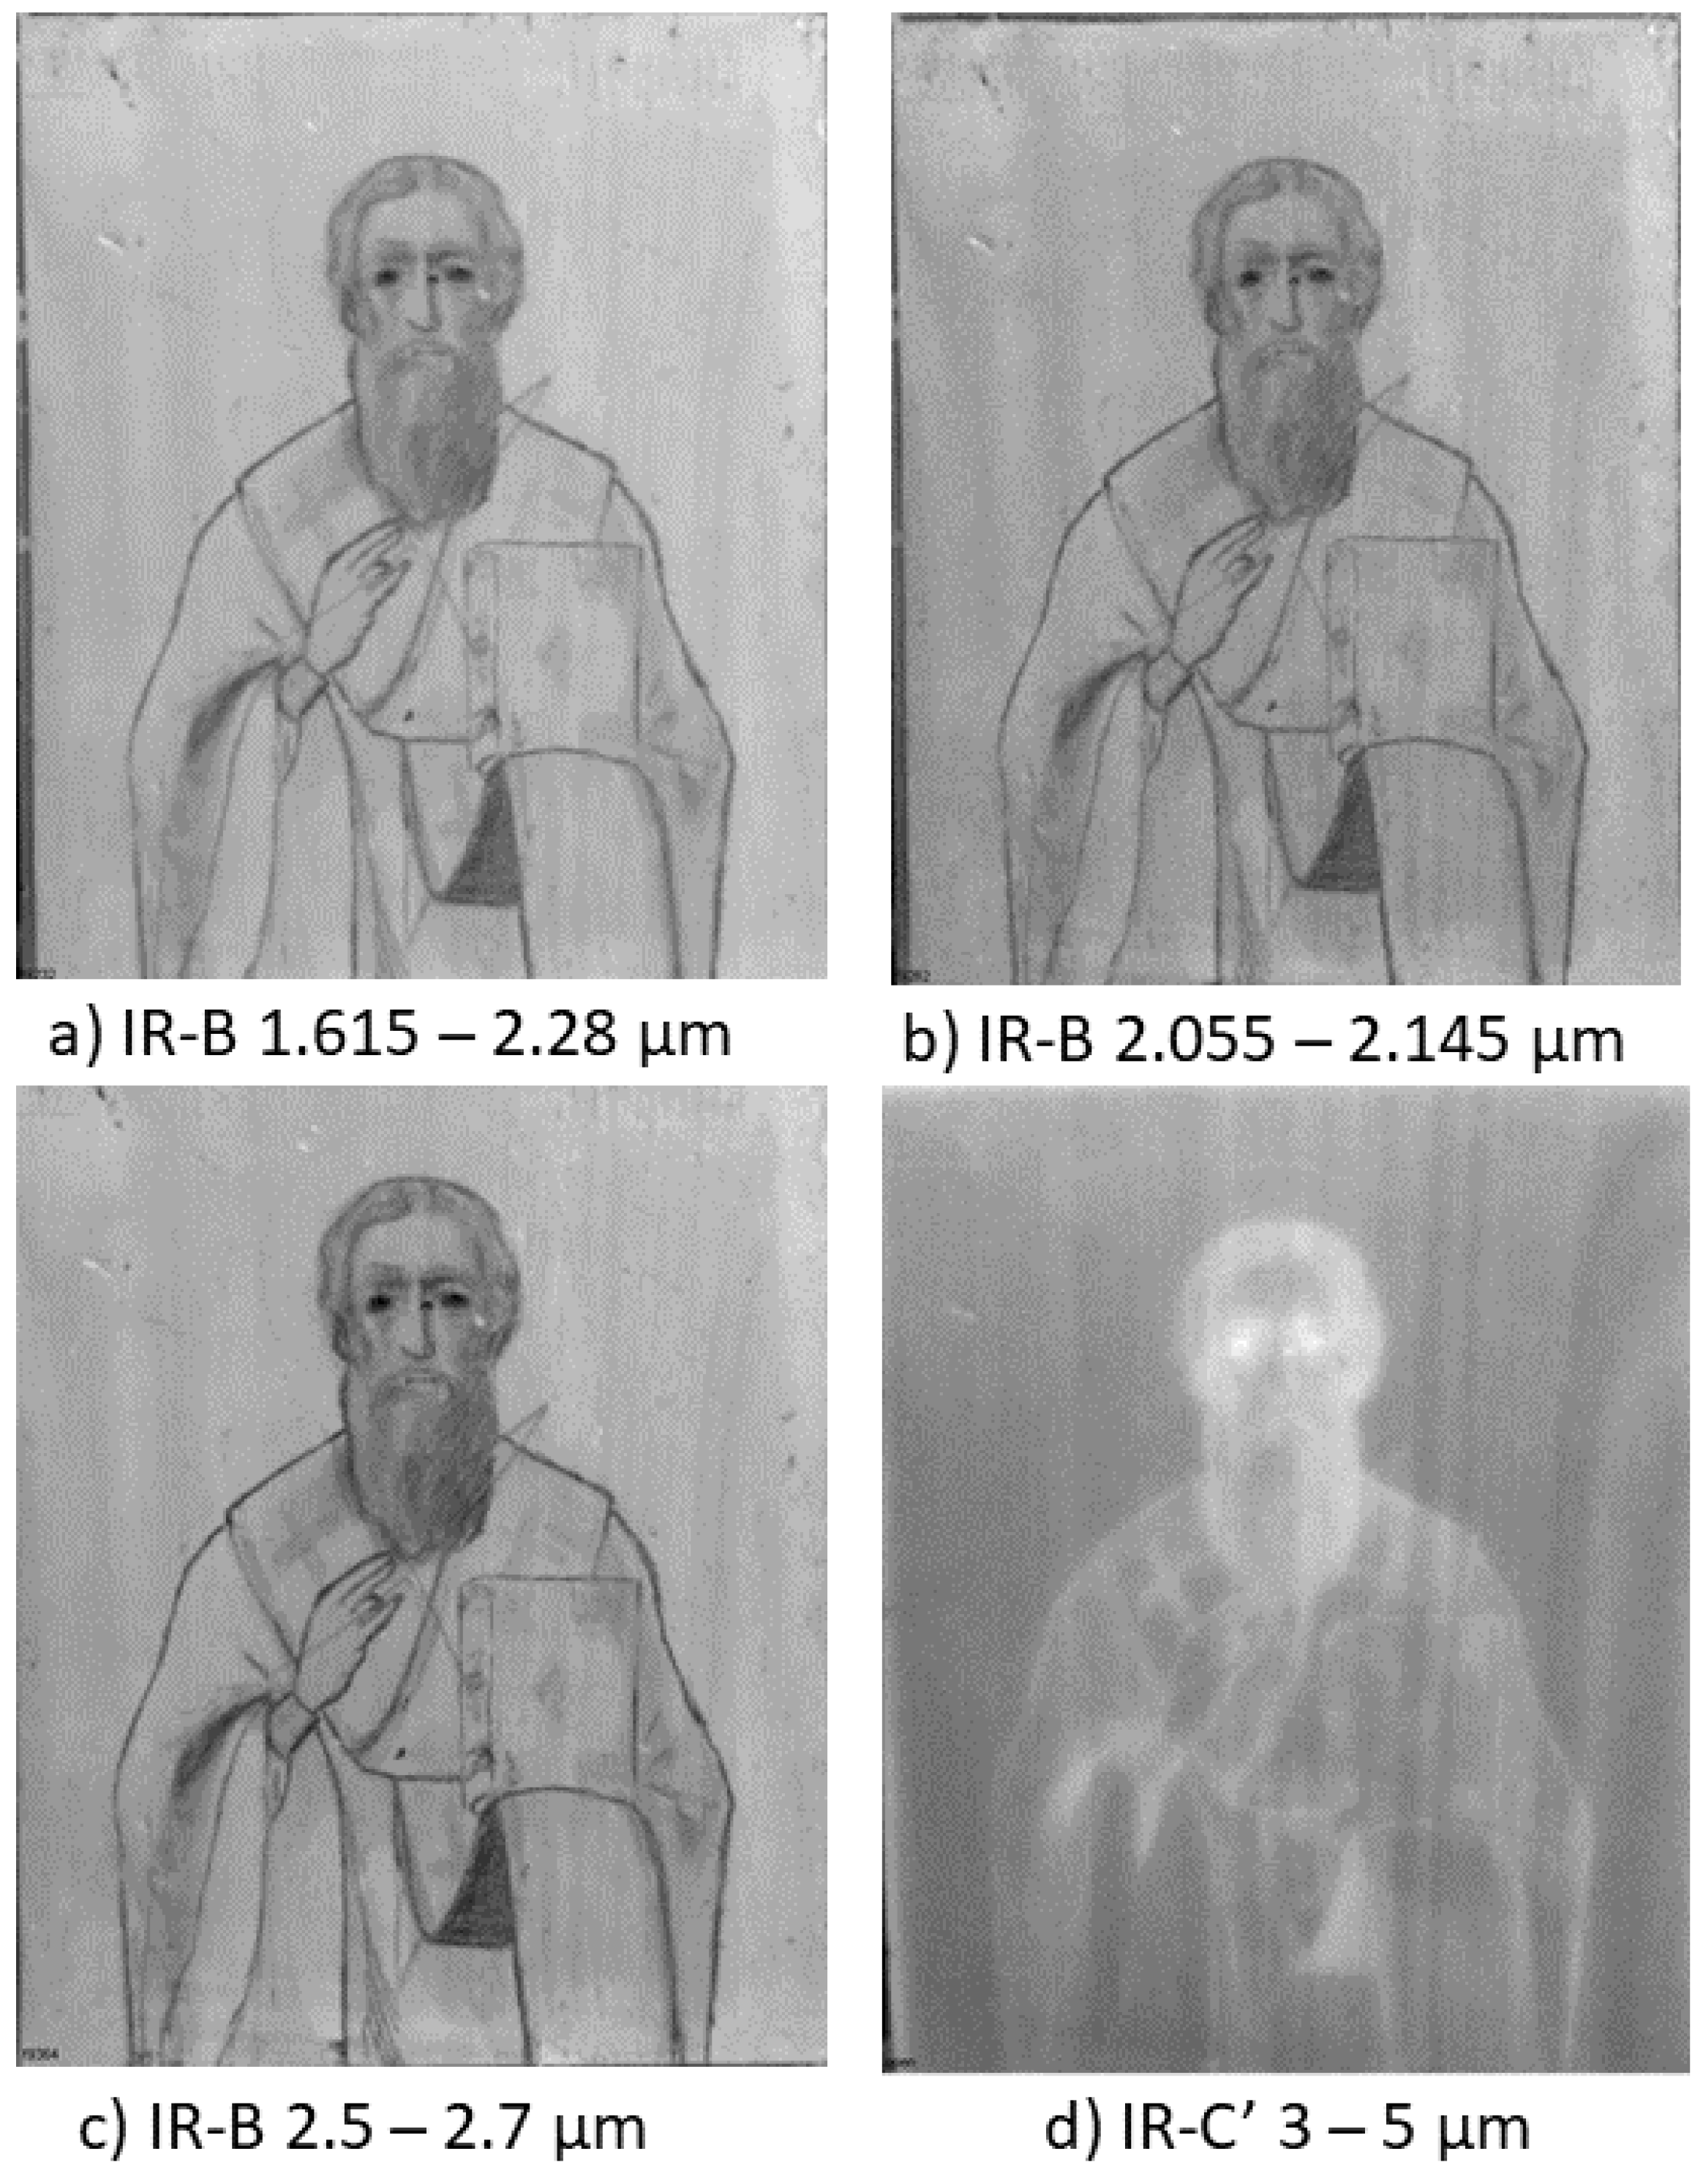
    reflectography measurements within the spectral range of 1.5–5 μ m (IR-B+C’) with separate filter options:
    *
    1.615–2.280 μ m ,
    *
    2.055–2.145 μ m ,
    *
    2.5–2.7 μ m ,
    *
    1.5–5 μ m ,
    active thermography measurements within the spectral range of 3–5 μ m (IR-C’).
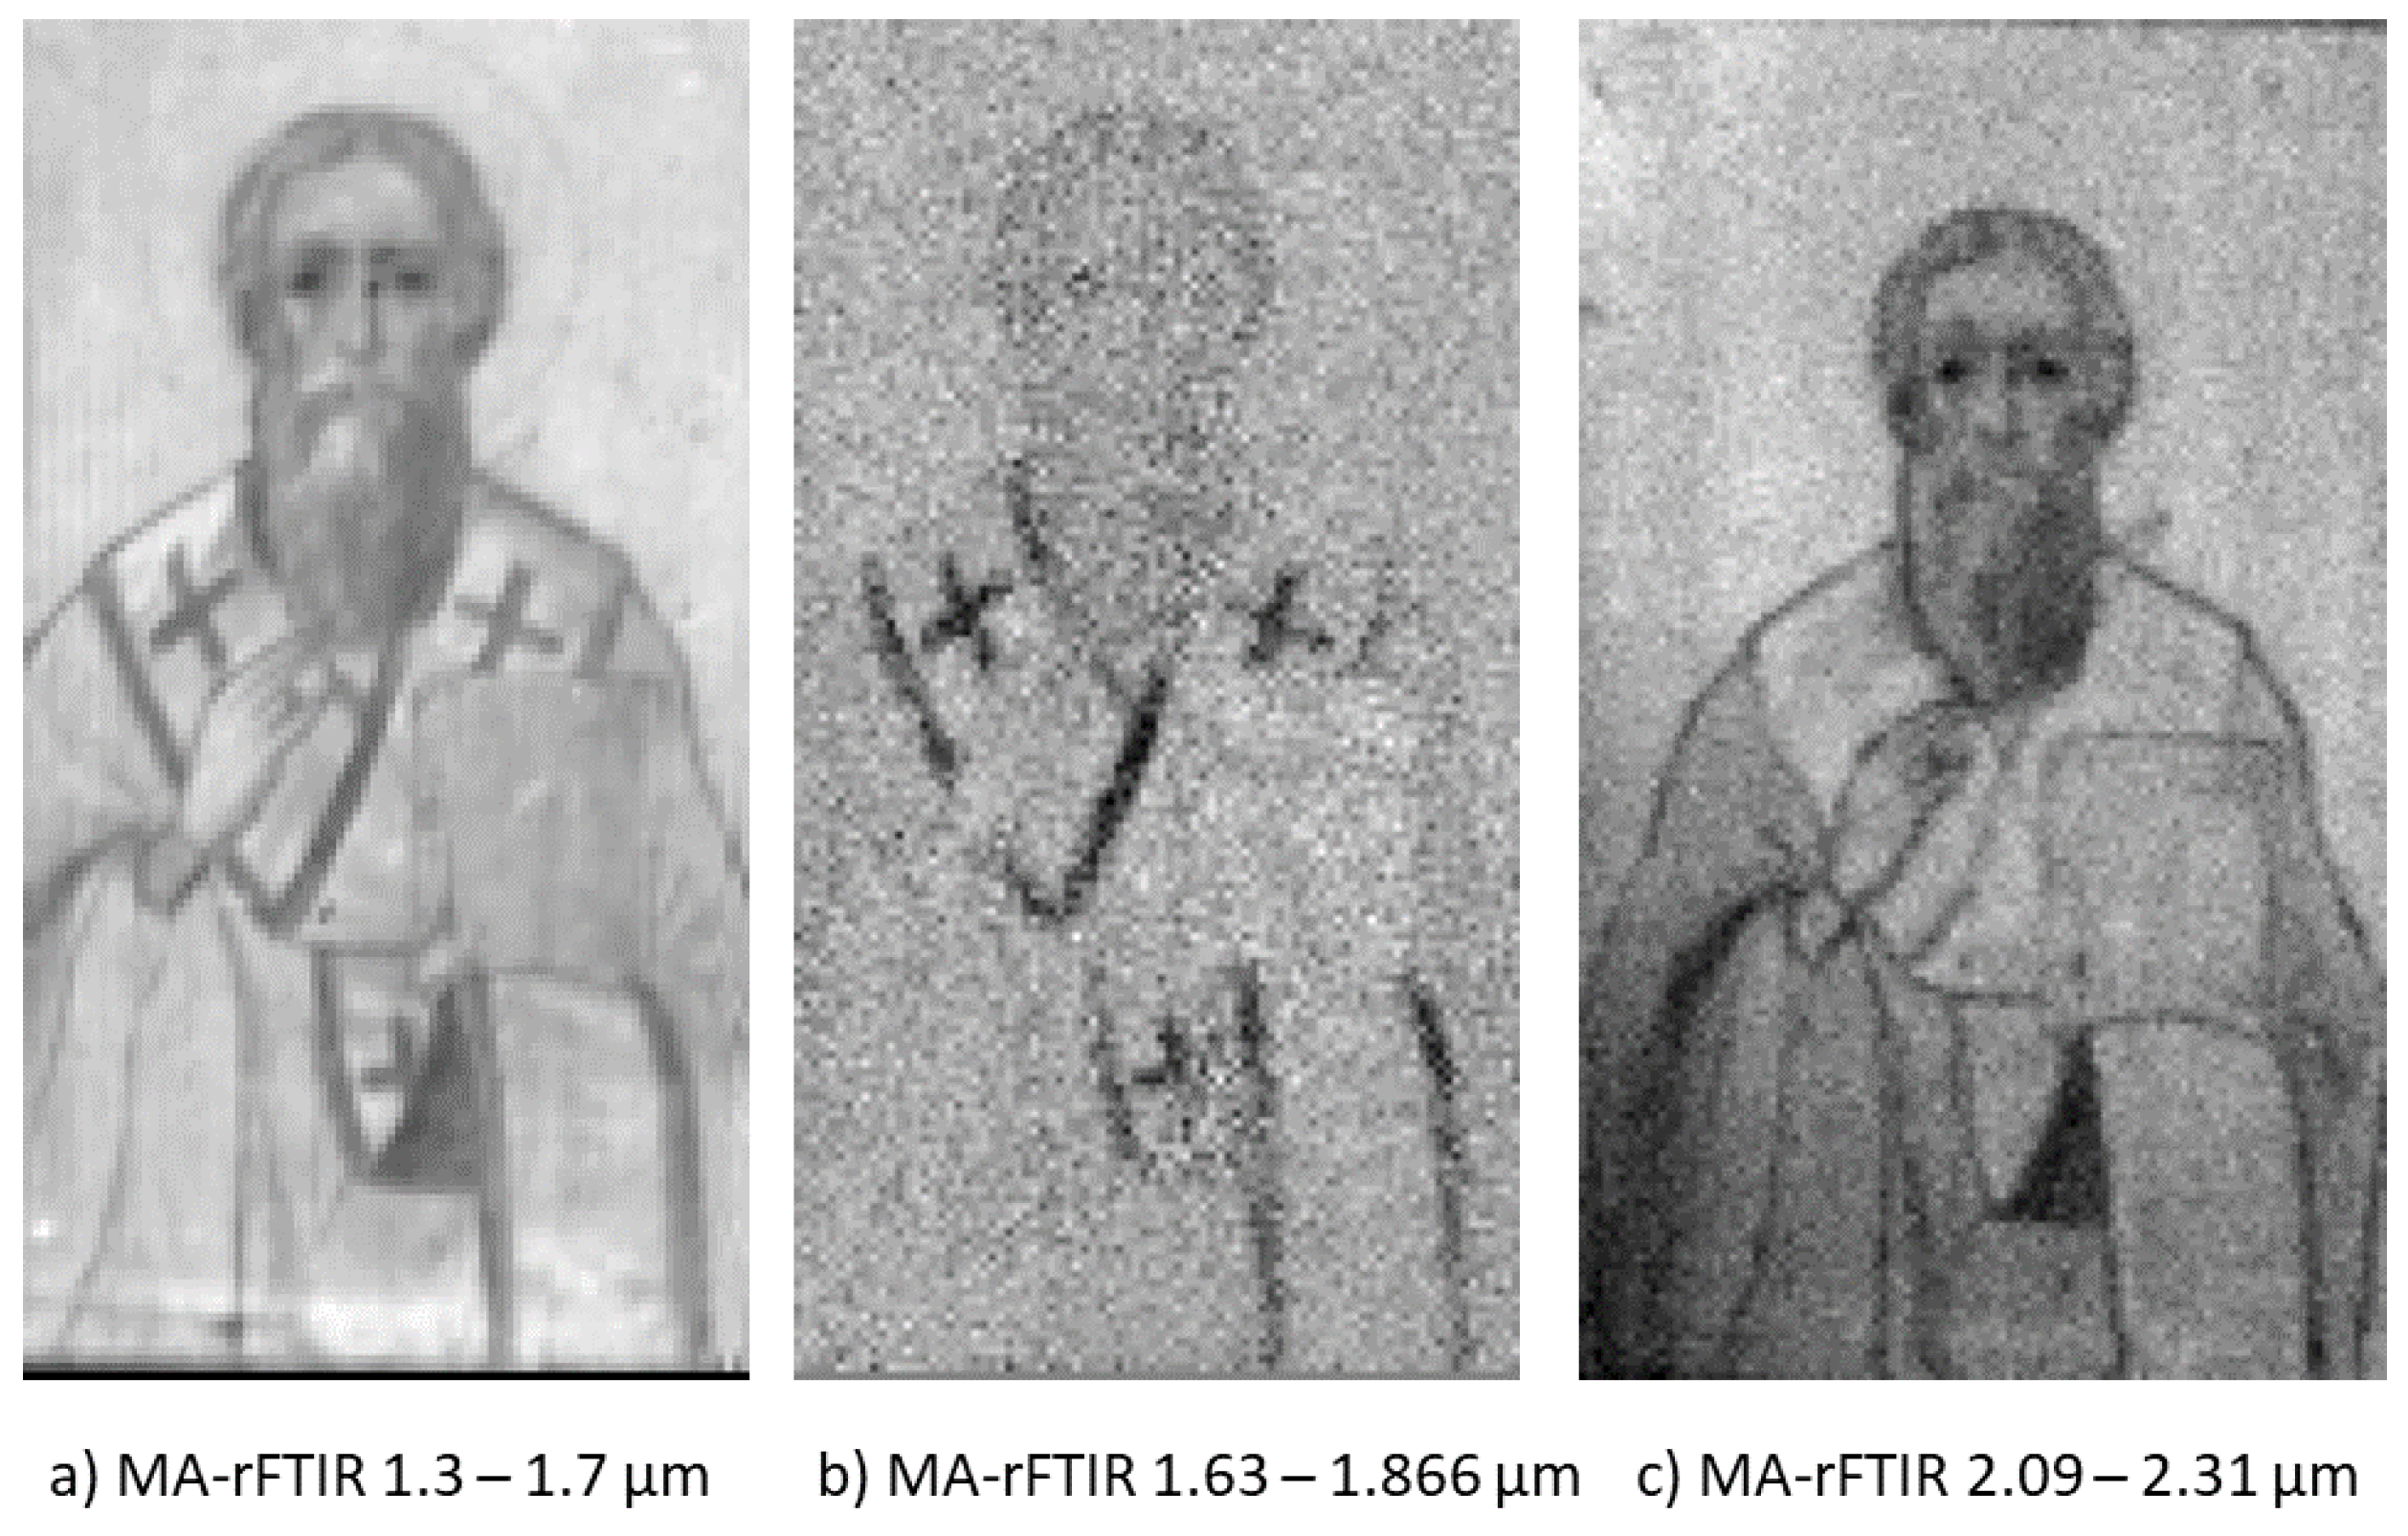
  • MA-rFTIR (macroscopic reflection mode Fourier transform infrared) measurements using a Bruker Alpha FTIR spectrometer (Bruker, Germany), fully described in [14] as benchmark measurement to verify the multi-spectral measurements.
The illumination and excitation sources for all test samples are positioned in front of the test sample on a distance of 1 m, except when further specified. An overview of the discussed measurements is shown in Table 2:

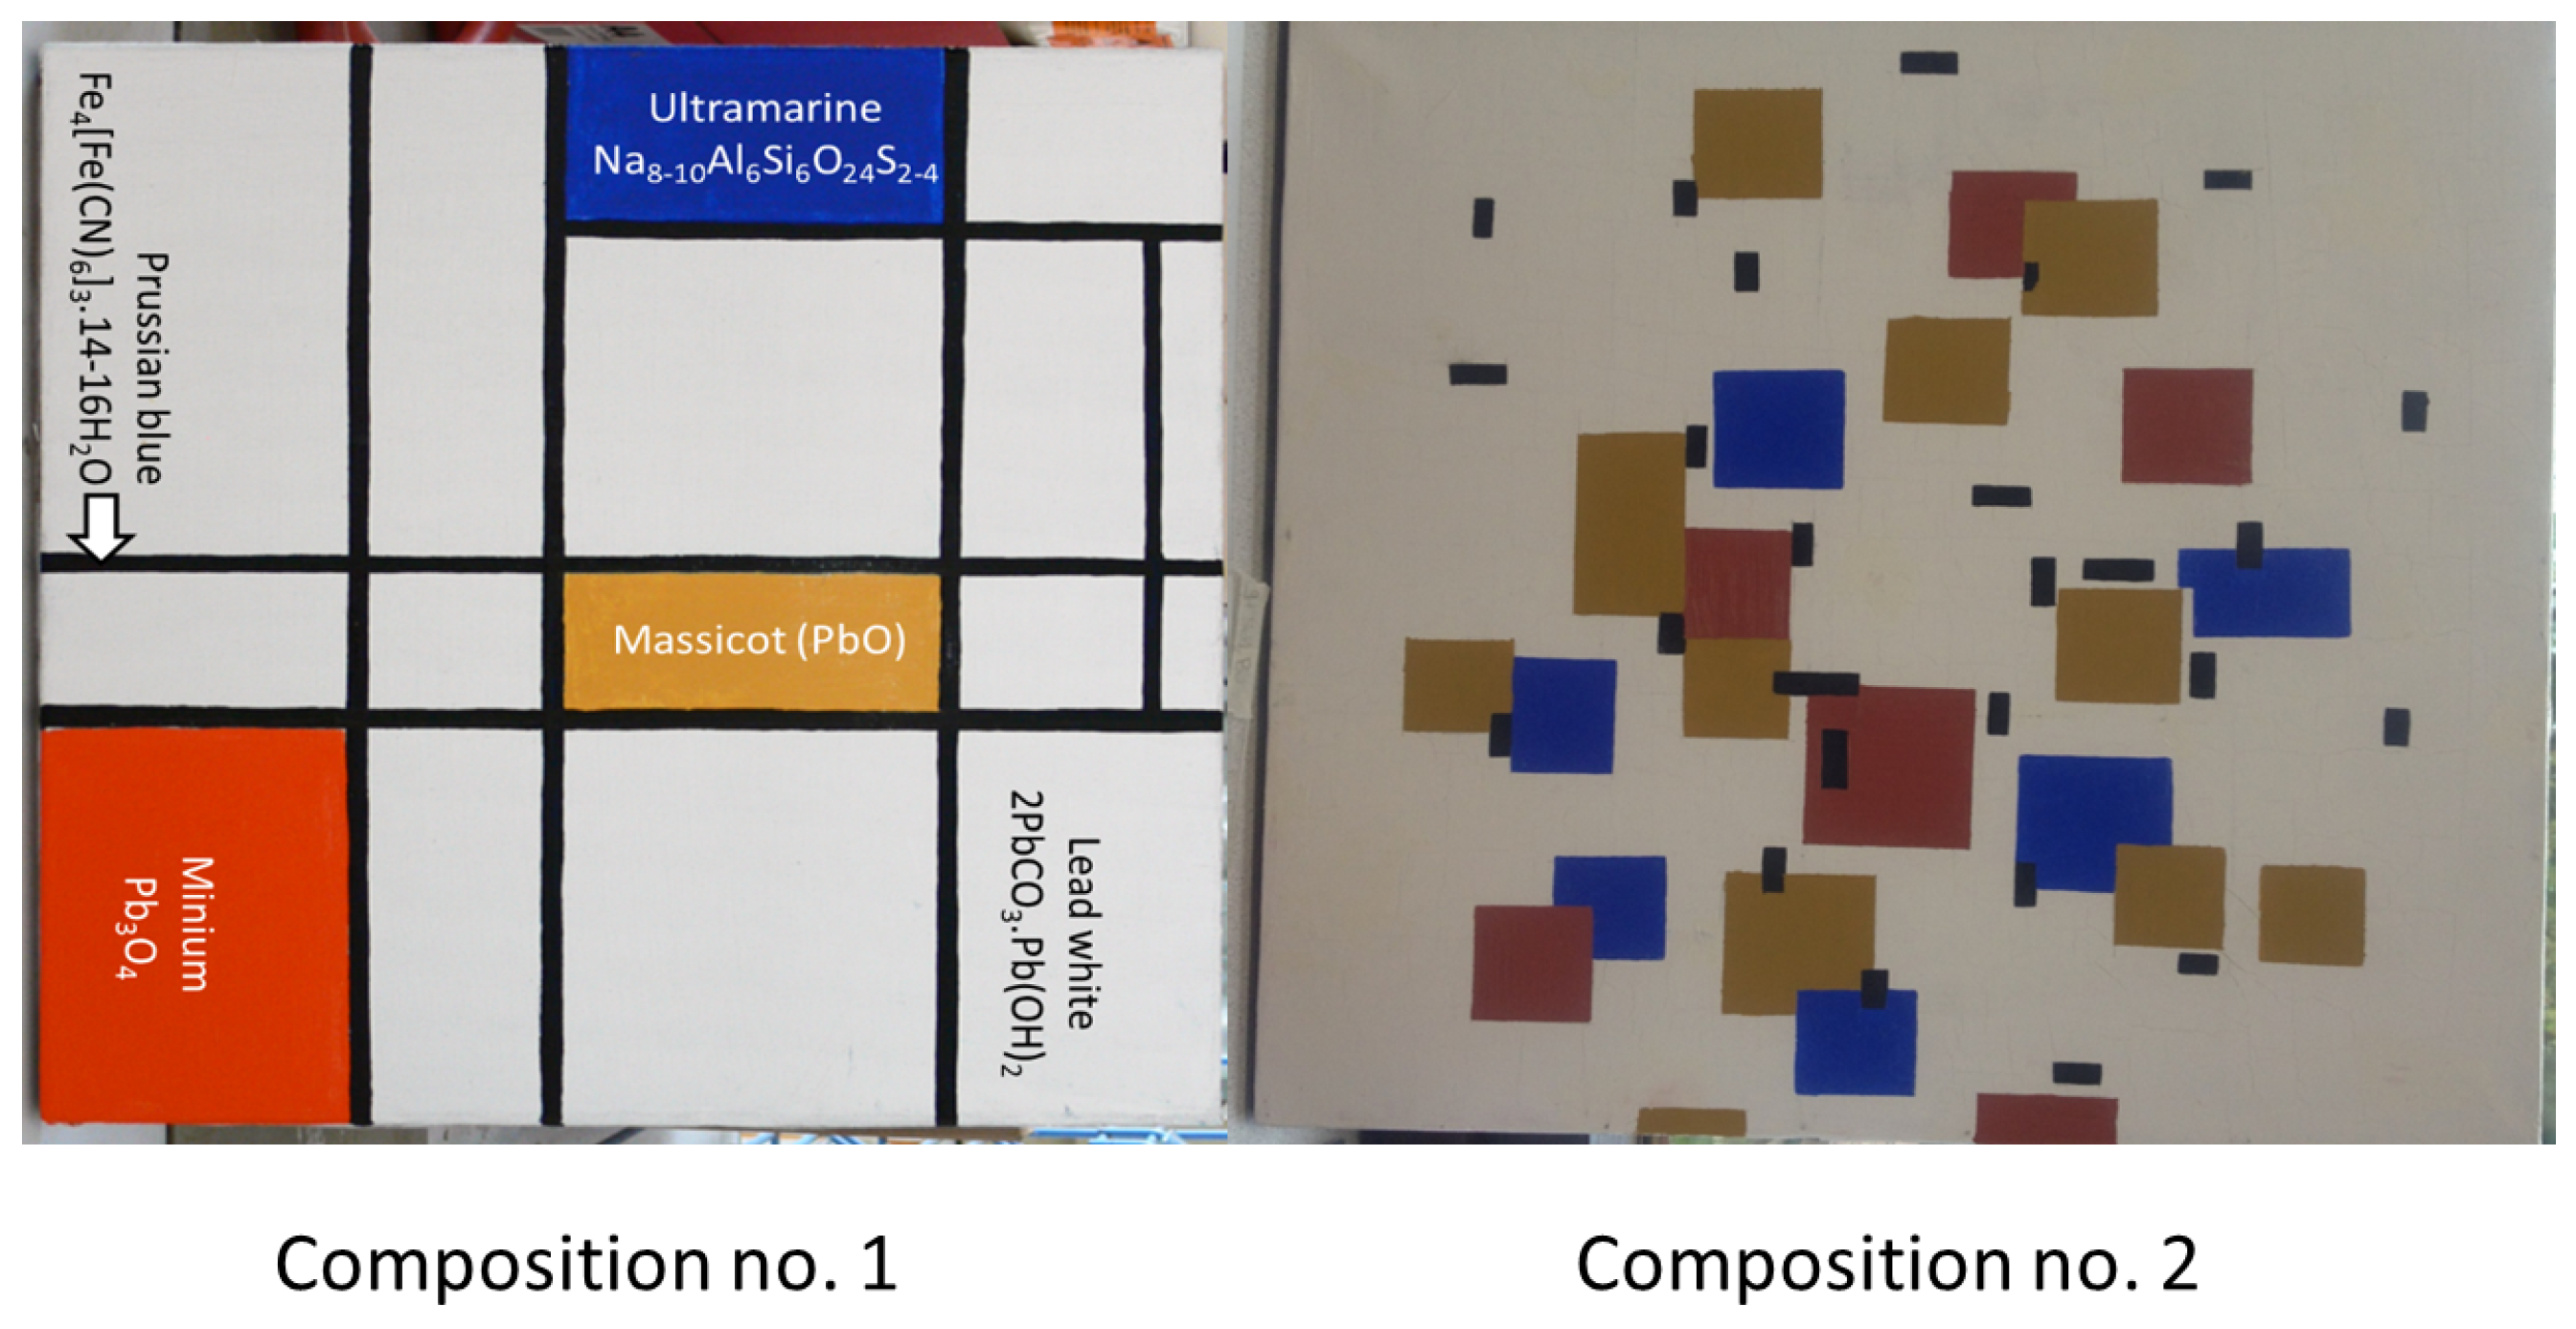
Test Sample Description

The following test samples are used within this manuscript:
Mondrian replica— a replica of a Mondrian painting covered with a thick lead white layer and on top of it a different Mondrian replica. The goal of this sample is to find traces of the replica underneath the lead white layer and to distinguish the different pigments. The overview of both replicas is shown in Figure 2 and the full composition is schematically provided in Figure 3.
19th century Saint Nicholas icon —The Russian house icon depicts Saint Nicholas of Myra and is painted on a wooden panel of 140 × 180 mm [14]. The goal of this test sample is to differentiate between the different blue tinted pigments, visualise the underdrawing pencil marks and to inspect the grain profile of the wooden back structure. Verification results are provided using MA-rFTIR measurements, describing the test sample in [14].
James Abbott McNeill Whistler reproductions Both canvas prototypes are composed of hybrid textile supports with different textile fibres. The original painting techniques are reproduced of the original artwork produced by James Abbott McNeill Whistler in 1871, entitled Portrait of the Painter’s Mother [20]. The main goal for these reproductions is focused on the identification of the canvas structure and to compare the painting strokes. The dimensions of the specimens are 24 cm × 30 cm. The textile support of canvas A was made from hemp and nettle fibres and is shown in Figure 4. This support structure is close to that of the original artwork. While the textile support of canvas B was made from flax and juniper fibres, which is shown in Figure 5. The force used on the paint brush was almost double with respect to the force used in painting A. The method to paint by pressing on the canvas through the paint brush is in contrast to the technique used by the art masters of that time [20].
Marquetries These ancient marquetries are originals of Italian origin with multiple subsurface and surface piercing defects and delaminations. The detection of these defects is the main goal for these test samples, independent of grain and wood type used. Both marquetries are shown in Figure 6, where some of the larger defects are visible.

3. Results and Discussion

In the following section, the results of the experimental measurements are subdivided between the different test samples and shortly discussed focusing on a comparison between IR-B and IRA/C data.

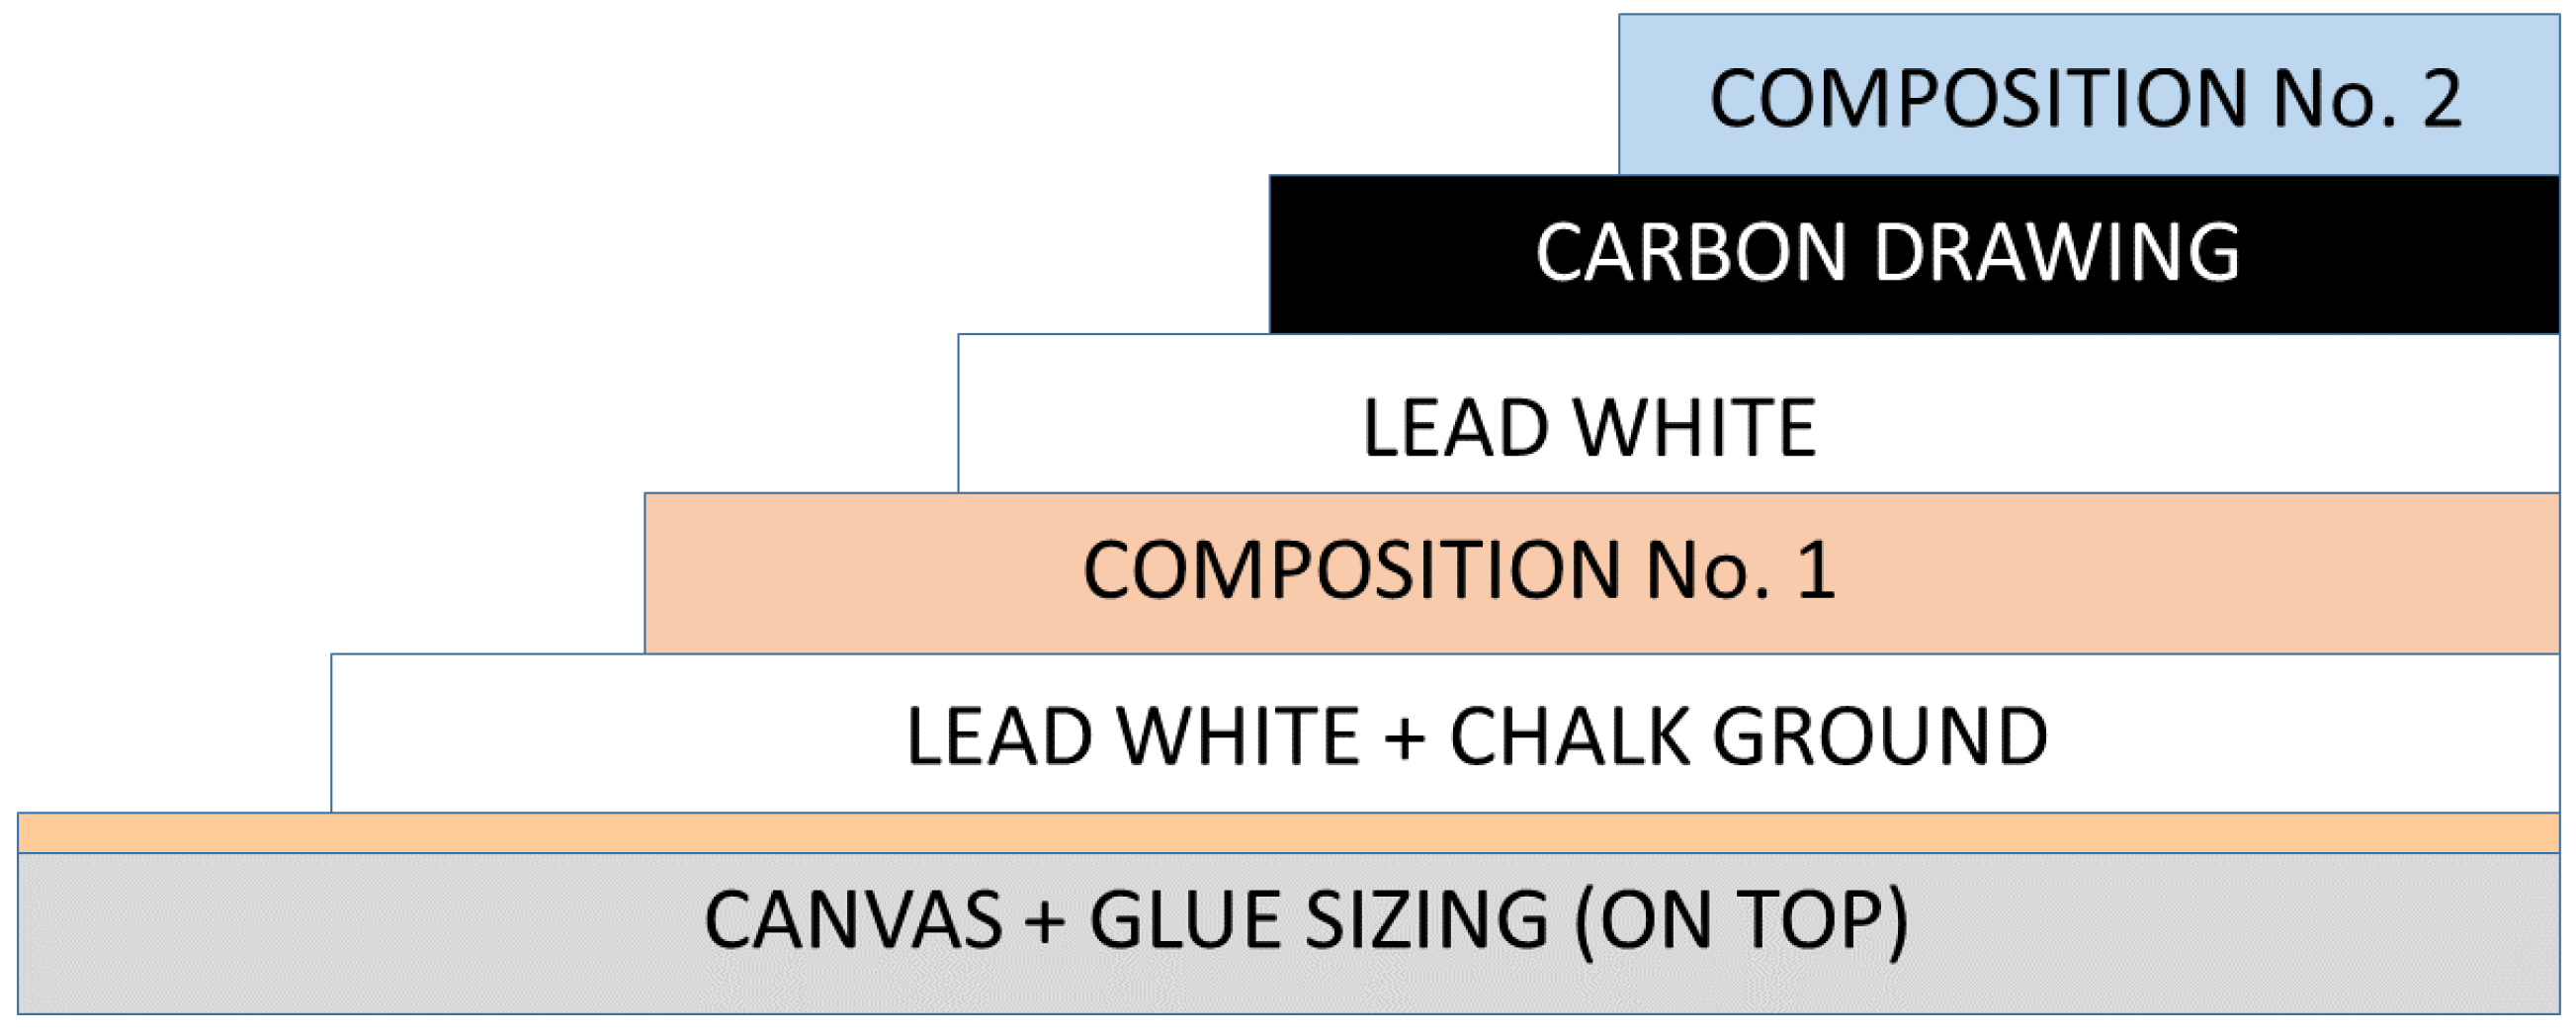
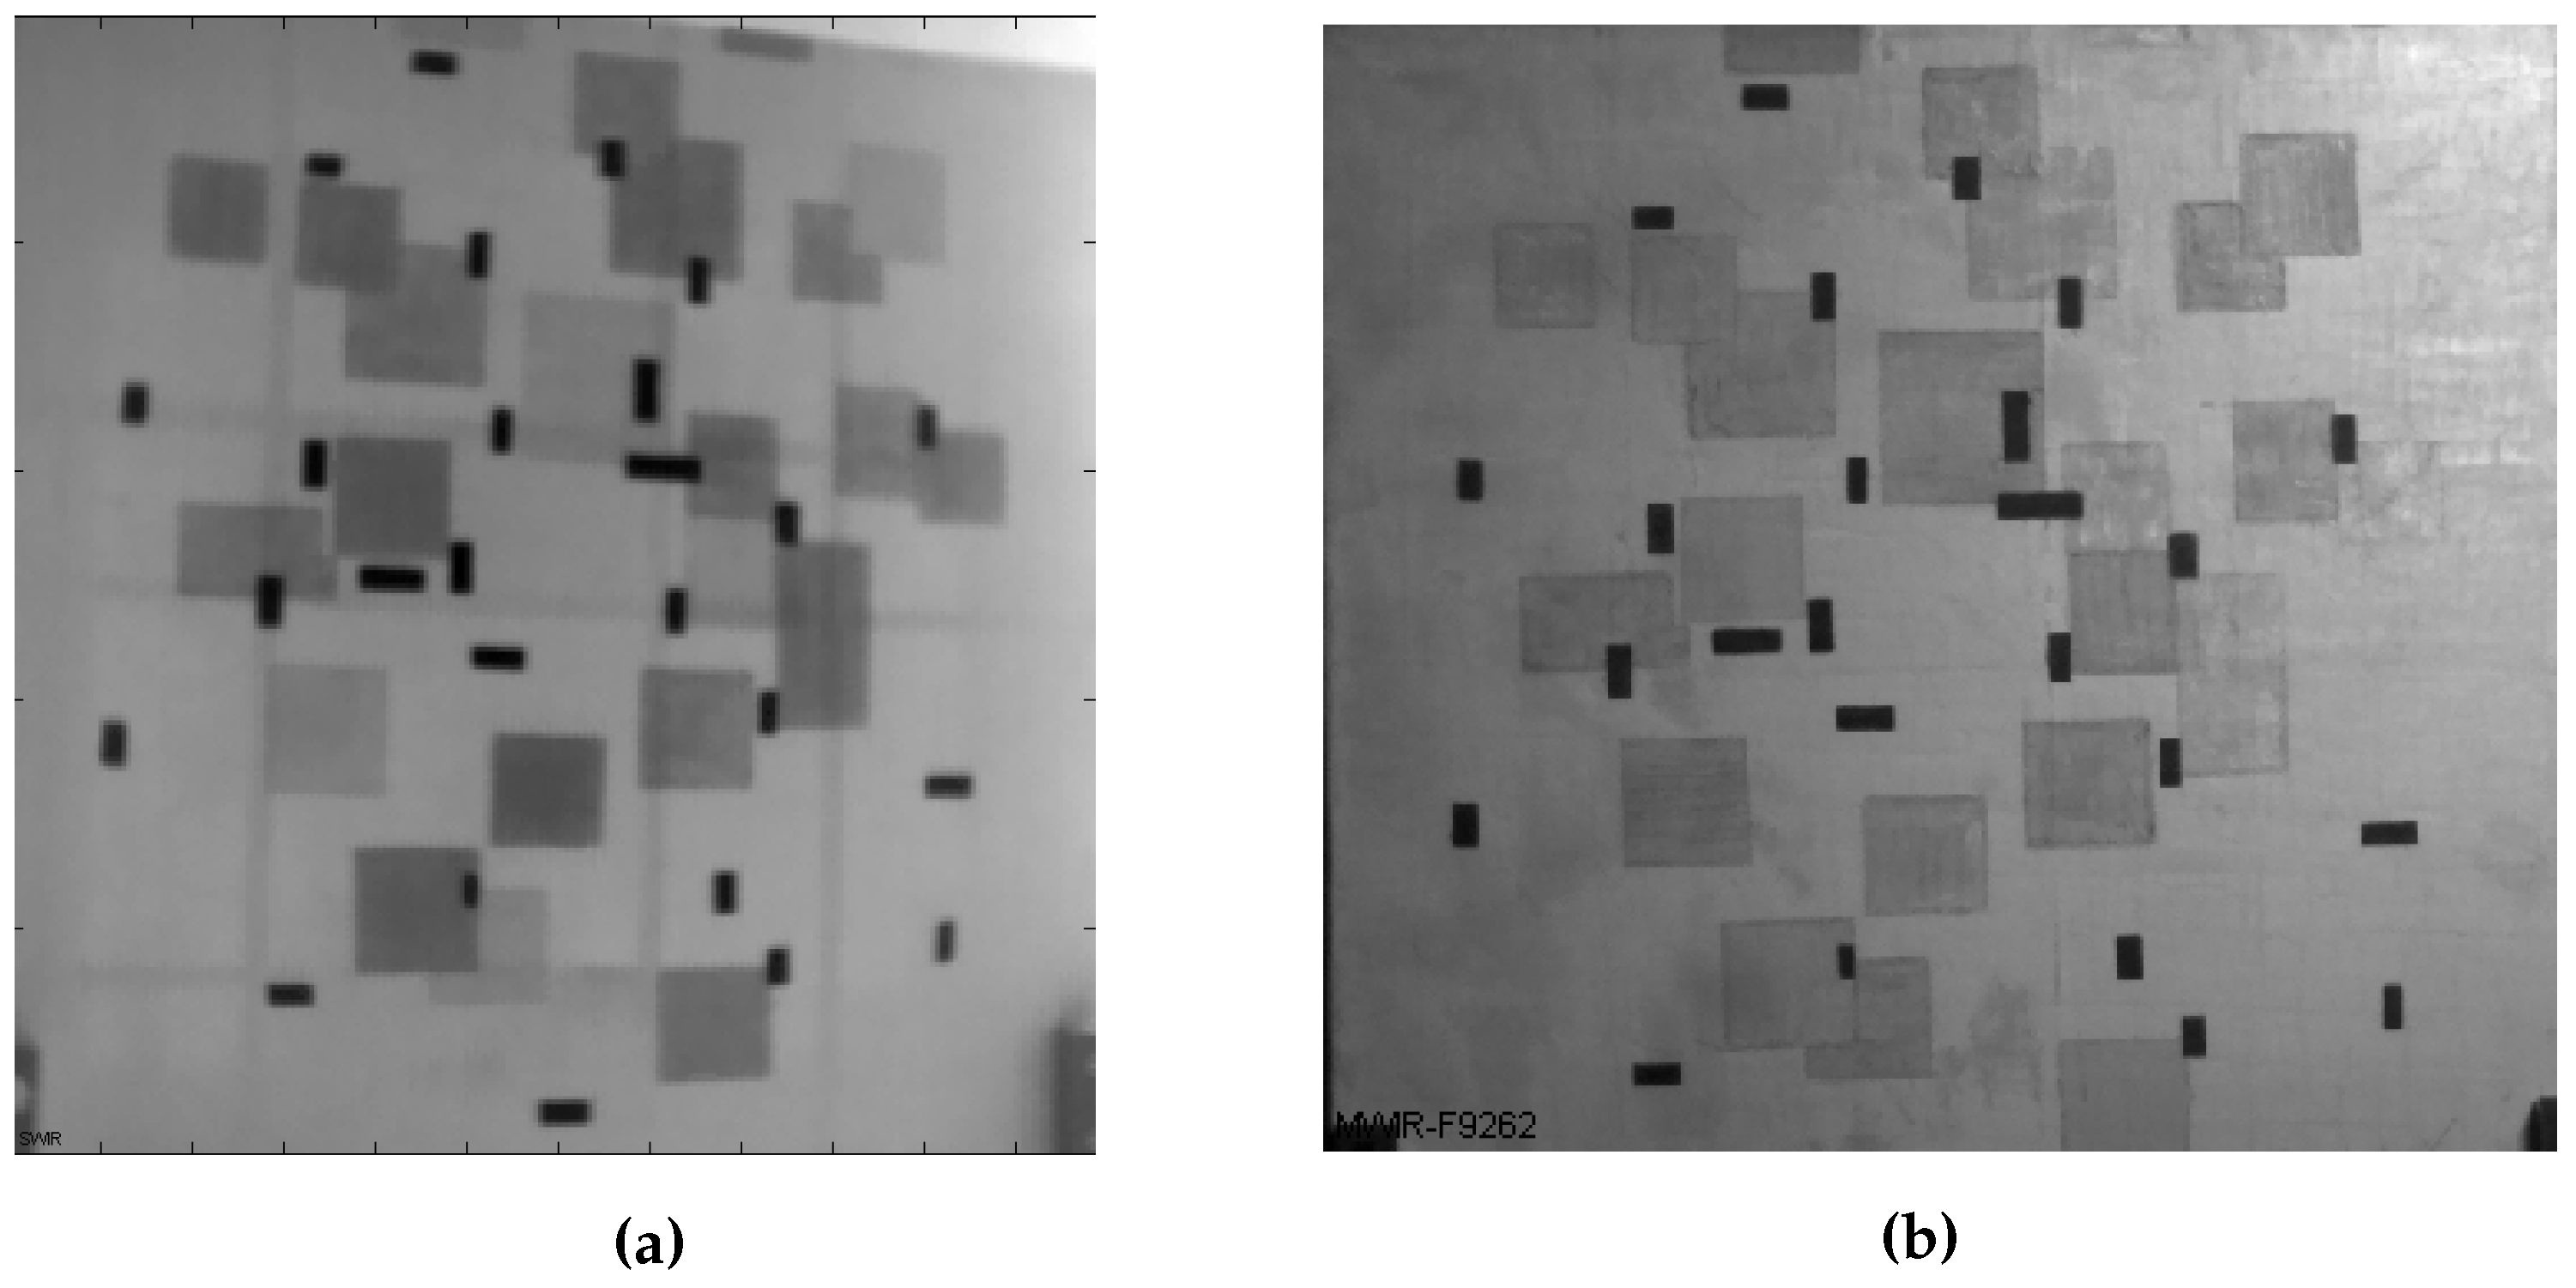
3.1. Mondrian: Underdrawing

The IR-A results, presented in Figure 7a, are performed with halogen illumination and give a clear view of the prussian blue lines of the composition below the lead white cover layer. The massicot and ultramarine pigments appear only vaguely.
The IR-B+C’ results, measured with the FLIR X6540sc camera, are subdivided in reflectivity (IR-B) and active thermography (IR-C’) measurements:

IR-B reflectivity:

The measurements deliver the best result when the filter around 2.2 μ m is used in combination with halogen illumination. The results are presented in Figure 7b, with prior knowledge, a few of the prussian blue lines can be distinguished, but the results remain vague. There could be concluded that it is not possible to distinguish a subsurface composition, and the results are worse with respect to the IR-A measurements.

IR-C’ active thermography:
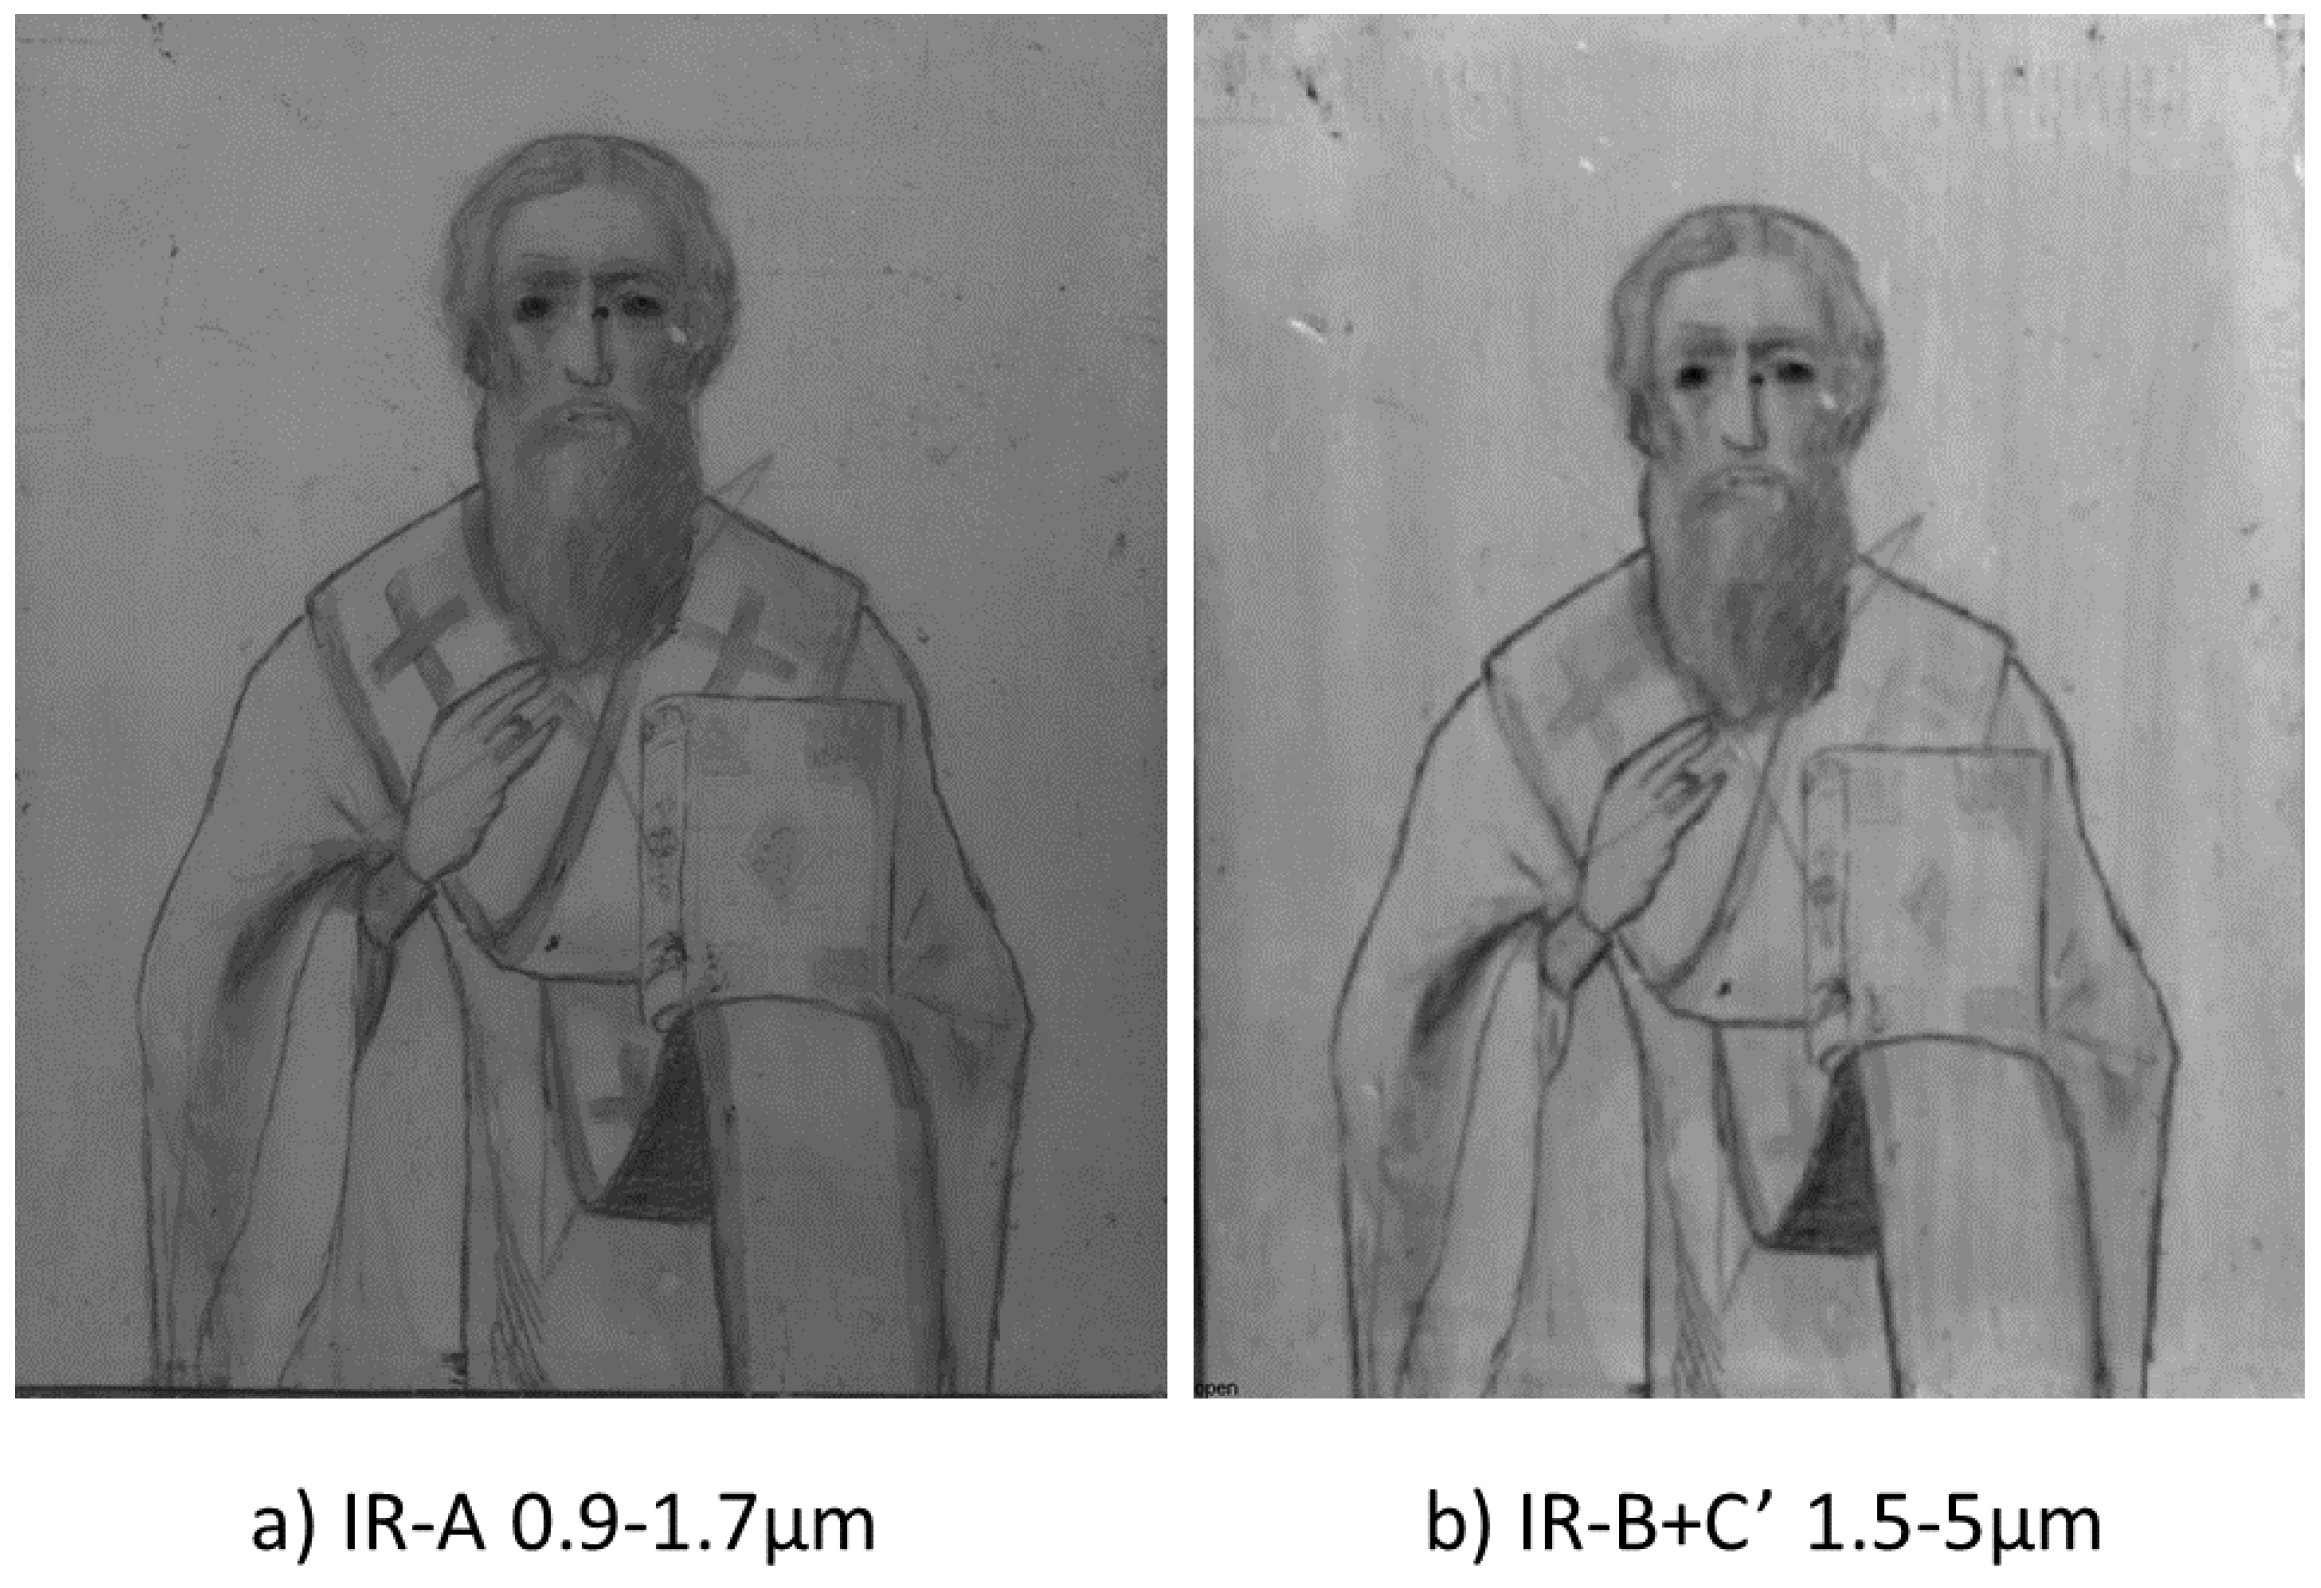
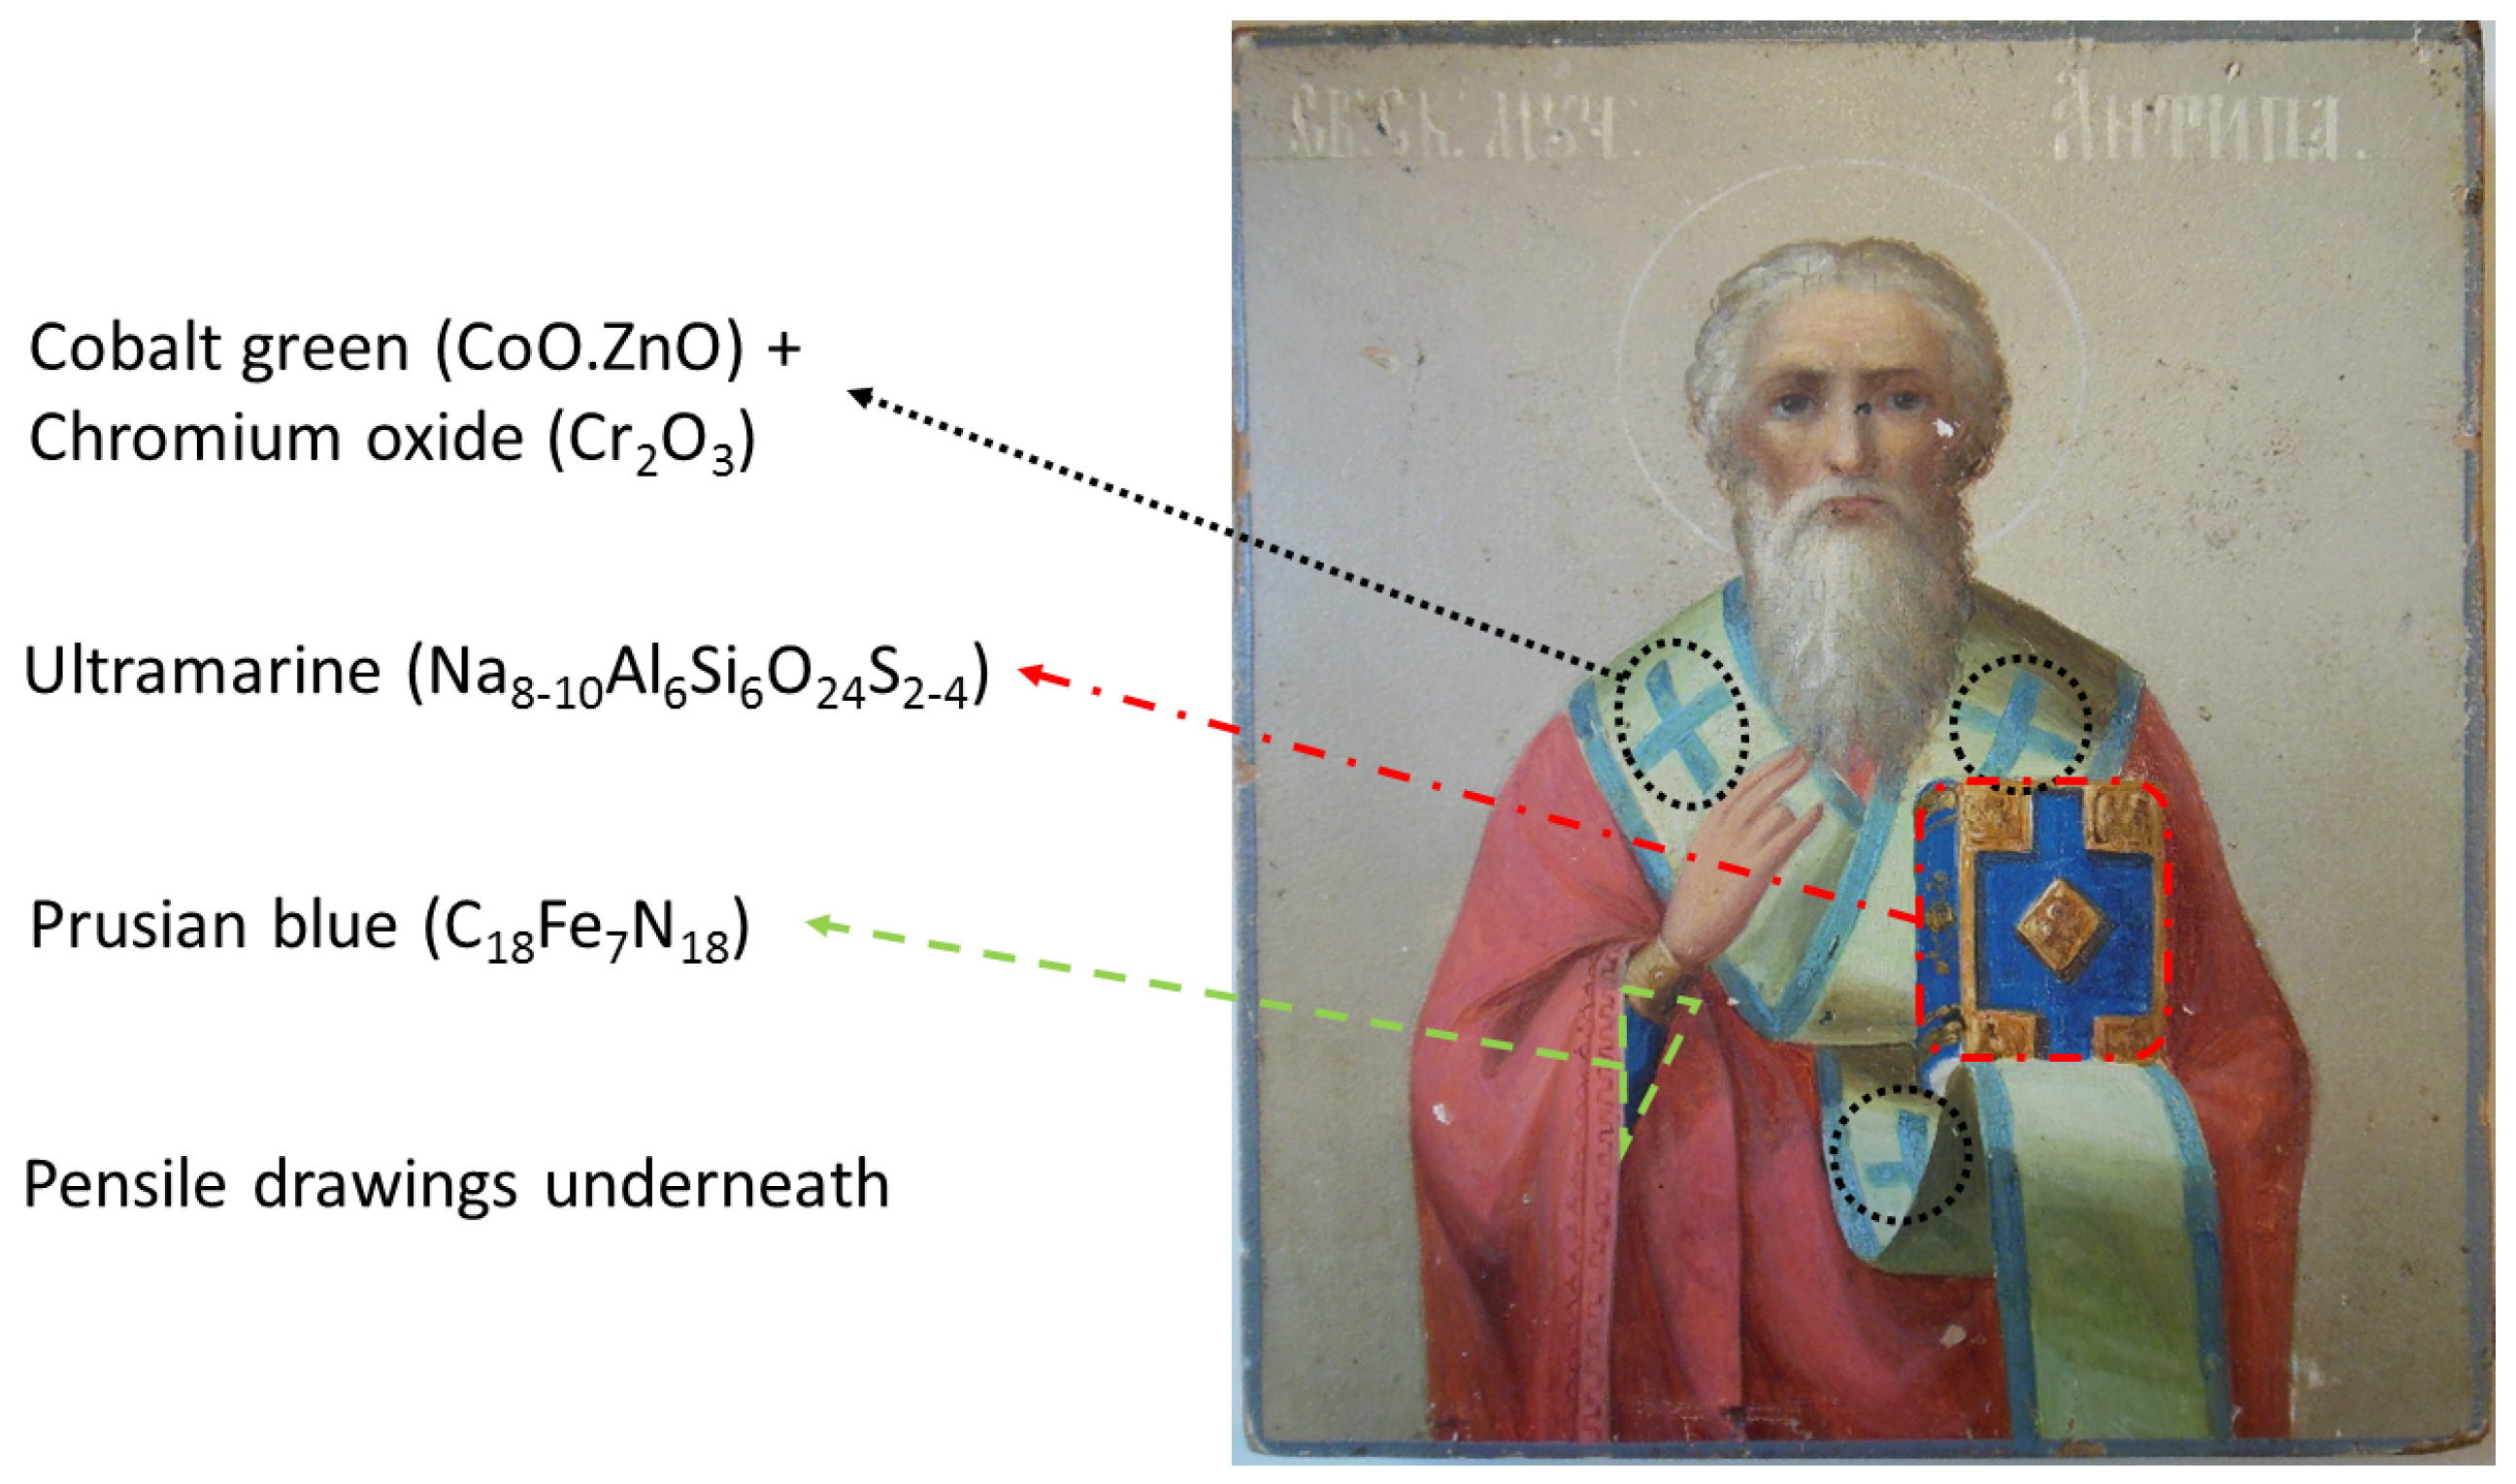
For the thermal inspection, the camera is used without camera filters within the IR-C’ spectrum. First, the halogen excitation source is used as active heat source directly aimed at the painting, exposing the painting to a sine wave excitation of 0.1 Hz, blocking the thermal power using a double glass filter. The result is shown in Figure 8a after Fourier transformation and phase analysis. The prussian blue lines are visible, but excessive post-processing is needed.
A second similar inspection is performed using pulsed thermography with a high power Xenon flash excitation of 5 ms. The results, post-processed with Principal Component Analysis (PCA) (bin 3),are presented in Figure 8b. It can be seen that not only the prussian blue lines but the massicot and ultramarine pigments could be clearly seen as well and the minium pigment could be vaguely distinguished. This can conclude that it is possible to evaluate the full sub-layered composition and that the results are similar or even better than the commonly used IR-A reflectography measurement.
With those results, we can conclude that the inspection of composition no. 1 is possible with a similar or even better accuracy using active thermography and an IR-B+C’ camera with respect to the well-known IR-A reflectography technique. It should be marked that the selected test sample contains a very thick intermediate layer of lead white. Unfortunately, with state-of-the-art techniques, those paintings below a painting with a thick lead white layer are very difficult to inspect. With these results, we can conclude that the use of active thermography can provide a relatively fast way to evaluate the presence of sub-layer compositions.

3.2. Icon: Pigments

The Russian icon will be used to first compare the ability to see pencil drawings within the IR-A and IR-B+C’ spectra and second to identify the different blue coloured pigments as indicated in Figure 9. Therefore, a comparison between the IR-B+C’ and MA-rFTIR results will be made to evaluate the received accuracy of the IR-B+C’device.

Reflectography:

An IR-A result of the Russian icon is shown in Figure 10a, where the halogen illumination source is used. It is shown that the pencil drawings occur prominently, including some details that were not visible in the regular photograph. For example, the beard of the icon contains a significant amount of pencil details and a cross becomes visible. The pencil marks absorb the illuminated radiation in contrast to the paint, which becomes semi-transparent. The paint is still semi-opaque, which makes it possible to compare the pencil drawing with the painted icon on top.
The IR-B+C’ reflectography alternative is shown in Figure 10b. A similar amount of detail in the pencil drawings can be observed although some horizontal marks (head, eyes and chin) become transparent, which were visible in Figure 10a. It should be noted that the pencil colouring is more prominent due to the higher transparency of the pigments in general. It should be noted that these results are an average of the full sensitive spectrum. By subdividing the full spectrum in smaller sub-spectra, multi-spectral analysis might deliver more in-depth information and increase the accuracy.
A multi-spectral analysis of the IR-B+C’ spectrum is performed using the four filters. The results are shown in Figure 11, which could be compared with similar measurements performed by the MA-rFTIR spectroscopy measurements of Figure 12. Both results are consistent with respect to the pigment appearance. The cobalt green pigment is only fully transparent around approximately 2.1 μ m . For lower and higher wavelengths, the pigment absorbs the incoming radiation and differentiates from the background. The utramarine and prussian blue in contrast behave differently. The ultramarine on the book is fully transparent in the IR-C’ spectrum and the prussian blue, which looks visually very similar, absorbs more radiation in the IR-C’ spectrum. In this way, there can be made a clear difference between the three blue pigments.

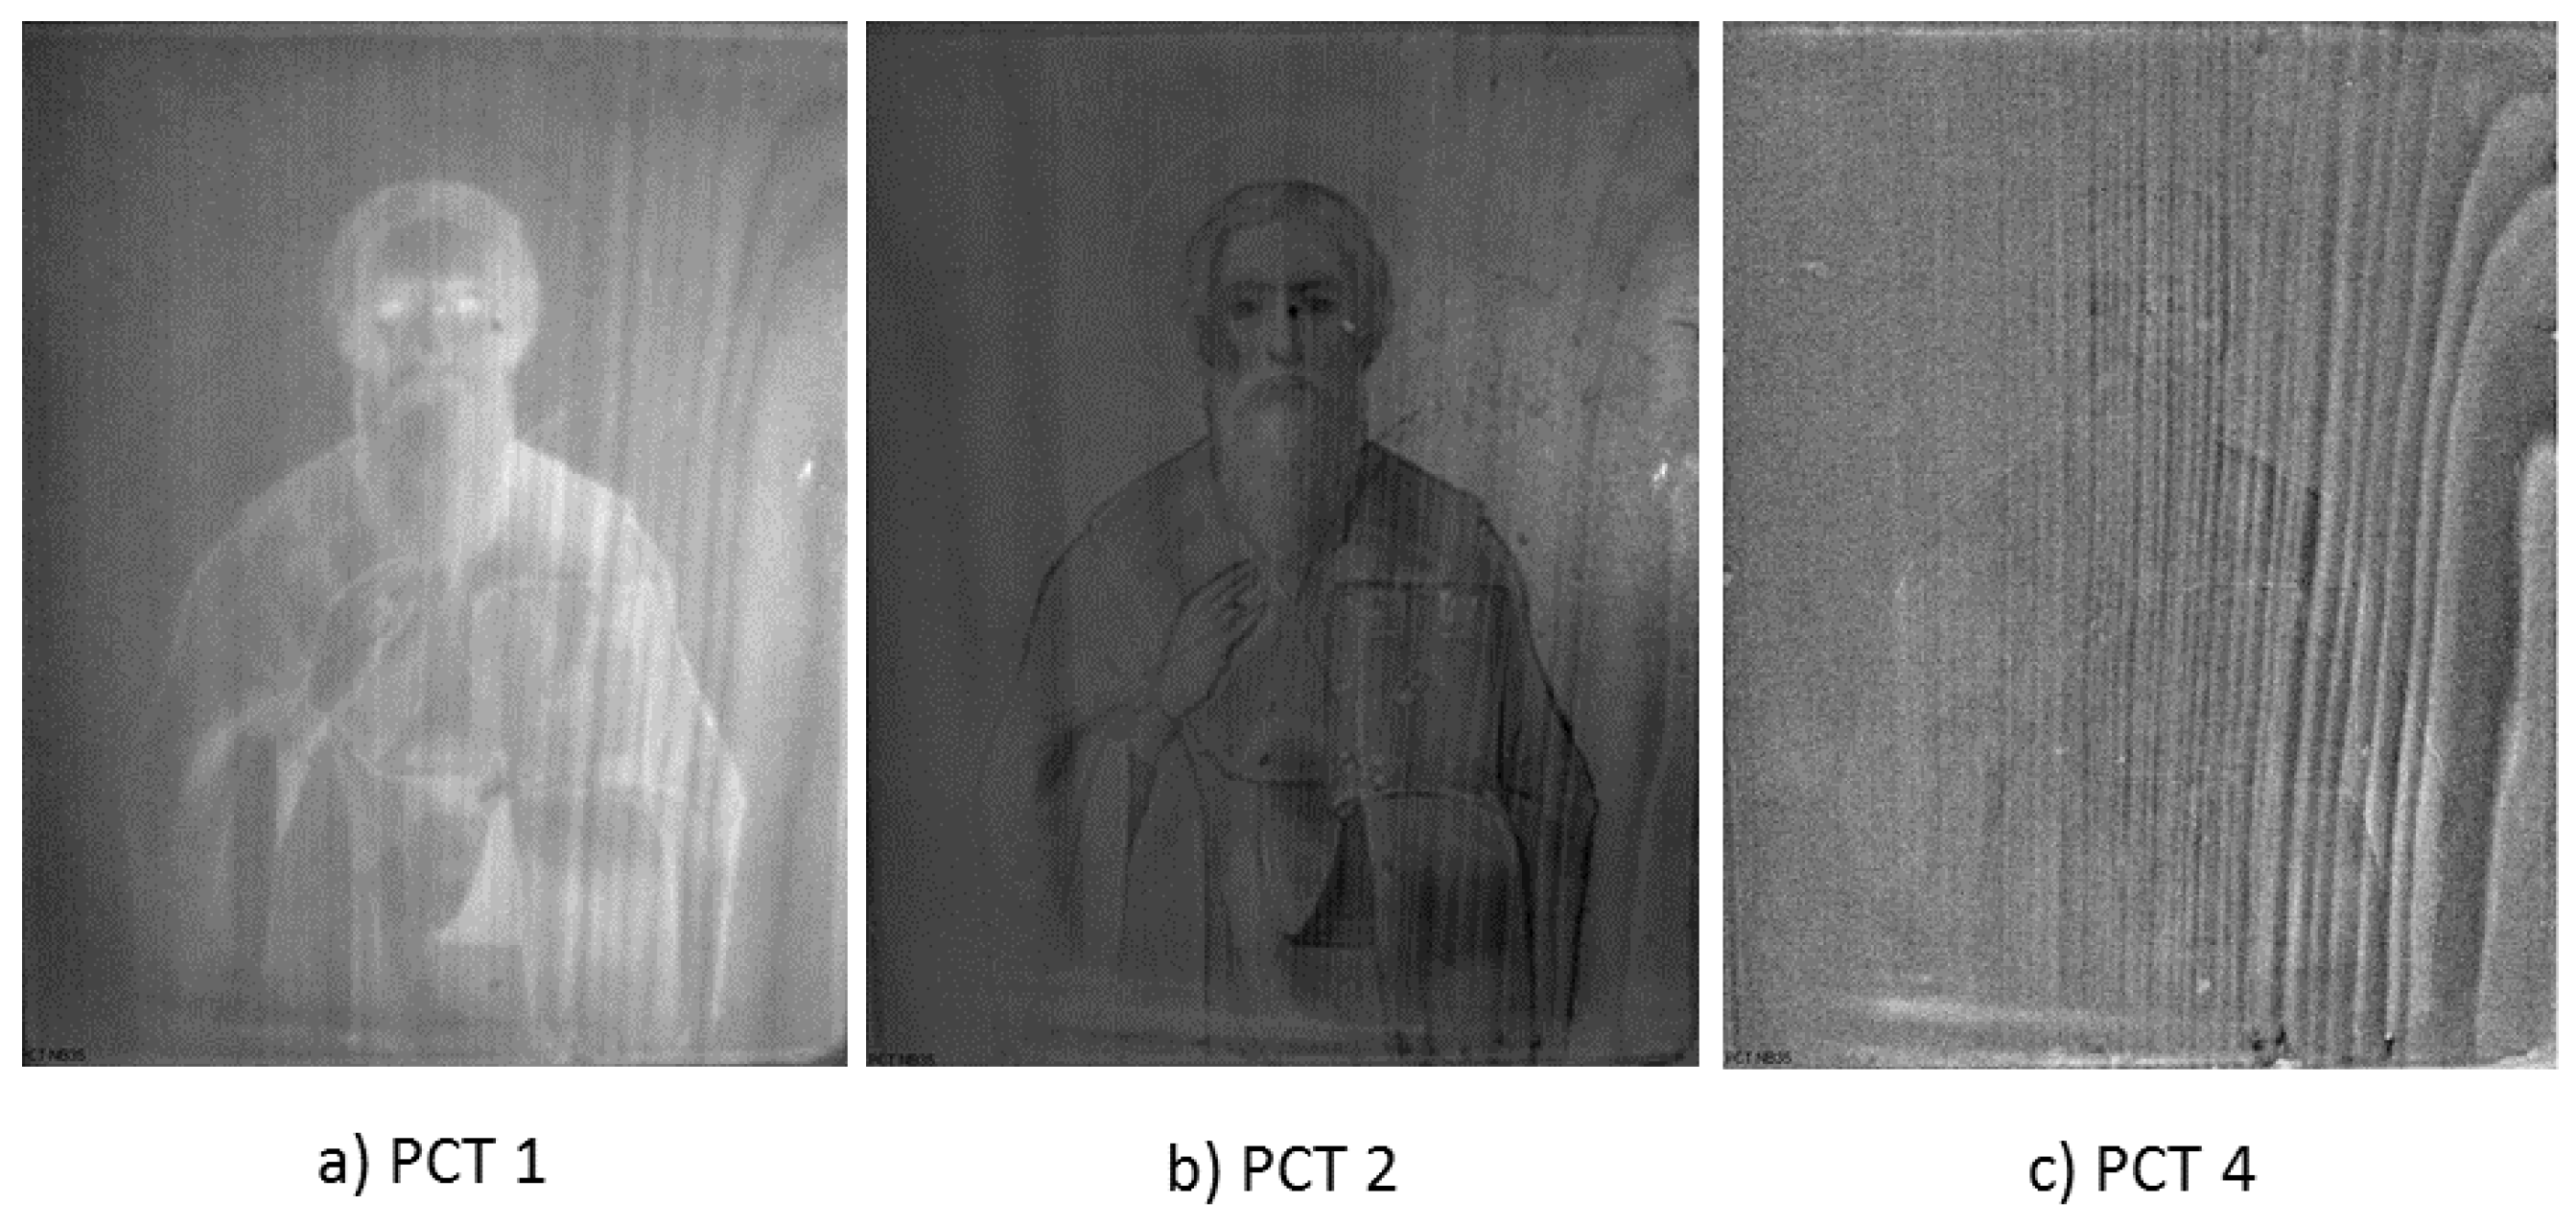
Active thermography:

The active thermography measurements are performed on the sample using a low power flash excitation of 400 J and principal component thermography (PCT). Using PCT, the measured data is divided into principal components that are used to disseminate certain artefacts. The wood grain structure can be disseminated from the picture using the same MWIR camera within the IR-C’ spectral range only and not looking to the illumination, but to the thermal diffusion. This is shown in Figure 13, where in (b) only the picture is visible and in (c) only the grain structure. This is an added value that is not possible with MA-rFTIR or IR-A measurement systems. Only the relevant principal component bins are shown in Figure 13.
To summarise, with respect to the pencil drawings, it is shown in Figure 10 that the amount of detail that can be seen is similar for the IR-A and IR-B(+C’) results, with the difference that the pigments are more transparent in the IR-B reflectography results. Hereby, it is shown that the IR-B+C’ system combines not only IRR with active thermography to inspect the background panel, but in addition provides the ability to perform fast, full-field spectral analysis in the unique IR-B spectral range.

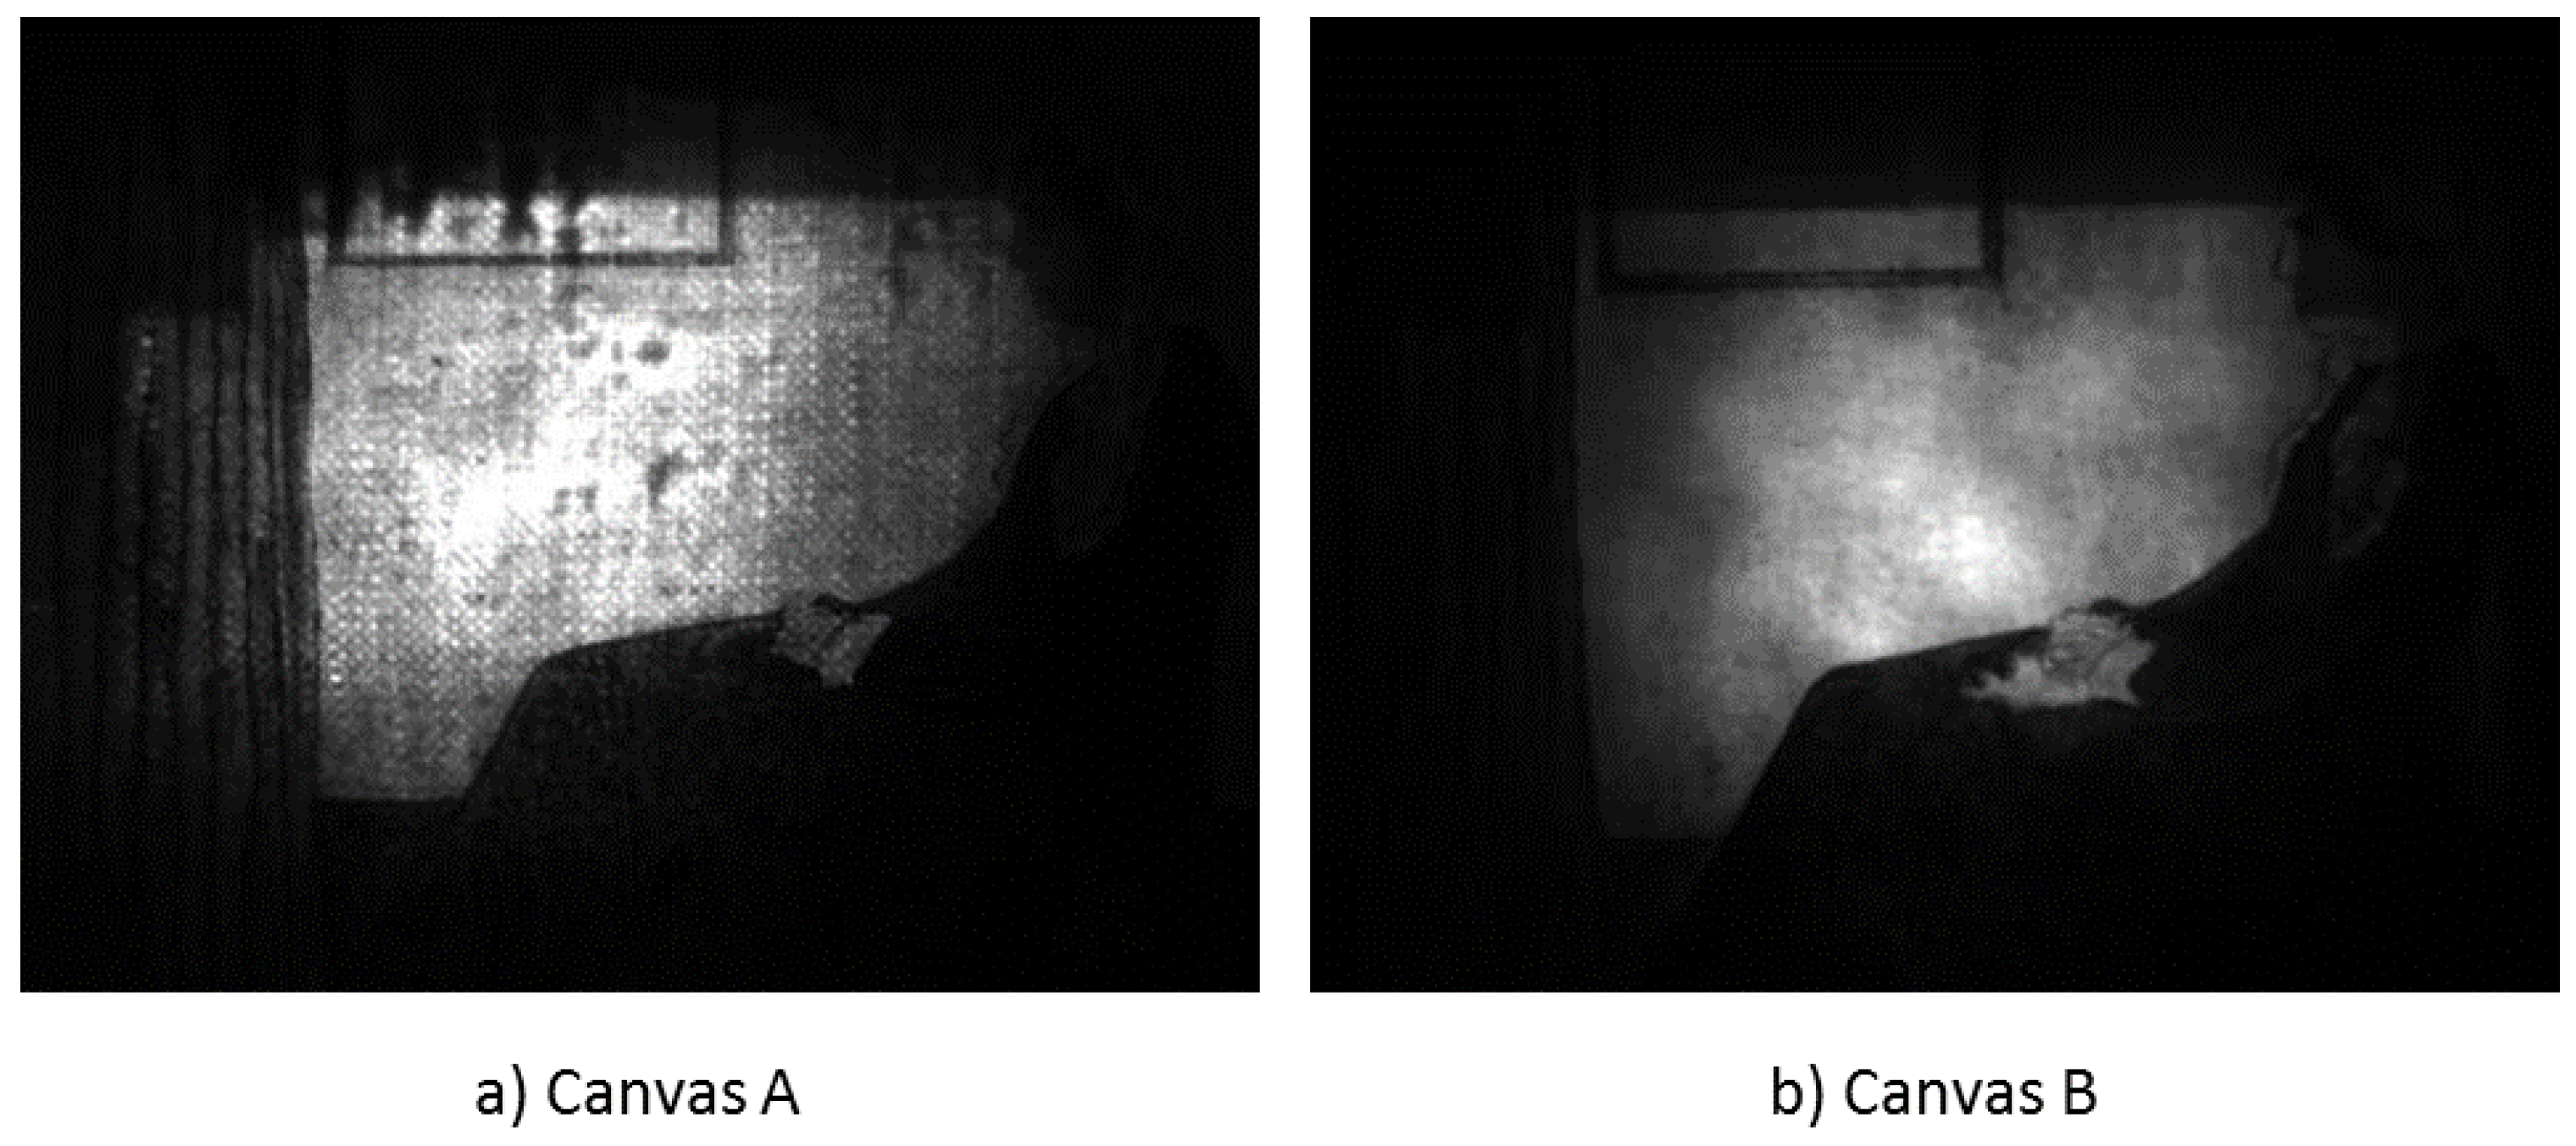
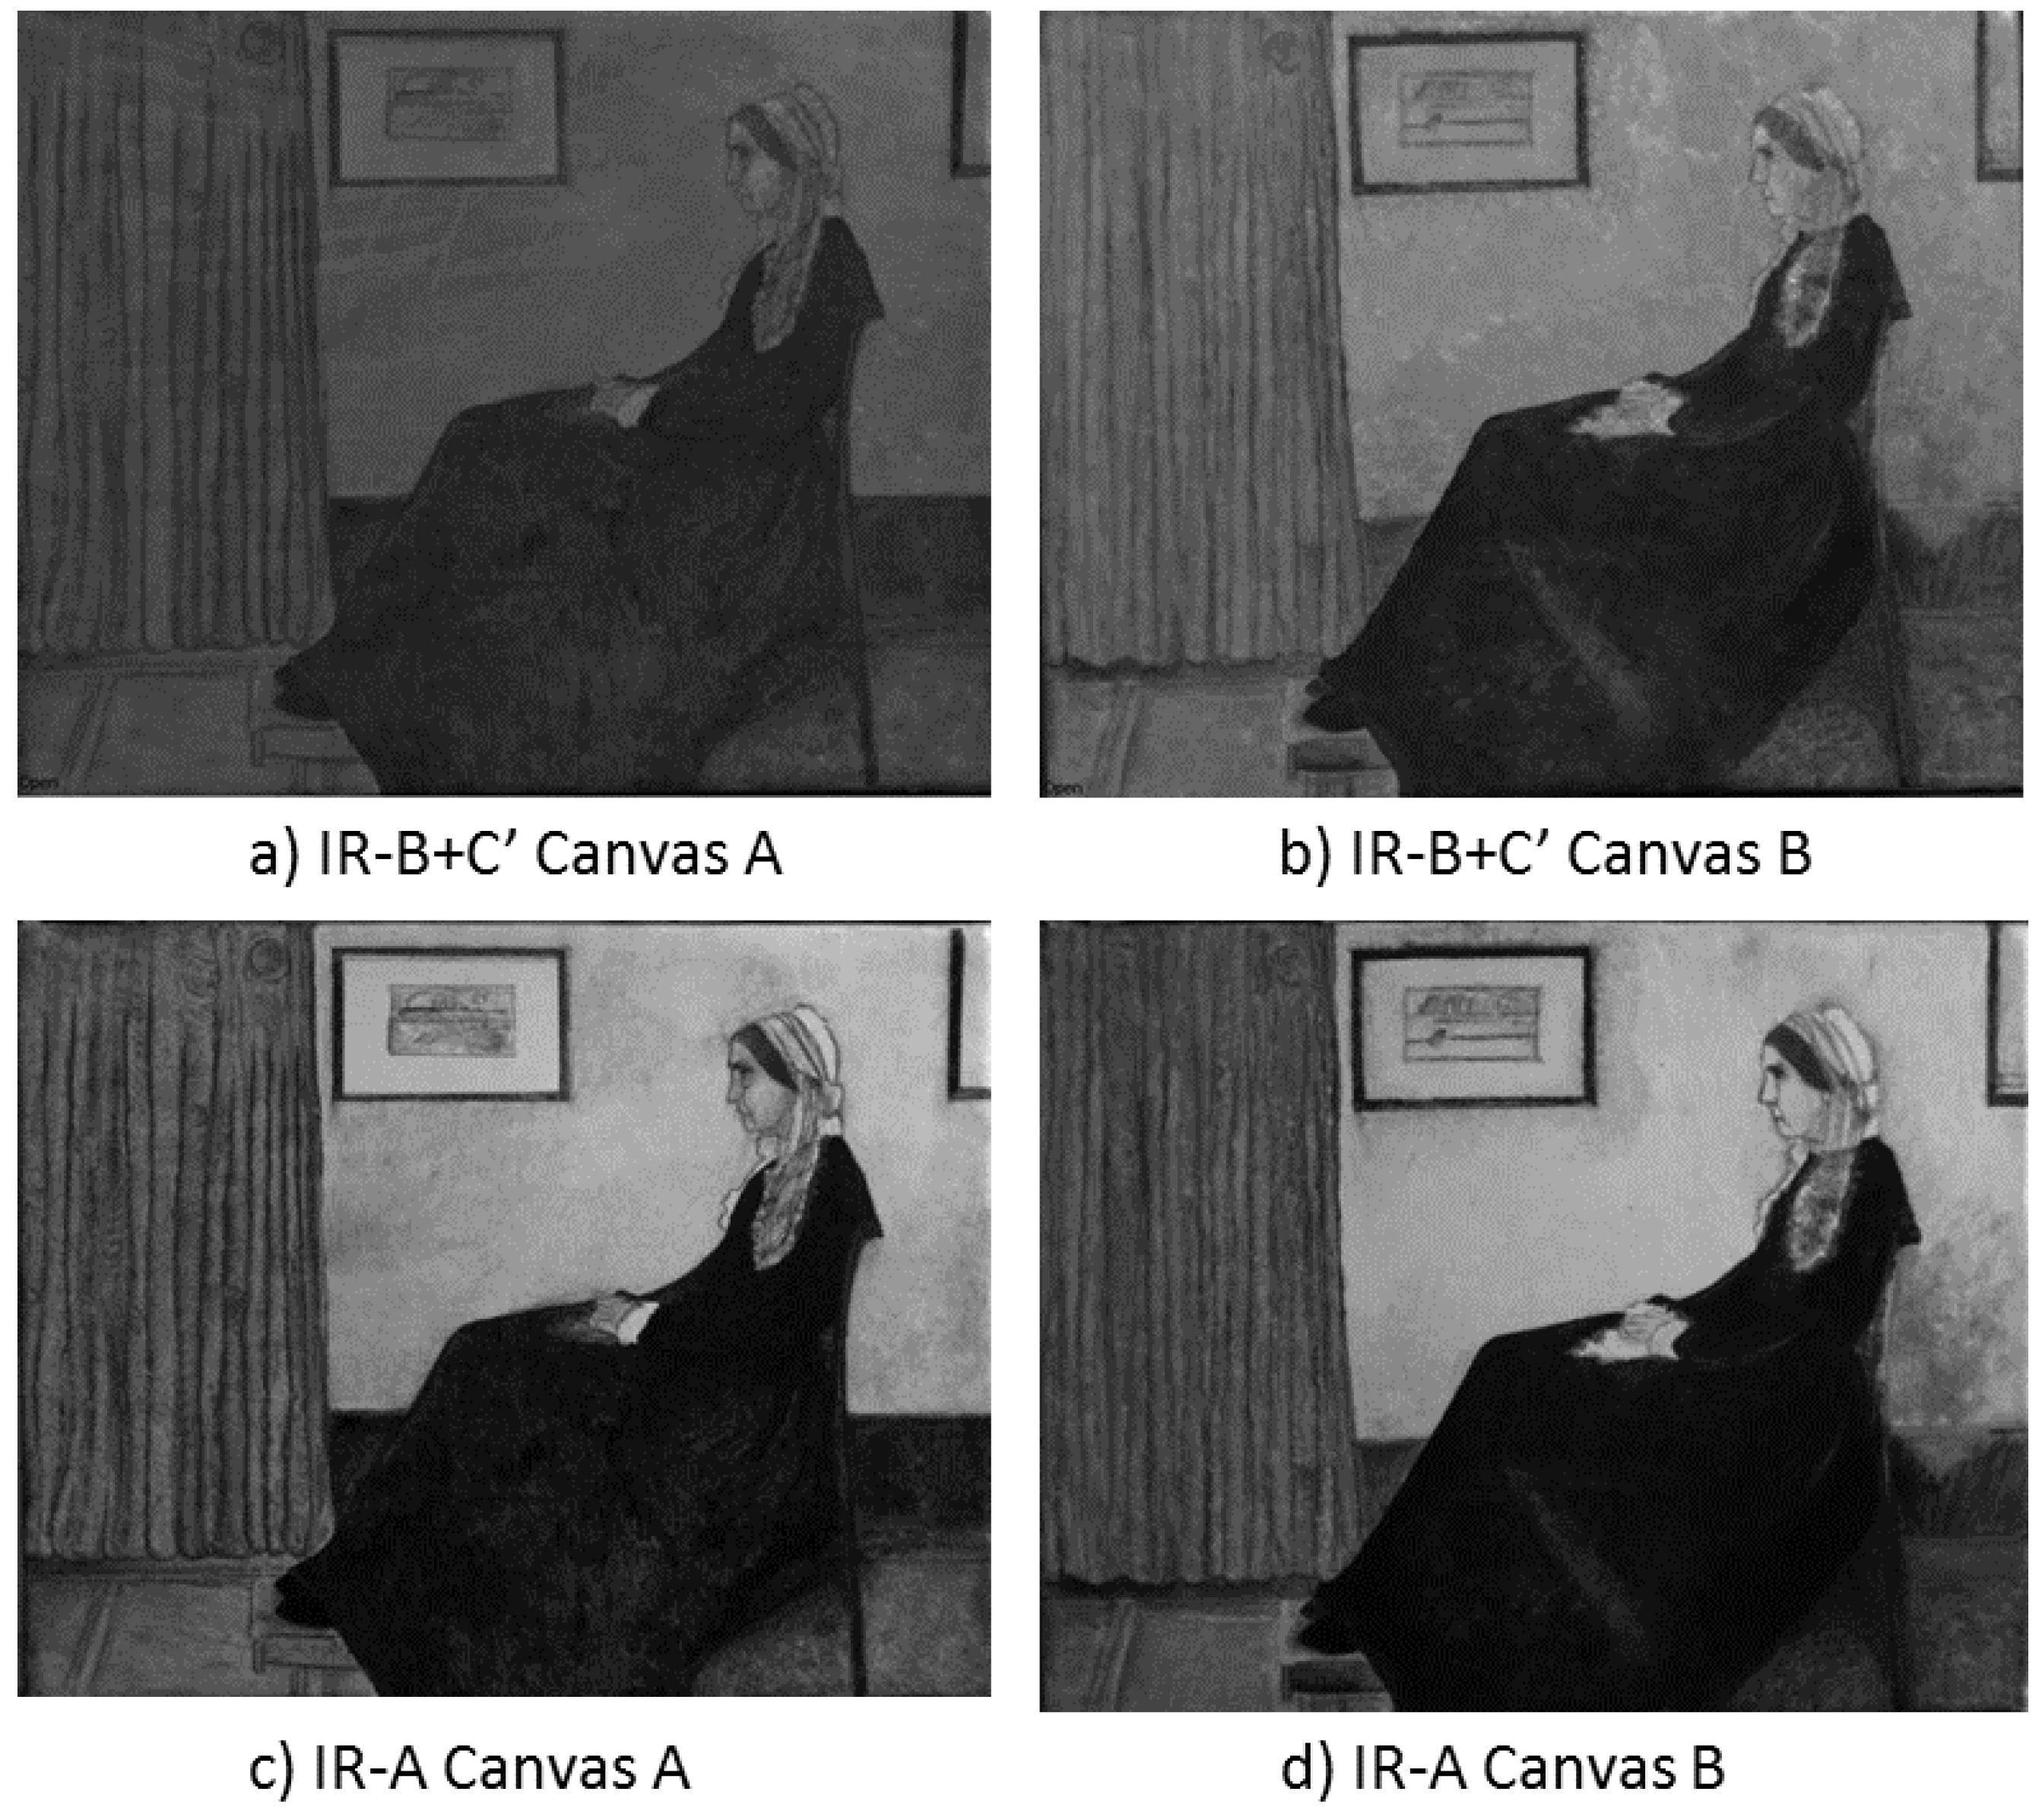
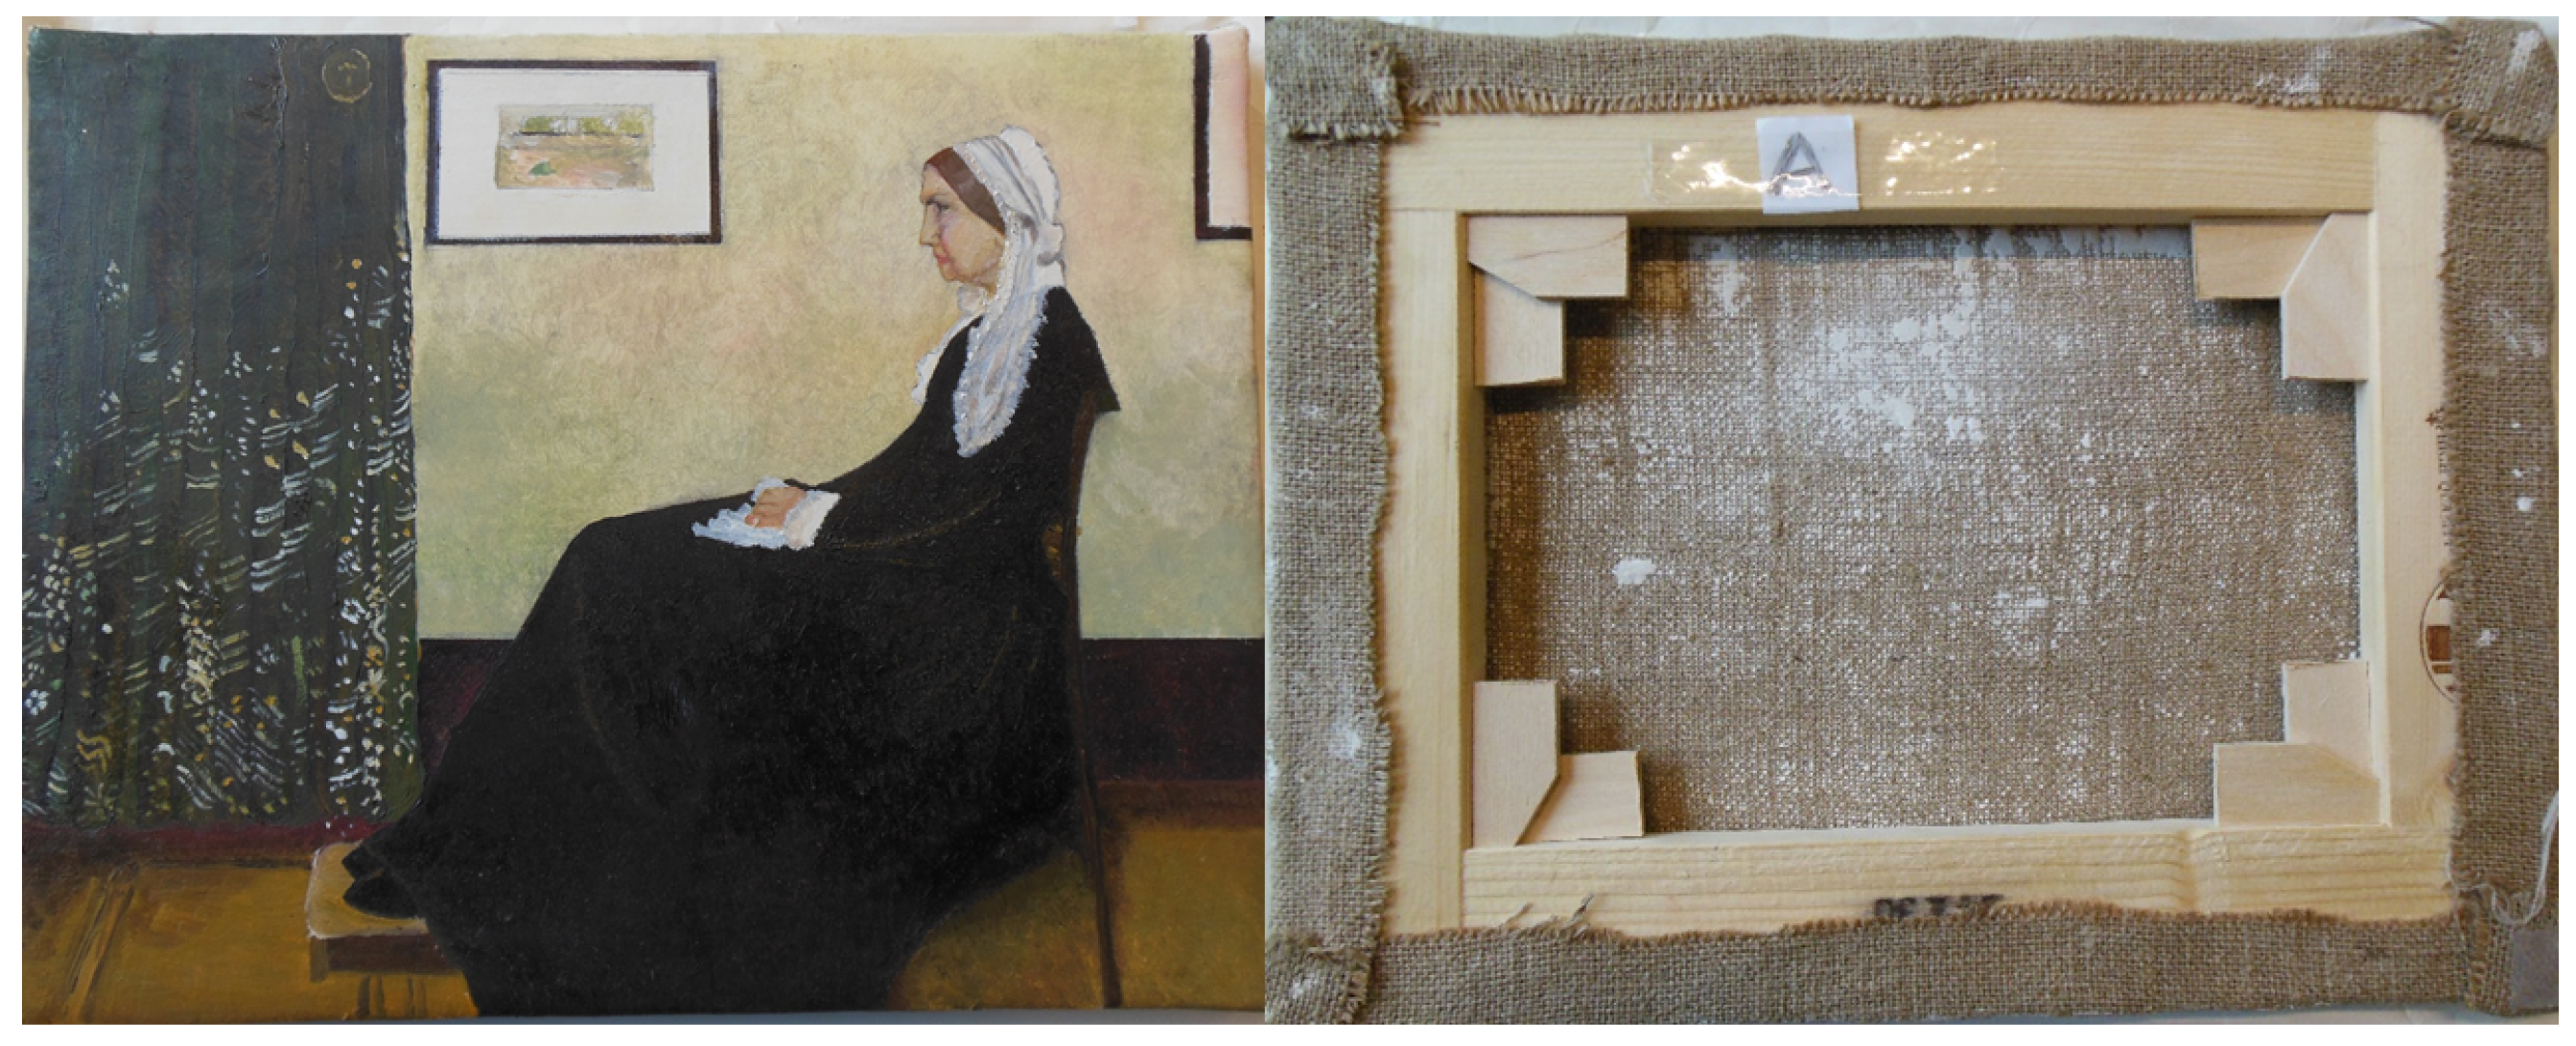
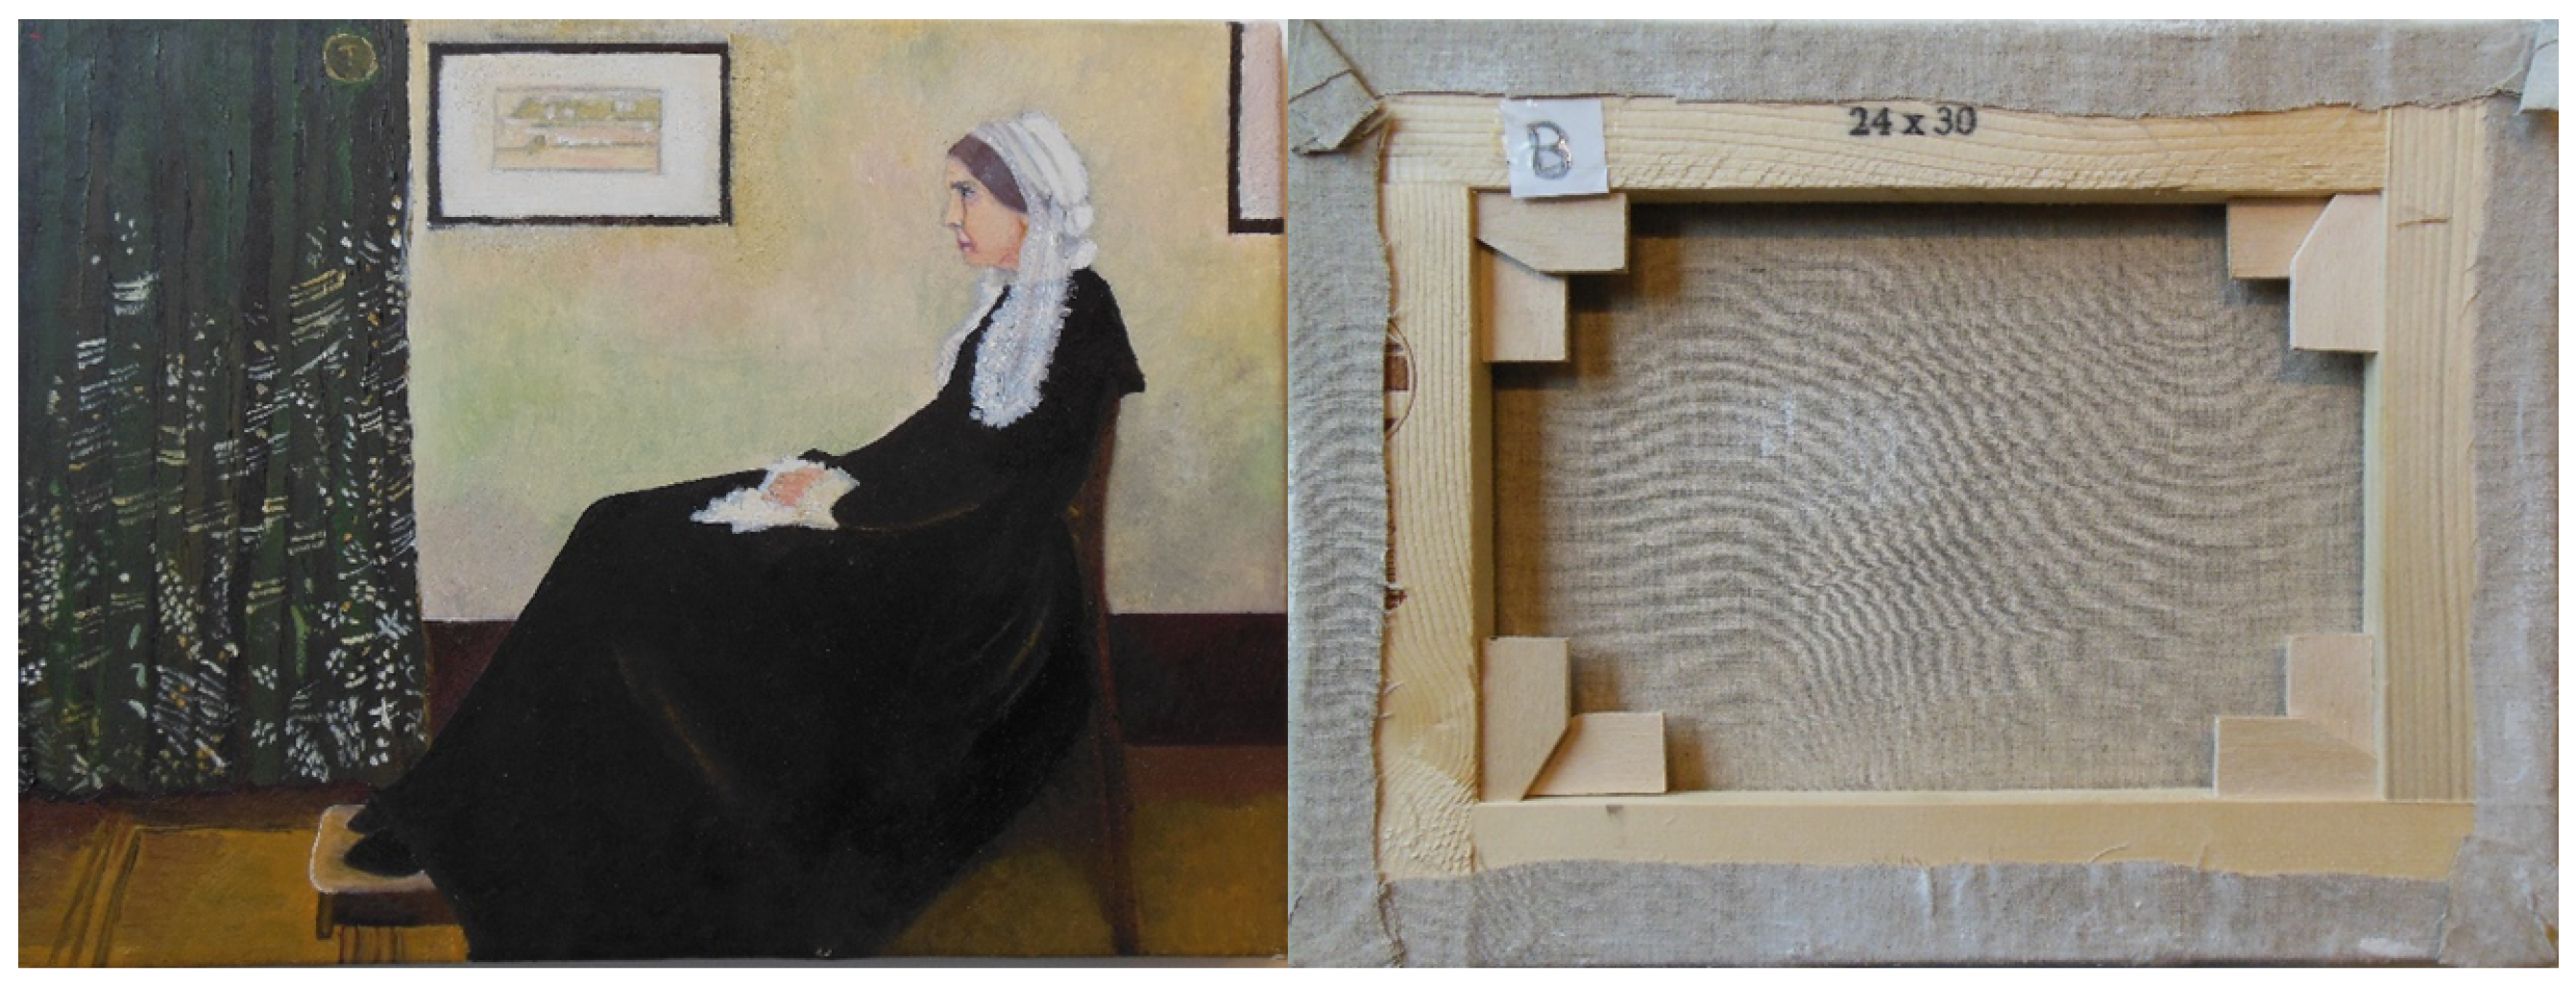
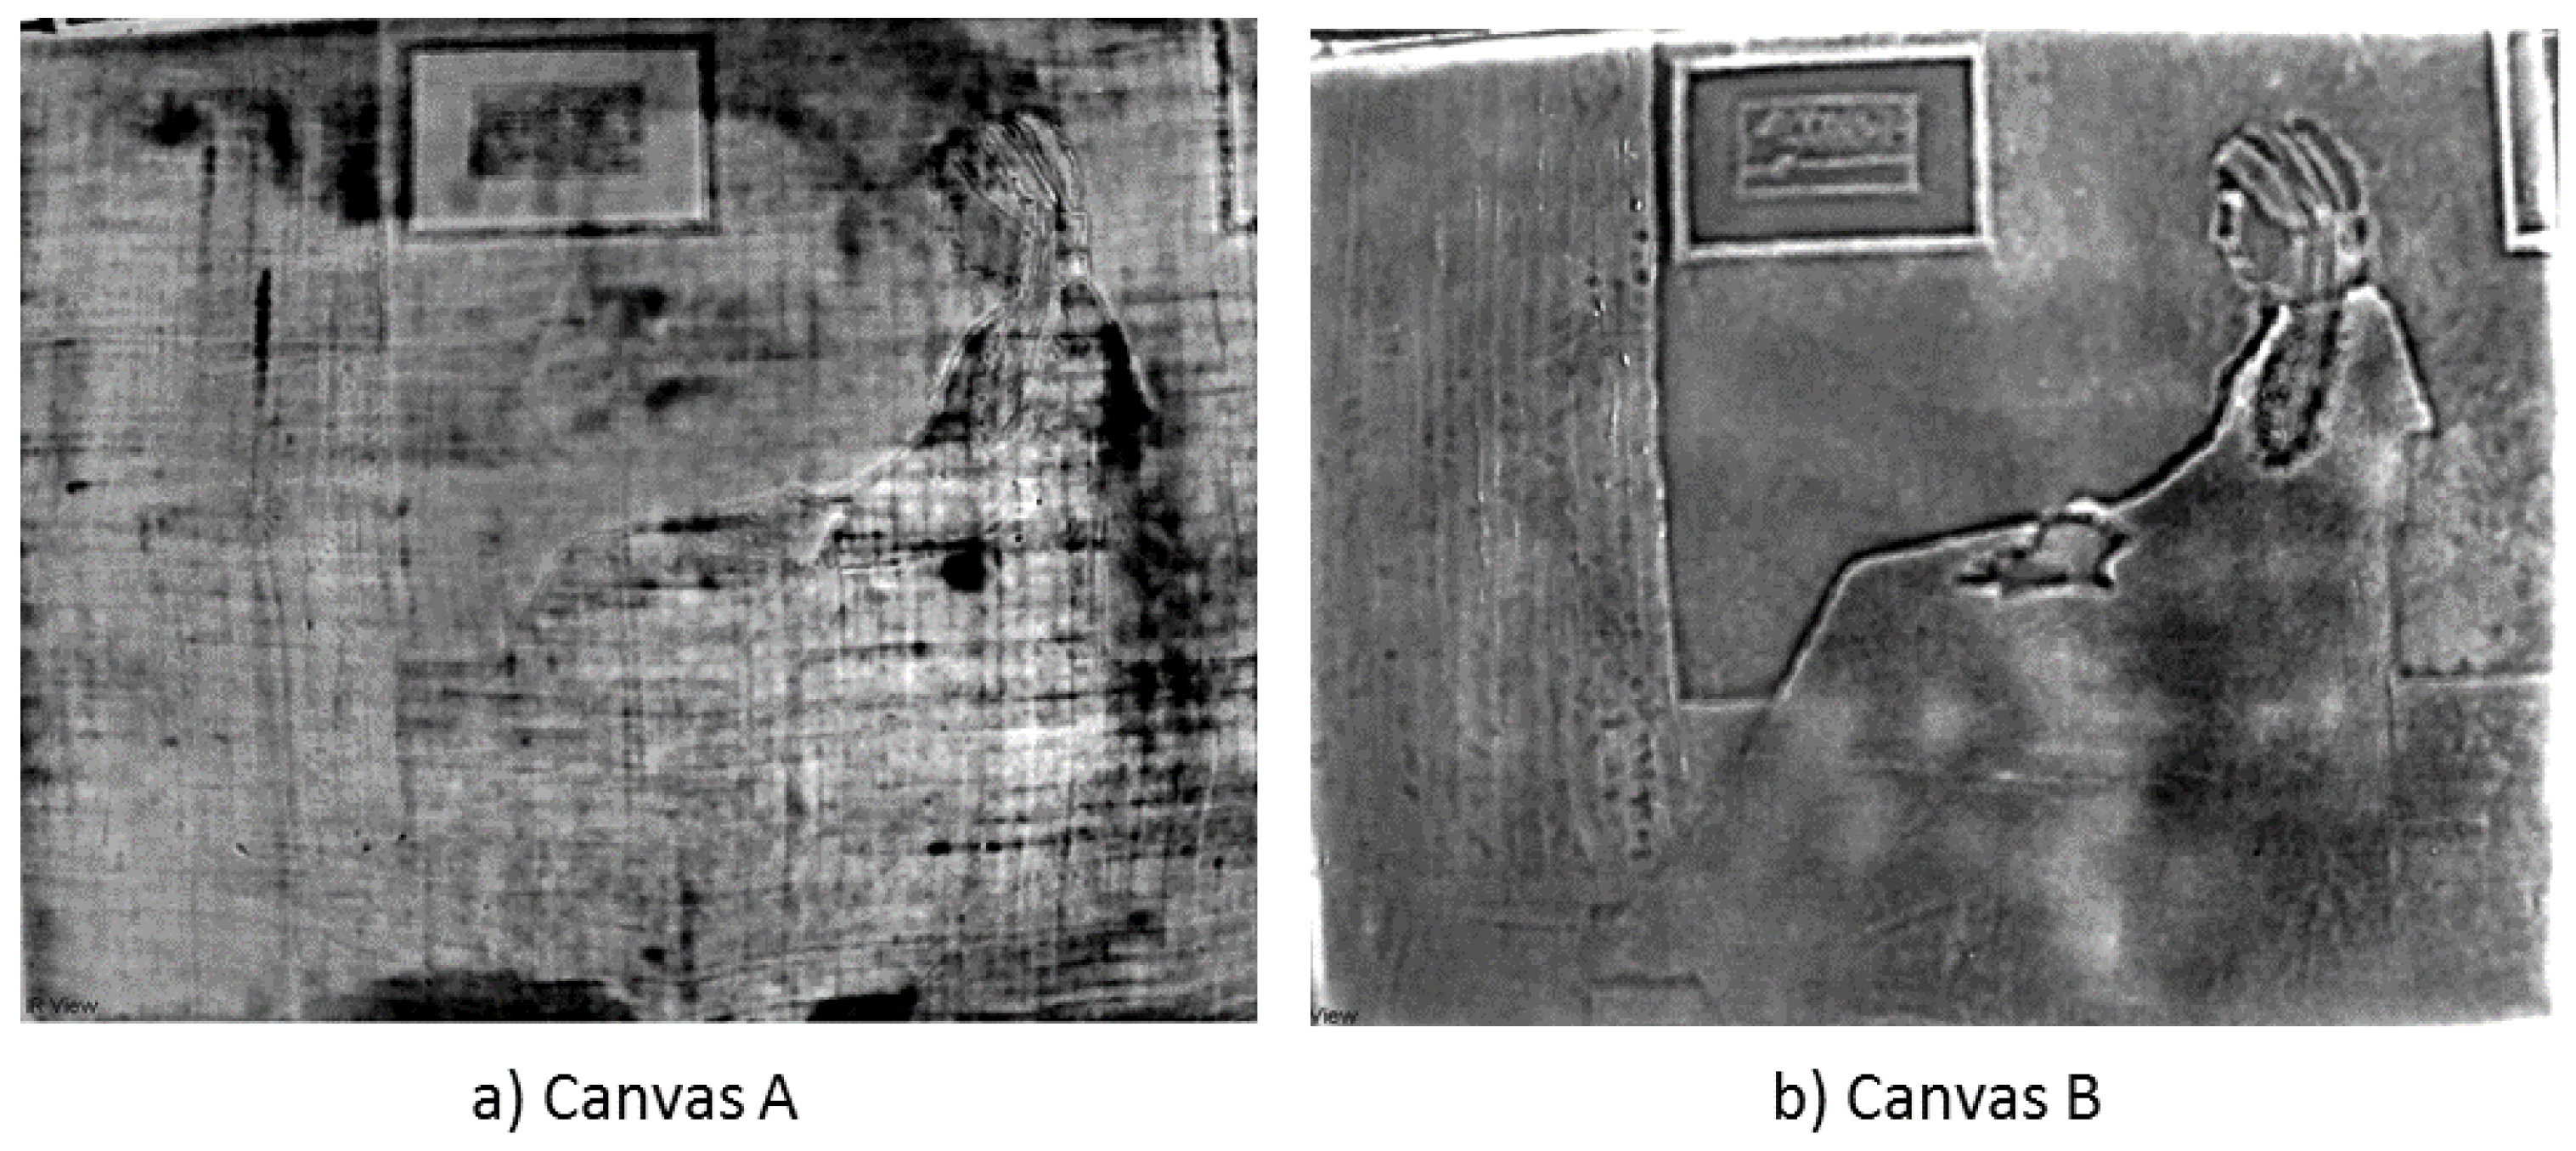
3.3. Whistler Replica: Canvas

On the Wistler replica paintings, we mainly focus on the canvas structure, to determine if a differentiation can be made between the different textile fibres and painting techniques.
With respect to the results described in Section 3.1, it could be concluded that IR-A reflectography from the front side will not penetrate the canvas. Therefore, we opted to position the illumination source from the back. In this way, a registration is made of the transmitted energy only. It was found that the 940 nm IR LED illumination source of 800 W delivered the most promising results, which are presented in Figure 14. The hemp and nettle fibres of canvas A have a thicker and less structured appearance, which makes them clearly visible through the upper paint layers. This is in large contrast with the fine structure of the flax and juniper fibres of canvas B. It should be marked that the information is only visible for the center of the canvas and an access to the back side of the canvas is mandatory.
Referring to Section 3.1, it is concluded that IR-B reflectography provides less accurate results when thicker layers of oil pigment should be penetrated. However, due to active thermography within the IR-C’ spectrum, similar results could be received after PCT analysis. This is shown in Figure 15, where PCT results are provided after flash excitation on both Whistler paintings. Comparing the fifth principal component, a large distinction can be made between both canvas types, which is comparable with the IR-A transmission results. The first four principal component bins show no significant difference. The large benefit is that inspection from the front side is possible. The drawback can be that more time is needed and minimal heating of the painting occurs. However, these results can conclude that canvas fiber analysis can be performed with an IR-B+C’ device over the full canvas and no access to the back side is mandatory.
Within Figure 16, a comparison is made of both canvases; both in IR-A and IR-B+C’ spectra, the reflectography results with an illumination from the front side are shown. Within these results, some small distinctions can be made in local reflectivity of both paintings. However, in our opinion, this is not enough evidence for the difference in painting technique. It could only give an indication for further investigation.

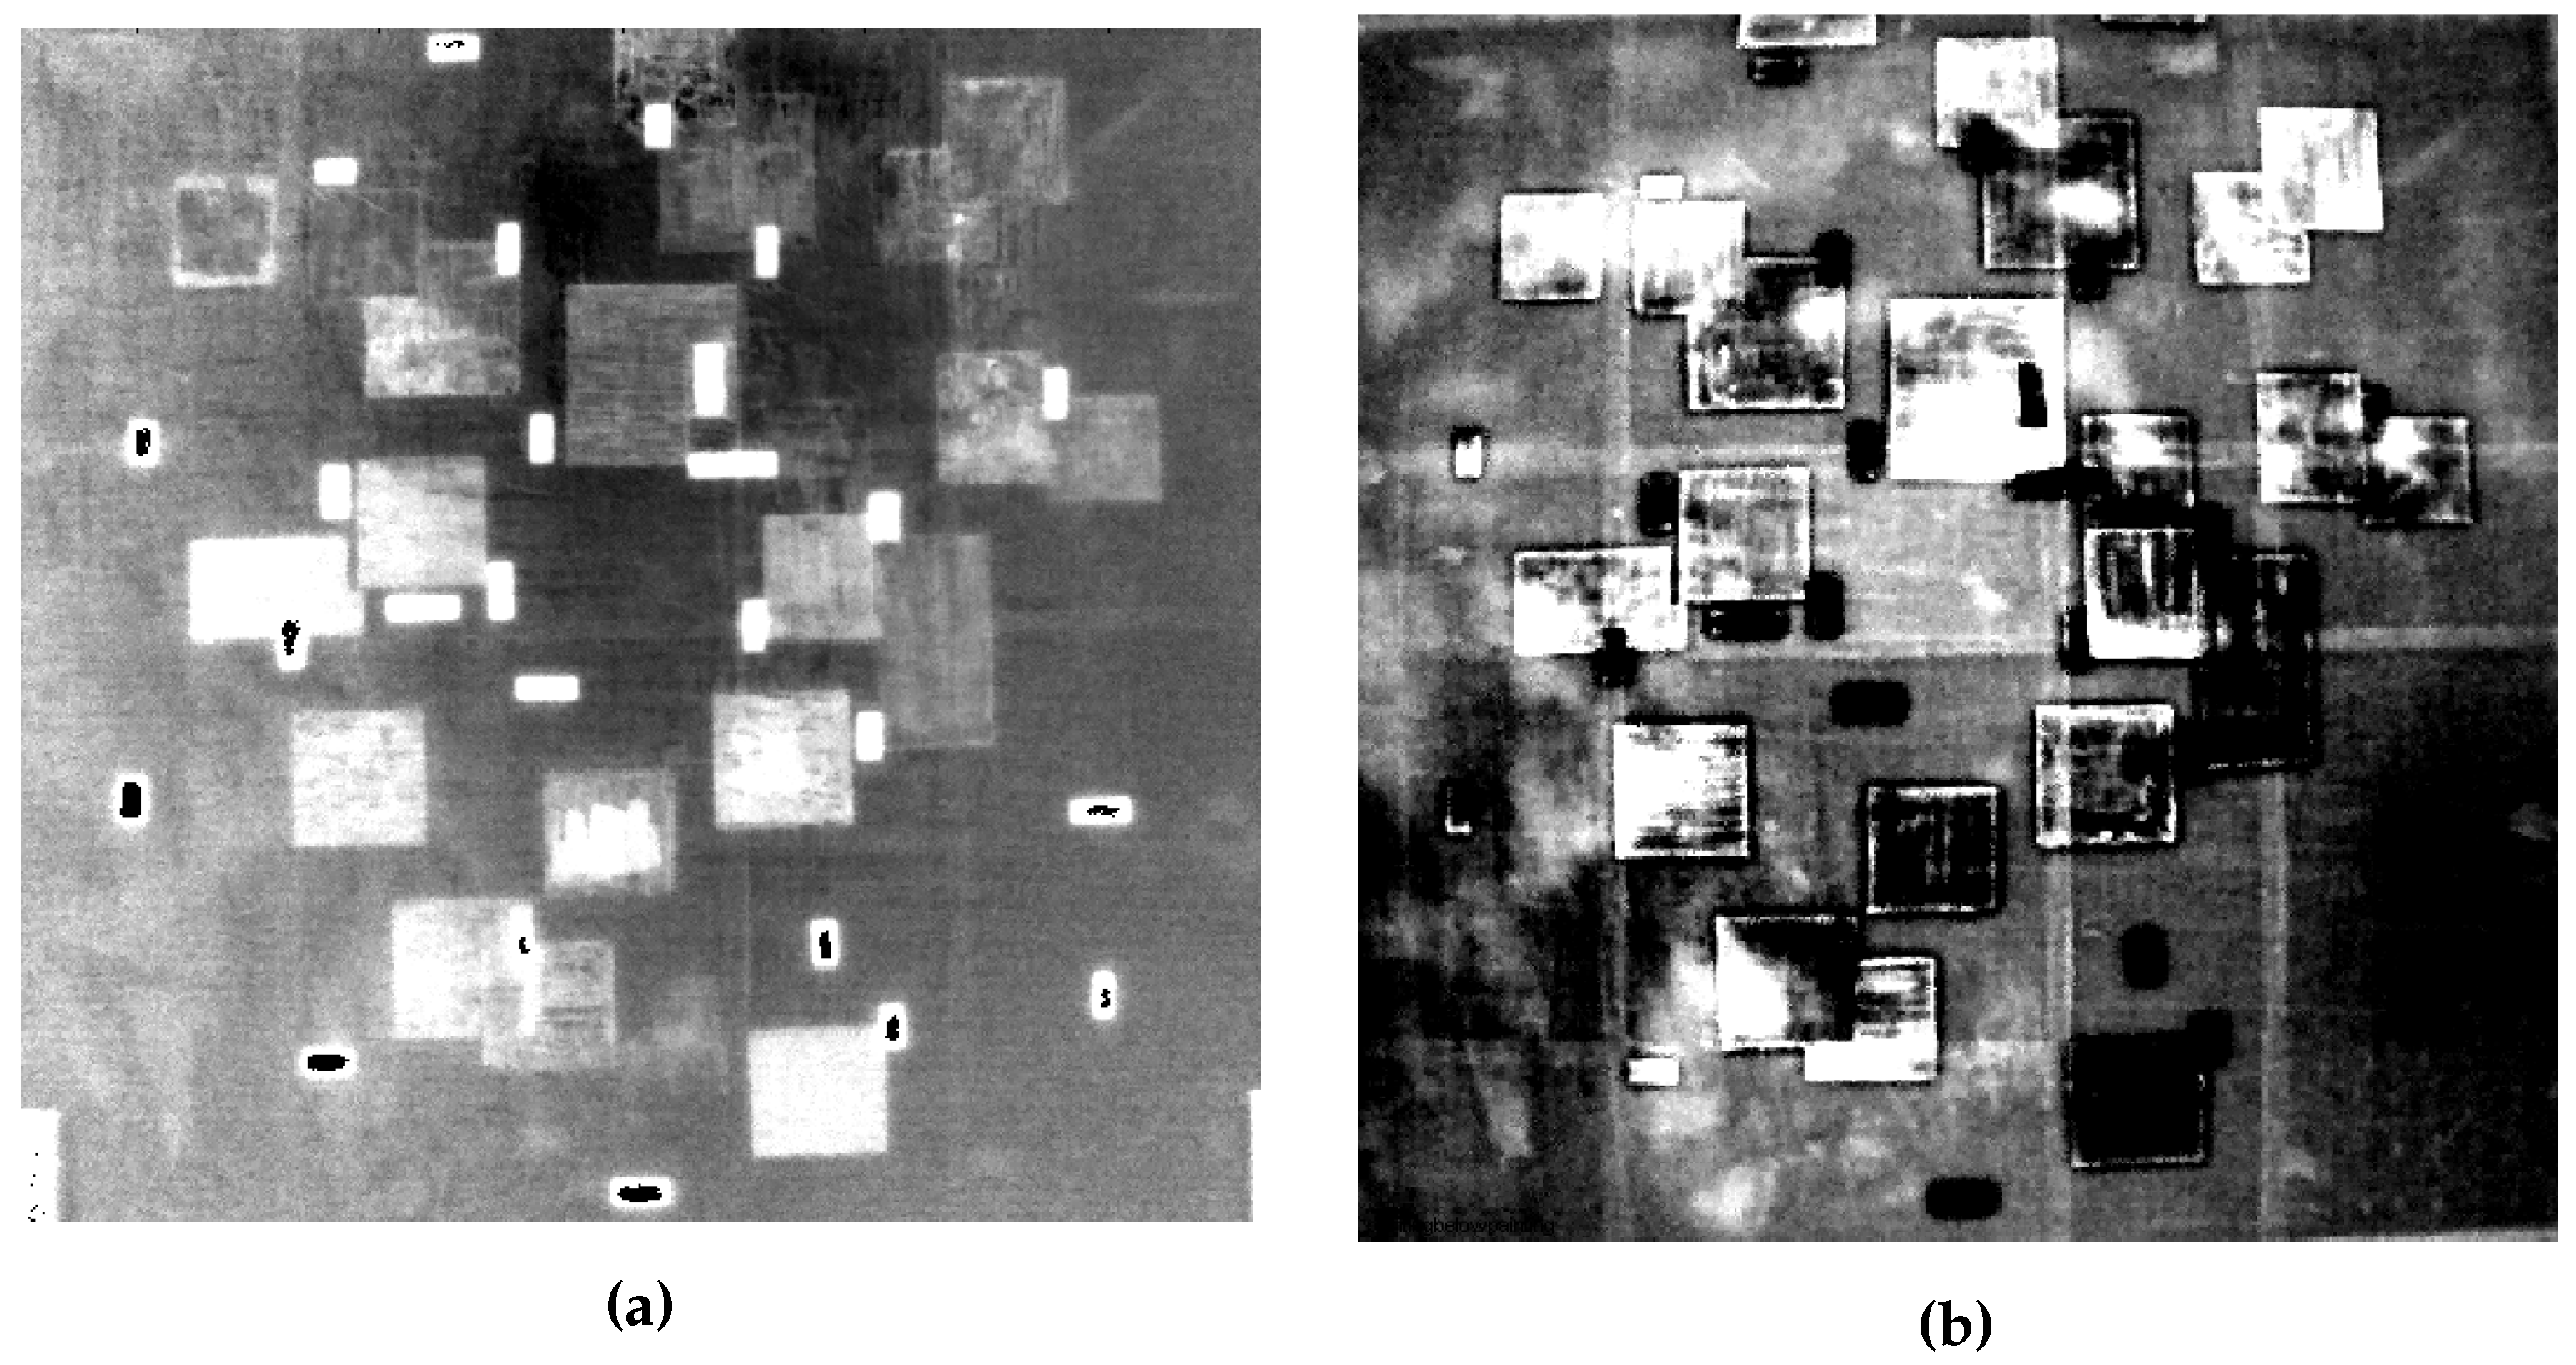
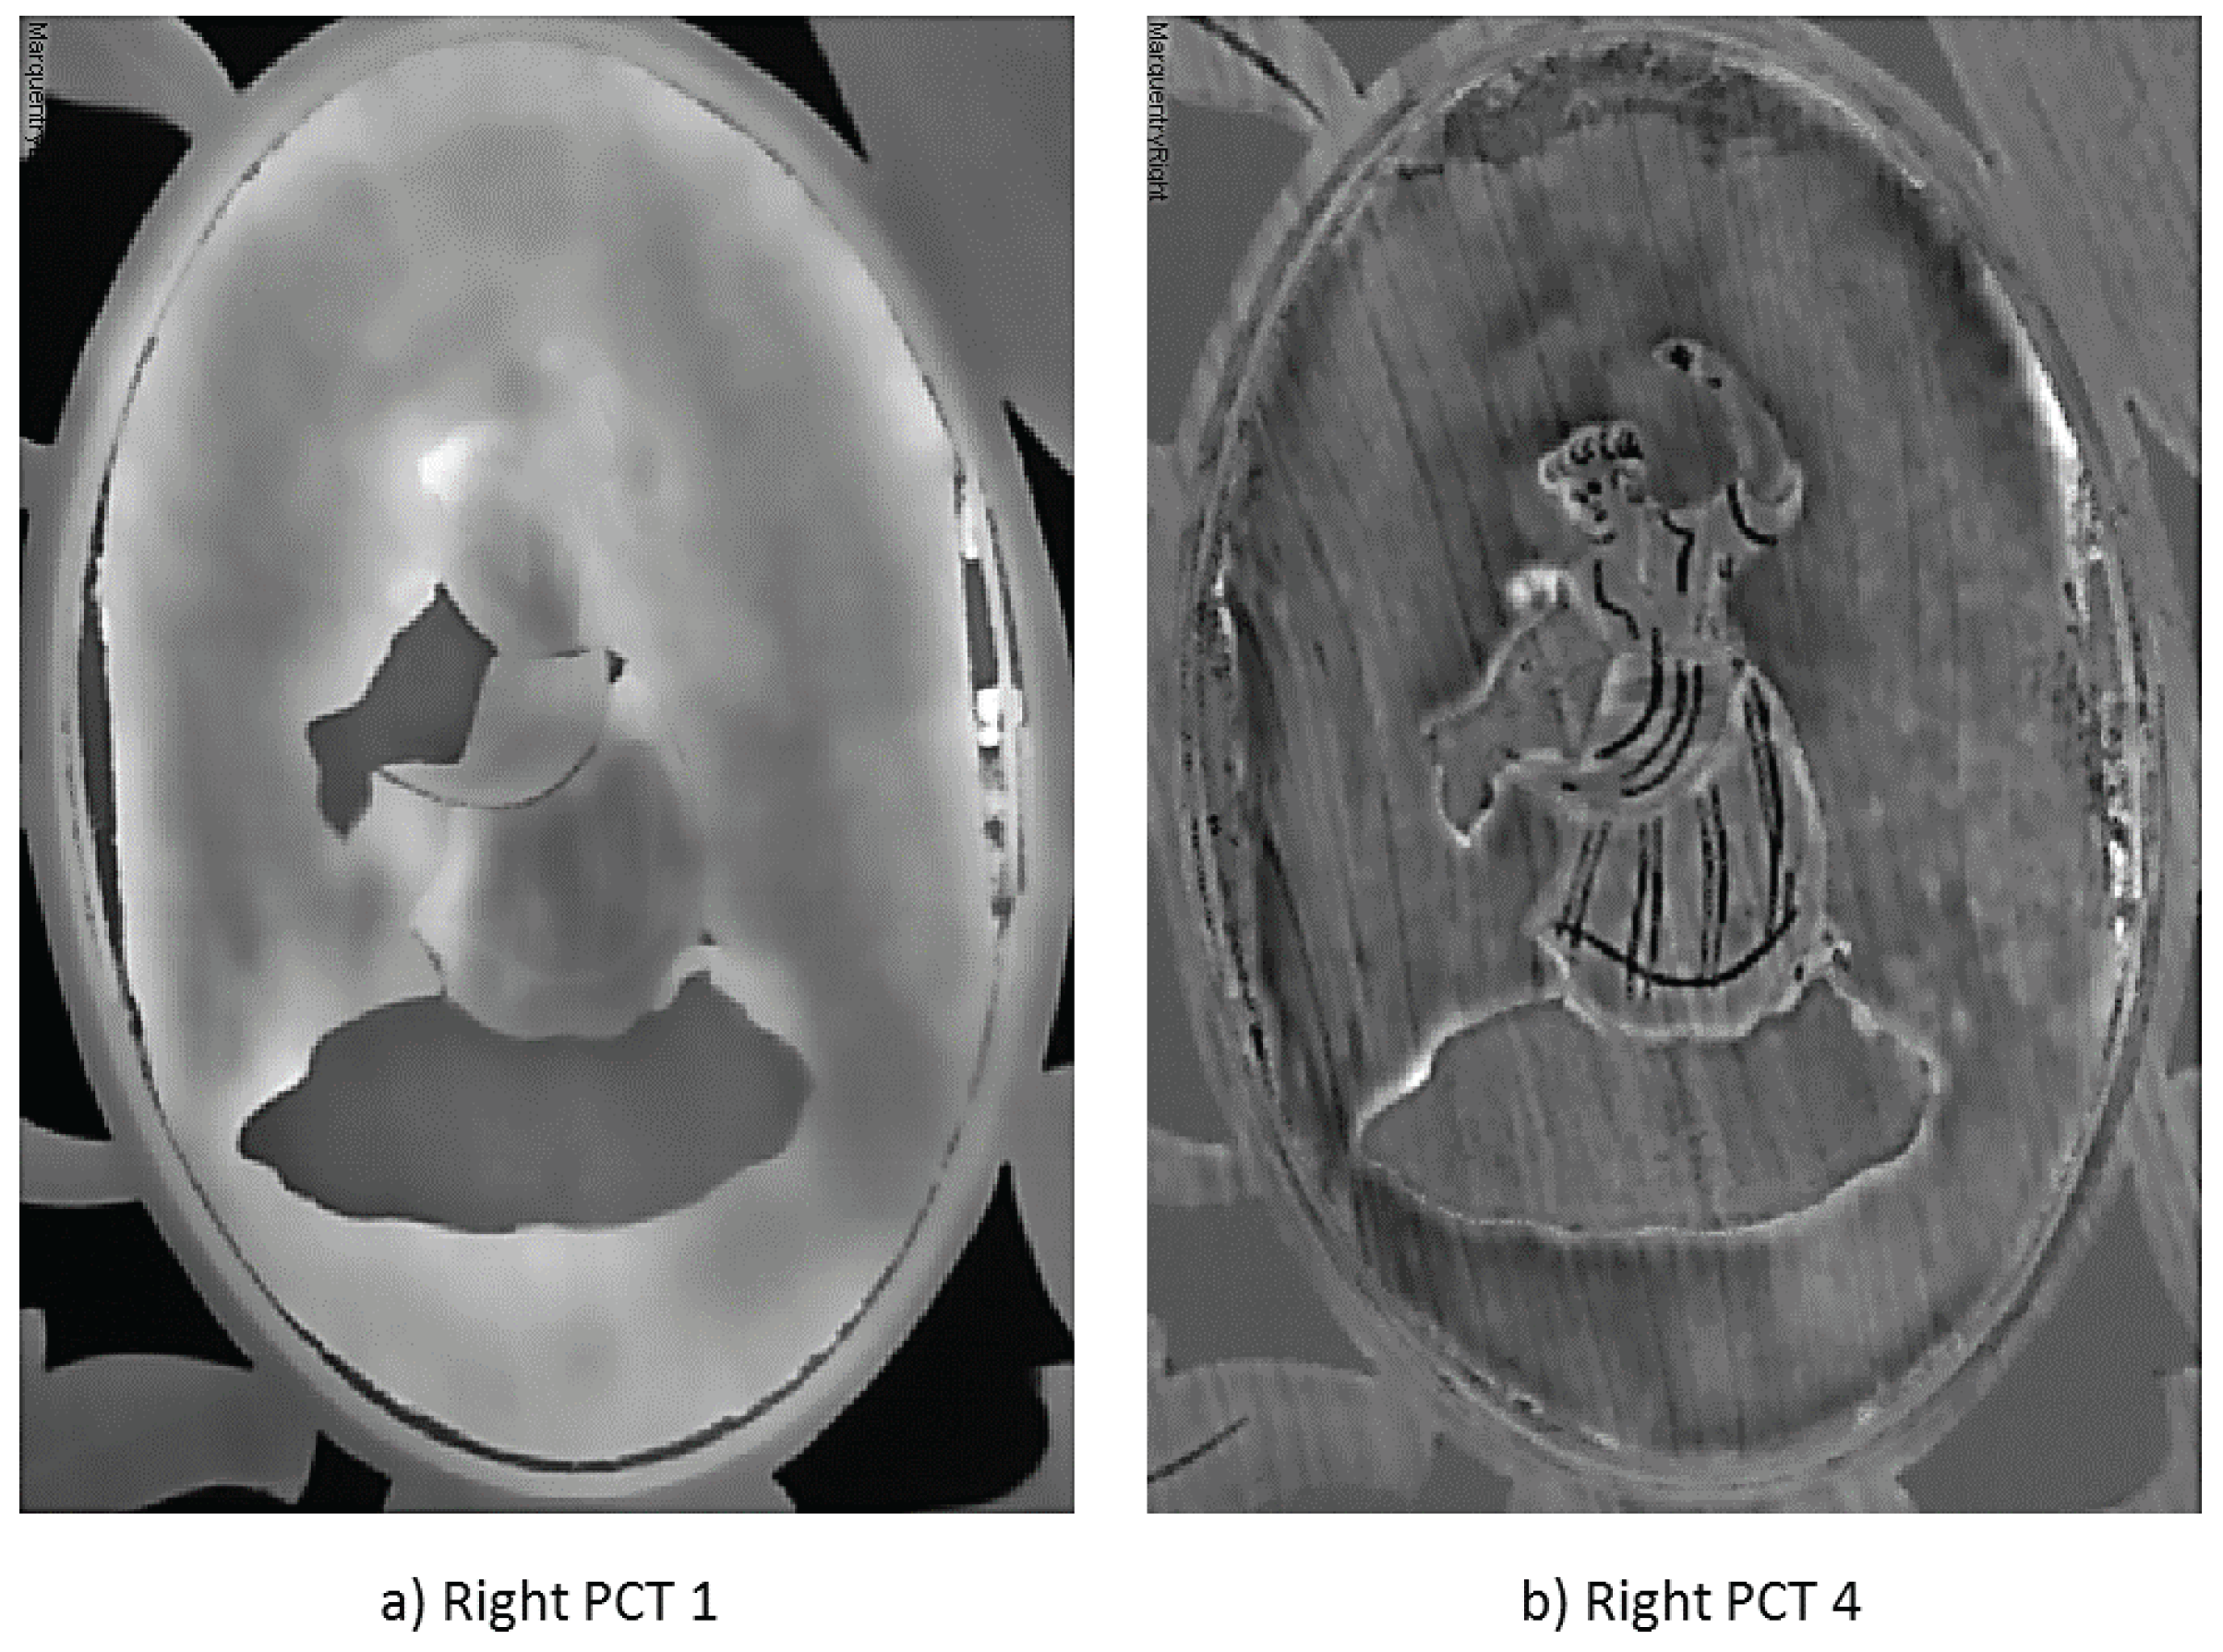
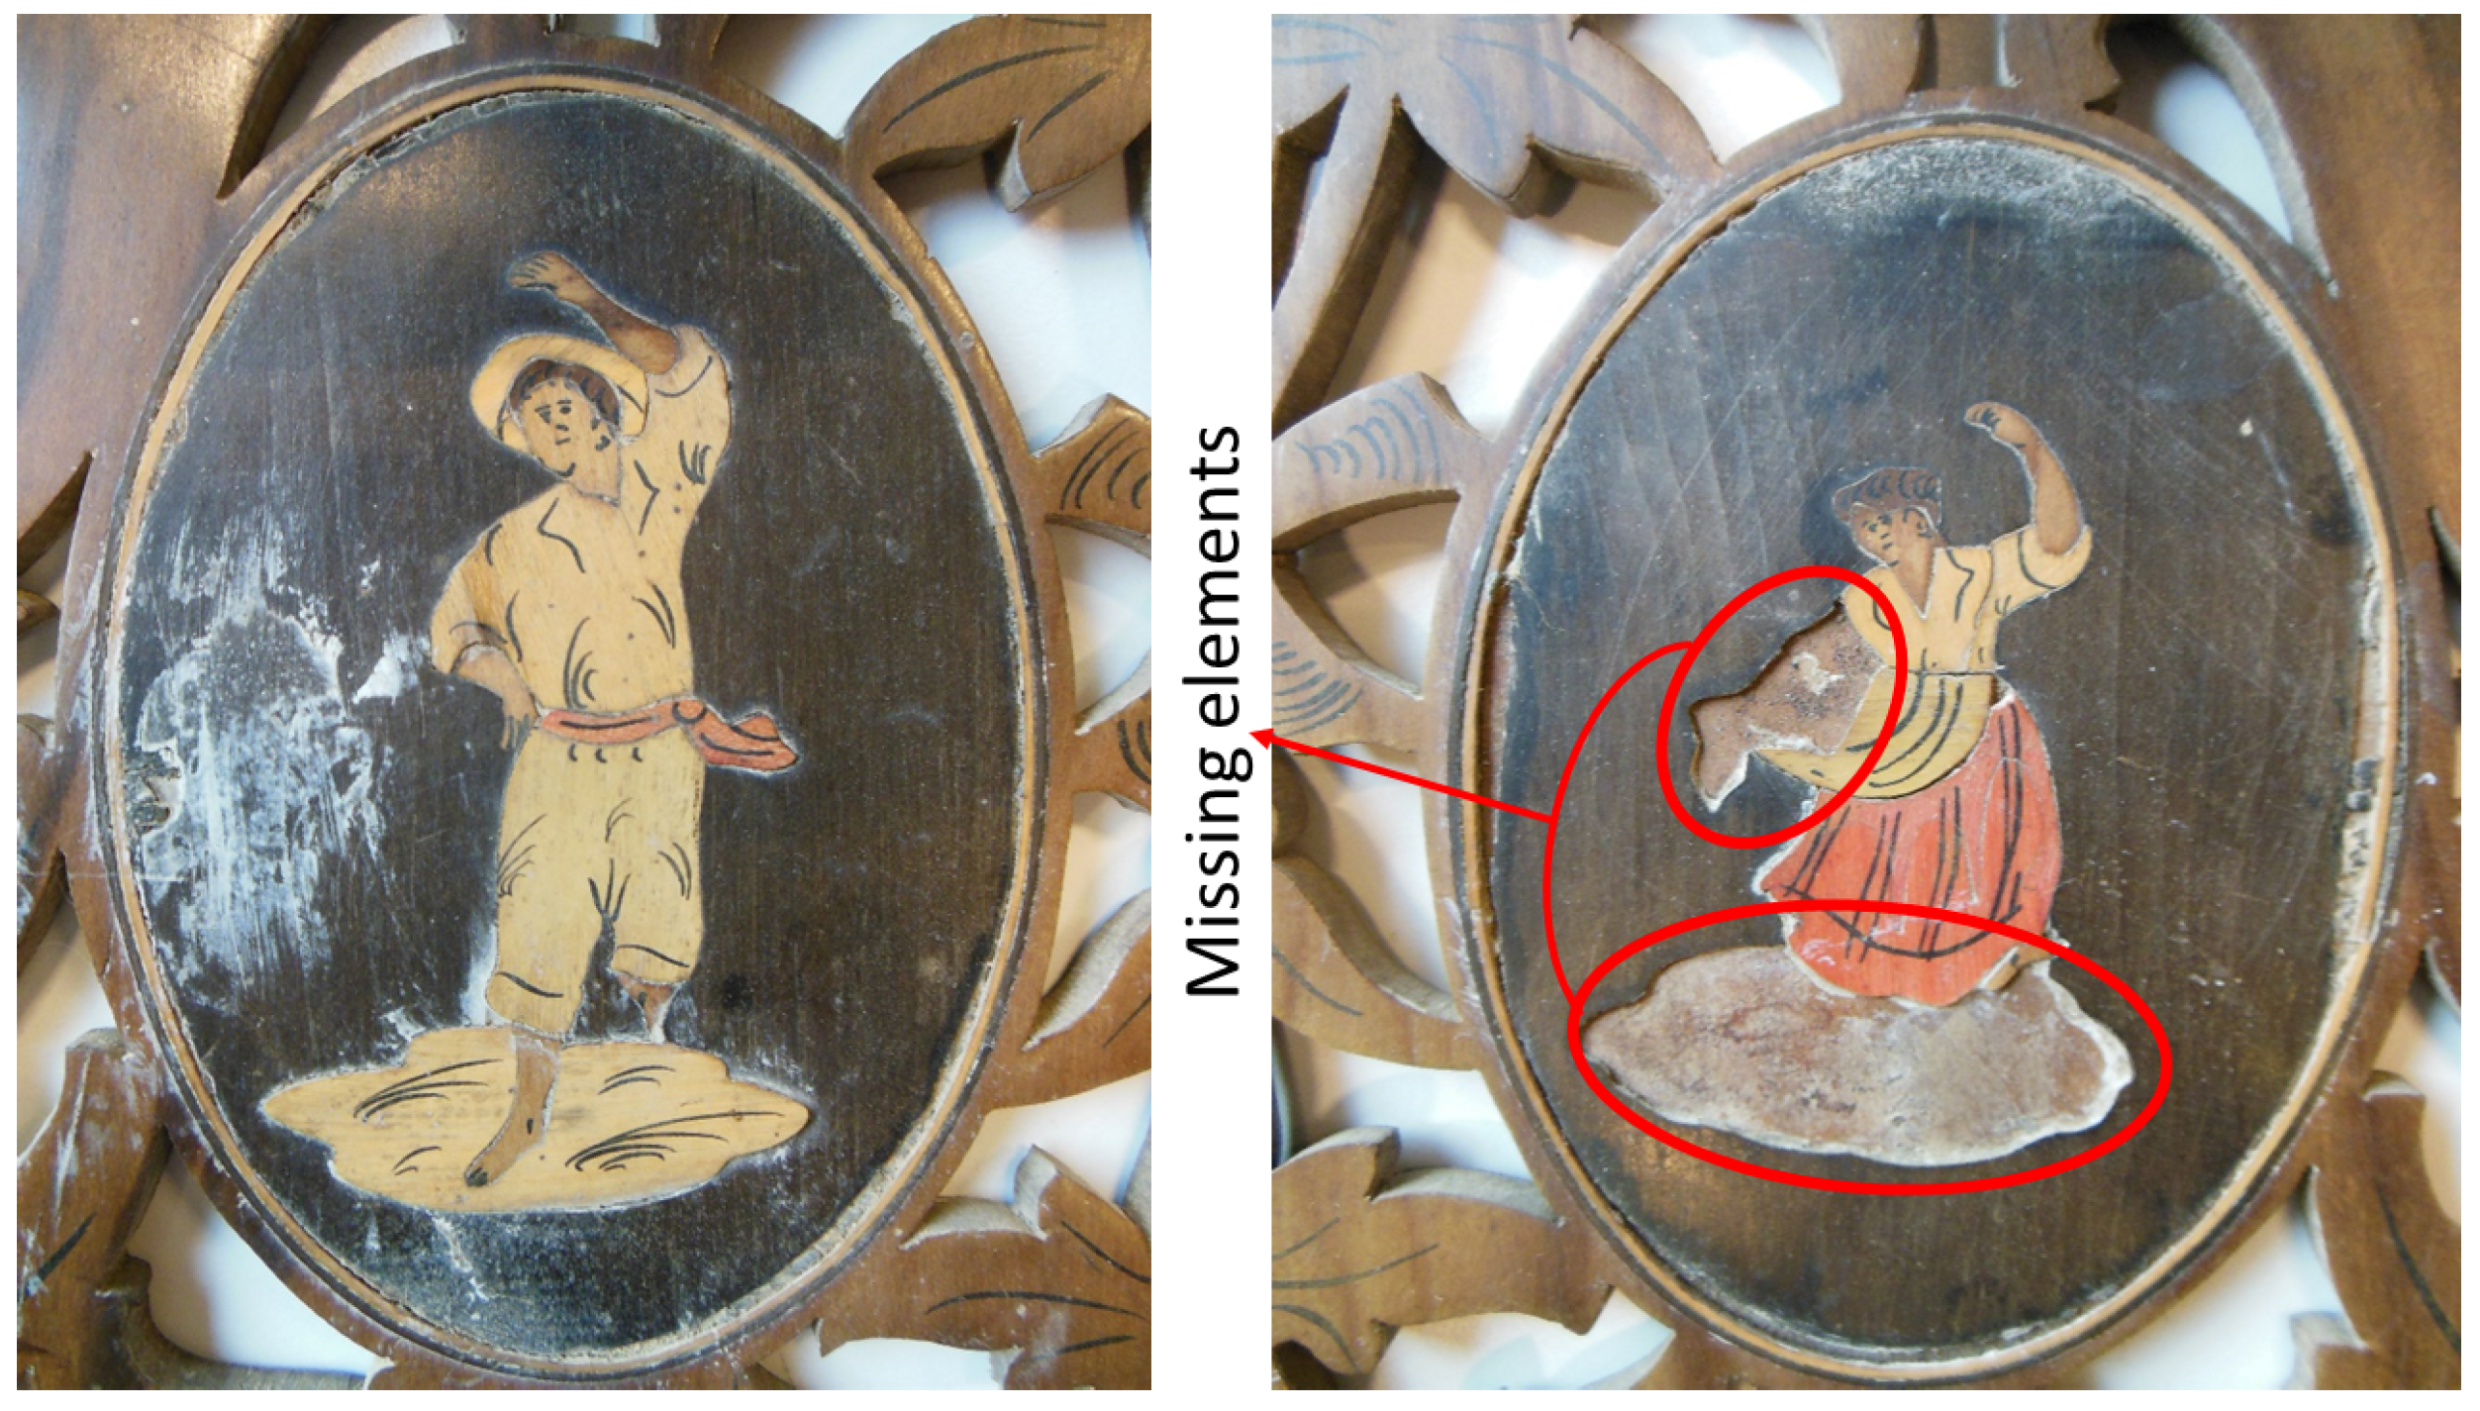
3.4. Marquetries: Wood Structure

With respect to the wooden marquetries, in this case, the goal was to inspect both structures on structural integrity. This is performed using IR-A reflectography and active thermography using the IR-C’ camera. The reflectography measurements are performed using halogen illumination of 1000 W and the raw results are shown in Figure 17 for both structures. In the visual pictures of Figure 6, it is seen that both marquetries are restored previously; unfortunately, it is not possible to see why. Within the IR-A results, the original defects are prominent visually, which delivers more in-depth information about the reason for restoration. However, no new defect can be found and the applicability is limited.
By performing active thermography inspection with the IR-B+C’ system using flash excitation and PCT post-processing analysis, some new defects are found within the different wooden sections. In particular, small delaminations are found and the two missing parts of the right marquetry. In addition, the grain structure becomes visible in some of the principal component bins. In Figure 18a, the grain structure becomes visible and it is visible that not all of the burned black lines are equally deep. The lines of the pants’ part are less accented, with respect to those in the torso part. In Figure 18b, a very large subsurface crack and delamination is visible (lighter area) at the lower region. The highlighted smaller parts contain smaller delaminations as well.
Similar results are shown in Figure 19 for the right marquetry. In particular, the two missing parts are prominently visible in (a). In the fourth bin (b), the different grain patterns of the different wooden sections are accurately visible. This might be interesting to compare different sets and verify their origin. This information is relevant for valuation purposes, understanding the production process, identifying falsifications and for restoration purposes.

4. Conclusions

The aim of this manuscript is to compare the abilities of a broadband MWIR (IR-B+C’) camera systems with the separate capabilities of an SWIR (IR-A) camera, MA-rFTIR spectroscopy and a regular MWIR (IR-C’) camera with respect to art work inspection. We inspected four different kinds of art work samples in order to perform the most known analyses. It is shown that both underdrawings and pentimenti can be made visible when the lead white paint layers in between are not too thick. It is shown that the contrast is increased by performing active thermography analysis, with respect to the common IR-A reflectography when intermediate layers become thicker. This is shown within the Mondrian and Icon test samples. In addition, similar results as MA-rFTIR spectroscopy can be achieved for blue pigment characterisation as shown in the Icon test sample. Sub-layer investigation of the canvas and wood structures can be inspected significantly better with a combination of IR-B and IR-C’ in contrast to IR-A or only IR-C’ measurements. For example, canvas fibre structures can be evaluated without access to the back of the painting and wooden grain structures can be filtered from the art work on top. This might have a major potential in dendrographic analysis of painted wood panels. A conclusive advantage for wooden art work is the ability to detect delaminations in the sub-layers of a wooden part. This might give better insights into the need of restoration, but this information can also give a better understanding in the fabrication process and to detect falsifications. The pentimenti and underdrawings give a better understanding of the process the artist went through when drawing the painting, which is useful information for historians and the general public. With this work, we can conclude that the use of a combined IR-B+C’ camera system delivers a broad range of applications and complement with a variety of other well-established systems. Although their price is higher than a IR-A or IR-C’ system, the union of both in an IR-B+C’ system is more time efficient, compact and cheaper than the combination of the separate equipment.

Acknowledgments

This research has been funded by the University of Antwerp and the Institute for the Promotion of Innovation by Science and Technology in Flanders (VLAIO) by the support to the TETRA project ’SINT: Smart Integration of Numerical modelling and Thermal inspection’ with project number HBC.2017.0032. Furthermore, the research leading to these results has received funding from the Research Foundation Flanders (FWO) travel grant V4.010.16N and the Stimpro stimuli of UAntwerpen under project ID 32864. We would like to end with a special thanks to the MiViM research chair of Prof. Xavier Maldague and the support of the full team in supporting the preliminary measurements of this research.

Author Contributions

J.P. and G.V.d.S. conceived and designed the experiments; J.P., S.S., S.L. and C. I.-C. performed the experiments; J.P. and S.L. analysed the data; K.J., S.S. and G.S. contributed materials and analysis tools; J.P., S.S. and G.S. wrote the paper.

Conflicts of Interest

The authors declare no conflict of interest. The founding sponsors had no role in the design of the study; in the collection, analyses, or interpretation of data; in the writing of the manuscript, and in the decision to publish the results.

References

  1. Miller, B.F. The Feasibility of using Thermography to Detect Subsurface Voids in Painted Wooden Panels. Bull. Am. Inst. Conserv. 1976, 16, 27–35. [Google Scholar] [CrossRef]
  2. Daffara, C.; Ambrosini, D.; Di Biase, R.; Fontana, R.; Paoletti, D.; Pezzati, L.; Rossi, S. Imaging data integration for painting diagnostics. Proc. SPIE 2009, 7391, 73910X. [Google Scholar]
  3. Delaney, J.K.; Thoury, M.; Zeibel, J.G.; Ricciardi, P.; Morales, K.M.; Dooley, K.A. Visible and infrared imaging spectroscopy of paintings and improved reflectography. Herit. Sci. 2016, 4, 6. [Google Scholar] [CrossRef]
  4. Miller, J.L. Principles of Infrared Technology: A Practical Guide to the State of the Art; Springer: Berlin, Germany, 1994. [Google Scholar]
  5. Obrutsky, A.; Acosta, D.; Garcia, A.; Scopelliti, J. Non-destructive testing methods used for the study of cultural heritage in Argentina. Insight Non-Destr. Test. Cond. Monit. 2009, 51, 499–503. [Google Scholar] [CrossRef]
  6. Ambrosini, D.; Daffara, C.; Di Biase, R.; Paoletti, D.; Pezzati, L.; Bellucci, R.; Bettini, F. Integrated reflectography and thermography for wooden paintings diagnostics. J. Cult. Herit. 2010, 11, 196–204. [Google Scholar] [CrossRef]
  7. Falco, C.M. High-Resolution Infrared Imaging. In Proceedings of the Nature of Light: Light in Nature III, San Diego, CA, USA, 2 August 2010; Volume 7782, p. 778206. [Google Scholar]
  8. Sfarra, S.; Ibarra-Castanedo, C.; Ambrosini, D.; Paoletti, D.; Bendada, A.; Maldague, X. Integrated approach between pulsed thermography, near-infrared reflectography and sandwich holography for wooden panel paintings advanced monitoring. Russ. J. Nondestruct. Test. 2011, 47, 284–293. [Google Scholar] [CrossRef]
  9. Daffara, C.; Pezzati, L.; Ambrosini, D.; Paoletti, D.; Di Biase, R.; Mariotti, P.I.; Frosinini, C. Wide-band IR imaging in the NIR-MIR-FIR regions for in situ analysis of frescoes. In Proceedings of the O3A: Optics for Arts, Architecture, and Archaeology III, Munich, Germany, 21 June 2011; Volume 8084, p. 808406. [Google Scholar]
  10. Crina Anca Sandu, I.; De Sá, M.H.; Pereira, M.C. Ancient ’gilded’ art objects from European cultural heritage: A review on different scales of characterization. Surf. Interface Anal. 2011, 43, 1134–1151. [Google Scholar] [CrossRef]
  11. Daffara, C.; Ambrosini, D.; Pezzati, L.; Paoletti, D. Thermal Quasi-Reflectography: a new imaging tool in art conservation. Opt. Express 2012, 20, 14746–14753. [Google Scholar] [CrossRef] [PubMed]
  12. Sfarra, S.; Ibarra-Castanedo, C.; Ambrosini, D.; Paoletti, D.; Bendada, A.; Maldague, X. Discovering the defects in paintings using non-destructive testing (NDT) techniques and passing through measurements of deformation. J. Nondestruct. Eval. 2014, 33, 358–383. [Google Scholar] [CrossRef]
  13. Alfeld, M.; Broekaert, J.A. Mobile depth profiling and sub-surface imaging techniques for historical paintings—A review. Spectrochim. Acta Part B At. Spectrosc. 2013, 88, 211–230. [Google Scholar] [CrossRef]
  14. Legrand, S.; Alfeld, M.; Vanmeert, F.; De Nolf, W.; Janssens, K. Macroscopic Fourier transform infrared scanning in reflection mode (MA-rFTIR), a new tool for chemical imaging of cultural heritage artefacts in the mid-infrared range. Analyst 2014, 139, 2489–2498. [Google Scholar] [CrossRef] [PubMed]
  15. Sfarra, S.; Ibarra-Castanedo, C.; Ridolfi, S.; Cerichelli, G.; Ambrosini, D.; Paoletti, D.; Maldague, X. Holographic Interferometry (HI), Infrared Vision and X-Ray Fluorescence (XRF) spectroscopy for the assessment of painted wooden statues: A new integrated approach. Appl. Phys. A Mater. Sci. Process. 2014, 115, 1041–1056. [Google Scholar] [CrossRef]
  16. Gavrilov, D.; Maeva, E.; Grube, O.; Vodyanoy, I.; Maev, R. Experimental comparative study of the applicability of infrared techniques for non-destructive evaluation of paintings. J. Am. Inst. Conserv. 2013, 52, 48–60. [Google Scholar] [CrossRef]
  17. Sfarra, S.; Theodorakeas, P.; Avdelidis, N.P.; Koui, M. Thermographic, ultrasonic and optical methods: A new dimension in veneered wood diagnostics. Russ. J. Nondestruct. Test. 2013, 49, 234–250. [Google Scholar] [CrossRef]
  18. Paez, G.; Strojnik, M. Spectral interrogation of a several-hundred-years old painting with a broadband IR camera. In Proceedings of the Infrared Remote Sensing and Instrumentation XXI, San Diego, CA, USA, 19 September 2013; Volume 8867, p. 886711. [Google Scholar]
  19. Bendada, A.; Sfarra, S.; Ibarra-Castanedo, C.; Akhloufi, M.; Caumes, J.; Pradere, C.; Batsale, J.; Maldague, X. Subsurface imaging for panel paintings inspection: A comparative study of the ultraviolet, the visible, the infrared and the terahertz spectra. Opto-Electron. Rev. 2015, 23, 88–99. [Google Scholar] [CrossRef]
  20. Zhang, H.; Sfarra, S.; Saluja, K.; Peeters, J.; Fleuret, J.; Duan, Y.; Fernandes, H.; Avdelidis, N.; Ibarra-Castanedo, C.; Maldague, X. Non-destructive Investigation of Paintings on Canvas by Continuous Wave Terahertz Imaging and Flash Thermography. J. Nondestruct. Eval. 2017, 36, 34. [Google Scholar] [CrossRef]
  21. Walmsley, E.; Metzger, C.; Delaney, J.K.; Fletcher, C. Improved visualization of underdrawings with solid-state detectors operating in the infrared. Stud. Conserv. 1994, 39, 217–231. [Google Scholar]
  22. Van Asperen de Boer, J.R.J. Reflectography of Paintings Using an Infrared Vidicon Television System. Stud. Conserv. 1969, 14, 96–118. [Google Scholar] [CrossRef]
  23. Gavrilov, D.; Maev, R.; Almond, D.P. A review of imaging methods in analysis of works of art: Thermographic imaging method in art analysis. Can. J. Phys. 2014, 92, 341–364. [Google Scholar] [CrossRef]
  24. Vollmer, M.; Möllmann, K. Infrared Thermal Imaging: Fundamentals, Research And Applications; Wiley-VCH: Berlin, Germany, 2010. [Google Scholar]
  25. Chaudhuri, P.; Santra, P.; Yoele, S.; Prakash, A.; Reddy, D.; Lachhvani, L.; Govindarajan, J.; Saxena, Y. Non-destructive evaluation of brazed joints between cooling tube and heat sink by IR thermography and its verification using FE analysis. NDT E Int. 2006, 39, 88–95. [Google Scholar] [CrossRef]
  26. Jeong, W.; Earls, C.; Philpot, W.; Zehnder, A. Inverse thermographic characterization of optically unresolvable through cracks in thin metal plates. Mech. Syst. Signal Process. 2012, 27, 634–650. [Google Scholar] [CrossRef]
  27. Susa, M.; Ibarra-Castanedo, C. Pulse thermography applied on a complex structure sample: Comparison and analysis of numerical and experimental results. In Proceedings of the IV Conferencia Panamericana de END, Buenos Aires, Argentina, 22–26 October 2007. [Google Scholar]
  28. Ibarra-Castanedo, C.; Genest, M.; Piau, J.M.; Guibert, S.; Bendada, A.; Maldague, X.P.V. Active Infrared Thermography Techniques for the Non-destructive Testing of Materials. In Ultrasonic and Advanced Methods for Nondestructive Testing and Material Characterization; Chen, C.H., Ed.; World Scientific Publishing: Singapore, 2007; pp. 325–348. [Google Scholar]
  29. Giorleo, G.; Meola, C. Comparison between pulsed and modulated thermography in glass–epoxy laminates. NDT E Int. 2002, 35, 287–292. [Google Scholar] [CrossRef]
  30. Busse, G. Techniques of Infrared Thermography: Part 4. Lock-in thermography. In Nondestructive Handbook, 3rd ed.; ASNT Press: Columbus, OH, USA, 2001; p. 718. [Google Scholar]
  31. Rajic, N. Principal component thermography. Def. Sci. Technol. 2002. [Google Scholar]
  32. Klein, M.T.; Ibarra-Castanedo, C.; Maldague, X.P.V.; Bendada, A. A straightforward graphical user interface for basic and advanced signal processing of thermographic infrared sequences. In Proceedings of the Thermosense XXX, Orlando, FA, USA, 17 March 2008; Volume 6939, p. 693914. [Google Scholar]
Figure 1. Schematic view of active thermography on a painting, as used within this work. IR: Infrared Radiation.
Applsci 08 00050 g001
Figure 2. Overview of the Mondrian compositions with pigment characteristics of the underneath layer. left: composition underneath; right: top layer composition.
Applsci 08 00050 g002
Figure 3. Schematic overview of the different layer stacking of Mondrian painting.
Applsci 08 00050 g003
Figure 4. Canvas A with the replica of James Abbott Whistler. On the left is a photograph of the figure (recto) and on the right is a picture of the canvas structure (verso).
Applsci 08 00050 g004
Figure 5. Canvas B with the replica of James Abbott Whistler. On the left is a photograph of the figure (recto) and on the right is a picture of the canvas structure (verso).
Applsci 08 00050 g005
Figure 6. Visual photograph of both marquetry test samples. The right sample contains some surface piercing defects, and the left has only corrected surface piercing anomalies present.
Applsci 08 00050 g006
Figure 7. Reflectographic results on the Mondrian painting. (a) IR-A results of Mondrian compositions with halogen illumination. Composition 1 appears mixed with composition 2; (b) IR-B reflectographic results using the filter around 2.2 μ m and halogen illumination. Composition 1 remains hidden.
Applsci 08 00050 g007

.42.42
(a)(b)
Figure 8. Active thermography results on the Mondrian painting. (a) IR-C’ results of Mondrian compositions with halogen sine wave of 0.1 Hz and glass filter after Fourier transform and phase analysis. Composition 1 lines are barely visible; (b) IR-C’ results of Mondrian compositions with flash excitation after principal component thermography (PCT) analysis (bin 3). Composition 1 is clearly visible.
Applsci 08 00050 g008

.43.43
(a)(b)
Figure 9. Visual photograph of Saint Nicholas icon with known pigment characteristics indicated.
Applsci 08 00050 g009
Figure 10. IR-A (a) and IR-B+C’ (b) reflectography results without the use of filters.
Applsci 08 00050 g010
Figure 11. IR-B+C’ reflectography results by using the four different filters. Differences in the blue pigments are present on the stole and book.
Applsci 08 00050 g011
Figure 12. Validation results performed making macroscopic reflection mode Fourier transform infrared (MA-rFTIR) to compare the IR-B+C’ filtered results.
Applsci 08 00050 g012
Figure 13. Active thermography results.
Applsci 08 00050 g013
Figure 14. IR-A transmission results of Whistler paintings with an 800W IR 940 nm LED illumination source from the backside. A difference occurs with respect to the canvas type.
Applsci 08 00050 g014
Figure 15. Active thermography results (IR-C’) of the Whistler paintings after PCT (bin 5) where difference in canvas structure is detectable.
Applsci 08 00050 g015
Figure 16. IR-B+C’ and IR-A reflection results of the Whistler paintings using halogen illumination from the frontside.
Applsci 08 00050 g016
Figure 17. Reflectography results of IR-A camera with halogen illumination.
Applsci 08 00050 g017
Figure 18. Active thermography results of the left marquetry after PCT analysis where delaminations become visible.
Applsci 08 00050 g018
Figure 19. Active thermography results of the right marquetry after PCT analysis where the missing parts are obviously visible, but some border laminations occur as well.
Applsci 08 00050 g019
Table 1. Infrared radiation division schemes used within the manuscript, based on Commission on Illumination (CIE) and spectral response scheme. Note: the quotes are own modifications to subdivide in accordance with the spectral response scheme.
CIE AbbreviationWavelengthSpectral Response AbbreviationWavelengthMethod
IR-A0.7–1.4 μ m Near-infrared (NIR)0.7–1.0 μ m Reflectography
IR-B1.4–3.0 μ m Short-wave infrared (SWIR)1.0–3 μ m Reflectography
IR-C’3.0–5.0 μ m Mid-wave infrared (MWIR)3.0–5.0 μ m Active thermography
IR-C”7.0–1000 μ m Long-wave infrared (LWIR)7.0–14 μ m Active thermography
Table 2. Overview of the different experiments used within this study in order of appearance. IR: Infrared Radiation; FLIR; MA-rFTIR: macroscopic reflection mode Fourier transform infrared.
Test SampleMethodExcitation SourceCamera
MondrianIR-A reflectographyhalogenGoodrich
MondrianIR-B reflectographyhalogenFLIR X6540sc 2.2 μ m filter
MondrianIR-B+C’ active thermographyhalogenFLIR X6540sc
MondrianIR-C’ active thermographyXenon flashFLIR Phoenix
IconIR-A reflectographyhalogenGoodrich
IconIR-B reflectographyhalogenFLIR X6540sc all filters
IconIR-B+C’ active thermographyXenon flashFLIR X6540sc
IconMA-rFTIRGlobal IR sourceBruker Alpha spectrometer
WhistlerIR-A reflectographyIR LEDGoodrich
WhistlerIR-B+C’ active thermographyhalogenFLIR X6540sc
WhistlerIR-C’ active thermographyXenon flashFLIR Phoenix
MarquetriesIR-A reflectographyIR LEDGoodrich
MarquetriesIR-B+C’ active thermographyXenon flashFLIR X6540sc
MarquetriesIR-C’ active thermographyXenon flashFLIR Phoenix

