Phase Coherence Index, HHT and Wavelet Analysis to Extract Features from Active and Passive Distribution Networks


Department of Electrical and Information Engineering, Polytechnic University of Bari, St. E. Orabona 4, I-70125 Bari, Italy
*
Author to whom correspondence should be addressed.
Appl. Sci. 2018, 8(1), 71; https://doi.org/10.3390/app8010071
Submission received: 27 November 2017
/
Revised: 30 December 2017
/
Accepted: 4 January 2018
/
Published: 7 January 2018
(This article belongs to the Special Issue Developing and Implementing Smart Grids: Novel Technologies, Techniques and Models)
Abstract
:The modern Power Distribution Systems (PDS) operate more and more often with distributed generators and the optimal operation of the utility distribution systems has to take into account the possibility of bi-directional energy flows, although this event may only occur for some of the PDS. For this reason, the analysis methods that are usually employed to investigate the electrical behavior of the PDS can be more or less effective, depending on the typology of electrical loads connected to the line and on the presence or absence of Renewable Energy Sources (RES). This paper proposes either a methodology to select the best performing mathematical tool to investigate the electrical behavior of the PDS—depending on their linearity and stationarity—either an index to discriminate the PDS on the basis of a different amount of PV penetration. The proposed approach is applied to three real cases of PDS with different characteristics: residential and commercial, in the presence or absence of PV plants. In addition, two indices that are able to characterize the PDS in terms of periodicity and disturbance of the electrical signal are considered, specifically the phase coherence between two arbitrary signals and the phase coherence between an arbitrary signal and a reference one. The combined use of these indices can give valuable information about the degree of non-linearity and can be a measure of the PV penetration in a distribution circuit.
Keywords:
distribution circuit; PV penetration; smart grids; phase coherence; HHT; wavelet; runs test; ADF test1. Introduction
Thanks to the availability of big data [1], which require advanced processing techniques [2], the strategies for planning, designing, management, and operating of electrical power systems have been deeply modified and the Smart Grids (SGs) represent the new paradigm. Moreover, it results that the electrical signals of a SG can be linear or nonlinear, stationary or non-stationary, periodic or a-periodic [3,4,5], depending on the loads that are connected to the Power Distribution Systems (PDS) (static, rotating), to the power electronics and to the typology of the energy sources (deterministic or stochastic). In fact, the large penetration of PhotoVoltaic (PV) power in the PDS causes a lack of reactive power [6], introducing specific and not trivial problems for the correct and effective operation of the line, because of the unpredictability of the produced energy [7]. Again, another known issue is the reduced system inertia that happens when high PV power is injected into the line [8]. Since other specific problems (e.g., presence of time-varying loads, not dispatchable energy sources, not optimized allocation of energy sources because of the previous combined effects) that are directly related to grid-connected RES can affect the operation of the grid, in the last years the attention of the researchers has been posed on the grid integration of the PV systems [9,10,11,12,13], wind plant [14], and so on.
In this framework, the planning and the operation of the PDS under the SG paradigm are not trivial [15]; in fact, the several issues show different criticalities, whose solutions require different approaches. Two issues are the Optimal Operation of Smart Distribution Networks (OOSDN) [16] and the Load Forecasting (LF) [17]. OOSDN plays a key role for the sufficient power delivery to consumers, the integration of RES, and the economic energy management. The operation of power distribution systems can be divided into real-time operation, when actions and commands occur in short time periods and are based on communication signals and state-estimation algorithms, and scheduled operation, when one day (or more days) ahead schedule is planned based on the demand and renewable power generation forecasting. Instead, LF techniques are used to predict future energy requirements of a system based on previous data, weather conditions, and availability of RES, ensuring the balance between demand and supply of energy. LF is mostly used for the prediction of future load on a given system for a specific period of time. In fact, LF can be classified into three main areas: (a) short term LF, used to predict load on hourly basis up to one week for daily running and cost minimization; (b) medium term LF that usually predicts load on weekly, monthly, and yearly basis for efficient operational planning; (c) long term LF, used to predict load up 50 years ahead to facilitate the expansion planning [17].
With this in mind, it is evident that the mathematical tools that are usually employed to extract features of short-time phenomena or devoted to the real-time operation are different from the ones utilized to study the medium term phenomena. For example, Refs. [18,19] propose approaches to study the power quality of PDS, thus devoted to analyze short time phenomena. Other tools to study the short-time electrical behavior of the PDS are based on the Phasor Measurement Unit (PMU), which is an instrument that is able to measure amplitude, phase, frequency, and Rate of Change of Frequency (ROCOF) of voltage and current waveforms. PMUs are largely used at the transmission level of the power systems for protection purposes, while today, they are also utilized at the distribution level for several applications [20], because of the known issues that are related to the injection of PV power into the grid. Instead, other mathematical tools are employed to study the medium-term issues of PDS. Examples are [21,22] for the forecasting, ref. [23] for the reliability, ref. [24] for the interaction with several RES, and so on. In particular, Wavelet Analysis (WA) is often utilized in this research area to detect and classify faults [25], to load forecast [26], and to monitor the PMU [27]. In [28], WA is utilized also in conjunction with the Empirical Mode Decomposition (EMD)—deriving from the Hilbert-Huang Transform (HHT)—to classify the power quality disturbances, while EMD is also integrated with artificial neural networks in [29] to forecast the short-term wind/speed of wind generators in large farm. Therefore, it is evident the importance to extract features by the electrical signals of power distribution systems, in order to prevent the failures, to attenuate the disturbances, to foresee the loads, and so on. For example, a time-frequency analysis for feature extraction is proposed in [30] with the aim to detect high-impedance faults, after having highlighted that the methods devoted to stationary signals return insufficient information, if they are applied to nonstationary and nonlinear signals. In [31], the feature extraction from the combination of the wavelet transform and of a Fourier-based method is carried out for the monitoring purposes of the insulators. A comprehensive review of the methods employed for the fault detection, classification and location in distribution systems is presented in [32], where the feature extraction is the core of the fault detection. In this context, this paper proposes a methodology, based on Fast Fourier Transform (FFT), Wavelet Analysis (WA), HHT, and the Phase Coherence (PC), with the aim to support the Distribution System Operator (DSO) for the medium-term planning of the PDS having or not the grid-connected PV plants. The proposed methodology compares the different features extracted by the different methods applied to the same dataset of PDS, showing the most suitable analysis method—or a combination of several methods—to study the electrical behavior of the PDS. In this way, the DSO, after having classified the several PDS, can directly apply the most performing method/combination, without any preliminary evaluations. For these aims, we studied three different cases, having different characteristics: residential or commercial, containing or not PV plants. These PDS are operating, so the results are based on real data and not on simulated ones. A methodology able to classify the most suitable analysis method for each typology of the PDS under investigation is proposed. This paper gives a double contribute to the state of art: the phase coherence index to compare the similarity between two electrical signals and a methodology to choose the most effective analysis method for the PDS under investigation. In particular, the phase coherence index is a measure of coherence between two time dependent signals. In this paper, the phase coherence is used two times to accomplish two purposes. In the first time, the coherence degree between a reference signal and the signal under investigation is calculated, in order to evaluate the linearity of the electrical signal. This information is used to choice the most suitable analysis method of an electrical signal, as it will be explained later. In the second case, the phase coherence index is calculated between two electrical signals of different PDS (with and without PV plants), in order to estimate the different penetration level of the PV power. The monitoring of this value can be useful to prevent the major disturbances in distribution systems, as the voltage variation [33,34] and the harmonic distortion [35]. Instead, the proposed methodology allows for selecting always the best analysis method (among HHT/FFT/WA) of the electrical signal. In fact, even if the FFT is the simplest and fastest method to use, it is able to extract all the operating modes of the electrical signal, only if it is linear and stationary. Otherwise, if the signal is linear but nonstationary, WA is more effective than FFT. Finally, if the signal is nonlinear, only HHT can extract all the operating modes.
The paper is organized as follows. Section 2 details the procedure and introduces the Phase Coherence (PC) index. Section 3 describes a real case study—constituted by three different PDS-, applies the methods, discusses the results, and classifies the methods. The conclusions are reported in Section 4.
2. Methodology
The proposed methodology to study the electrical behavior of PDS is based on the analysis of the electrical current signals. Since the electrical signals can be linear or nonlinear, stationary or nonstationary, depending on the connected loads and/or the presence of RES, there is no a unique optimal analysis method. So, the proposed methodology (as shown in the flowchart of Figure 1) is based on several checks (colored blocks) on the dataset in order to select, step by step, the most suitable method. The first check (blue block) is the linearity degree of the analyzed signal, which can be evaluated by means of the PC index (Equation (1)) that returns the coherence degree between two signals and is defined by [3]:
where FFT is the Fast Fourier Transform, while Φa and Φb represent the phases of the two electrical signals. The PC index varies in the range 0 ÷ 1, where 0 indicates that the two signals are not coherent and 1 means that they are totally coherent. In particular, PC index is used for two different aims: (i) if one of the two signals used in (1) is a reference signal (for example a sinusoidal signal), then the index provides a measure about the discrepancy of the signal under test with respect to the reference one (in this case it is named PCref); (ii) if the electrical signals deriving from two PDS are compared, the PC gives the information about the mutual similarity (here it is named PCsigs). In the first case, says that the system under investigation is linear, otherwise it is nonlinear. If the system is nonlinear, then the most suitable analysis method to characterize an electrical signal is the HHT, which extracts the time-varying oscillations, named Intrinsic Mode Function (IMF), by means of the EMD. The Hilbert transform Y(t) = H{X(t)} (Equation (2)) of a time-dependent signal X(t) is given by:
where P denotes the principal value. In this paper, the electrical signal X(t) is represented by the current i(t). The Hilbert complex extension of X(t) is , where j is the imaginary unit and the amplitude a(t) and the phase are expressed by and , respectively. The signal X(t) can be decomposed into a finite collection of IMFs [36], i.e., , with the time-dependent IMFs with variable amplitude and the non-oscillatory residue term, resulting from the sifting process. The number of oscillations of the IMFs decreases as the order of IMF increases; this depends on the iterative extraction procedure of each IMF. In fact, each step of EMD produces a new signal that is equal to the subtraction between the original one and the mean value of the envelope curves of its local maximum and minimum values.
The complex representation (Equation (3)) of each IMF is the following:
with the amplitude of , and , .
The original amplitude X(t) (Equation (4)) of the electrical signal expanded in a Fourier representation via the IMF components can be written in the form:
with Re the real part and fl the instantaneous frequency of the l-th IMF. The residue is neglected, when it is a monotonic function without the possibility to extract another IMF.
Instead, if the system is linear, it needs a second check (orange block in Figure 1) to determine whether the signal is stationary or not. The signal is stationary when the summary statistics (e.g., mean and variance) are stable during a long time, i.e., they have no trend and no variation. The verifications are usually done in two alternative ways. The first one provides that the time series is divided into more partitions and the means and variances of the groups are compared each other; this technique is known as runs test. If the differences are not statistically significant, then the time series is likely stationary. The second one is based on statistical tests (e.g., the Augmented Dickey-Fuller’s (ADF) test [37,38] based on the unit root test) and on the null hypothesis that the time series is stationary. ADF returns the p-value; so, fixing the significance level , if , the null hypothesis is rejected, and the time series is non-stationary. In this case, the most suitable method to characterize an electrical signal in the time-frequency space is the WA, which is based on a function—called wavelet mother. Here, the Morlet wavelet mother [39], which is often chosen in the applications of power systems [28], is used. There are several orthogonal wavelet families, which are the Daubechies, Symlets, Coiflets, and Meyer, whereas the criteria to select the mother wavelet are the following [40]:
- The wavelet should have an enough number of vanishing moments to represent the main features.
- The wavelet should provide sharp cutoff frequencies to reduce the amount of leakage energy.
- The total wavelet energy should be higher than that of the same feature of the same signal.
- The wavelet basis should be orthonormal.
When considering a time domain signal x(t), the continuous wavelet transform (Equation (5)) is a linear function given by:
with s and u the scale and translation parameters of the mother wavelet ψ(t) (Equation (6)) that in this case is:
where fB and fC are two characteristic parameters [41]. In addition, the HHT can be used to study linear and nonstationary signals, but it does not return further information with respect to the one obtained by WA, and the extraction of the information is more complicated. Instead, if the signal is linear and stationary, then the most suitable method is surely the FFT, because it returns reliable and fast results. Also, in this case, it is possible but less convenient to apply WA or HHT.
Finally, the penetration of PV plants can be evaluated (green block in Figure 1), calculating the PCsigs index by means of (1), where the two input signals are the current in the distribution circuit to analyze and the current flowing in a passive benchmark line. By calculating the PCsigs between other distribution circuit and the same passive benchmark, it is possible to estimate the different penetration level of PV plants in different PDS. Figure 2 resumes the applicability of the different methods.
3. Results and Discussion
The case study is constituted by several real PDS, containing active and passive circuits. The active ones are characterized by bidirectional energy fluxes, due to the presence of distributed generators that inject relevant amount of power; instead, the passive ones are interested by energy flux along a unique direction. In particular, the attention is focused on three distribution circuits, named L1, L2, and L3, having different electrical behavior. L1 is a passive distribution circuit, whereas L2 and L3 are active (Table 1). L1 has a peak power of about 100 kW and no PV plant is connected. L2 has about 108 kWp of PV power with a maximum peak of absorbed power of about 80 kW. L3 has only one 6-kWp grid-connected PV plant, with a peak-absorbed power of 50 kW. The three distribution circuits have about the same length. Moreover, the users of the L1 and L2 are almost exclusively residential, whereas L3 feeds commercial users. Regarding the acquisition system, the datalogger of DSO is set to store one sample every 10 minutes, then acquires 144 samples per day and covers the period from September 2013 to June 2014, corresponding to nine months with a total amount of about 40,000 samples. Following, the results coming from the application of the proposed methodology to the case under test are presented. Figure 3 reports the time-domain waveforms of the currents flowing in one of the three phases (specifically the phase B) for each considered distribution circuit L1, L2, and L3, during the whole period of investigation. The currents system is not symmetric (here not shown) and the maximum current values of the different circuits are different. L1 has a maximum current amplitude between 100 A and 150 A (depending on the phase), the peak amplitude of L2 is 100 A for the three phases, whereas L3 is less regular with peaks between 50 A and 80 A for the different phases. As it is evident, the distribution circuit L2 shows a more regular behavior during the whole period of acquisition than the other power distribution circuits. In addition, L3 is very noisy; this behavior can be ascribed to the typology of users that are connected to that distribution circuit.
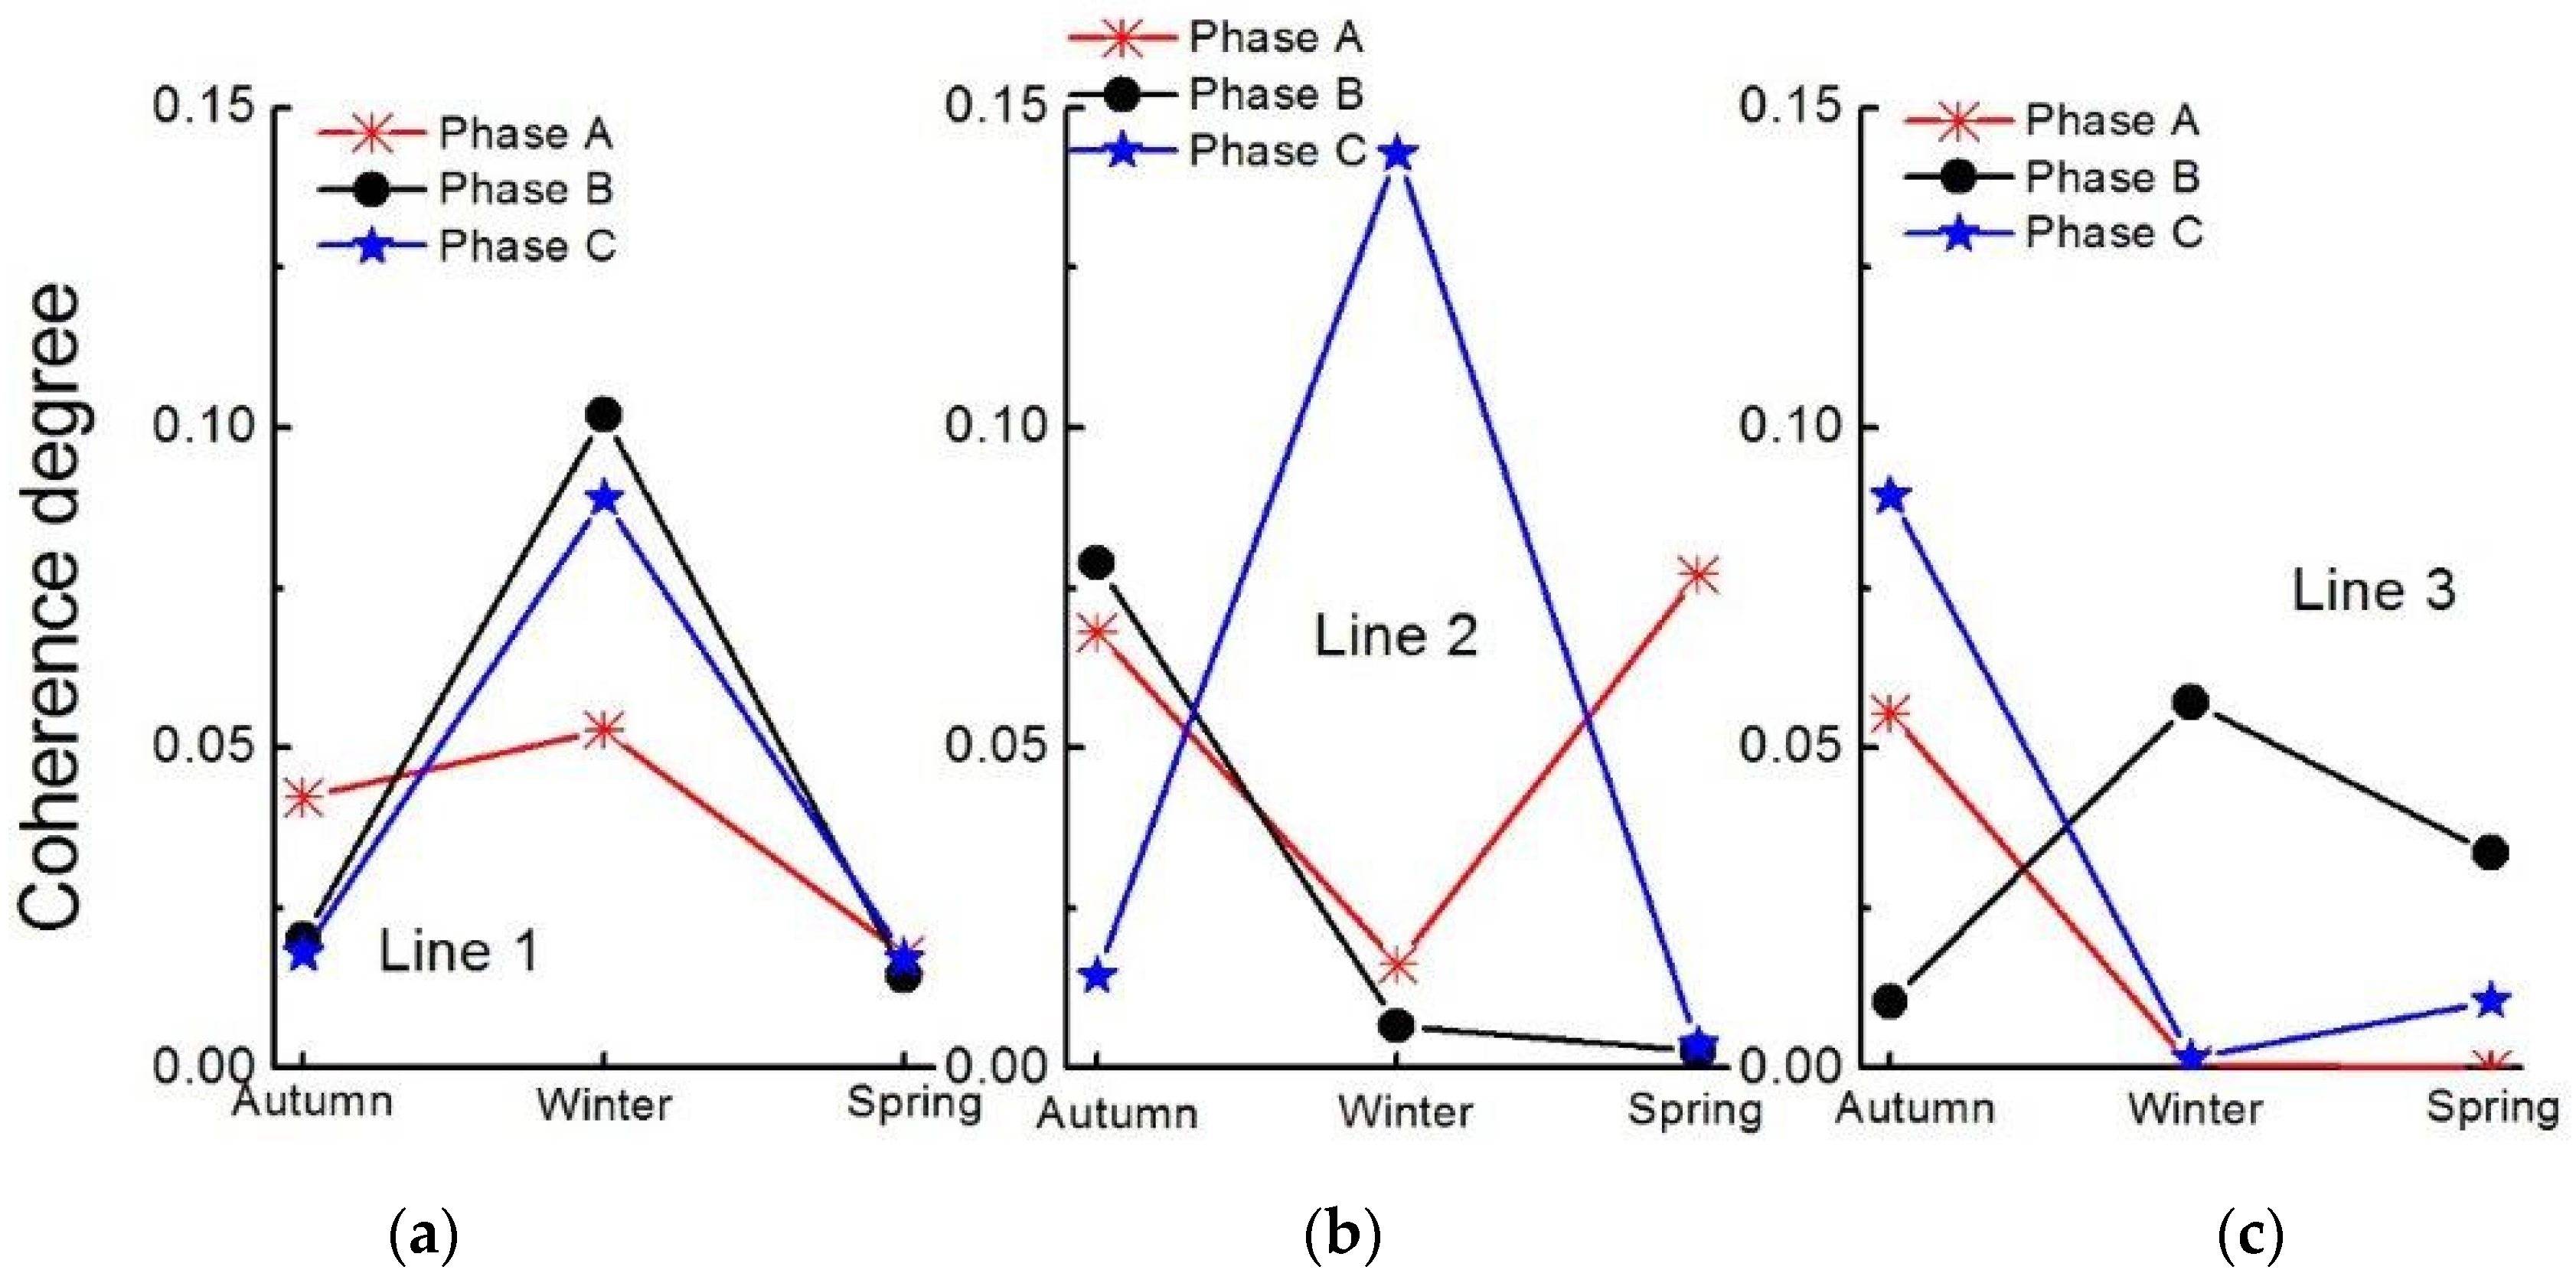
Observing the flow-chart of Figure 1, the first step is the check on the linearity of the signal, based on the PCref (it is worth mentioning that a coherence index equal to one means that the equivalent load is linear). As reference signal, a generic sinusoid with the same amplitude and frequency of the first harmonic of each line has been chosen. The analysis has been carried out during the different seasons, circuit by circuit, and phase by phase. Figure 4 shows that the value of PCref of each line/phase/season is very different from one. Moreover, L3 is, on average, the less coherent than the other two PDS; in fact, the peak value 0.10 is never reached. The phases of L1, are, on average, the most coherent ones in the winter and the index follows the same trend for the three phases. The phases of L2 have very different behavior during all the seasons; also, in the spring, when the injected PV power has the maximum value and a minimum value of the index is expected, it is true for the phases B and C, whereas the phase A shows an opposite trend. This allows for affirming that the typology of the electrical loads and their utilization affect the electrical behavior of the distribution circuit more than the contribution of the injected PV power. In general, we can also observe that for the three studied distribution circuit, the minimum values of the coherence index appear in spring. These values evidence the presence of strong nonlinearities, so the blue block of Figure 1 suggests using HHT to study the electrical signals.
HHT allows to outcome other frequency modes that the FFT is not able to find, being the Fourier analysis valid in the hypothesis of linear regime. In particular, the typical electrical signal analyzed here can exploit different working frequencies due to the non-linear and a-periodical working behavior. The results from the HHT analysis are proposed in Figure 5, where each plot is referred to single distribution circuit. Each diagram highlights the frequencies of the IMFs. Some IMFs, in the high-frequency as well as in low-frequency spectrum, could not be revealed by the FFT analysis. Moreover, a deeper analysis has been carried out, subdividing the whole dataset in three subsets, each one corresponding to a season: autumn, winter and spring (see Table 2). It is possible to observe that the number of the computed IMFs is directly related to the noise present in the electrical signal. The results are similar to the ones of Figure 5, but not all the IMFs are present in the current of each phase and of each distribution circuit. Observing the Figure 5 and the Table 2, it results that L3 is noisier than the other two, as highlighted by the largest number of IMFs obtained from the HHT analysis. This behavior depends on the typology of the connected users (we remind that L3 is the commercial distribution circuit).
Now, in order to appreciate the usefulness of the proposed index PCref for suggesting the most suitable method to study the electrical signals, the FFT and the WA are applied to the same dataset, showing that only partial results would have been obtained with respect to the ones calculated by HHT.
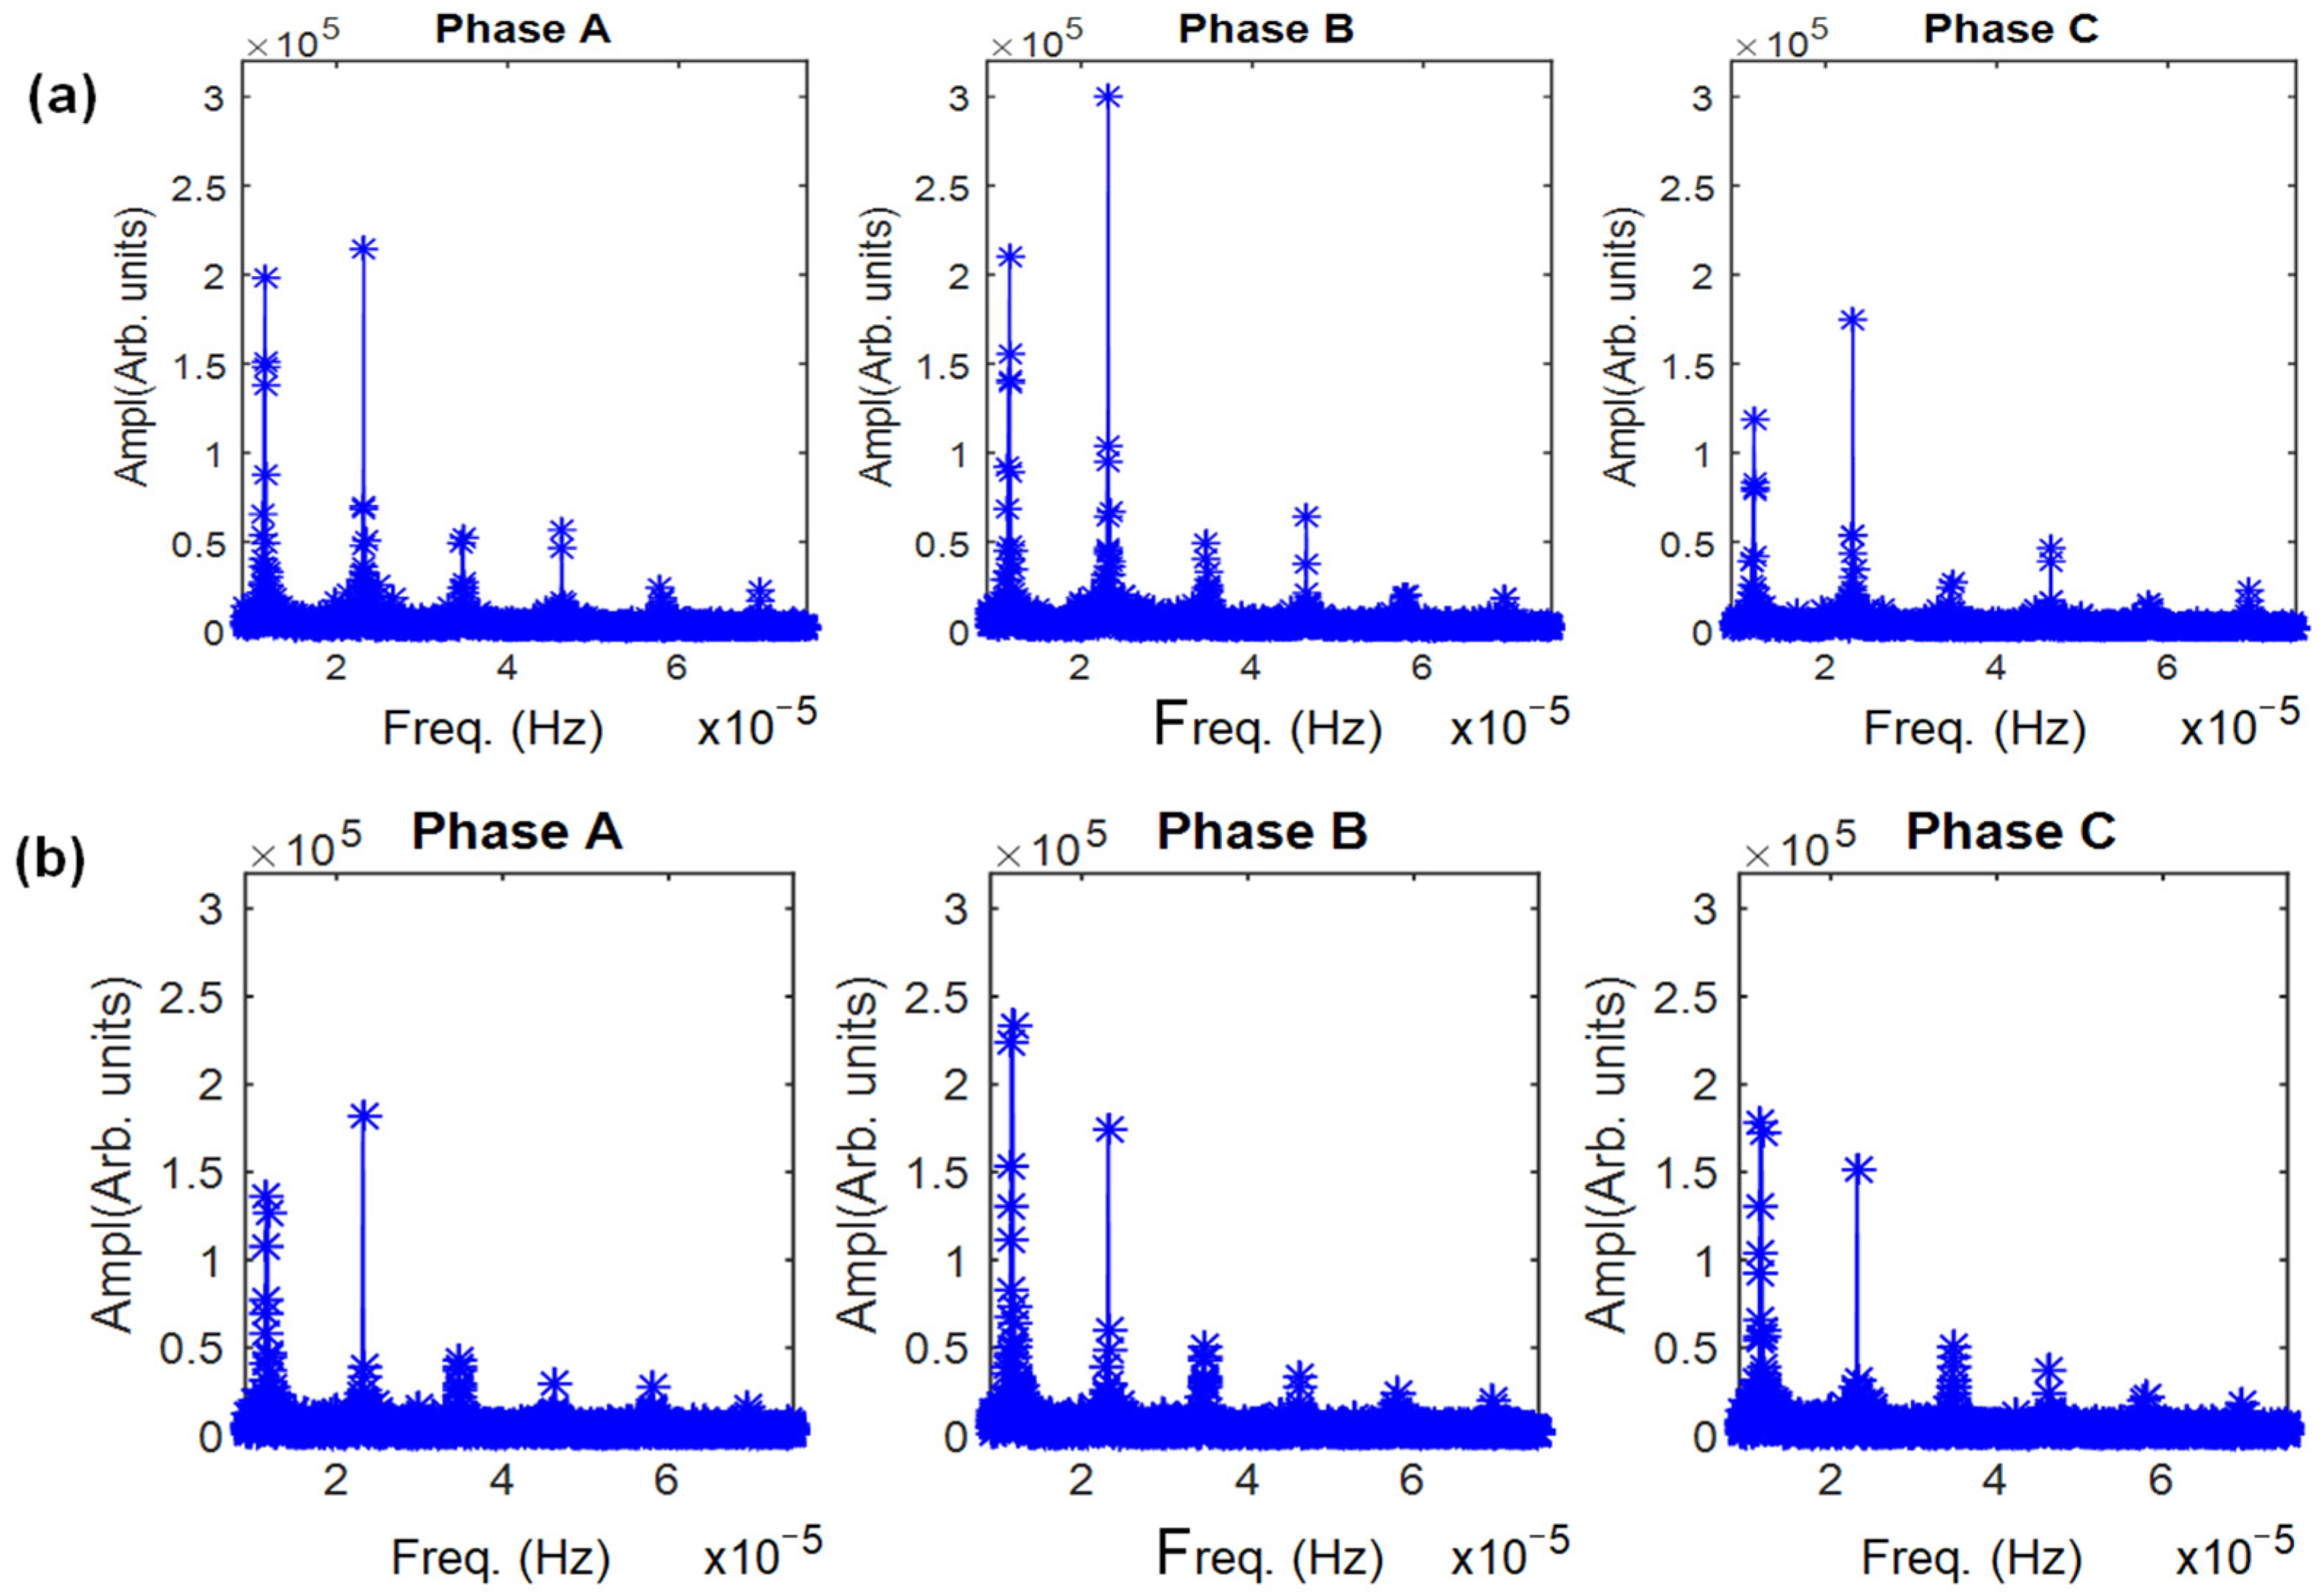
In fact, let us firstly consider the results from FFT (Figure 6). It can be noted that the main harmonics are located at the same frequencies, even if the amplitudes of the harmonics vary either for different phases of the same distribution circuit either for different distribution circuits. The main excited modes are related to the time periods 24 h and 12 h associated to the first and second frequency peak (11.63 µHz and 23.17 µHz, respectively). In addition, the higher order harmonics are also present but with a smaller peak amplitude.
Comparing Figure 5 and Figure 6, it is evident that HHT returns richer information than FFT, revealing operating modes that are not captured by the FFT. In fact, while the FFT evidences only the fundamental component and its higher harmonics, the HHT also shows non-multiple behaviors of the fundamental one. This happens because the dataset is nonlinear and nonstationary, with the consequence that only HHT can give the complete information, whereas FFT shows its limits. Lastly, let us apply the WA (Figure 7), which provides frequency vs time information. Basically, for the different cases reported, only two evident harmonics are excited, the fundamental one and the second one. However, a different temporal behavior is shown. In fact, it is easy to observe the fundamental component in all of the phases of the distribution circuits L1 and L2 (more evident in L1) for the whole period, whereas the first harmonic of the line L3 (f = 11.63 µH) has an intermittent behavior. Concerning the second harmonic (f = 23.13 µH), it is possible to observe that it is quite constant during the whole temporal window for L1, it is intermittent for L3, whereas the amplitude of L2 is quite small. With this in mind, it results that the presence of PV plant can influence the second harmonic behavior; in fact, the second harmonic is negligible for L2, which has a great amount of PV power, whereas it is quite constant for L1, which has no PV plant connected. So, it results that WA gives more information than FFT in the case of non-stationary signals, because WA can extract the frequency components for many temporal windows inside the total investigation time. Nevertheless, also, the frequency components extracted by WA are less than the ones extracted by HHT, because WA is not suitable to strongly study nonlinear signals.
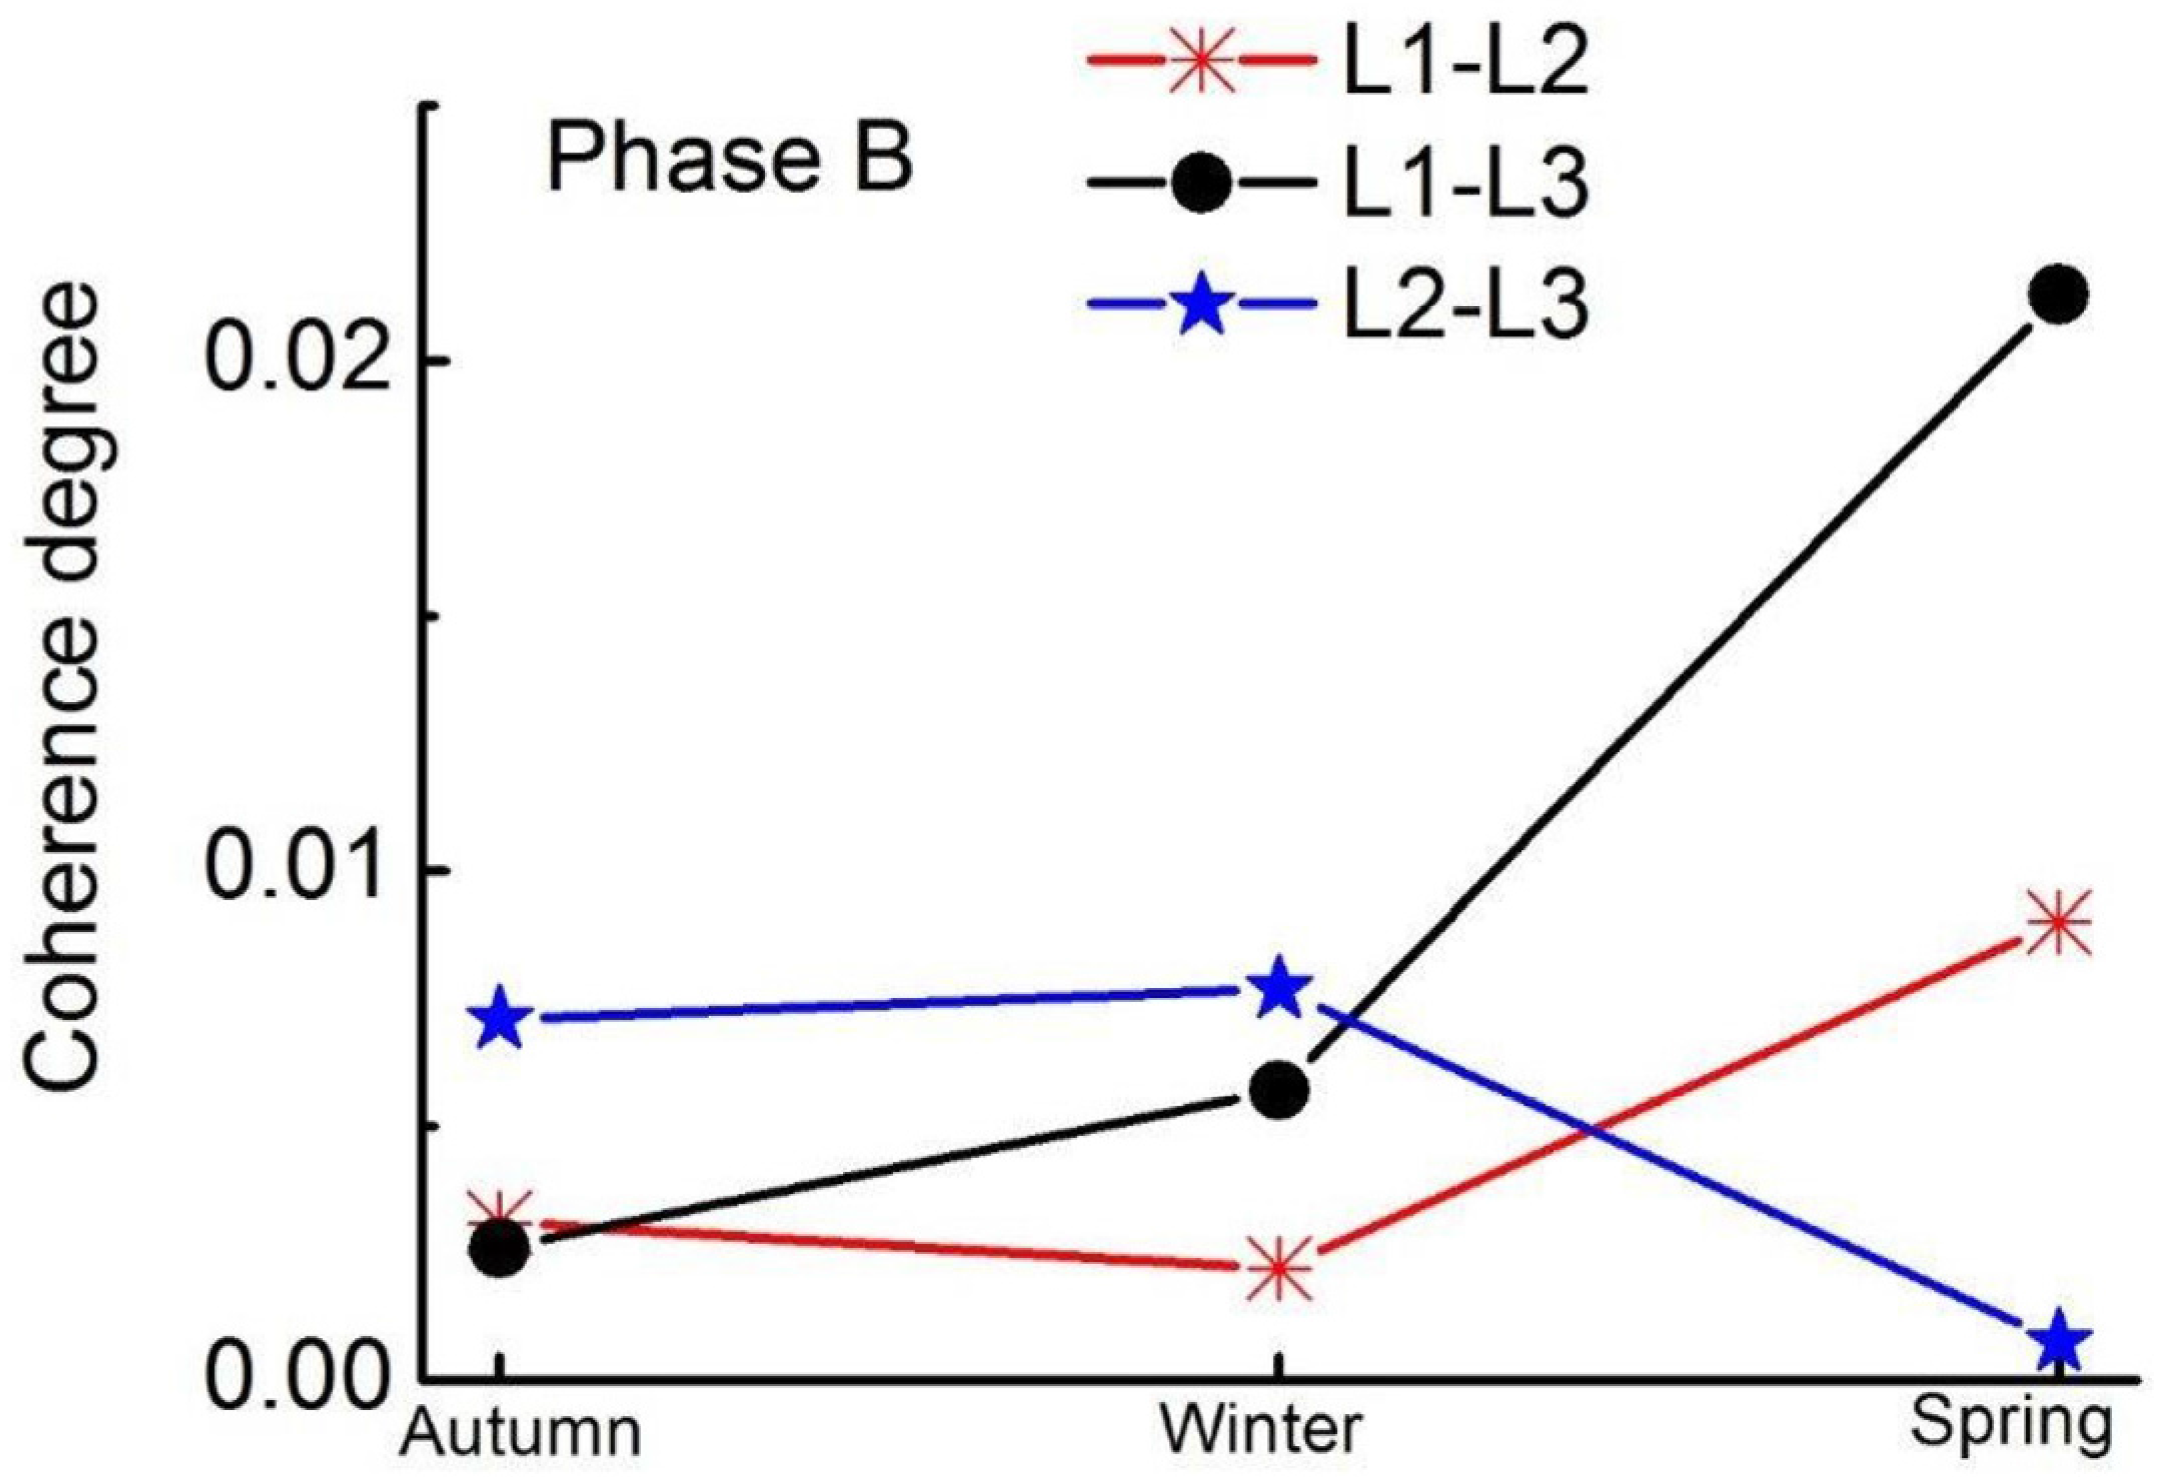
Finally, to estimate the PV penetration, the PCsigs for the three possible combinations among the three distribution circuits under investigation have been calculated, choosing just one phase of each distribution circuit (the phase B in this case, but similar behaviors have been found for the other phases): current of L1 versus current of L2, current of L1 versus current of L3, current of L2 versus current of L3. The three indices are calculated for the three seasons (Figure 8). It results that the distribution circuit L2 and L3 (both fed also by the PV generators) are the most coherent ones during the autumn and winter, instead L1 and L2 are the less coherent ones, because L1 is a passive distribution circuit, whereas L2 has the larger amount of PV power. The coherence degree between the distribution circuits L1 and L3 has an intermediate value. In spring, the great amount of current that is injected in L2 by the 108 kWp-PV generators completely modifies the mutual interactions. However, in general, the comparison of the coherence degrees of distinct active distribution circuits with respect to a common passive one can provide useful qualitative information about the presence of PV plants.
From all the previous analyses, it results that the main key findings of the proposed methodology are two. The first one regards the PCsig index that allows to distinguish the distribution circuits with different PV penetration, simply calculating an index. The monitoring of the PCsig can be useful to prevent the major disturbances in distribution systems, as the voltage variation and the harmonic distortion. Secondly, the proposed procedure allows to select the best analysis method among HHT/FFT/WA. In fact, even if the FFT is the simplest and fastest method to use, nevertheless, as evidenced above, the extraction of all the operating modes in presence of strongly nonlinear signals is possible only by using HHT. In fact, in the case study, several operating modes are not detected correctly by the FFT neither by the WA, but it is necessary to use mathematical methods (like the HHT) that are able to extract the main features of a non-linear, non-stationary, and non-periodic electrical signal.
4. Conclusions
In this paper, a methodology to select the best performing mathematical tool to study PDS, on the basis of its degree of both the linearity and the stationarity, has been proposed. This methodology can be applied in presence or in absence of distributed generators. In particular, different typologies of distribution circuits have been considered (residential, commercial, with or without connected PV plants), in order to verify the goodness of the proposed methodology. The case study has been based on the data of real and operating PDS and not on simulation data. After the preliminary study of the temporal evolution of the current of each distribution circuit, the index PCref has been introduced to test the linearity degree of the electrical signal. A second check is done to define whether the signal is stationary. These verifications help the user to select the most appropriate method to study a generic electrical signal.
The proposed methodology has been applied to three different PDS, with the following results. The FFT analysis, which is also the most common mathematical tool, is very easy to be implemented, but is not useful to study signals with important nonlinearities. If the signal is not stationary, then the FFT does not take into account this effect. In order to observe the nonstationary characteristic of the signal, the wavelet transform is a better approach than FFT, because it shows the amplitude of the excited frequency modes of the signal as a function of the time evolution.
Both FFT and WA are based on a linear approach; therefore, they are not able to study the frequency behavior of signals having strongly nonlinear characteristics. In the presence of nonlinear electrical signals, the HHT shows the best performance with respect to both FFT and WA, exploiting the excited modes in the frequency regime.
Finally, the use of the PCsig index has allowed evaluating the penetration of the PV power, on a seasonal basis, thanks to the use of a benchmark passive distribution circuit. Since the proposed approach allows for the feature extraction of the PDS, the future works will be the extension of this procedure for the load forecasting of PDS and for the fault detection issues.
Author Contributions
Silvano Vergura and Mario Carpentieri conceived and designed the experiments; Silvano Vergura performed the experiments; Silvano Vergura and Mario Carpentieri analyzed the data and wrote the paper.
Conflicts of Interest
The authors declare no conflict of interest.
References
- Bayer, M.A.; Laney, D. The Importance of Big Data: A Definition; Gartner: Stamford, CT, USA, 2012. [Google Scholar]
- Tcheou, M.P.; Lovisolo, L.; Ribeiro, M.V.; da Silva, E.A.B.; Rodrigues, M.A.M.; Romano, J.M.T.; Diniz, P.S.R. The Compression of Electric Signal Waveforms for Smart Grids: State of the Art and Future Trends. IEEE Trans. Smart Grid 2014, 5, 291–302. [Google Scholar] [CrossRef]
- Vergura, S.; Zivieri, R.; Carpentieri, M. Indices to study the Electrical Power Signals in Active and Passive Distribution Lines: A Combined Analysis with Empirical Mode Decomposition. Energies 2016, 9, 211. [Google Scholar] [CrossRef]
- Vergura, S.; Zivieri, R.; Carpentieri, M. Seasonal Signal Analysis of Distribution Lines in Smart Grids via Hilbert-Huang Transform. In Proceedings of the 2015 IEEE 15th International Conference on Environment and Electrical Engineering (EEEIC), Roma, Italy, 10–13 June 2015; pp. 1420–1425. [Google Scholar] [CrossRef]
- Zivieri, R.; Vergura, S.; Carpentieri, M. Analytical and numerical solution to the nonlinear cubic Duffing equation: An application to electrical signal analysis of distribution lines. Appl. Math. Model. 2016, 40, 9152–9164. [Google Scholar] [CrossRef]
- Eftekharnejad, S.; Vittal, V.; Heydt, G.T.; Keel, B.; Loehr, J. Impact of Increased Penetration of Photovoltaic Generation on Power Systems. IEEE Trans. Power Syst. 2013, 28, 893–901. [Google Scholar] [CrossRef]
- Bottaccioli, L.; Estebsari, A.; Patti, E.; Pons, E.; Acquaviva, A. A novel integrated real-time simulation platform for assessing photovoltaic penetration impacts in smart grids. Energy Procedia 2017, 111, 780–789. [Google Scholar] [CrossRef]
- Gopakumar, P.; Reddy, M.J.B.; Mohanta, D.K. Stability Concerns in Smart Grid with Emerging Renewable Energy Technologies. Int. J. Electr. Power Compon. Syst. 2014, 42, 418–425. [Google Scholar] [CrossRef]
- Hung, D.Q.; Mithulananthan, N.; Lee, K.Y. Determining PV penetration for distribution systems with time-varying load models. IEEE Trans. Power Syst. 2014, 29, 3048–3057. [Google Scholar] [CrossRef]
- Vergura, S. Scalable Model of PV Cell in Variable Environment Condition based on the Manufacturer Datasheet for Circuit Simulation. In Proceedings of the 2015 IEEE 15th International Conference on Environment and Electrical Engineering (EEEIC), Roma, Italy, 10–13 June 2015. [Google Scholar]
- Hayes, W.; Ngan, L. A time-dependent model for CdTe PV module temperature in utility-scale systems. IEEE J. Photovolt. 2015, 5, 238–242. [Google Scholar] [CrossRef]
- Vergura, S. A Complete and Simplified Datasheet-based Model of PV Cells in Variable Environmental Conditions for Circuit Simulation. Energies 2016, 9, 326. [Google Scholar] [CrossRef]
- Patsalides, M.; Efthymiou, V.; Stavrou, A.; Georghiou, G.E. Simplified distribution grid model for power quality studies in the presence of photovoltaic generators. IET Renew. Power Gener. 2015, 9, 618–628. [Google Scholar] [CrossRef]
- Kayal, P.; Chanda, C.K. A multi-objective approach to integrate solar and wind energy sources with electrical distribution network. Sol. Energy 2015, 112, 397–410. [Google Scholar] [CrossRef]
- Kazmi, S.A.A.; Shahzad, M.K.; Khan, A.Z.; Shin, D.R. Smart Distribution Networks: A Review of Modern Distribution Concepts from a Planning Perspective. Energies 2017, 10, 501. [Google Scholar] [CrossRef]
- Evangelopoulos, V.A.; Georgilakis, P.S.; Hatziargyriou, N.D. Optimal operation of smart distribution networks: A review of models, methods and future research. Electr. Power Syst. Res. 2016, 140, 95–106. [Google Scholar] [CrossRef]
- Khan, A.R.; Mahmood, A.; Safdar, A.; Khan, Z.A.; Khan, N.A. Load forecasting, dynamic pricing and DSM in smart grid: A review. Renew. Sustain. Energy Rev. 2016, 54, 1311–1322. [Google Scholar] [CrossRef]
- Farzanehrafat, A.; Watson, R. Power Quality State Estimator for Smart Distribution Grids. IEEE Trans. Power Syst. 2013, 28, 2183–2191. [Google Scholar] [CrossRef]
- Urbina-Salas, I.; Razo-Hernandez, J.R.; Granados-Lieberman, D.; Valtierra-Rodriguez, M.; Torres-Fernandez, J.E. Instantaneous Power Quality Indices Based on Single-Sideband Modulation and Wavelet Packet-Hilbert Transform. IEEE Trans. Instrum. Meas. 2017, 6, 1021–1031. [Google Scholar] [CrossRef]
- Wache, M.; Murray, D.C. Application of Synchrophasor Measurements for distribution networks. In Proceedings of the 2011 IEEE Power and Energy Society General Meeting, Detroit, MI, USA, 24–29 July 2011; pp. 1–4. [Google Scholar]
- Dellino, G.; Laudadio, T.; Mari, R.; Mastronardi, N.; Meloni, C.; Vergura, S. Energy Production Forecasting in a PV plant using Transfer Function Models. In Proceedings of the 2015 IEEE 15th International Conference on Environment and Electrical Engineering (EEEIC), Rome, Italy, 10–13 June 2015. [Google Scholar]
- Hayes, B.P.; Gruber, J.K.; Prodanovic, M. A Closed-Loop State Estimation Tool for MV Network Monitoring and Operation. IEEE Trans. Smart Grid 2015, 6, 2116–2125. [Google Scholar] [CrossRef]
- Ding, Y.; Singh, C.; Goel, L.; Østergaard, J.; Wang, P. Short-Term and Medium-Term Reliability Evaluation for Power Systems with High Penetration of Wind Power. IEEE Trans. Sustain. Energy 2014, 5, 896–906. [Google Scholar] [CrossRef]
- Marí, L.; Nabona, N. Renewable Energies in Medium-Term Power Planning. IEEE Trans. Power Syst. 2015, 30, 88–97. [Google Scholar] [CrossRef]
- Li, W.; Monti, A.; Ponci, F. Fault Detection and Classification in Medium Voltage DC Shipboard Power Systems with Wavelets and Artificial Neural Networks. IEEE Trans. Instrum. Meas. 2014, 63, 2651–2665. [Google Scholar] [CrossRef]
- Sun, X.; Luh, P.B.; Cheung, K.W.; Guan, W.; Michel, L.D.; Venkata, S.S.; Miller, M.T. An Efficient Approach to Short-Term Load Forecasting at the Distribution Level. IEEE Trans. Power Syst. 2016, 31, 2526–2537. [Google Scholar] [CrossRef]
- Kim, D.; Chun, T.Y.; Yoon, S.; Lee, G.; Shin, Y. Wavelet-Based Event Detection Method Using PMU Data. IEEE Trans. Smart Grid 2017, 8, 1154–1162. [Google Scholar] [CrossRef]
- Liu, Z.; Cui, Y.; Li, W. A Classification Method for Complex Power Quality Disturbances Using EEMD and Rank Wavelet SVM. IEEE Trans. Smart Grid 2015, 6, 1678–1685. [Google Scholar] [CrossRef]
- Hong, Y.Y.; Yu, T.-H.; Liu, C. Hour-ahead wind speed and power forecasting using empirical mode decomposition. Energies 2013, 6, 6137–6152. [Google Scholar] [CrossRef]
- Ghaderi, A.; Mohammadpour, H.A.; Ginn, H.L.; Shin, Y.J. High-Impedance Fault Detection in the Distribution Network Using the Time-Frequency-Based Algorithm. IEEE Trans. Power Deliv. 2015, 30, 1260–1268. [Google Scholar] [CrossRef]
- Prasad, P.S.; Rao, B.P. Condition monitoring of 11 kV overhead power distribution line insulators using combined wavelet and LBP-HF features. IET Gener. Transm. Distrib. 2017, 11, 1144–1153. [Google Scholar] [CrossRef]
- Chen, K.; Huang, C.; He, J. Fault detection, classification and location for transmission lines and distribution systems: A review on the methods. IET High Volt. 2016, 1, 25–33. [Google Scholar] [CrossRef]
- Aziz, T.; Ketjoy, N. Penetration Limits in Low Voltage Networks and Voltage Variations. IEEE Access 2017, 5, 16784–16792. [Google Scholar] [CrossRef]
- Wu, Y.K.; Ye, G.T.; Shaaban, M. Analysis of Impact of Integration of Large PV Generation Capacity and Optimization of PV Capacity: Case Studies in Taiwan. IEEE Trans. Ind. Appl. 2016, 52, 4535–4548. [Google Scholar] [CrossRef]
- Chidurala, A.; Saha, T.K.; Mithulananthan, N. Harmonic impact of high penetration photovoltaic system on unbalanced distribution networks—Learning from an urban photovoltaic network. IET Renew. Power Gener. 2016, 10, 485–494. [Google Scholar] [CrossRef]
- Huang, N.E.; Shen, Z.; Long, S.R.; Wu, M.C.; Shih, H.H.; Zheng, Q.; Yen, N.-C.; Tung, C.C.; Liu, H.H. The empirical mode decomposition and the Hilbert spectrum for nonlinear and non-stationary time series analysis. Proc. R. Soc. Lond. Ser. A 1998, 454, 903–995. [Google Scholar] [CrossRef]
- Dickey, D.A.; Fuller, W.A. Distribution of the Estimators for Autoregressive Time Series with a Unit Root. J. Am. Stat. Assoc. 1979, 74, 427–431. [Google Scholar]
- Dickey, D.A.; Fuller, W.A. Likelihood Ratio Statistics for Autoregressive Time Series with a Unit Root. Econometrica 1981, 49, 1057–1072. [Google Scholar] [CrossRef]
- Goswami, J.C.; Chan, A.K. Fundamentals of Wavelets. In Theory, Algorithms and Applications, 1st ed.; Wiley-Interscience: Hoboken, NJ, USA, 2000. [Google Scholar]
- Perrier, V.; Philipovitch, T.; Basdevant, C. Wavelet spectra compared to Fourier spectra. J. Math. Phys. 1995, 36, 1506–1519. [Google Scholar] [CrossRef]
- Vergura, S.; Siracusano, G.; Carpentieri, M.; Finocchio, G. A Nonlinear and Non-Stationary Signal Analysis for Accurate Power Quality Monitoring in Smart Grids. In Proceedings of the 3rd Renewable Power Generation Conference (IET-RPG), Naples, Italy, 24–25 September 2014. [Google Scholar]
Figure 1.
Flow-chart to choose the most suitable method.
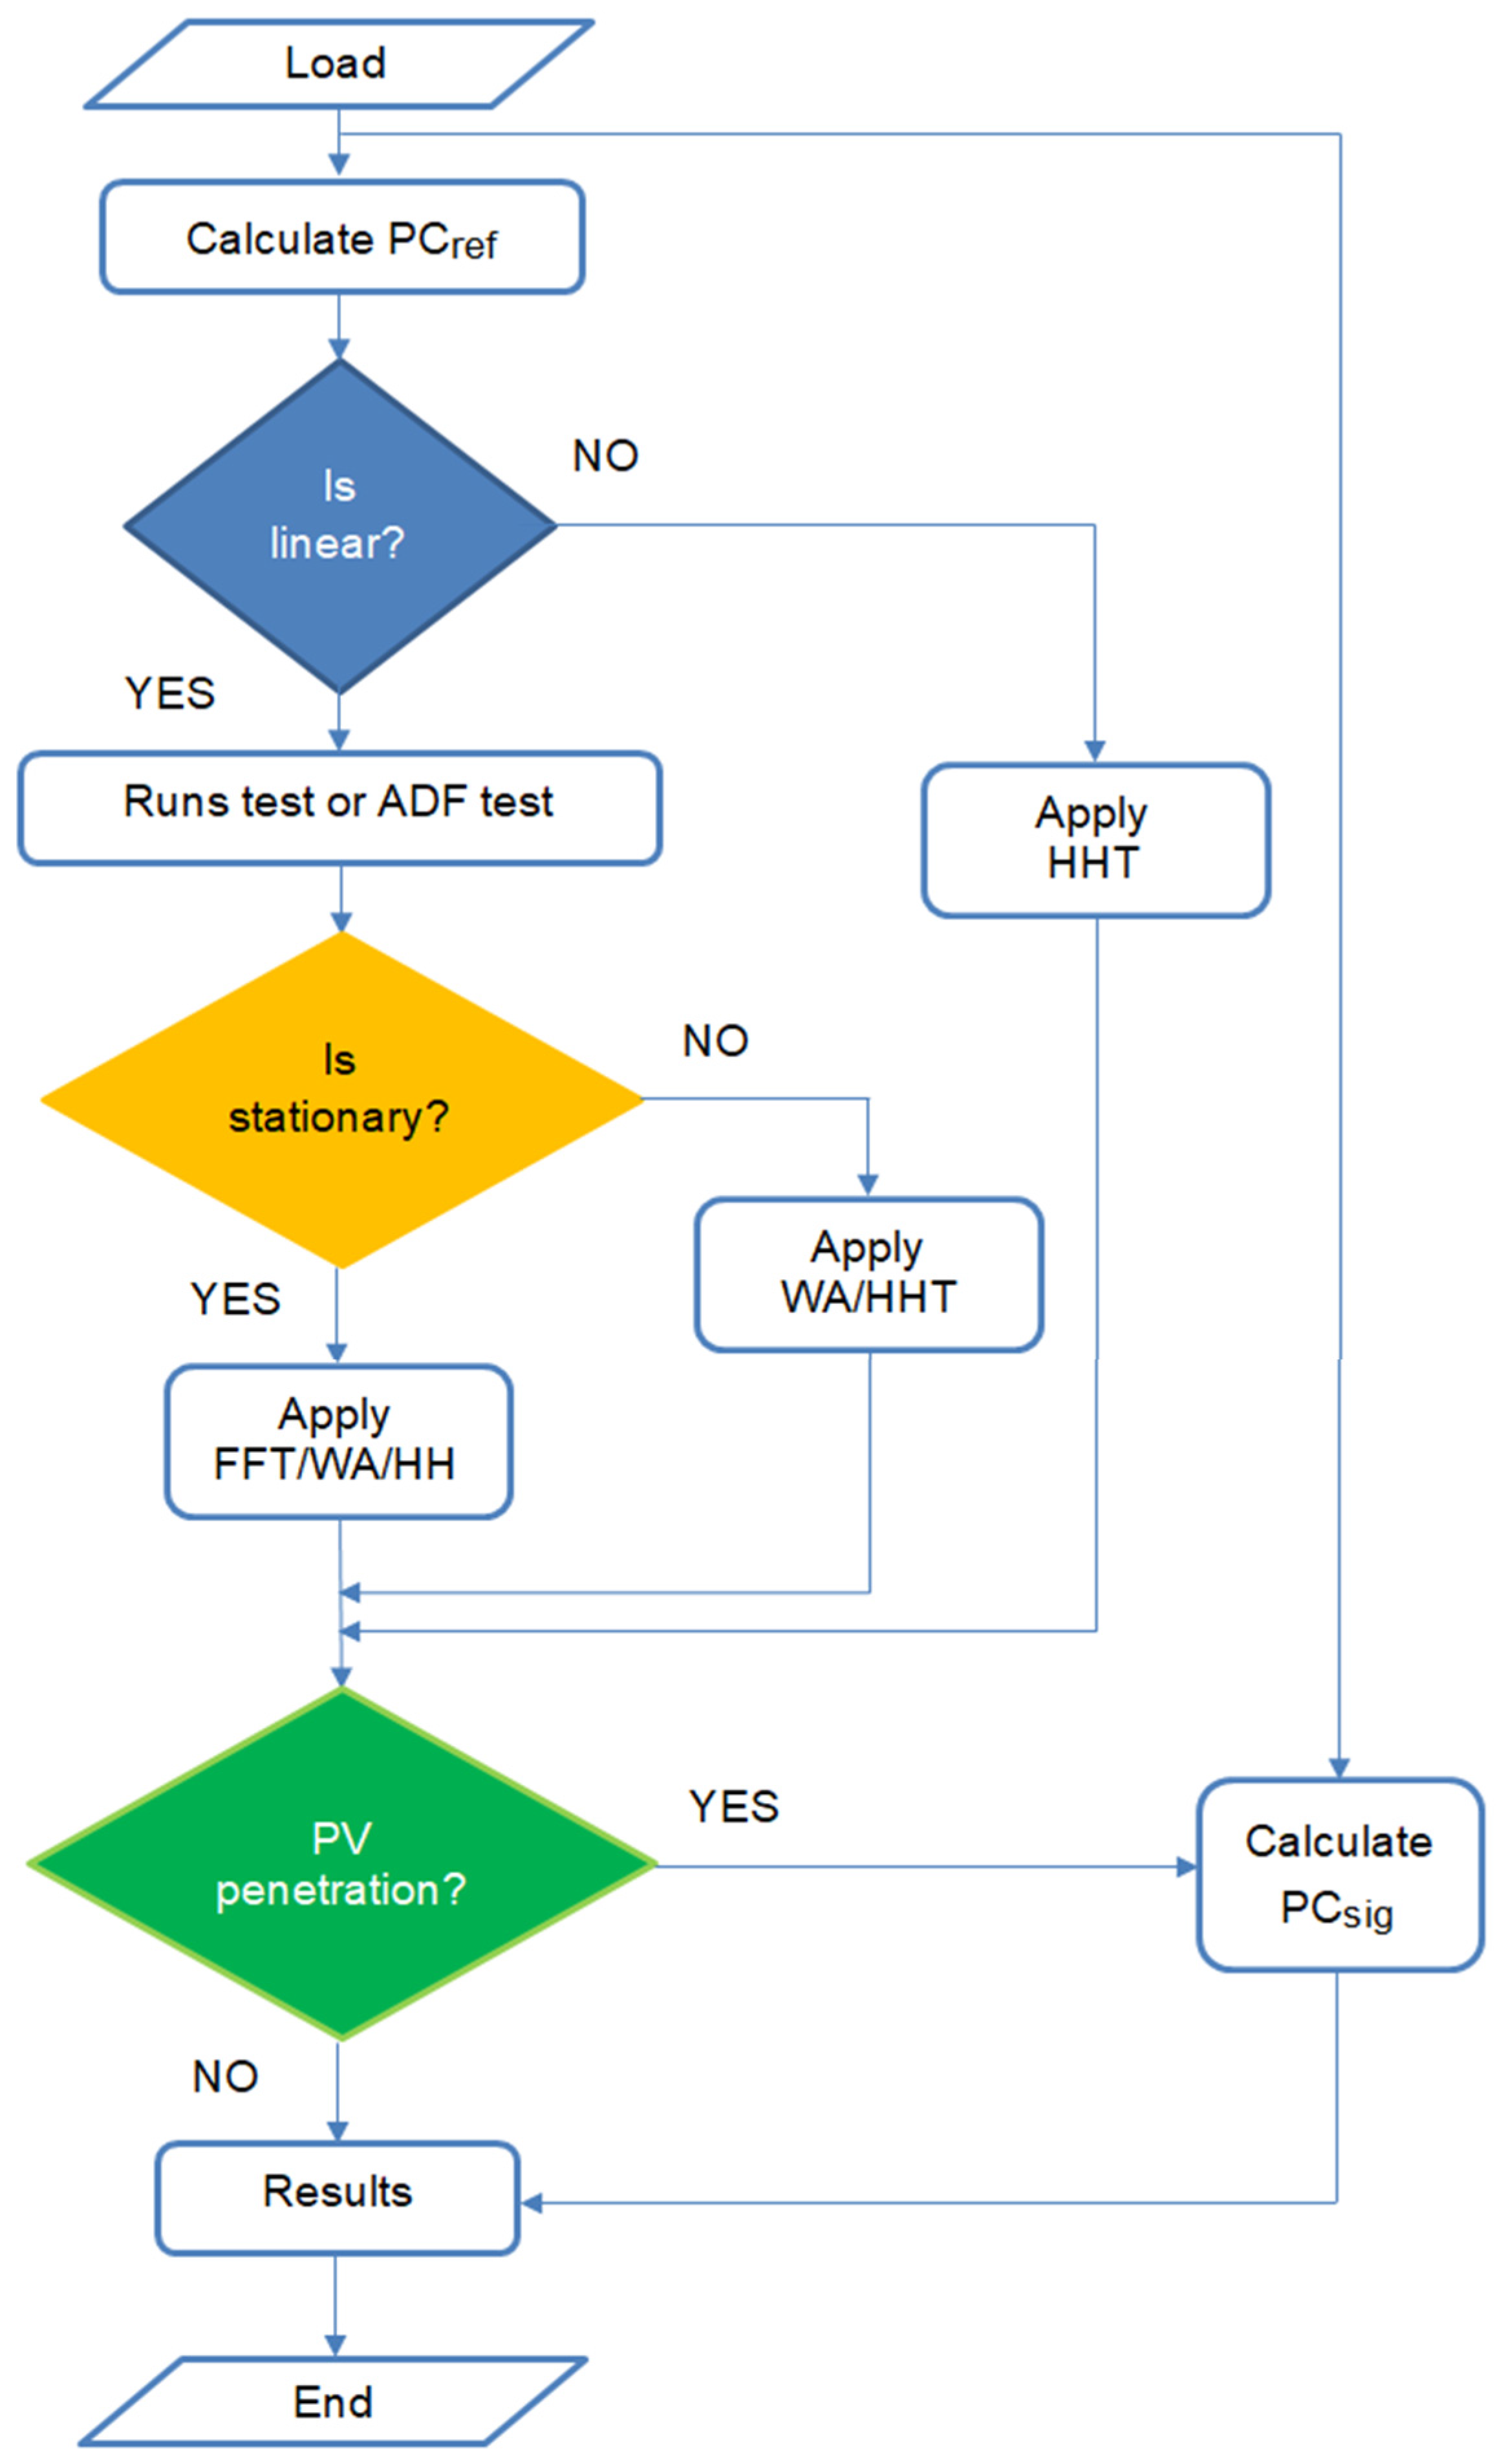
Figure 2.
Methods to analyze electrical signals of Power Distribution Systems (PDS) with PhotoVoltaic (PV) plants. (× = not applicable; √ = applicable).
Figure 2.
Methods to analyze electrical signals of Power Distribution Systems (PDS) with PhotoVoltaic (PV) plants. (× = not applicable; √ = applicable).
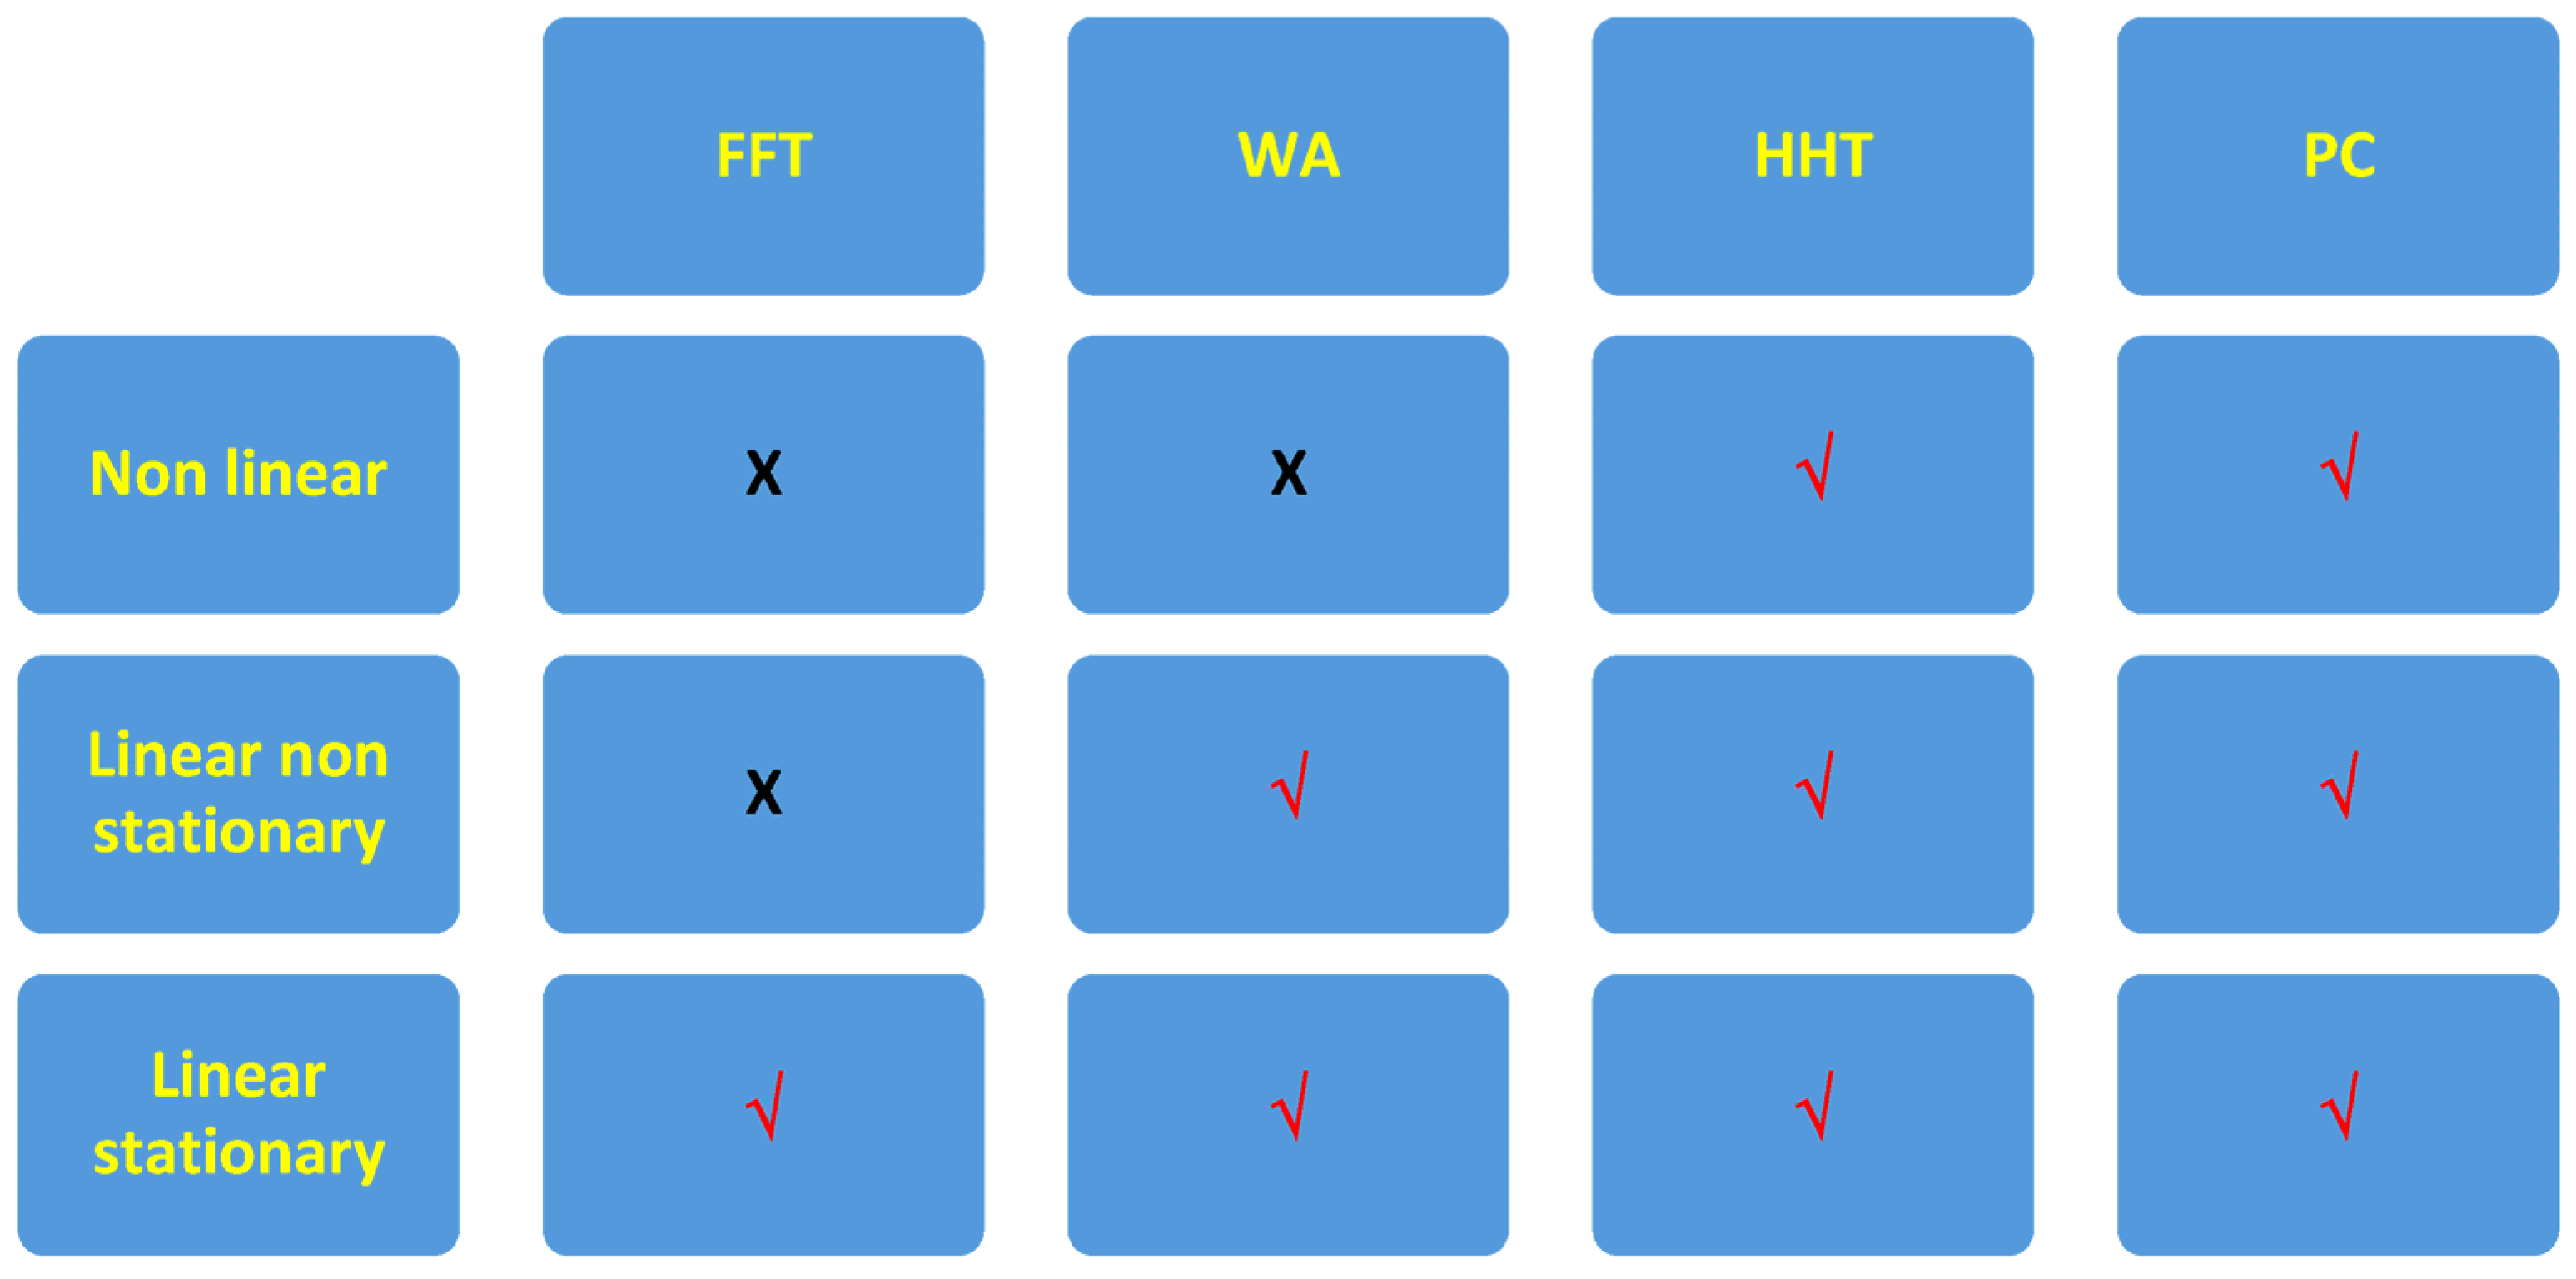
Figure 3.
Time-domain waveforms of the currents flowing into the phase B of the three distribution circuits L1, L2, L3, for the whole analysis period.
Figure 3.
Time-domain waveforms of the currents flowing into the phase B of the three distribution circuits L1, L2, L3, for the whole analysis period.
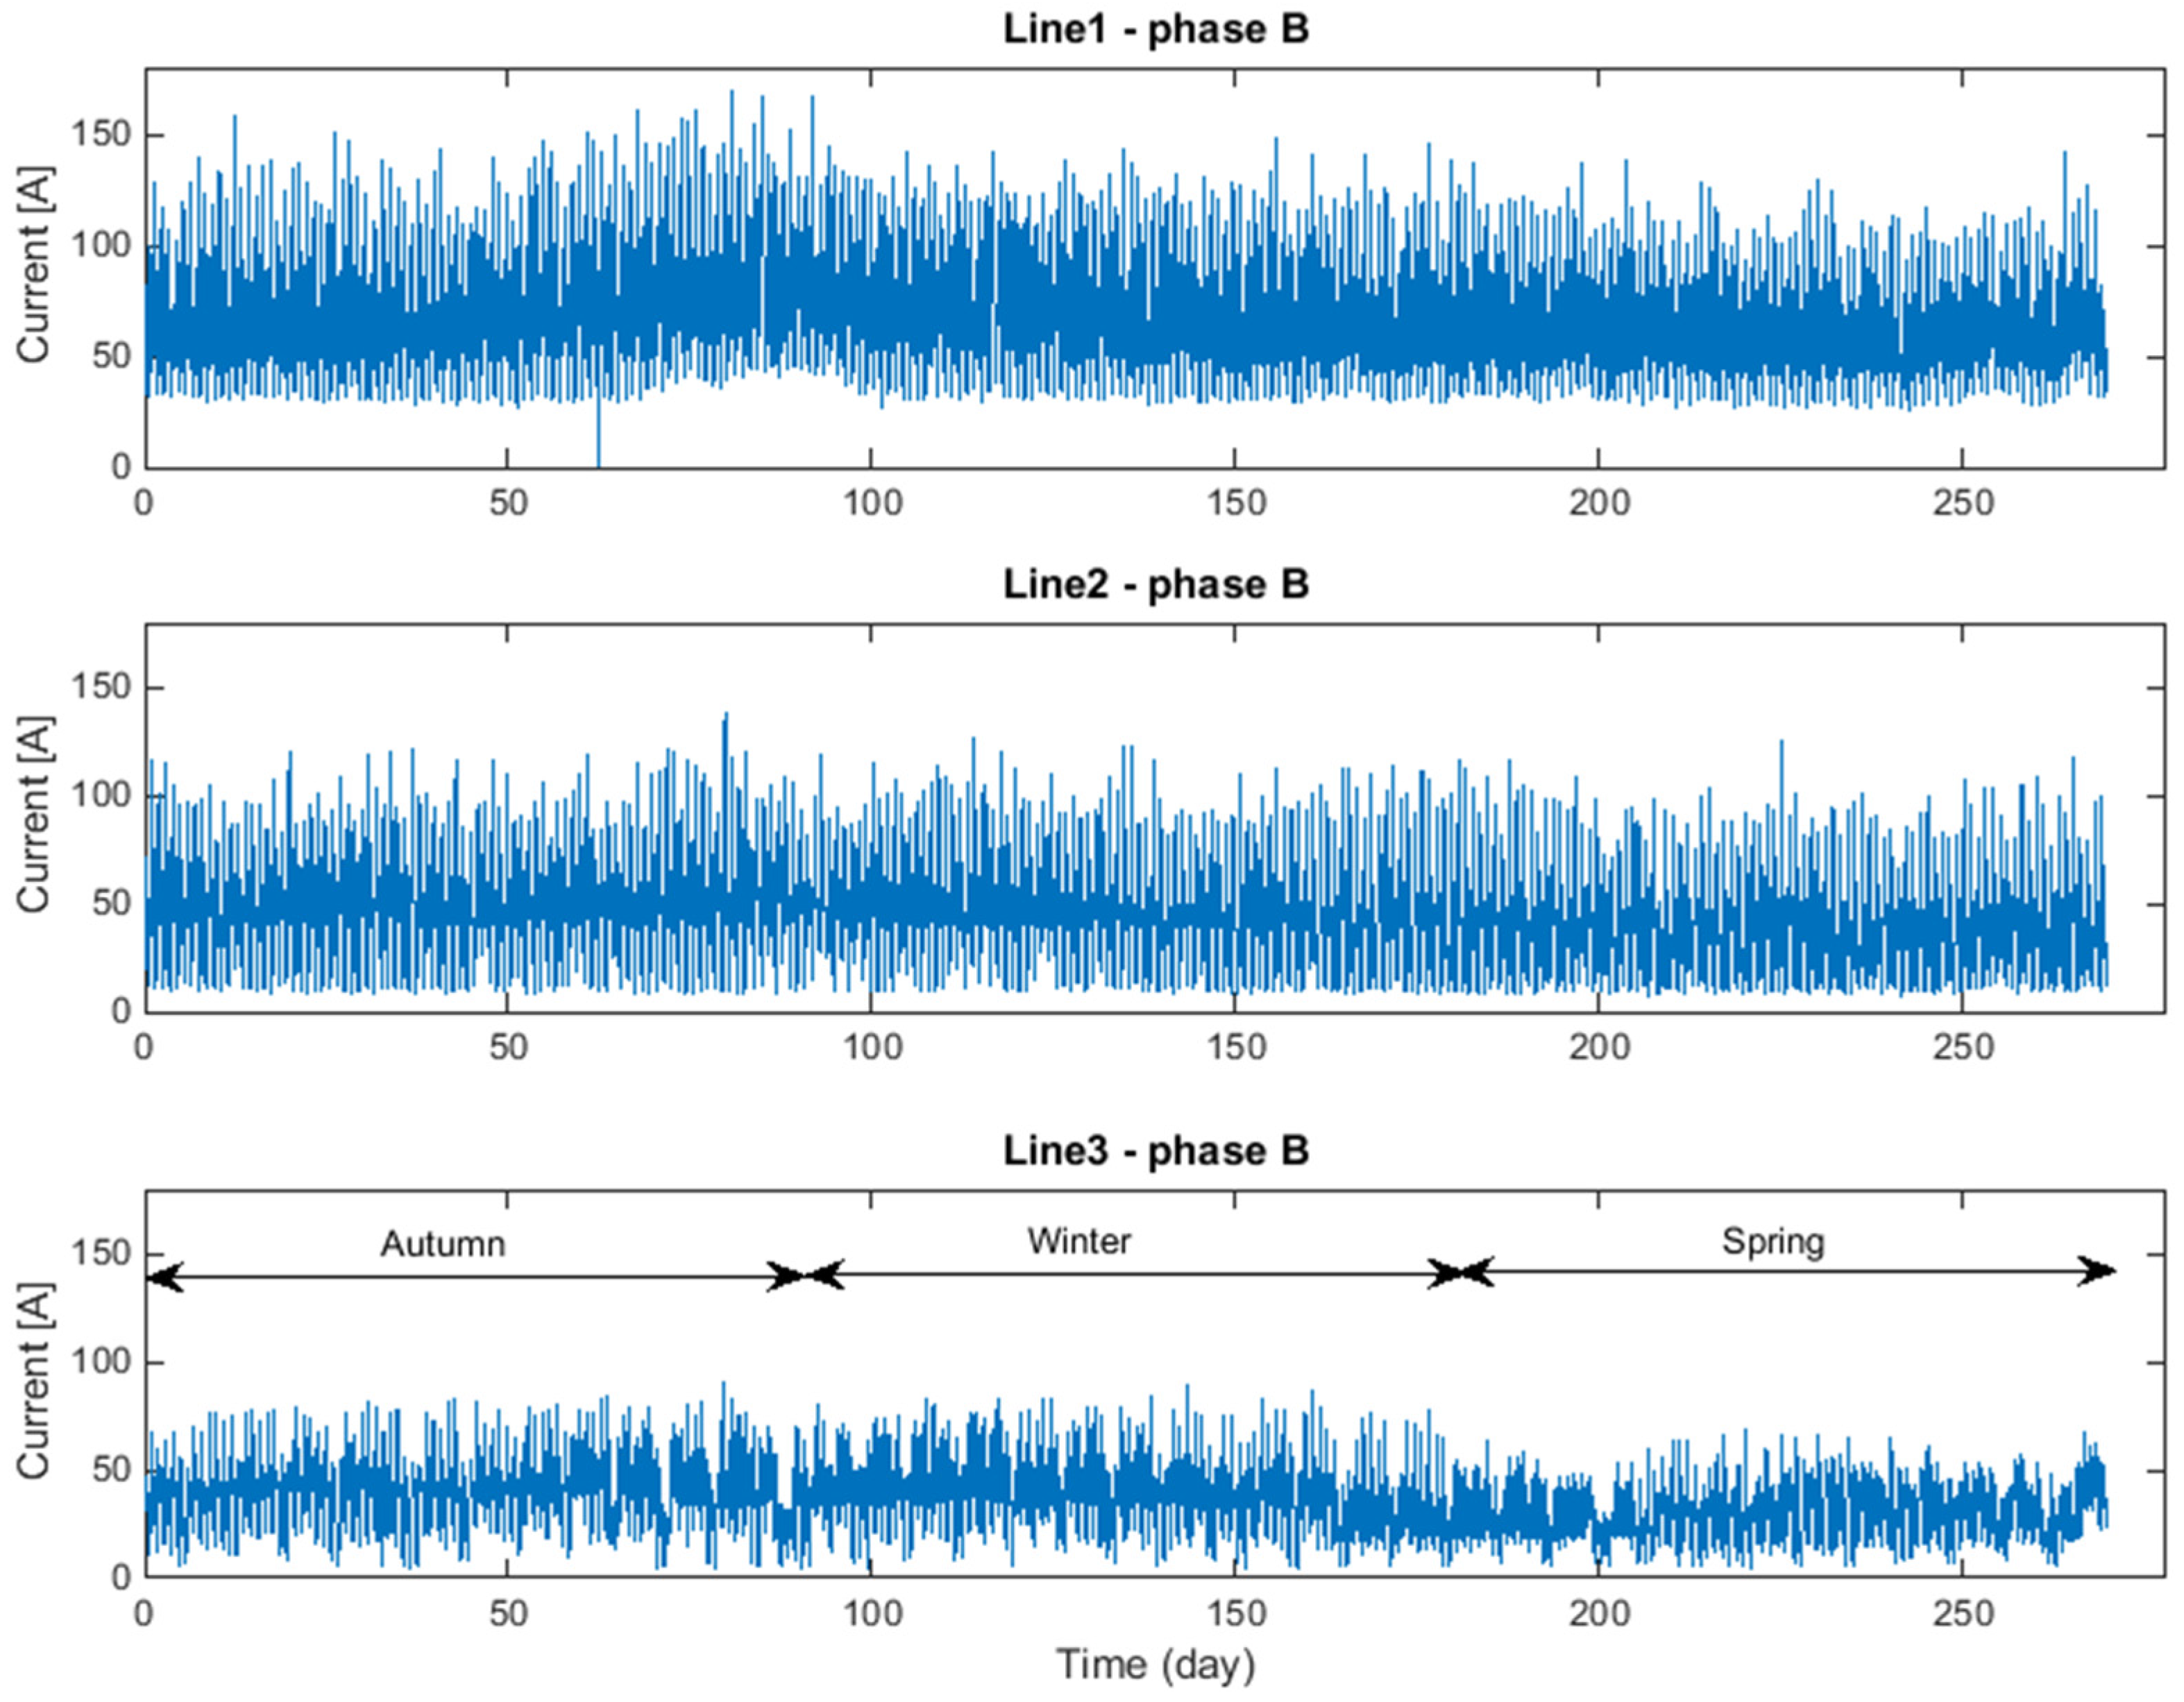
Figure 4.
Coherence degree between each current signal and a generic sinusoid (as a reference), PCref, for each phase of each distribution circuit for the different seasons. (a) L1; (b) L2; and, (c) L3.
Figure 4.
Coherence degree between each current signal and a generic sinusoid (as a reference), PCref, for each phase of each distribution circuit for the different seasons. (a) L1; (b) L2; and, (c) L3.

Figure 5.
Hilbert-Huang Transform (HHT) of the currents flowing in L1, L2, L3 for the whole period. (a) L1; (b) L2; and, (c) L3.
Figure 5.
Hilbert-Huang Transform (HHT) of the currents flowing in L1, L2, L3 for the whole period. (a) L1; (b) L2; and, (c) L3.
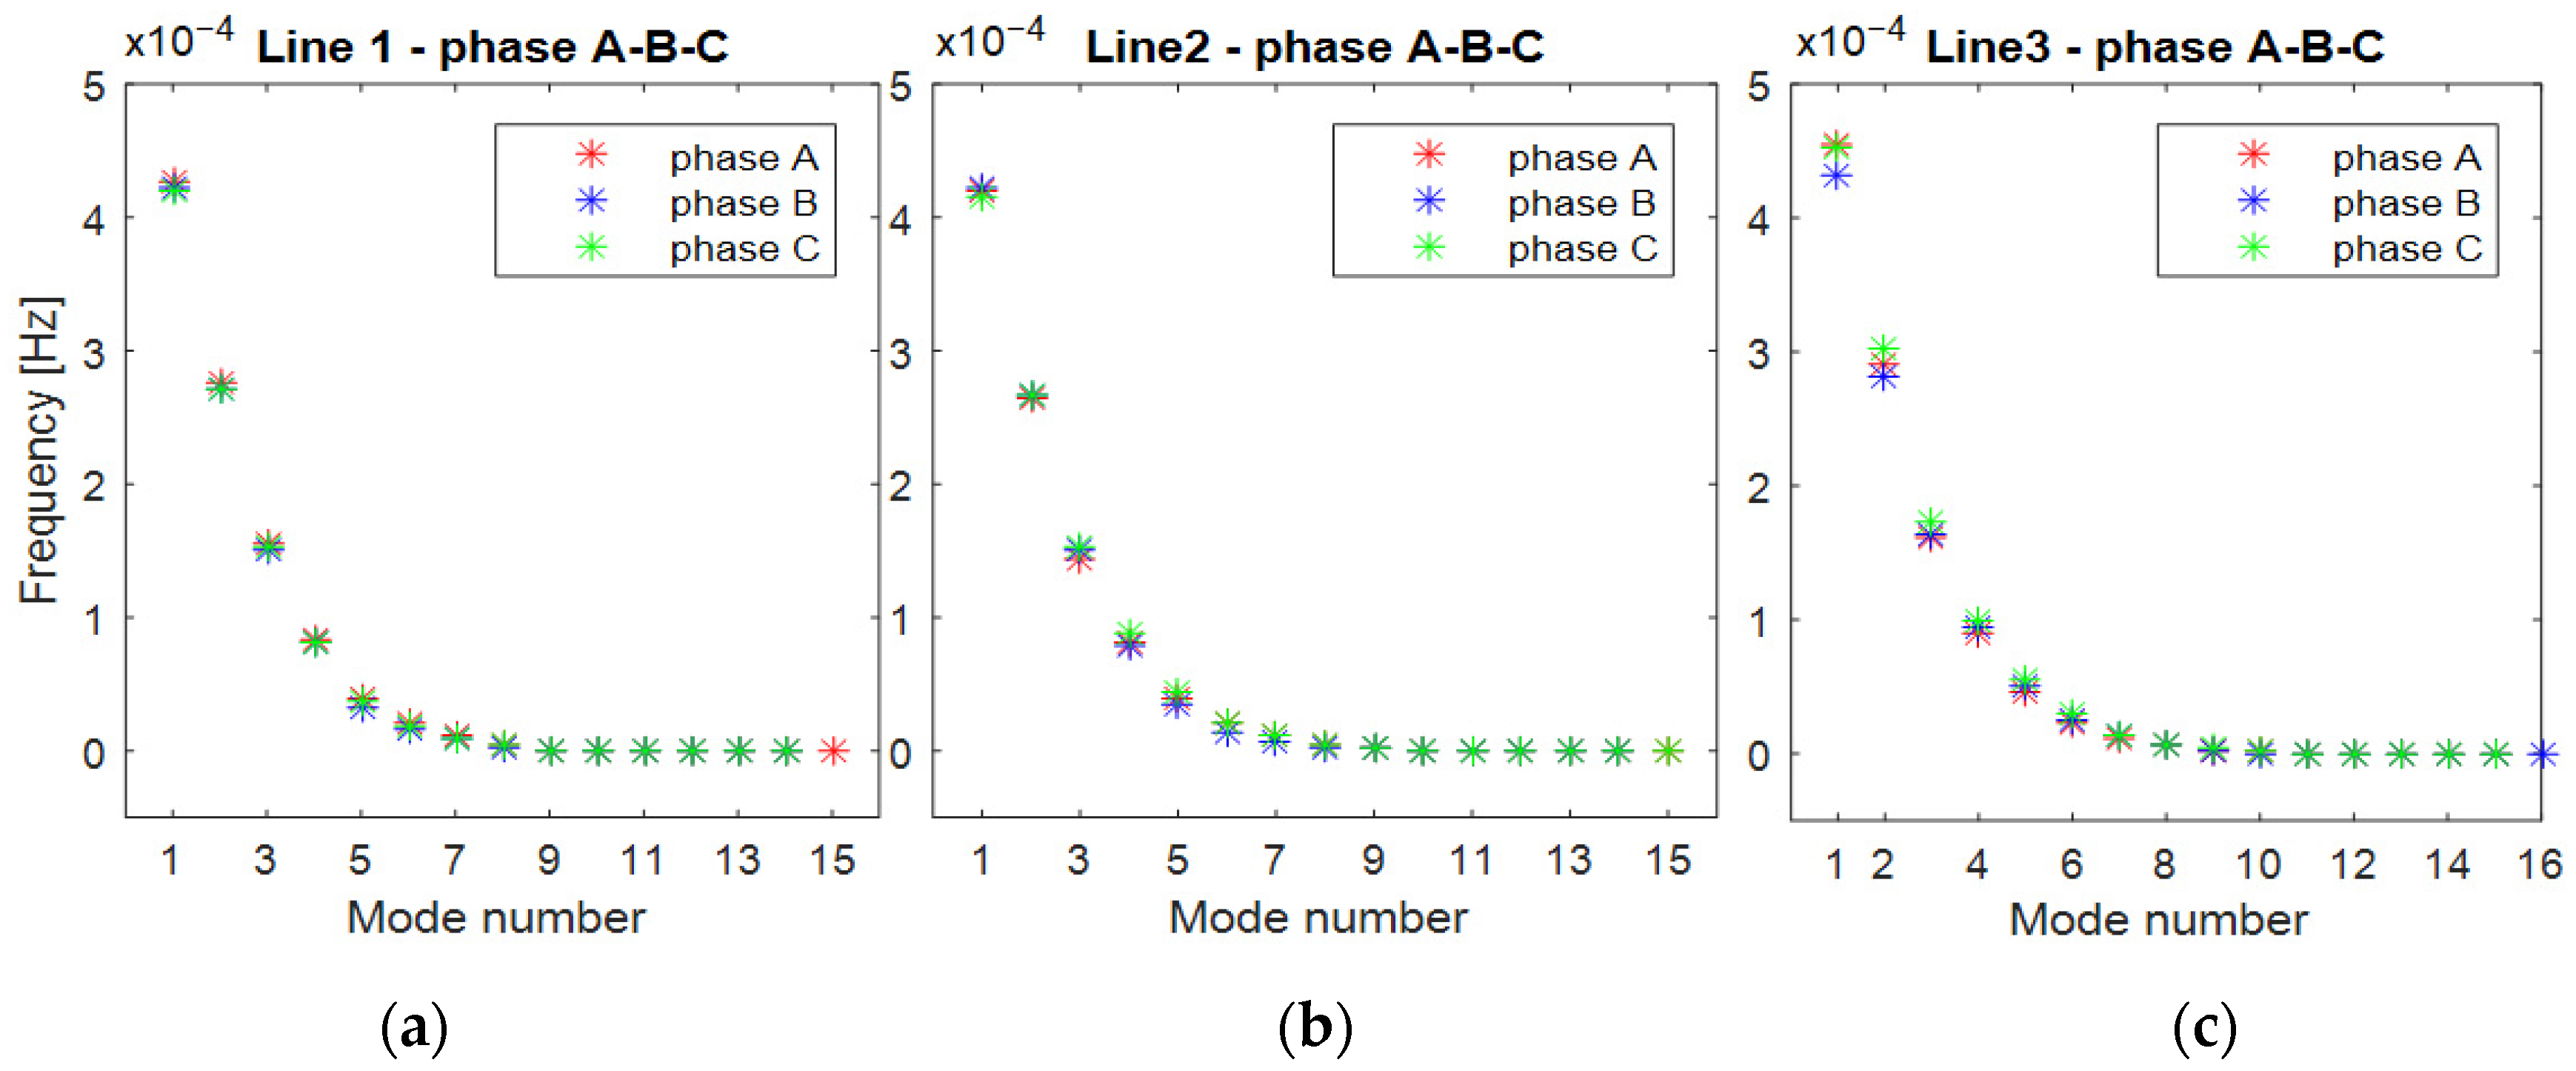
Figure 6.
FFT of the currents flowing into the distribution circuits L1, L2, L3 for the whole period. (a) L1; (b) L2; and, (c) L3.
Figure 6.
FFT of the currents flowing into the distribution circuits L1, L2, L3 for the whole period. (a) L1; (b) L2; and, (c) L3.

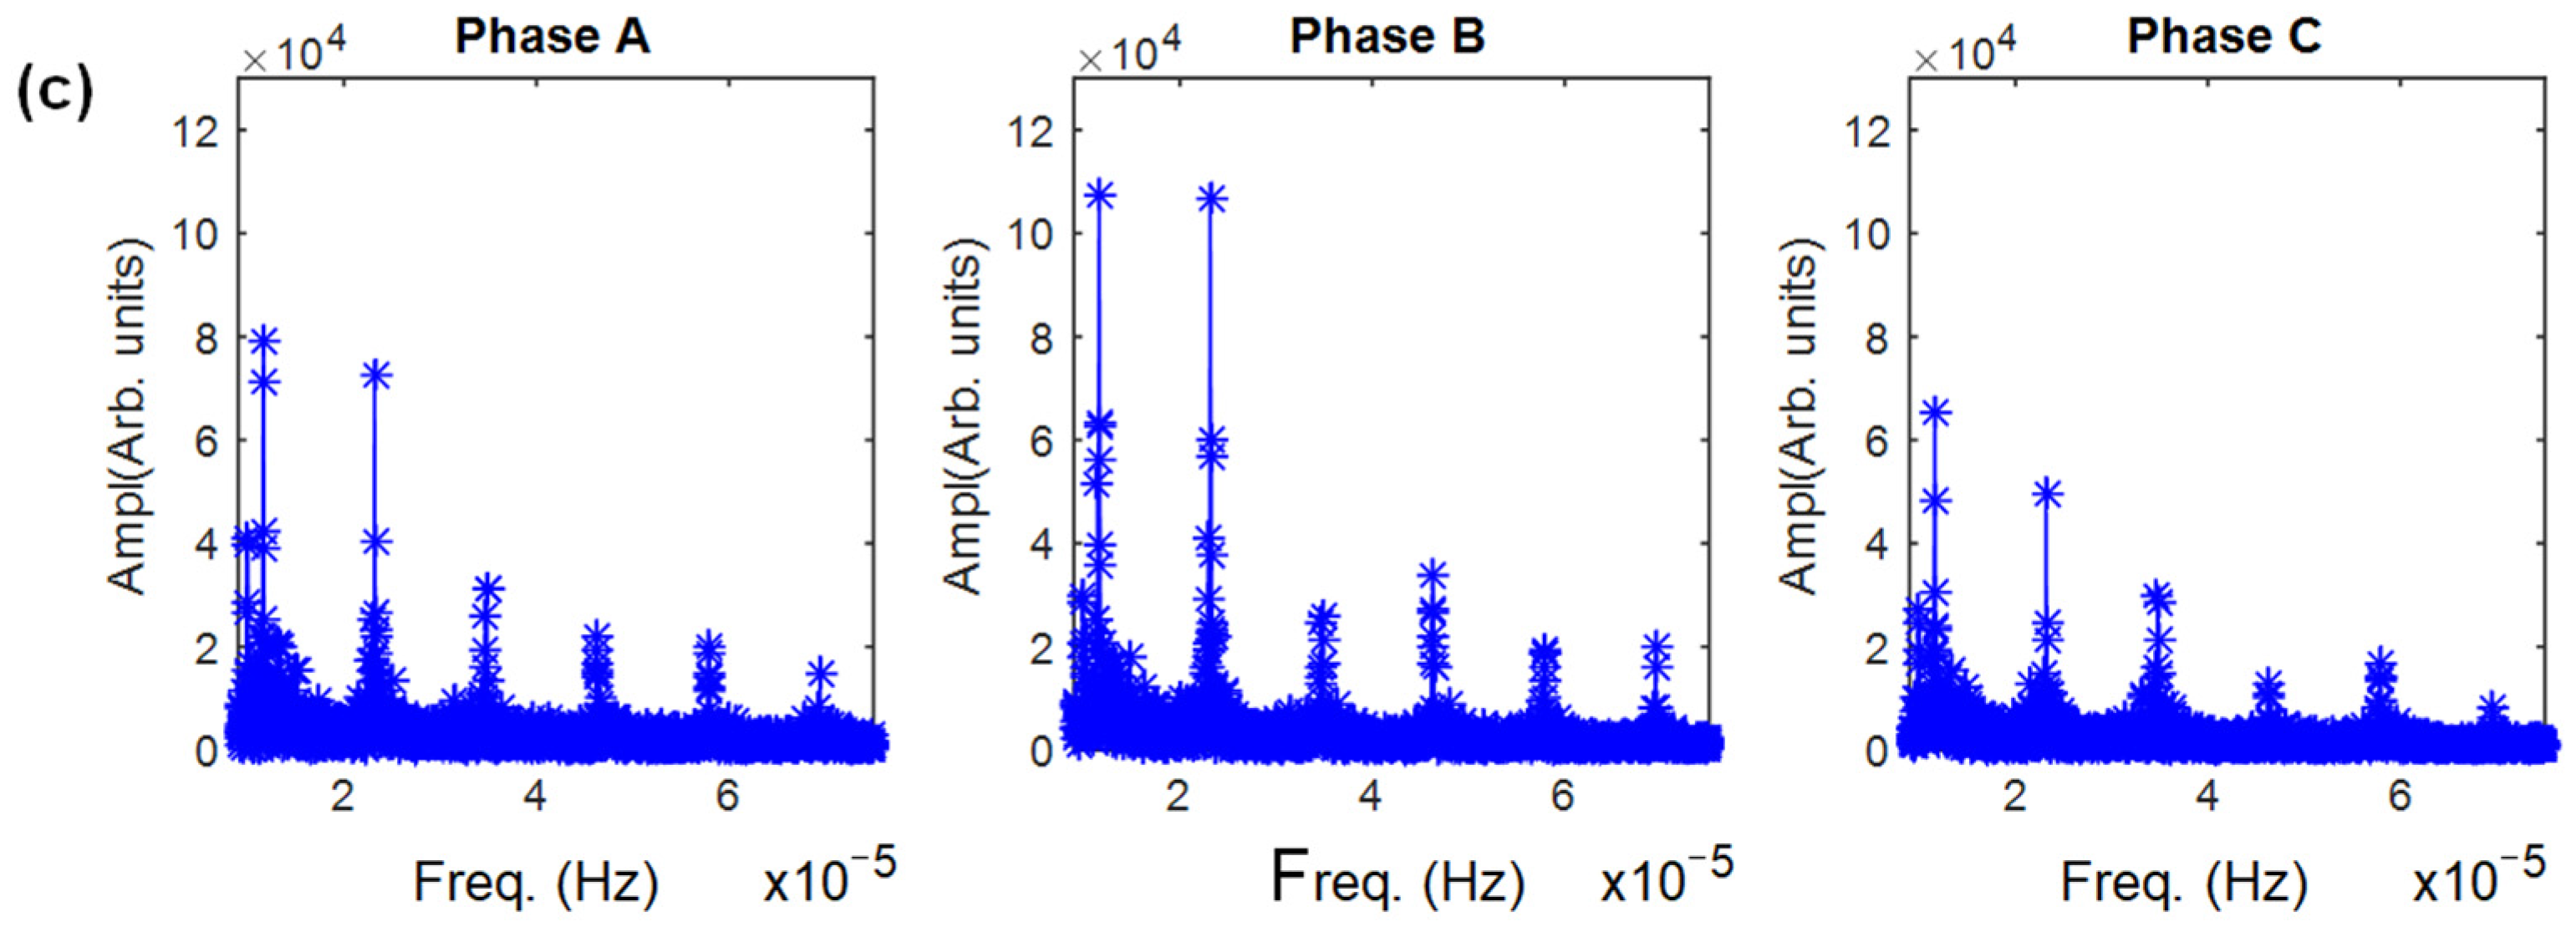
Figure 7.
Wavelet of the currents flowing in L1, L2, L3 for the entire period. (a–c) phases of the line L1; (d–f) phases of the line L2; (g–i) phases of the line L3.
Figure 7.
Wavelet of the currents flowing in L1, L2, L3 for the entire period. (a–c) phases of the line L1; (d–f) phases of the line L2; (g–i) phases of the line L3.

Figure 8.
Coherence degree between two lines PCsigs, based on the currents flowing into a fixed and arbitrary phase.
Figure 8.
Coherence degree between two lines PCsigs, based on the currents flowing into a fixed and arbitrary phase.


Table 1.
Characteristics of the PDS under investigation.
| Title | L1 | L2 | L3 |
|---|---|---|---|
| Maximum absorbed power (kW) | 100 | 80 | 50 |
| PV power (kWp) | ---- | 108 | 6 |
| Length (m) | 415 | 396 | 380 |
| Prevalent typology of end-user | residential | residential | commercial |
Table 2.
Number of Intrinsic Mode Function (IMFs) for each current, for each distribution circuit, for each season.
Table 2.
Number of Intrinsic Mode Function (IMFs) for each current, for each distribution circuit, for each season.
| L1 | L2 | L3 | |
|---|---|---|---|
| Autumn | |||
| Phase A | 13 | 13 | 13 |
| Phase B | 13 | 13 | 13 |
| Phase C | 13 | 12 | 13 |
| Winter | |||
| Phase A | 12 | 13 | 12 |
| Phase B | 12 | 13 | 13 |
| Phase C | 13 | 13 | 13 |
| Spring | |||
| Phase A | 13 | 12 | 14 |
| Phase B | 12 | 13 | 13 |
| Phase C | 13 | 12 | 13 |
© 2018 by the authors. Licensee MDPI, Basel, Switzerland. This article is an open access article distributed under the terms and conditions of the Creative Commons Attribution (CC BY) license (http://creativecommons.org/licenses/by/4.0/).
Share and Cite
MDPI and ACS Style
Vergura, S.; Carpentieri, M. Phase Coherence Index, HHT and Wavelet Analysis to Extract Features from Active and Passive Distribution Networks. Appl. Sci. 2018, 8, 71. https://doi.org/10.3390/app8010071
AMA Style
Vergura S, Carpentieri M. Phase Coherence Index, HHT and Wavelet Analysis to Extract Features from Active and Passive Distribution Networks. Applied Sciences. 2018; 8(1):71. https://doi.org/10.3390/app8010071
Chicago/Turabian StyleVergura, Silvano, and Mario Carpentieri. 2018. "Phase Coherence Index, HHT and Wavelet Analysis to Extract Features from Active and Passive Distribution Networks" Applied Sciences 8, no. 1: 71. https://doi.org/10.3390/app8010071
Note that from the first issue of 2016, this journal uses article numbers instead of page numbers. See further details here.