Pipeline Leak Localization Based on FBG Hoop Strain Sensors Combined with BP Neural Network


1
School of Ocean Science and Technology, Dalian University of Technology, Panjin 124221, Liaoning, China
2
Faculty of Infrastructure Engineering, Dalian University of Technology, Dalian 116024, Liaoning, China
3
School of Civil Engineering, Shenyang Jianzhu University, Shenyang 110168, Liaoning, China
*
Author to whom correspondence should be addressed.
Appl. Sci. 2018, 8(2), 146; https://doi.org/10.3390/app8020146
Submission received: 14 December 2017
/
Revised: 11 January 2018
/
Accepted: 19 January 2018
/
Published: 24 January 2018
(This article belongs to the Special Issue Fiber Bragg Gratings: Fundamentals, Materials and Applications)
Abstract
:Featured Application
A pipeline leakage localization method using self-developed FBG hoop strain sensors combined with BP neural network is proposed and validated.
Abstract
Pipelines function as blood vessels serving to bring life-necessities, so their safe usage is one of the foremost concerns. In our previous work, a fiber Bragg grating (FBG) hoop strain sensor with enhanced sensitivity was developed to measure the pressure drop induced by pipeline leakage. Some hoop strain information during the leakage transient process can be extracted from the amount of FBG hoop strain sensors set along the pipeline. In this paper, an integrated approach of a back-propagation (BP) neural network and hoop strain measurement is first proposed to locate the leak points of the pipeline. Five hoop strain variations are employed as input neurons to achieve pattern recognition so as to predict the leakage point. The RMS error can be as low as 1.01% when choosing appropriate hidden layer neurons. Furthermore, the influence of noise on the network’s performance is investigated through superimposing Gaussian noise with a different level. The results demonstrate the feasibility and robustness of the neural network for pipeline leakage localization.

1. Introduction
Pipelines are widely used for transportation or conveying fluids from one place to another, for which automotive transportation is often dangerous or impractical. Pipeline leaks are among the most difficult problems causing both loss of product, as well as serious environmental pollution. Therefore, it is important to locate the leak point accurately to mitigate problems and avoid potentially crippling costs.
Currently, some methods and systems for detecting pipeline leakage have been developed. Recent innovations on pipeline leak detection techniques can be classified into two categories: new sensors and new algorithms. From the aspect of the sensor, some novel sensing techniques are used to detect the pipeline fault due to higher sensitivity and reliability, like fiber optic sensing [1,2], wireless sensor networks [3,4] and the acoustic method [5,6]. Among these techniques, fiber optic sensors emerged as the most appropriate for long distance pipelines with no potential safety hazard compared with traditional electrical gauges. From the aspect of algorithms, the fluid transient state due to leakage occurrence is always analyzed, then the leak accidents can be identified, thus locating the leak point, in combination with signal processing techniques and mathematic analysis, including artificial neural network [7,8], support vector machine (SVM) [9,10], harmonic wavelet analysis [11], etc. Until now, no integrated solution for leakage detection combining both advantages of the fiber sensor and advanced algorithm has been proposed in the literature.
Fiber optic sensors, with the advantages of immunity to electromagnetic interference, high accuracy and multiplexibility, are now widely used to detect pipeline fault since there are many probable dangers related to gas or liquid pipelines [12,13]. A novel FBG hoop strain sensor has been developed and encapsulated in our lab to measure the pipeline hoop strain variation induced by leaks or other pressure drop cases [14,15]. This sensor provides a nondestructive testing (NDT) method for pipeline leakage detection and localization by installing multiple sensors along the pipeline. In addition, more information during the leakage transient flow process can be extracted so as to describe the leakage characteristics at different leak points or with different leak rates, which provides a potential approach to locate the leak point.
The pipeline leakage detection and localization can be treated as a classification problem in which a leak fault condition is considered to be a sample. Different leakage scenarios can be identified by some machine learning algorithms, like k nearest neighbor (kNN) [16], support vector machine [10], multi-layer perceptron neural network (MLPNN) [9], etc. The fundamental idea of these methods is to extract features from flow, pressure and temperature measurements at the inlet and outlet of the pipeline and then to train the classifier. Until now, signals from the pipeline mid-section have not been utilized as feature extractions to enhance the reliability and accuracy of the classification algorithms because no additional sensors can be mounted along the pipeline.
This paper provides a new pipeline leakage localization method integrating advanced FBG hoop strain sensors and an effective BP neural network-based classification algorithm. The research work can be split into two branches. On the one hand, the FBG hoop strain sensor developed in our previous work will be briefly demonstrated to show its performance in pipe pressure drop. On the other hand, the neural network system is trained by using multi-hoop strain characteristic values, then used to locate different leak points. The remainder of this paper is organized as follows: in the next part, the developed FBG hoop strain sensor with enhanced sensitivity is introduced. Then, the theory of the neural network for pipeline leak localization is provided in detail. In the next section, a case study of a long-distance pipeline is presented, including cases considering different levels of signal noise. Finally, conclusions are drawn.
2. FBG Hoop Strain Sensor
A novel FBG-based hoop strain sensor was developed in our previous work to monitor the hoop strain drop induced by pressure reduction [15]. This sensor has the advantages of optical sensing technology, such as high accuracy, long-term stability, multiplexibility and immunity to electromagnetic interference. This part briefly reviews the design and encapsulation of the FBG hoop strain sensor, as well as its performance in a preliminary leakage experiment on a model pipeline.
2.1. FBG Hoop Strain Sensor Development
Figure 1 shows the schematic diagram and the encapsulated FBG hoop strain sensor. Generally, the sensor is composed of a fiber Bragg grating, two gripper tubes, two gripper blocks, a protective tube, a movable end and a fixed end. The mechanical structure of the FBG hoop strain sensor has the function of strain sensitivity amplification, which is demonstrated in the previous research [15]. The encapsulated sensor shown in Figure 1b has a specially-designed pre-tension function to ensure tight connection to the curved surface of the pipe. The anchorage member is fixed onto the surface of the measured pipeline before installing the optic fiber component. Then, the fiber can be tensioned and tightly installed. The method of fixing the anchorage member on the pipeline may be adhesion or welding, depending on the pipeline material. For example, in the following model pipeline experiment, the anchorage member is adhered using epoxy resin.
2.2. Leakage Detection by FBG Hoop Strain Sensor
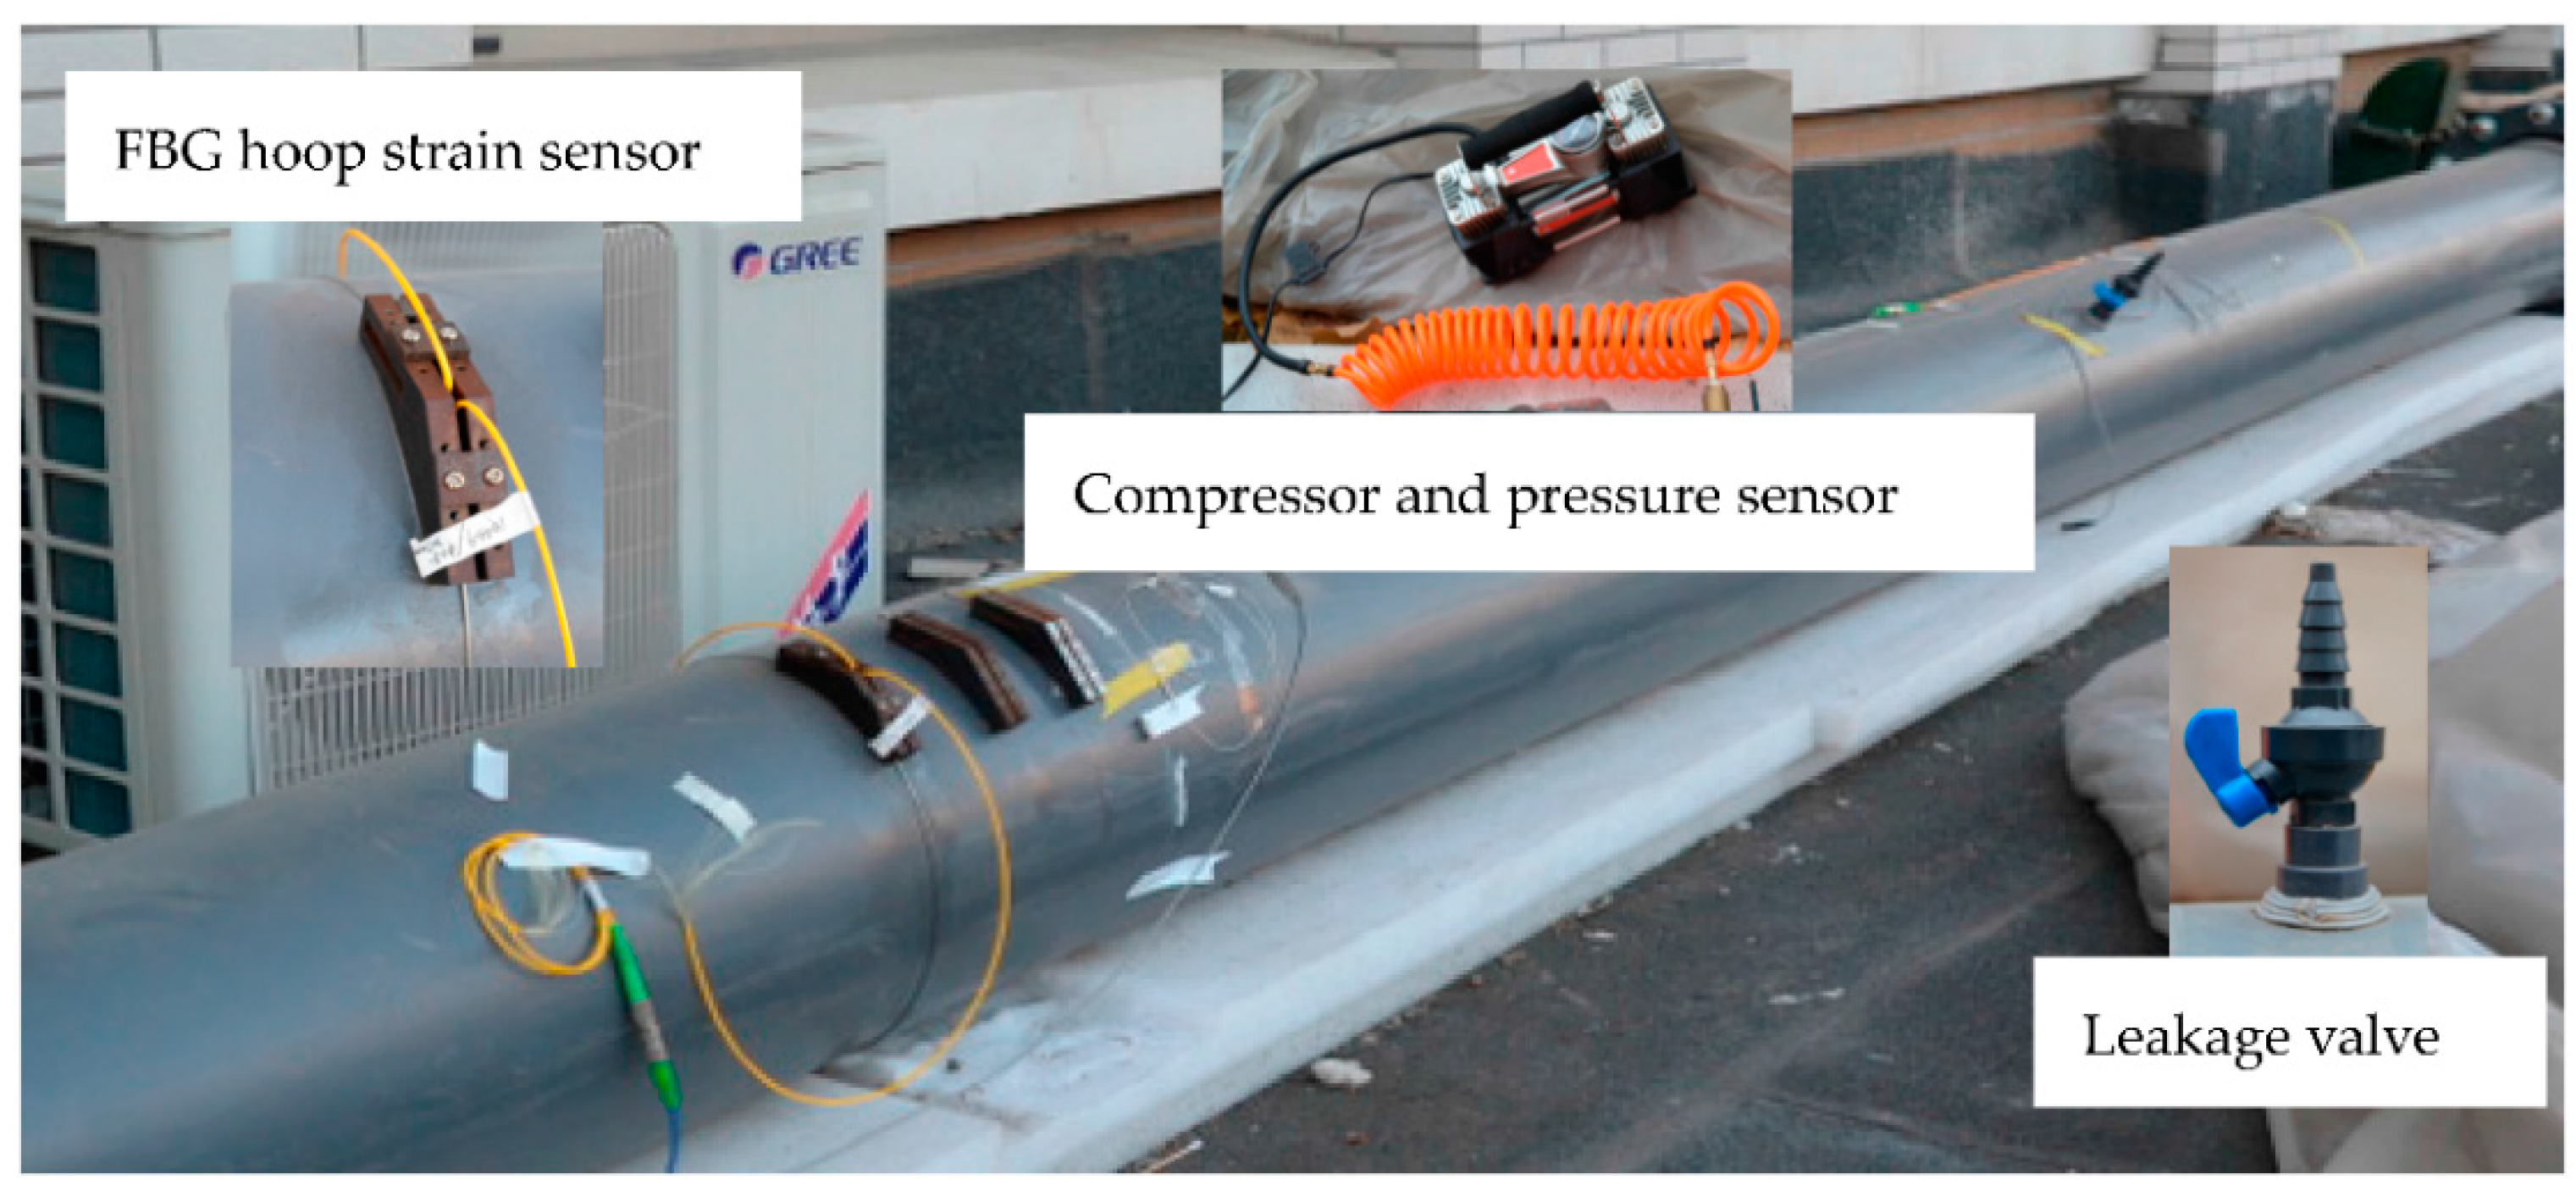
The preliminary experiment is conducted on a PVC model pipeline (shown in Figure 2) to test the developed FBG hoop strain sensor for leakage detection. The leakage process can be simulated by opening a valve pre-installed on the model. A pressure sensor is also installed as a traditional leak detection method to compare with the FBG hoop strain sensor. It can be seen that the FBG hoop strain sensor is tightly fixed onto the surface of the model pipe by using the pre-tension mechanism.
The leakage occurrence leads to the pressure drop at the leak point and then forms a negative pressure wave (NPW), which propagates along the pipeline. When NPW arrives at a sensor, the pressure drop or the strain drop can be detected to determine the arrival time of NPW and even to calculate the location of the leak point by two sensors. Figure 3 shows the time domain signals of the FBG hoop strain sensor and the pressure sensor when a leak valve is opened. The sudden drop can be considered as the arrival of NPW at the sensors. It can be found that the FBG hoop strain sensor has a similar function in leak detection and is used as a substitute for the traditional pressure sensor. The main advantage of this FBG hoop strain sensor over the traditional pressure gauge is that it can be installed nondestructively and flexibly along the pipeline. Therefore, one potential application of the FBG hoop strain sensor is to install a series of sensors along the pipeline to acquire the characteristic information of different leakage conditions.
3. Calculation of Hoop Strain Time-History Curve
Theoretically, the pipeline leakage case can be both simulated by experiment and numerical simulation, during which the signals can be collected. However, it is impractical to open a hole on a real pipeline to simulate a leakage. Thus, to obtain the key characteristics of hoop strain induced by leakage, the time-history curve needs to be first calculated by numerical simulation. In this work, the method of characteristics is applied to solve the hydraulic transient process of a leakage occurrence.
3.1. The Method of Characteristics
The method of characteristics (MOC) is a common method to solve the hydraulic transient. The derivative of the model can be integrated into the total differential, and the characteristics of the fixed grid are changed. Based on the continuity equation and momentum equation for unsteady pipe liquid flow, the characteristics are converted into the following form:
where x is the distance of the centerline of the pipeline, t is time, V is average velocity, H is the piezometric head, a is NPW velocity, D is the inner diameter and g is gravity acceleration.
C+ and C− are the two characteristic equations of the transient flow problem. Since the friction is nonlinear, the equations can be solved by the finite difference method to get the numerical solution, as shown in Figure 4. In this method, the length of the pipeline is discretized, and the length of each section Δx = L/N. The time step Δt is the travelling time of NPW along (Δt = Δx/a). In Figure 4, the horizontal axis is the discretized pipeline and the vertical axis is the transient time, respectively.
Equations (1) and (2) are integrated along the characteristic lines. The pressure head and mass flow rate at any point can be solved by the intersection of two characteristic lines C+ and C−. For instance, the pressure head HP at node P can be expressed as:
where B is the characteristic impedance and R is the friction loss. Then, the mass flow rate QP at node P can be solved by the above simultaneous equations, as:
Therefore, the fluid state of any time step can be obtained from the previous time step by using two linear equations.
For the leak point, the mass flow rate on the left side is equal to the sum of the leak flow rate and the mass flow rate on the right side. Based on this assumption, the pressure head and the mass flow rate at the leak point can be derived as the following equation set:
where Cd is the orifice discharge coefficient and Al is the leakage area, respectively. The product term CdAl is used to describe leakage magnitude.
When using the above equations, the leak occurrence time is considered to be the initial time step. In other words, at the first time step, the fluid state changes only at the leak point while the other points remain unchanged. If the terminal time is set, the pressure or even the hoop strain time-history curve can be solved. The hoop strain reaches a new steady state after certain steps’ calculation.
3.2. Simulation Study
The above-mentioned MOC is employed in the following pipeline leakage simulation. The parameters of the pipeline are as follow: length of pipeline L = 55 km, steady mass flow rate Q = 0.0319 m3/s, acceleration of gravity g = 9.81 m/s2, NPW velocity a = 1100 m/s, hydraulic friction coefficient f = 0.015, inlet pressure Pin = 1717 kPa, outlet pressure Pout = 1570 kPa, pipe diameter D = 341 mm, pipe thickness t = 8 mm, Young’s modulus E = 210 GPa. The pipeline is manually divided into 50 sections; thus, the length of each section Δx = 1.1 km and time step Δt = 1 s.
All of the grid nodes (except inlet and outlet nodes) are the potential leak points. For each leakage condition, the hoop strain variation of any node along the pipeline can be calculated by the MOC method. Several FBG hoop strain sensors are assumed to be installed along the pipeline; thus, hoop strain variation of any node can be extracted. As an example, three leakages (5.5 km, 27.5 km, 49.5 km away from the inlet, respectively) are simulated to get the hoop strain variations at the outlet node during 1000 s after leak occurrence. As shown in Figure 5, the oscillation of hoop strain due to the impact of high speed flowing fluid with the boundary condition can be observed. A sudden drop occurs in the first few seconds and finally reaches a smaller value than the initial hoop strain. It is noticed that due to the damping of transient events, the hoop strain variation is greater when the leak point is closer to the downstream of the pipeline.
Generally, a different leak location induces a different hoop strain variation. Therefore, potential relationships can be established between hoop strain variations and leak locations. In other words, the leak point can be located from some crucial hoop strain characteristics. In the following part, the machine learning method is employed to predict leak location based on hoop strain information.
4. Leakage Localization Based on BP Neural Network
As discussed above, the FBG hoop strain sensors can be installed along the pipeline as the sensing element to measure the hoop strain variations. A series of hoop strain values composes eigenvectors to predict leakage locations. Compared with the traditional leak monitoring method based on the pressure sensor, this hoop strain-based method can provide more characteristic information since the FBG sensors can be nondestructively installed on the pipeline and arranged flexibly. In this part, a leakage localization based on the BP neural network is proposed by using multiple hoop strain characteristics.
4.1. Back-Propagation Neural Network
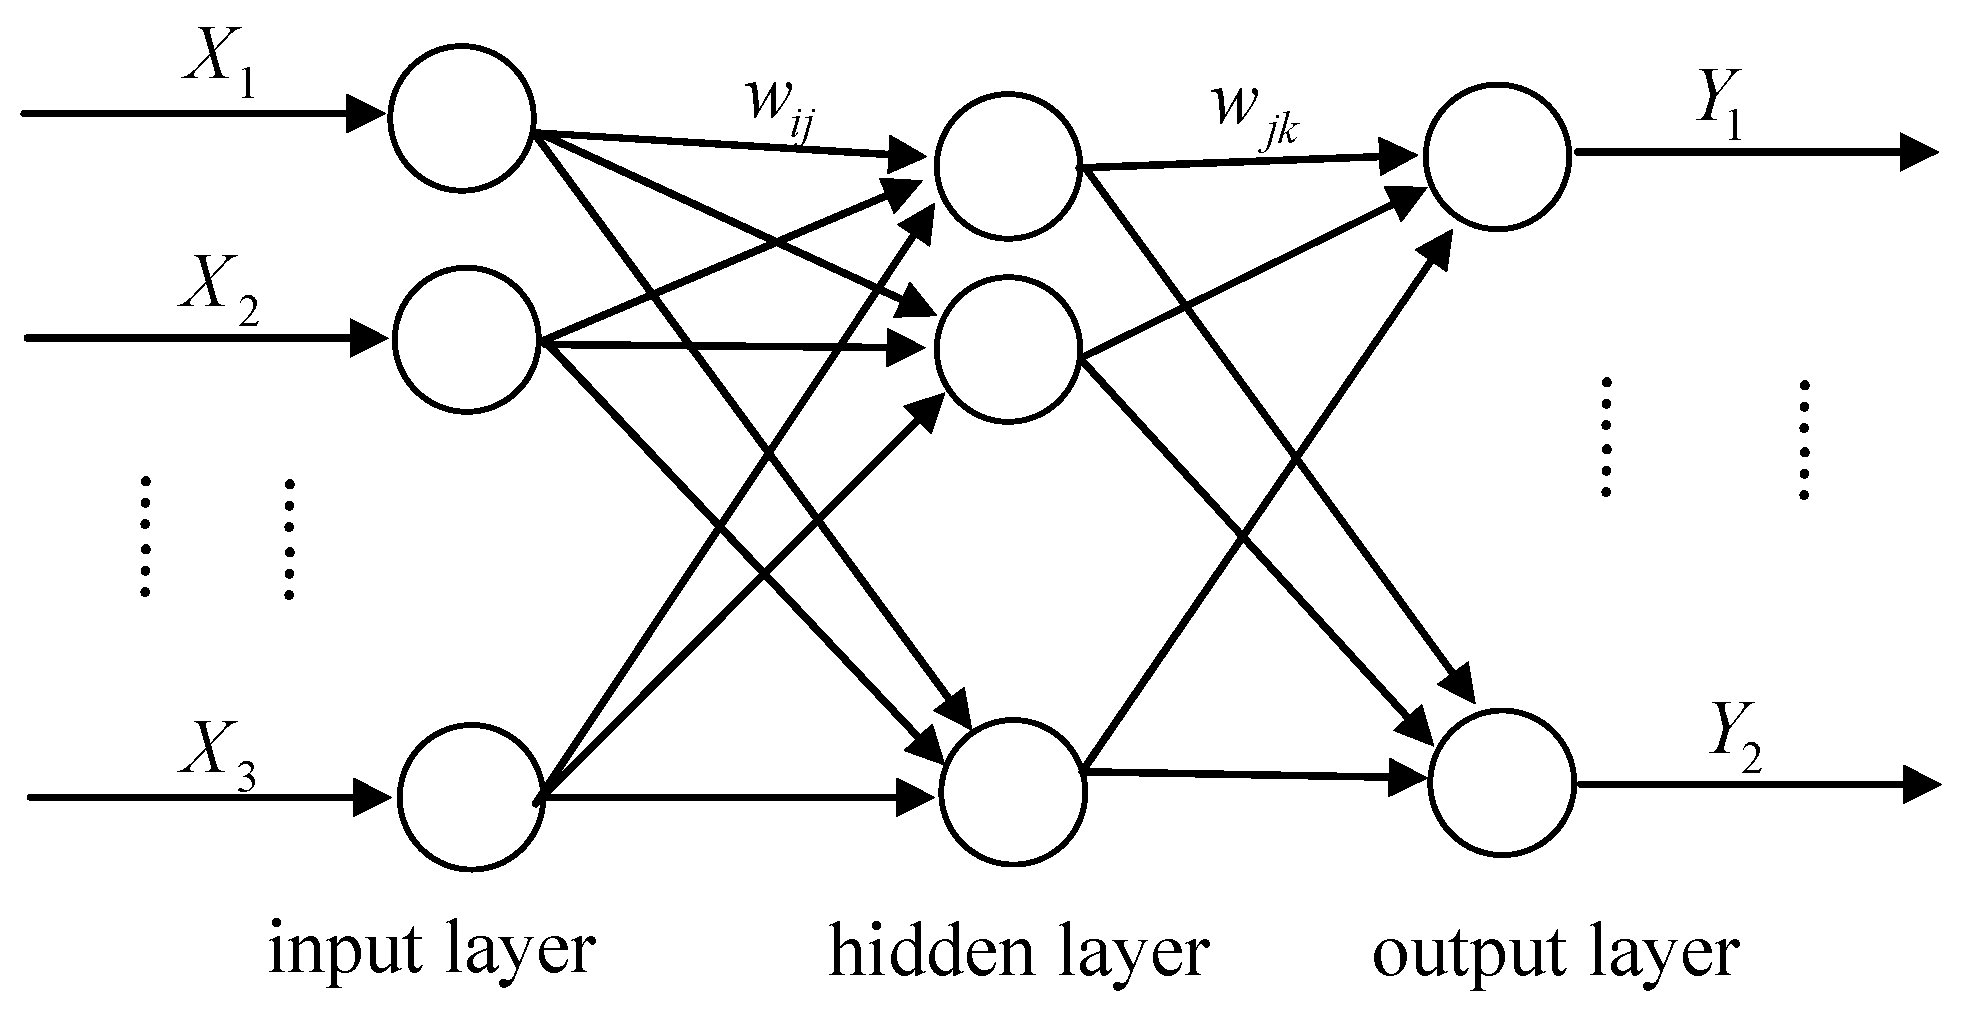
The back-propagation neural network is a type of multilayer network that trains the weights of the nonlinear differential function. This kind of algorithm of the neural network was first put forward in 1986 by the parallel distributed processing group Rumelhart et al. Currently, the BP-based multilayer perception is one of the most widely-used neural networks. It is suitable to process the massive amount of data in long-distance pipeline monitoring with good properties of fault-tolerance, self-organized learning and self-adaptivity. The typical back-propagation network consists of an input layer, an output layer and at least one hidden layer, as shown in Figure 6. The BP neural network has great capabilities for nonlinear approximation and pattern recognition, which have been used in many fields across mathematics, medical science, finance and engineering.
4.2. BPNN for Leakage Localization
The basic idea of this method is to use the BP neural network to recognize the leakage point of the pipelines through the hoop strain distribution acquired by some FBG hoop strain sensors. Different leakage accidents bring distinct hoop strain distributions, which can be seen as a pattern for leakage of a specific point.
Thus, the BP neural network for leakage localization can be established as follows. Several hoop strain sensing points are chosen as the neurons of the input layer. The variable parameter in the output layer is the different leakage point. It is noted that the neurons both in the input and the output layer are from the nodes in MOC as mentioned in Section 3.1. The number of neurons in the hidden layer can be determined by the input and the output layer and optimized through trial calculation.
In the training or learning mode, the hoop strain variations are fed to the input layer. A neuron of the network calculates the weighted sum of its inputs and passes it through a transfer function to generate an output. The most popular transfer function is the sigmoid logistic function, which is defined as:
A neuron of the output (leak point) goes to the inputs of all hoop strain neurons of the succeeding layer. The leakage point is collected at the output layer. The calculated outputs Ok and the error compared with desired outputs ek can be expressed respectively as:
where wjk is the connection weight and H is the output of the hidden layer. The network learns by adjusting its weights; thus, the error is smaller in the next iteration. The weight can be shown in the following formula by considering the learning rate constant η:
The parameters used in the leakage prediction network need to be set for a specific pipeline. There is no integrated theory to determine the number of neurons in the hidden layers. Thus, the number is often set with a given performance by trial in simulation. Appropriate parameters of the network should be obtained by repeating tests.
4.3. Method Validation
The BP neural network-based leakage detection system is established on the 55-km long-distance pipeline. The parameters of the pipeline are presented in Section 3.2. The pipeline is averagely divided into 50 sections, so there are 51 nodes along the pipeline (inlet and outlet included). The 49 intermediate nodes are considered as the possible leak points. Generally, the input neurons are the sensing points where the FBG hoop strain sensors are installed. However, it is not necessary to employ all of the sensing points, which may bring the problem of over fitting in the BP neural network. In this case study, five averagely divided hoop strain sensors along the pipeline are chosen as the input neurons. It is still worth mentioning for other leakage localization applications, the number of input neurons should be determined by trial to obtain the best localization results.
Through leakage analysis using MOC, hoop strain variations of the five sensing points are obtained and shown in Table 1. The first column is the number of leak points, corresponding to the mid-side nodes of the present pipeline. It is noted that the values of hoop strain variations are very close; hence, it is difficult for traditional strain sensors to distinguish the differences. However, as presented in Section 2, the developed FBG hoop strain sensor is characterized by enhanced sensitivity; thus, the measured hoop strain can by amplified.
To make the network with good convergence and mapping capability, the following equation is used to normalize the data to [0, 1] before developing the model:
where xmax and xmin are the maximum and minimum of the hoop strain values in Table 1. xi is the original hoop strain value, and is the normalized value. Then, the structure of the network for leakage localization on this pipeline is established as shown in Figure 7. In the input layer, the five parameters are the five hoop strain sensing points evenly spaced along the pipeline. The variable parameter in the output layer is the leakage point, corresponding to 49 leakage patterns.
The number of neurons in the hidden layer can be estimated according to the following empirical formula, and 15 neurons is an optimal selection by trial calculation. In the equations, m and n are the number of inputs and outputs, respectively, and a is a random integer ranging from 0–10.
Therefore, the total sample number is 49, from which 30 samples are randomly selected for BP neural network training, and all of the samples are used as the test parameters for the trained neural network. The purpose of validating all the samples is to guarantee that all of the leakage points can be figured out by the neural network system. In addition, measurement noise will be superimposed to test its performance for potentially practical leakage localization.
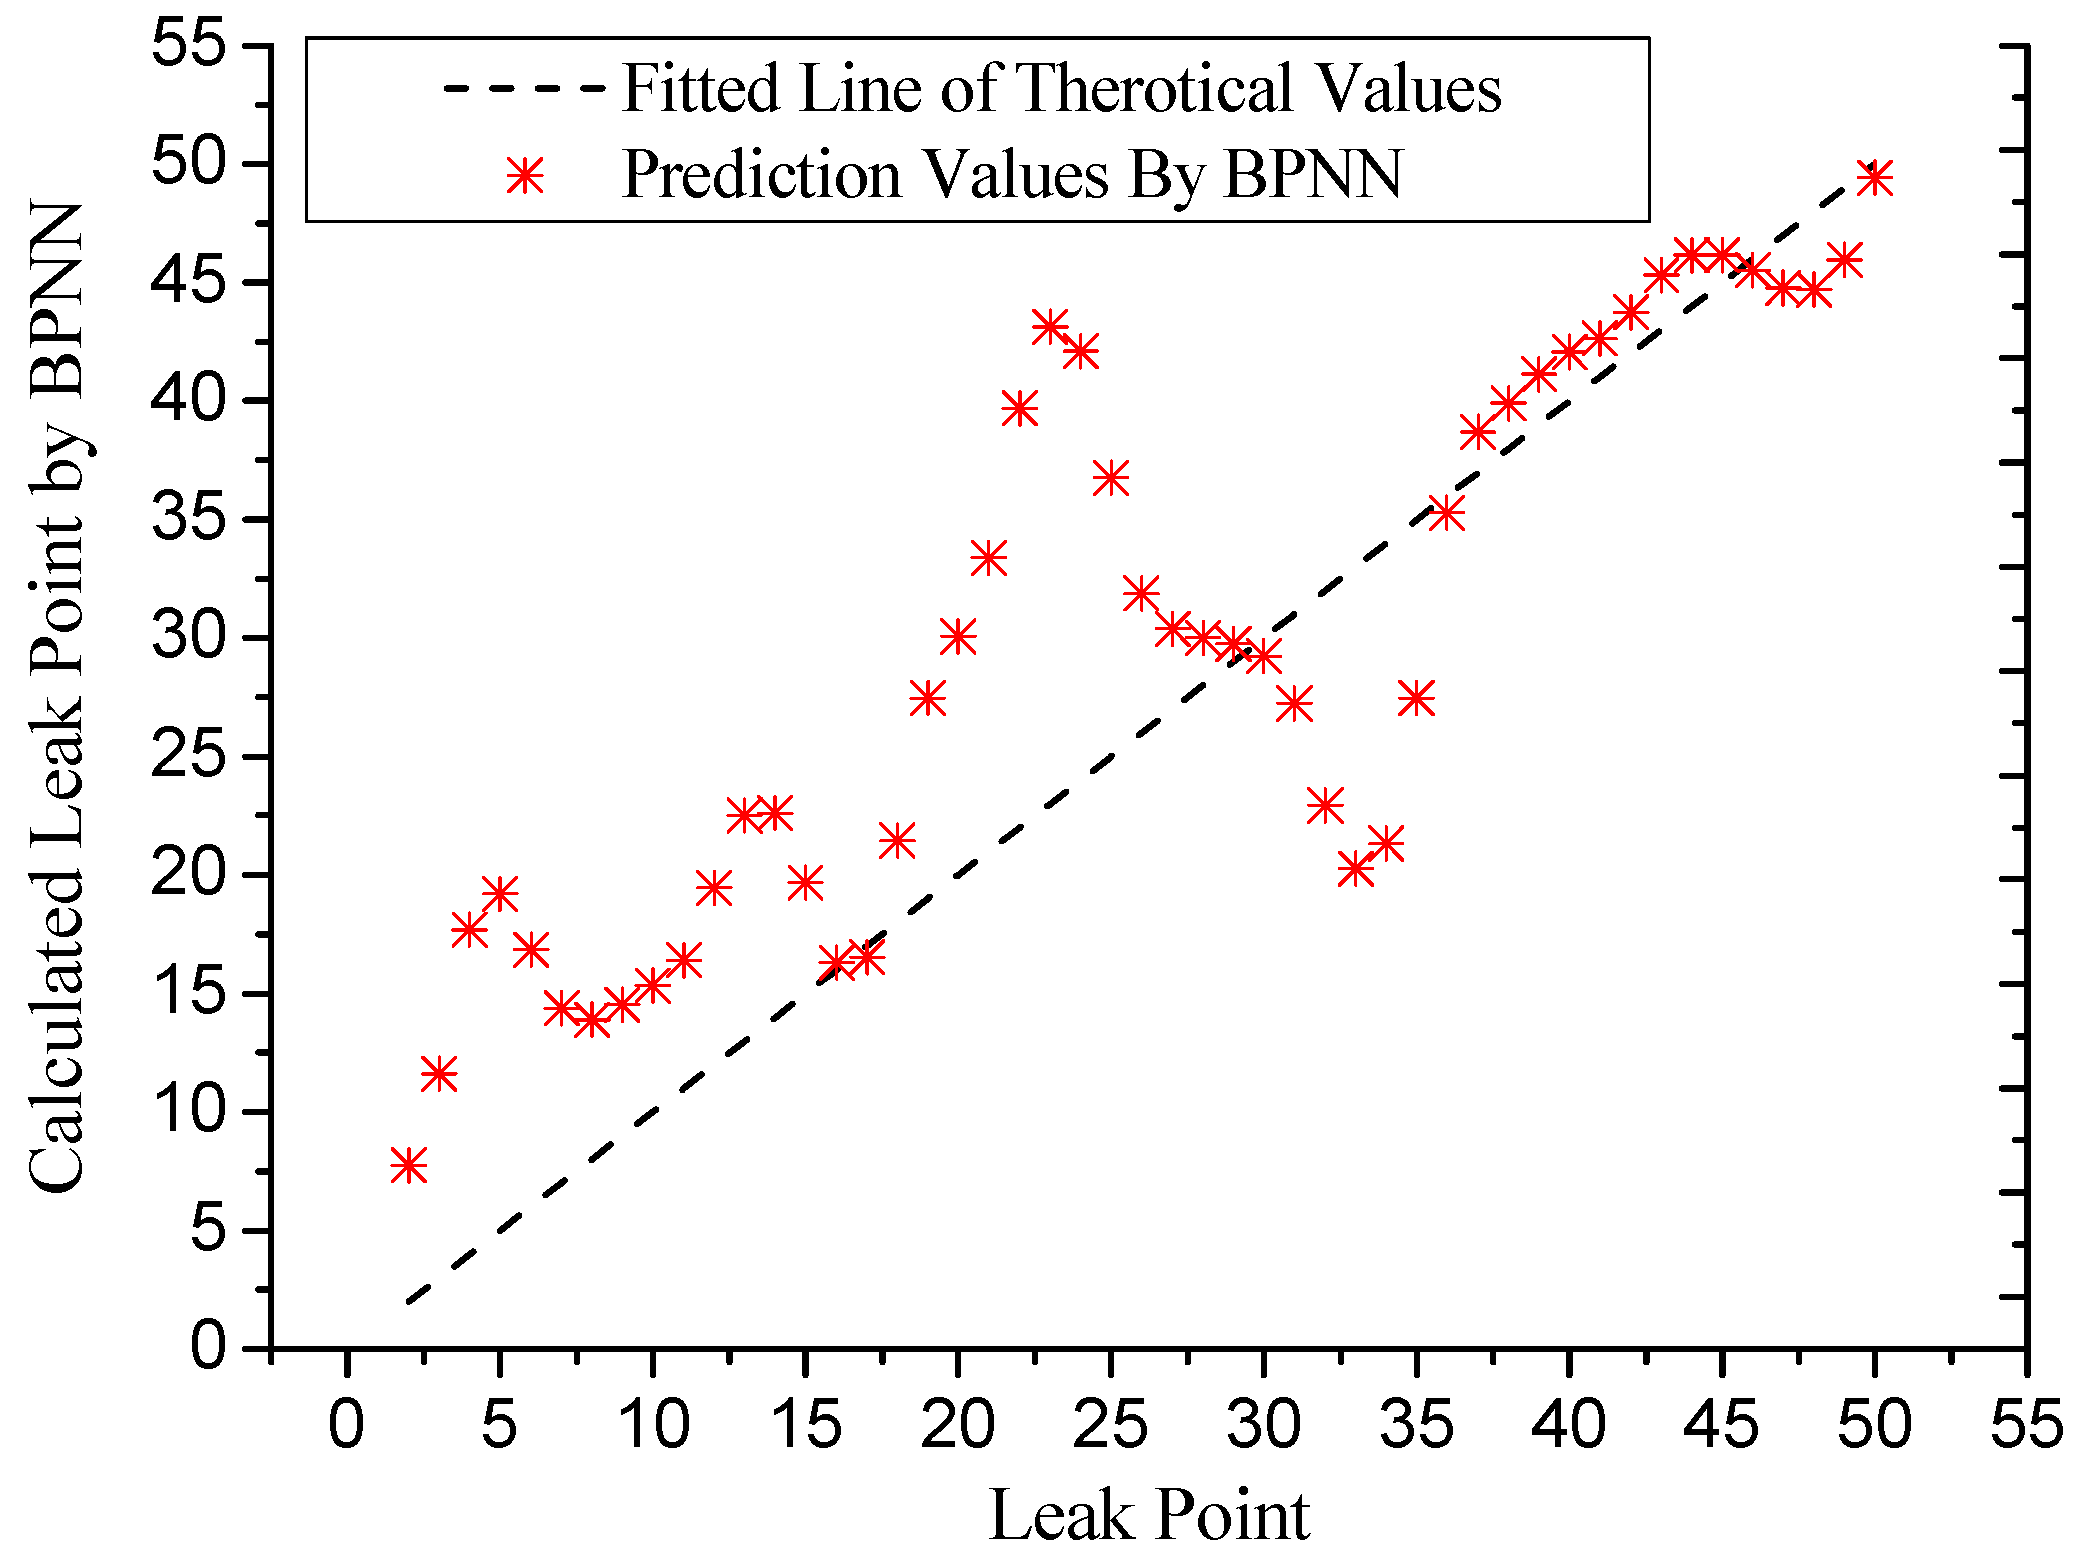
Before using the FBG hoop strain sensing signals, a trial test based on the traditional pressure gauges is firstly implemented. Usually, the pressure gauges are installed at the inlet and the outlet of a single straight pipeline. Thus, two pressure variations can be extracted based on MOC calculation under different leak points. For the BP neural network in this case, the input neurons are the two pressure signals and the output neurons are the potential leakage points. The localization results using the pressure gauges are presented in Figure 8. It can be seen from the figure that although the predicted leak values are around the fitted line of the actual leak points, the errors are extremely large in many locations. Therefore the BPNN-based pipeline leakage localization method cannot be established when using traditional pressure gauges.
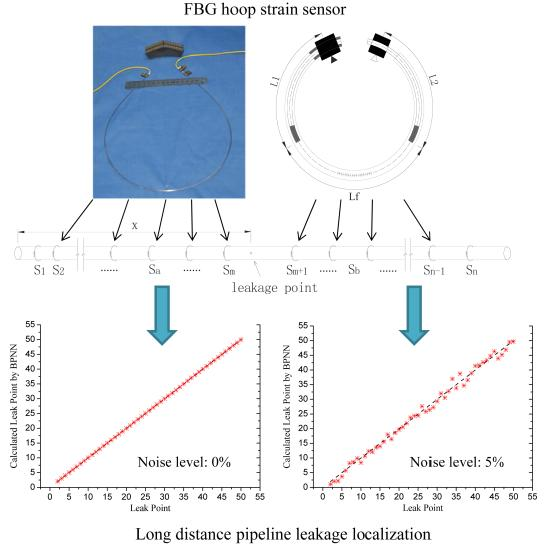
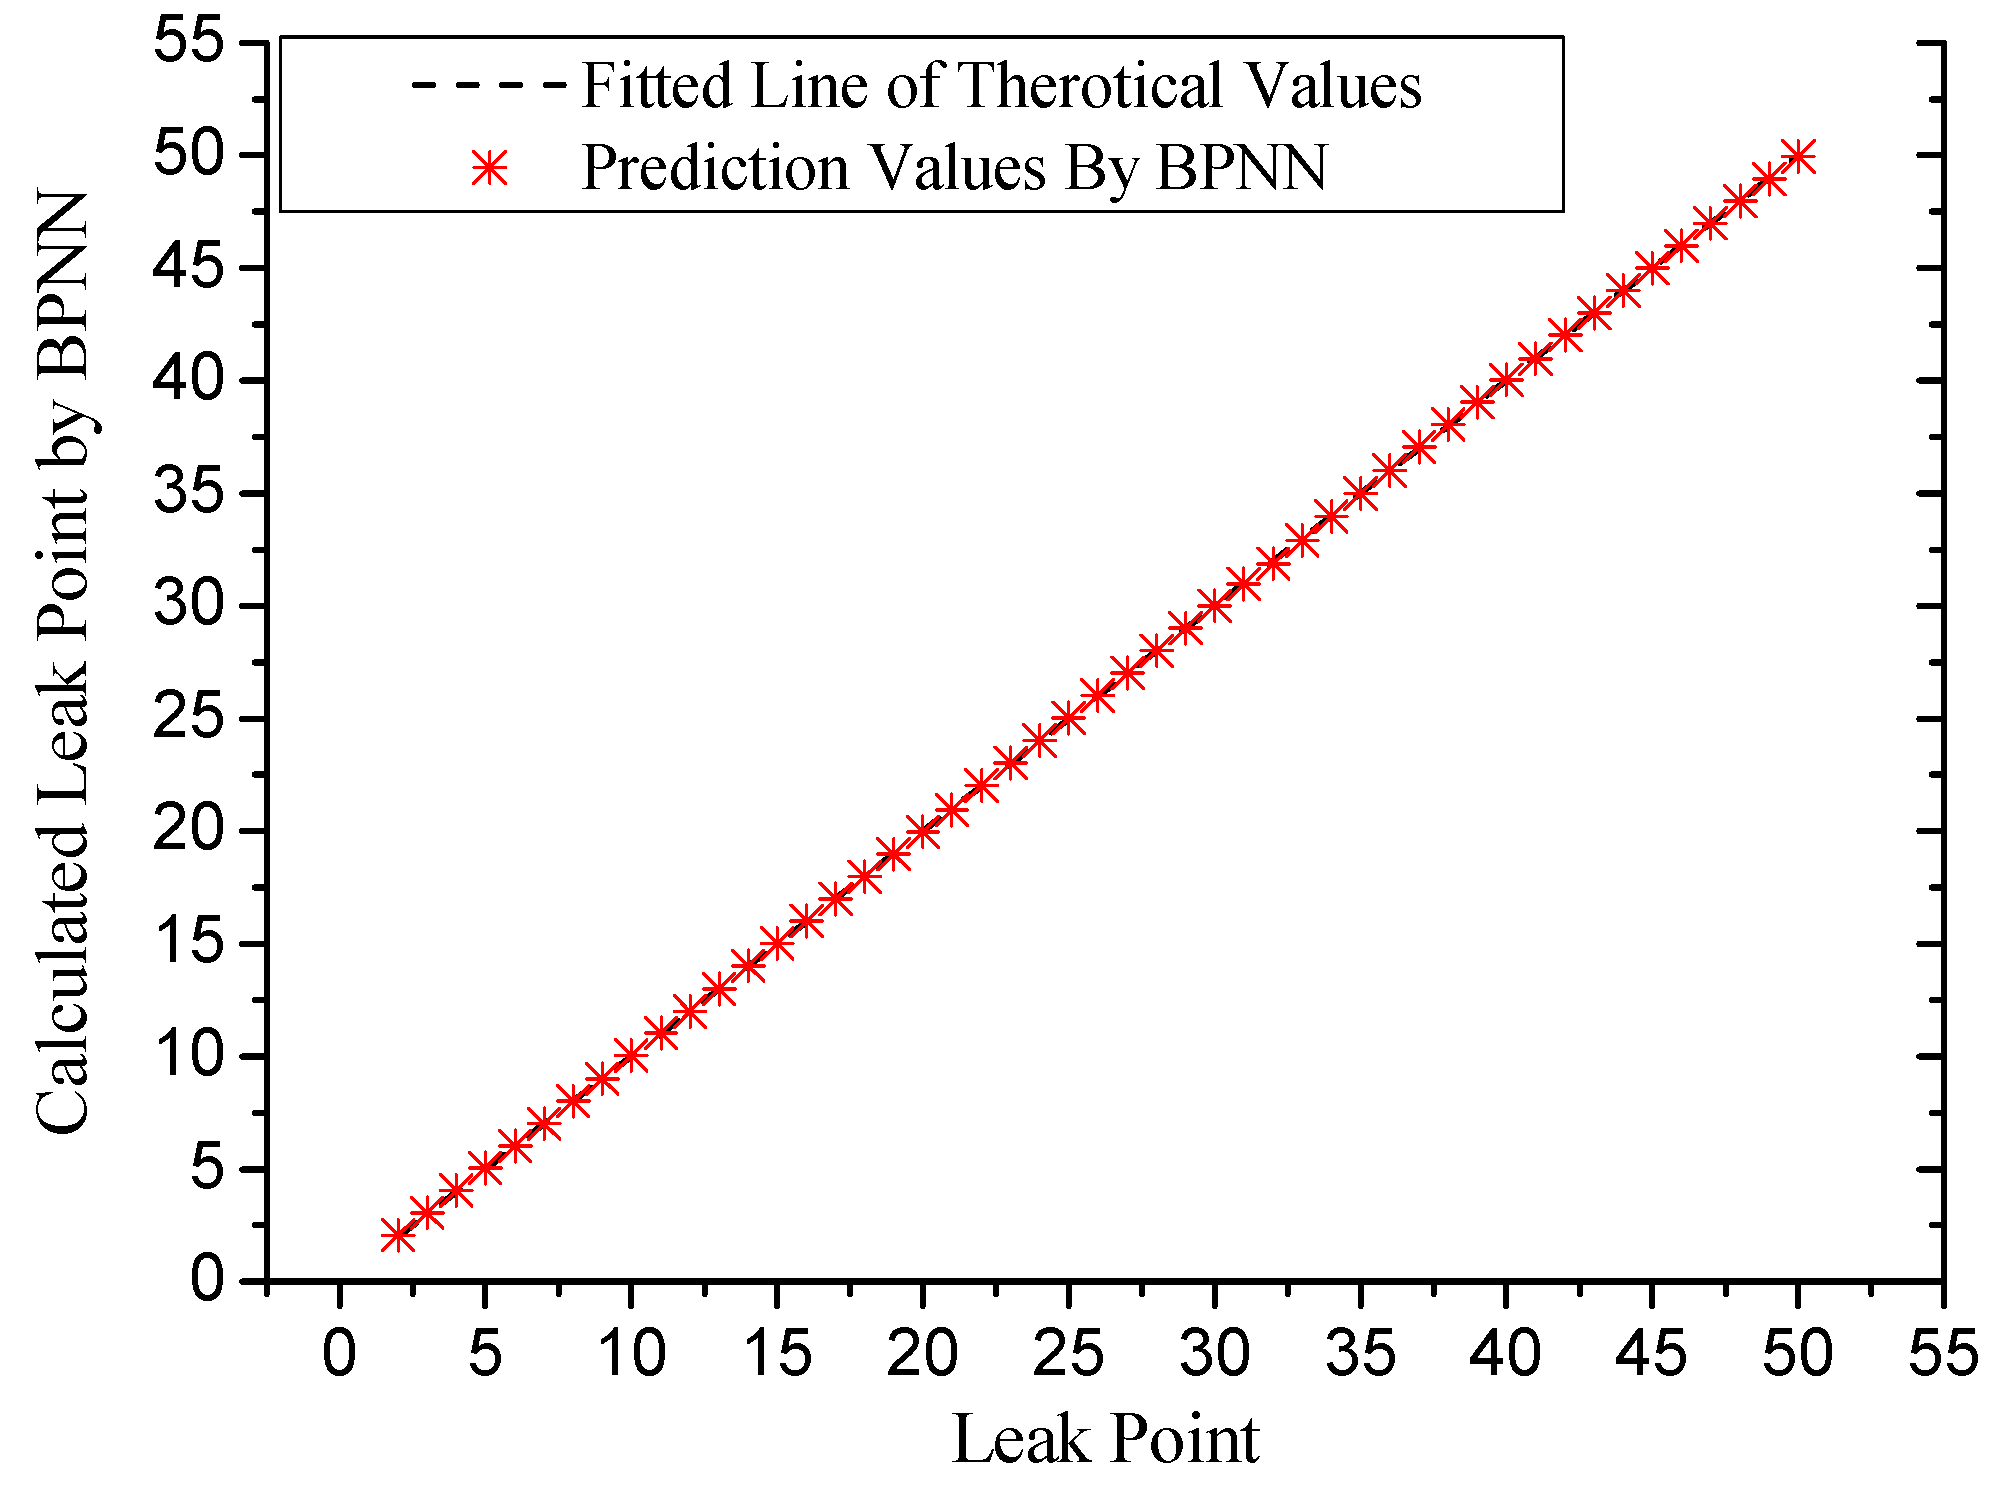
Then, we replace the pressure gauge signals with the five FBG hoop strain sensing signals. It is worth mentioning that, compared with the traditional pressure gauge method, the FBG hoop strain sensor is a kind of nondestructive evaluation approach since it can be installed at any point along the pipeline. Thus, more information from the pipeline mid-side can be acquired besides the inlet and outlet pressure variation when multi-hoop strain sensing points are set along the pipeline. In this case study, five hoop strain sensing signals are chosen as the input neurons for the BPNN-based leakage localization approach. However, the pressure gauge-based method cannot be improved since it is impossible to install extra pressure gauges after the pipeline is constructed or even in operation status. The neural network prediction result of the non-noise case is shown in Figure 9. The horizontal axis in the graph represents the assumed leak point number ranging from 2–49 and the vertical axis represents the neural network prediction result of the leak point. The regression coefficient R value in non-noise situation is nearly 0.999, which is very close to one. This means that the predicted values of the neural network and actual leak points are very close.
The network’s performance is quantified using the mean of squared errors, or the RMS errors, which is the deviation between the predicted and the actual value with the predictive number n. The RMS error is used to evaluate the deviation degree of the calculated values from the true values. Besides the RMS error, the standard deviation and the regression coefficient are adopted to evaluate the influence of different hidden node numbers. From Table 2, it can be seen when there are 15 hidden neurons. The standard deviation and the RMS error are smaller than the others. Thus, the number of hidden layer neurons is set as 15 in order to train the neural network for noise cases.
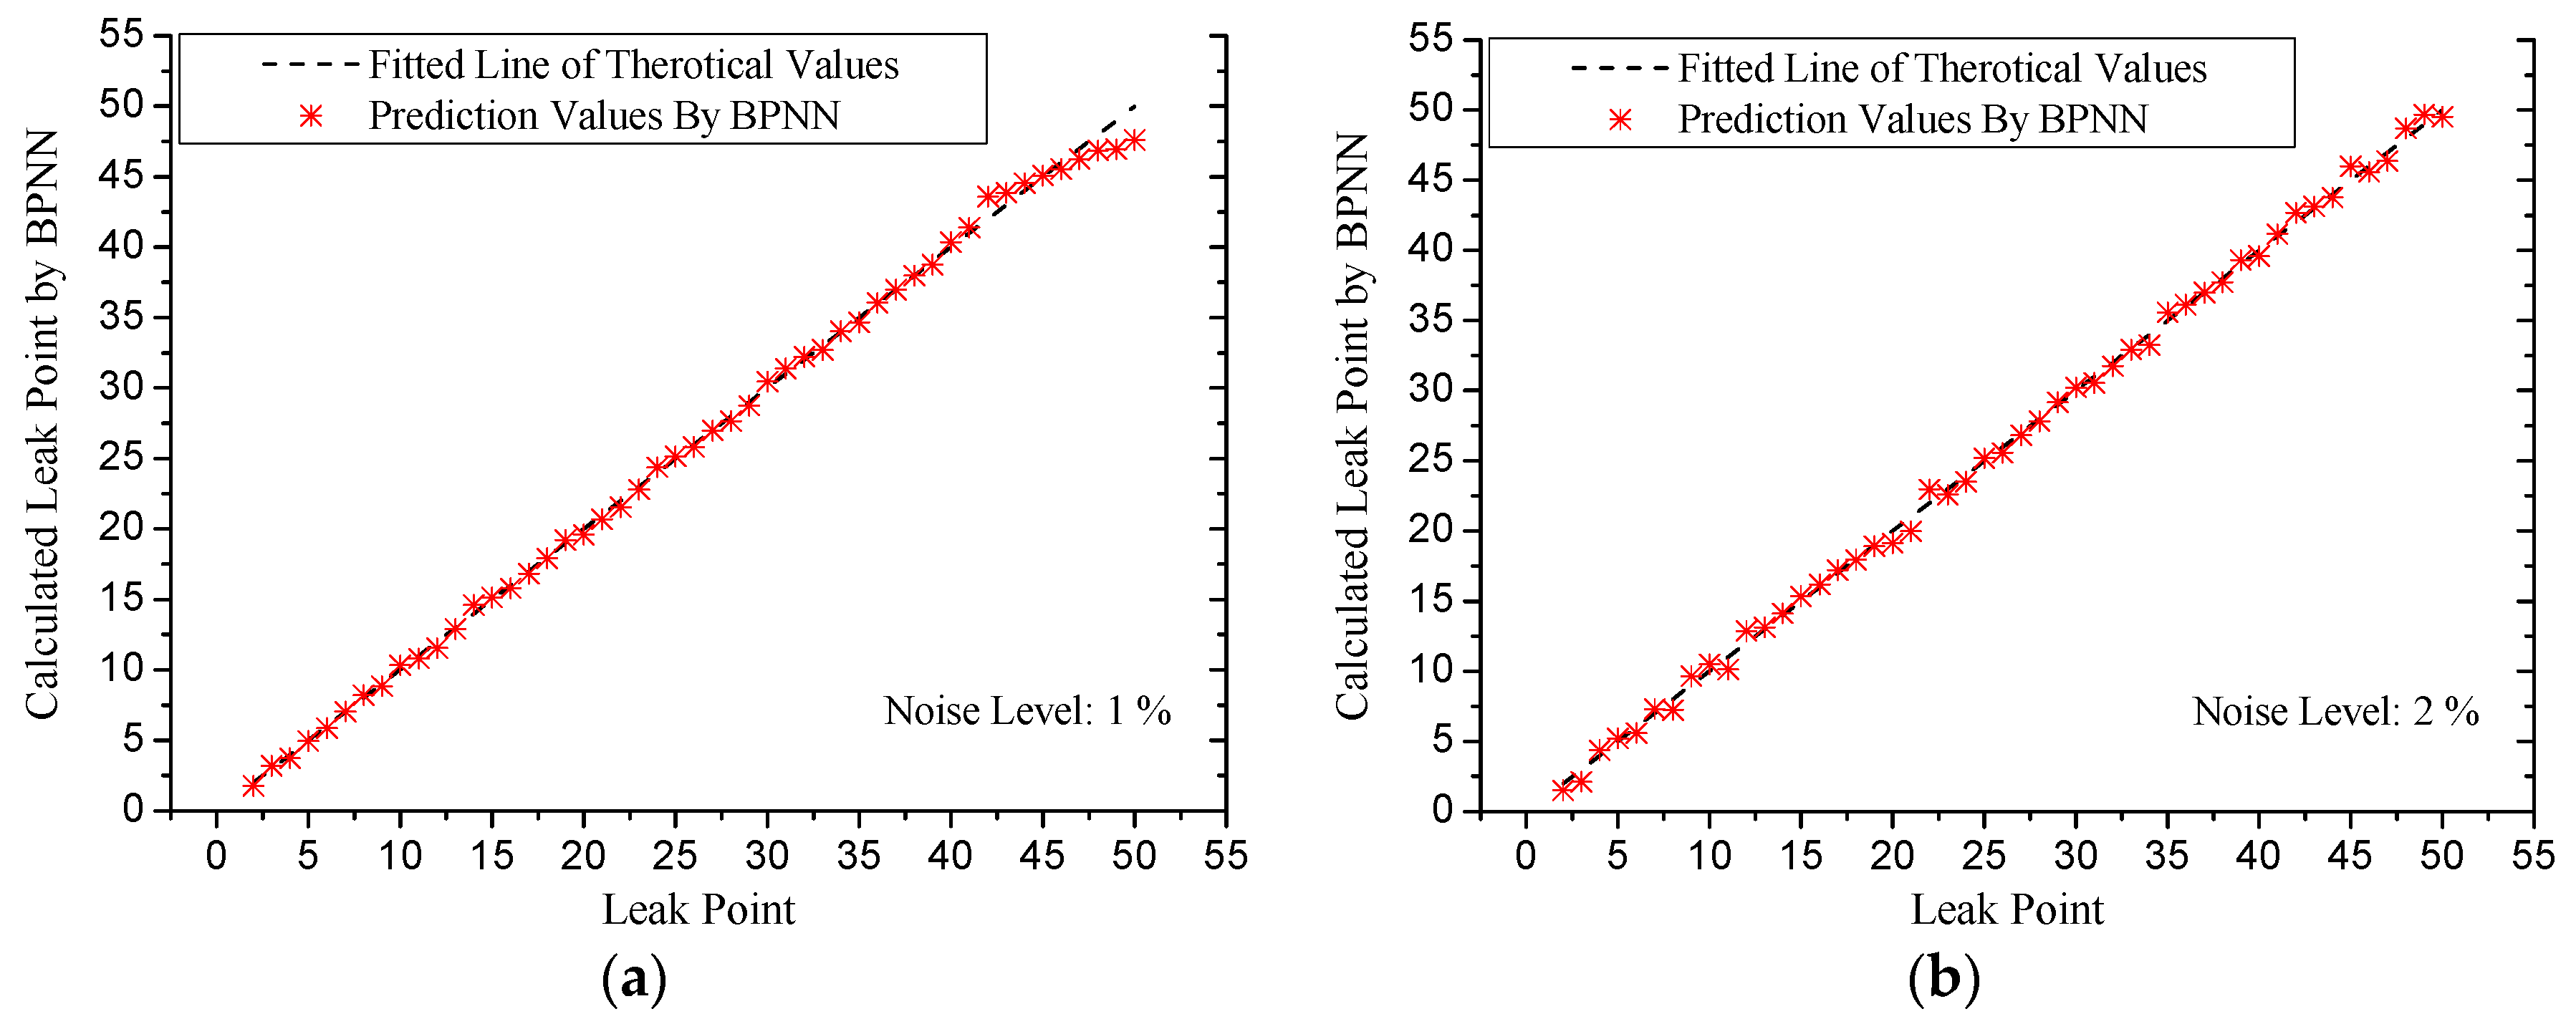
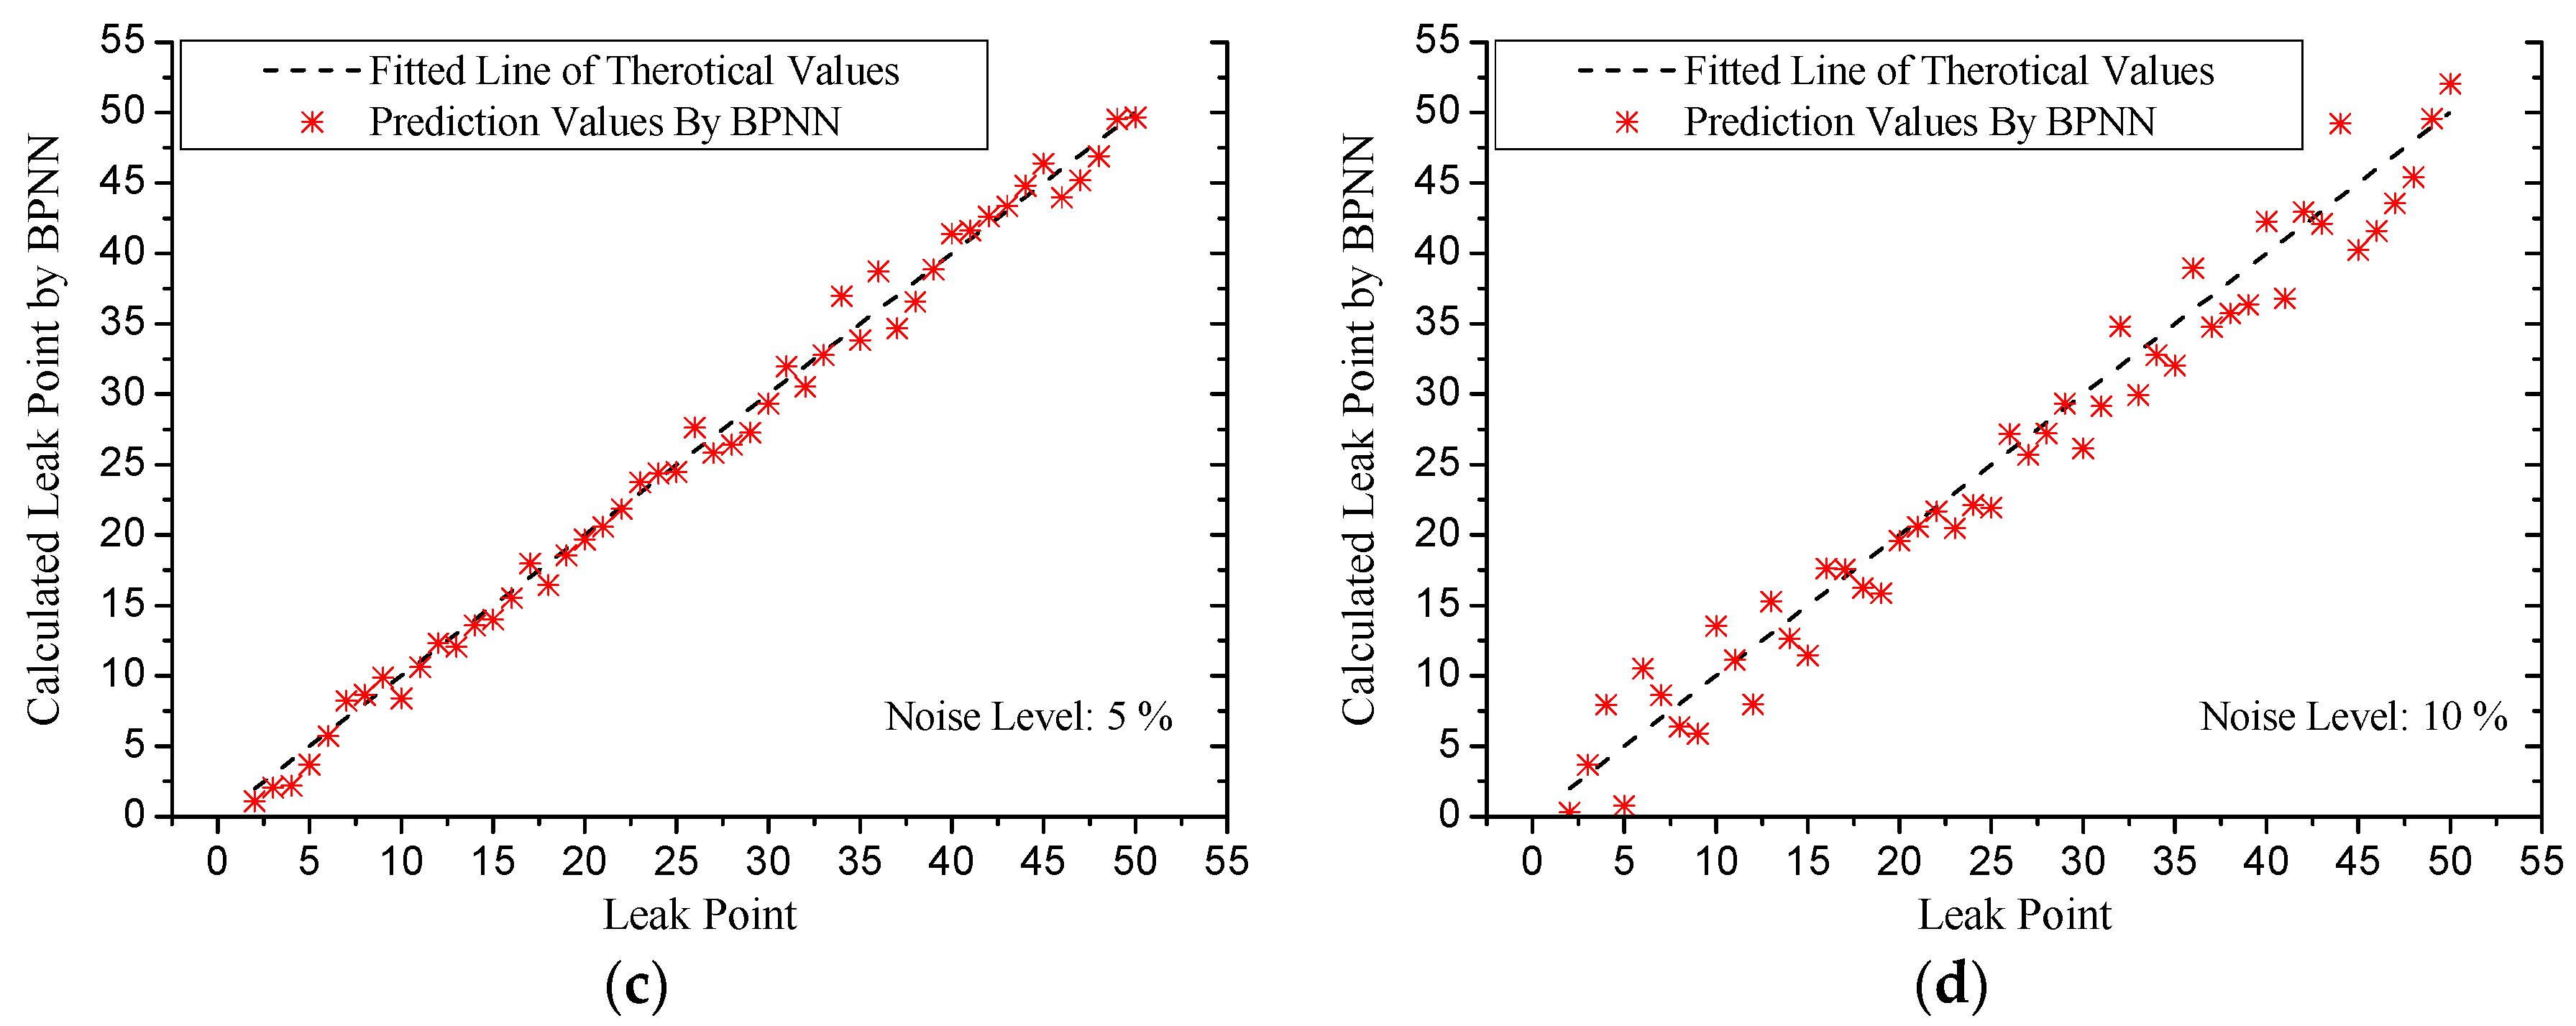
Measurement noise always influences the localization accuracy for real pipeline monitoring. In the above validation, the hoop strain variation is calculated based on MOC; thus, it is a numerical solution with no signal noise. For the actual application, the measurement noise will influence the localization effect. On the one hand, the measurement noise is generated from the FBG sensing system, like the FBG interrogator. On the other hand, the external disturbance or vibration will induce extra noise on all of the sensing points. Besides, the novel developed FBG hoop strain sensor has enhanced strain sensitivity, which means the noise level will also be enlarged in the measurement. Thus, it is important to consider the signal noise for different levels for the real application. To demonstrate the robustness of the neural network, the calculated hoop strain variations are randomly added with Gaussian noises and sent as test samples for the trained neural network. Figure 10 shows the prediction results under different level noises. The noise levels are 1%, 2%, 5% and 10%, respectively. The error analysis of several noise levels is presented in Table 3. It can be seen that the neural network for leakage localization has a very good anti-noise capacity. The RMS error is as low as 1.7473% even under a 10% measurement noise level, which means the average localization error is less than 1 km for the 55-km pipeline in this case study. For some leak points, it is found that the localization error is more than 5 km. This problem cannot be solved by increasing the input neurons (or the hoop strain sensing points) according to different trials. A probable approach is to combine this with manual inspection after generally locating the leak position to find a more precise result. However, considering the RMS error of the whole pipeline, the average accuracy of leakage localization is still acceptable. Meanwhile, since the FBG sensor features high accuracy and low noise level, this test is only used to demonstrate the ultimate performance of the BP neural network-based method. In real the application, the noise generated from the FBG sensor should be much lower than 10%. Thus, the proposed neural network for pipeline leakage localization is expected to function well in practical applications. Future research will focus on dealing with extremely large localization error from this system.
The results of the case study in this paper are from an ideal pipeline, without considering any external disturbance. Thus, this is a preliminary investigation with scope for further research. The work detailed in this paper opens the door to many potential avenues of research for leakage detection in pipelines. Additional pipeline leakage experiments or even real pipeline applications, including buried pipelines, overhead pipelines and even subsea pipelines, still need to be conducted to evaluate the performance of the neural network using hoop strain variations. Another possible next step for this research is the transition from the leakage detection and localization of single pipelines to the more general case of a branched network of pipelines.
5. Conclusions
The FBG hoop strain sensor, which is developed and encapsulated in our early research, brings the possibility of multi-point hoop strain measurements for a long-distance pipeline. In this paper, a BP neural network is employed as an important component in the pipeline leakage monitoring system. It is used to realize leak location recognition through hoop strain distributions.
When choosing the appropriate number of hidden layer neurons, the established network makes the RMS error lie within the range of 1%. The small error of the test sample outputs as compared to the target values demonstrates the effectiveness of the proposed method. Furthermore, the influence of noises on the neural network’s performance is discussed through simulation. The results show the good anti-noise ability of the network. To conclude, the neural network presented promising potential with good capability and robustness in pattern recognition for the pipeline leakage localization system.
Acknowledgments
This work has been supported by the Fund of the National Natural Science Foundation of China (Grant Nos. 51608094, 51421064, 51327003 and 51678109) and the National Key Research and Development Program of China (Grant No. 2016YFC0701107). These grants are greatly appreciated.
Author Contributions
Ziguang Jia and Liang Ren conceived of and designed the experiments. Liang Ren performed the experiments. Ziguang Jia analyzed the data. Hongnan Li contributed materials/analysis tools. Ziguang Jia and Wei Sun wrote the paper.
Conflicts of Interest
The authors declare no conflict of interest.
References
- Inaudi, D.; Glisic, B. Long-Range Pipeline Monitoring by Distributed Fiber Optic Sensing. J. Press. Vessel Technol. 2010, 132, 763–772. [Google Scholar] [CrossRef]
- Yan, S.Z.; Chyan, L.S. Performance enhancement of BOTDR fiber optic sensor for oil and gas pipeline monitoring. Opt. Fiber Technol. 2010, 16, 100–109. [Google Scholar] [CrossRef]
- Sun, Z.; Wang, P.; Vuran, M.C.; Al-Rodhaan, M.A.; Al-Dhelaan, A.M.; Akyildiz, I.F. MISE-PIPE: Magnetic induction-based wireless sensor networks for underground pipeline monitoring. Ad Hoc Netw. 2011, 9, 218–227. [Google Scholar] [CrossRef]
- Yoon, S.; Ye, W.; Heidemann, J.; Littlefield, B.; Shahabi, C. SWATS: Wireless Sensor Networks for Steamflood and Waterflood Pipeline Monitoring. IEEE Netw. 2011, 25, 50–56. [Google Scholar] [CrossRef]
- Meng, L.; Li, Y.; Wang, W.; Fu, J. Experimental study on leak detection and location for gas pipeline based on acoustic method. J. Loss Prev. Process Ind. 2012, 25, 90–102. [Google Scholar] [CrossRef]
- Ozevin, D.; Harding, J. Novel leak localization in pressurized pipeline networks using acoustic emission and geometric connectivity. Int. J. Press. Vessel Pip. 2012, 92, 63–69. [Google Scholar] [CrossRef]
- Zadkarami, M.; Shahbazian, M.; Salahshoor, K. Pipeline leak diagnosis based on wavelet and statistical features using Dempster-Shafer classifier fusion technique. Process Saf. Environ. 2017, 105, 156–163. [Google Scholar] [CrossRef]
- Zadkarami, M.; Shahbazian, M.; Salahshoor, K. Pipeline leakage detection and isolation: An integrated approach of statistical and wavelet feature extraction with multi-layer perceptron neural network (MLPNN). J. Loss Prev. Process 2016, 43, 479–487. [Google Scholar] [CrossRef]
- Qu, Z.; Feng, H.; Zeng, Z.; Zhuge, J.; Jin, S. A SVM-based pipeline leakage detection and pre-warning system. Measurement 2010, 43, 513–519. [Google Scholar] [CrossRef]
- Ni, L.; Jiang, J.; Pan, Y. Leak location of pipelines based on transient model and PSO-SVM. J. Loss Prev. Process 2013, 26, 1085–1093. [Google Scholar] [CrossRef]
- Hu, J.; Zhang, L.; Liang, W. Detection of small leakage from long transportation pipeline with complex noise. J. Loss Prev. Process 2011, 24, 449–457. [Google Scholar] [CrossRef]
- Li, H.; Li, D.; Song, G. Recent applications of fiber optic sensors to health monitoring in civil engineering. Eng. Struct. 2004, 26, 1647–1657. [Google Scholar] [CrossRef]
- Li, H.N.; Yi, T.H.; Ren, L.; Li, D.S.; Huo, L.S. Reviews on innovations and applications in structural health monitoring for infrastructures. Struct. Monit. Maint. 2014, 1, 1–45. [Google Scholar] [CrossRef]
- Jia, Z.; Ren, L.; Li, H.; Ho, S.; Song, G. Experimental study of pipeline leak detection based on hoop strain measurement. Struct. Control Health Monit. 2015, 22, 799–812. [Google Scholar] [CrossRef]
- Ren, L.; Jia, Z.; Li, H.; Song, G. Design and experimental study on FBG hoop-strain sensor in pipeline monitoring. Opt. Fiber Technol. 2014, 20, 15–23. [Google Scholar] [CrossRef]
- Valizadeh, S.; Moshiri, B.; Salahshoor, K. Leak Detection in Transportation Pipelines Using Feature Extraction and KNN Classification. In Proceedings of the Pipelines Specialty Conference, San Diego, CA, USA, 15–19 August 2009; pp. 580–589. [Google Scholar]
Figure 1.
Developed FBG hoop strain sensor. (a) Schematic diagram of an FBG hoop strain sensor; (b) picture of the encapsulated FBG hoop strain sensor with a pre-tension system.
Figure 1.
Developed FBG hoop strain sensor. (a) Schematic diagram of an FBG hoop strain sensor; (b) picture of the encapsulated FBG hoop strain sensor with a pre-tension system.
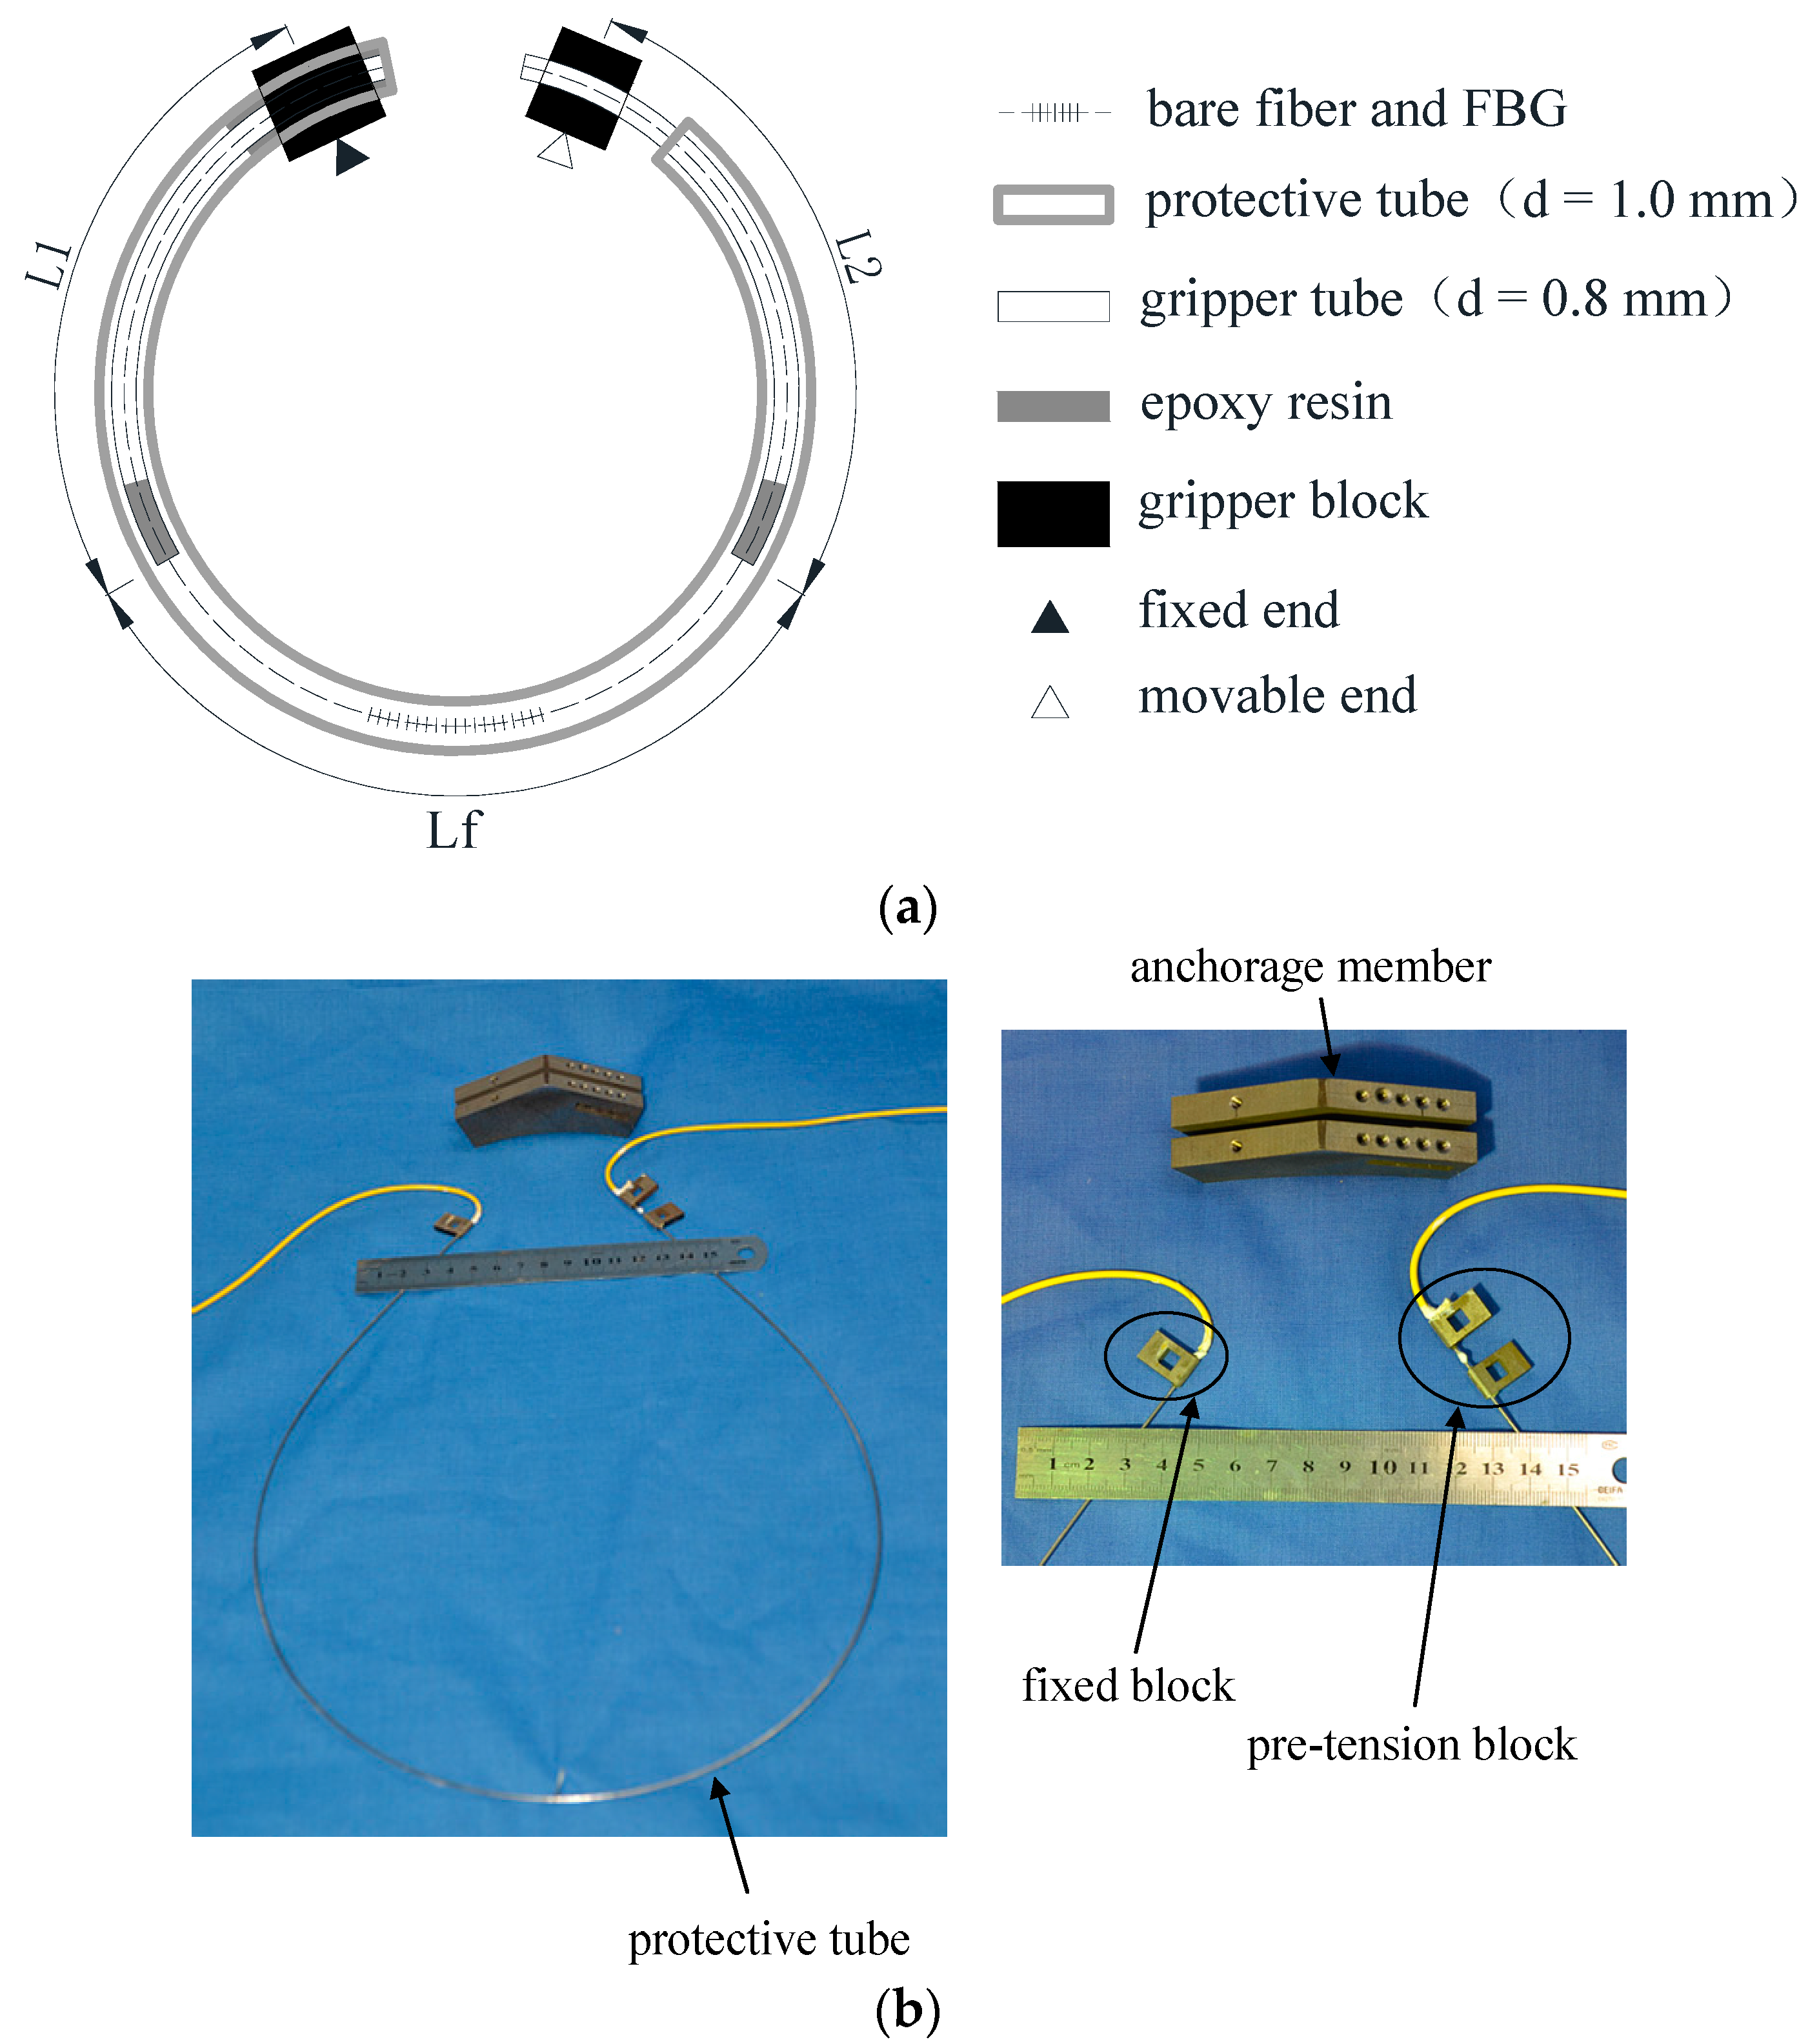
Figure 2.
Picture of model pipeline and FBG sensors.

Figure 3.
Time history curve of the FBG hoop strain sensor for leak detection. NPW, negative pressure wave.
Figure 3.
Time history curve of the FBG hoop strain sensor for leak detection. NPW, negative pressure wave.
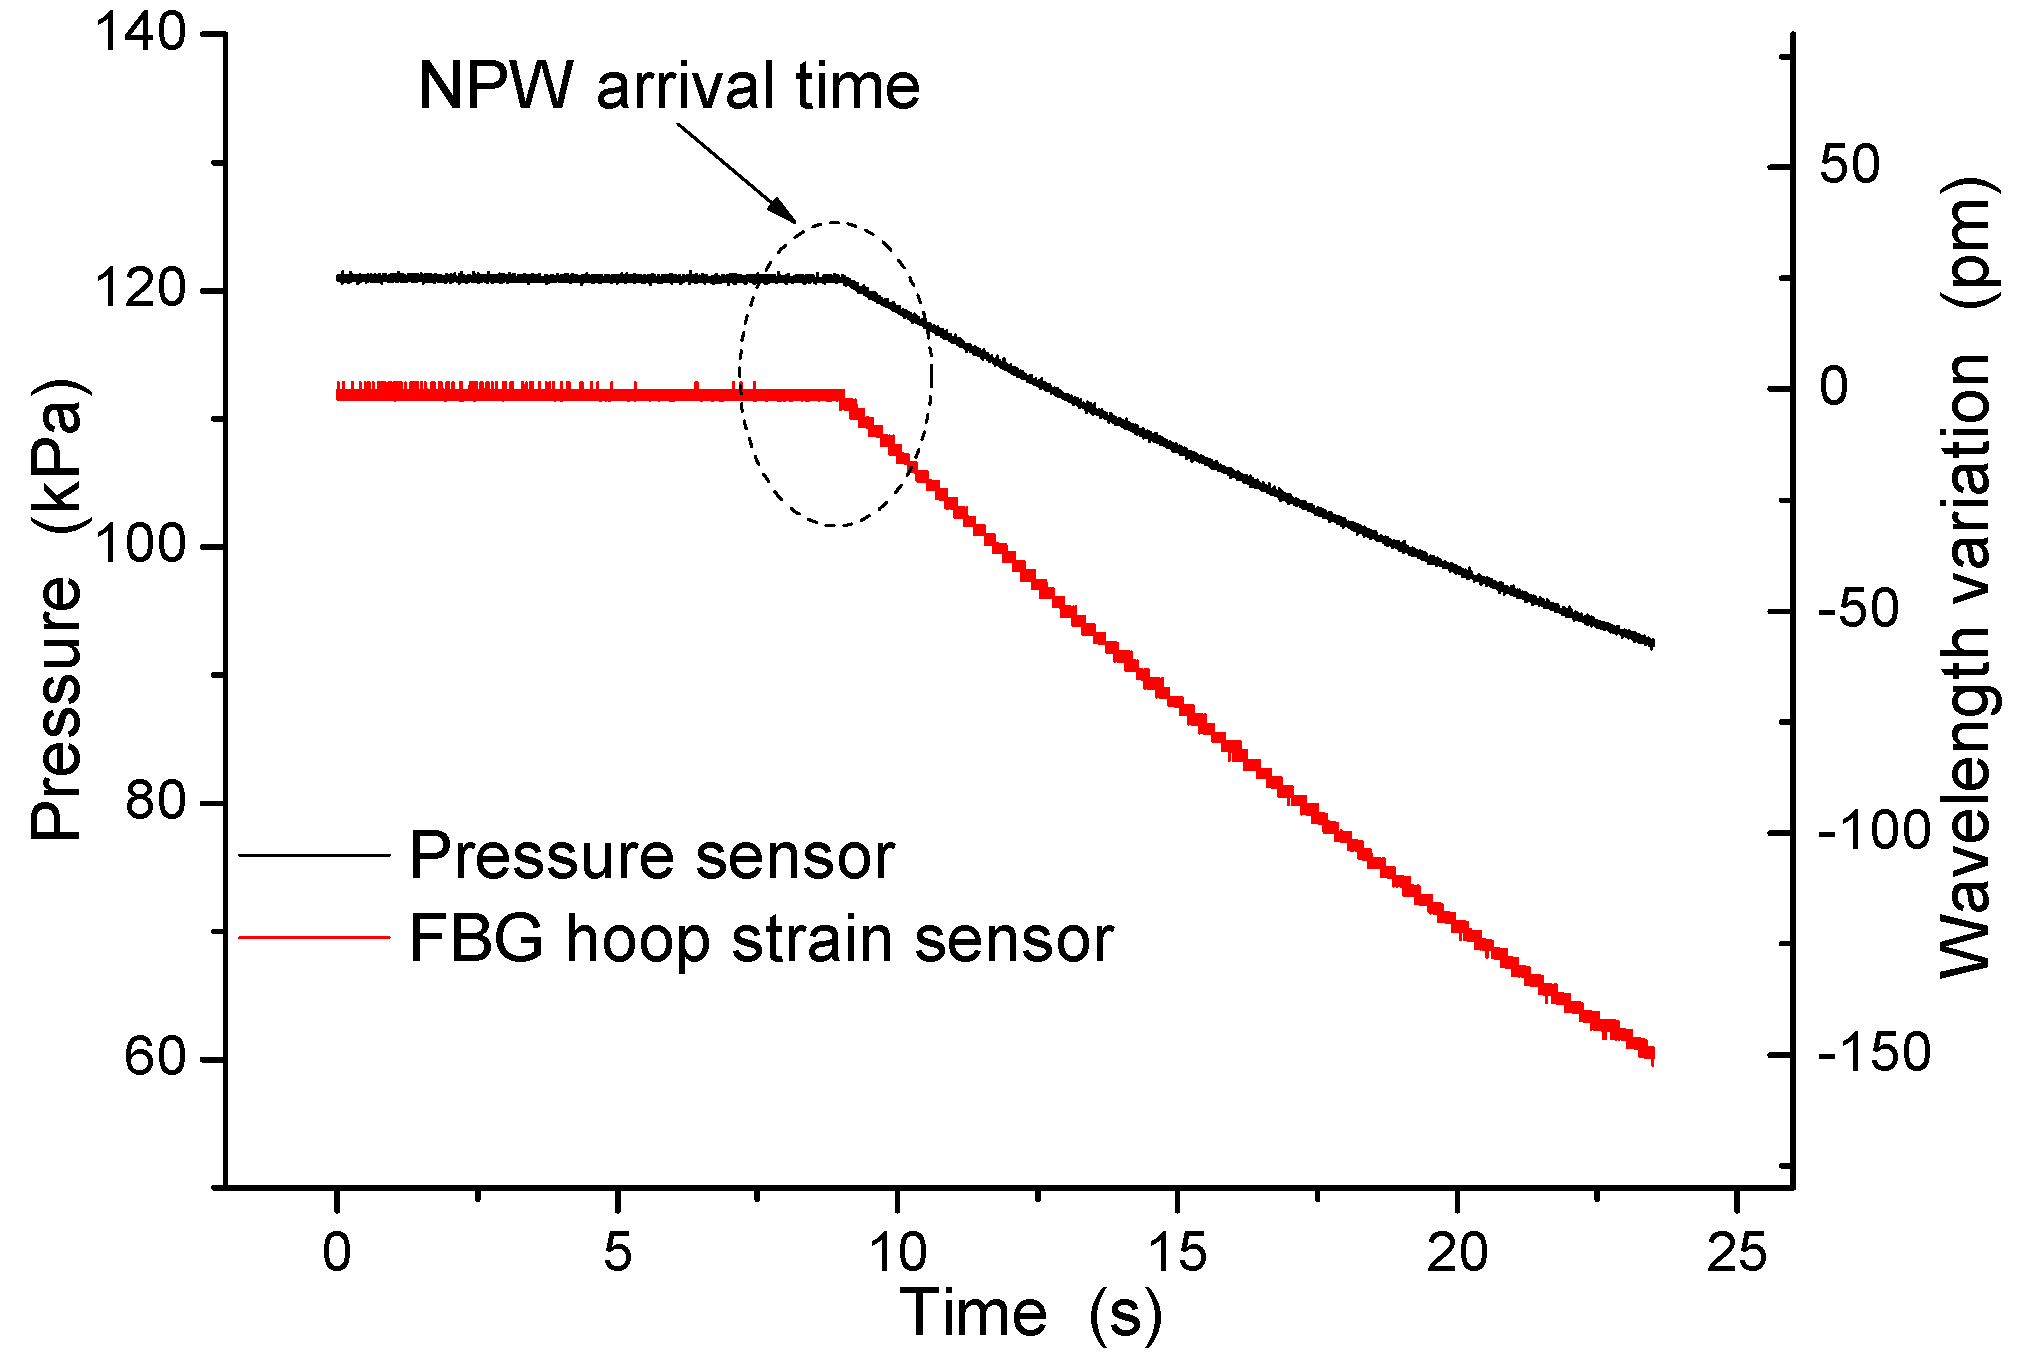
Figure 4.
Difference grid for the method of characteristics (MOC).
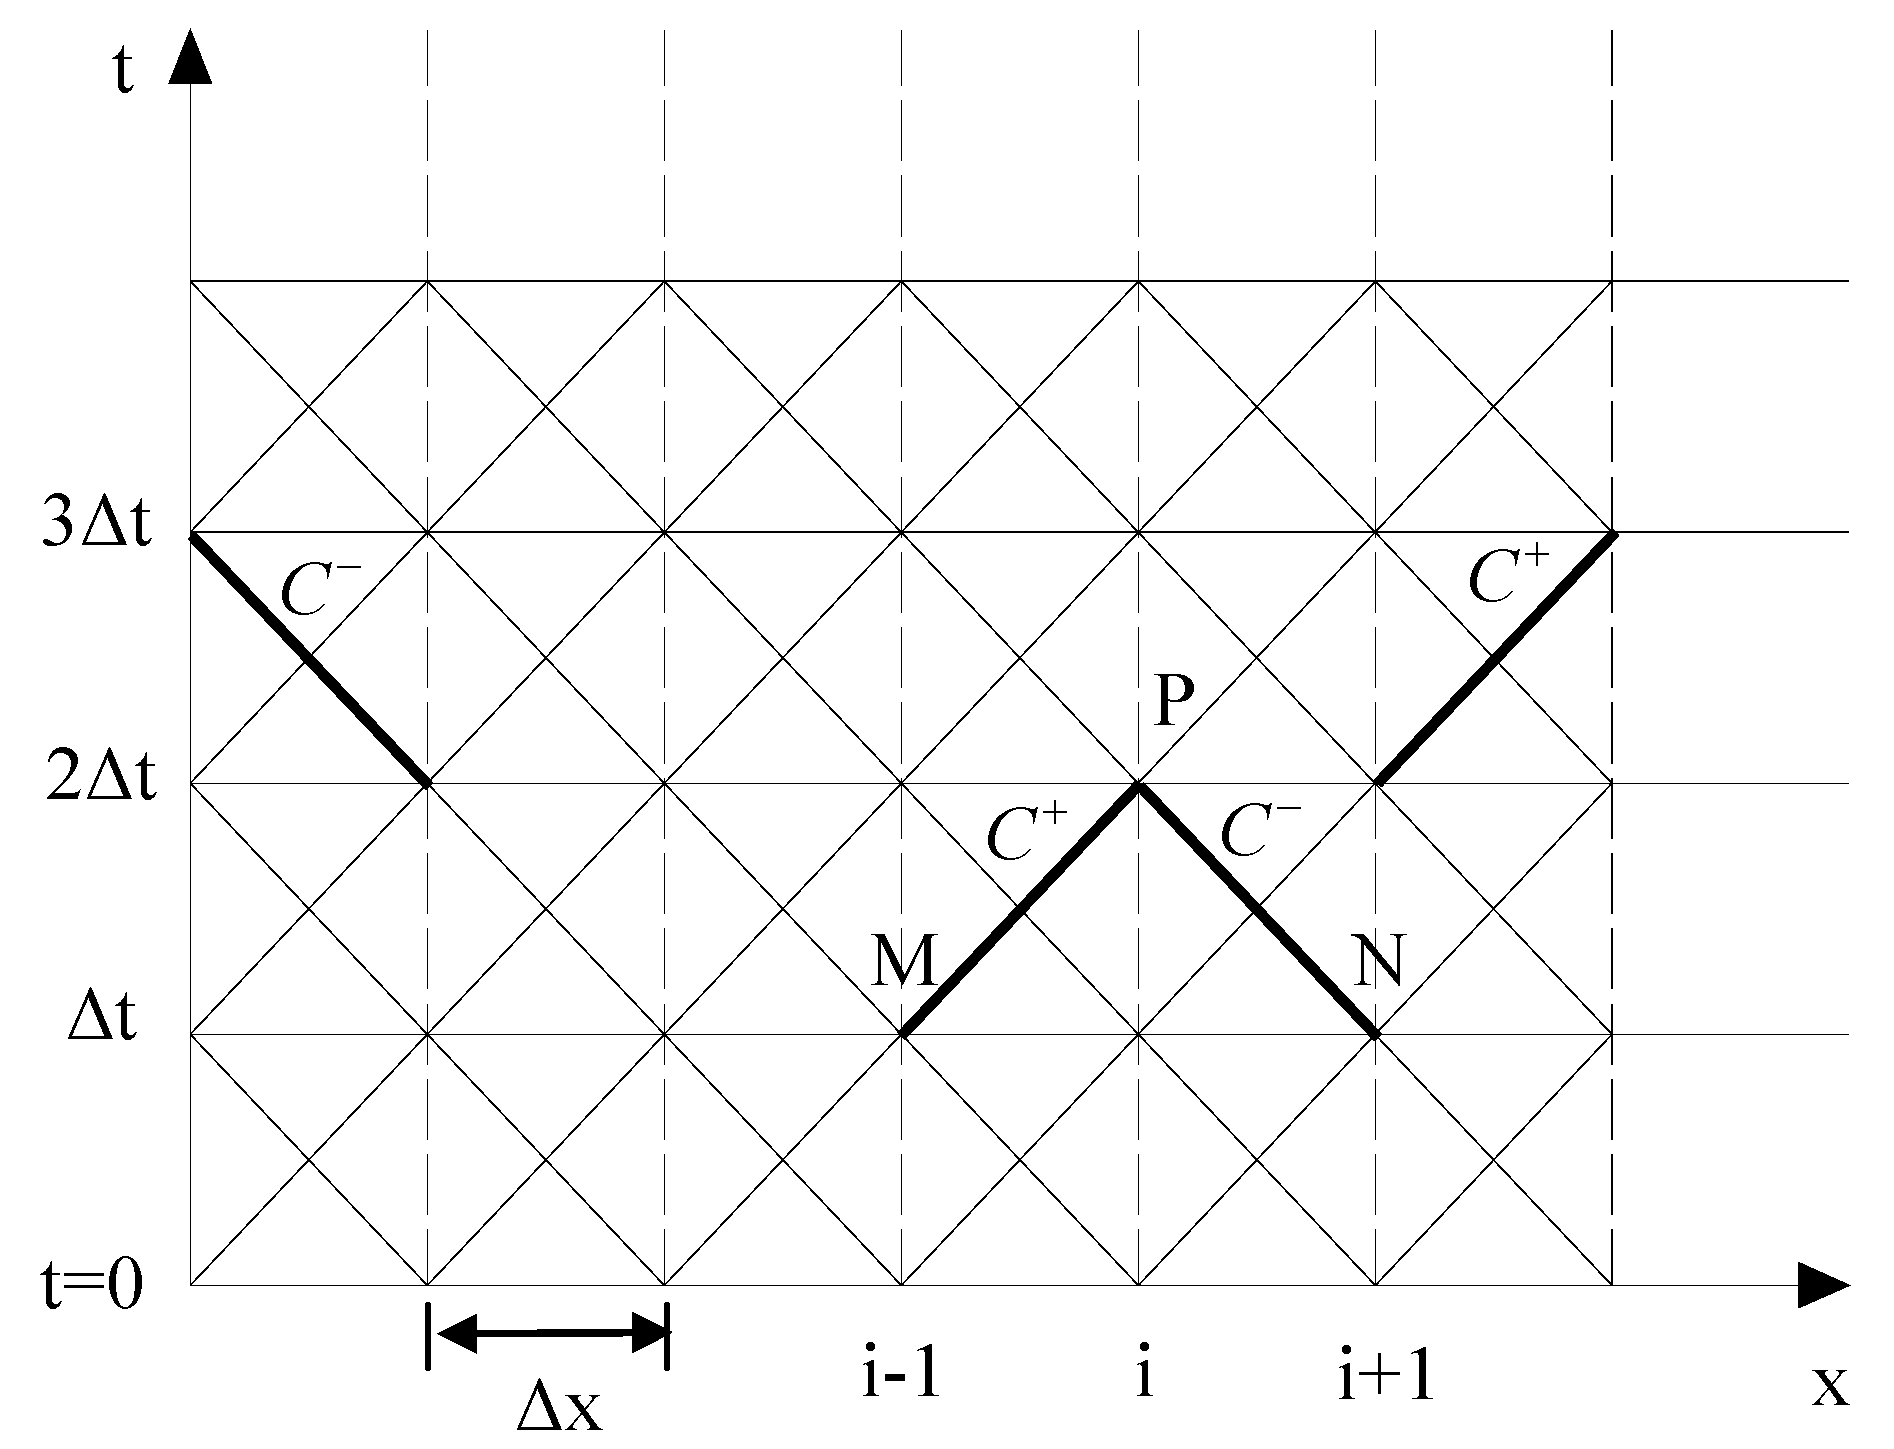
Figure 5.
Hoop strain time history at the end node in different leak locations.
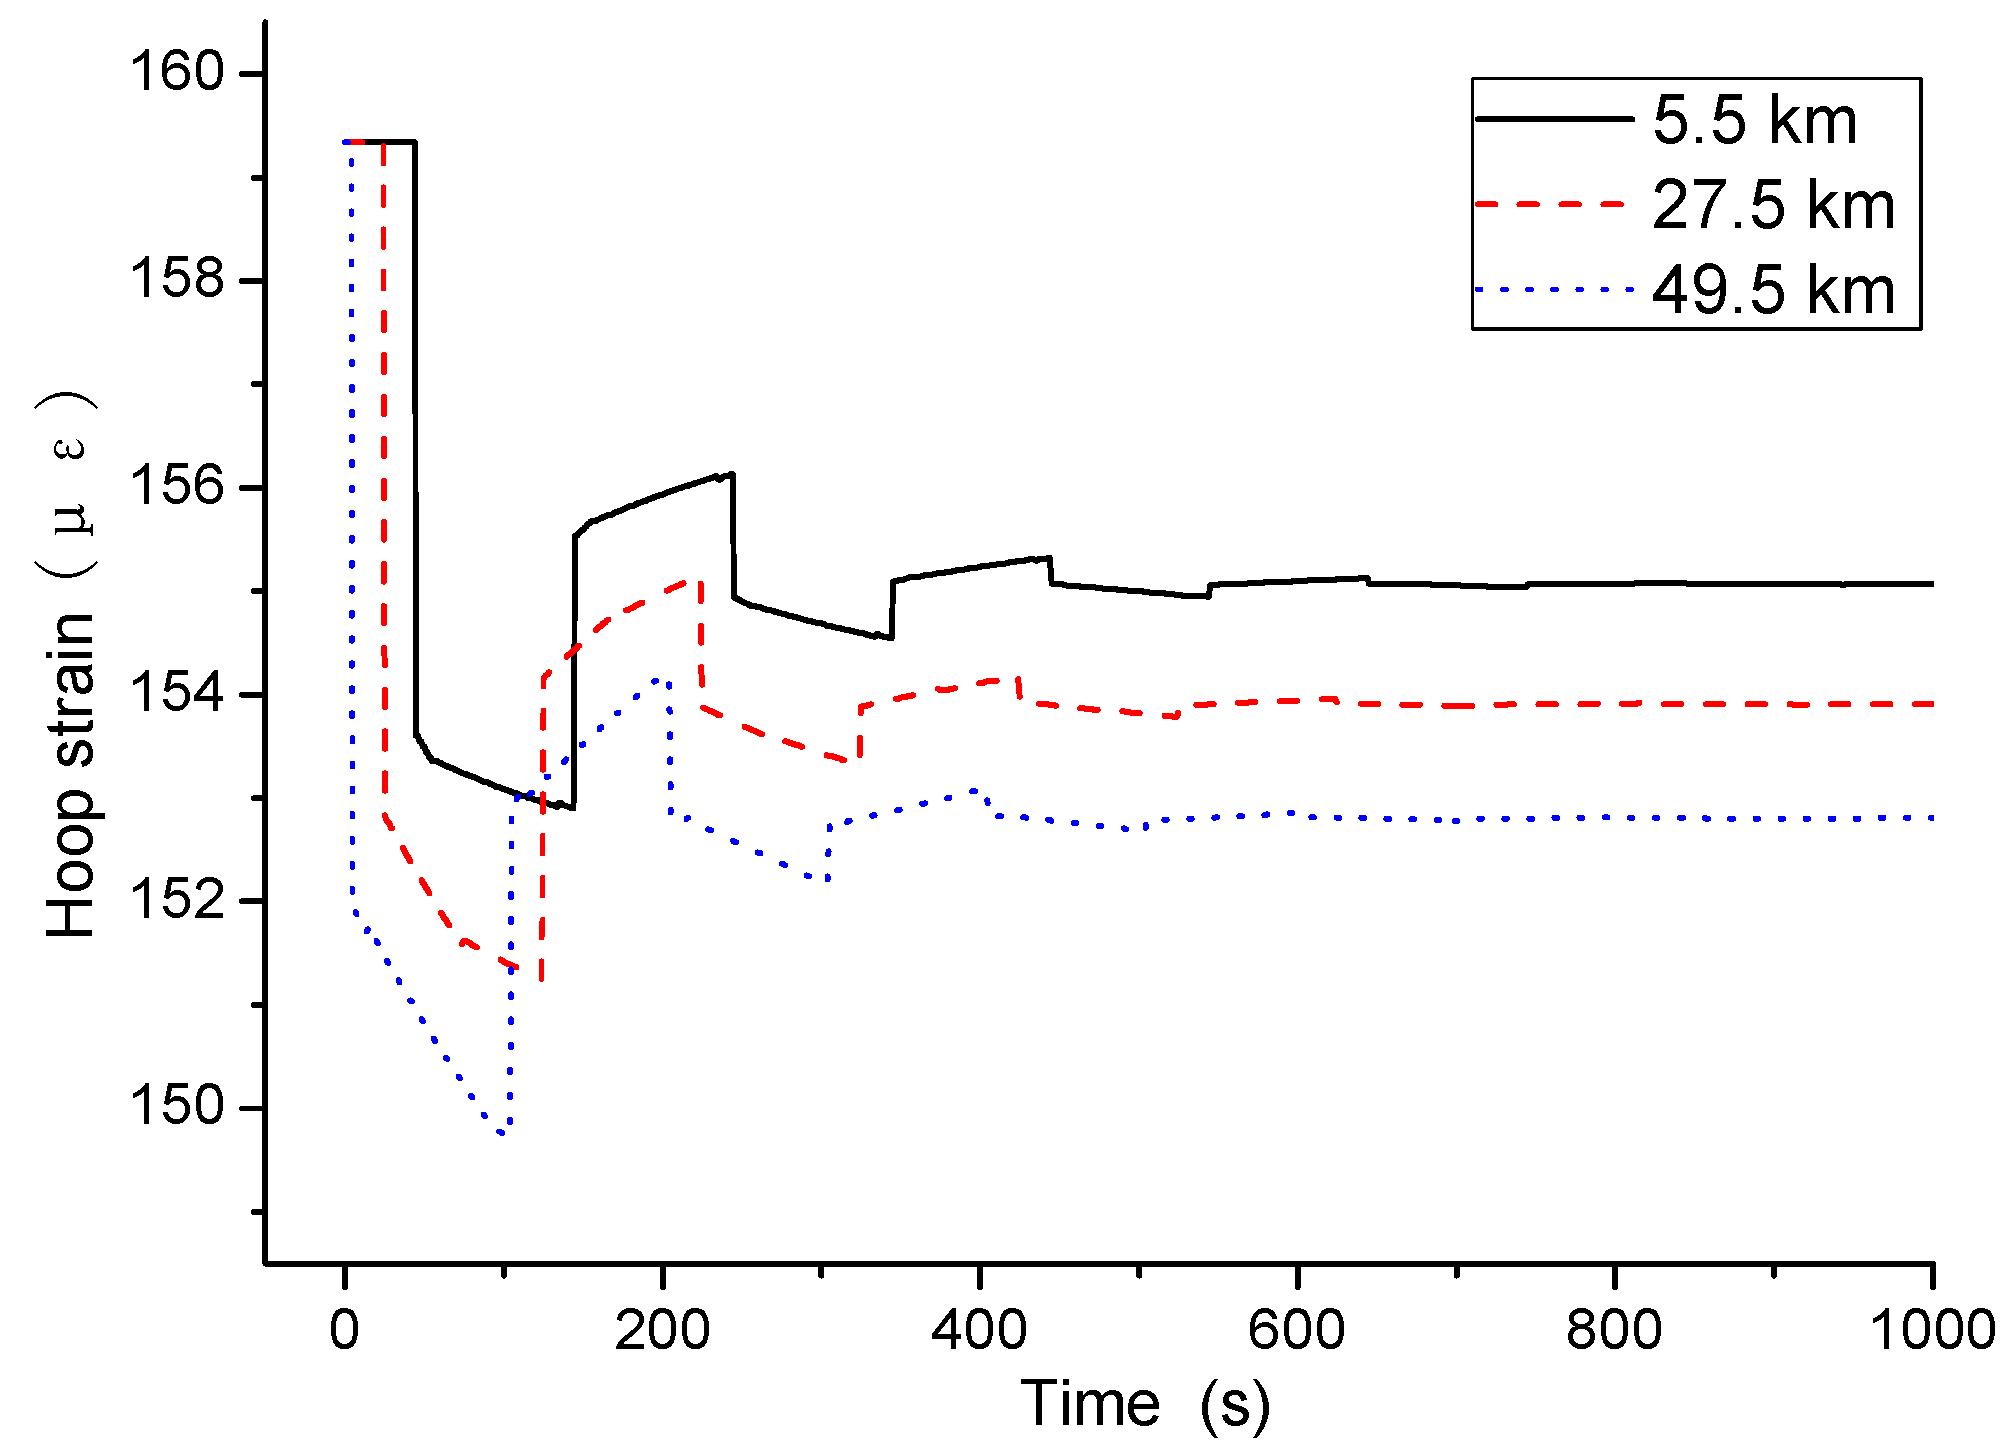
Figure 6.
Topological graph of the BP neural network.

Figure 7.
The BP neural network structure for leakage localization.
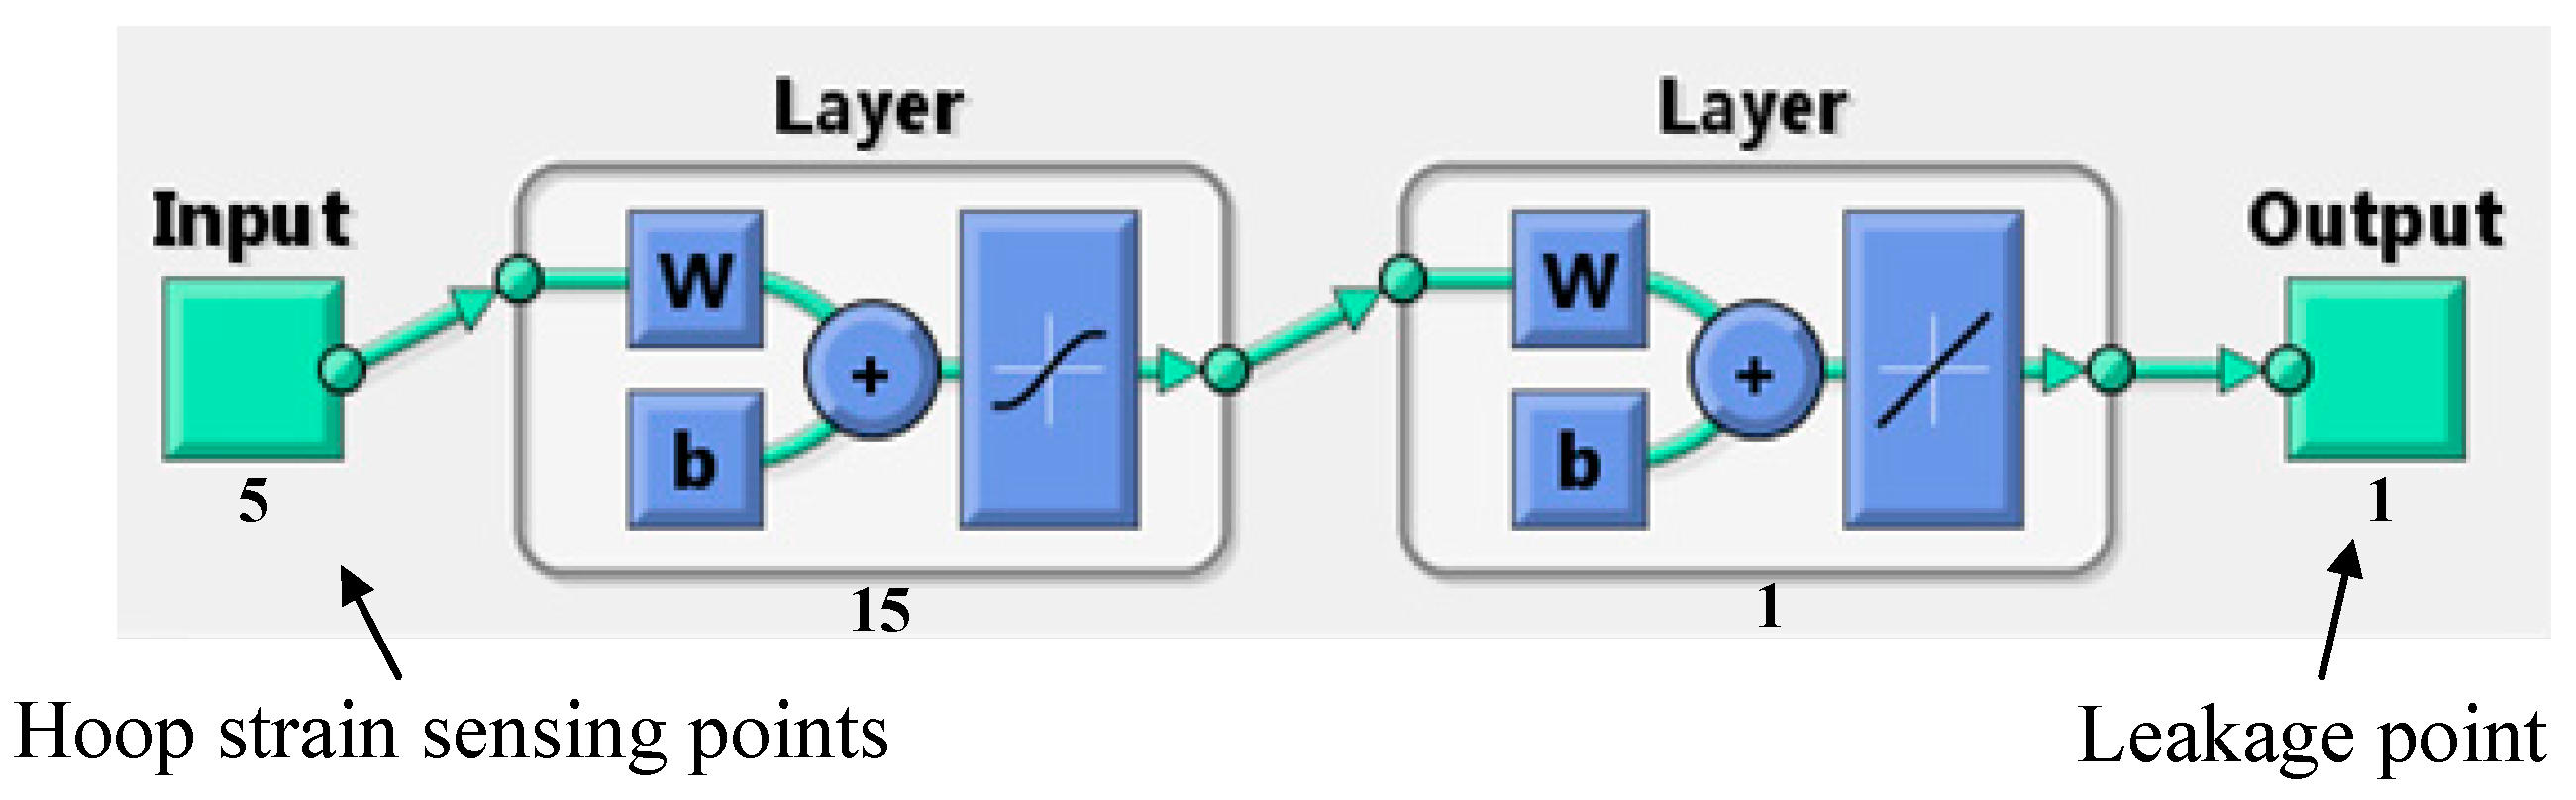
Figure 8.
Localization results based on two pressure gauges and BPNN.

Figure 9.
Contrast of the prediction result with real leak point.

Figure 10.
Leakage localizations considering different noise levels: (a) 1%; (b) 2%; (c) 5%; (d) 10%.
Figure 10.
Leakage localizations considering different noise levels: (a) 1%; (b) 2%; (c) 5%; (d) 10%.


Table 1.
Distribution of hoop strain variations.
| Leak Point | Hoop Strain Sensing Point | Leak Point | Hoop Strain Sensing Point | ||||||||
|---|---|---|---|---|---|---|---|---|---|---|---|
| 1 | 2 | 3 | 4 | 5 | 1 | 2 | 3 | 4 | 5 | ||
| 2 | 23.04 | 22.63 | 22.22 | 21.81 | 21.40 | 27 | 23.51 | 23.01 | 22.02 | 21.61 | 21.20 |
| 3 | 23.03 | 22.62 | 22.21 | 21.80 | 21.39 | 28 | 23.51 | 23.01 | 22.01 | 21.60 | 21.19 |
| 4 | 23.02 | 22.61 | 22.20 | 21.79 | 21.38 | 29 | 23.51 | 23.01 | 22.00 | 21.59 | 21.18 |
| 5 | 23.02 | 22.61 | 22.20 | 21.79 | 21.38 | 30 | 23.51 | 23.01 | 22.00 | 21.59 | 21.18 |
| 6 | 23.01 | 22.60 | 22.19 | 21.78 | 21.37 | 31 | 23.51 | 23.01 | 21.99 | 21.58 | 21.17 |
| 7 | 23.00 | 22.59 | 22.18 | 21.77 | 21.36 | 32 | 23.51 | 23.01 | 22.52 | 21.57 | 21.16 |
| 8 | 22.99 | 22.58 | 22.17 | 21.76 | 21.35 | 33 | 23.51 | 23.02 | 22.52 | 21.56 | 21.15 |
| 9 | 22.98 | 22.57 | 22.16 | 21.75 | 21.34 | 34 | 23.51 | 23.02 | 22.52 | 21.56 | 21.15 |
| 10 | 22.98 | 22.57 | 22.16 | 21.74 | 21.33 | 35 | 23.51 | 23.02 | 22.52 | 21.55 | 21.14 |
| 11 | 22.97 | 22.56 | 22.15 | 21.74 | 21.33 | 36 | 23.51 | 23.02 | 22.52 | 21.54 | 21.13 |
| 12 | 23.51 | 22.55 | 22.14 | 21.73 | 21.32 | 37 | 23.51 | 23.02 | 22.52 | 21.53 | 21.12 |
| 13 | 23.51 | 22.54 | 22.13 | 21.72 | 21.31 | 38 | 23.51 | 23.02 | 22.52 | 21.53 | 21.11 |
| 14 | 23.51 | 22.53 | 22.12 | 21.71 | 21.30 | 39 | 23.51 | 23.02 | 22.52 | 21.52 | 21.11 |
| 15 | 23.51 | 22.53 | 22.11 | 21.70 | 21.29 | 40 | 23.51 | 23.02 | 22.52 | 21.51 | 21.10 |
| 16 | 23.51 | 22.52 | 22.11 | 21.70 | 21.29 | 41 | 23.51 | 23.02 | 22.52 | 21.50 | 21.09 |
| 17 | 23.51 | 22.51 | 22.10 | 21.69 | 21.28 | 42 | 23.51 | 23.02 | 22.52 | 22.03 | 21.08 |
| 18 | 23.51 | 22.50 | 22.09 | 21.68 | 21.27 | 43 | 23.51 | 23.02 | 22.52 | 22.03 | 21.08 |
| 19 | 23.51 | 22.49 | 22.08 | 21.67 | 21.26 | 44 | 23.51 | 23.02 | 22.52 | 22.03 | 21.07 |
| 20 | 23.51 | 22.49 | 22.07 | 21.66 | 21.25 | 45 | 23.51 | 23.02 | 22.52 | 22.03 | 21.06 |
| 21 | 23.51 | 22.48 | 22.07 | 21.66 | 21.25 | 46 | 23.51 | 23.02 | 22.52 | 22.03 | 21.06 |
| 22 | 23.51 | 23.01 | 22.06 | 21.65 | 21.24 | 47 | 23.51 | 23.02 | 22.52 | 22.03 | 21.05 |
| 23 | 23.51 | 23.01 | 22.05 | 21.64 | 21.23 | 48 | 23.51 | 23.02 | 22.52 | 22.03 | 21.04 |
| 24 | 23.51 | 23.01 | 22.04 | 21.63 | 21.22 | 49 | 23.51 | 23.02 | 22.52 | 22.03 | 21.03 |
| 25 | 23.51 | 23.01 | 22.04 | 21.63 | 21.21 | 50 | 23.51 | 23.02 | 22.52 | 22.03 | 21.03 |
| 26 | 23.51 | 23.01 | 22.03 | 21.62 | 21.21 | ||||||
Table 2.
Prediction errors under different hidden nodes of the BP neural network.
| Hidden Nodes | Standard Deviation | RMS Error | Regression Coefficient |
|---|---|---|---|
| 3 | 2.8616 | 2.8939 | 0.9798 |
| 5 | 1.8664 | 2.0083 | 0.9930 |
| 7 | 2.1291 | 2.3373 | 0.9927 |
| 10 | 0.6653 | 0.7381 | 0.9992 |
| 12 | 0.0266 | 0.0285 | 1.0000 |
| 15 | 0.0091 | 0.0101 | 1.0000 |
| 18 | 1.1984 | 1.2374 | 0.9973 |
| 20 | 0.3459 | 0.3639 | 0.9997 |
Table 3.
Prediction error under different noise levels.
| Noise Level | Standard Deviation | RMS Error | Regression Coefficient |
|---|---|---|---|
| 1% | 0.2317 | 0.2441 | 0.9999 |
| 2% | 0.3948 | 0.4061 | 0.9996 |
| 3% | 0.6401 | 0.6355 | 0.999 |
| 5% | 0.9369 | 0.9275 | 0.9979 |
| 7% | 1.3422 | 1.3348 | 0.9956 |
| 10% | 1.7166 | 1.7473 | 0.9935 |
© 2018 by the authors. Licensee MDPI, Basel, Switzerland. This article is an open access article distributed under the terms and conditions of the Creative Commons Attribution (CC BY) license (http://creativecommons.org/licenses/by/4.0/).
Share and Cite
MDPI and ACS Style
Jia, Z.; Ren, L.; Li, H.; Sun, W. Pipeline Leak Localization Based on FBG Hoop Strain Sensors Combined with BP Neural Network. Appl. Sci. 2018, 8, 146. https://doi.org/10.3390/app8020146
AMA Style
Jia Z, Ren L, Li H, Sun W. Pipeline Leak Localization Based on FBG Hoop Strain Sensors Combined with BP Neural Network. Applied Sciences. 2018; 8(2):146. https://doi.org/10.3390/app8020146
Chicago/Turabian StyleJia, Ziguang, Liang Ren, Hongnan Li, and Wei Sun. 2018. "Pipeline Leak Localization Based on FBG Hoop Strain Sensors Combined with BP Neural Network" Applied Sciences 8, no. 2: 146. https://doi.org/10.3390/app8020146
Note that from the first issue of 2016, this journal uses article numbers instead of page numbers. See further details here.