Monitoring Damage Using Acoustic Emission Source Location and Computational Geometry in Reinforced Concrete Beams


1
De La Salle University, 2401 Taft Avenue, Manila 1004, Philippines
2
Tokyo Institute of Technology, Meguro Ookayama 2-12-1, Tokyo 152-8552, Japan
*
Author to whom correspondence should be addressed.
Appl. Sci. 2018, 8(2), 189; https://doi.org/10.3390/app8020189
Submission received: 14 November 2017
/
Revised: 20 January 2018
/
Accepted: 23 January 2018
/
Published: 26 January 2018
(This article belongs to the Special Issue Soft Computing Techniques in Structural Engineering and Materials)
Abstract
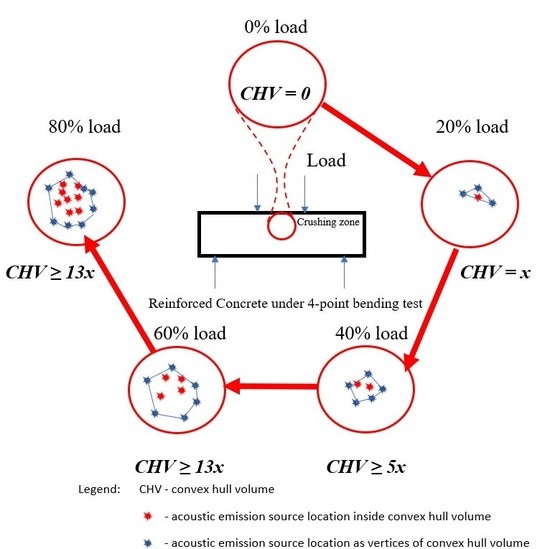
:Non-destructive testing in reinforced concrete (RC) for damage detection is still limited to date. In monitoring the damage in RC, 18 beam specimens with varying water cement ratios and reinforcements were casted and tested using a four-point bending test. Repeated step loads were designed and at each step load acoustic emission (AE) signals were recorded and processed to obtain the acoustic emission source location (AESL). Computational geometry using a convex hull algorithm was used to determine the maximum volume formed by the AESL inside the concrete beam in relation to the load applied. The convex hull volume (CHV) showed good relation to the damage encountered until 60% of the ultimate load at the midspan was reached, where compression in the concrete occurred. The changes in CHV from 20 to 40% and 20 to 60% load were five and 13 times from CHV of 20% load for all beams, respectively. This indicated that the analysis in three dimensions using CHV was sensitive to damage. In addition, a high water-cement ratio exhibited higher CHV formation compared to a lower water-cement ratio due to its ductility where the movement of AESL becomes wider.
1. Introduction
In today’s modern world, structural health monitoring is very important to assess the retrofitting and repair of structures. Structures experience man-made and natural disasters that need more precise and accurate assessment in preparation of an event or after an event. The material that is commonly used in structures is concrete. Concrete can be assessed in many ways, where the factors to be considered in the test are cost, time, and the idle period during assessment. One way of achieving a better and more economical test is through the use of a non-destructive test (NDT). The NDT in concrete is complex due to its nonhomogeneous ingredients and design mix.
From research, there are two common tests that are available in the literature. The NDT test can be classified as insensitive or sensitive to internal damage. Insensitive to internal damage are those test methods that do not correlate well with mechanical load or any damage. In this test, an abrupt change in the measurement of a parameter indicates the sudden failure of concrete. Examples of these NDT tests are the ultrasonic pulse velocity (UPV) test, SONREB (ultrasonic pulse velocity test and rebound hammer) test, and the chain drag method. On the other hand, NDT tests that are sensitive to internal damage involve parameters that correlate well with internal load. Examples of sensitive NDT tests are the non-linear ultrasonic test [1,2,3] and the acoustic emission (AE) test [4].
The focus of this study is to use the AE test that is sensitive to internal damage. It relates the mechanical behavior of concrete to the crack propagation inside it. Experiments are conducted to assess crack propagation and the localization of micro-cracks with the macro deformation of concrete under uniaxial tension [5]. This generation of elastic waves inside concrete is generated by the release of energy, as shown in Figure 1, where highly localized stresses develop ahead of the crack tip [6]. Waves are monitored by piezoelectric sensors, which convert the mechanical signal into electrical signals. Numerous studies have been conducted using AE parameters such as AE event, AE counts, AE arrival time, AE energy, and AE source location (AESL) to characterize damage and cracks in historical and new structures [7,8,9,10,11,12]. However, few papers have been conducted to study AE in reinforced concrete (RC) beams.
2. Acoustic Emission Test on RC Beams
Recent research in AE includes the testing of RC beams with high initial loading cycles that produced fewer acoustic emission signals [13]. A recent overview of AE on fatigue damage assessment summarized that the damage in RC beams subjected to increasing load in conjunction with this technique is still limited [14].
The combination of NDT to assess damage in RC concrete proved to be effective. The latest development includes “infradock”, where inspection techniques for on-site measurements should be synthesized as a prognosis procedure [15]. This test includes ultrasonic, impact-echo, and acoustic emission tests [16]. In addition, the AE test was used in detecting cracks in concrete damaged under Alkali-Silica Reaction [17]. Results showed that the high frequency range of AE events between 300 kHz and 400 kHz can be an indication of aggregate cracking, while the low frequency range of AE events between 100 kHz and 300 kHz can be an indication of matrix cracking between the paste and interfacial transition zone (ITZ). Weighted peak frequencies were also used to characterize damage in different stages of stress-strain diagram [18].
In this paper, since the data on AE tests are limited in RC beams, AESL hits were used from laboratory experiments as a parameter for measuring damage under the four-point bending test. Two water-cement ratios of 0.40 and 0.60 with three different beam reinforcement designs—A, B, and C—were used.
2.1. Factors Affecting Acoustic Emission Tests
There are many factors affecting AE tests in concrete. One factor is the scaling of specimens, which most researchers use as a basis for their assumptions in creating models. From studies, the mesoscale can be assumed to be closest to the behavior of concrete. Experimentation and the numerical method are employed for notched and un-notched concrete beams during the three-point bending test. The AESL and mesoscale non-linear model is correlated with the damage evolution and characterization of the Fracture Process Zone (FPZ). The initiation of fracture in notched beams is detected earlier than in un-notched beams. An AESL moving along the horizontal axis indicated more ductile behavior [19,20]. A phenomenological model is made to capture important characteristics that emerge in damage progression and AE measurements. In the case of masonry specimens, the stored elastic energy is released in the creation of surfaces at the micro/mesoscopic level [21].
Another scale is the multiscale approach. Multiscale methodology should be considered in the AE test of RC structures. Validation using the cracking characterization in a laboratory should be correlated with real structures of different sizes and different ingredients. Specimen size, as well as sensor type and sensors separation distance have a strong influence on AE test results [22].
Drawn from previous research, the following are the challenges that need to be addressed by researchers for the improvement of in situ NDTs using AE:
- (a)
- Localization of damage—Determining the localization of cracks inside RC beams is an important concern that researchers need to explore. As an example, time reverse modeling using the AE test is applied in RC specimens and confirmed to be capable of localizing AE activity caused by concrete cracking [23]. In addition, the combination of AE signals and digital imaging can reveal and possibly characterize damage in concrete [24].
- (b)
- Size of specimens—Reinforced beam specimens of three sizes of scales are made to investigate the size effect of concrete beams when the bending test is introduced using digital image correlation (DIC) and AE. In large beams, tensile micro-cracking is observed in the initial and intermediate level of loadings, while shear cracking is evident at the final stages [25]. In another study, zoning is used to explore the behavior of mode of failure near the support and at the midspan of a long beam. Zones near the support tested under the four-point bending test showed that the initial load from 20 to 50% dominantly result in the tensile mode of failure, followed by shear failure over 50 to 100% ultimate load. On the other hand, the middle zone of the beam exhibits a different behavior. It undergoes the dominant tensile mode of failure from 0 to 100% of ultimate load and few shear modes are observed at the final stage of the ultimate load [26].
- (c)
- Mode of failure—Fracture modes are investigated in beams tested in the three-point bending test. Tensile cracks occurred first followed by shear cracks. In addition, elementary finite element models are used to investigate the stress field of tensile stress and shear stress in the beam to redesign the experiment setup to have more dominant shear cracks [27]. Another study considered composite slabs with layers of casted wire mesh, and tested failure modes of punching and flexure. A damage index using AE energy is used when a high AE energy class is found to be associated with activities in the FPZ [28].
In this study, the three challenges mentioned above were addressed and considered as limitations. Particularly, the placement of AE sensors at the midspan of the short RC beam was addressed. The time-difference method was used to localize and determine the AESL hits in the compression zone under the crushing of concrete. The algorithm for the AESL hits is available from the literature [29]. The design of the beam considered in the experiment was over-reinforced. Over-reinforced concrete beams tend to have minimal midpoint deflection and evident failure on the compression zone above the neutral axis experienced by concrete. The dominant mode of failure for the whole structure was achieved by bending at the midspan and not by shear experienced near the support.
2.2. Relationship of Fracture Mechanics and Acoustic Emission Test Results
According to the failure process of concrete, the nucleation of shear cracks follows tensile cracks on an existing crack surface [15]. Experiments with AE tests and fracture mechanics were conducted to correlate damage analysis or energy in structures [30,31,32]. In addition, acoustic emission and digital image correlation techniques were simultaneously used to investigate fracture parameters such as crack opening and size of fracture zone. It was found out that AE is useful in locating fracture growth due to micro- and macro-cracks, while DIC is useful to measure the crack openings. Both methods also presented a good estimation of crack tip location. It was also observed that the total number of AE events for larger beams required more energy to cause failure in beams [33].
The FPZ is also of interest to localize damage. In a previous study, plain concrete specimens under uniaxial load were generally found to have narrower/smaller FPZs than fiber-reinforced concrete. The FPZ can be considered as an indicator of brittleness/toughness of the material. A tougher material with a higher energy capacity has a wider/larger FPZ [34].
Fatigue crack growth in plain concrete beams using three-point loading showed that the rate of decrease in stiffness and the rate of change of crack growth was independent of the size of the specimen [35].
Interfaces between materials also need to considered in real life situations. An investigation of a concrete-concrete interface was conducted with beams of different sizes, with a jointed interface between two different strengths of concrete. The width of the FPZ and damage zone are computed using load, displacement, AE events, and AE energy, and was found to be independent of the size. Additionally, as the difference in compressive strength of concrete on either side of interface increases, the load carrying capacity, number of AE events, AE energy, width of FPZ, and damage zone decrease [36].
From the abovementioned discussions, modeling and DIC are mostly conducted using two-dimensional analysis. However, structures are in three dimensions and the investigation of crack opening and FPZ should be done in three dimensions as well. This paper uses convex hull volume (CHV), which is a representation of the three-dimensional analysis, to investigate the localization of damage or FPZ in the compression zone at the midspan of the beam. In relation to this, further investigations are warranted.
2.3. Using Computational Geometry and Acoustic Emission Source Location (AESL)
The AESL can be determined using the time-difference approach. Adaption of the Bancroft algorithm from geodesy to the localization procedure of sources of elastic waves gave good stability, automation, and performance of localization results. A combination of the permutation approach led to reliable results for larger specimens that may show an accurate fracture process in concrete [37]. It was recommended that the use of AE test data from the literature be analyzed using the artificial intelligence method to identify damage modes in concrete [38]. Using AE test results with artificial intelligence such as support vector machine or pattern recognition proved to be a good tool in assessing materials [39,40,41].
The localization of damage in this paper was focused on the middle third span of the beam, where the mode of failure is the crushing of concrete in the compression zone. A multiscale approach was used to determine the damage inside the beam regardless of tensile cracks at the initial stages and shear cracks at the latter stages. These AESL hits were analyzed and simplified regardless of whether they were under tensile (type-I) or shear (type-II) cracks. The objective is to use AESL to visualize damage growth under computational geometry. The AESL results under different loads were employed in MATLAB for solving the volume of the convex hull generated in three dimensions.
In 1970, computational geometry emerged from the field of algorithm design and analysis. Some successes in the research discipline include robotics, computer graphics, geographic information systems, and others, where geometric algorithms play an important aspect [42]. One category of computational geometry is the convex hull algorithm. The conventional convex hull algorithm uses points in space to form the smallest convex polygon in recognized shapes and sizes. There are numerous algorithms designed to achieve a convex hull [43]. In the field of medicine, convex hull imaging is capable of detecting defects [44]. In material science, the ability to visualize a concentration of points in space can lead researchers to determine growth of points inside. An example of research is the use of convex hulls as one of the techniques in determining minor impact, perforations, and debonding damages in sandwich composites [45].
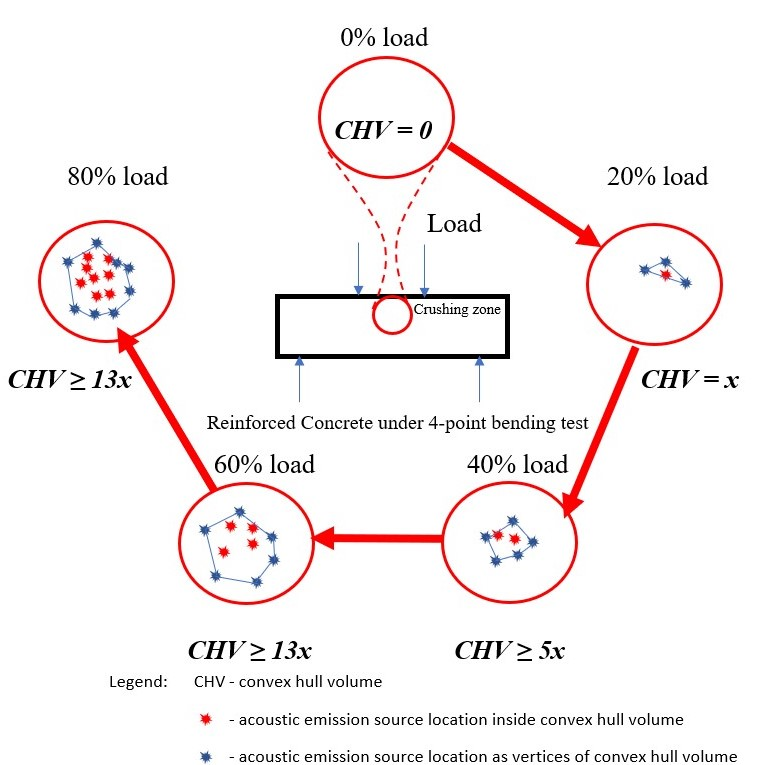
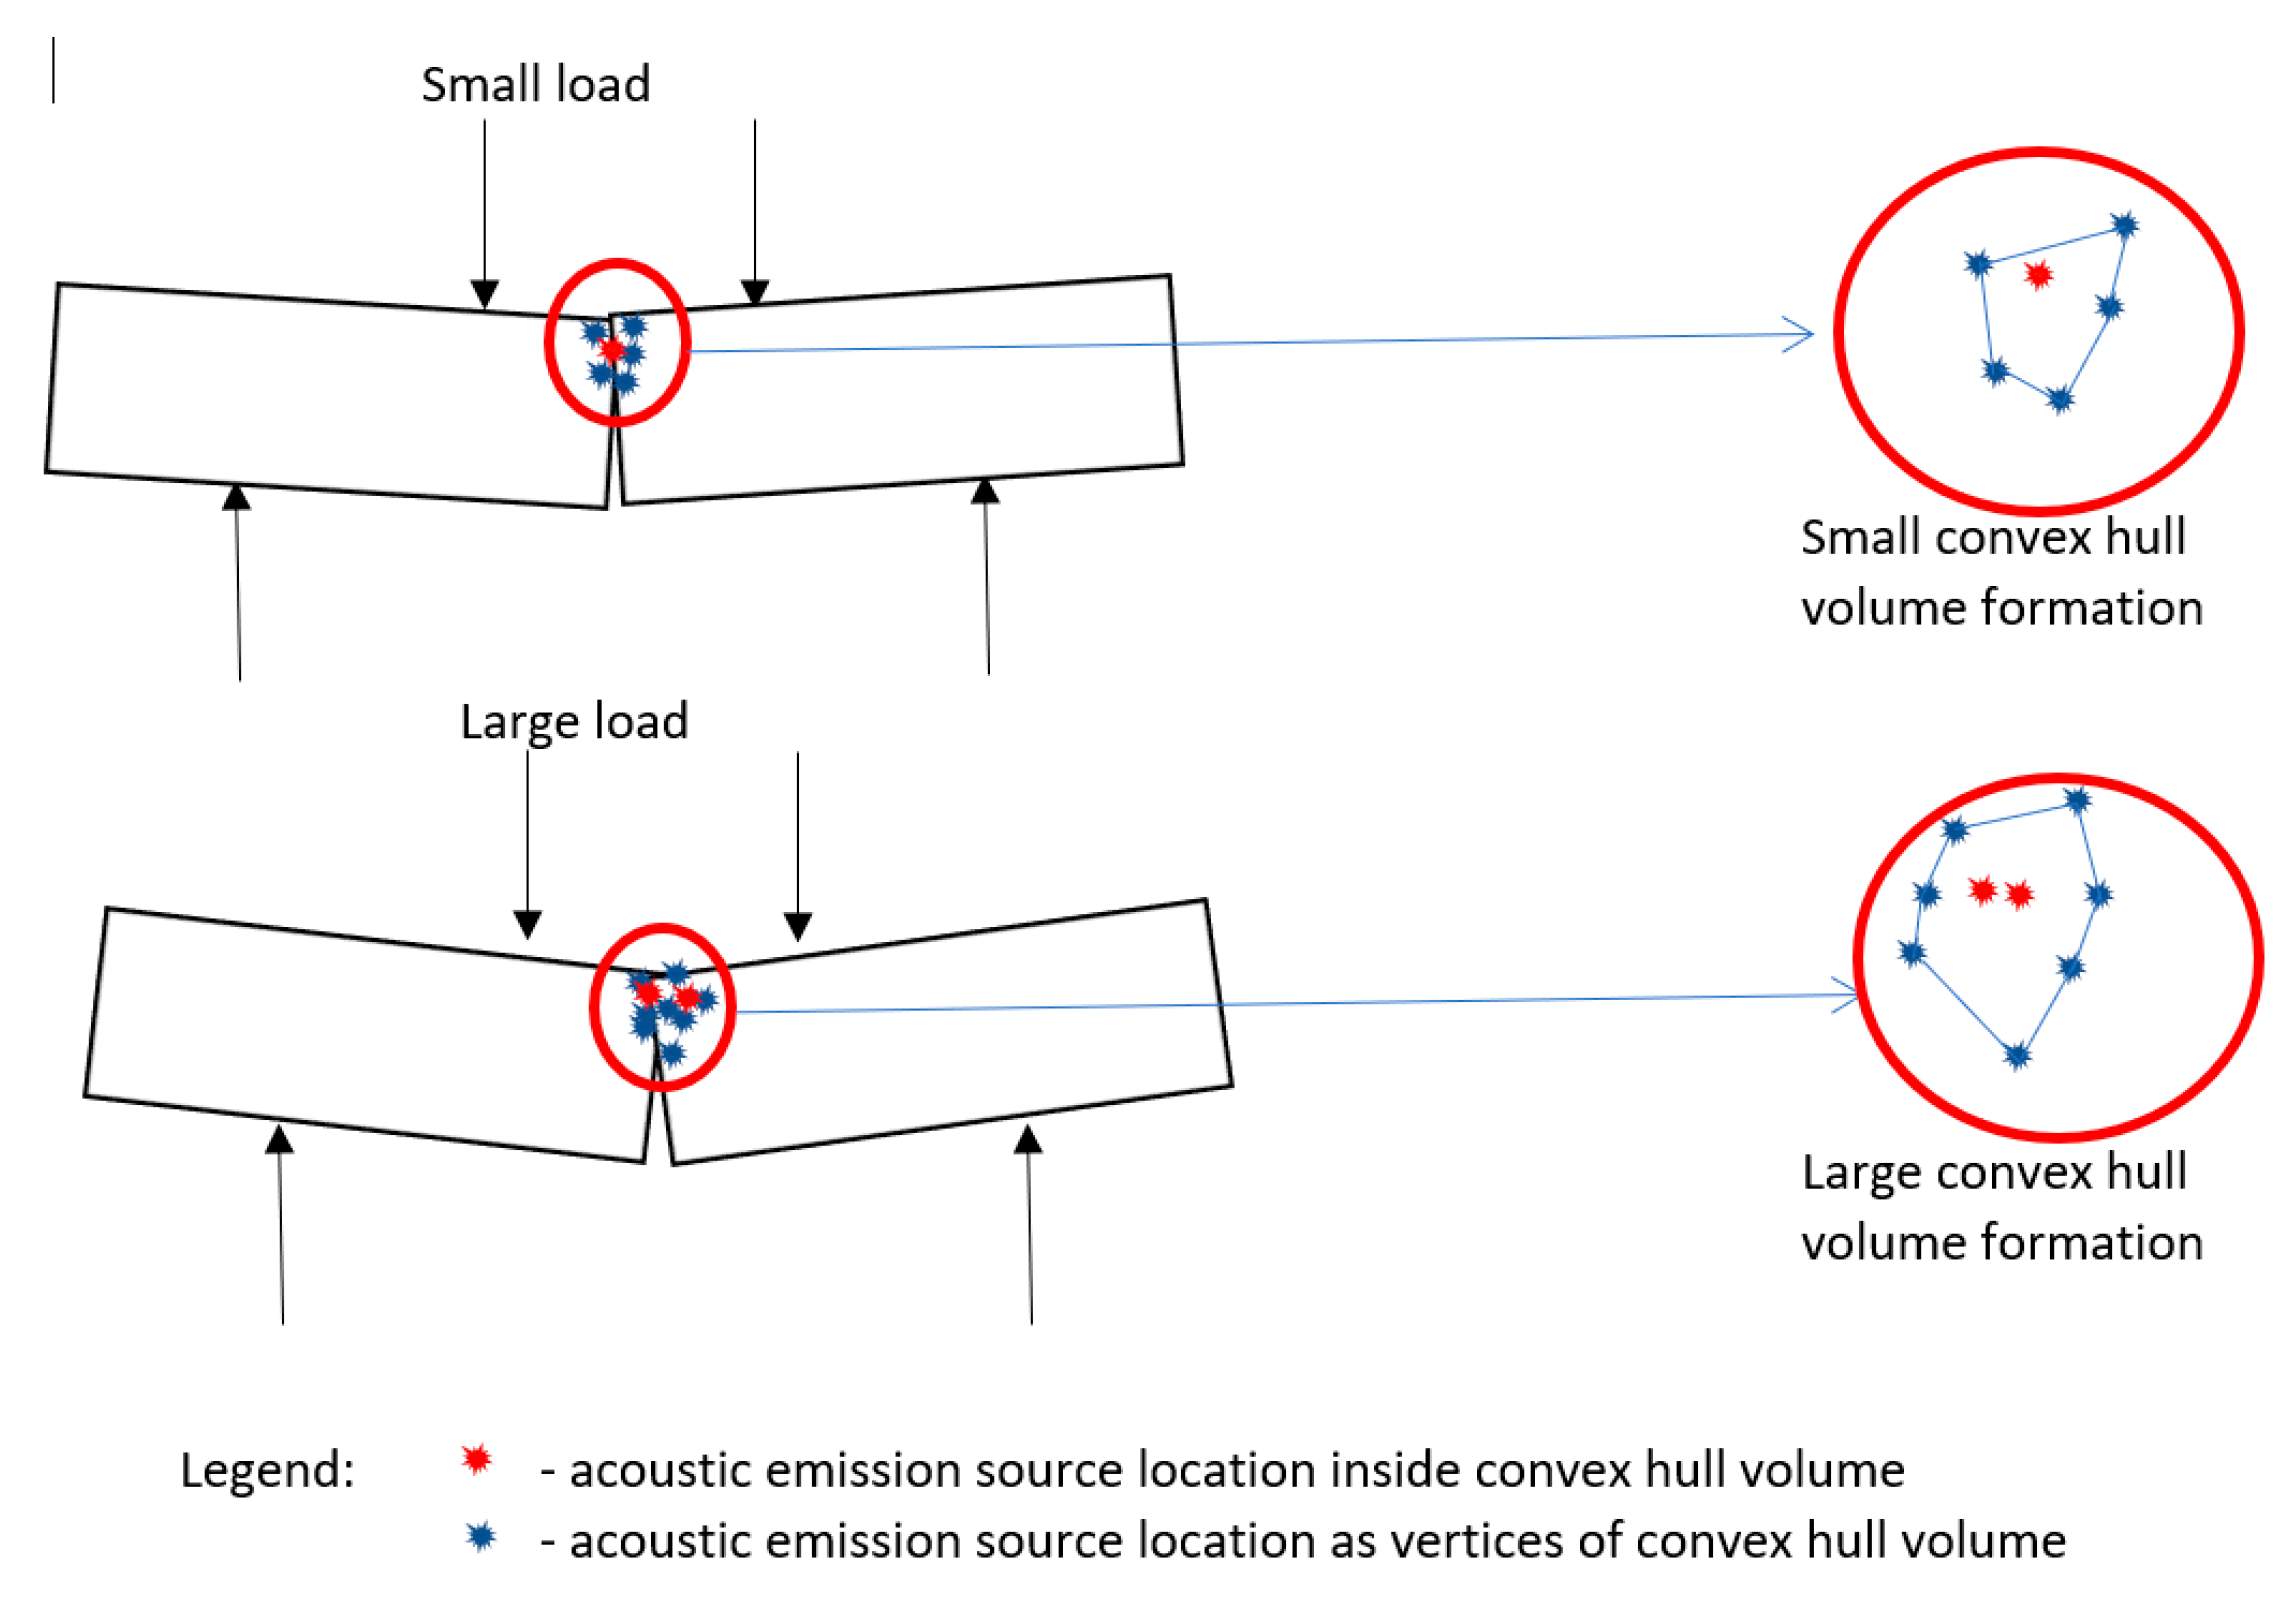
Shown in Figure 2 is the illustration of beams under small and large loads. A small load leads to low AESL hits, while a large load leads to high AESLs hits. The convex hull algorithm connects the vertices of points in space to form the CHV. In general, the AESL hits spread out wider when the load is increased, and that can lead to an increase in CHV. However, some AESL hits, such as those marked in red, form at the latter stages of loading and are inside CHV. This red AESL hits may be classified as shear cracks (type-II) or mixed mode inside the damaged zone. Further investigation is recommended to explore the AESL inside CHV and AESL as vertices of the volume formed.
3. Experimental Methodology
A total of 18 RC beam specimens were casted. The size of the specimens was 100 mm × 100 mm × 400 mm length, with varied water-cement ratios of 0.40 and 0.60. The sand-total aggregate ratio was 45%. Shown in Table 1 is the design mix of the concrete used in the experiment. The reinforcing bar used for the longitudinal bars and stirrups are plain rounded bars, 9 mm in diameter. The yield strength of the round bar is 400 MPa. The RC beams were divided into three types, as shown in Figure 3. Beam A has two longitudinal bars placed at the top and bottom with stirrups, Beam B has two longitudinal bars placed at the bottom with stirrups, and Beam C has only one longitudinal bar at the bottom without stirrups. Beams were designed where shear near the support would be insignificant, with an ultimate load of 22 kN, 22 kN, and 12 kN for designs A, B, and C, respectively. A pilot test was conducted to ensure that the estimated ultimate load was experienced by the RC beams prior to the 18 RC beam tests.
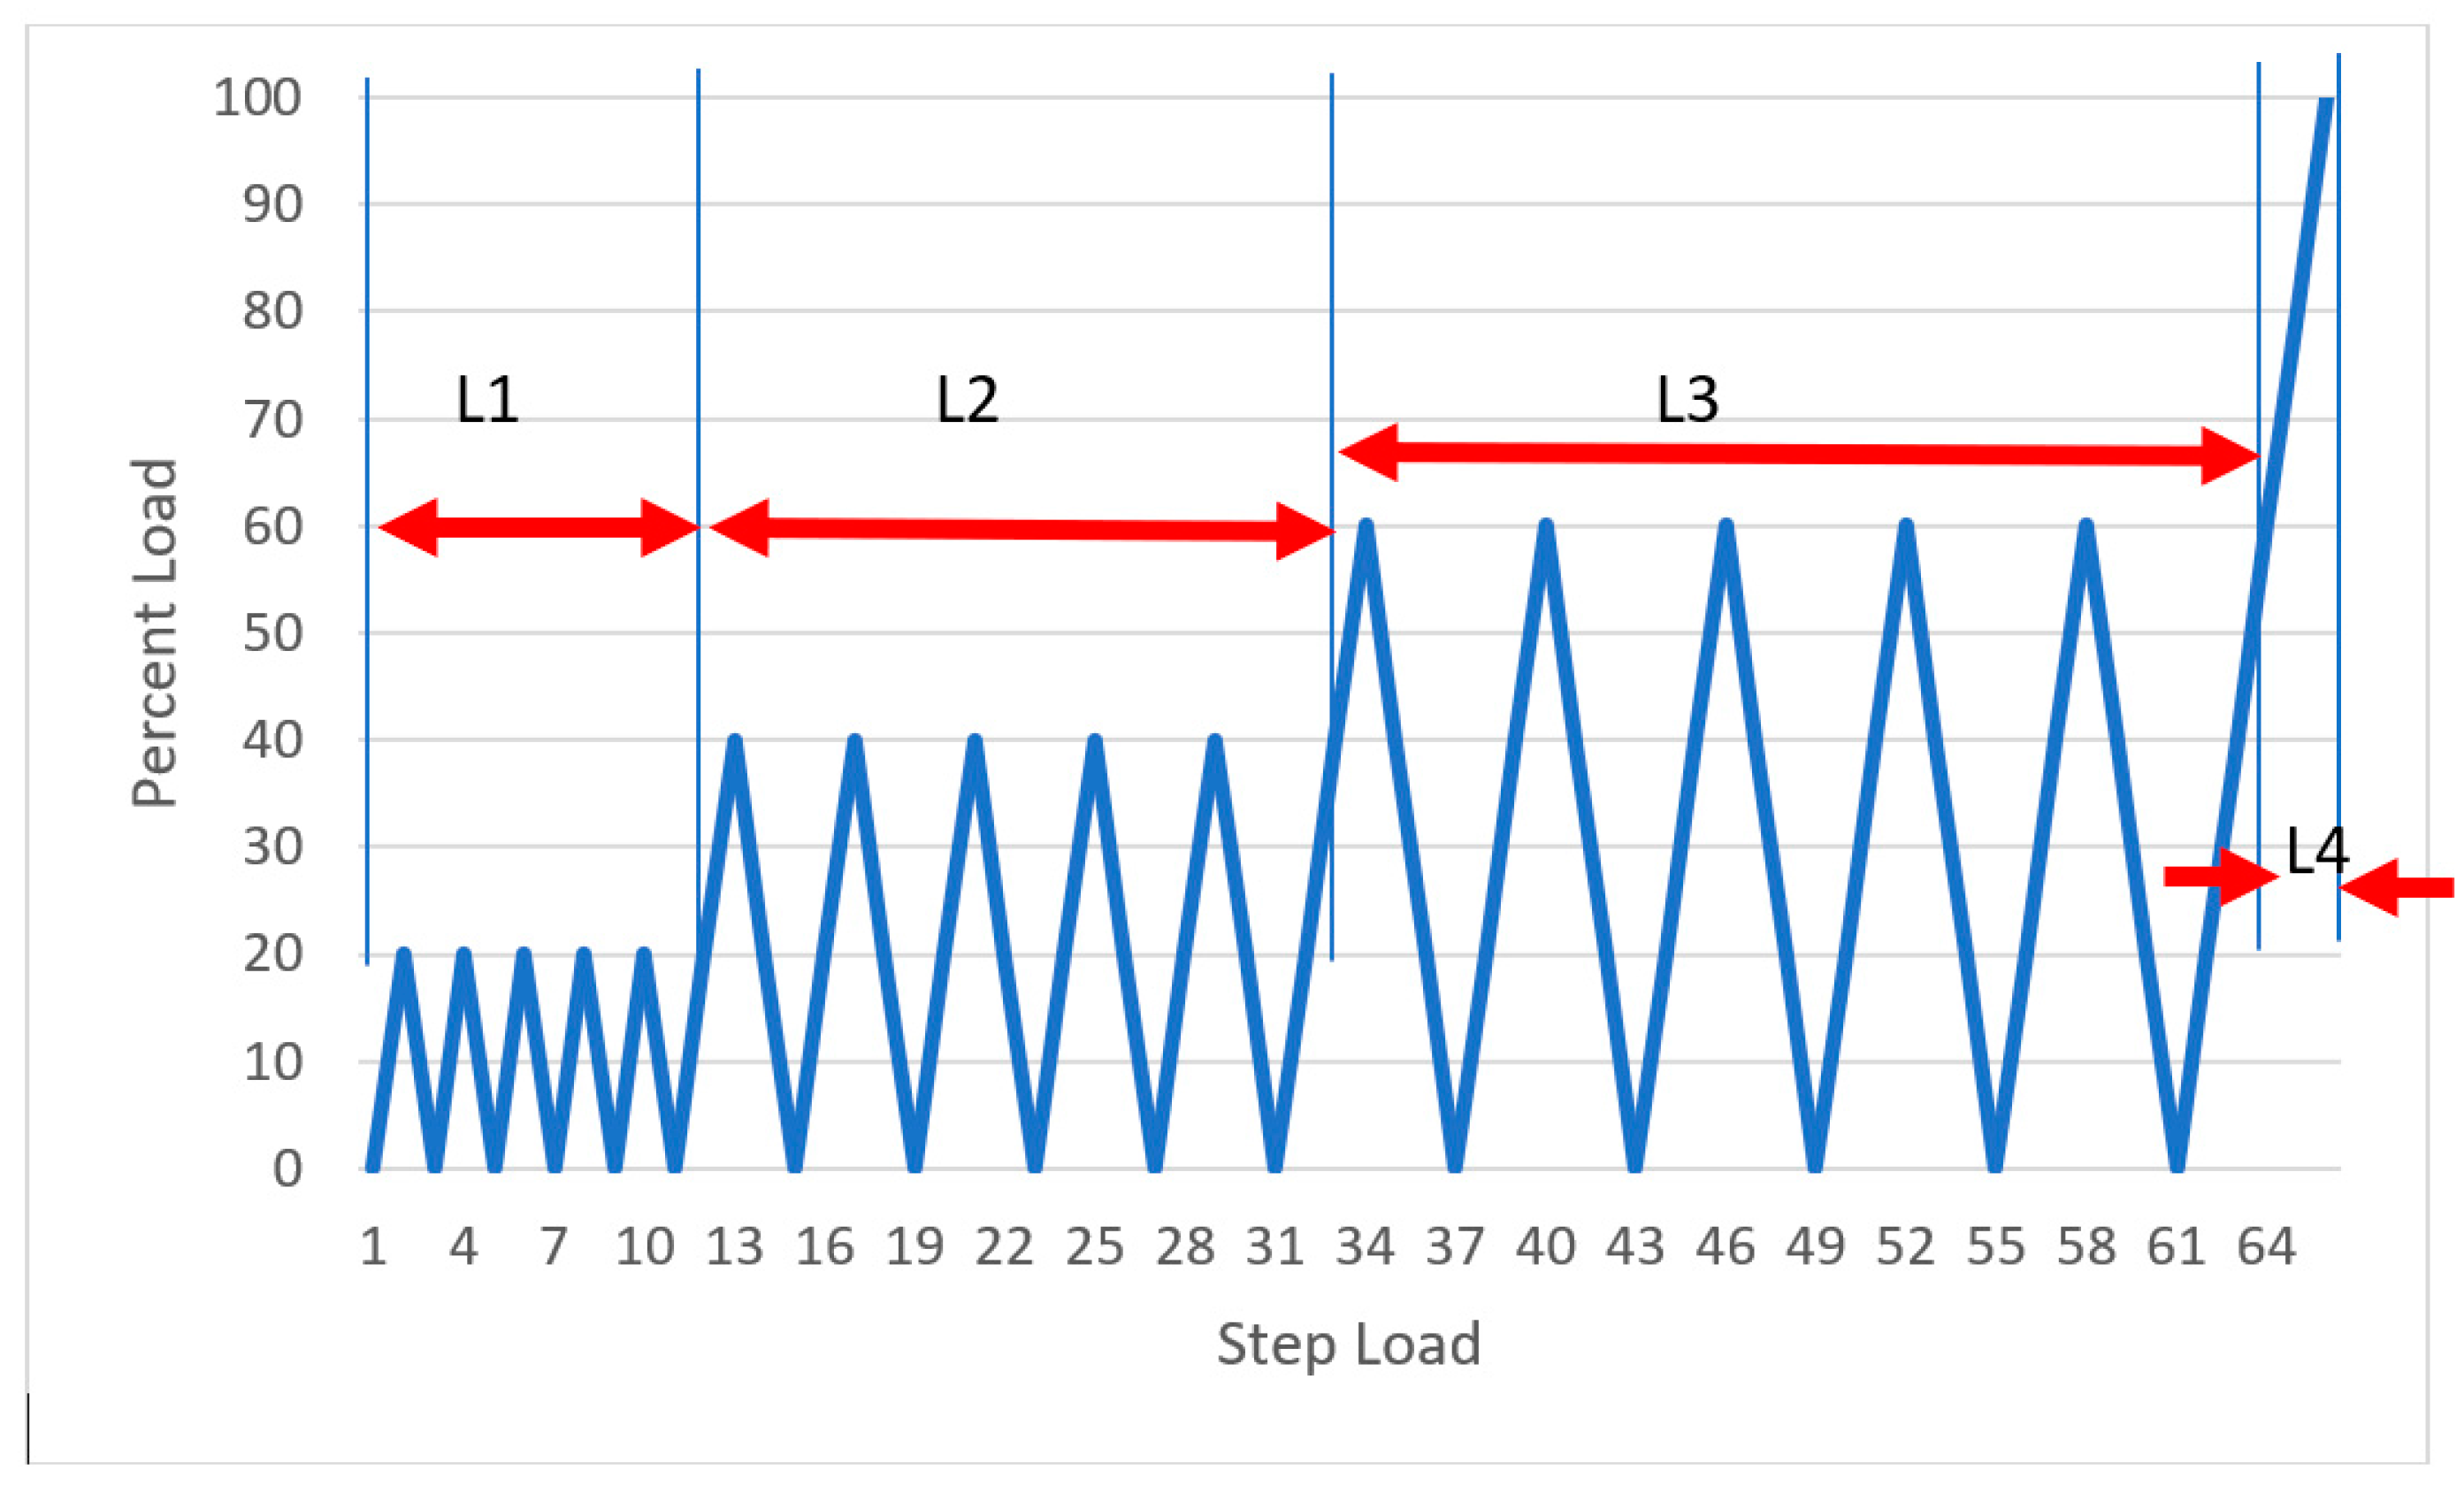
After curing all of the specimens on the 28th day, a universal testing machine was used to subject each specimen to a four-point bending test. Six AE sensors were placed on the beam before the testing occurred. The load diagram for the test is shown in Figure 4, where the percent load is stated with respect to the ultimate load. Each loading and unloading pattern was classified into three repeated loading paths as L1—0 to 20% load, L2—0 to 40% load, L3—0 to 60% load, and L4—60 to 100% load.
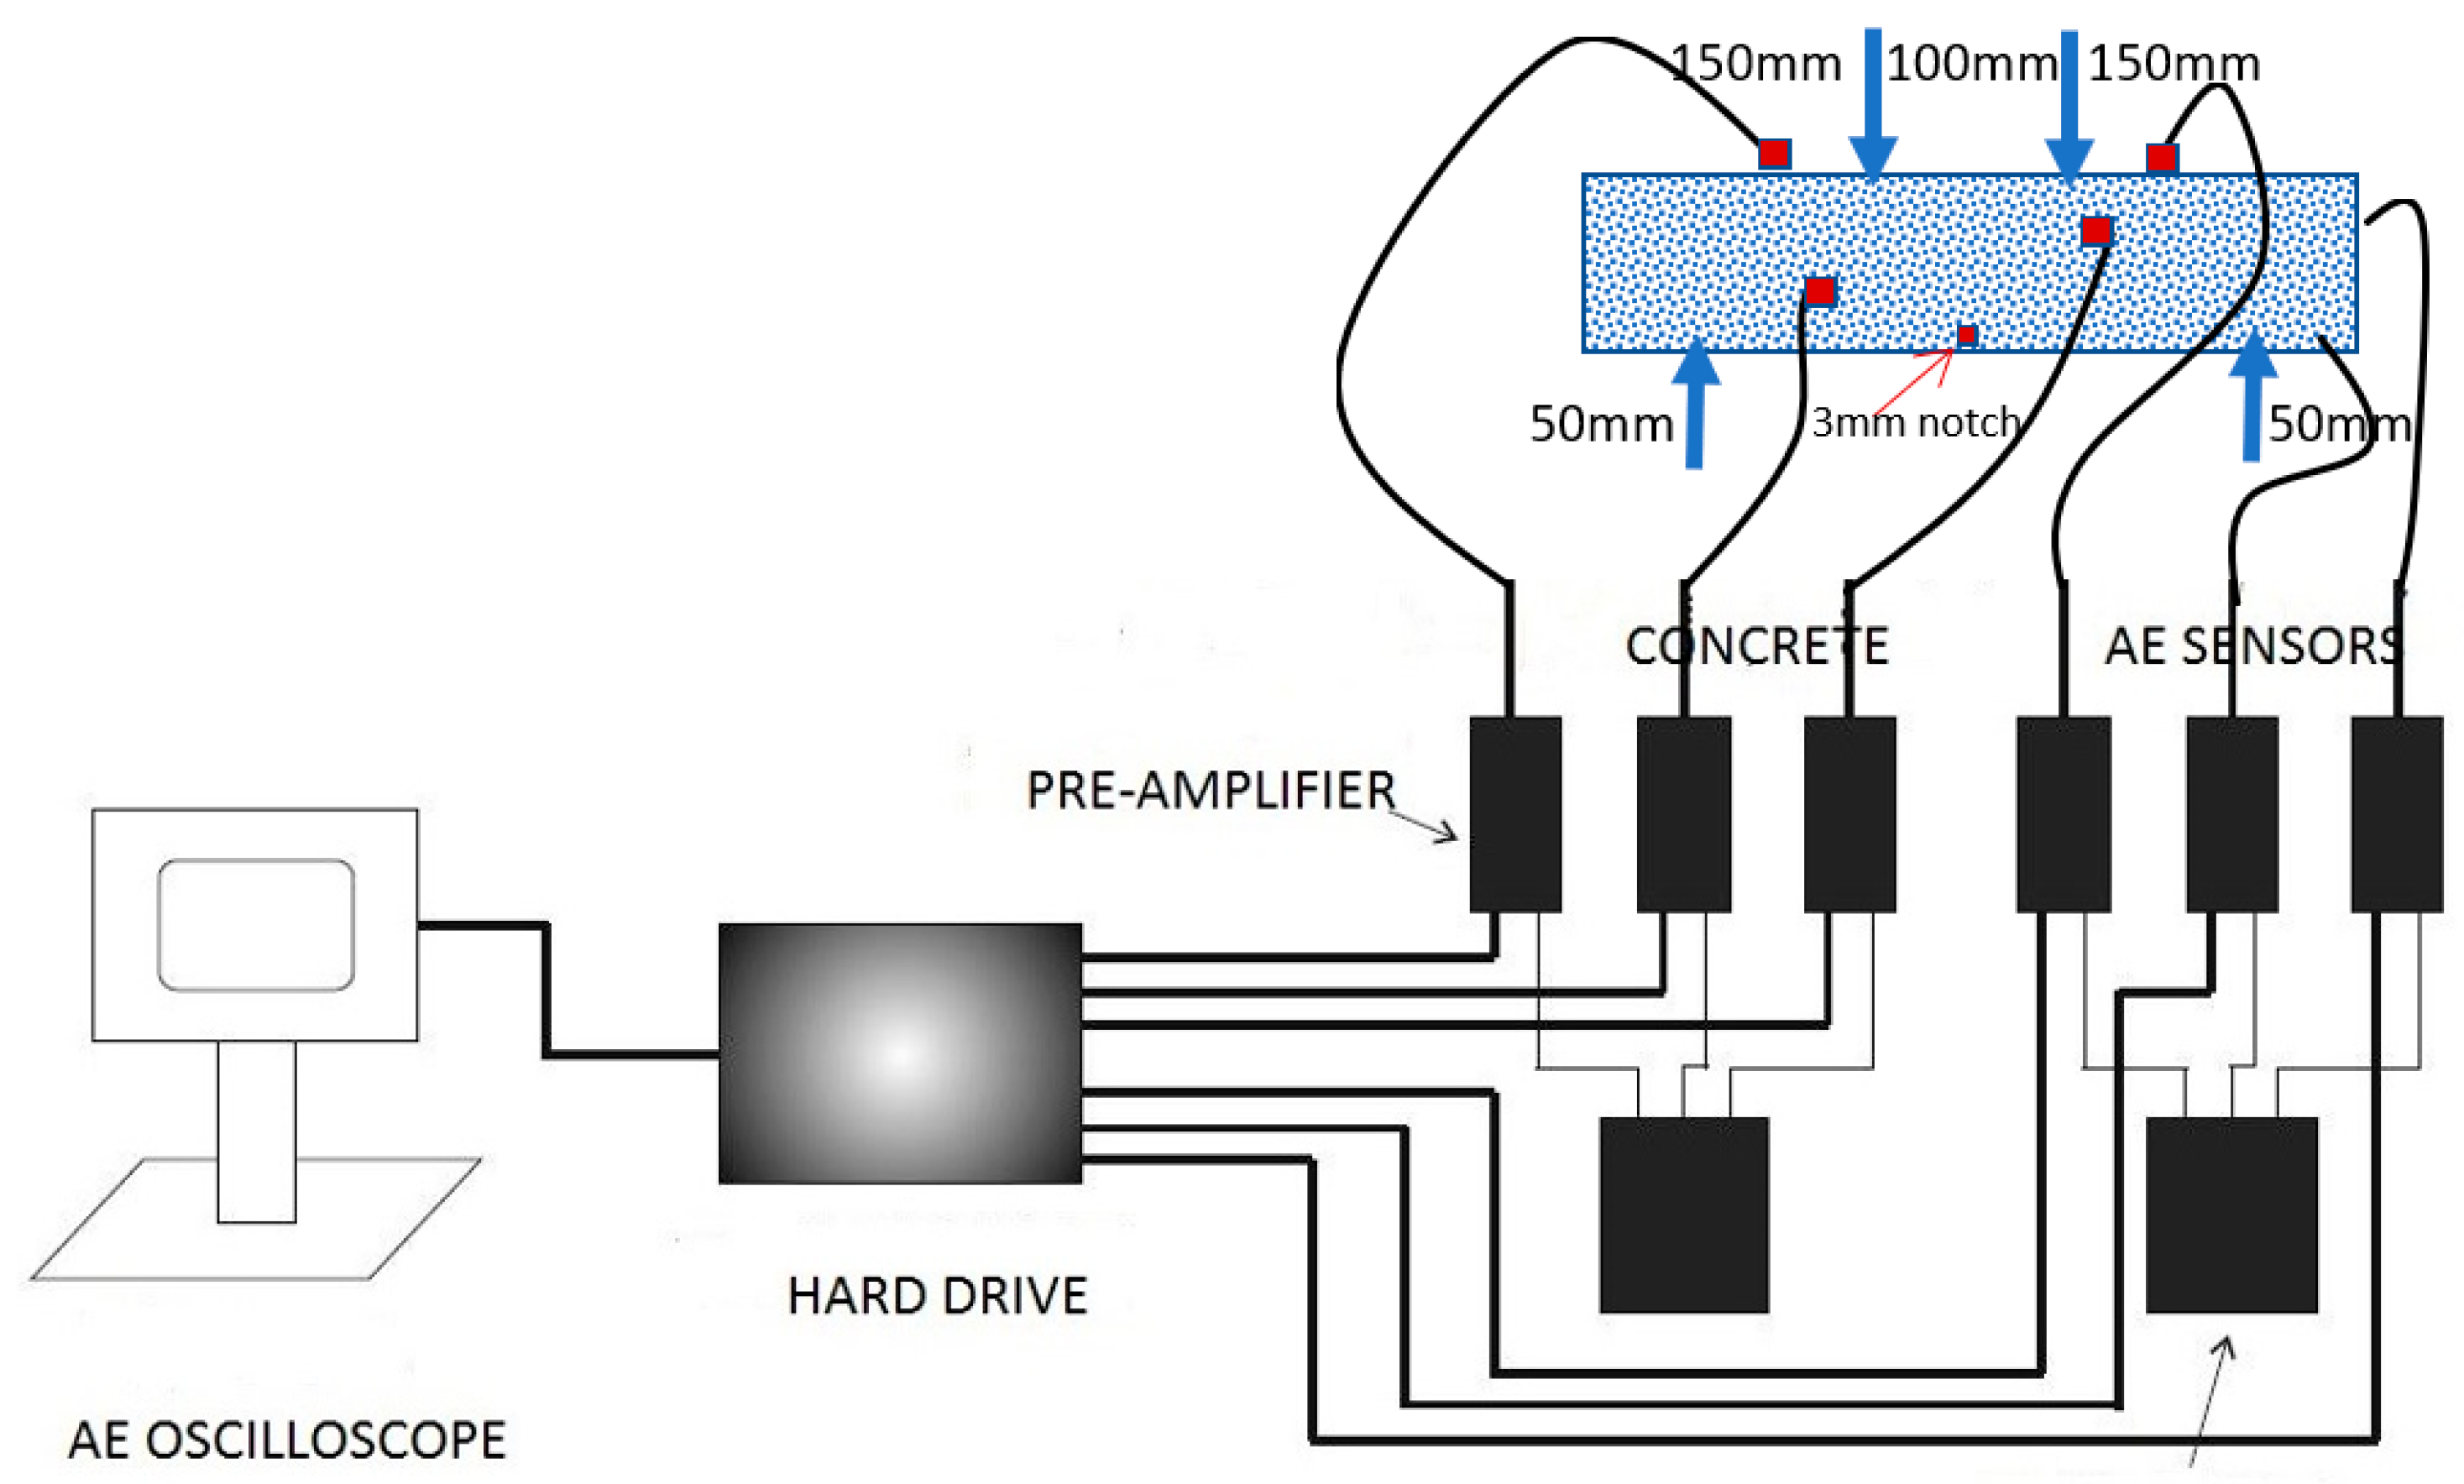
The AE sensors were connected to a preamplifier/main amplifier with a factor of 40 dB. Six AE sensors were placed at coordinates (10 cm, 5 cm, 10 cm), (30 cm, 5 cm, 10 cm), (12.5 cm, 0 cm, 2.5 cm), (27.5 cm, 0 cm, 7.5 cm), (27.5 cm, 10 cm, 2.5 cm), and (12.5 cm 10 cm, 7.5 cm). From the data obtained, the viewing of waveforms for six channels was seen in the computer. These datasets were then saved as binary data. Waveform binary data was processed through the GFORTRAN program to determine the AESL. Noises were eliminated with a threshold of 0.1 Volts to distinguish environmental noise with the right acoustic emission signal generated from cracks inside the concrete. The experimental setup is shown in Figure 5, where a 3-mm notch was made to prevent multiple cracks from forming in the constant moment region, and to ensure that the localization of stresses in the middle section of the beam occurred with the failure mode of bending, not shear. The actual test photo is shown in Figure 6.
4. Results and Discussion
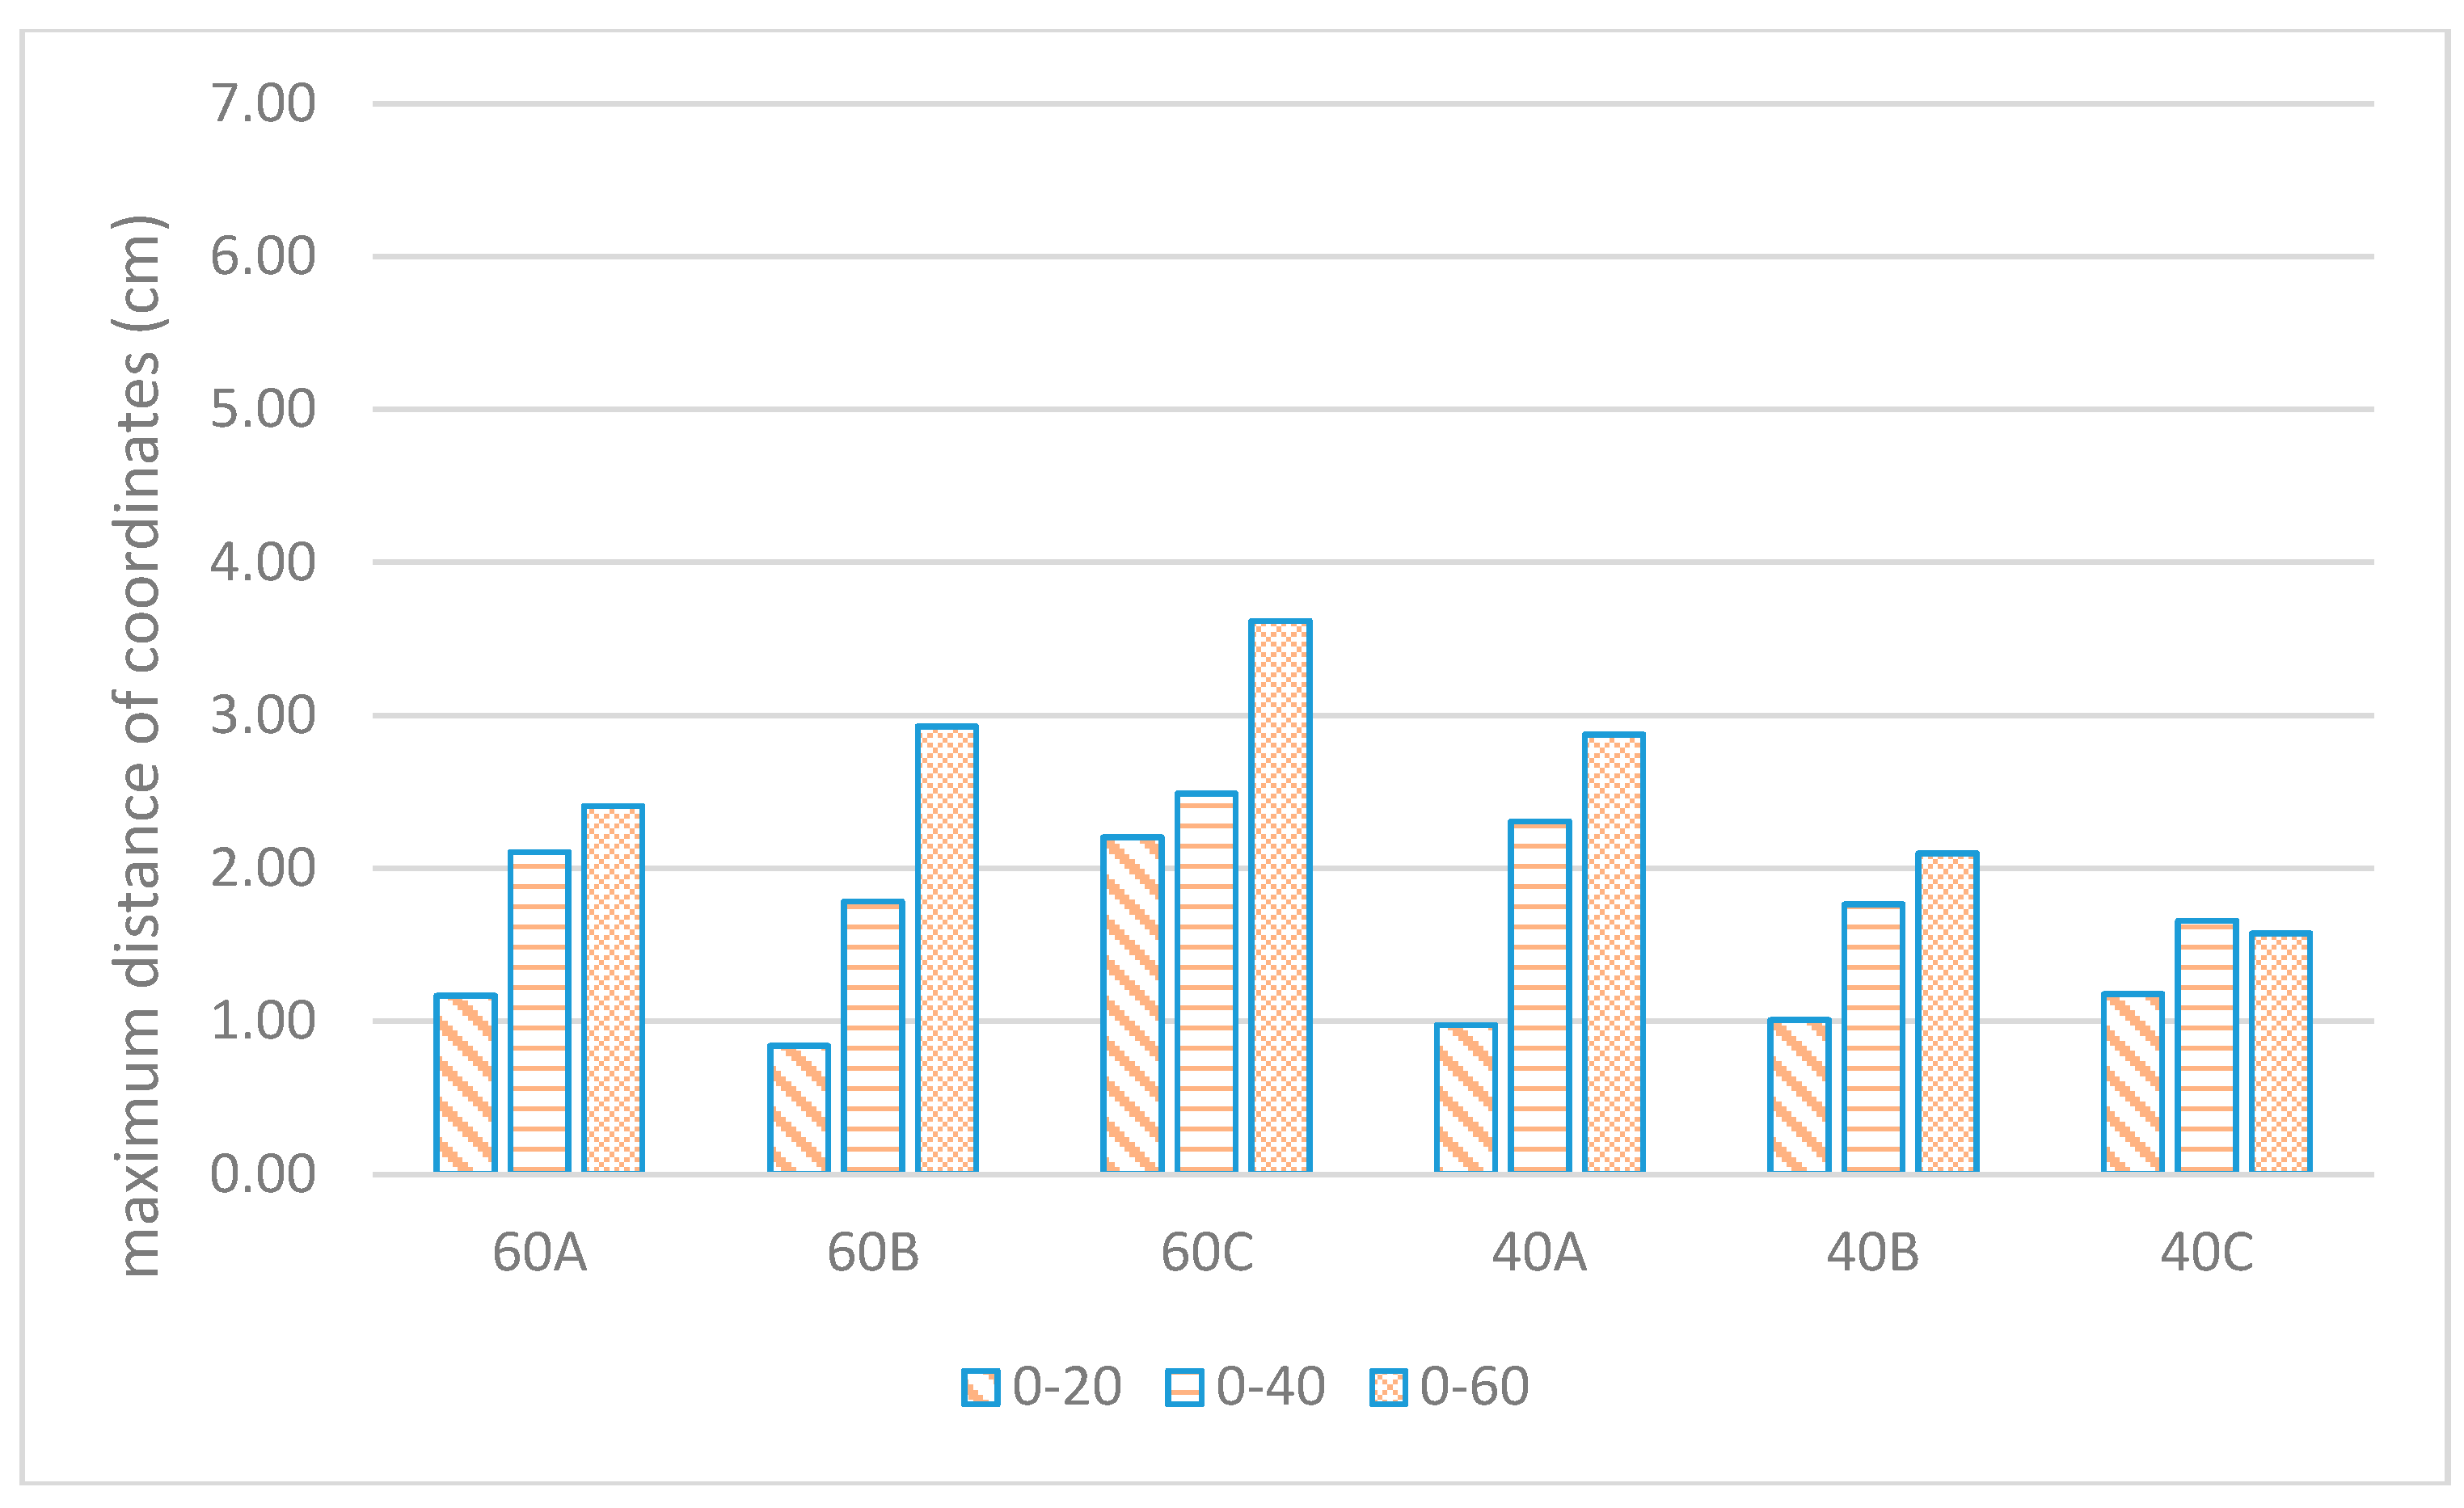
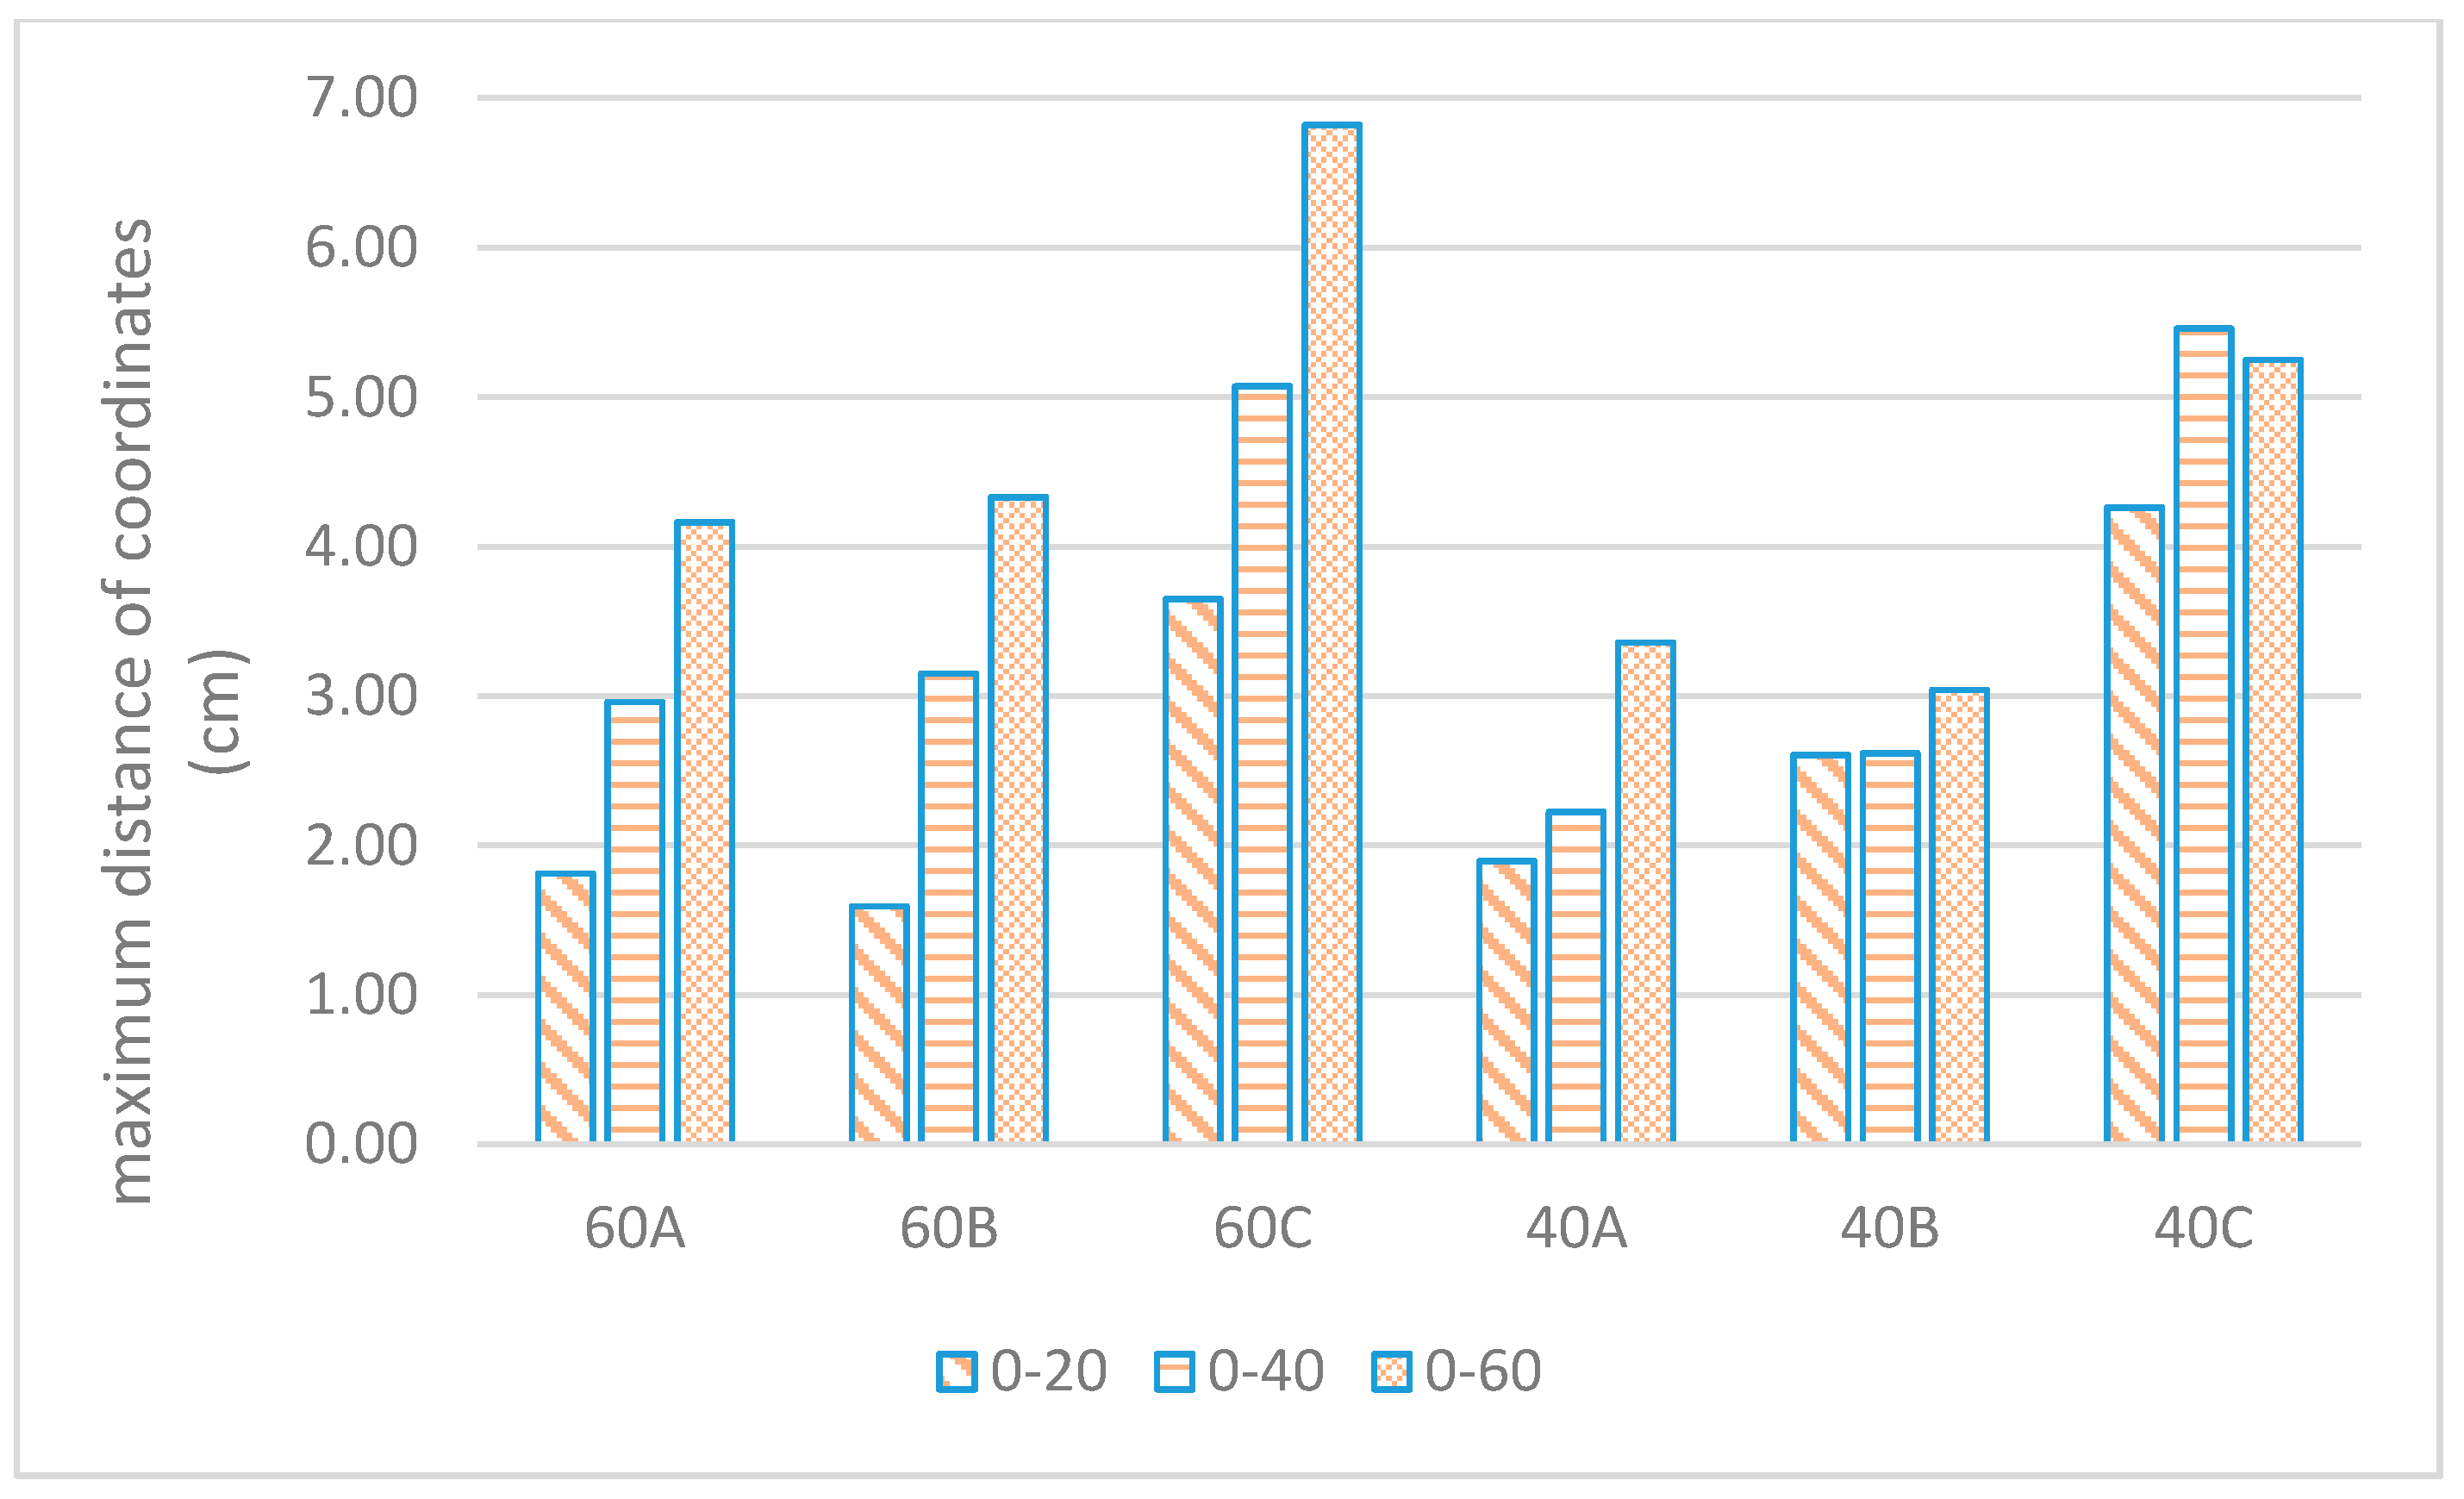
Data on AESL are analyzed in two dimensions and investigated with respect to the sequential hits experienced. Shown in Figure 7 is the AESL hits and maximum distances across each axis considered. In addition, Figure 8, Figure 9 and Figure 10 show the maximum distances of AESL in two dimensions. The progression of maximum distances for all types of RC beams along the x-axis showed good correlation to damage. However, the behavior of the changes in maximum distances of AESL behaved linearly. The progression of maximum distances along the y-axis, which represent the width of AESL hits, is 4 cm or more for a load greater than 60%. This showed that the spread of AESL hits after 60% ultimate load is more than 40% of the width of the concrete. For the progression along the z-axis, which is the movement along the height, the WC40 experienced 3 cm or more, while WC60 encountered 4 cm or more for a load more than 60% of the ultimate load. This showed the ductility of WC60 compared to WC40, where AESL hits were spread out farther.
The discussion above focused on the two-dimensional analysis of AESL. Using all data along each axis, a three-dimensional graph was investigated. In Figure 11, AESL hits were plotted and compared to each beam reinforcement with water-cement ratios of 0.40 and 0.60. Quantitative analysis for the figure presented was difficult to carry out, but generally the location of the AESL hits becomes wider as the water-cement ratio increases. This showed that, with respect to each type of reinforcement design, the concrete with the higher water-cement ratio is more ductile than that with the lower water-cement ratio. In addition, most of the AESL were positioned above the mid-height of the beam. This was maybe due to the crack formation where the AESL is represented by the crack tip. The geometric positions of the AESL upon loading was difficult to analyze due to the three-dimensional axes, where the width of the crack formation should be considered in the crack progression. In this paper, CHV was considered to represent the analysis in three dimensions. The assumption in AESL is that it served as vertices in CHV formation where it occupies the space by the mortar or the ITZ. These points are the weakest link inside the concrete mixture. The surfaces or edges of the CHV generated do not represent the surface of the mortar or ITZ. The inclusion of aggregates is assumed to be negligible in solving the CHV [4].
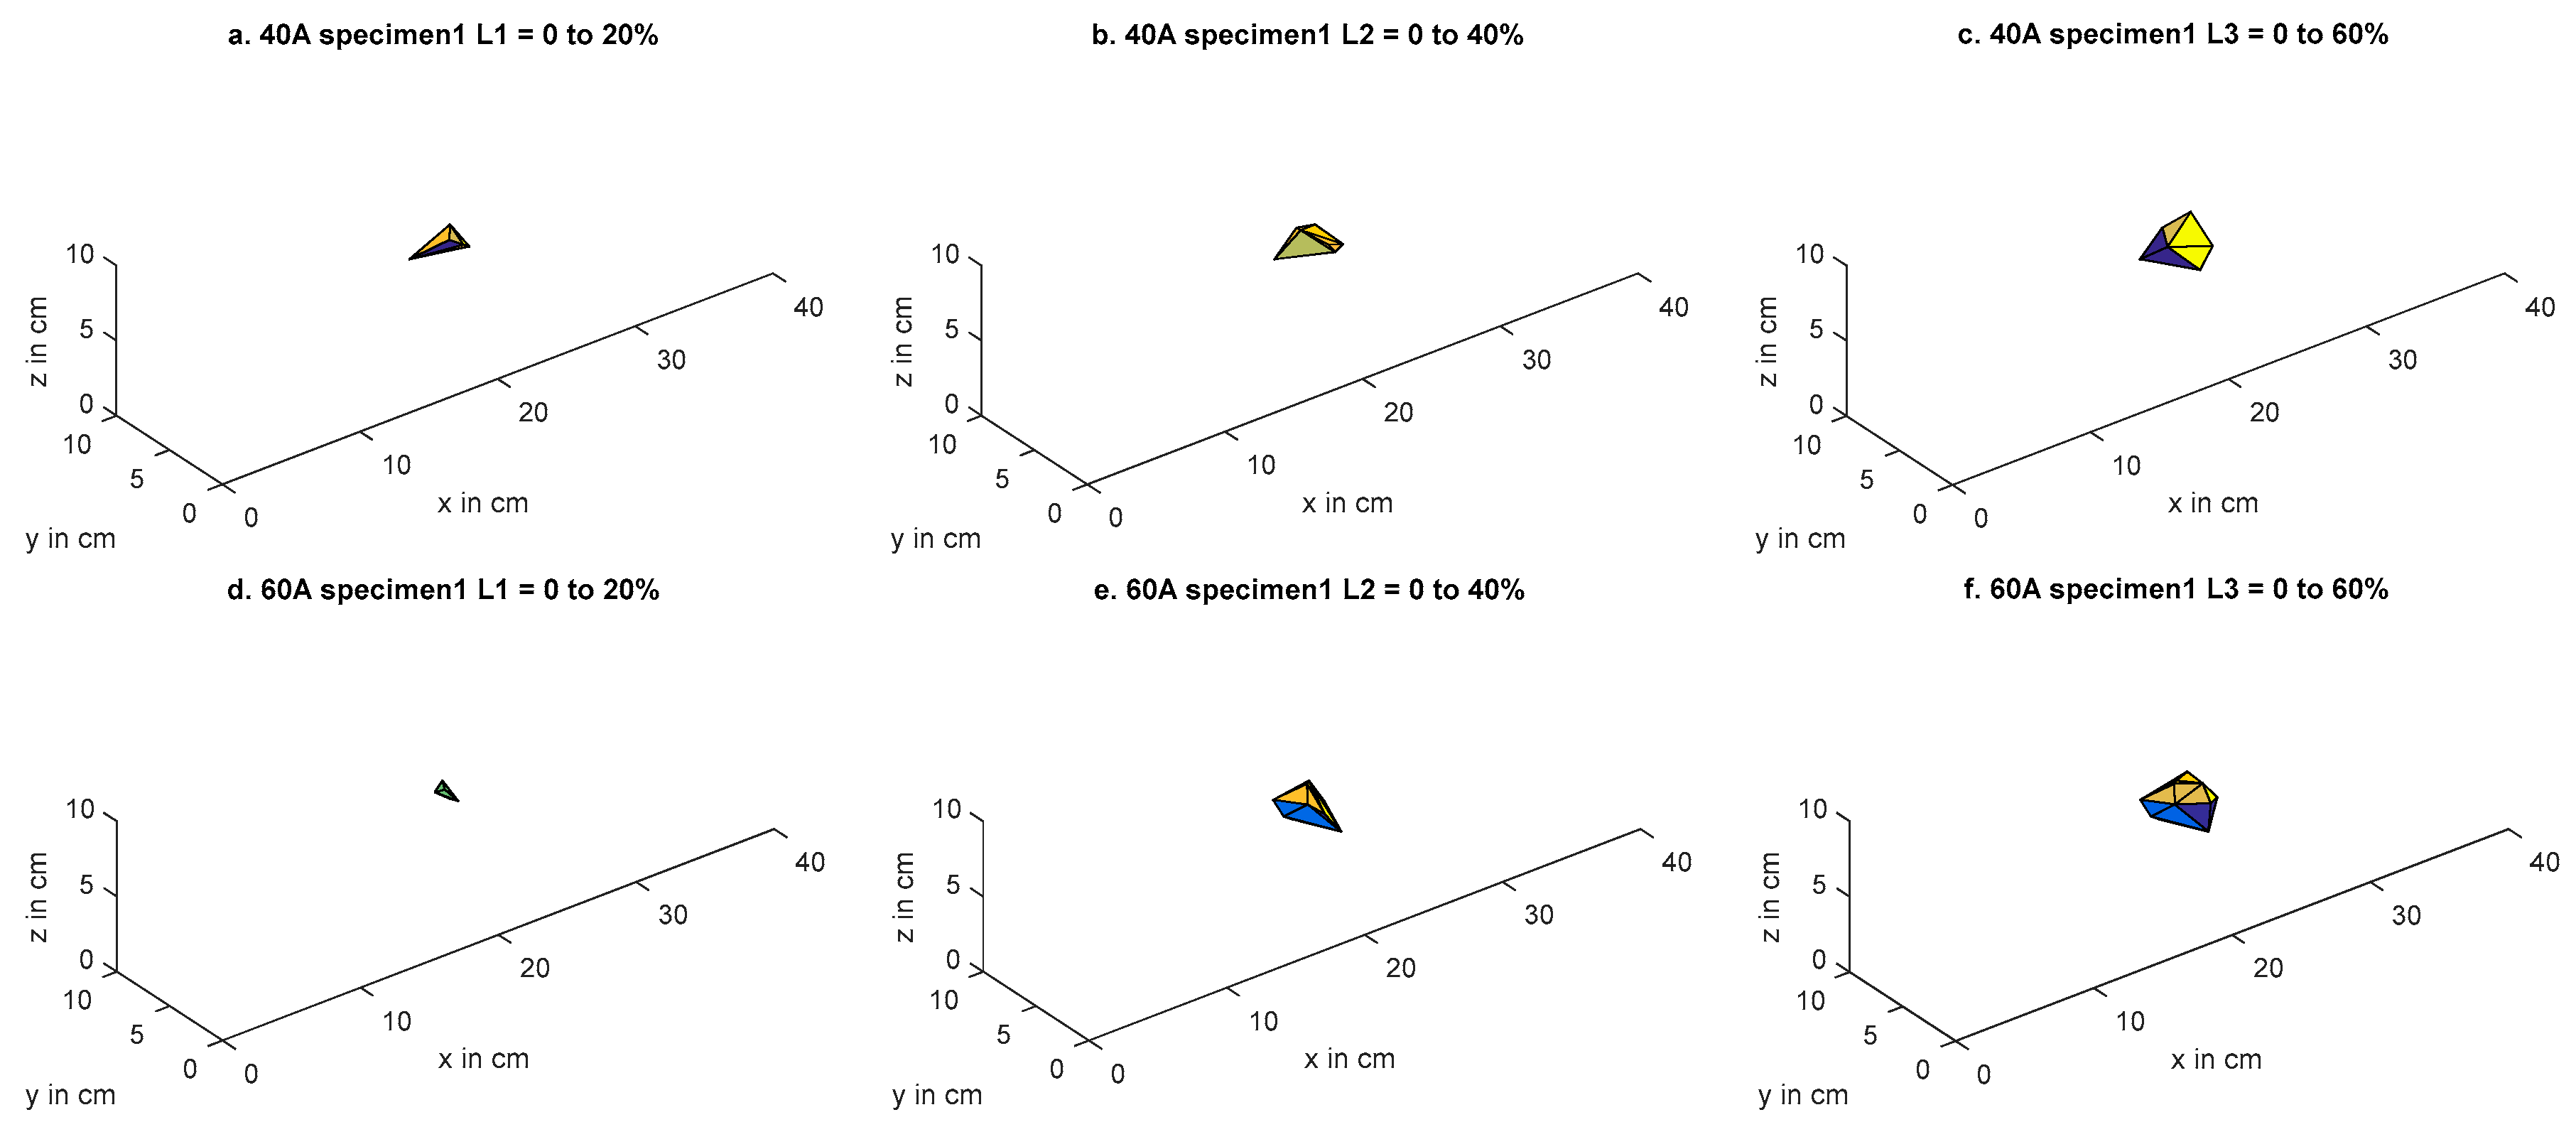
Shown in Figure 12 are the WC40 and WC60 specimens with beam design A in isometric view, where the CHV progression increases according to L1, L2, and L3. The quantity of the CHV showed that WC60 has a greater volume than WC40 of the same beam reinforcements. This showed the ductility of WC60 compared to WC40, where AESL hits spread out more widely when crushing is experienced in the compression zone.
In Figure 13, the WC40 and WC60 specimens with beam design B are shown from the top view of the concrete specimens. The CHV also increases with the loading/unloading branch L1, L2, and L3. Similar to beam design A in Figure 11, the WC60 specimen spreads its volume wider than the WC40. This indicates the ductility of WC60 when subjected to a four-point bending test.
The CHV progression for beam design B is shown in Figure 14 along its side elevation. The CHV increases with the load progression L1, L2, and L3. In this view, the spread of the AESL along the vertical axis decreases when load is increased.
The CHV progression for beam design C is shown in Figure 15 along its front elevation. Beam design C has the least reinforcement, compared to designs A and B. The CHV increases with the load progression L1, L2, and L3. In this view, the AESLs are relatively lower for design C than designs A and B at the initial stages of the load. This shows that the cracks are forming below the mid-height at the initial stages due to the absence of stirrups, where no confinement is experienced. Similarly, all designs with WC60 spread their volume wider than those with WC40 for each specific reinforcement content. This also indicates the ductility of WC60 when subjected to a four-point bending test.
Figure 12, Figure 13, Figure 14 and Figure 15 illustrate in different views showing the volume formation from different perspectives. Finally, the average value of CHV progression for all beams (A, B, and C) were computed and are shown in Figure 16. In general, the CHV was larger for WC60 than WC40 for specific reinforcement content. This showed the ductility of WC60 to be greater than that of all WC40 beams.
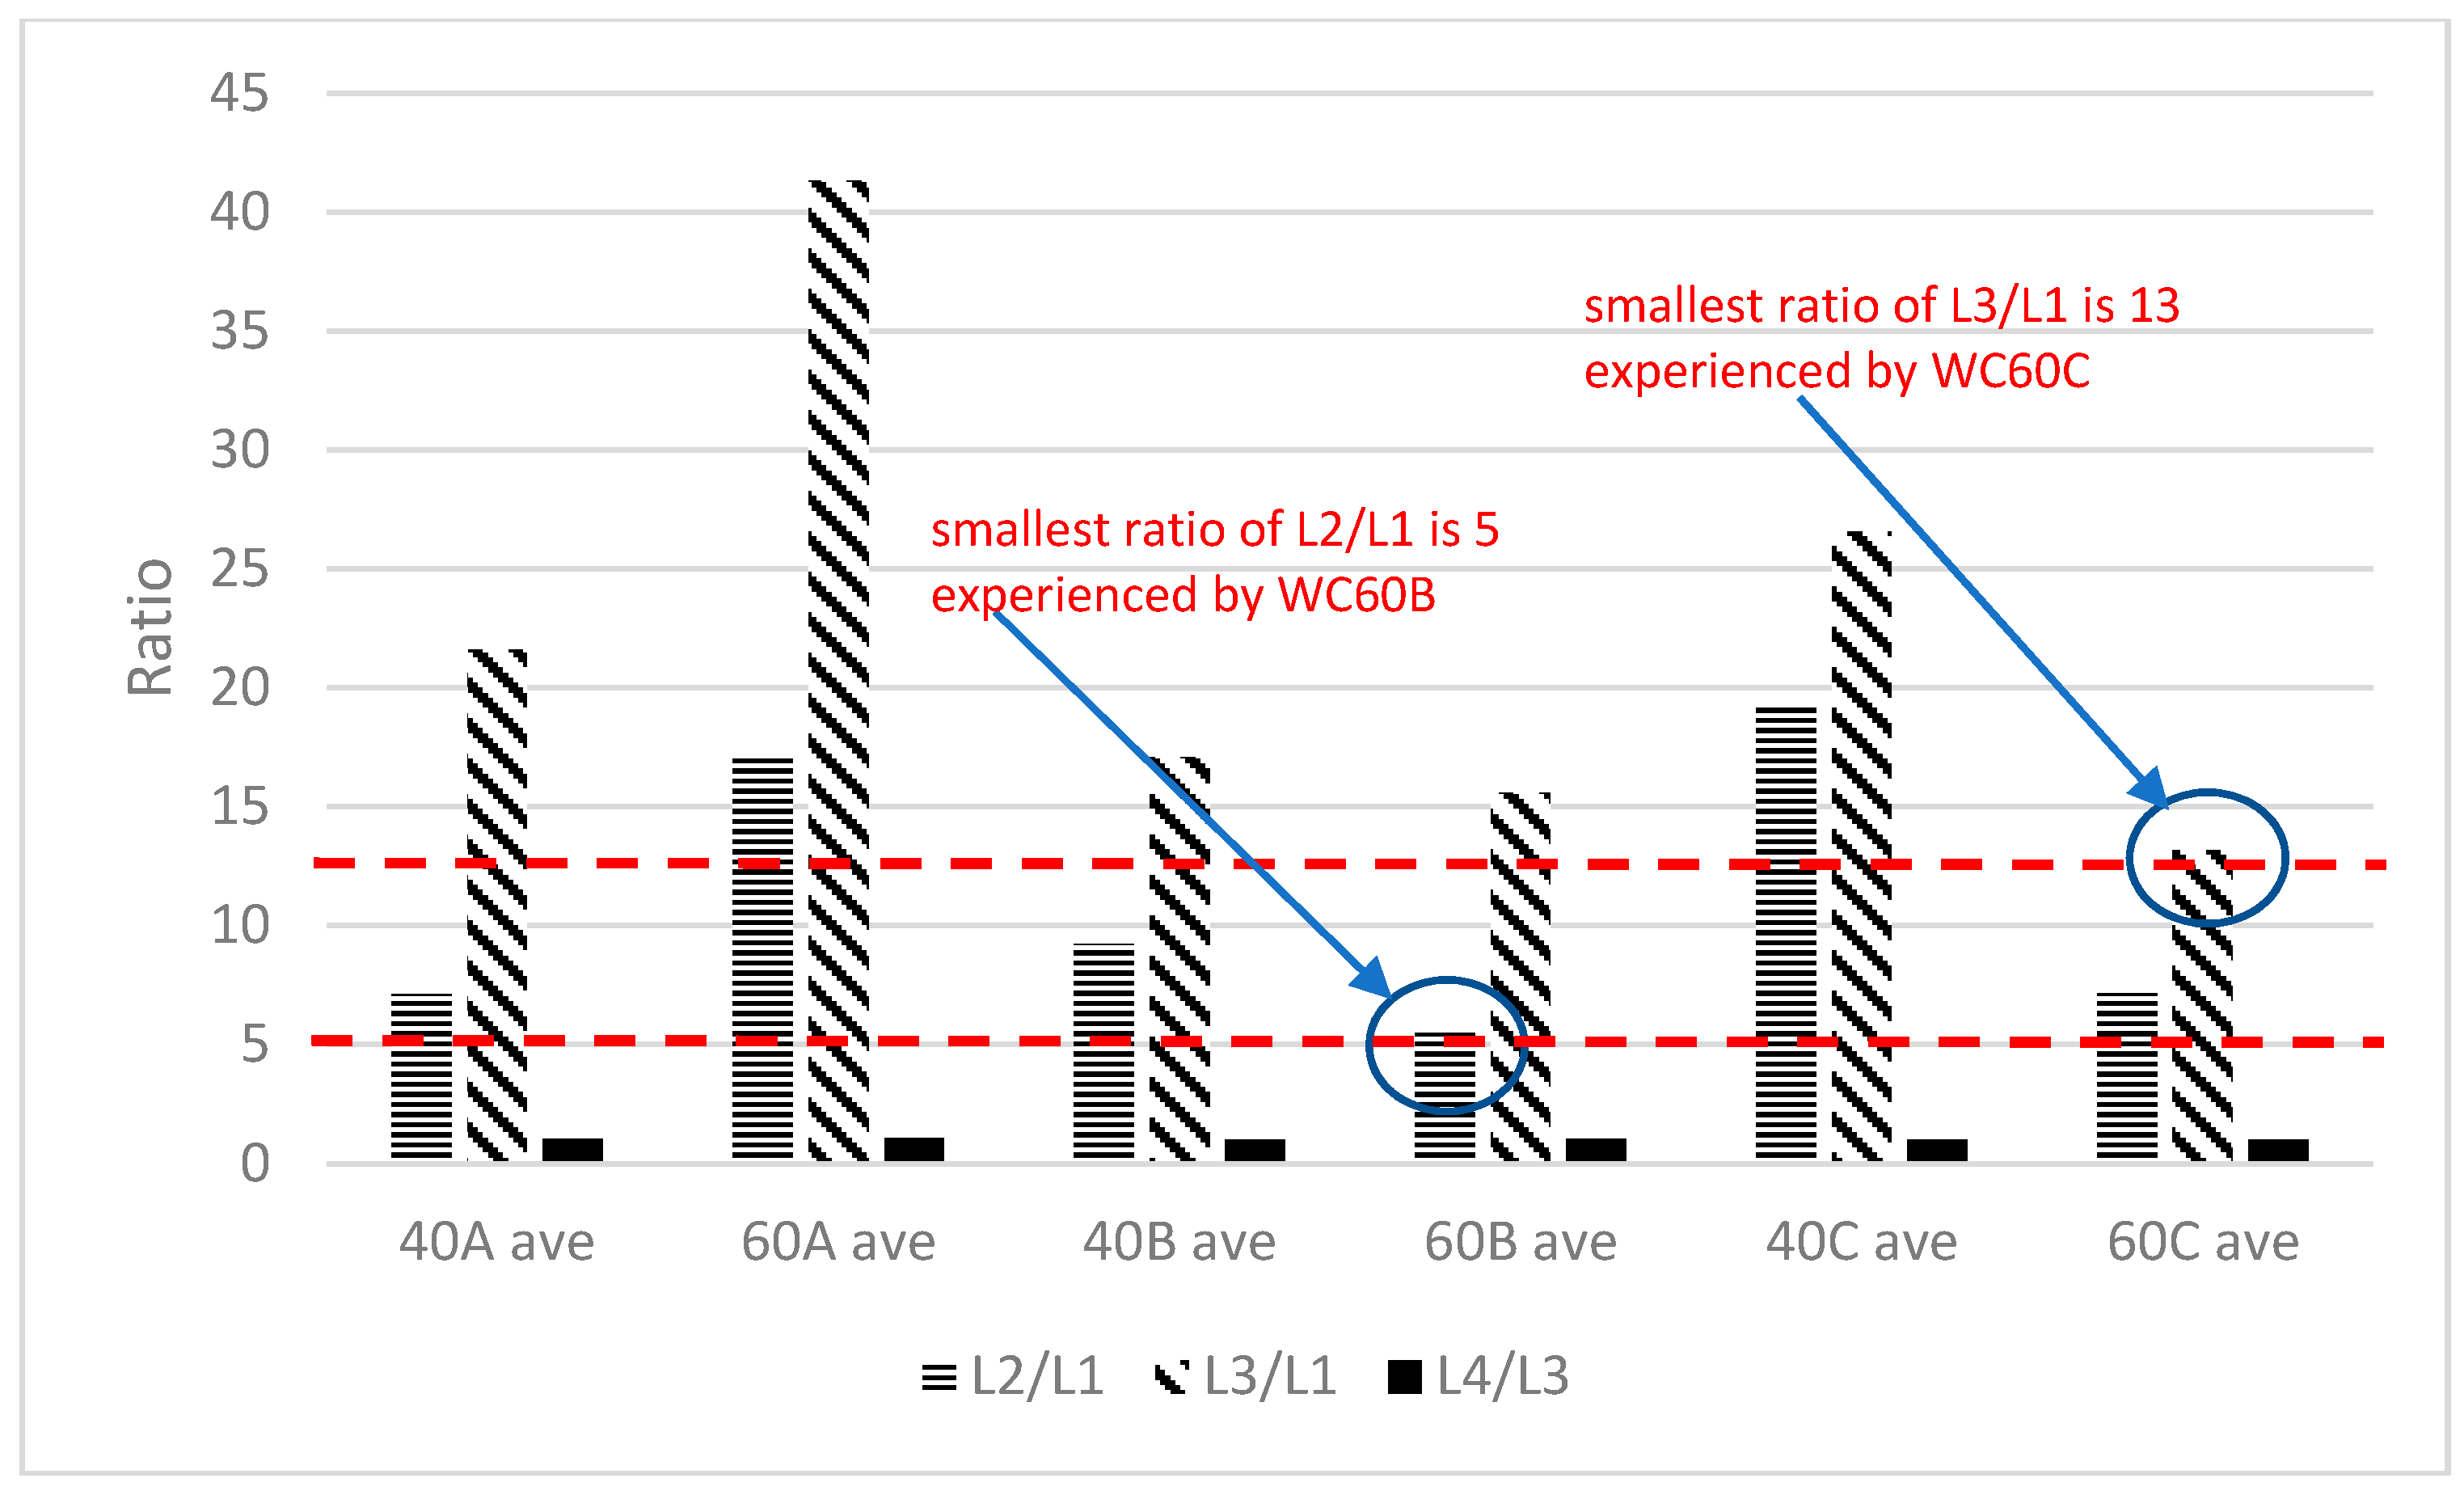
An additional analysis was made using a baseline for damage measurement. In NDT, the challenge of researchers is to arrive at a baseline value and measure parameters according to a baseline value. The baseline value used is the reference load L1. To measure the CHV progression according to baseline L1, the ratio of loads is computed. Shown in Figure 17 are the ratios of CHV. It was observed that the safest or smallest ratio of L2 to L1 was more than five times from CHV of 20% load for all beams, while the ratio of L3 to L1 was more than 13 times from CHV of 20% load for all beams. It was also noted the ratio of L4 to L3 for all beams exhibited no significant difference, therefore the detection of damage using this CHV formation can be sensitive until 60% of the ultimate load is reached.
5. Conclusions
Computational geometry using the convex hull algorithm was used to determine the maximum volume formed by the AE source location hits inside 18 concrete beams with varying water-cement ratios and reinforcements. The volume of the convex hull showed a good relation to the damage encountered in the four-point bending test for each type of beam. The specimens with a high water-cement ratio had higher convex hull volume formation compared to those with a lower water-cement ratio due to the ductility, where the movement of AE source location hits spreads out wider.
The changes in the convex hull volume from 20% load to 40% load was more than five times for all beams. In addition, the changes in convex hull volume from 20% load to 60% load was more than 13 times from CHV of 20% load for all beams. Lastly, the changes in convex hull volume from 60% to failure for all beams exhibited no significant difference. This showed that the convex hull volume correlated well with the damage until 60% of the ultimate load was reached.
Acknowledgments
The research work was funded under the JSPS-Ronpaku Scholarship. The open access publication fee was funded by the main author of the paper.
Author Contributions
Jason Maximino C. Ongpeng, Andres Winston C. Oreta and Sohichi Hirose conceived and designed the experiments; Jason Maximino C. Ongpeng performed the experiments, analyzed the data, and wrote the paper.
Conflicts of Interest
The authors declare no conflict of interest.
Acronyms and Symbols
| Acronym/Symbol | Description |
| AE | Acoustic Emission |
| AESL | Acoustic Emission Source Location |
| CHV | Convex Hull Volume |
| Design A | Two longitudinal top bars and two longitudinal bottom bars |
| Design B | Two longitudinal bottom bars |
| Design C | One longitudinal bottom bar |
| DIC | Digital Image Correlation |
| FPZ | Fracture Process Zone |
| ITZ | Interfacial Transition Zone |
| L1 | Cyclic load from 0 to 20% of ultimate load |
| L2 | Cyclic load from 0 to 40% of ultimate load |
| L3 | Cyclic load from 0 to 60% of ultimate load |
| L4 | Load from 60 to 100% of ultimate load |
| NDT | Non-Destructive Test |
| RC | Reinforced Concrete |
| WC40 | Water-Cement Ratio of 0.40 |
| WC40 | Water-Cement Ratio of 0.60 |
References
- Ongpeng, J.M.C.; Oreta, A.W.C.; Hirose, S. Effect of Load Pattern in the Generation of Higher Harmonic Amplitude in Concrete Using Nonlinear Ultrasonic Test. J. Adv. Concrete Technol. 2016, 14, 205–214. [Google Scholar] [CrossRef]
- Ongpeng, J.M.C.; Oreta, A.W.C.; Hirose, S.; Nakahata, K. Nonlinear Ultrasonic Investigation of Concrete with Varying Aggregate Size under Uniaxial Compression Loading and Unloading. J. Mater. Civ. Eng. 2017, 29. [Google Scholar] [CrossRef]
- Ongpeng, J.M.C.; Soberano, M.; Oreta, A.W.C.; Hirose, S. Artificial Neural Network Model using Ultrasonic Test Results to Predict Compressive Stress in Concrete. Comput. Concrete 2017, 19, 59–68. [Google Scholar] [CrossRef]
- Ongpeng, J.M.C.; Oreta, A.W.C.; Hirose, S. Damage progression in concrete using acoustic emission test through convex hull visualization. ACI Mater. 2016, 113, 737–744. [Google Scholar] [CrossRef]
- Li, Z.; Shah, S.P. Localization of microcracking in concrete under uniaxial tension. ACI Mater. 1994, 91, 372–381. [Google Scholar]
- Lim, H.J.; Song, B.; Park, B.; Sohn, H. Noncontact fatigue crack visualization using nonlinear ultrasonic modulation. NDT E Int. 2015, 73, 8–14. [Google Scholar] [CrossRef]
- Carpenteri, A.; Lacidogna, G. Damage monitoring of an historical masonry building by the acoustic emission technique. Mater. Struct. 2006, 39, 161–167. [Google Scholar]
- Li, Z.; Li, F.; Li, X. P-wave arrival determination and AE characterization of concrete. J. Eng. Mech. 2000, 126, 194. [Google Scholar] [CrossRef]
- Li, Z.; Li, F.; Shah, S.P. Application of Acoustic Emission Technique to detection of reinforcing steel corrosion in concrete. ACI Mater. 1998, 95, 68–81. [Google Scholar]
- Ohtsu, M. The history and development of acoustic emission in concrete engineering. Mag. Concrete Res. 1996, 48, 321–330. [Google Scholar] [CrossRef]
- Suzuki, T.; Ohtsu, M.; Shigeishi, M. Relative damage evaluation of concrete in a road bridge by AE rate-process analysis. Mater. Struct. 2007, 40, 221–227. [Google Scholar] [CrossRef]
- Ettouney, M.M.; Alampalli, S. Infrastructure Health in Civil Engineering: Theory and Components; CRC Press: Boca Raton, FL, USA, 2012; pp. 363–426. [Google Scholar]
- Xiangqian, F.; Shaowei, H.; Jun, L.; Congjie, W. Acoustic emission properties of concrete on dynamic tensile test. Constr. Build. Mater. 2016, 114, 66–75. [Google Scholar] [CrossRef]
- Noorsuhada, M.N. An overview on fatigue damage assessment of reinforced concrete structures with the aid of acoustic emission technique. Constr. Build. Mater. 2016, 112, 424–439. [Google Scholar] [CrossRef]
- Ohtsu, M. AE and Related NDT for Damage Evaluation of Civil Structures: Prospective Applications of AE measurements to infra-dock of concrete structures. Constr. Build. Mater. 2018, 158, 1134–1142. [Google Scholar] [CrossRef]
- Ohtsu, M. Elastic wave methods for NDE in concrete based generalized theory of acoustic emission. Constr. Build. Mater. 2016, 122, 845–854. [Google Scholar] [CrossRef]
- Farnam, Y.; Geiker, M.R.; Bentz, D.; Weiss, J. Acoustic emission waveform characterization of crack origin and mode in fractured and ASR damaged concrete. Cem. Concrete Compos. 2015, 60, 135–145. [Google Scholar] [CrossRef]
- Paul, S.C.; Pirskawetz, S.; Van Zijl, G.P.A.G.; Schmidt, W. Acoustic emission for characterising the crack propagation in strain-hardening cement-based composites (SHCC). Cem. Concrete Res. 2015, 69, 19–24. [Google Scholar] [CrossRef]
- Saliba, J.; Matallah, M.; Loukili, A.; Regoin, J.P.; Gregorie, D.; Verdon, L.; Pijaudier-Cabot, G. Experimental and numerical analysis of crack evolution in concrete through acoustic emission technique and mesoscale modelling. Eng. Fract. Mech. 2016, 167, 123–137. [Google Scholar] [CrossRef]
- Ongpeng, J.M.C.; Oreta, A.W.C.; Hirose, S. Monitoring Damage in Reinforced Concrete Structure using Seesaw Effect through Acoustic Emission test. In Proceedings of the 32nd European Conference on Acoustic Emission Testing (EWGAE 2016), Prague, Czech Republic, 7–9 September 2016; pp. 383–392. [Google Scholar]
- Bosia, F.; Pugno, N.; Lacidogna, G.; Carpinteri, A. Mesoscopic modeling of Acoustic Emission through an energetic approach. Int. J. Solids Struct. 2008, 45, 5856–5866. [Google Scholar] [CrossRef]
- Carpinteri, A.; Lacidogna, G.; Accornero, F.; Mpalaskas, A.C.; Matikas, T.E.; Aggelis, D.G. Influence of damage in the acoustic emission parameters. Cem. Concrete Compos. 2013, 44, 9–16. [Google Scholar] [CrossRef]
- Kocur, G.K.; Saenger, E.H.; Grosse, C.U.; Vogel, T. Time reverse modeling of acoustic emissions in a reinforced concrete beam. Ultrasonics 2016, 65, 96–104. [Google Scholar] [CrossRef] [PubMed]
- Lacigdona, G.; Piana, G.; Carpinteri, A. Acoustic Emission and Modal Frequency Variation in Concrete Specimens under Four-point Bending. Appl. Sci. 2017, 7, 339. [Google Scholar] [CrossRef]
- Alam, S.Y.; Loukili, A.; Grondin, F.; Roziere, E. Use of digital image correlation and acoustic emission technique to study the effect of structural size on cracking of reinforced concrete. Eng. Fract. Mech. 2015, 143, 17–31. [Google Scholar] [CrossRef]
- Shahidan, S.; Pullin, R.; Bunnori, N.M.; Holford, K.M. Damage Classification in Reinforced Concrete beam by Acoustic Emission. Constr. Build. Mater. 2013, 45, 78–86. [Google Scholar] [CrossRef]
- Aggelis, D.G.; Mpalaskas, A.C.; Matikas, T.E. Investigation of different fracture modes in cement-based materials by acoustic emission. Cem. Concrete Res. 2013, 48, 1–8. [Google Scholar] [CrossRef]
- Behnia, A.; Ranjbar, N.; Chai, H.K.; Masaeli, M. Failure prediction and reliability analysis of ferrocement composite structures by incorporating machine learning into acoustic emission monitoring technique. Constr. Build. Mater. 2016, 122, 823–832. [Google Scholar] [CrossRef]
- Ongpeng, J.M.C. Acoustic Emission Test in Visualizing Crack Progression for Concrete Beams. Asian J. Civ. Eng. 2016, 17, 479–486. [Google Scholar]
- Vidya Sagar, R. A parallel between earthquake sequences and acoustic emissions released during the fracture process in reinforced concrete structures under flexural loading. Constr. Build. Mater. 2016, 114, 772–793. [Google Scholar] [CrossRef]
- Selman, E.; Ghiami, A.; Alver, N. Study of fracture evolution in FRP-strengthened reinforced concrete beam under cyclic load by acoustic emission technique: An integrated mechanical-acoustical energy approach. Constr. Build. Mater. 2015, 95, 832–841. [Google Scholar] [CrossRef]
- Antonaci, P.; Bocca, P.; Masera, D. Fatigue crack propagation monitoring by Acoustic Emission signal analysis. Eng. Fract. Mech. 2012, 81, 26–32. [Google Scholar] [CrossRef]
- Alam, S.Y.; Saliba, J.; Loukili, A. Fracture examination in concrete through combined digital image correlation and acoustic emission techniques. Constr. Build. Mater. 2014, 69, 232–242. [Google Scholar] [CrossRef]
- Tschegg, E.K.; Schneemayer, A.; Merta, I.; Rieder, K.A. Energy dissipation capacity of fibre reinforced concrete under biaxial tension-compression load. Part II: Determination of the fracture process zone with the acoustic emission technique. Cem. Concrete Compos. 2015, 62, 187–194. [Google Scholar] [CrossRef]
- Shah, S.G.; Chandra Kishen, J.M. Use of acoustic emissions in flexural fatigue crack growth studies on concrete. Eng. Fract. Mech. 2012, 87, 36–47. [Google Scholar] [CrossRef]
- Shah, D.G.; Chandra Kishen, J.M. Fracture behavior of concrete-concrete interface using acoustic emission technique. Eng. Fract. Mech. 2010, 77, 908–924. [Google Scholar] [CrossRef]
- Behnia, A.; Chai, H.K.; Shiotani, T. Advanced structural health monitoring of concrete structures with the aid of acoustic emission. Constr. Build. Mater. 2014, 65, 282–302. [Google Scholar] [CrossRef]
- De Berg, M.; Kreveld, M.V.; Overmars, M.; Schwarzkopf, O. Computational Geometry Algorithms and Applications, 2nd ed.; Springer: Berlin, Germany, 1998. [Google Scholar]
- Suresh Kumar, C.; Arumugam, V.; Sengottuvelusamy, R.; Srinivasan, S.; Dhakal, H.N. Failure strength prediction of glass/epoxy composite laminates from acoustic emission parameters using artificial neural network. Appl. Acoust. 2017, 115, 32–41. [Google Scholar] [CrossRef]
- Li, S.; Song, Y.; Zhou, G. Leak detection of water distribution pipeline subject to failure of socket joint based on acoustic emission and pattern recognition. Measurement 2018, 115, 39–44. [Google Scholar] [CrossRef]
- Morizet, N.; Godin, N.; Tang, J.; Maillet, E.; Fregonese, M.; Normand, B. Classification of acoustic emission signals using wavelets and Random Forests: Application to localized corrosion. Mech. Syst. Signal Process. 2016, 70, 1026–1037. [Google Scholar] [CrossRef]
- Cormen, T.; Leiserson, C.; Rivest, R.; Stein, C. Introduction to Algorithms, 3rd ed.; MIT Press: Cambridge, MA, USA, 2009. [Google Scholar]
- Barber, C.B.; Dobkin, D.P.; Huhdanpaa, H.T. The quickhull algorithm for convex hulls. ACM Trans. Math. Softw. 1996, 22, 469–483. [Google Scholar] [CrossRef]
- Petyrniak, R. Application of convex hull algorithm for defect detection in selected biological materials. Solid State Phenom. 2013, 197, 41–46. [Google Scholar] [CrossRef]
- Just-Agosto, F.; Shafiq, B.; Serrano, D. Development of a damage detection scheme applicable to sandwich composites. J. Sandw. Struct. Mater. 2007, 9, 343–363. [Google Scholar] [CrossRef]
Figure 1.
Formation of macro- and micro-cracks (Lim et al., 2015 [6]).
Figure 1.
Formation of macro- and micro-cracks (Lim et al., 2015 [6]).
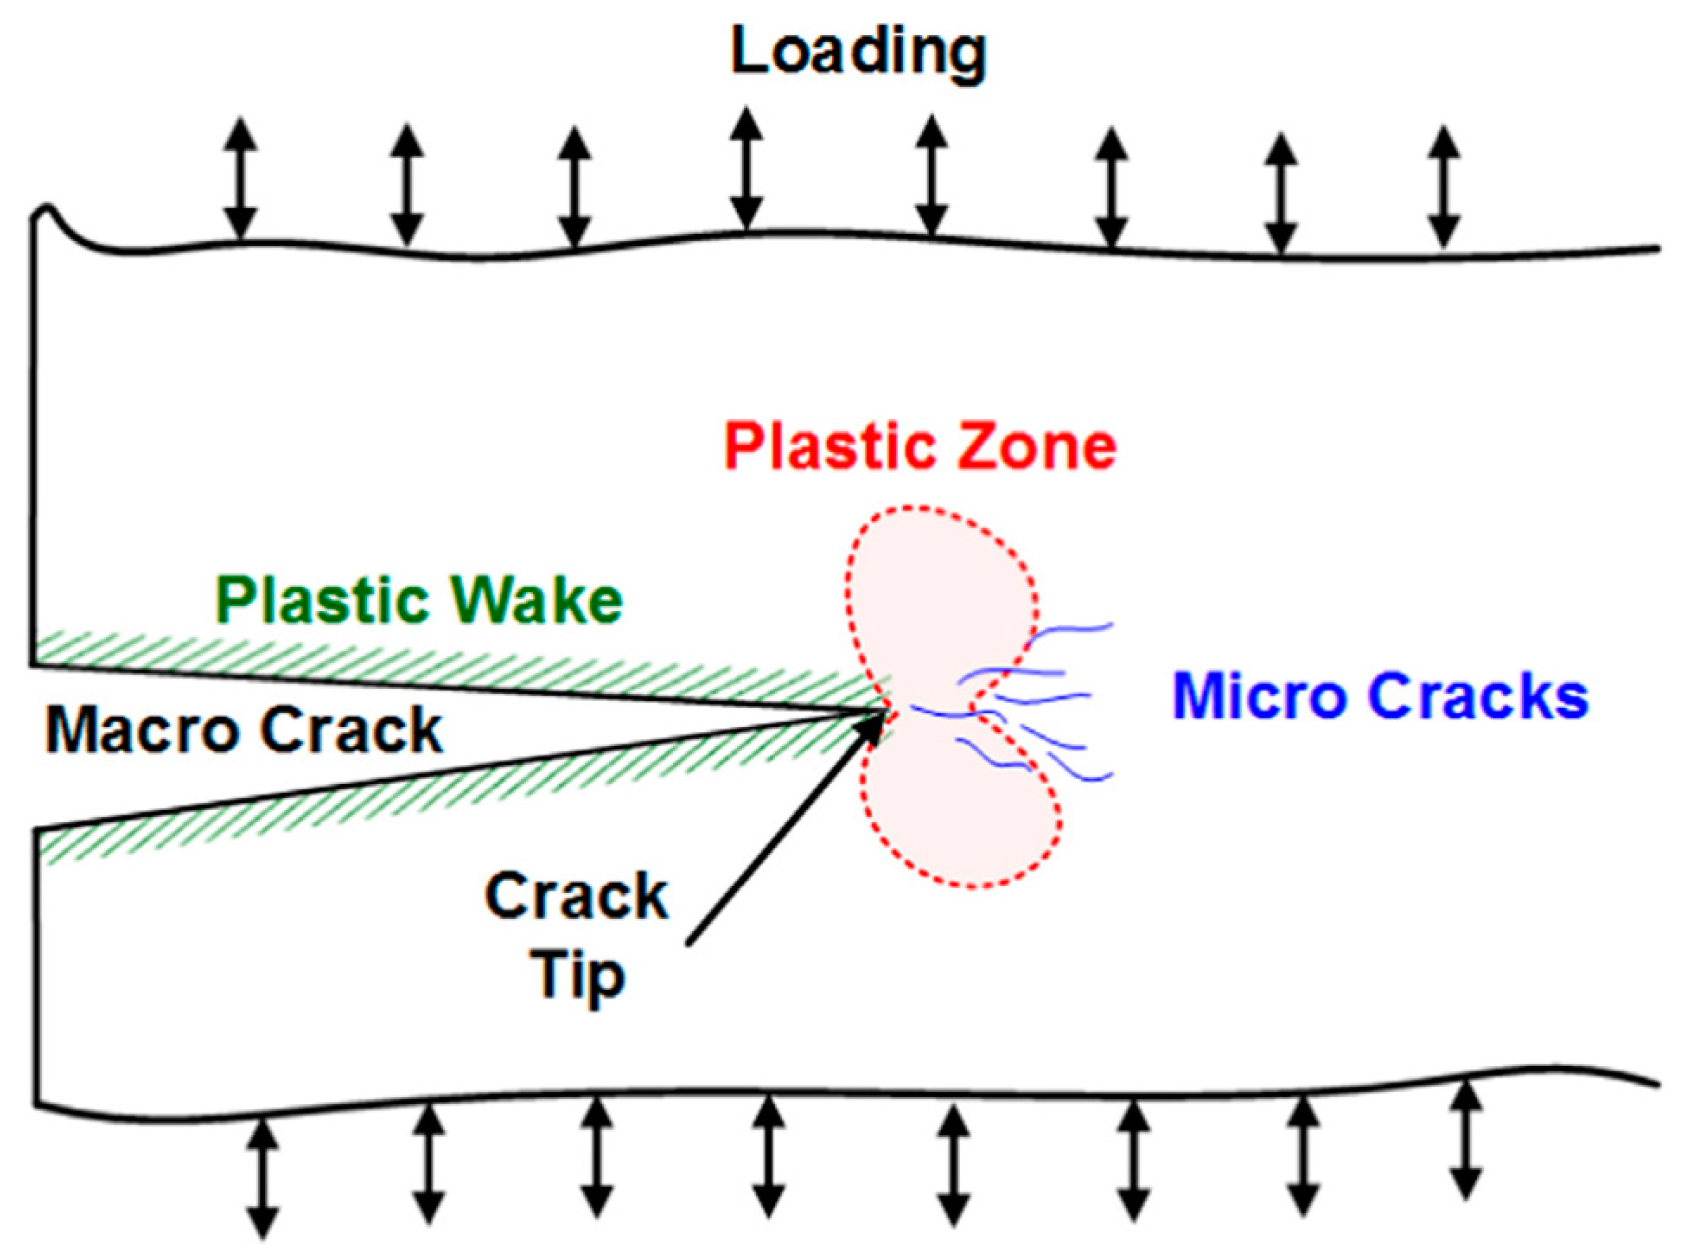
Figure 2.
Convex hull representation in two dimension.

Figure 3.
Reinforcements of the three beams.
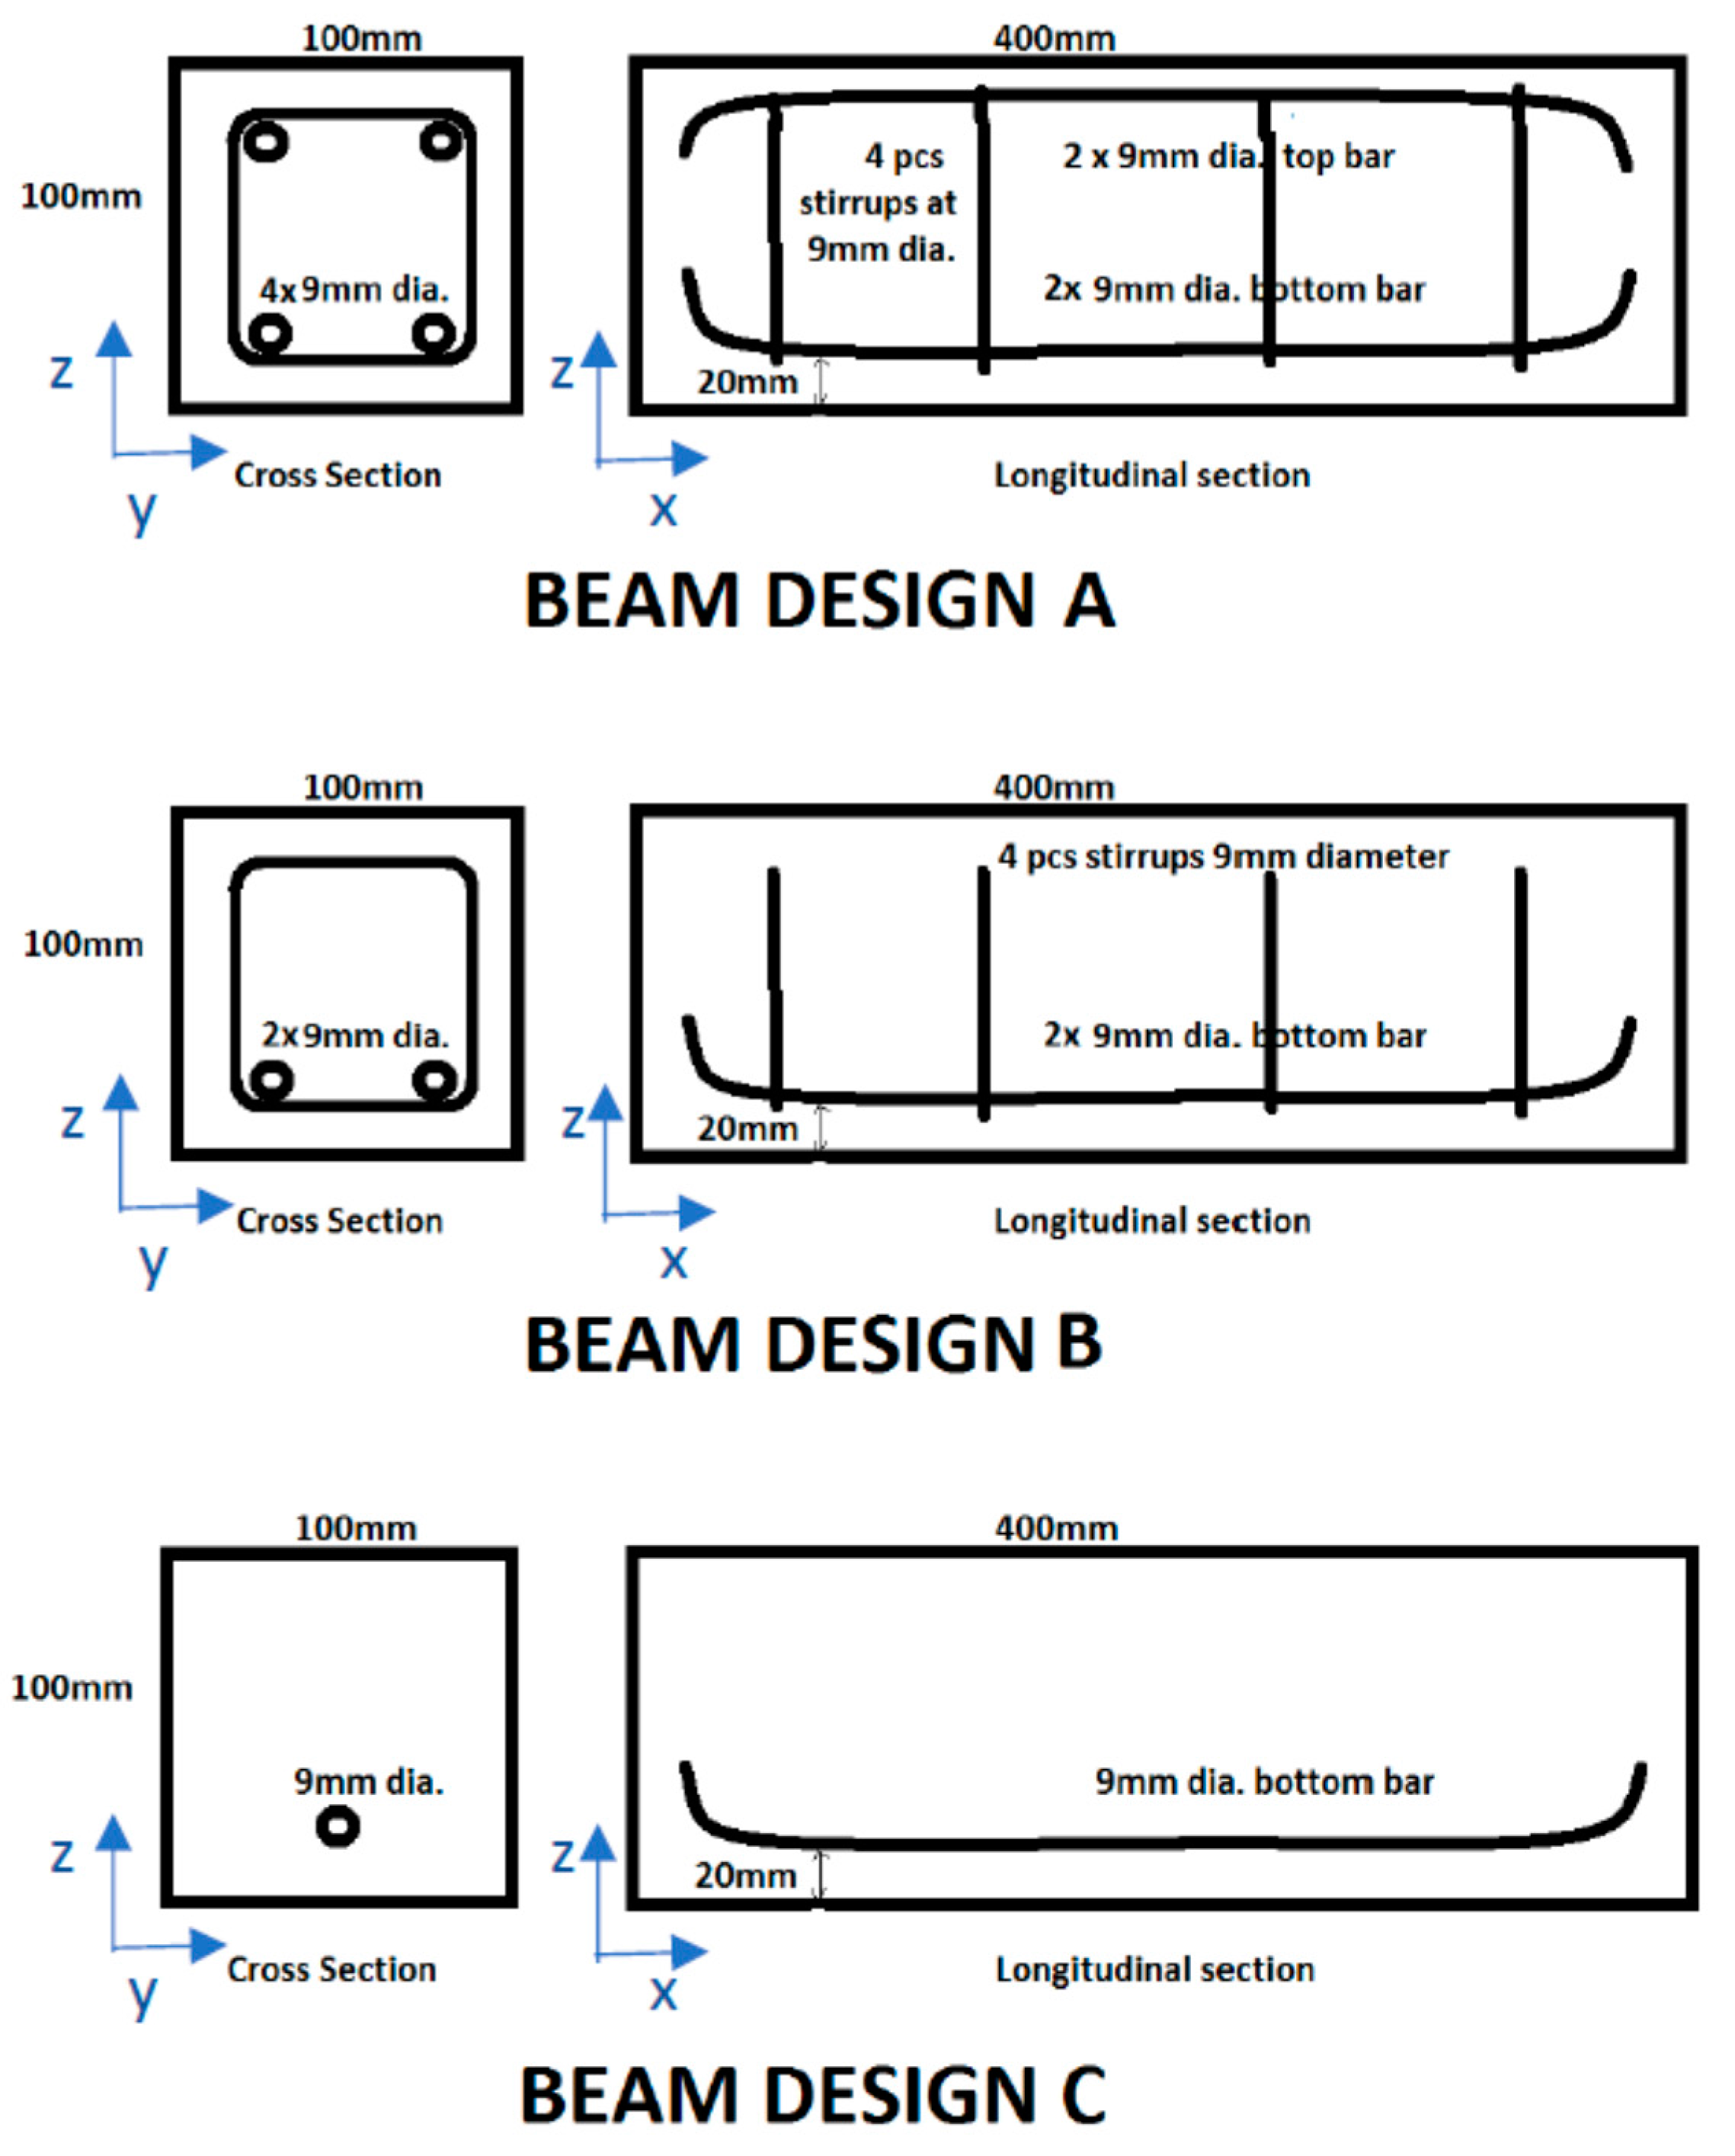
Figure 4.
Step load for the four-point bending with loading/unloading branches L1, L2, L3, and L4.

Figure 5.
Acoustic emission and four-point bending test setup.

Figure 6.
Acoustic emission and four-point bending test setup.
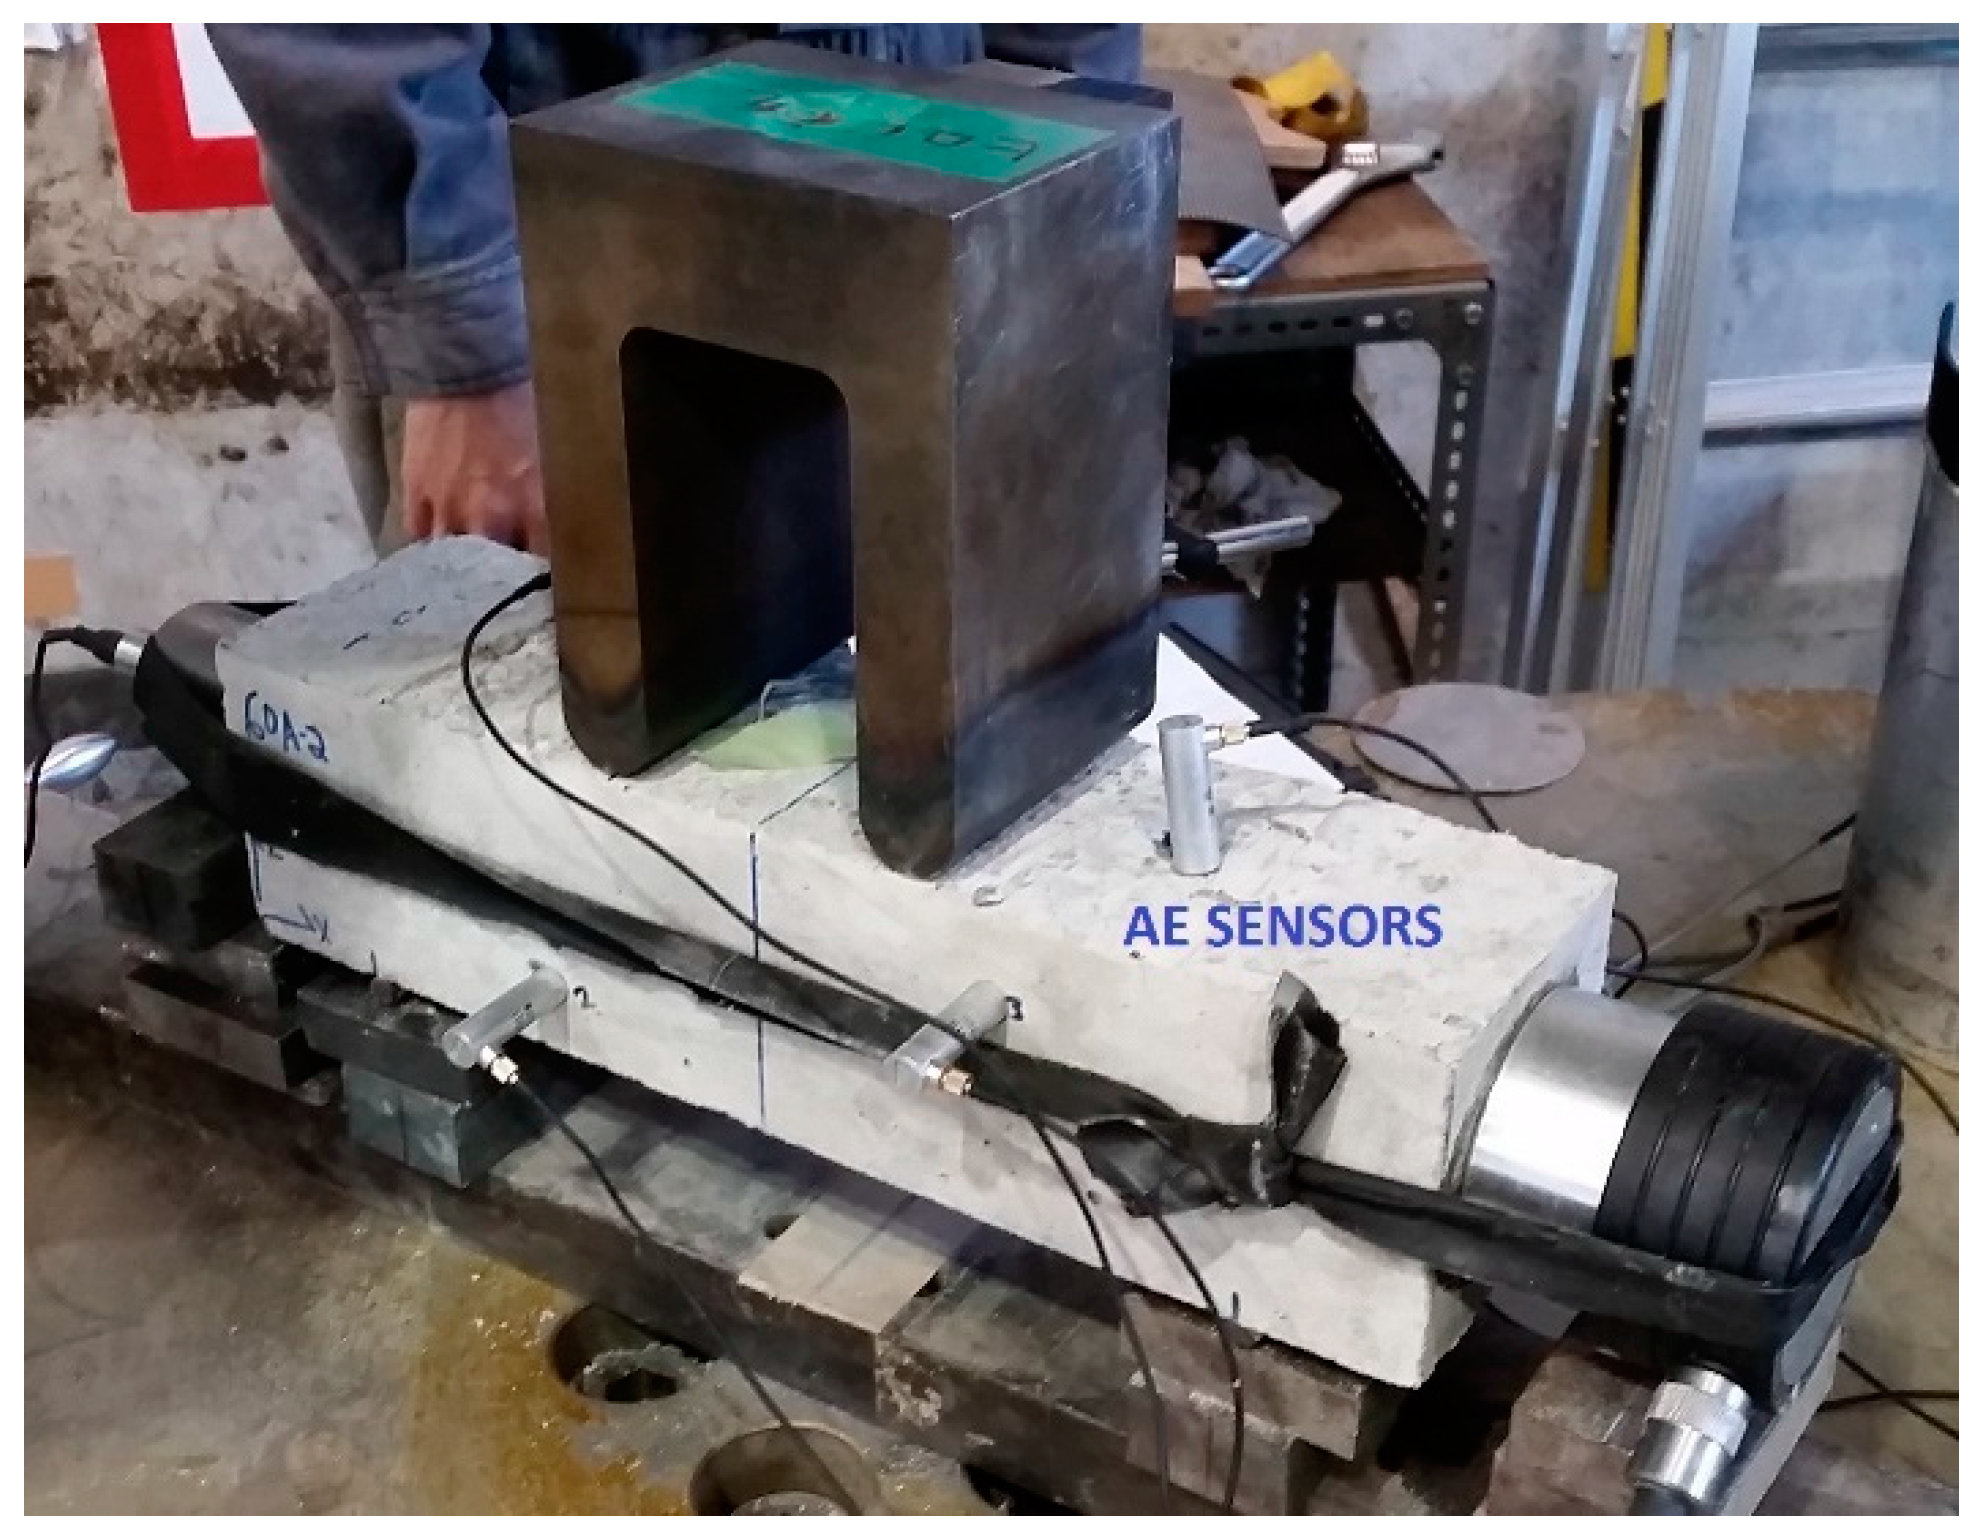
Figure 7.
Acoustic emission source location (AESL) for Specimen 1 WC60 Design C.
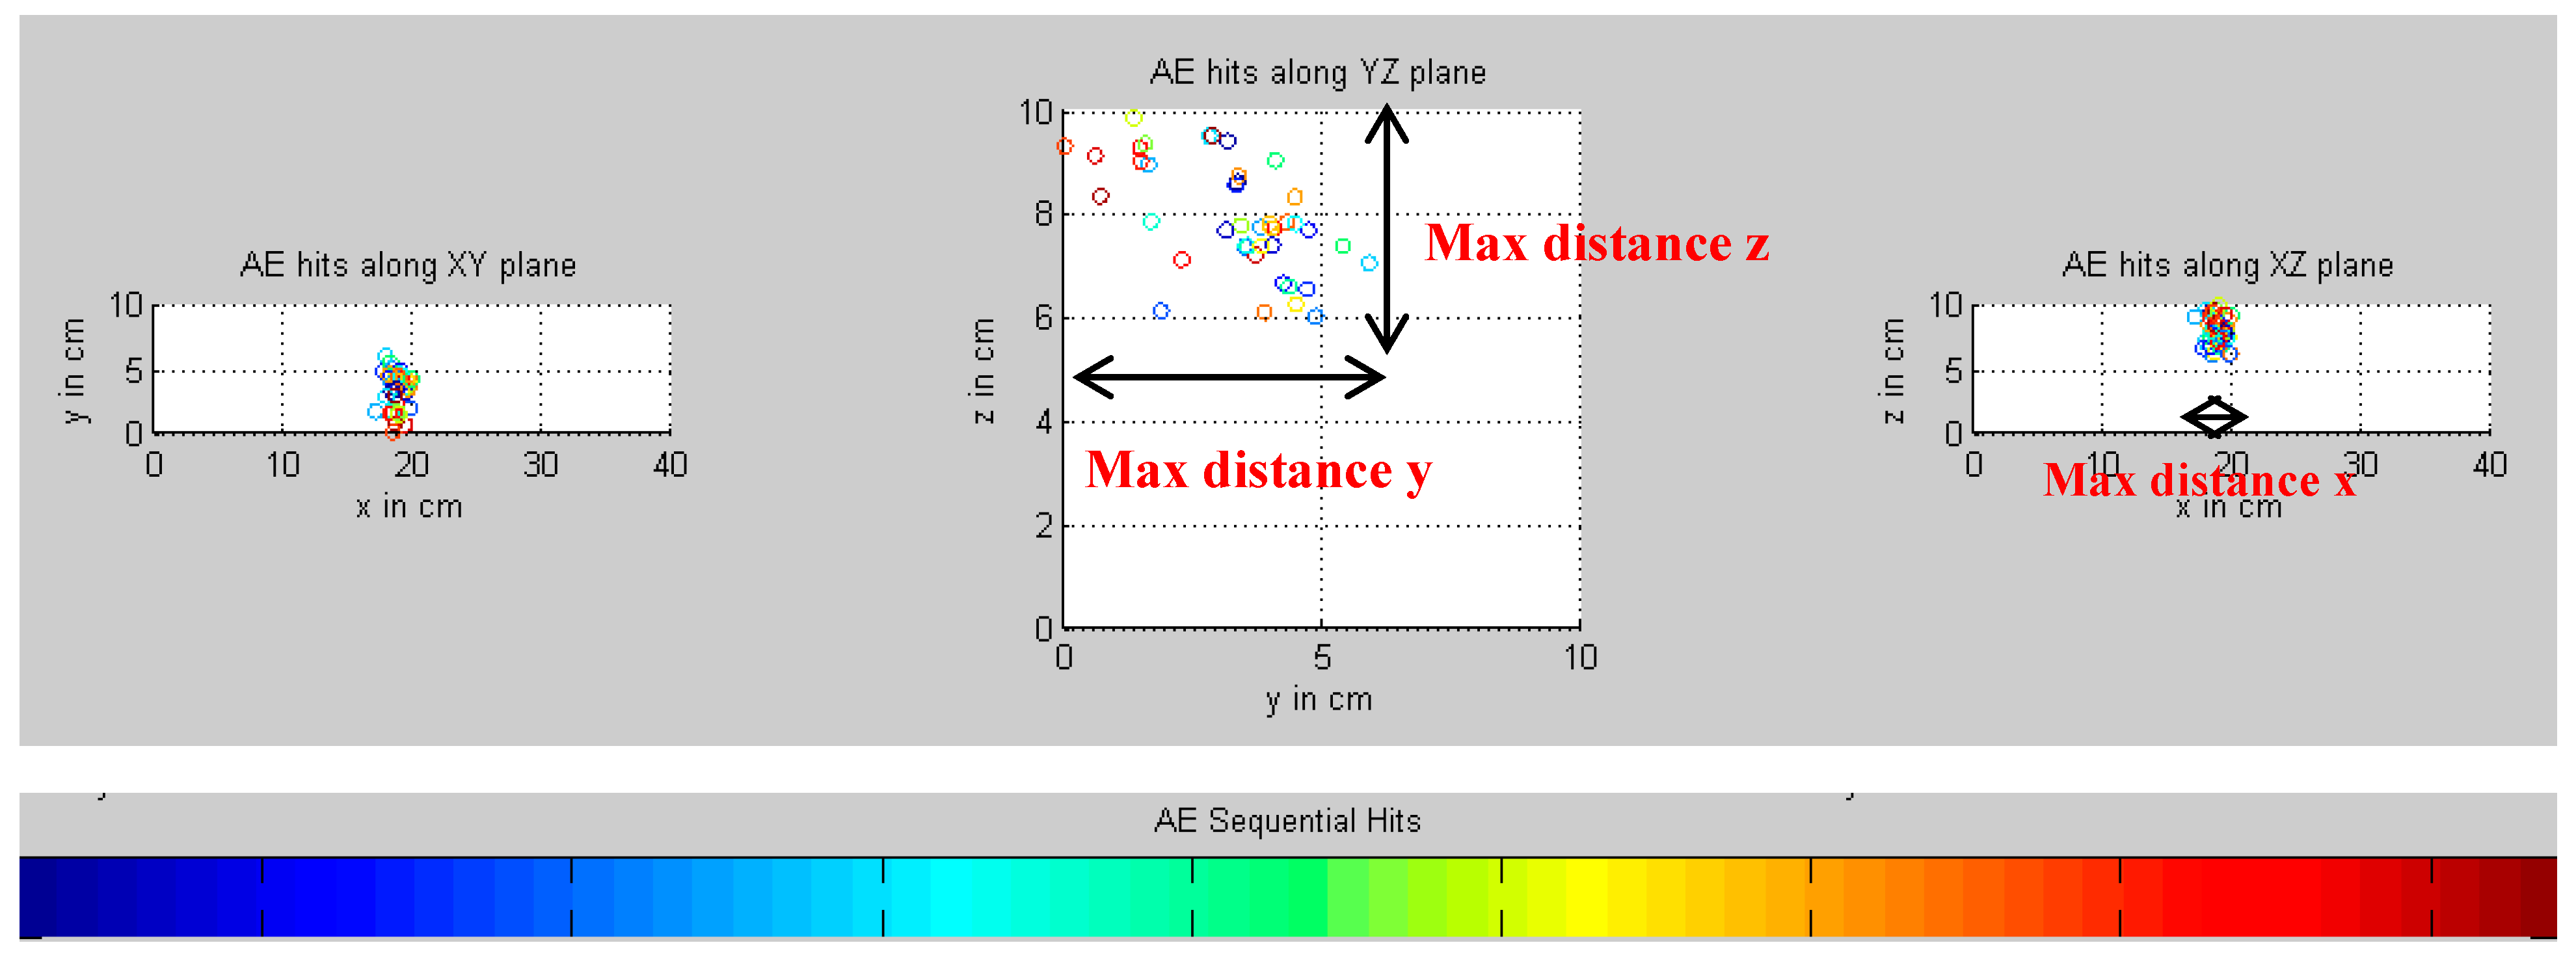
Figure 8.
Average maximum AESL along the x-axis.

Figure 9.
Average maximum AESL along the y-axis.
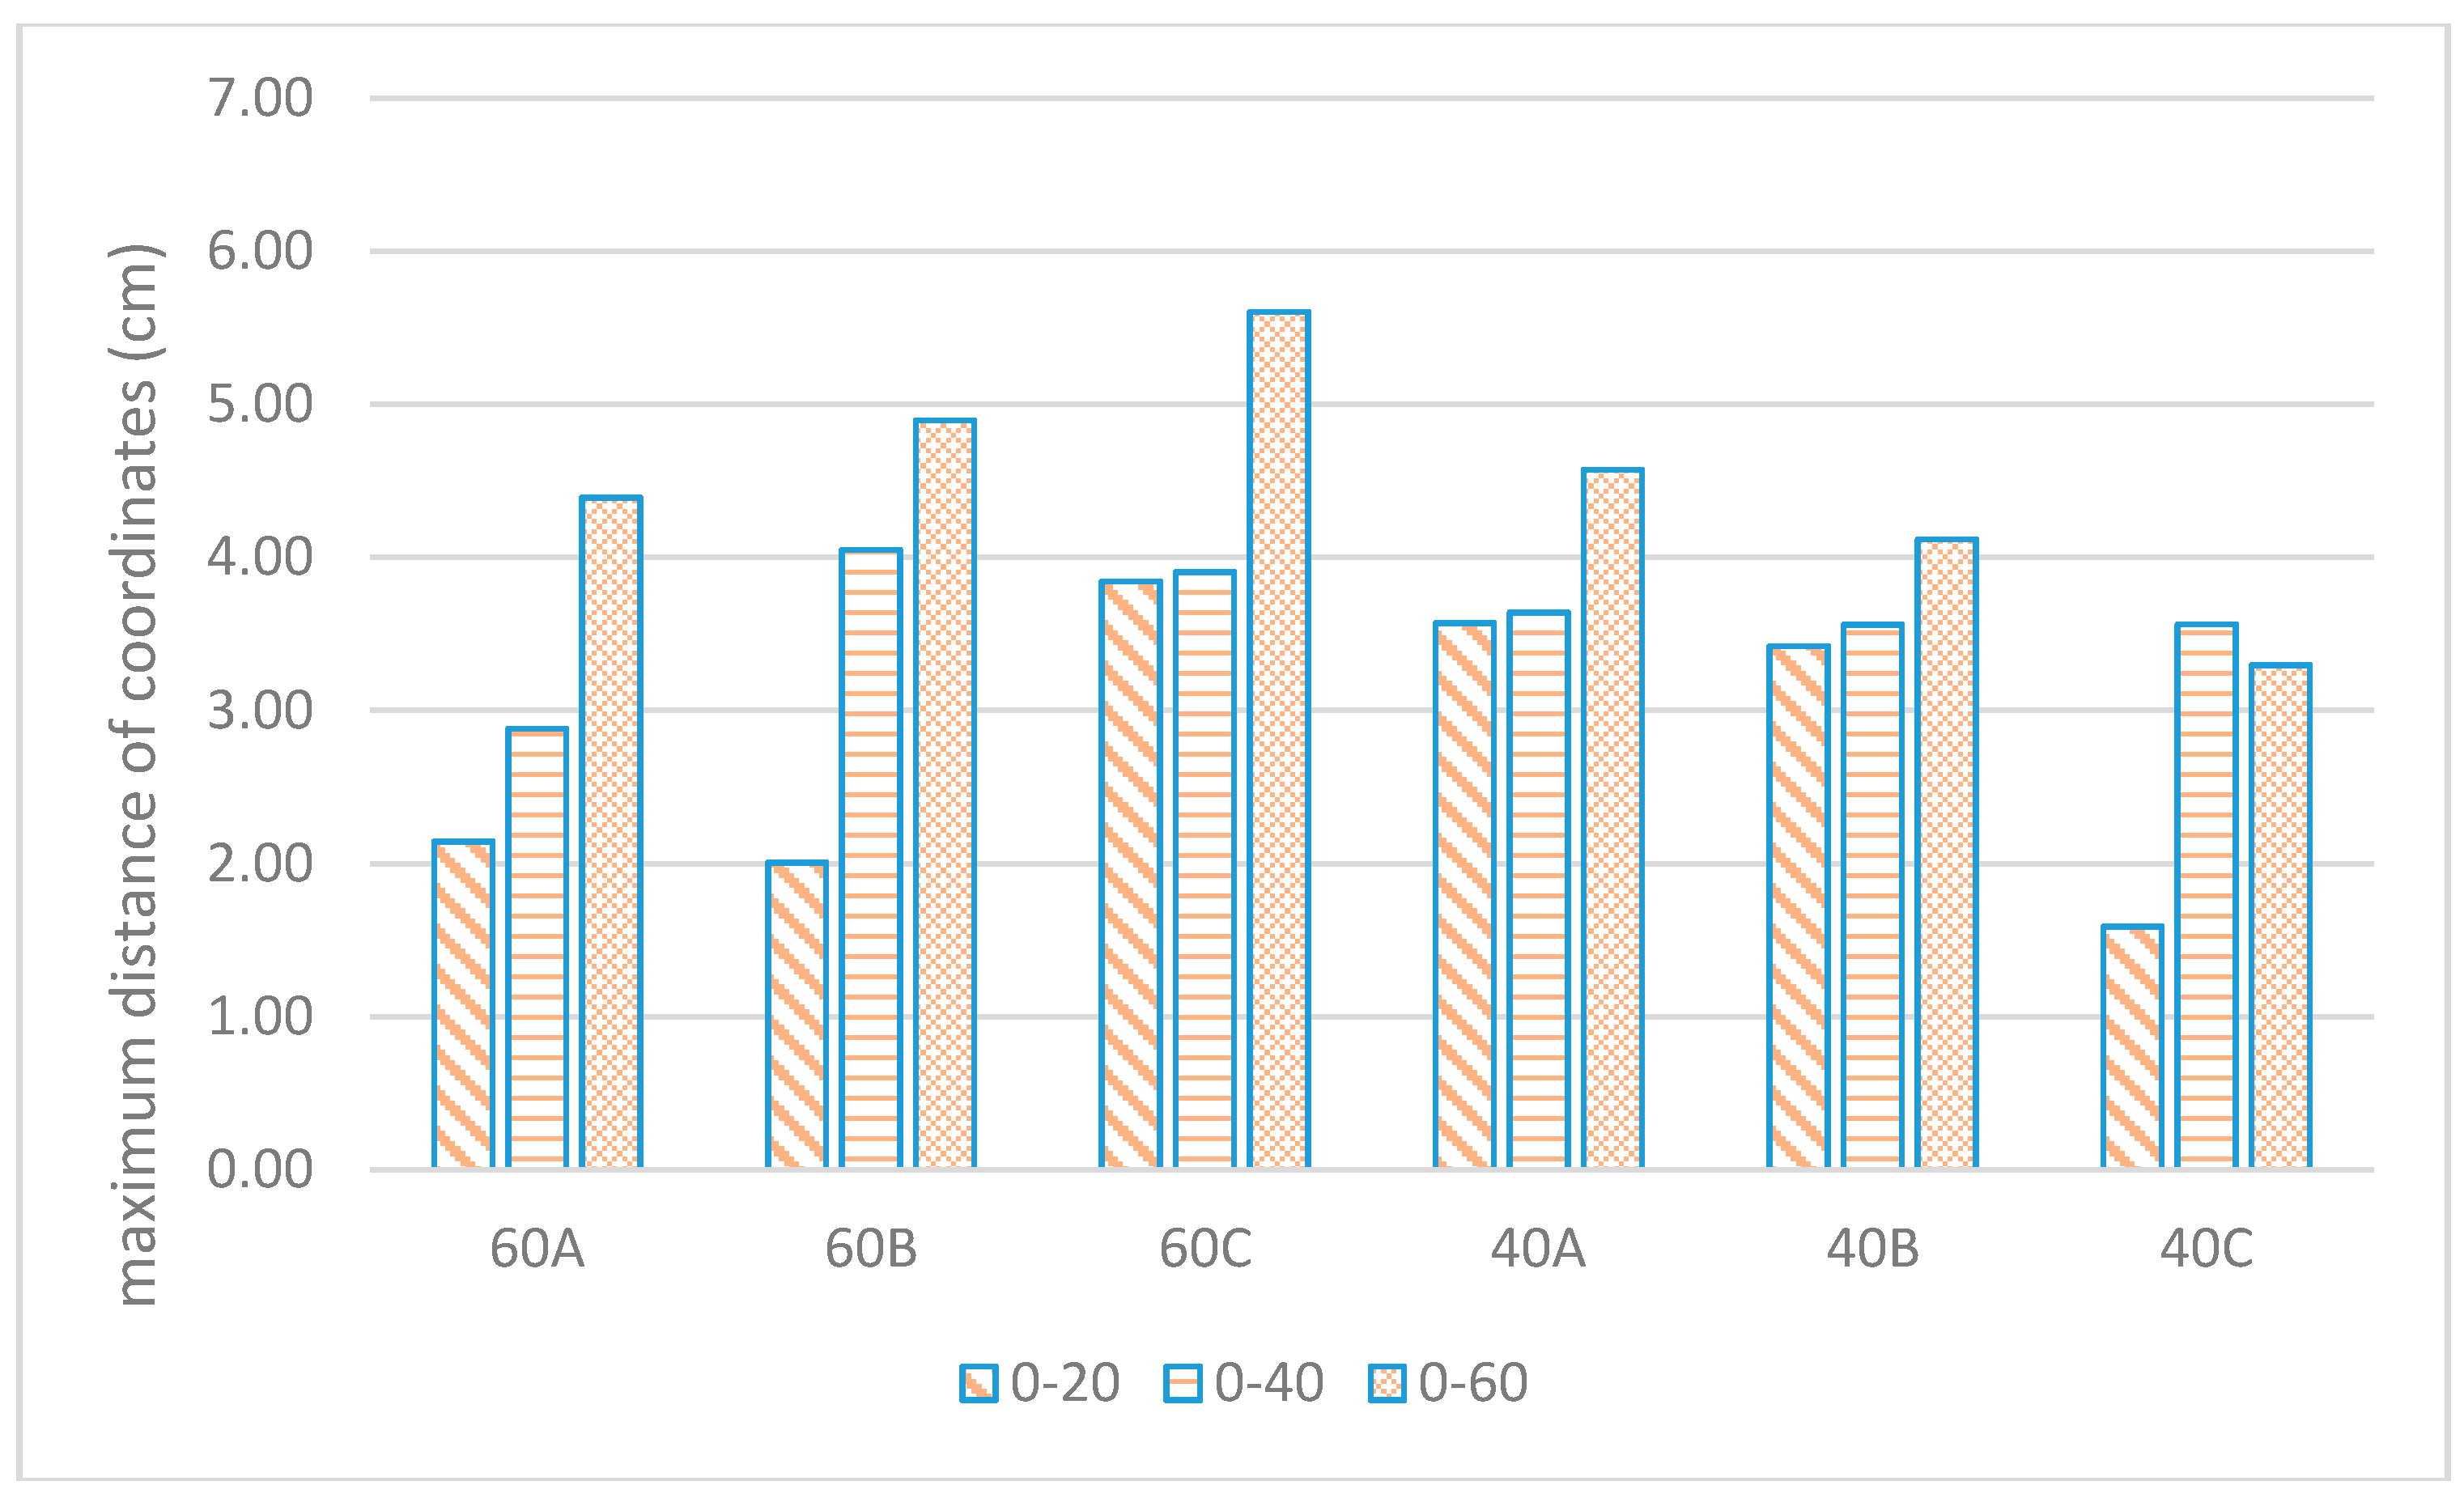
Figure 10.
Average maximum AESL along the z-axis.

Figure 11.
Acoustic emission (AE) hits from L1 to L4 for the six variations of RC beams.
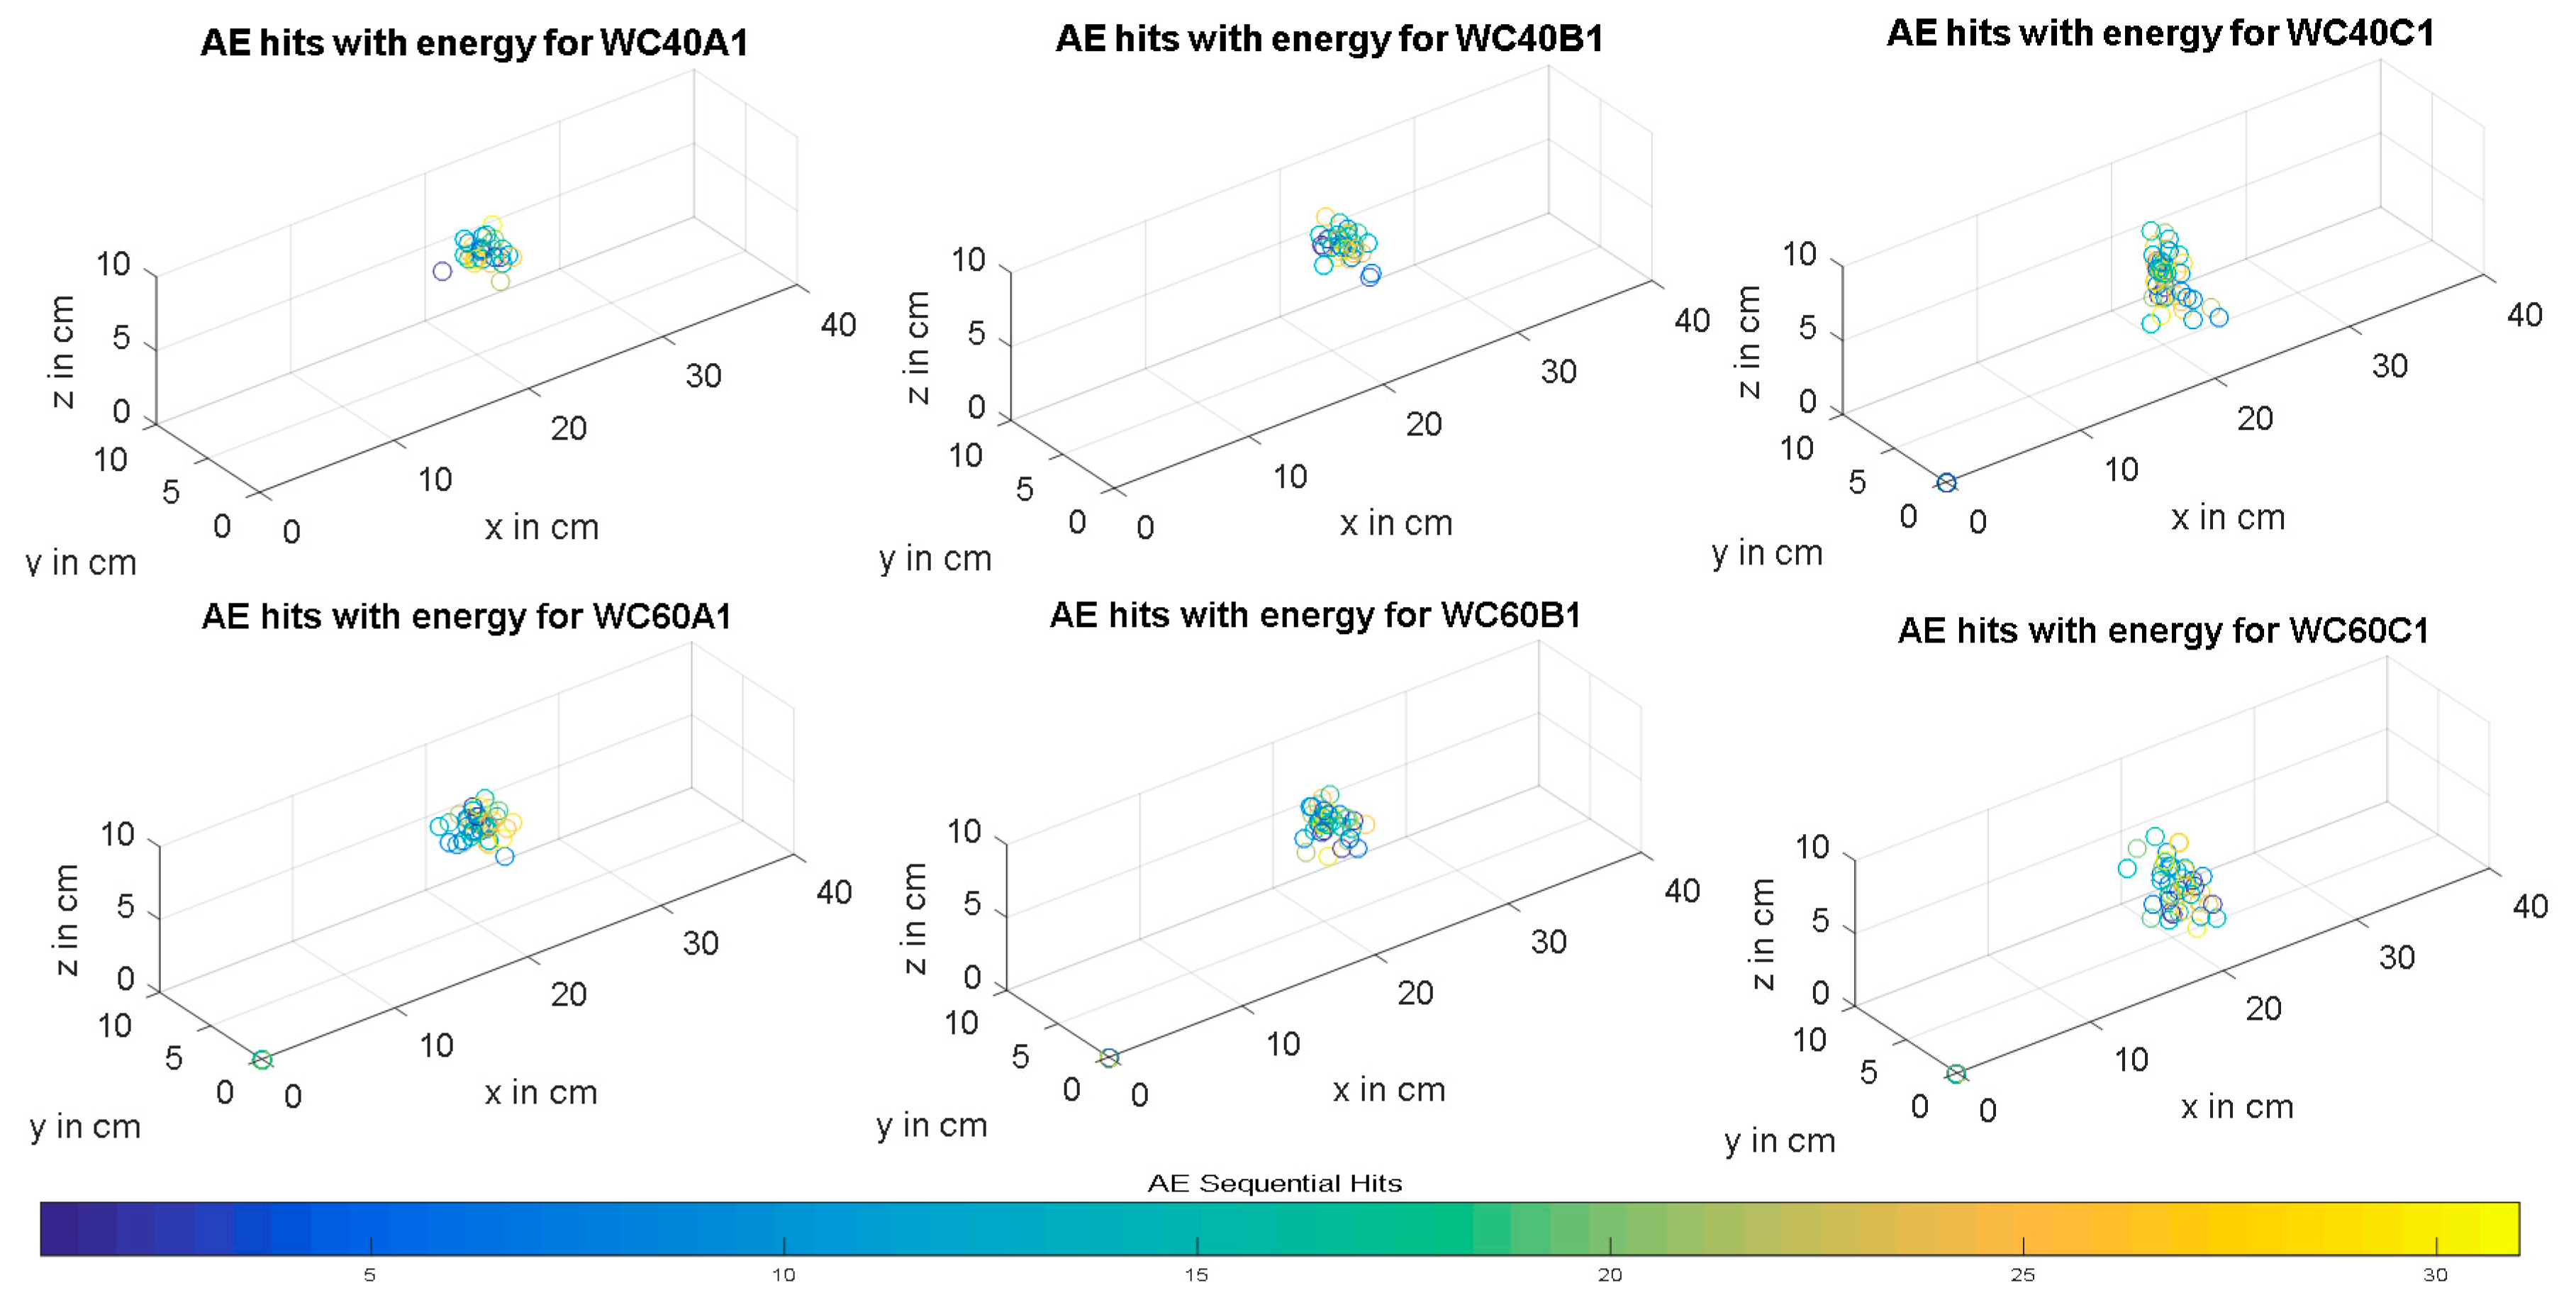
Figure 12.
Convex hull volume (CHV) progression seen in space (x-, y-, and z-axis) for L1, L2, and L3 for specimens WC40A1 (a–c), and WC60A1 (d–f).
Figure 12.
Convex hull volume (CHV) progression seen in space (x-, y-, and z-axis) for L1, L2, and L3 for specimens WC40A1 (a–c), and WC60A1 (d–f).

Figure 13.
CHV progression seen from the top view (x-and y-axis) for L1, L2, and L3 for specimens WC40B1 (a–c), and WC60B1 (d–f).
Figure 13.
CHV progression seen from the top view (x-and y-axis) for L1, L2, and L3 for specimens WC40B1 (a–c), and WC60B1 (d–f).
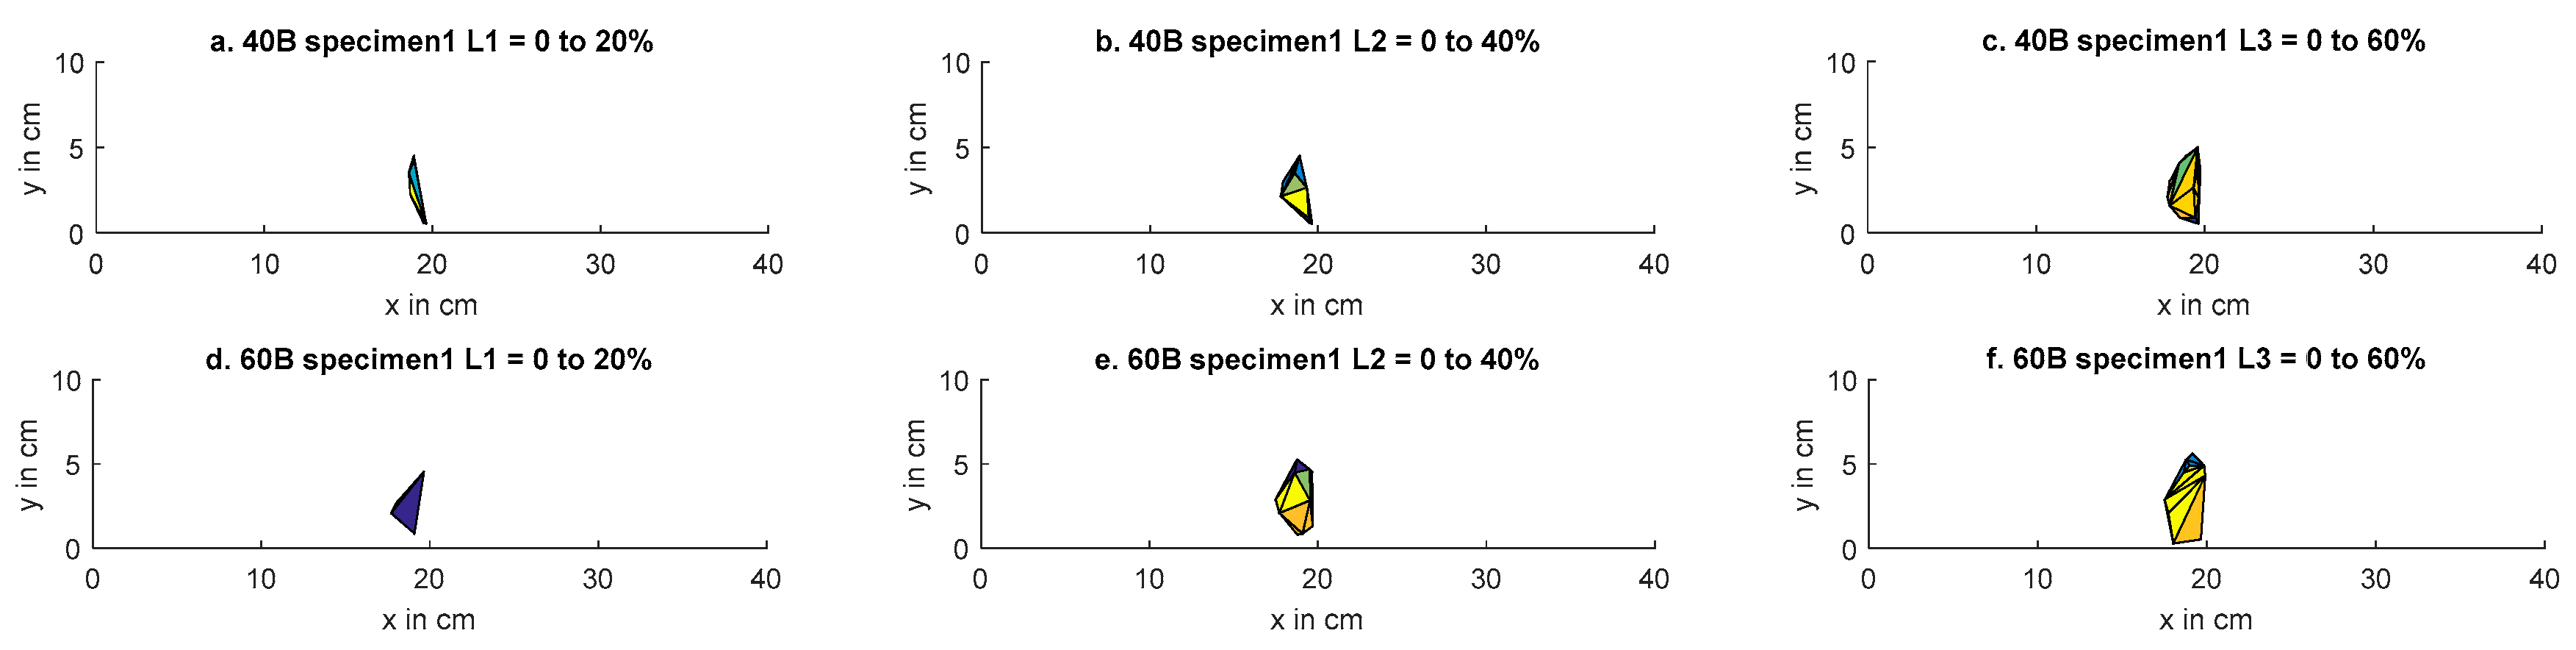
Figure 14.
CHV progression seen along the side elevation (x-and z-axis) for L1, L2, and L3 for specimens WC40B1 (a–c), and WC60B1 (d–f).
Figure 14.
CHV progression seen along the side elevation (x-and z-axis) for L1, L2, and L3 for specimens WC40B1 (a–c), and WC60B1 (d–f).
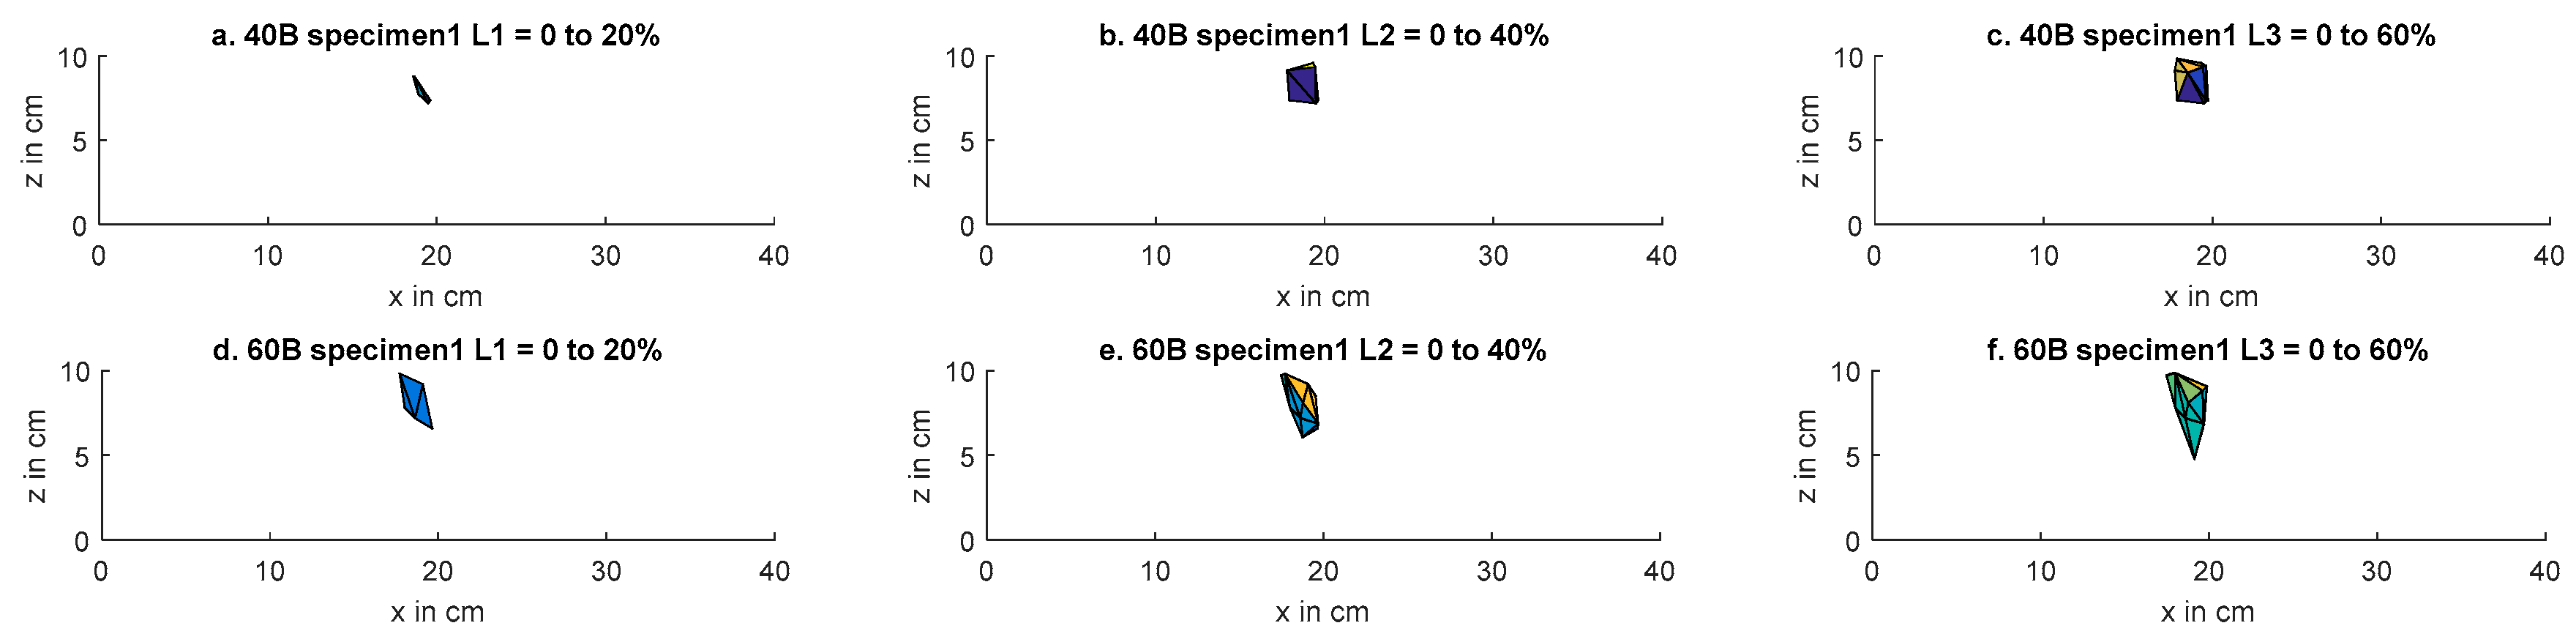
Figure 15.
CHV progression seen along the front elevation (y-and z-axis) for L1, L2, L3, and L4 for specimens WC40C1 (a–d), and WC60C1 (e–h).
Figure 15.
CHV progression seen along the front elevation (y-and z-axis) for L1, L2, L3, and L4 for specimens WC40C1 (a–d), and WC60C1 (e–h).
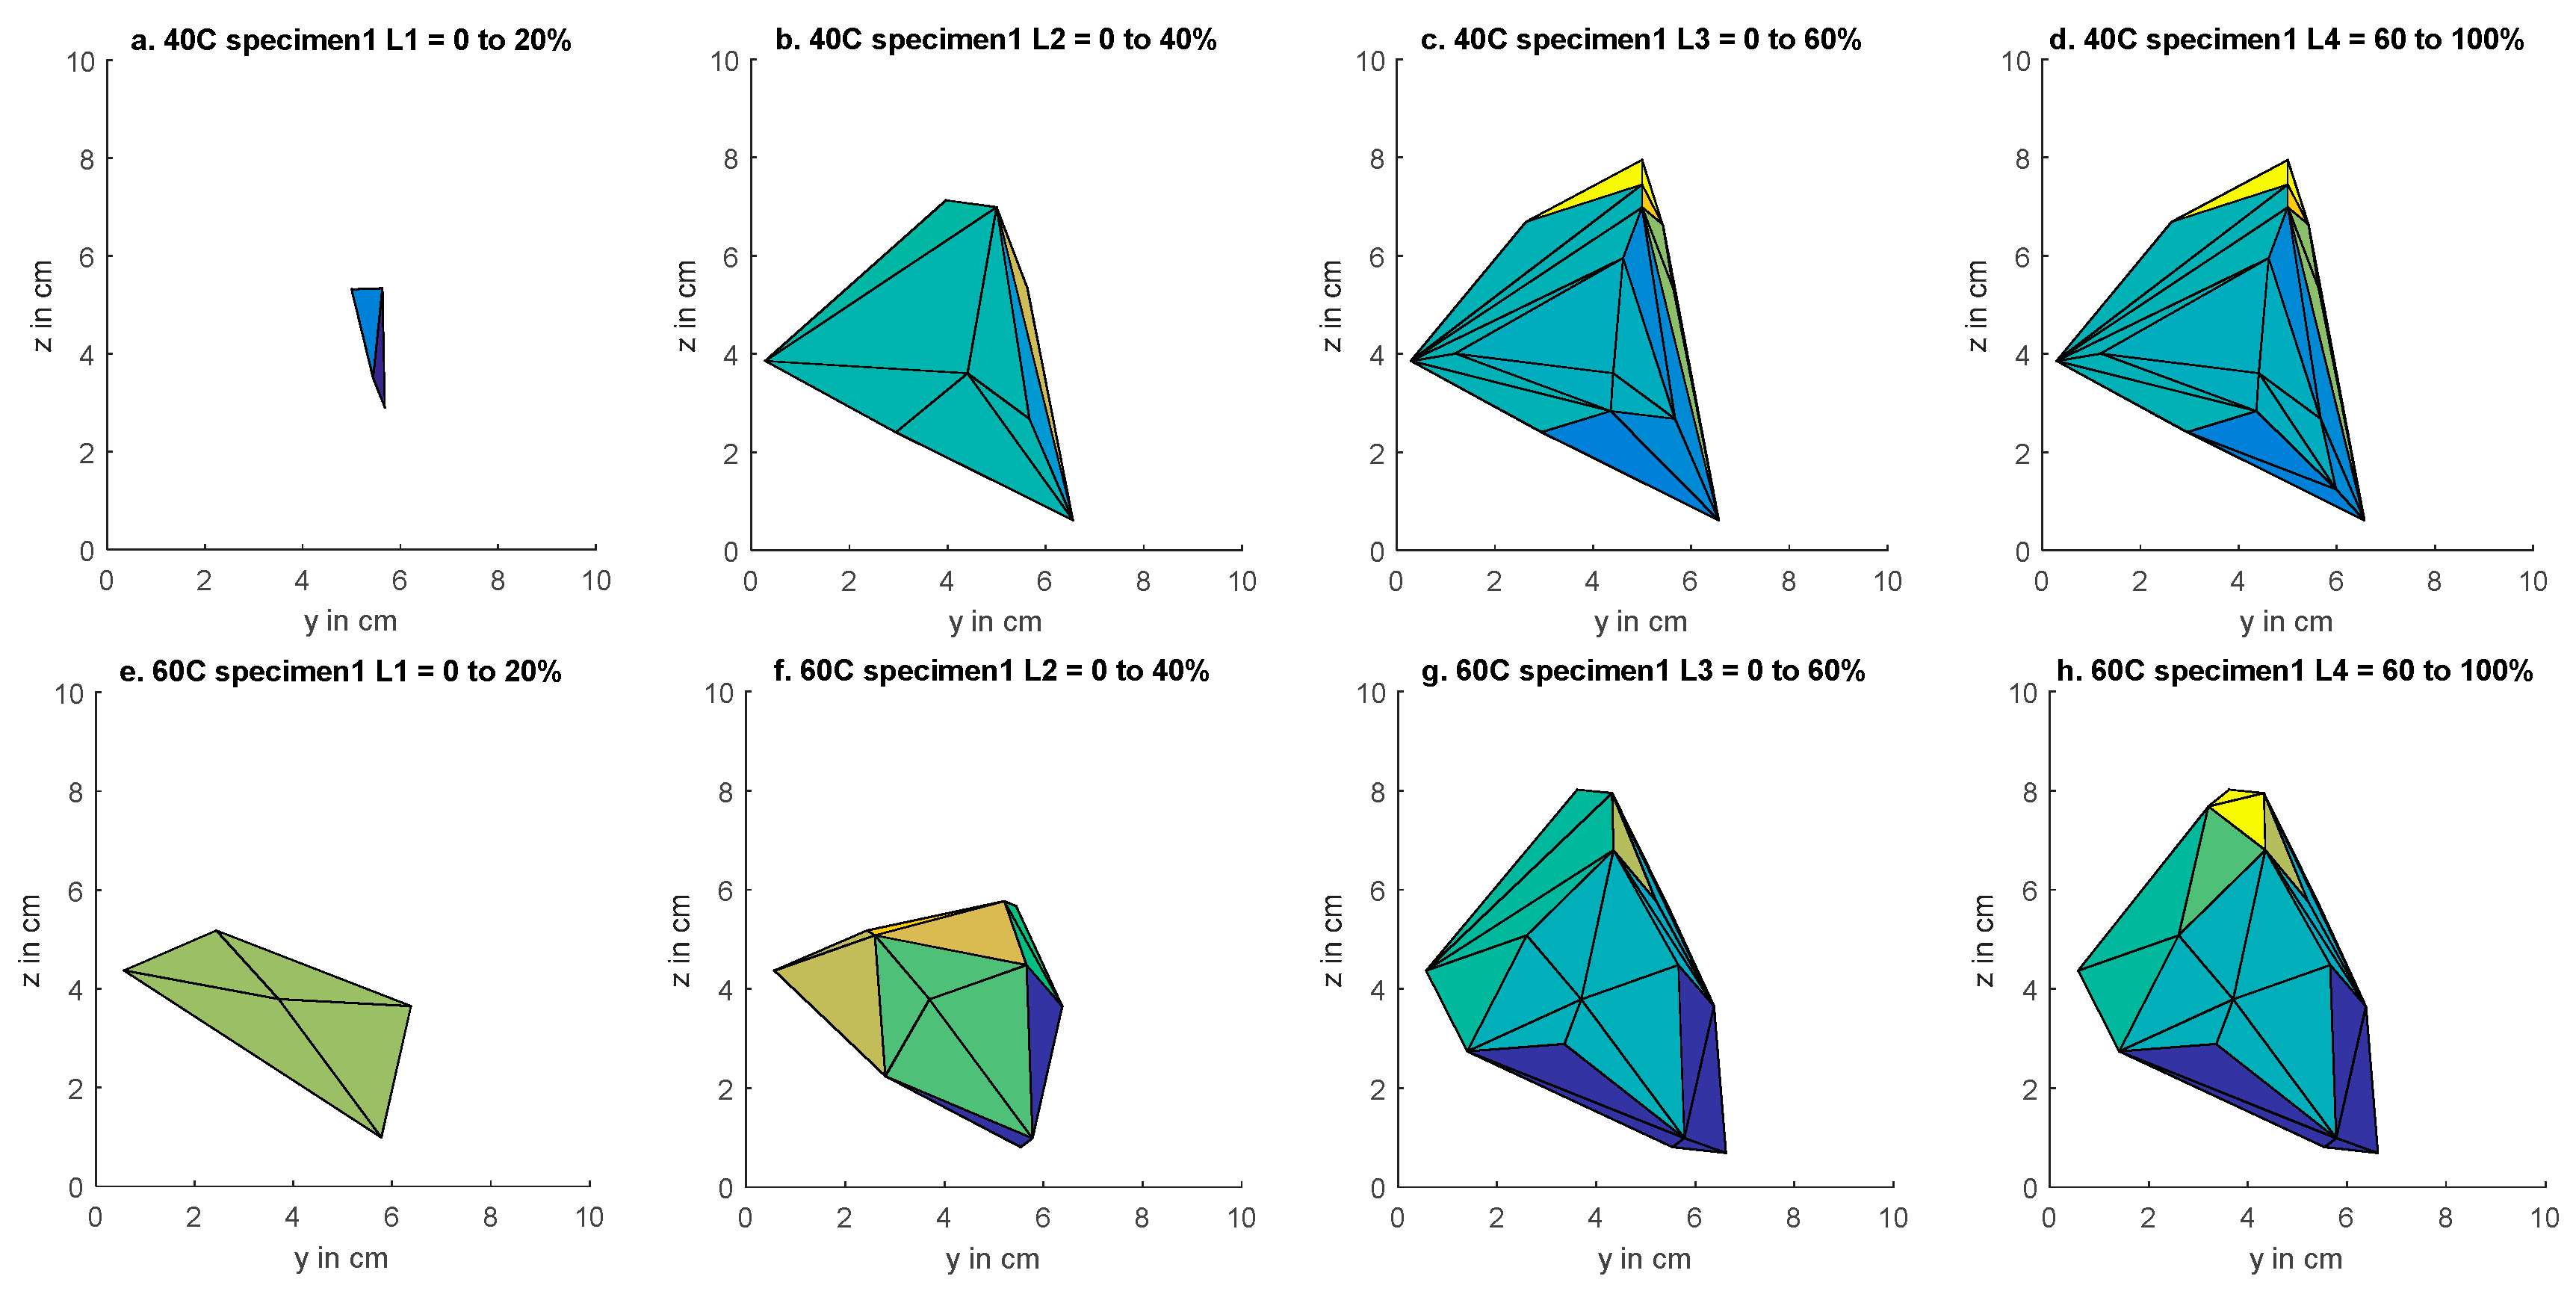
Figure 16.
Average CHV according to L1, L2, L3, and L4.
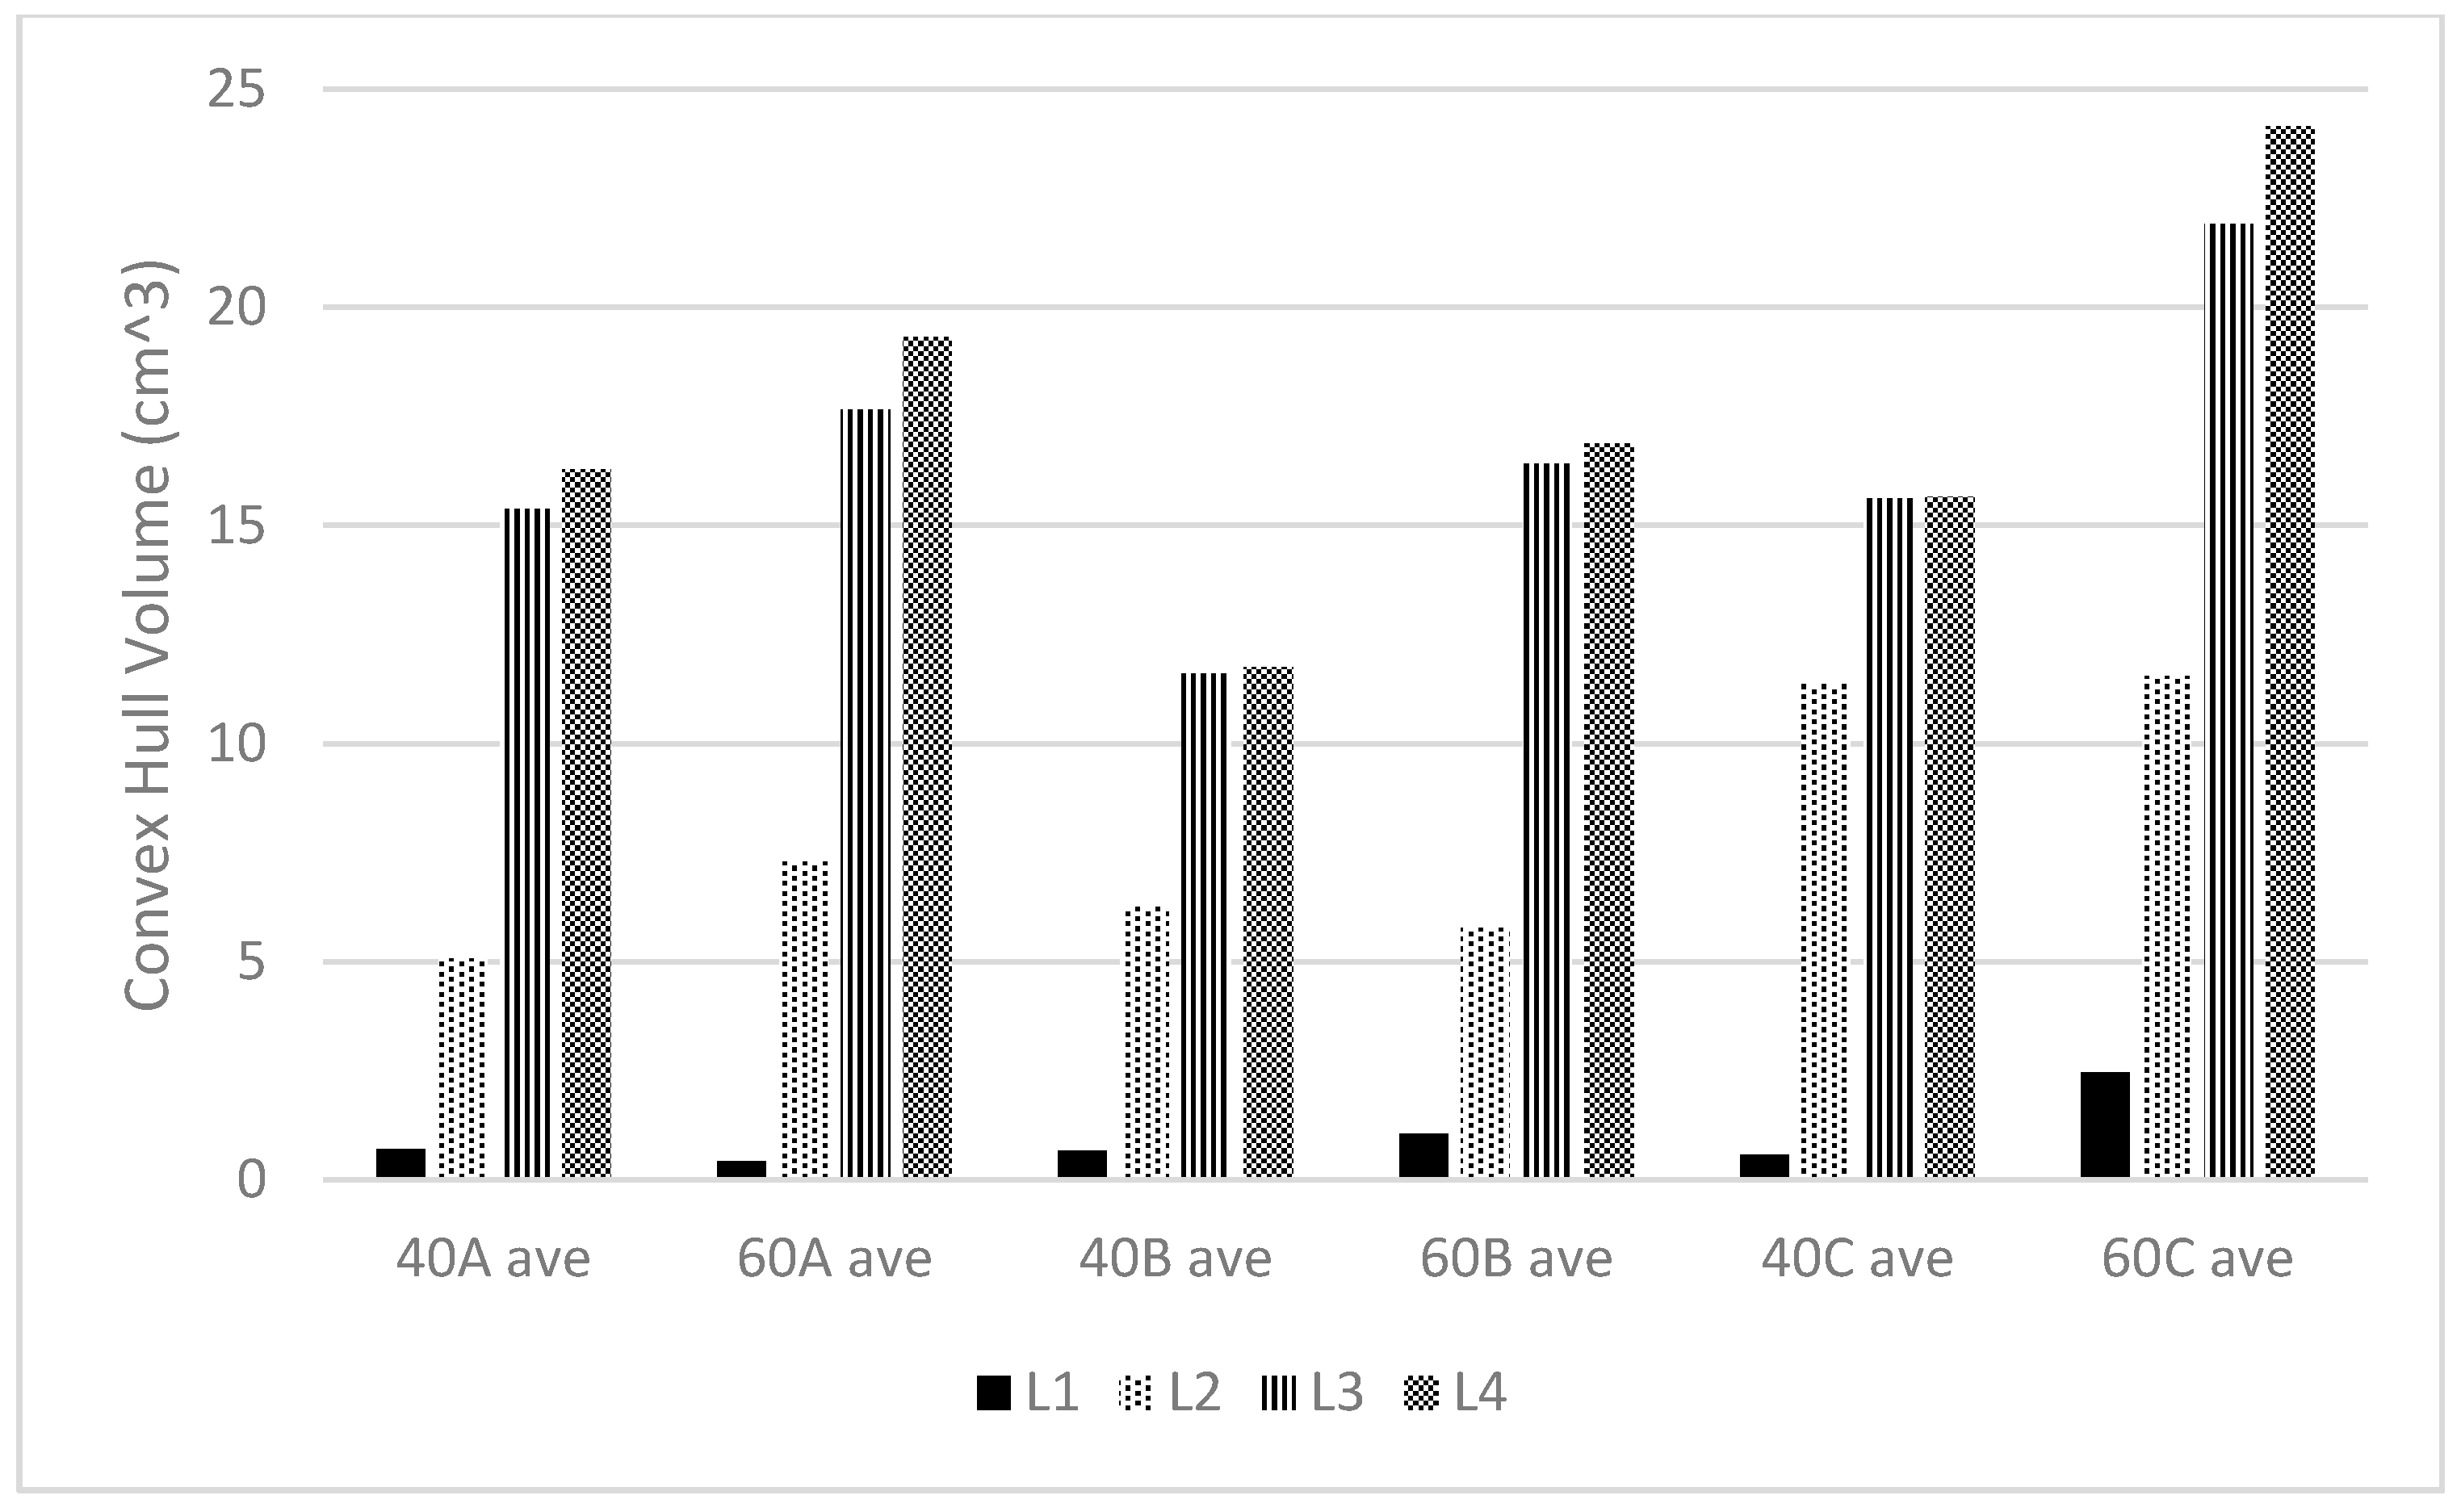
Figure 17.
Ratio of CHV L2/L1, L3/L1, and L4/L3.


Table 1.
Design mix of concrete.
| Maximum Aggregate Size (mm) | Unit Quantity (kg/m3) | ||||
|---|---|---|---|---|---|
| W/C (%) | Cement | Sand | Gravel | Water-Reducing Agent | |
| 20 mm | 40 and 60 | 344 | 761 | 1038 | 0.69 |
© 2018 by the authors. Licensee MDPI, Basel, Switzerland. This article is an open access article distributed under the terms and conditions of the Creative Commons Attribution (CC BY) license (http://creativecommons.org/licenses/by/4.0/).
Share and Cite
MDPI and ACS Style
Ongpeng, J.M.C.; Oreta, A.W.C.; Hirose, S. Monitoring Damage Using Acoustic Emission Source Location and Computational Geometry in Reinforced Concrete Beams. Appl. Sci. 2018, 8, 189. https://doi.org/10.3390/app8020189
AMA Style
Ongpeng JMC, Oreta AWC, Hirose S. Monitoring Damage Using Acoustic Emission Source Location and Computational Geometry in Reinforced Concrete Beams. Applied Sciences. 2018; 8(2):189. https://doi.org/10.3390/app8020189
Chicago/Turabian StyleOngpeng, Jason Maximino C., Andres Winston C. Oreta, and Sohichi Hirose. 2018. "Monitoring Damage Using Acoustic Emission Source Location and Computational Geometry in Reinforced Concrete Beams" Applied Sciences 8, no. 2: 189. https://doi.org/10.3390/app8020189
Note that from the first issue of 2016, this journal uses article numbers instead of page numbers. See further details here.