Article

Effect of HCV Core Antigen and RNA Clearance during Therapy with Direct Acting Antivirals on Hepatic Stiffness Measured with Shear Wave Elastography in Patients with Chronic Viral Hepatitis C

Department of Infectious Diseases and Hepatology, Medical University of Bialystok, 14 Zurawia St; 15-540 Bialystok, Poland
*
Author to whom correspondence should be addressed.
Appl. Sci. 2018, 8(2), 198; https://doi.org/10.3390/app8020198
Submission received: 19 December 2017 / Revised: 26 January 2018 / Accepted: 26 January 2018 / Published: 29 January 2018
(This article belongs to the Special Issue Ultrasound Elastography)

Abstract

:
To assess a combination of novel measures of therapeutic success in the treatment of chronic hepatitis C (CHC) infection, we evaluated liver stiffness (LS) with shear wave elastography and hepatitis C virus core antigen (HCVcAg) concentrations. We followed 34 patients during and after treatment with direct acting antivirals. All patients achieved a sustained virologic and serologic response and a significant increase of albumin levels. Decreases of alanine aminotransferase (ALT) activity and alpha-fetoprotein (AFP) level were observed during the treatment and follow-up period. A significant decrease in LS was observed between baseline, end of treatment (EOT), and at 24- and 96-week post-treatment follow-up. LS decline between EOT and 96-week follow-up (FU96) was observed in 79% of patients. Significant LS changes were seen in patients with advanced fibrosis, particularly in cirrhotics and in patients with ALT exceeding 100 IU/mL. There was a positive correlation between ALT activity and LS changes at the baseline versus FU96. A negative correlation was demonstrated between individual HCVcAg baseline concentrations and reduction of LS at the baseline versus FU96. In conclusion, we observed that LS significantly declined during and after antiviral treatment. It was accompanied by improvement in some liver function measures, and disappearance of both HCVcAg and HCV ribonucleic acid (HCV RNA).

1. Introduction

Prevalence of hepatitis C virus (HCV) infection is currently estimated to be 1%, corresponding to about 70 million viremic people worldwide [1]. HCV infection untreated for many years can lead to serious consequences such as liver cirrhosis, hepatocellular carcinoma (HCC), hepatic decompensation and death.
Currently available treatment with direct-acting antivirals (DAAs) is pangenotypic, safe, easy, and short, and its efficacy is almost 100% [2,3].
Diagnosis of HCV infection currently is based on the presence of antibodies followed by HCV RNA detection. According to recent findings, HCV core antigen (HCVcAg) testing can replace HCV RNA detection [4,5,6]. Its clearance during DAA therapy can predict sustained virologic response (SVR), which is an indicator of HCV clearance [7]. Quantitative HCV RNA is still a gold standard for monitoring anti-viral treatment efficacy. According to the most recent guidelines of the European Association for the Study of the Liver (EASL) the use of HCVcAg was recommended as an alternative marker of treatment efficacy [8]. Since HCVcAg has not been routinely applied for monitoring of treatment efficacy up to now, we decided to use it simultaneously with HCV RNA in our study.
Evaluation of the progression of liver disease is a crucial element of HCV diagnosis, treatment prioritization and its monitoring. Invasiveness, cost and possible side effects of liver biopsy, recognized up to now as a gold standard, have led recently to the rapid development of non-invasive techniques for the evaluation of liver fibrosis [9,10,11,12]. Two major directions in this area are serologic tests, combining a number of laboratory measures with a final calculation of the numeric value and measurement of liver stiffness (LS) with transient elastography (TE) or shear wave elastography (SWE) [13,14]. Major advantages of LS measurement are safety, non-invasiveness, the possibility of testing in real time, repeatability and low cost of examination [15,16,17]. The main weakness of all non-invasive techniques is insufficient differentiation between moderate degrees of fibrosis [18]. However, it is essential to highlight that LS does not represent fibrosis directly; as a matter of fact, the LS value is a resultant of fibrosis, inflammation and blood microcirculation with a possible additional effect of hepatic steatosis or other hepatic conditions, and therefore can serve as an independent measure of liver disease progression [19].
Currently, LS testing is widely used to assess liver disease for possible prioritization of HCV treatment. It can also provide prognostic information during the post-treatment follow-up [20,21]. Some recent studies confirmed higher diagnostic value of SWE compared to TE, and therefore we applied this technique in our practice and in this study [22,23].
Currently, three techniques are available for elastography of the liver: one-dimensional transient elastography, (1D-TE), acoustic radiation force impulse (ARFI) that include point shear wave elastography (pSWE), and real-time two-dimensional shear wave elastography (2D-SWE). Depending on the method used, the shear wave measurement takes place perpendicular to the plane of excitation (pSWE; 2D-SWE) or parallel to excitation (1D-TE). In 1D-TE, the mechanical vibrator exerts a controlled vibrating external “blow” on the surface of the body, which create shear waves which propagate through the examined tissue. After that, the same probe measures the velocity of the shear wave and, after transformation, we get a measurement of stiffness. In pSWE, acoustic radiation force impulse is used to induce tissue movement in the normal direction in a single focal location, but tissue transposition is not measured itself. Longitudinal waves are converted to shear waves through the absorption of acoustic energy; then, the speed of these waves is measured and transformed to quantify tissue elasticity. In the case of 2D SWE, multiple focal zones are examined in rapid series, forming cylindrical shear wave cone and allowing real-time monitoring of shear waves. After transformation, we get color, quantitative elastogram applied to a B-mode image. pSWE and 2D-SWE can be performed using a conventional ultrasound machine in contrast to 1D-TE [24].
Since both HCVcAg and SWE can be considered novel measures of therapeutic success and possible predictors of further outcome of liver disease, we assessed the association between HCVcAg clearance and LS in CHC patients treated with DAAs.

2. Materials and Methods

2.1. Patients

Thirty-four patients with chronic hepatitis C infection were included in the study. All patients were Caucasians: 12 females and 22 males with a median age of 50 (IQR 41.5-58.5). The most common HCV genotype was 1b—demonstrated in 29 (88%) patients, which is consistent with the epidemiological situation in the region of the study [25]. Nineteen (58%) patients had experienced previous interferon-based therapy and 15 (46%) had liver cirrhosis. More details of baseline patients’ characteristics are presented in Table 1. HCV infection was confirmed in all patients according to a common diagnostic algorithm (presence of serum anti-HCV antibody and HCV RNA). Patients with HIV (human immunodeficiency virus) or HBV (hepatitis B virus) co-infection, pregnant or planning pregnancy females, patients with decompensated liver disease (Child-Pugh C class) or with contraindications to planned treatment were excluded from the study.
The study protocol was approved by the Ethics Committee and written informed consent was obtained from each patient before the start of the study.

2.2. Treatment Regimens

Twenty-four patients were treated with fixed doses of ombitasvir/paritaprevir/ritonavir possibly combined with dasabuvir and ribavirin (OBV/PRV/r ± DSV ± RBV) and ten patients with ledipasvir/sofosbuvir (LDV/SOF) according to product characteristics, EASL and national guidelines [26]. Selection of the medication for a particular patient was based on the physician’s judgment.

2.3. Study Design

Blood samples for HCV RNA, HCVcAg and laboratory measures of hepatic function were collected during the treatment and follow-up period at the baseline, end of treatment (EOT), and follow-up 24 weeks (FU24) and 96 weeks (FU96) after treatment termination. Sustained virologic response (SVR) was defined as undetectable serum HCV RNA 24 weeks after treatment termination, and sustained serologic response (SSR) was defined as HCVcAg undetectability.

2.4. HCV RNA and HCVcAg Measurement

Blood samples were collected in EDTA (ethylenediaminetetraacetic acid) containing tubes and plasma was separated. Plasma samples for HCV RNA and HCVcAg measurements were stored at −70 °C until the time of testing. Serum HCV RNA quantitative levels were determined by a Roche COBAS AmpliPrep HCV test (Roche Molecular System, Pleasanton, CA, USA) with level of quantification 15 IU/mL, and level of detection 11 IU/mL. For quantification of serum HCV core antigen (HCVcAg) samples were tested with the fully automated Architect HCVcAg assay (Abbott Diagnostics, Chicago, IL, USA) according to the manufacturer’s recommendations. Concentration of HCVcAg was expressed in femtomoles (fmol/L) per liter (1.0 fmol/L = 0.02 pg/mL). According to the manufacturer, the detection cut-off for a negative value was 3.0 fmol/L, the gray zone was 3–10 fmol/L and the upper detection limit was 180,000 fmol/L. HCV genotype was determined by direct sequencing of the PCR (polymerase chain reaction) product using genotype-specific primers.

2.5. Other Laboratory Measures

Several laboratory measures of hepatic function, including activity of alanine aminotransferase (ALT) and alkaline phosphatase (ALP), concentrations of bilirubin, albumins, alpha-fetoprotein (AFP), creatinine, international normalized ratio (INR), as well as hemoglobin level (Hb) and platelet count (PLT), were analyzed at the baseline, during the treatment and at follow-up visits. Child–Pugh and MELD (model of end-stage liver disease) scores were calculated based on clinical and laboratory measures.

2.6. Liver Stiffness

LS was measured with non-invasive, real-time, quantitative shear wave elastography (2D-SWE) using AIXPLORER equipment (Super Sonic Imagine, Aix-en-Provence, France), with a convex broadband probe (SC6-1) [27,28]. Measurement was carried out according to the protocol provided by the manufacturer. During one SWE examination, three to five successive measurements were taken and the mean expressed in kPa (kilopascal) was documented as the final result. LS values were additionally expressed in the METAVIR scale corresponding to histologic fibrosis according to the manufacturer’s recommendations, as follows F0/1: <7.1 kPa, F2: 7.1–8.6 kPa, F3: 8.7–10.3 kPa, F4: >10.4 kPa.

2.7. Statistical Analysis

Statistical analysis was performed with Statistica 10 (StatSoft, Cracow, Poland). Patients’ data are presented as the number and percentage, median and interquartile range (IQR). Correlations were analyzed with Spearman’s rank correlation coefficient. The normality of the distribution was assessed by the D’Agostino–Pearson test and Shapiro–Wilk test. Differences between groups were assessed by Wilcoxon’s signed rank test, the unpaired T-test, and in the case of three or more groups by repeated-measures ANOVA. Differences were considered significant at p values below 0.05.

3. Results

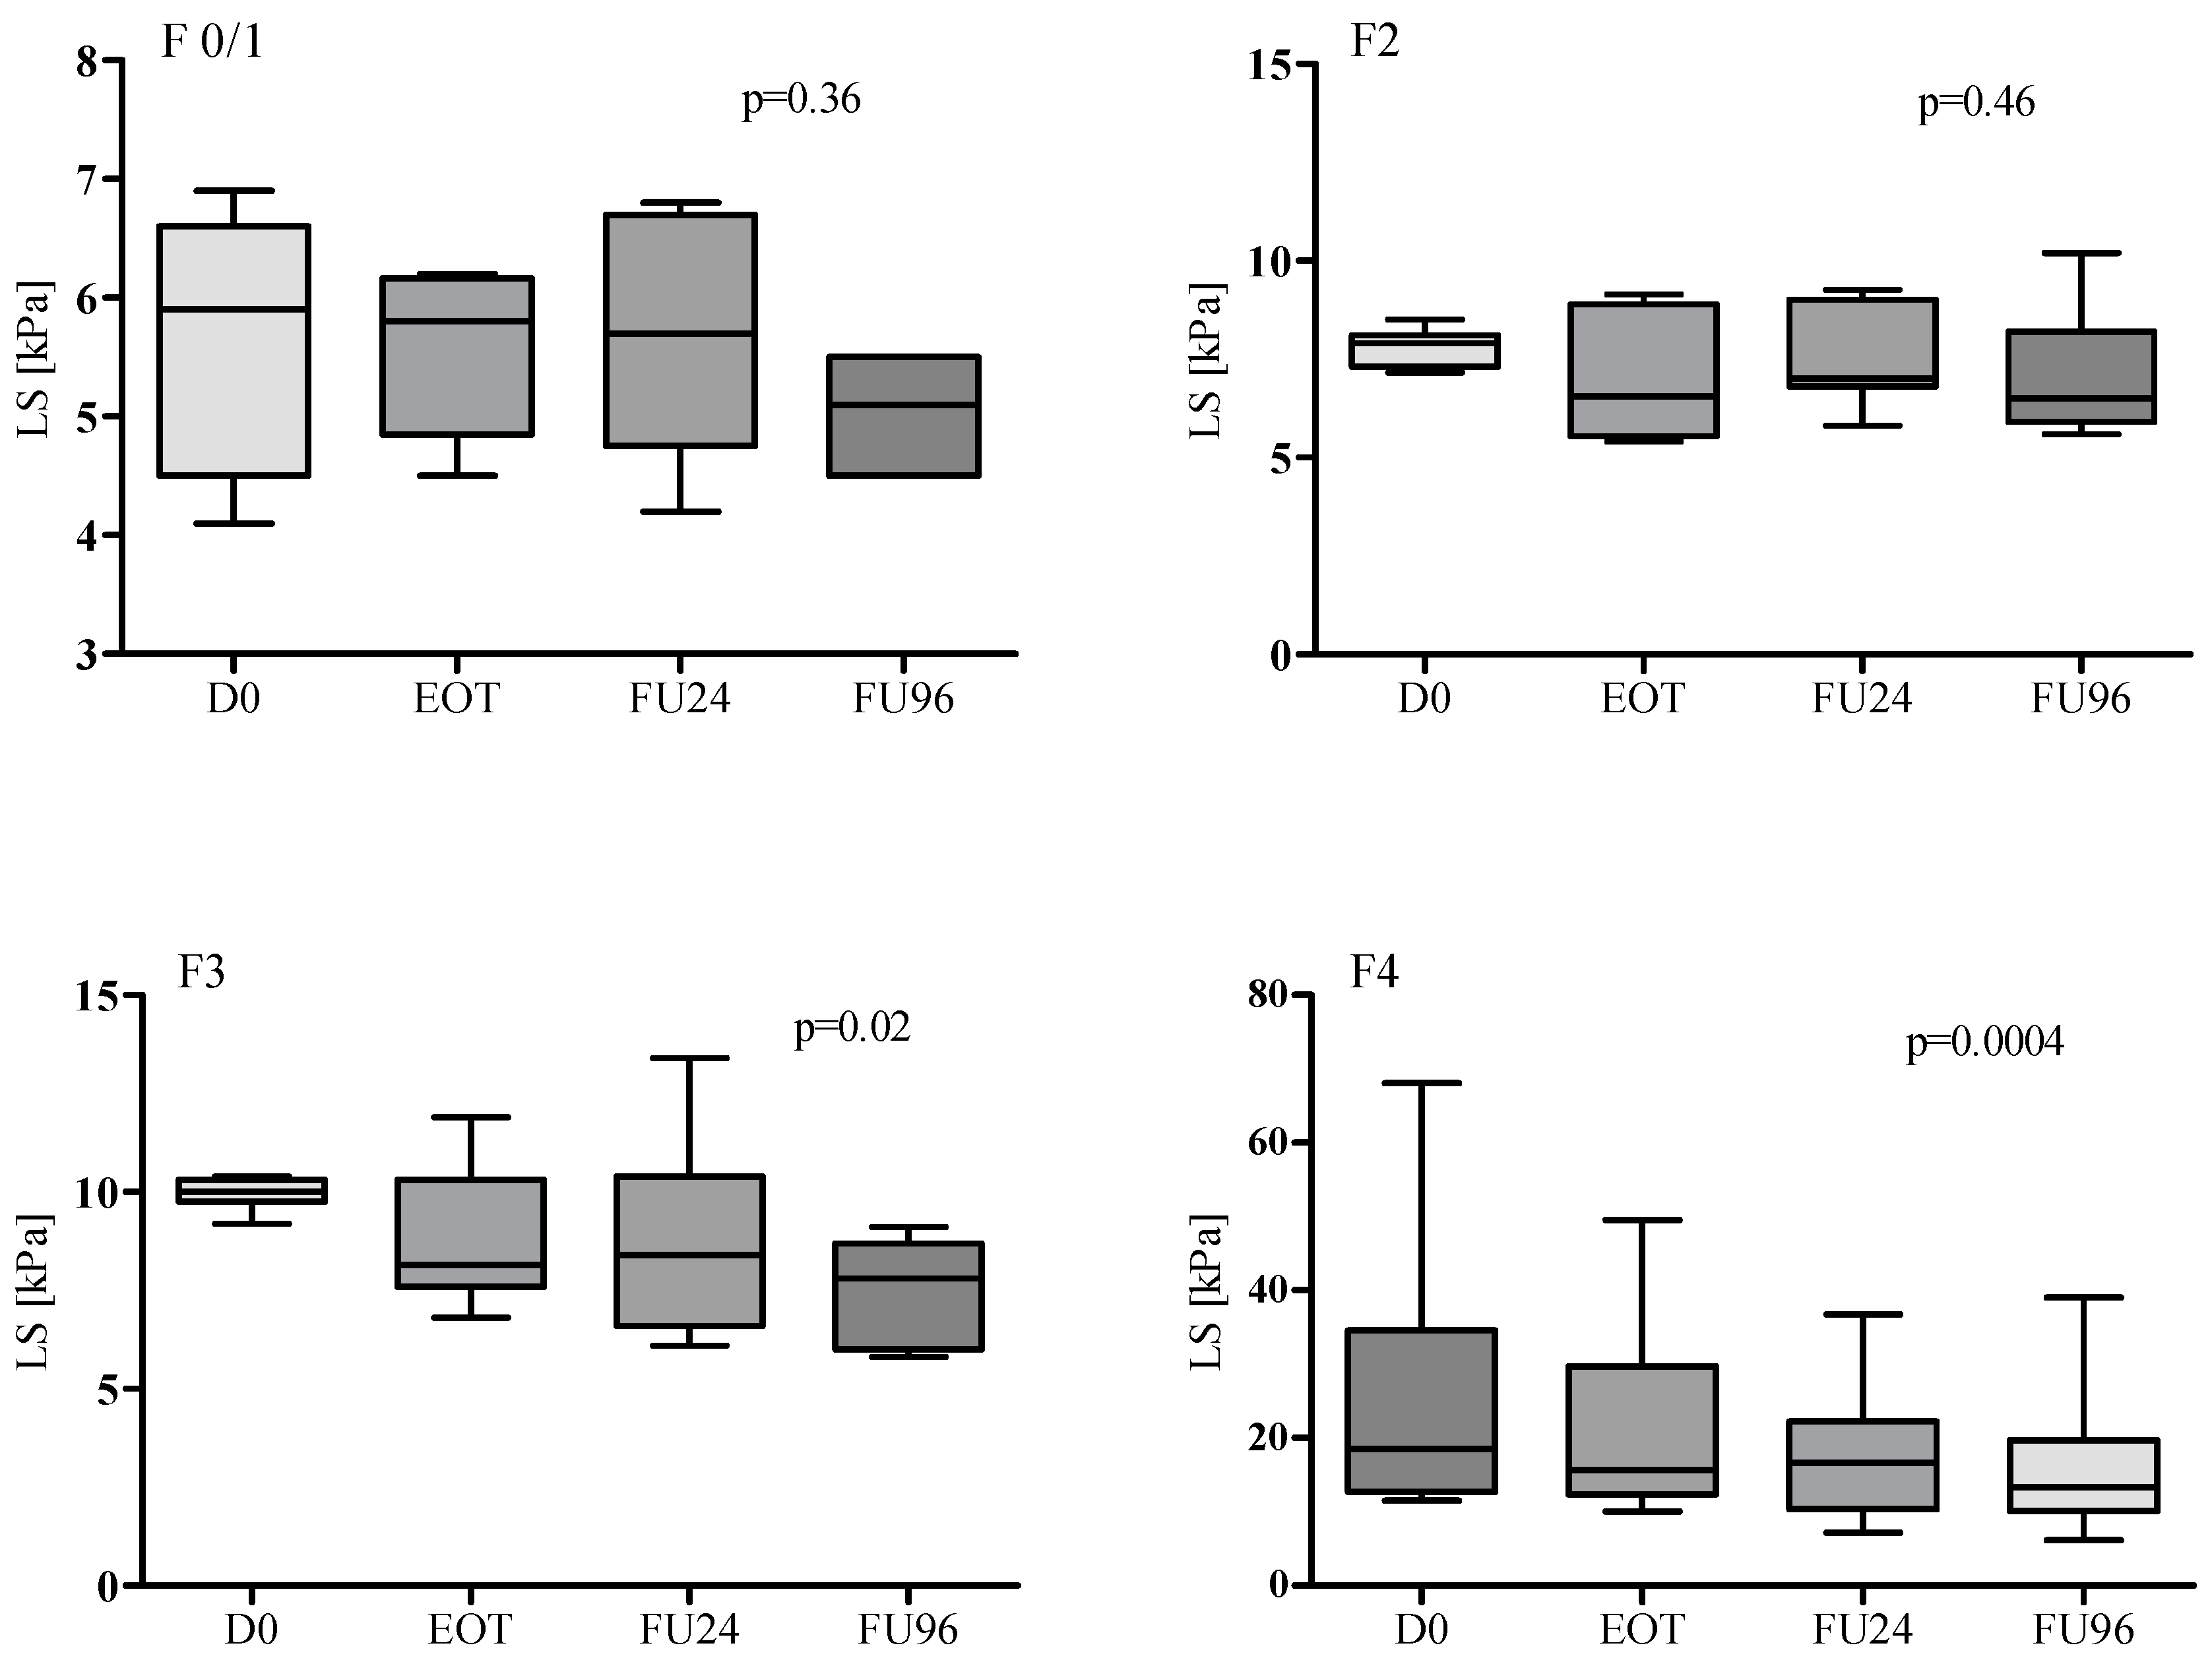
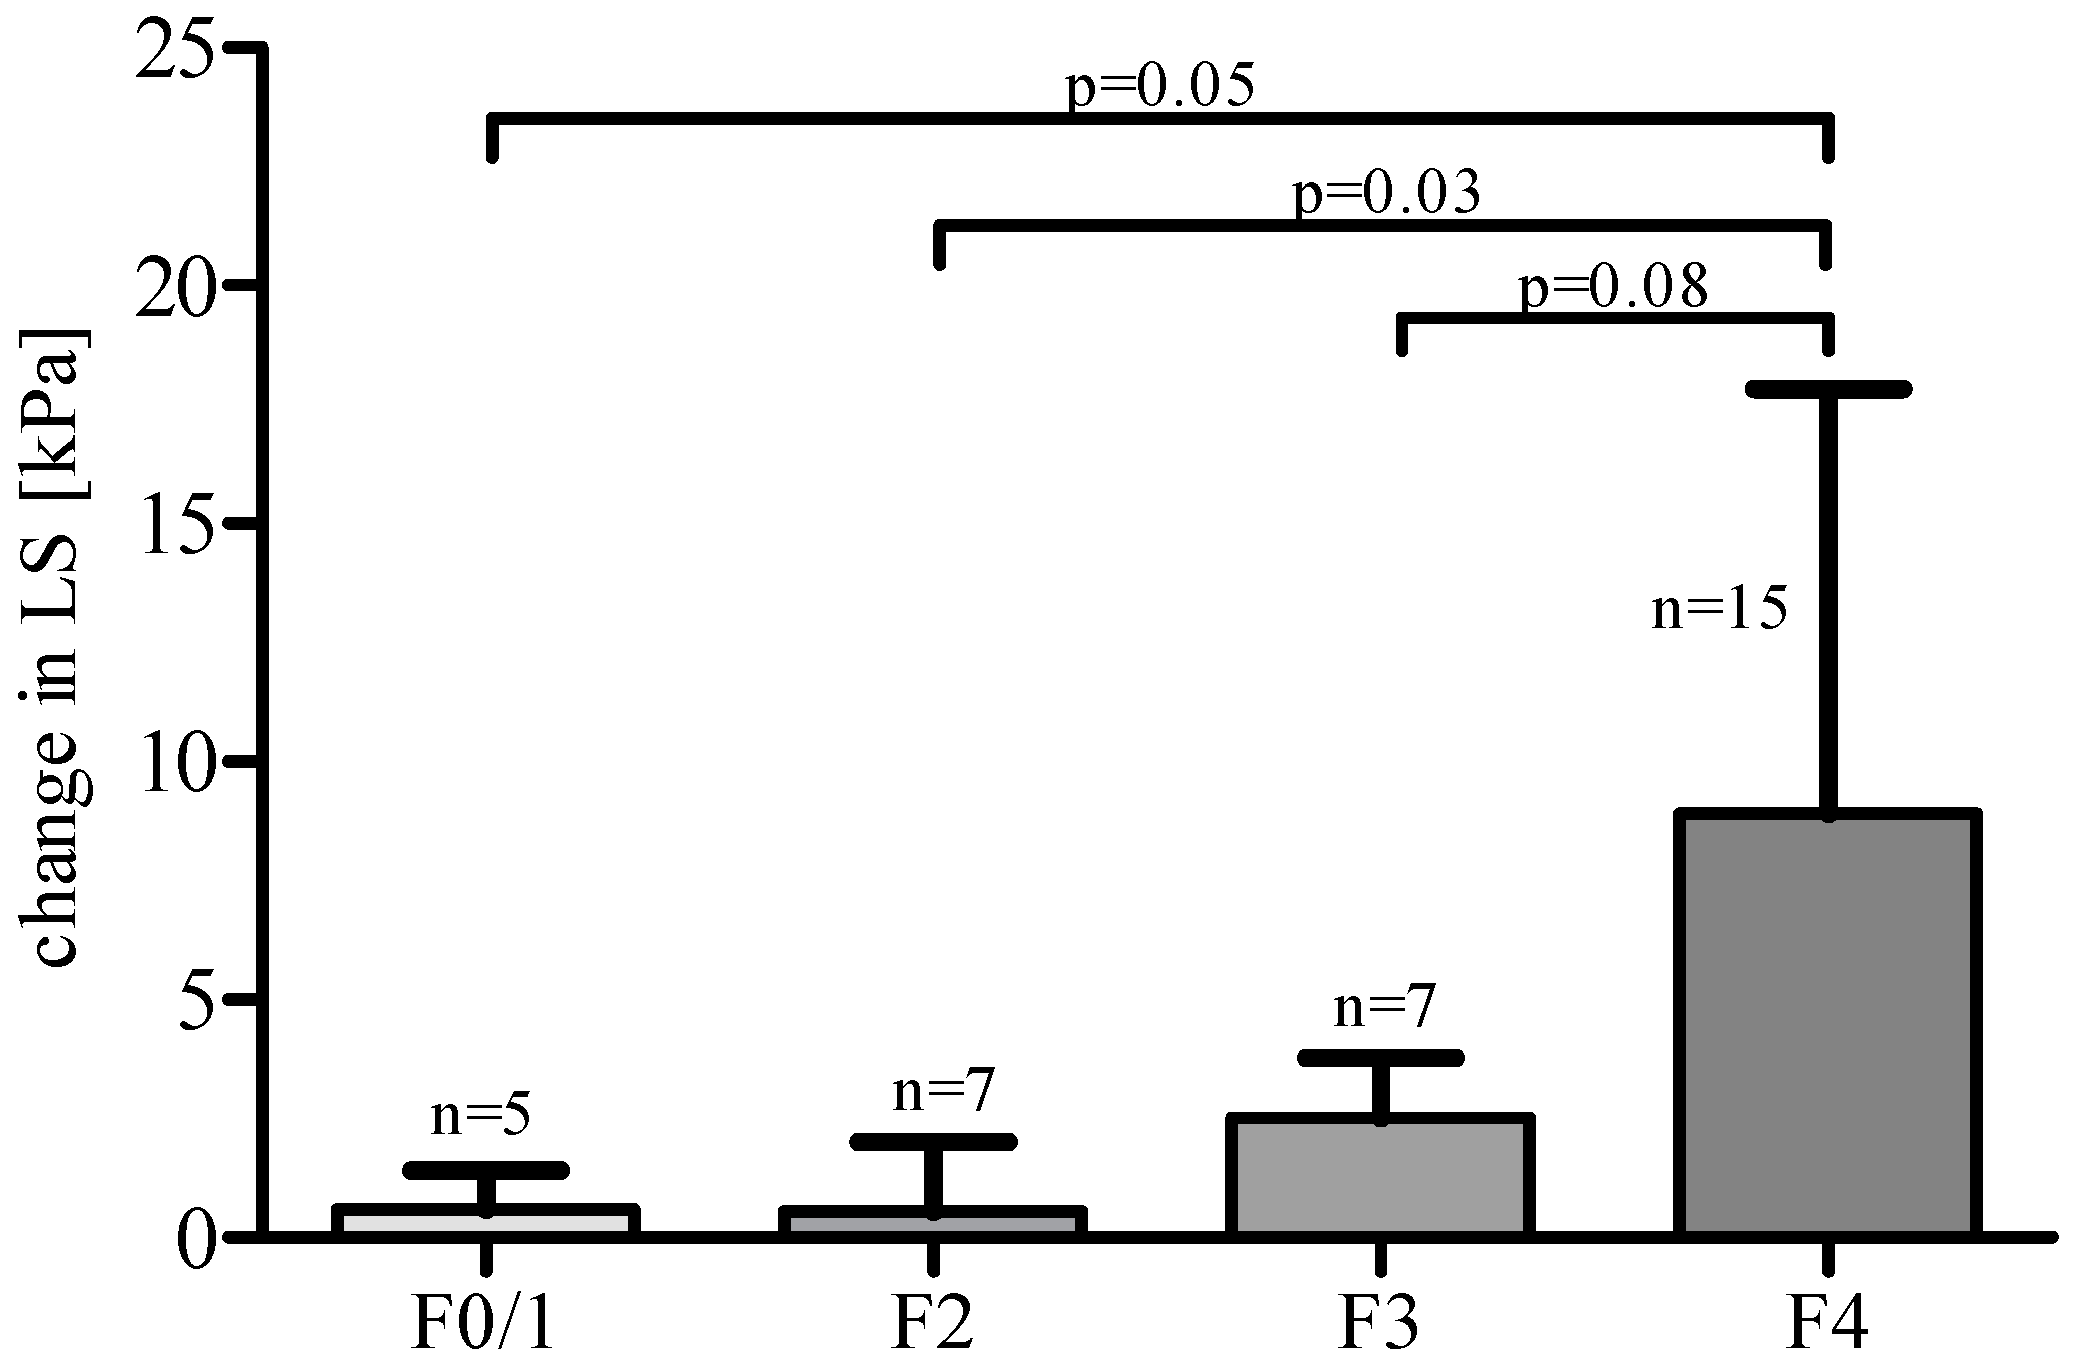
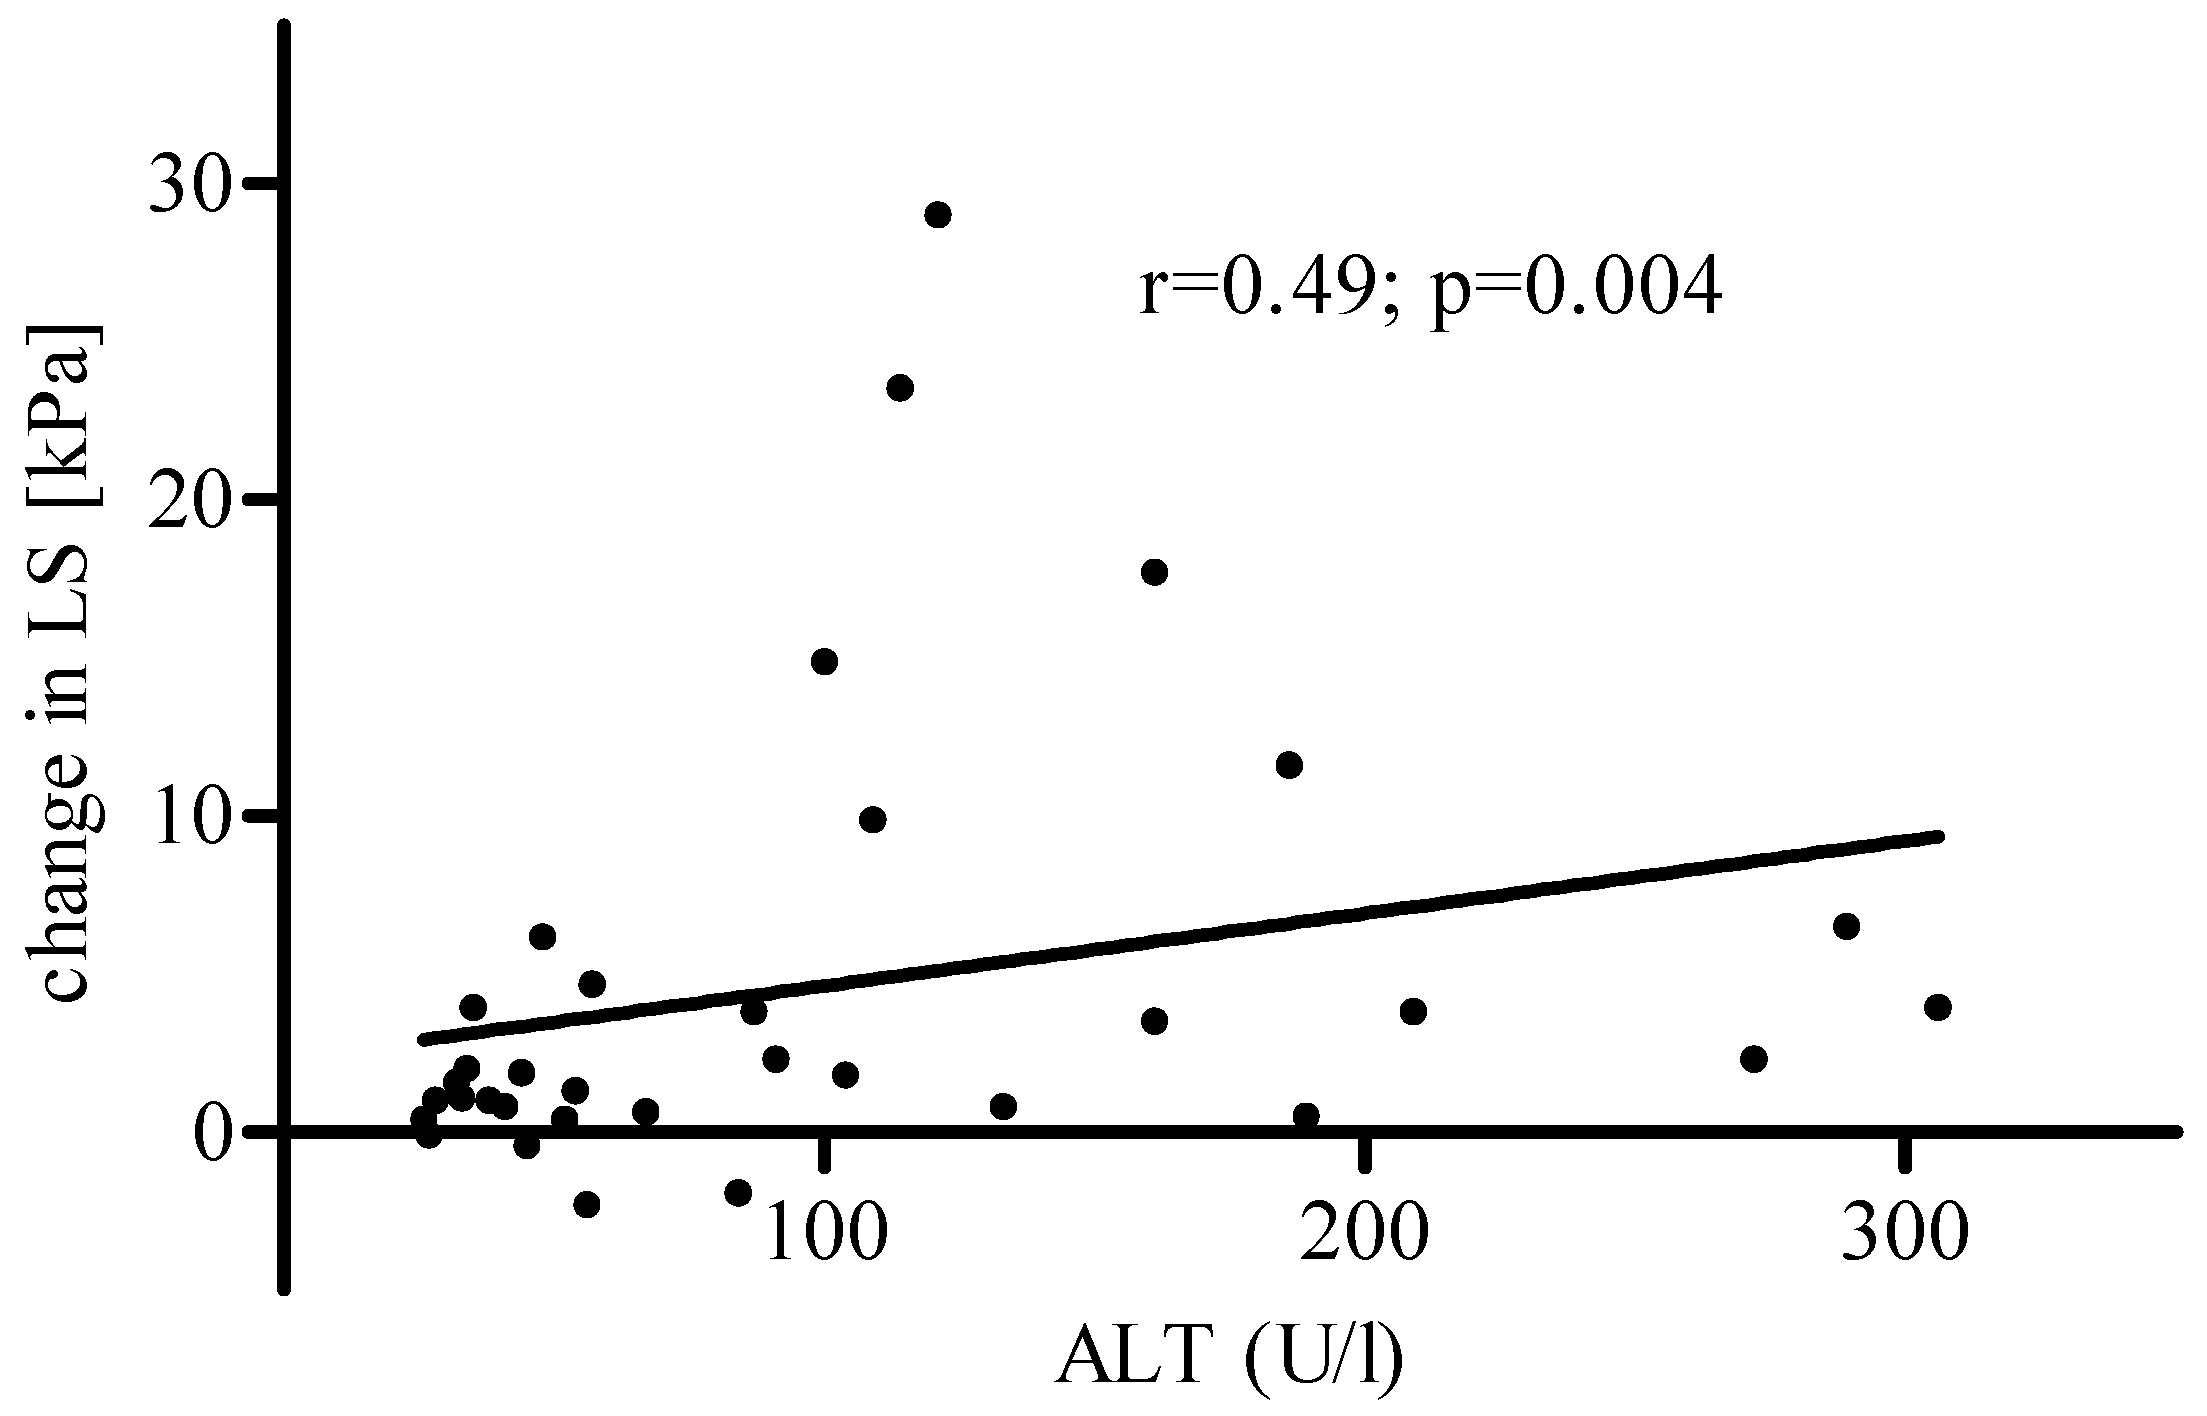
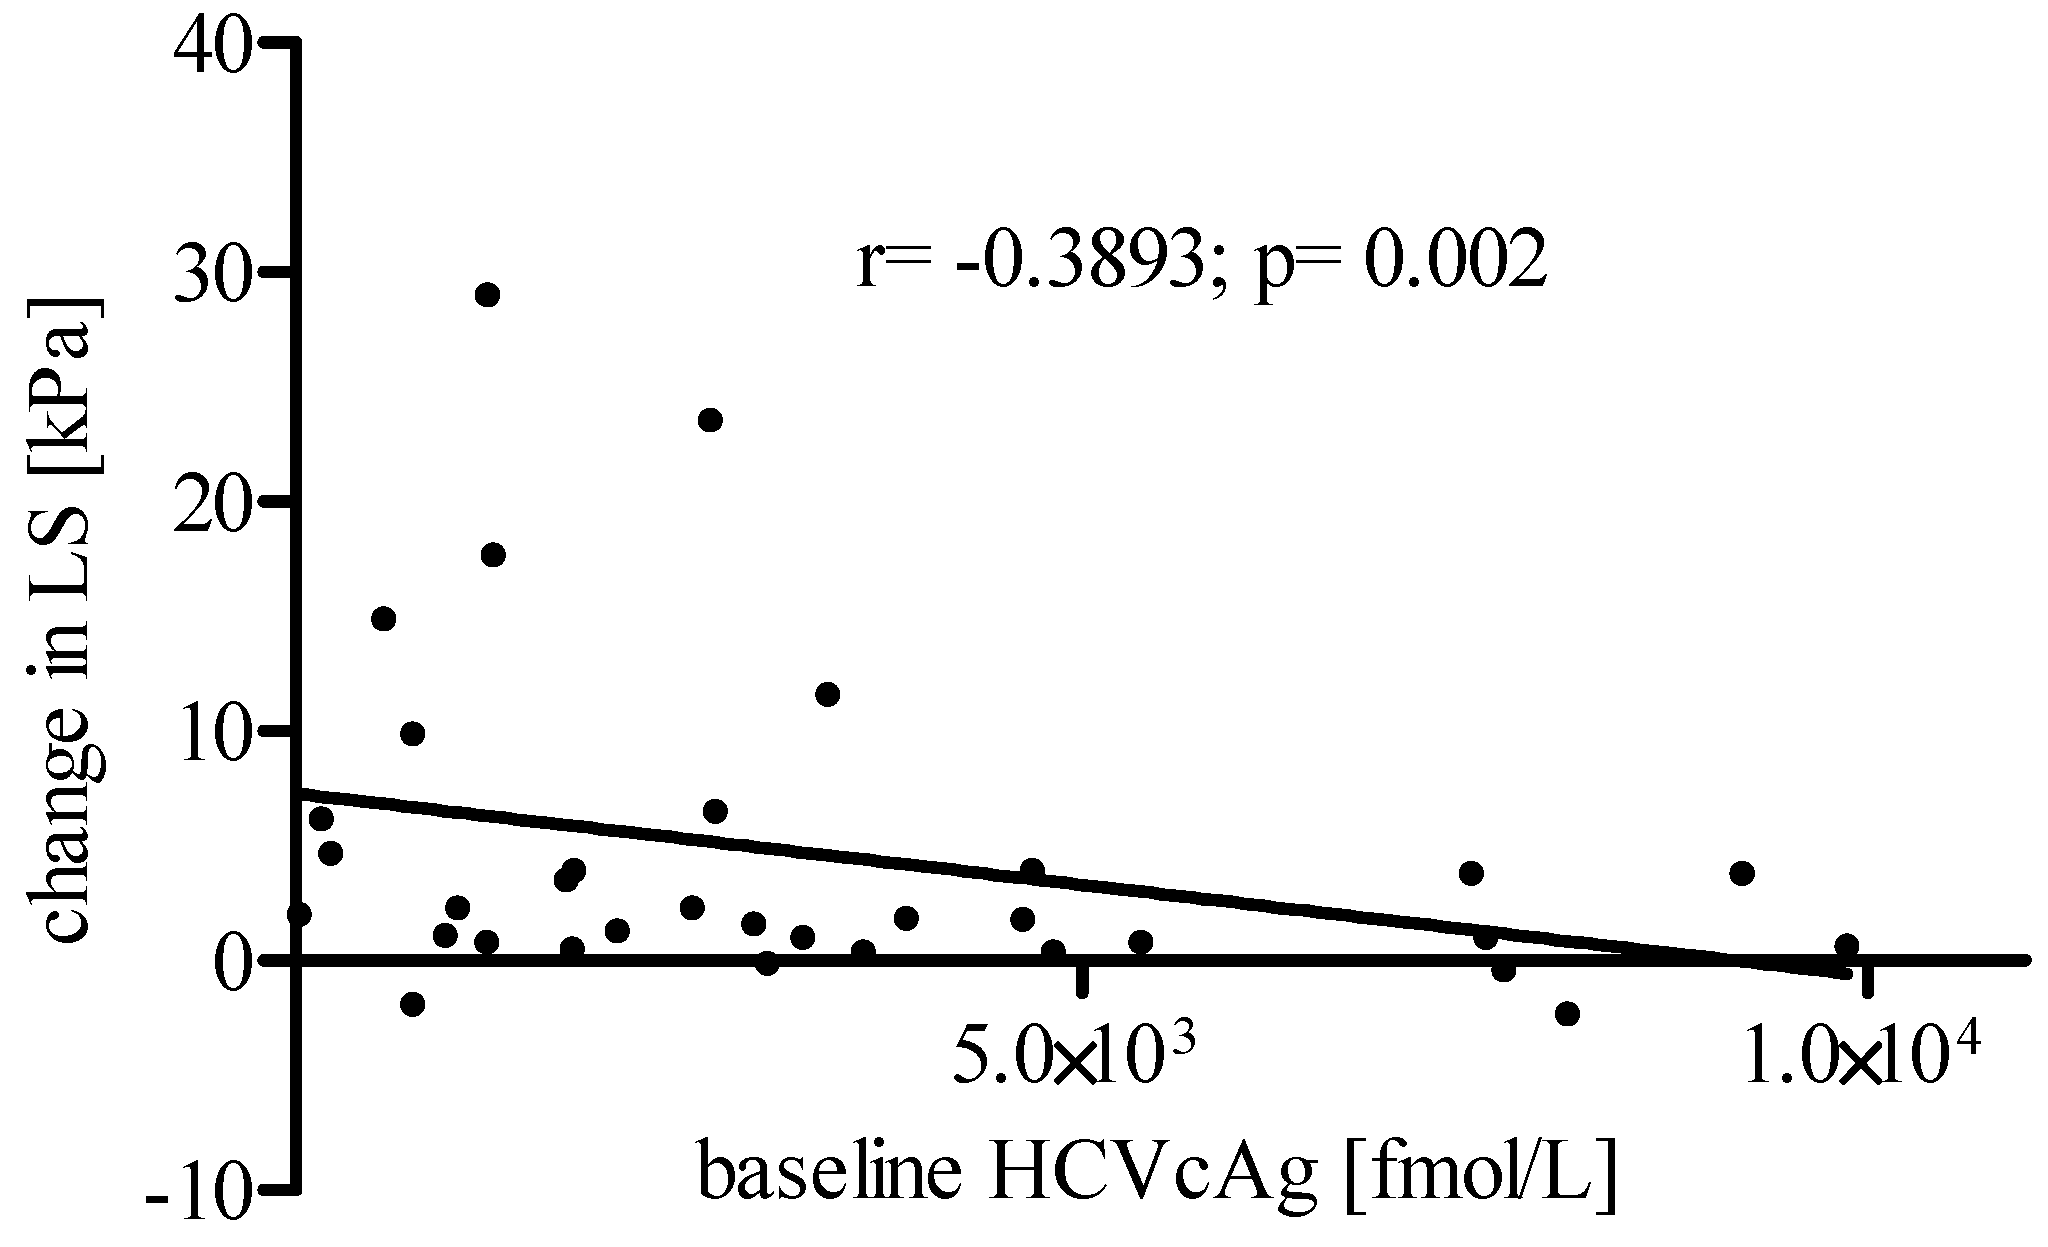
The baseline LS measured in all patients was 14.9 ± 13.2 kPa, and varied from 4.1 to 68.0 kPa. It was significantly (p = 0.003) higher in treatment experienced (median 12.6 kPa; IQR 10.1–20.7), than in treatment naïve patients (median 7.9 kPa; IQR 6.6–9.2). According to the METAVIR score, 15 patients (44%) were classified as F4, 7 (21%) F3, 7 (21%) F2 and 5 (15%) F0/1. All patients achieved SVR and SSR. As shown in Table 2, a statistically significant increase of albumin levels, and a decrease of ALT activity and AFP level were observed during the treatment and follow-up period. A statistically significant decrease in LS was observed between baseline and all following time points after treatment termination (Table 3). Moreover, significant differences were also noted between EOT and FU96, as well as between FU24 and FU96. As shown in Figure 1, a decrease in LS between EOT and FU96 was observed in 27 (79%) patients. In analysis based on baseline fibrosis stage, statistically significant changes in LS were seen in patients with advanced fibrosis of F3 and F4 only (Figure 2), and the LS decline was significantly bigger in cirrhotics compared to patients with less advanced disease (Figure 3). LS reduction between baseline and FU96 was significantly (p = 0.047) bigger in experienced (median 3.5 kPa; IQR 1.2–8.1), compared to treatment naïve patients (median 0.8 kPa; IQR 0.2–3). The decrease in LS was also significantly (p = 0.0006) bigger in patients with ALT exceeding 100 IU/mL (9.27 ± 9.01 kPa) than in those with lower ALT activities (1.42 ± 2.06 kPa). There was also a positive correlation between ALT activity and change in LS at baseline versus FU96 (r = 0.49; p = 0.004) (Figure 4). As shown in Figure 5, a statistically significant negative correlation (r = −0.3893; p = 0.002) was also demonstrated between individual HCVcAg baseline concentrations and reduction of LS values at baseline versus FU96.

4. Discussion

The first descriptions of the elastography technique come from the mid-1990s [29,30]. Since then, in laboratories around the world, there has been a rapid development of this method, adding new quality to the imaging studies used so far. This technique, in a way that is easy to perform and interpret, allows one to define the “hardness” of the tissue. In a sense, it can be said that this method replaces a physical examination performed inside the human body, differentiating tissues that are healthy or pathologically changed according to their “hardness” [29]. This method is non-invasive and not time-consuming, as compared to a liver biopsy, and it is therefore easy to repeat frequently. There are some limitations in which the severity of liver inflammation and portal hypertension are the main influence on the results [31,32,33,34].
Currently, the measurement of liver stiffness is recommended by many hepatologic scientific societies as a method to determine the severity of liver disease before and after HCV treatment [8,26].
In our study, all patients had an elastographic examination performed at predetermined time points, showing a total reduction in stiffness in the vast majority of patients. This observation has already been made in earlier studies [35,36,37,38,39]. In our cohort, the range of changes in kPa was −4.2 to 41.8 kPa between baseline and FU24, 2.3 kPa to 29 kPa between baseline and FU96, and −2.6 to 18.7 between EOT and FU96.
According to the results of some previous studies, we have demonstrated that patients undergoing effective HCV treatment lower their LS values during follow-up (in FU24 by 1.1 kPa) and long-term observation (in FU96 by 2 kPa) in relation to baseline. In the Arima et al. study, patients treated with pegylated interferon (pegIFN) and RBV were followed, observing a mean LS drop by 5.3 (4.1–6.3) kPa in two-year follow-up [37]. However, in the Hezode et al. study, the median decrease compared to baseline at the end of follow-up was 3.4 kPa, vs. 1.8 kPa in the patients who did not achieve an SVR [38]. Due to the 100% effectiveness of treatment in our cohort, we were unable to determine such a relationship. In the ANRS CO13 HEPAVIH Cohort study, patients with HIV/HCV co-therapy remaining on two- or three-drug therapy (pegINF plus RBV with or without protease inhibitor) were investigated [39]. It was observed that achieving SVR is an independent predictor of obtaining an LS decrease. For LS evaluation, the transient elastography method was used in the studies described above and, according our knowledge, there are insufficient trials in which the SWE method was used in patients with antiviral treatment. In the Tada et al. study, the results of 210 patients treated with daclatasvir and asunaprevir were analyzed, and it was found that the average LS decreased by 1.4 kPa between baseline and EOT and 2.6 kPa between baseline and FU24, which is consistent with our results [40]. It should be noted that the type of DAA regimen used made no difference.
We also found that a significant decrease in LS occurred during both periods, antiviral therapy (between baseline and EOT p = 0.008) and in the long-term follow-up (between EOT and FU96 p = 0.0002; between FU24 and FU96 p = 0.005) as well. In the previously mentioned Arima et al. study and the Chekuri et al. study, no further decrease in LS was observed after treatment in long-term follow-up—no change between in LS between 1 and 2 years of follow-up [35,37]. Conversely, in the Tada et al. study, as mentioned above, an LS decrease was also observed 24 weeks after therapy completion [40]. In the Taachi et al. trial in patients undergoing simeprevir combined with pegINF and RBV, similar results were obtained (after FU24 LS decreased by 14%) using the acoustic radiation force impulse elastography technique [41]. It can be hypothesized that the differences were influenced by the applied treatment (pegINF vs non-interferon therapies) and the method used to measure LS. The effect on the above results in our study may be due to the relatively high percentage of patients with liver cirrhosis, as well.
In our study, statistically significant changes in LS were observed in patients with more advanced liver fibrosis at F3 and F4 (p = 0.02 and 0.0004 respectively). Higher levels of liver stiffness before treatment and greater LS reduction after treatment in treatment experienced patients was related to more advanced disease in this population compared to treatment naïve. In previous studies, in patients treated with pegIFN in whom fibrosis was evaluated by liver biopsy, fibrotic regression was observed in long-term observation [42,43,44,45]. In these studies, fibrosis declined by 29–82% depending on the time of observation (from 1.6 to 5.2 years). In the Arima et al. study it was found that in 76% of patients who had F3–F4 fibrosis by liver biopsy prior to treatment, deduced fibrosis was reduced by 2 points in the fibrotic scale, and 46% of these patients had a reduction in fibrosis to F0–F1 (measured LS after treatment) [37]. It can be assumed that the LS changes not only illustrate the decline of the inflammatory process in the liver but also the regression of fibrosis and the LS measurement can visualize it in a faster way than the liver biopsy.
In previous studies, it has already been confirmed that as a result of antiviral treatment, there is an improvement in some parameters that assess liver function. In the Miyaki et al. study, they found that in patients who achieved SVR, a reduction in the AFP level, ALT activity, and platelet count were observed [46]. In a larger group of patients, in a more detailed analysis, this observation was confirmed by Tada et al. [40]. In our group of patients, we found improvement in albumin and ALT levels. However, the level of platelets did not change significantly, which is in contrast to some of the previous studies [35,40]. Probably due to the transient hyperbilirubinemia associated with the treatment (OMB/PRV/rtv ± DSV ± RBV), a statistically significant decrease in the level of bilirubin between baseline and FU24 and FU96 was observed. A similar decrease in bilirubin was observed by Deterding et al. [47]. One of the limitations of elastography is the effect on aminotransferase activity, or severity of inflammation. In our study we found that patients with advanced inflammation and ALT above 100 U/L had a statistically greater LS change between baseline and FU96, which is consistent with previous studies [40,47,48]. We also found, similarly to Chekuri et al., a positive correlation between the size of LS change and ALT activity between baseline and FU96 [35].
HCV is a well-known viral carcinogen, causing a high risk of HCC development in the infected liver. A well-established marker of this type of cancer is AFP. In our study, the elevated level of AFP at baseline indicates in most patients the presence of inflammation and necrotic processes in the liver and the accompanying processes of parenchymal reconstruction related to advanced fibrosis. During the follow-up at the end of treatment there was a statistically significant decrease in AFP concentration compared to baseline during EOT from −0.96 to 88.35 ng/dL, and during FU24 from −2.26 to 89.31 ng/dL. It should be noted that the concentration of AFP stabilized in the period between FU24 and FU96.
We did not find any statistically significant differences in the BMI index. In various studies, the results are ambiguous. Chekuri et al. observed a statistically significant increase in BMI, while in the study by Patton et al. there was no such relationship [35,49]. Chekuri et al. as the reason for the increase in BMI suggested hypermetabolism related to reduction of HCV associated inflammation, but this finding requires further studies.
To the best of our knowledge, this is the first study to evaluate the correlation between HCV core antigen and changes in liver stiffness during anti-viral treatment. The main advantage of HCVcAg is its excellent correlation with HCV RNA accompanied by much lower costs [50,51,52]. In our previous study baseline HCVcAg concentration correlated with HCV RNA level, its on-treatment decline was faster, and it predicted a virologic response [7].
In our study, all patients achieved an SSR, i.e., HCVcAg was undetectable at the end of treatment and this effect was maintained during a six-month follow-up. We also found a statistically significant negative correlation between changes in LS between baseline and FU96 and baseline HCVcAg. Considering that the level of LS changes depends on the severity of inflammation (ALT), a lower concentration of HCVcAg may allow an increased inflammatory response and therefore changes in LS are bigger. However, the importance of this correlation requires further research on a larger group of patients.
The advantage of our study is its prospective nature, its innovation in the assessment of changes in liver stiffness and the applied treatment based on DAA regimens. Additionally, for the first time, we analyzed the impact of HCVcAg changes on liver stiffness during antiviral treatment.
One of the most important limitations of our work is the relatively small group of patients and the lack of comparative results of liver biopsies through which a more detailed analysis could be carried out, but it could be currently questionable from the ethical point of view due to the availability of non-invasive methods of liver evaluation. Moreover, due to excellent antiviral efficacy of DAA therapy, we were not able to compare LS dynamics in responders and non-responders.

5. Conclusions

We demonstrated that liver stiffness measured with shear wave elastography significantly declined during and after treatment of chronic hepatitis C infection with direct acting antivirals. It was accompanied by improvement in some liver function measures, and the disappearance of both HCV core antigen and RNA.

Acknowledgments

This study was partially funded by a grant from Medical University of Bialystok in Poland, grant number N/ST/ZB/15/001/1156 (153-56 834L). Covering the costs to publish in open access was funded by foundation “Medycyna Podróży” Bialystok, Poland.

Author Contributions

Both authors contributed to the article equally.

Conflicts of Interest

Mariusz Łucejko has served as a speaker Gilead, Merck. Robert Flisiak has served as a speaker and an advisory board member for AbbVie, Gilead, Janssen, Merck and Roche.

References

  1. Blach, S.; Zeuzem, S.; Manns, M. Polaris Observatory HCV Collaborators. Global prevalence and genotype distribution of hepatitis C virus infection in 2015: A modelling study. Lancet Gastroenterol. Hepatol. 2017, 2, 161–176. [Google Scholar] [CrossRef]
  2. Alkhouri, N.; Lawitz, E.; Poordad, F. Novel treatments for chronic hepatitis C: Closing the remaining gaps. Curr. Opin. Pharmacol. 2017, 37, 107–111. [Google Scholar] [CrossRef] [PubMed]
  3. Morgan, J.R.; Servidone, M.; Easterbrook, P.; Linas, B.P. Economic evaluation of HCV testing approaches in low and middle income countries. BMC Infect. Dis. 2017, 17 (Suppl. 1), 697. [Google Scholar] [CrossRef] [PubMed]
  4. Jülicher, P.; Galli, C. Identifying cost-effective screening algorithms for active hepatitis C virus infections in a high prevalence setting. J. Med. Econ. 2017, 7, 1–10. [Google Scholar] [CrossRef] [PubMed]
  5. Hullegie, S.J.; GeurtsvanKessel, C.H.; Van der Eijk, A.A.; Ramakers, C.; Rijnders, B.J.A. HCV antigen instead of RNA testing to diagnose acute HCV in patients treated in the Dutch Acute HCV in HIV Study. J. Int. AIDS 2017, 20, 21621. [Google Scholar] [CrossRef] [PubMed]
  6. Duchesne, L.; Njouom, R.; Lissock, F.; Tamko-Mella, G.F.; Rallier, S.; Poiteau, L.; Soulier, A.; Chevaliez, S.; Vernet, G.; Rouveau, N.; et al. HCV Ag quantification as a one-step procedure in diagnosing chronic hepatitis C infection in Cameroon: The ANRS 12336 study. J. Int. AIDS Soc. 2017, 20, 21446. [Google Scholar] [CrossRef] [PubMed]
  7. Łucejko, M.; Flisiak, R. Quantitative measurement of HCV core antigen for management of interferon-free therapy in HCV infected patients. Antivir. Ther. 2017. [Google Scholar] [CrossRef] [PubMed]
  8. European Association for the Study of the Liver. Recommendations on Treatment of Hepatitis C 2016. J. Hepatol. 2017, 66, 153–194. [Google Scholar] [CrossRef]
  9. Bravo, A.A.; Sheth, S.G.; Chopra, S. Liver biopsy. N. Engl. J. Med. 2001, 344, 495–500. [Google Scholar] [CrossRef] [PubMed]
  10. The French METAVIR Cooperative Study Group. Intraobserver and interobserver variations in liver biopsy interpretation in patients with chronic hepatitis C. Hepatology 1994, 20, 15–20. [Google Scholar]
  11. Bedossa, P.; Dargere, D.; Paradis, V. Sampling variability of liver fibrosis in chronic hepatitis C. Hepatology 2003, 38, 1449–1457. [Google Scholar] [CrossRef] [PubMed]
  12. Piccinino, F.; Sagnelli, E.; Pasquale, G.; Giusti, G. Complications following percutaneous liver biopsy. A multicentre retrospective study on 68,276 biopsies. J. Hepatol. 1986, 2, 165–173. [Google Scholar] [CrossRef]
  13. Friedrich-Rust, M.; Poynard, T.; Castera, L. Critical comparison of elastography methods to assess chronic liver disease. Nat. Rev. Gastroenterol. Hepatol. 2016, 13, 402–411. [Google Scholar] [CrossRef] [PubMed]
  14. Castera, L.; Chan, H.L.Y.; Arrese, M.; The Clinical Practice Guideline Panel. EASL-ALEH clinical practice guidelines: Noninvasive tests for evaluation of liver disease severity and prognosis. J. Hepatol. 2015, 63, 237–264. [Google Scholar]
  15. Sandrin, L.; Fourquet, B.; Hasquenoph, J.M. Transient elastography: A new noninvasive method for assessment of hepatic fibrosis. Ultrasound Med. Biol. 2003, 29, 1705–1713. [Google Scholar] [CrossRef] [PubMed]
  16. Bercoff, J.; Tanter, M.; Fink, M. Supersonic shear imaging: A new technique for soft tissue elasticity mapping. IEEE Trans. Ultrason. Ferroelectr. Freq. Control 2004, 51, 396–409. [Google Scholar] [CrossRef] [PubMed]
  17. Bavu, E.; Gennisson, J.-L.; Couade, M.; Bercoff, J.; Mallet, V.; Fink, M.; Badel, A.; Vallet-Pichard, A.; Nalpas, B.; Tanter, M.; et al. Noninvasive in vivo liver fibrosis evaluation using supersonic shear imaging: A clinical study on 113 hepatitis C virus patients. Ultrasound Med. Biol. 2011, 37, 1361–1373. [Google Scholar] [CrossRef] [PubMed]
  18. Tsochatzis, E.A.; Gurusamy, K.S.; Ntaoula, S.; Cholongitas, E.; Davidson, B.R.; Burroughs, A.K. Elastography for the diagnosis of severity of fibrosis in chronic liver disease: A meta-analysis of diagnostic accuracy. J. Hepatol. 2011, 54, 650–659. [Google Scholar] [CrossRef] [PubMed]
  19. Deffieux, T.; Gennisson, J.L.; Bousquet, L.; Corouge, M.; Cosconea, S.; Amroun, D.; Tripon, S.; Terris, B.; Mallet, V.; Sogni, P.; et al. Investigating liver stiffness and viscosity for fibrosis, steatosis and activity staging using shear wave elastography. J. Hepatol. 2015, 62, 317–324. [Google Scholar] [CrossRef] [PubMed]
  20. Ogasawara, N.; Kobayashi, M.; Akuta, N.; Kominami, Y.; Fujiyama, S.; Kawamura, Y.; Sezaki, H.; Hosaka, T.; Suzuki, F.; Saitoh, S.; et al. Serial changes in liver stiffness and controlled attenuation parameter following direct-acting antiviral therapy against hepatitis C virus genotype 1b. J. Med. Virol. 2018, 90, 313–331. [Google Scholar] [CrossRef] [PubMed]
  21. Elsharkawy, A.; Alem, S.A.; Fouad, R.; El Raziky, M.; El Akel, W.; Abdo, M.; Tantawi, O.; AbdAllah, M.; Bourliere, M.; Esmat, G. Changes in liver stiffness measurements and fibrosis scores following sofosbuvir based treatment regimens without interferon. J. Gastroenterol. Hepatol. 2017, 32, 1624–1630. [Google Scholar] [CrossRef] [PubMed]
  22. Cassinotto, C.; Lapuyade, B.; Mouries, A.; Hiriart, J.B.; Vergniol, J.; Gaye, D.; Castain, C.; Le Bail, B.; Chermak, F.; Foucher, J.; et al. Non-invasive assessment of liver fibrosis with impulse elastography: Comparison of supersonic shear imaging with ARFI and FibroScanVR. J. Hepatol. 2014, 61, 550–557. [Google Scholar] [CrossRef] [PubMed]
  23. Guibal, A.; Renosi, G.; Rode, A.; Scoazec, J.Y.; Guillaud, O.; Chardon, L.; Munteanu, M.; Dumortier, J.; Collin, F.; Lefort, T.; et al. Shear wave elastography: An accurate technique to stage liver fibrosis in chronic liver diseases. Diagn. Interv. Imaging 2016, 97, 91–99. [Google Scholar] [CrossRef] [PubMed]
  24. Sigrist, R.M.S.; Liau, J.; Kaffas, A.E.; Chammas, M.C.; Willmann, J.K. Ultrasound Elastography: Review of Techniques and Clinical Applications. Theranostics 2017, 7, 1303–1329. [Google Scholar] [CrossRef] [PubMed]
  25. Flisiak, R.; Pogorzelska, J.; Berak, H.; Horban, A.; Orłowska, I.; Simon, K.; Tuchendler, E.; Madej, G.; Piekarska, A.; Jabłkowski, M.; et al. Prevalence of HCV genotypes in Poland—The EpiTer study. Clin. Exp. Hepatol. 2016, 2, 144–148. [Google Scholar] [CrossRef] [PubMed]
  26. Polish Group of HCV Experts; Halota, W.; Flisiak, R.; Boroń-Kaczmarska, A.; Juszczyk, J.; Małkowski, P.; Pawłowska, M.; Simon, K.; Tomasiewicz, K. Recommendations for the treatment of hepatitis C issued by the Polish Group of HCV Experts—2016. Clin. Exp. Hepatol. 2016, 2, 27–33. [Google Scholar] [CrossRef] [PubMed]
  27. Ferraioli, G.; Tinelli, C.; Dal Bello, B.; Zicchetti, M.; Filice, G.; Filice, C. Liver Fibrosis Study Group. Accuracy of real-time shear wave elastography for assessing liver fibrosis in chronic hepatitis C: A pilot study. Hepatology 2012, 56, 2125–2133. [Google Scholar] [CrossRef] [PubMed]
  28. Muller, M.; Gennisson, J.-L.; Deffieux, T.; Tanter, M.; Fink, M. Quantitative viscoelasticity mapping of human liver using supersonic shear imaging: Preliminary in vivo feasibility study. Ultrasound Med. Biol. 2009, 35, 219–229. [Google Scholar] [CrossRef] [PubMed]
  29. Sarvazyan, A.P. A new approach to remote ultrasonic evaluation of viscoelastic properties of tissues for diagnostics and healing monitoring. In Proceedings of the ARPA/ONR Medical Ultrasonic Imaging Technology Workshop, Landsdowne, VA, USA, 24–26 January 1995. [Google Scholar]
  30. Rudenko, O.V.; Sarvazyan, A.P.; Emelianov, S.Y. Acoustic radiation force and streaming induced by focused nonlinear ultrasound in a dissipative medium. J. Acoust. Soc. Am. 1996, 99, 2791–2798. [Google Scholar] [CrossRef]
  31. Poynard, T.; Pham, T.; Perazzo, H.; Munteanu, M.; Luckina, E.; Elaribi, D.; Ngo, Y.; Bonyhay, L.; Seurat, N.; Legroux, M.; et al. Real-Time Shear Wave versus Transient Elastography for Predicting Fibrosis: Applicability, and Impact of Inflammation and Steatosis. A Non-Invasive Comparison. PLoS ONE 2016, 11, e0163276. [Google Scholar] [CrossRef] [PubMed]
  32. Yoon, K.T.; Lim, S.M.; Park, J.Y.; Kim, D.Y.; Ahn, S.H.; Han, K.H.; Chon, C.Y.; Cho, M.; Lee, J.W.; Kim, S.U. Liver stiffness measurement using acoustic radiation force impulse (ARFI) elastography and effect of necroinflammation. Dig. Dis. Sci. 2012, 57, 1682–1691. [Google Scholar] [CrossRef] [PubMed]
  33. Arena, U.; Vizzutti, F.; Corti, G.; Ambu, S.; Stasi, C.; Bresci, S.; Moscarella, S.; Boddi, V.; Petrarca, A.; Laffi, G.; et al. Acute viral hepatitis increases liver stiffness values measured by transient elastography. Hepatology 2008, 47, 380–384. [Google Scholar] [CrossRef] [PubMed]
  34. Coco, B.; Oliveri, F.; Maina, A.M.; Ciccorossi, P.; Sacco, R.; Colombatto, P.; Bonino, F.; Brunetto, M.R. Transient elastography: A new surrogate marker of liver fibrosis influenced by major changes of transaminases. J. Viral Hepat. 2007, 14, 360–369. [Google Scholar] [CrossRef] [PubMed]
  35. Chekuri, S.; Nickerson, J.; Bichoupan, K.; Sefcik, R.; Doobay, K.; Chang, S.; DelBello, D.; Harty, A.; Dieterich, D.T.; Perumalswami, P.V.; et al. Liver Stiffness Decreases Rapidly in Response to Successful Hepatitis C Treatment and Then Plateaus. PLoS ONE 2016, 11, e0159413. [Google Scholar] [CrossRef] [PubMed]
  36. Wang, J.H.; Changchien, C.S.; Hung, C.H.; Tung, W.C.; Kee, K.M.; Chen, C.H.; Hu, T.H.; Lee, C.M.; Lu, S.N. Liver stiffness decrease after effective antiviral therapy in patients with chronic hepatitis C: Longitudinal study using FibroScan. J. Gastroenterol. Hepatol. 2010, 25, 964–969. [Google Scholar] [CrossRef] [PubMed]
  37. Arima, Y.; Kawabe, N.; Hashimoto, S.; Harata, M.; Nitta, Y.; Murao, M.; Nakano, T.; Shimazaki, H.; Kobayashi, K.; Ichino, N.; et al. Reduction of liver stiffness by interferon treatment in the patients with chronic hepatitis, C. Hepatol. Res. 2010, 40, 383–392. [Google Scholar] [CrossRef] [PubMed]
  38. Hezode, C.; Castera, L.; Roudot-Thoraval, F.; Bouvier-Alias, M.; Rosa, I.; Roulot, D.; Leroy, V.; Mallat, A.; Pawlotsky, J.M. Liver stiffness diminishes with antiviral response in chronic hepatitis, C. Aliment. Pharmacol. Ther. 2011, 34, 656–663. [Google Scholar] [CrossRef] [PubMed] [Green Version]
  39. ANRS CO13 HEPAVIH Cohort. Regression of liver stiffness after sustained hepatitis C virus (HCV) virological responses among HIV/HCV—Coinfected patients. Aids 2015, 29, 1821–1830. [Google Scholar] [CrossRef]
  40. Tada, T.; Kumada, T.; Toyoda, H.; Mizuno, K.; Sone, Y.; Kataoka, S.; Hashinokuchi, S. Improvement of liver stiffness in patients with hepatitis C virus infection who received direct-acting antiviral therapy and achieved sustained virological response. J. Gastroenterol. Hepatol. 2017, 32, 198–1988. [Google Scholar] [CrossRef] [PubMed]
  41. Tachi, Y.; Hirai, T.; Kojima, Y.; Ishizu, Y.; Honda, T.; Kuzuya, T.; Hayashi, K.; Ishigami, M.; Goto, H. Liver stiffness reduction correlates with histological characteristics of hepatitis C patients with sustained virological response. Liver Int. 2017. [Google Scholar] [CrossRef] [PubMed]
  42. Shiratori, Y.; Imazeki, F.; Moriyama, M.; Yano, M.; Arakawa, Y.; Yokosuka, O.; Kuroki, T.; Nishiguchi, S.; Sata, M.; Yamada, G.; et al. Histologic improvement of fibrosis in patients with hepatitis C who have sustained response to interferon therapy. Ann. Intern. Med. 2000, 132, 517–524. [Google Scholar] [CrossRef] [PubMed]
  43. Veldt, B.J.; Saracco, G.; Boyer, N.; Cammà, C.; Bellobuono, A.; Hopf, U.; Castillo, I.; Weiland, O.; Nevens, F.; Hansen, B.E.; et al. Long term clinical outcome of chronic hepatitis C patients with sustained virological response to interferon monotherapy. Gut 2004, 53, 1504–1508. [Google Scholar] [CrossRef] [PubMed]
  44. Toccaceli, F.; Laghi, V.; Capurso, L.; Koch, M.; Sereno, S.; Scuderi, M. Long-term liver histology improvement in patients with chronic hepatitis C and sustained response to interferon. J. Viral Hepat. 2003, 10, 126–133. [Google Scholar] [CrossRef] [PubMed]
  45. George, S.L.; Bacon, B.R.; Brunt, E.M.; Mihindukulasuriya, K.L.; Hoffmann, J.; Di Bisceglie, A.M. Clinical, virologic, histologic, and biochemical outcomes after successful HCV therapy: A 5-year follow-up of 150 patients. Hepatology 2009, 49, 729–738. [Google Scholar] [CrossRef] [PubMed]
  46. Miyaki, E.; Imamura, M.; Hiraga, N.; Murakami, E.; Kawaoka, T.; Tsuge, M.; Hiramatsu, A.; Kawakami, Y.; Aikata, H.; Hayes, C.N.; et al. Daclatasvir and asunaprevir treatment improves liver function parameters and reduces liver fibrosis markers in chronic hepatitis C patients. Hepatol. Res. 2016, 46, 758–764. [Google Scholar] [CrossRef] [PubMed]
  47. Deterding, K.; Honer Zu Siederdissen, C.; Port, K.; Solbach, P.; Sollik, L.; Kirschner, J.; Mix, C.; Cornberg, J.; Worzala, D.; Mix, H.; et al. Improvement of liver function parameters in advanced HCV-associated liver cirrhosis by IFN-free antiviral therapies. Aliment. Pharmacol. Ther. 2015, 42, 889–901. [Google Scholar] [CrossRef] [PubMed]
  48. Tachi, Y.; Hirai, T.; Ishizu, Y.; Honda, T.; Kuzuya, T.; Hayashi, K.; Ishigami, M.; Goto, H. α-fetoprotein levels after interferon therapy predict regression of liver fibrosis in patients with sustained virological response. J. Gastroenterol. Hepatol. 2016, 31, 1001–1008. [Google Scholar] [CrossRef] [PubMed]
  49. Patton, H.M.; Patel, K.; Behling, C.; Bylund, D.; Blatt, L.M.; Vallee, M.; Heaton, S.; Conrad, A.; Pockros, P.J.; McHutchison, J.G.; et al. The impact of steatosis on disease progression and early and sustained treatment response in chronic hepatitis C patients. J. Hepatol. 2004, 40, 484–490. [Google Scholar] [CrossRef] [PubMed]
  50. Aoyagi, K.; Ohue, C.; Iida, K.; Kimura, T.; Tanaka, E.; Kiyosawa, K.; Yagi, S. Development of a simple and highly sensitive enzyme immunoassay for hepatitis C virus core antigen. J. Clin. Microbiol. 1999, 37, 1802–1808. [Google Scholar] [PubMed]
  51. Mederacke, I.; Potthoff, A.; Meyer-Olson, D.; Meier, M.; Raupach, R.; Manns, M.P.; Wedemeyer, H.; Tillmann, H.L. HCV core antigen testing in HIV- and HBV-coinfected patients, and in HCV-infected patients on hemodialysis. J. Clin. Virol. 2012, 53, 110–115. [Google Scholar] [CrossRef] [PubMed]
  52. Łucejko, M.; Grzeszczuk, A.; Jaroszewicz, J.; Flisiak, R. Serum HCV core antigen concentration in HCV monoinfection and HCV/HIV coinfection. Pol. Merkur. Lekarski 2013, 35, 72–76. [Google Scholar] [PubMed]
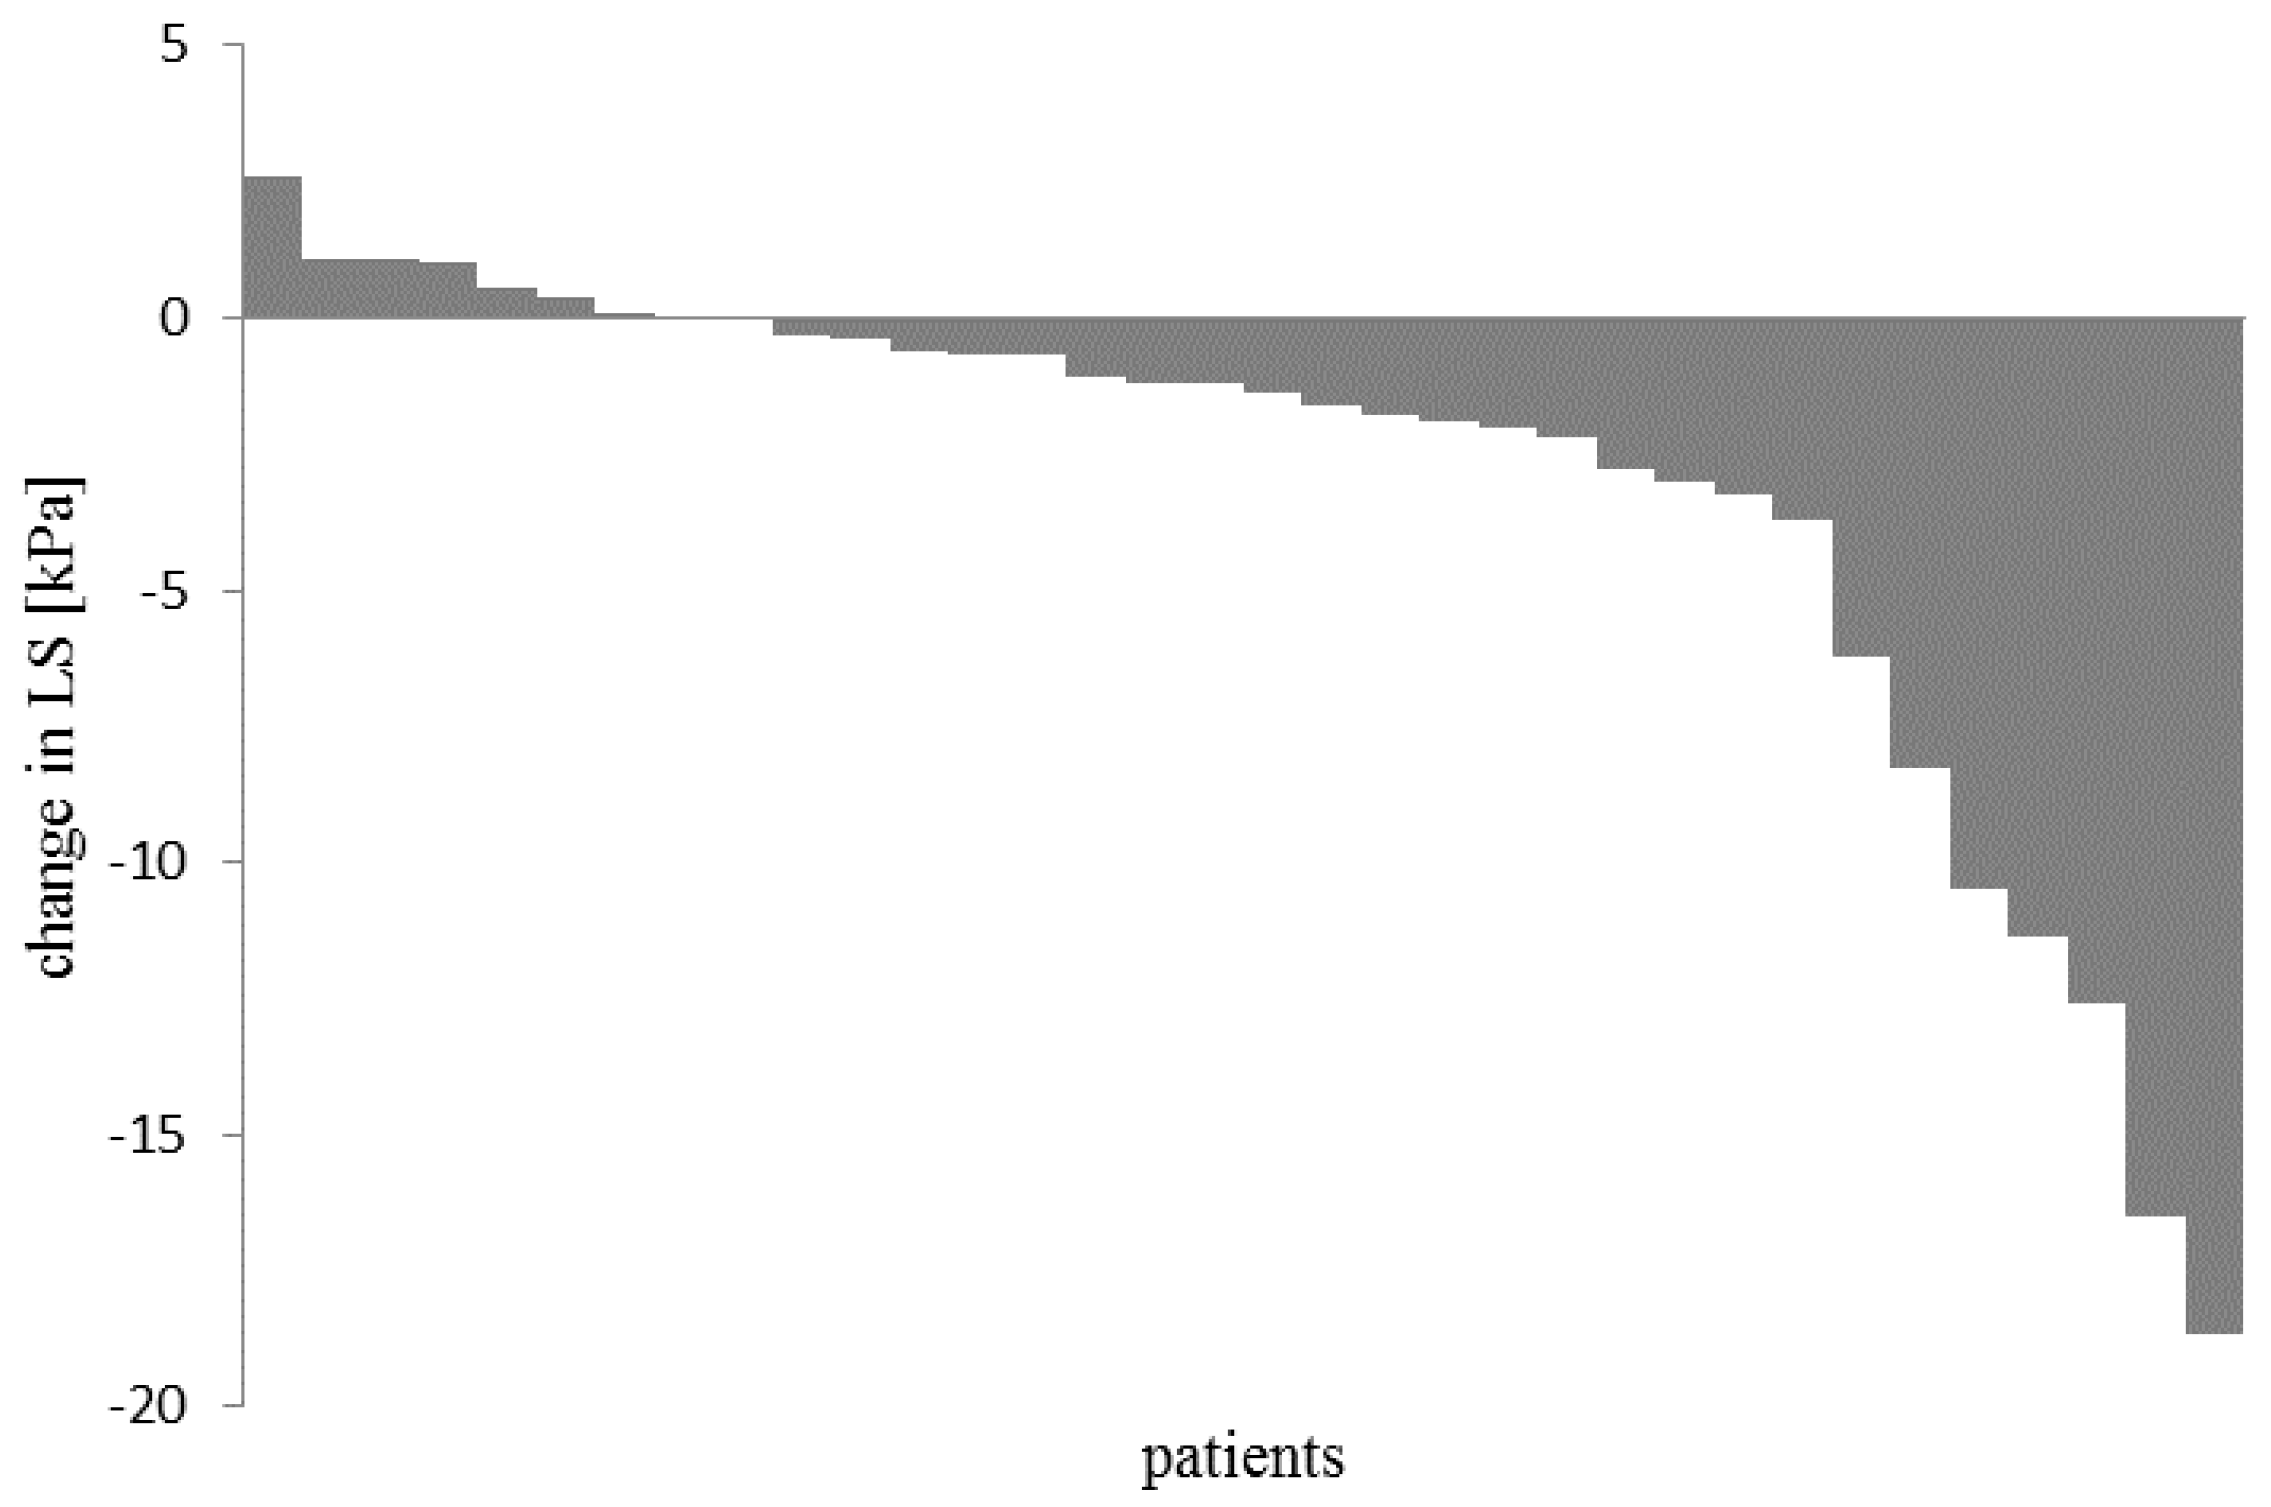
Figure 1. Reduction of liver stiffness between EOT and FU96 in individual patients. Each column represents one patient and the change in liver stiffness between end of treatment and 96 weeks later. LS—liver stiffness; kPa—kilopascal.
Applsci 08 00198 g001
Figure 2. Median values of sequential LS measurement according to baseline fibrosis stage. EOT—end of treatment; FU24—follow-up visit at week 24 after treatment; FU96—follow-up visit at week 96 after treatment; F0/1—F4: METAVIR scores; LS—liver stiffness; kPa—kilopascal; the upper and bottom side of each box represent 25th and 75th percentile (interquartile range); the line passing through the field indicates the median; whiskers indicate minimum and maximum. Statistical method: analysis of variance ANOVA.
Applsci 08 00198 g002
Figure 3. Change in LS after 96 weeks in patients with fibrosis stage F4 and below F4 measured at baseline (unpaired t-test). F0/1–F4: METAVIR scores; LS—liver stiffness; kPa—kilopascal; data presented as mean; whiskers indicate standard deviations.
Applsci 08 00198 g003
Figure 4. Correlation (Spearman’s rank correlation coefficient) between ALT activity at baseline and changes in LS between baseline and FU96. ALT—alanine aminotransferase; LS—liver stiffness; kPa—kilopascal.
Applsci 08 00198 g004
Figure 5. Correlation (Spearman’s rank correlation coefficient) between baseline HCVcAg levels and change in liver stiffness between baseline and FU96. HCVcAg—HCV core antigen; kPa—kilopascal; LS—liver stiffness; fmol—femtomoles.
Applsci 08 00198 g005
Table 1. Baseline characteristics.
CharacteristicsAll; N = 34
Age, years [median (IQR)]50 (41.5–58.5)
Males [n; %]10; 59
BMI, kg/m2 [median (IQR)]26.2 (23.2–28.6)
HCV RNA, log10 IU/mL [median (IQR)]5.9 (5.6–6.3)
HCVcAg, fmol/L [median (IQR)]2653 (1168–4716)
HCV genotype 1a/1b/3a/4 [%]6/88/0/6
Prior HCV treatment history-
  null response [n; %]8; 24
  partial response [n; %]4; 12
  relapse [n; %]9; 26
  naive [n; %]12; 35
  unknown [n; %]1; 3
PLT—× 103 cell/mm3 [median (IQR)]154 (91–201)
Hemoglobin—g/dL [median (IQR)]15.1 (13.73–15.9)
Albumin—mg/dL [median (IQR)]4.3 (3.9–4.7)
ALT—IU/mL [median (IQR)]75.5 (40.3–140)
Bilirubin—mg/dL [median (IQR)]0.7 (0.5–0.9)
AFP—ng/dL [median (IQR)]6.2 (2.8–20.2)
Liver stiffness—kPa [median (IQR)]10.2 (7.8–17.9)
Liver cirrhosis [n;%]14; 42
MELD score [median (min–max)]7 (6–15)
Child Pugh score [median (min–max)]5 (5–9)
BMI—body mass index; HCV RNA; ribonucleic acid hepatitis C virus; HCVcAg—hepatitis C core antigen; PLT—platelets; ALT—alanine aminotransferase; AFP—alpha-fetoprotein; kPa-kilopascal; MELD—Model of End-Stage Liver Disease; IQR—interquartile range; log10—decimal logarithm.
Table 2. Dynamics of changes in laboratory test and liver stiffness during the treatment and follow-up period; p was calculated with Wilcoxon signed rank.
N = 34BaselineEOTpFU24pFU96p
[me dian; IQR]--baseline vs. EOT-baseline vs. FU24-baseline vs. FU96
HCV RNA log10 IU/mL5.9
(5.6–6.3)
0<0.00010<0.00010<0.0001
HCVcAg fmol/L2653
(1168–4716)
0<0.00010<0.0001--
Albumin mg/dL4.3
(3.9–4.7)
4.5
(4.2–4.8)
0.054.8
(4.4–5)
<0.00014.7
(4.5–4.9)
<0.0001
Bilirubin mg/dL0.7
(0.5–0.9)
0.7
(0.4–1.2)
ns0.6
(0.4–0.8)
0.0080.6
(0.4–0.9)
0.05
Creatinine mg/dL0.685
(0.585–0.765)
0.715
(0.610–0.810)
0.080.725
(0.623–0.803)
0.030.820
(0.745–0.890)
<0.0001
Liver stiffness kPa10.2
(7.8–17.9)
9.8
(6.5–13.9)
0.0089.1
(6.8–15.6)
0.0088.2
(5.9–13.2)
<0.0001
ALT IU/mL75.5
(40.25–140)
24
(16–30.25)
<0.000122
(15.75–32.25)
<0.0001--
PLT × 103 cell/mm3154
(91–201)
167
(108.3–219.5)
0.04155
(97.8–207.5)
ns--
Hemoglobin g/dL15.1
(13.7–15.9)
14.1
(12.5–15.6)
0.00915.1
(14.1–16.4)
ns--
AFP ng/dL6.2
(2.8–20.2)
3.3
(2.3–4.7)
<0.00013.4
(2.4–4.8)
<0.0001--
EOT—end of treatment; FU24—follow-up visit at week 24 after treatment; FU96—follow-up visit at week 96 after treatment; BMI—body mass index; HCV RNA—ribonucleic acid hepatitis C virus; HCVcAg—hepatitis C core antigen; kPa-kilopascal; ALT—alanine aminotransferase; PLT—platelets; AFP—alpha-fetoprotein.
Table 3. Statistical significance of differences calculated with Wilcoxon signed rank test (p), between LS values at particular examination time points.
p-ValuesBaselineEOTFU24FU96
baselinexxxx
EOT0.008xxx
FU240.0080.09xx
FU96<0.00010.00020.005x
EOT—end of treatment; FU24—follow-up visit at week 24 after treatment; FU96—follow-up visit at week 96 after treatment.