Fast Volumetric Ultrasound B-Mode and Doppler Imaging with a New High-Channels Density Platform for Advanced 4D Cardiac Imaging/Therapy

 , and
, and
Abstract
:1. Introduction
2. Materials and Methods
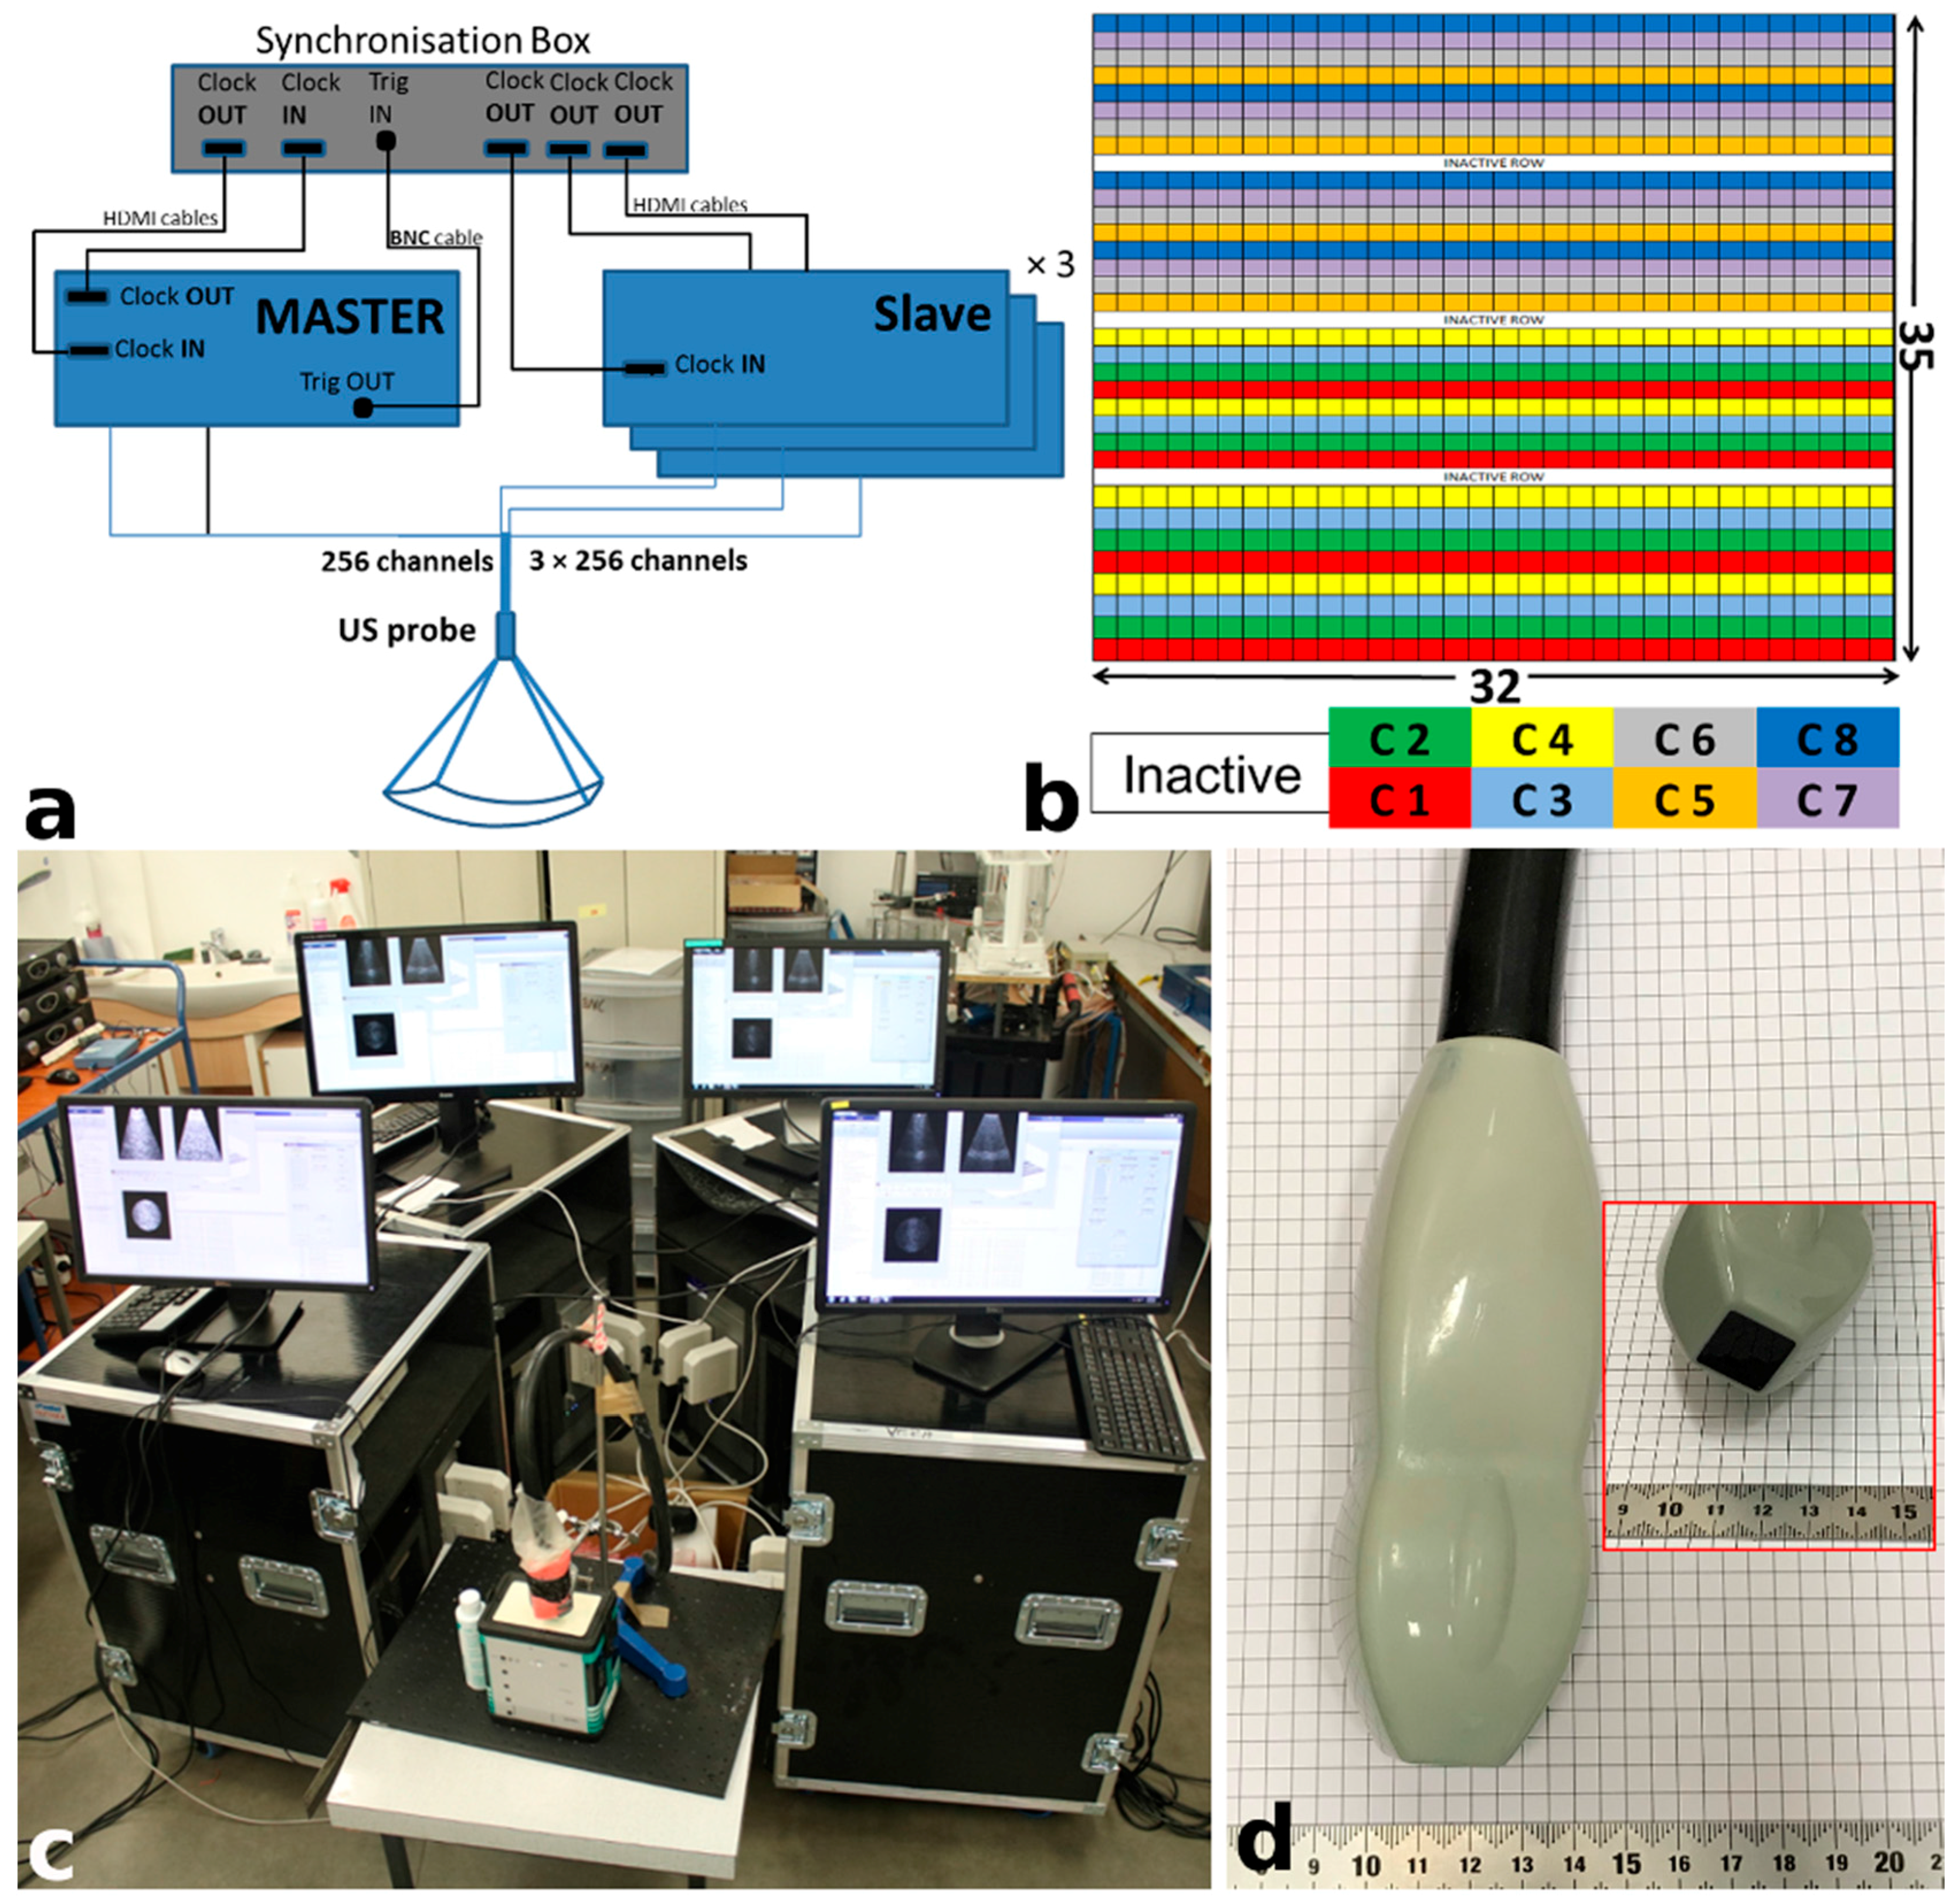
2.1. US Experimental Platform
2.2. Numerical Simulations
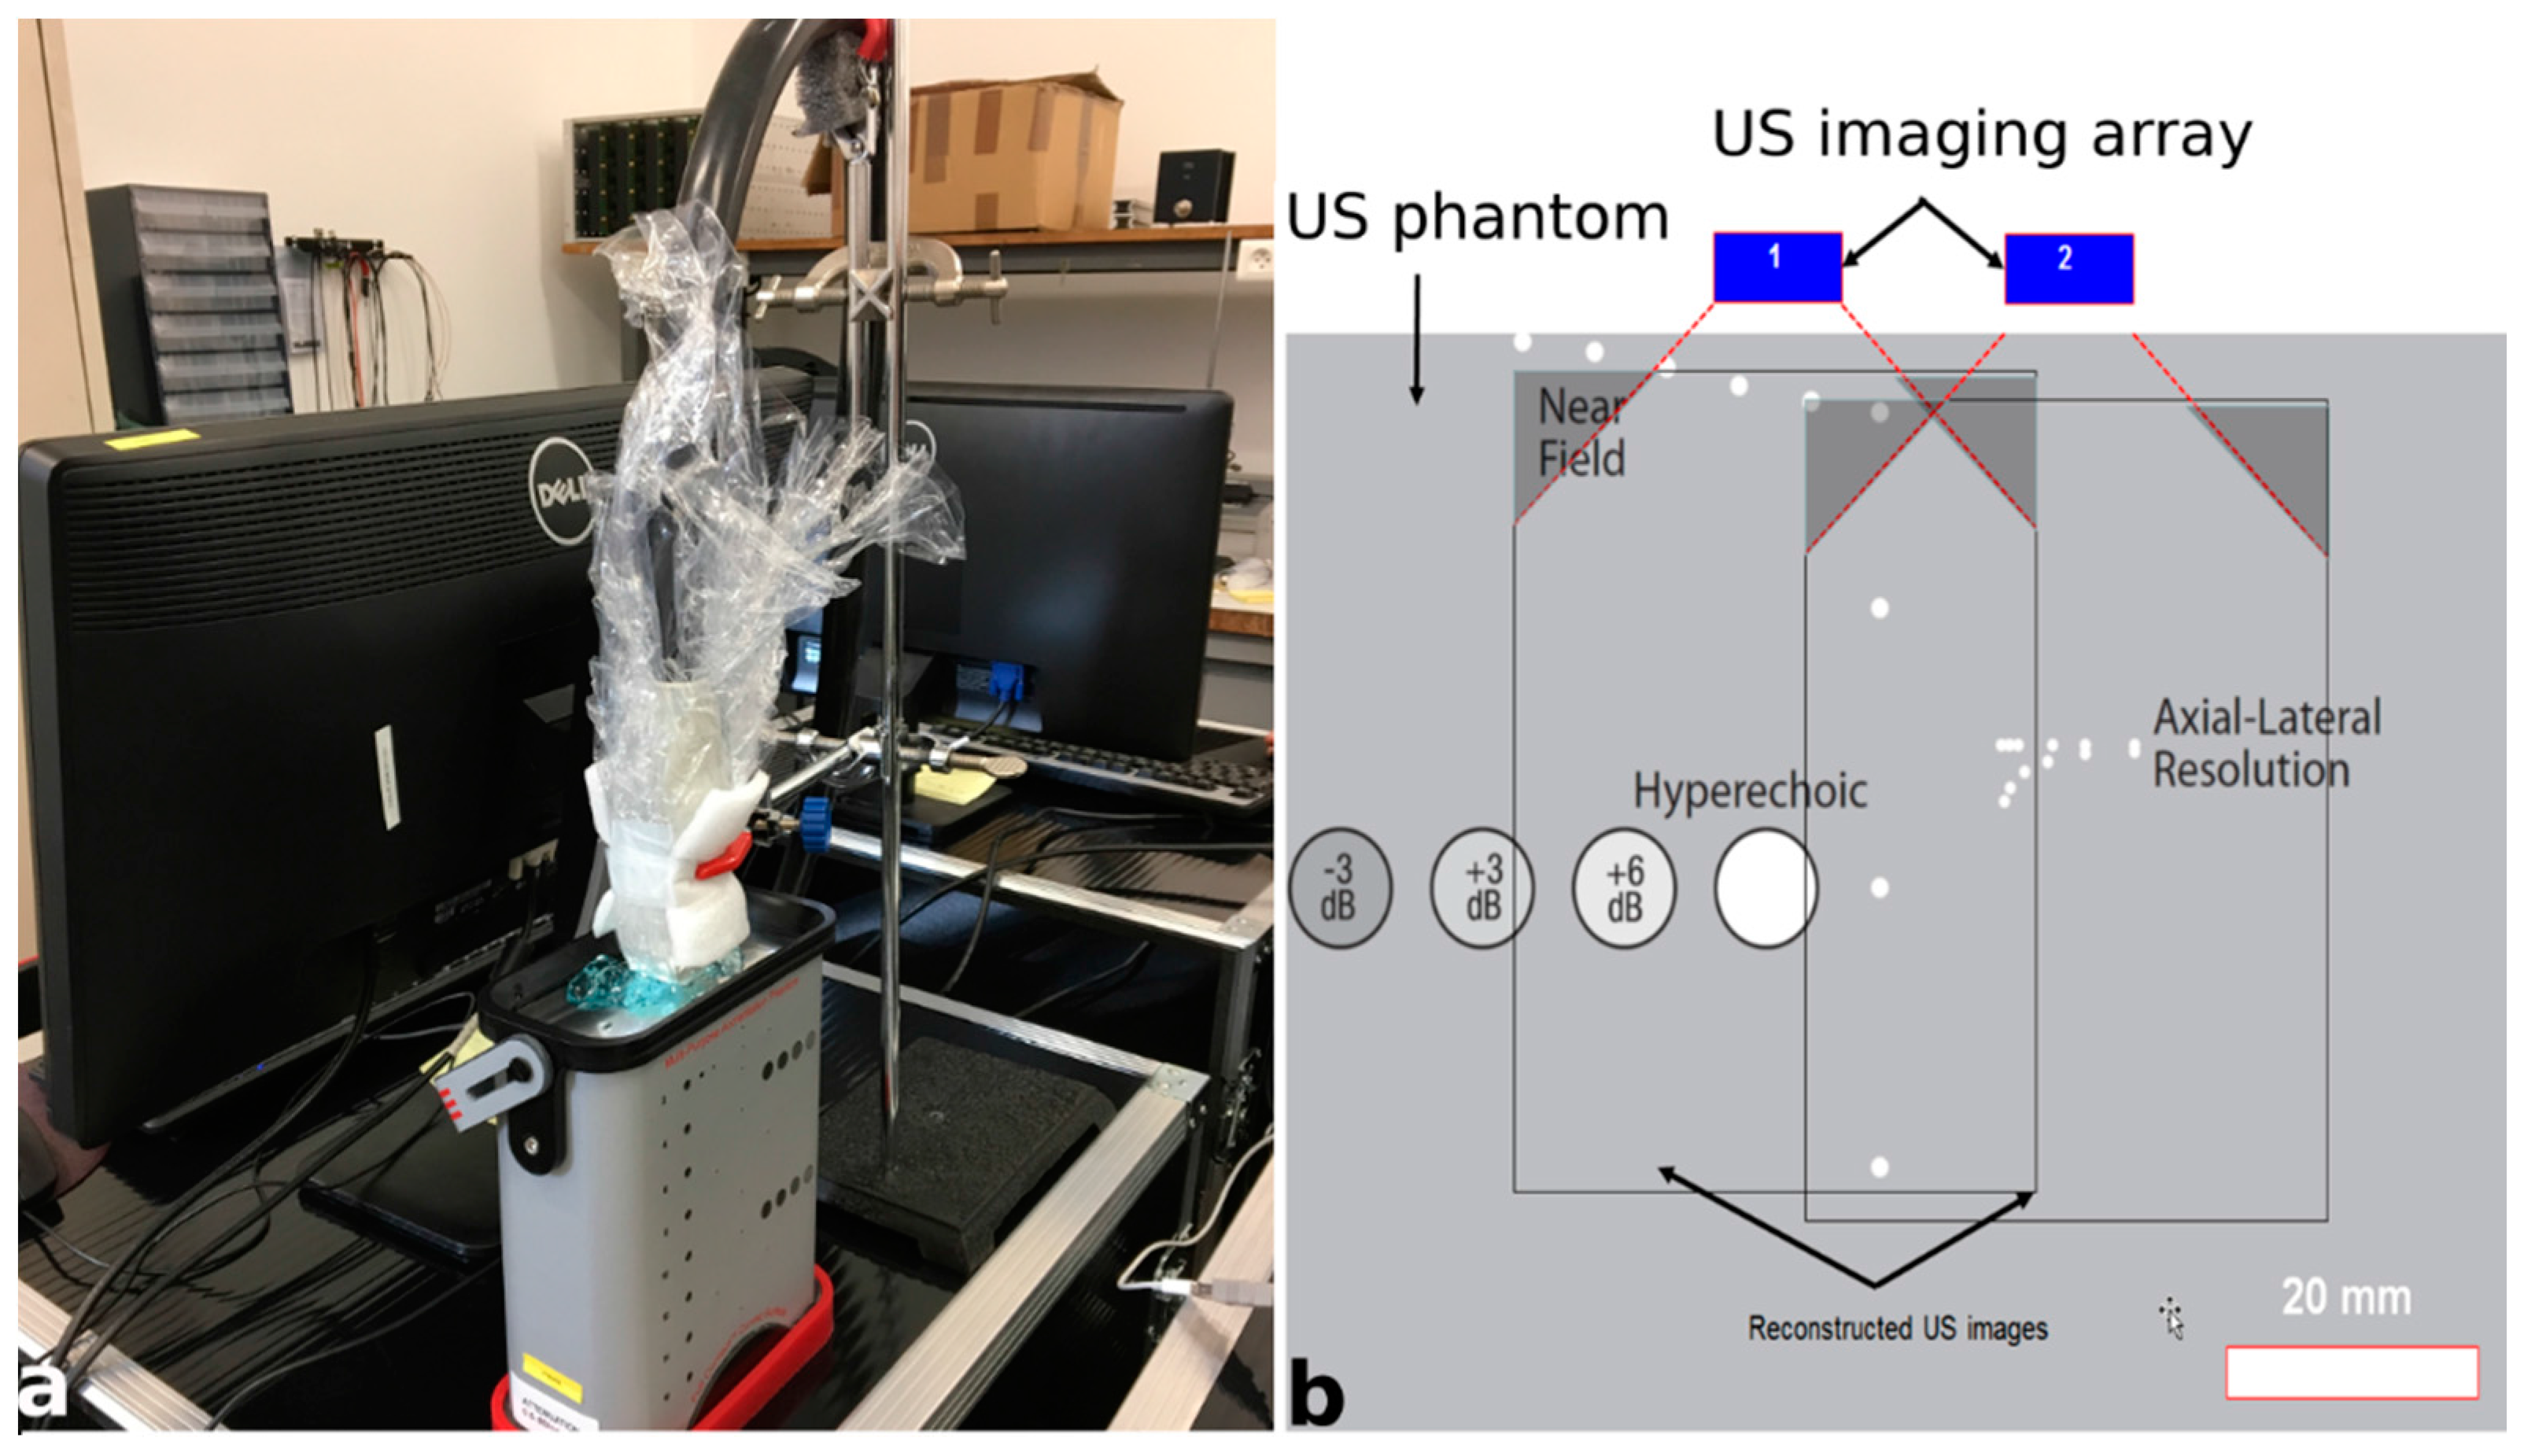
2.3. Initial Experimental Acquisitions for Validation of the Platform
2.4. Experimental Data Acquisitions for Doppler Application
2.5. Data Processing
3. Results
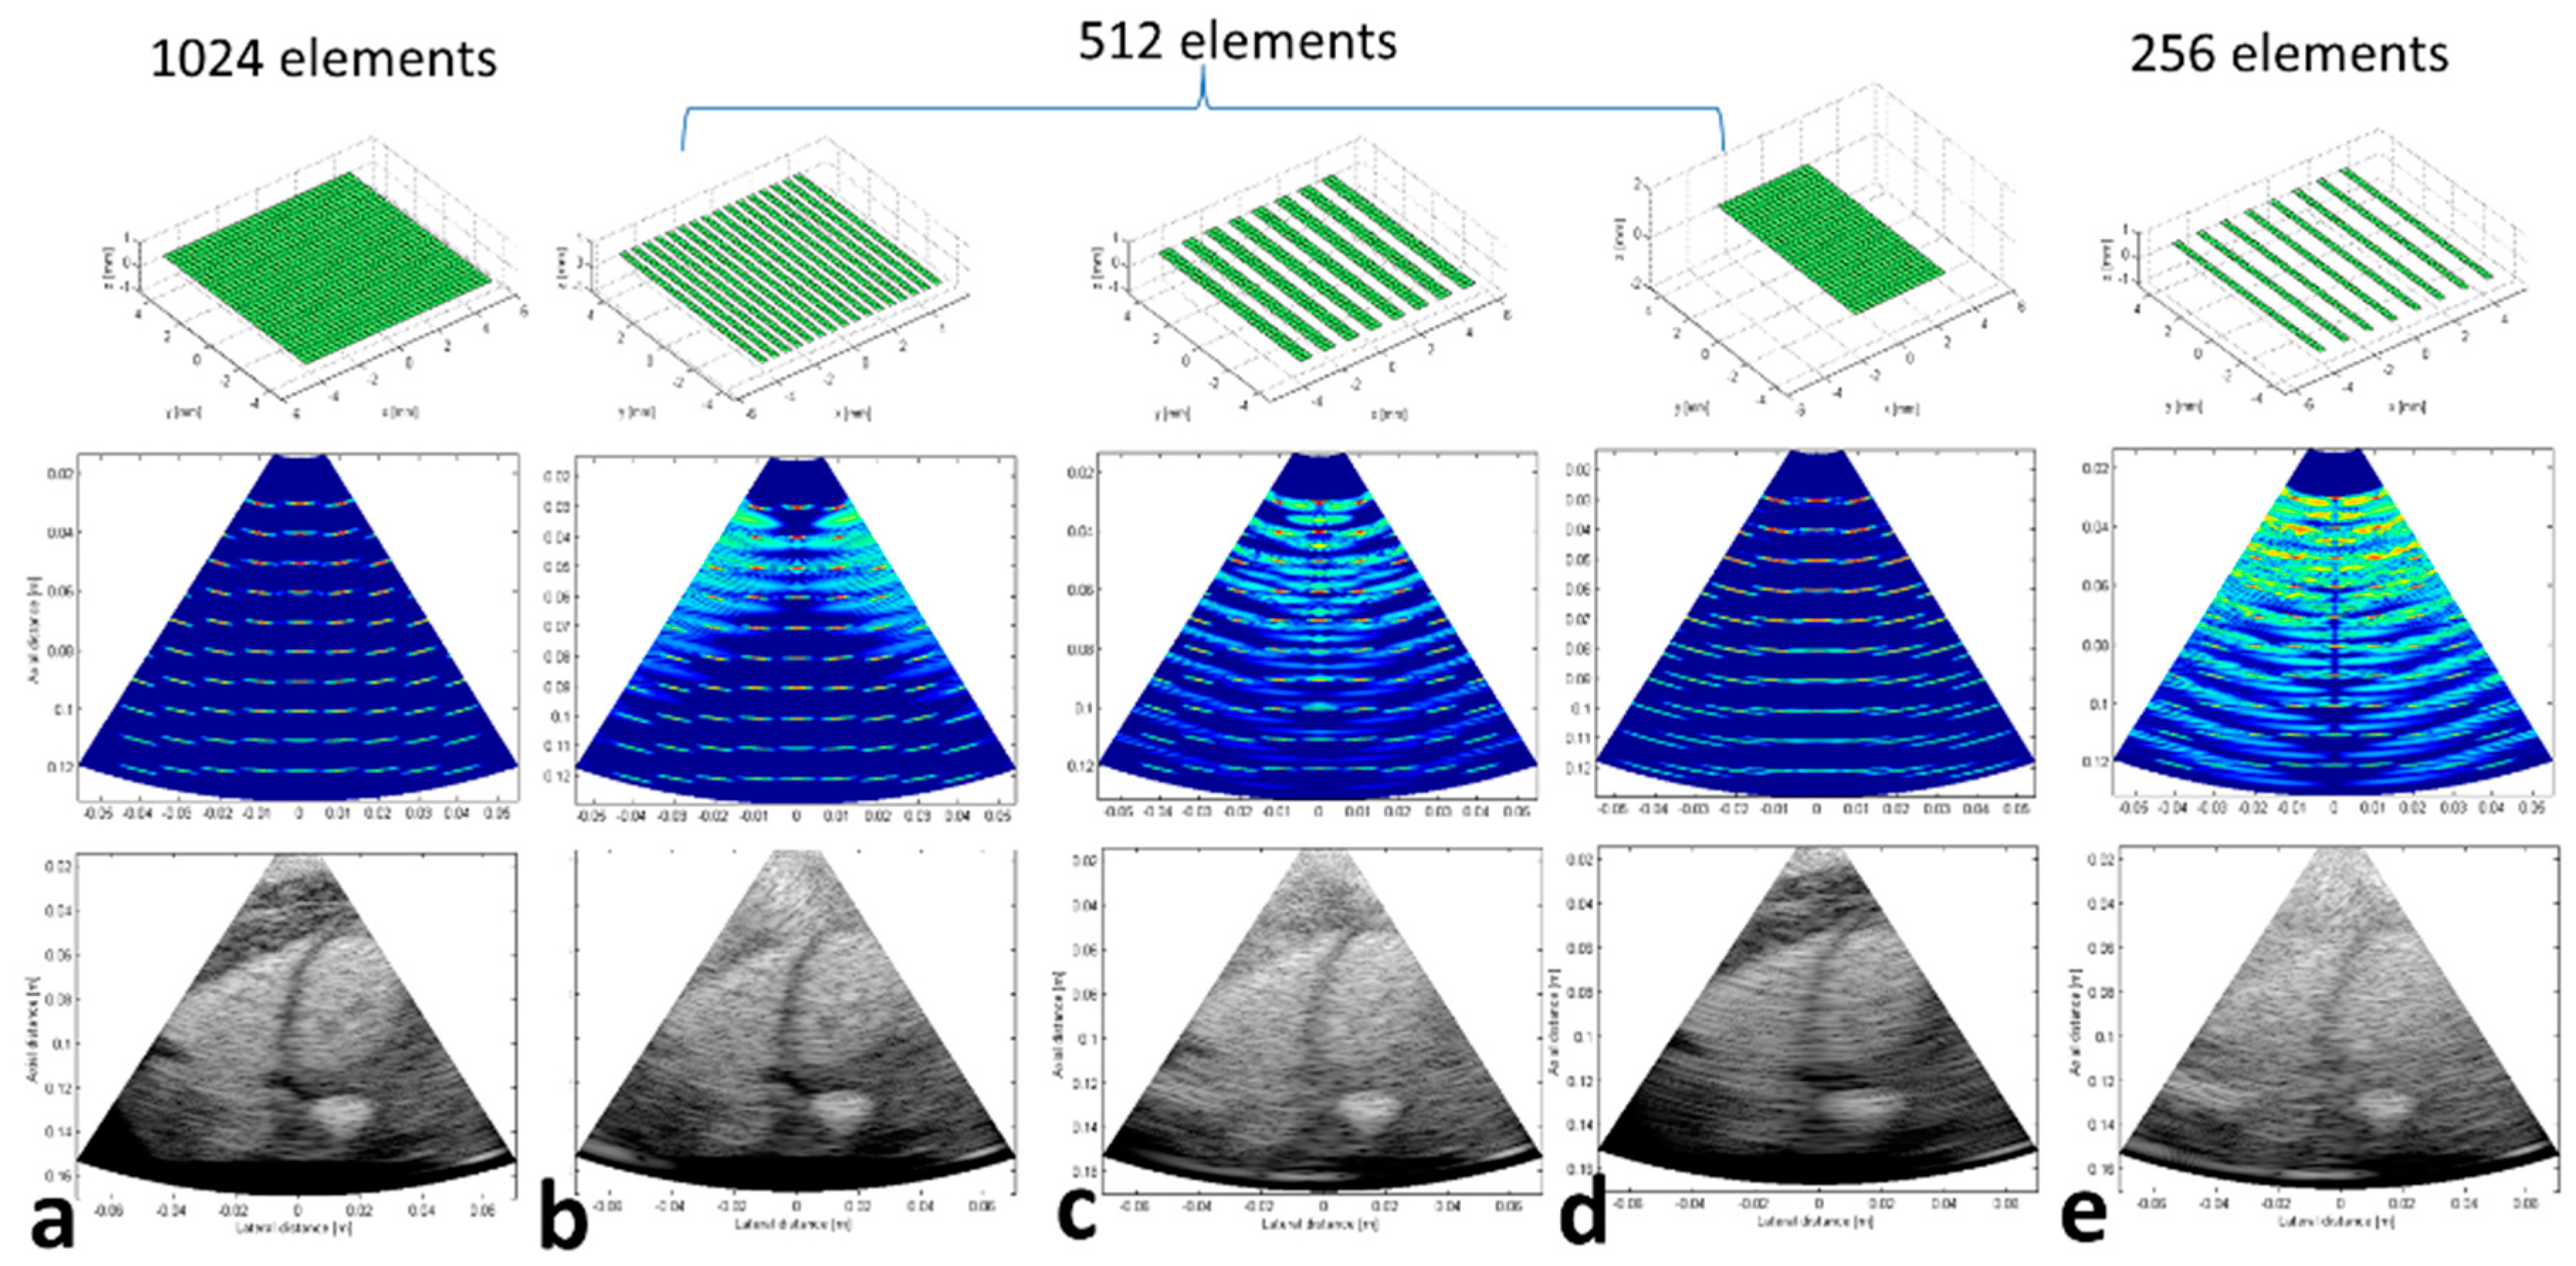
3.1. Preliminary Numerical Simulations
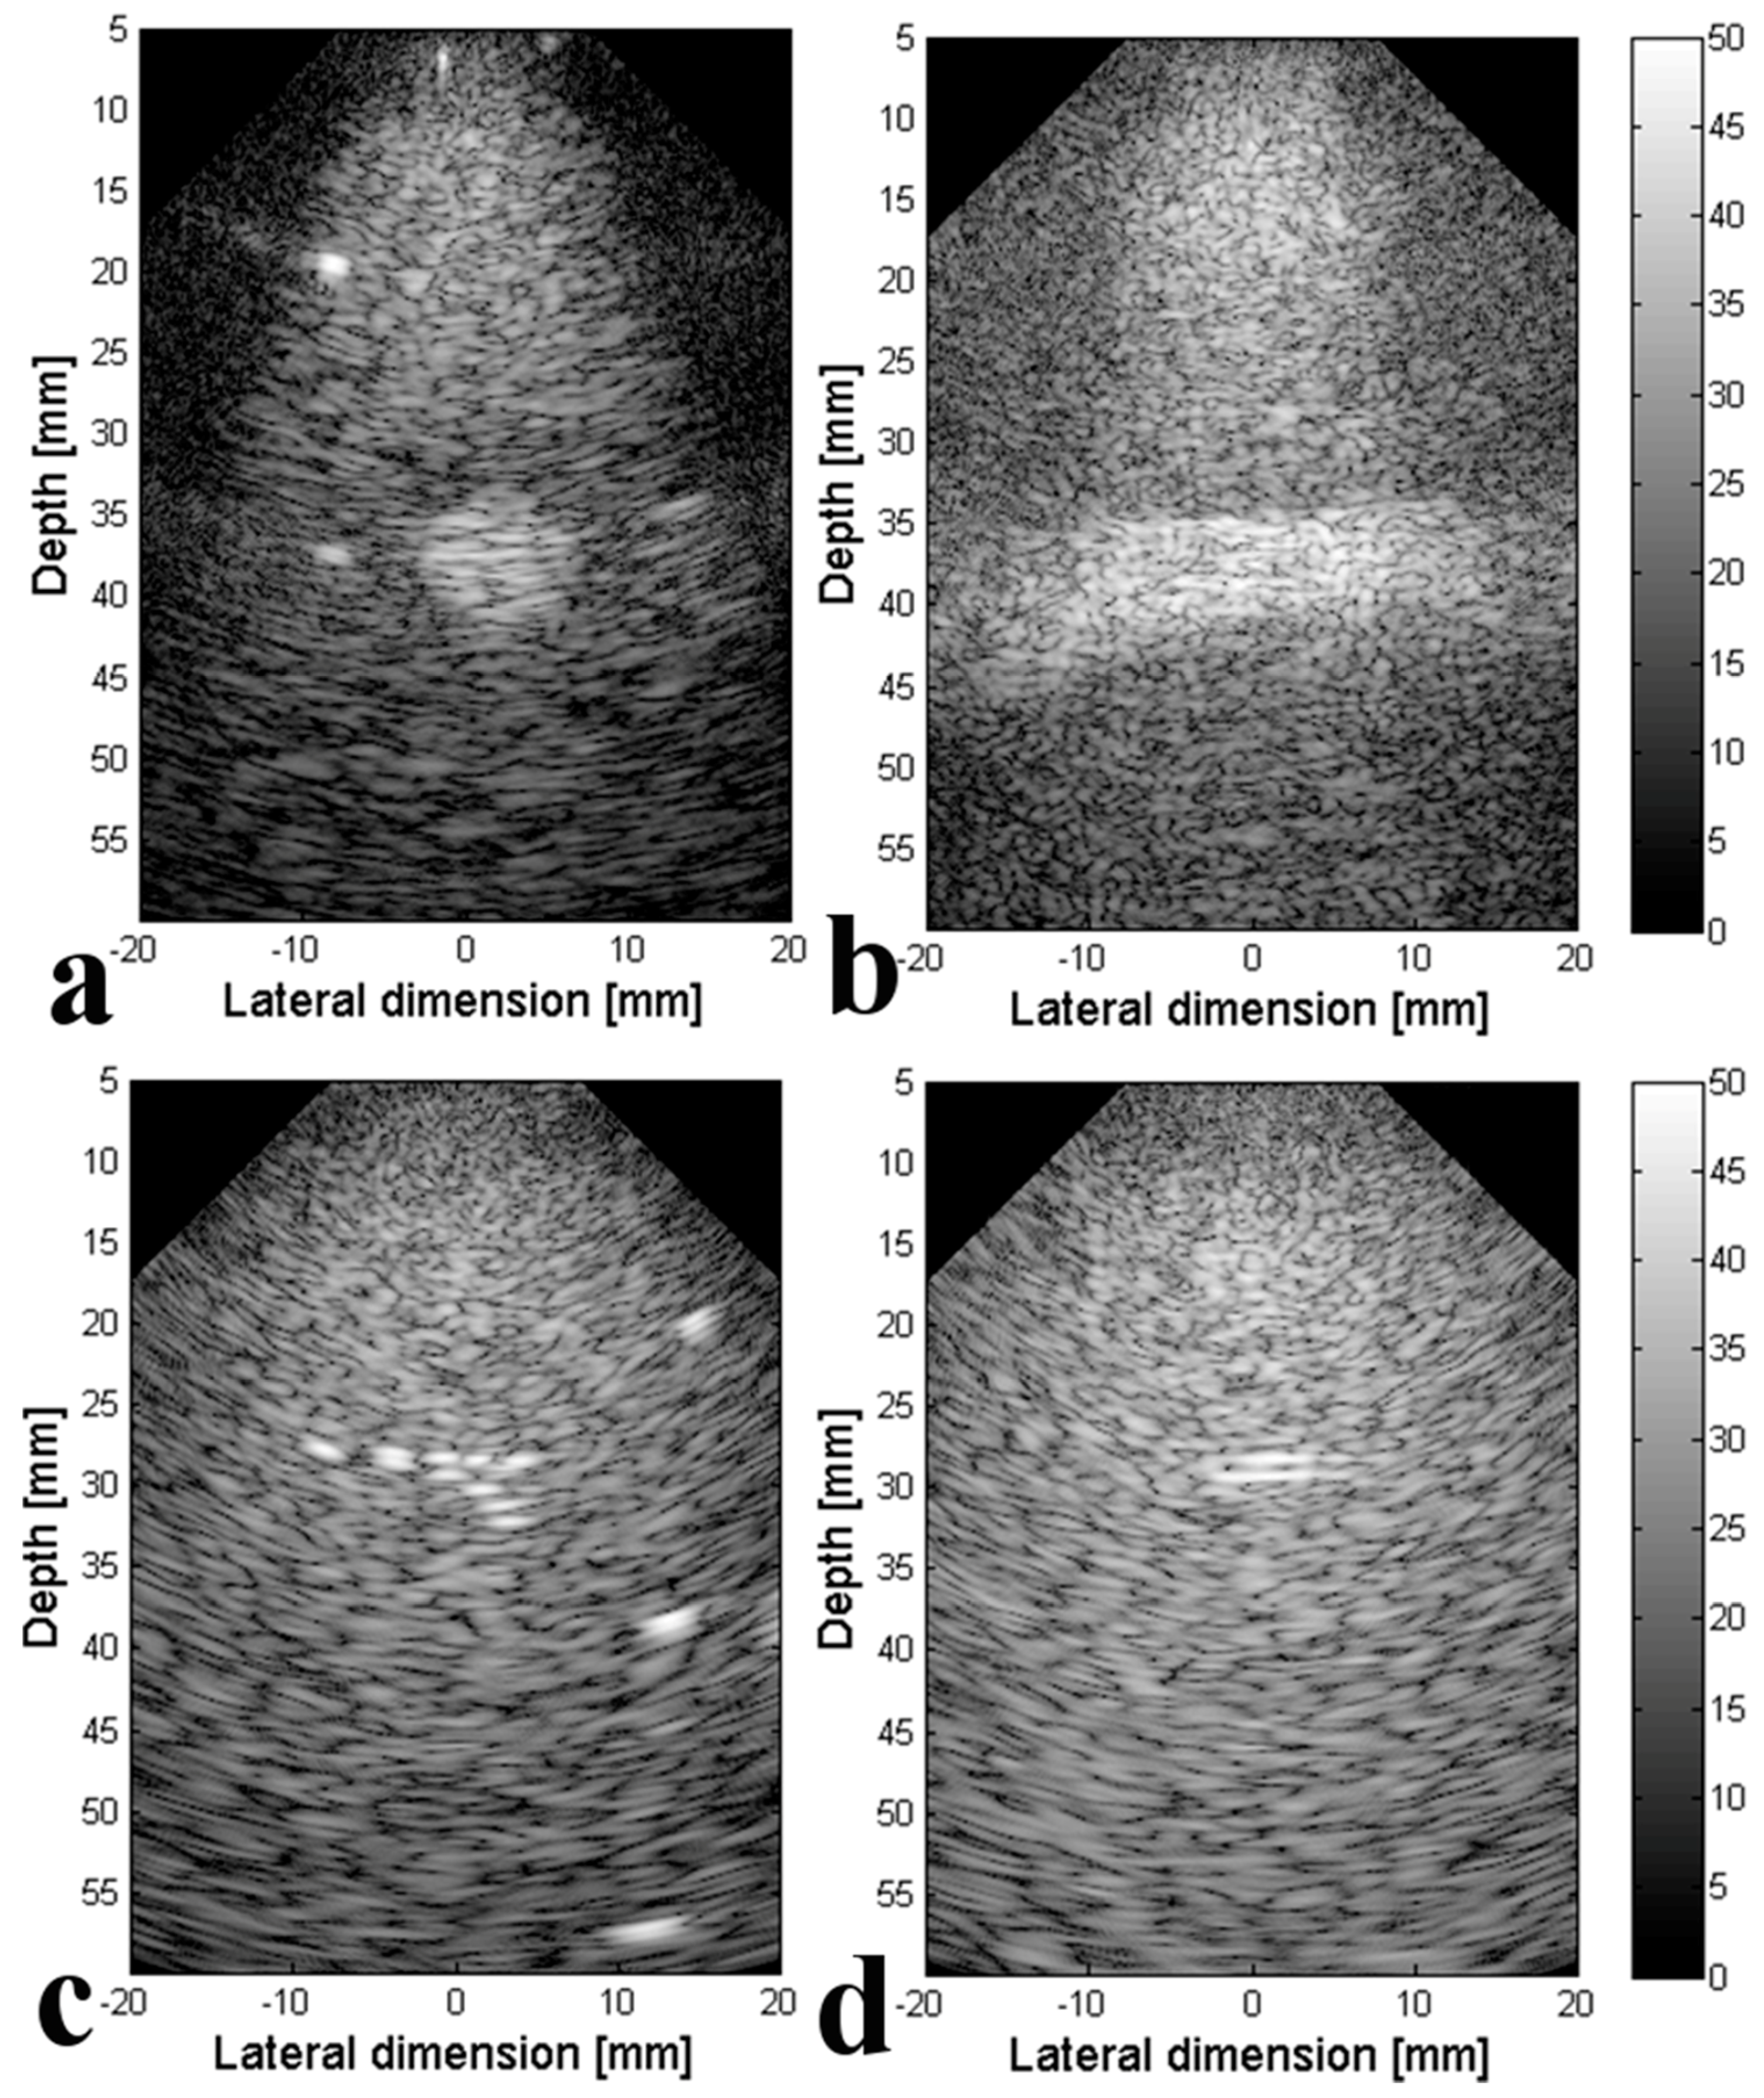
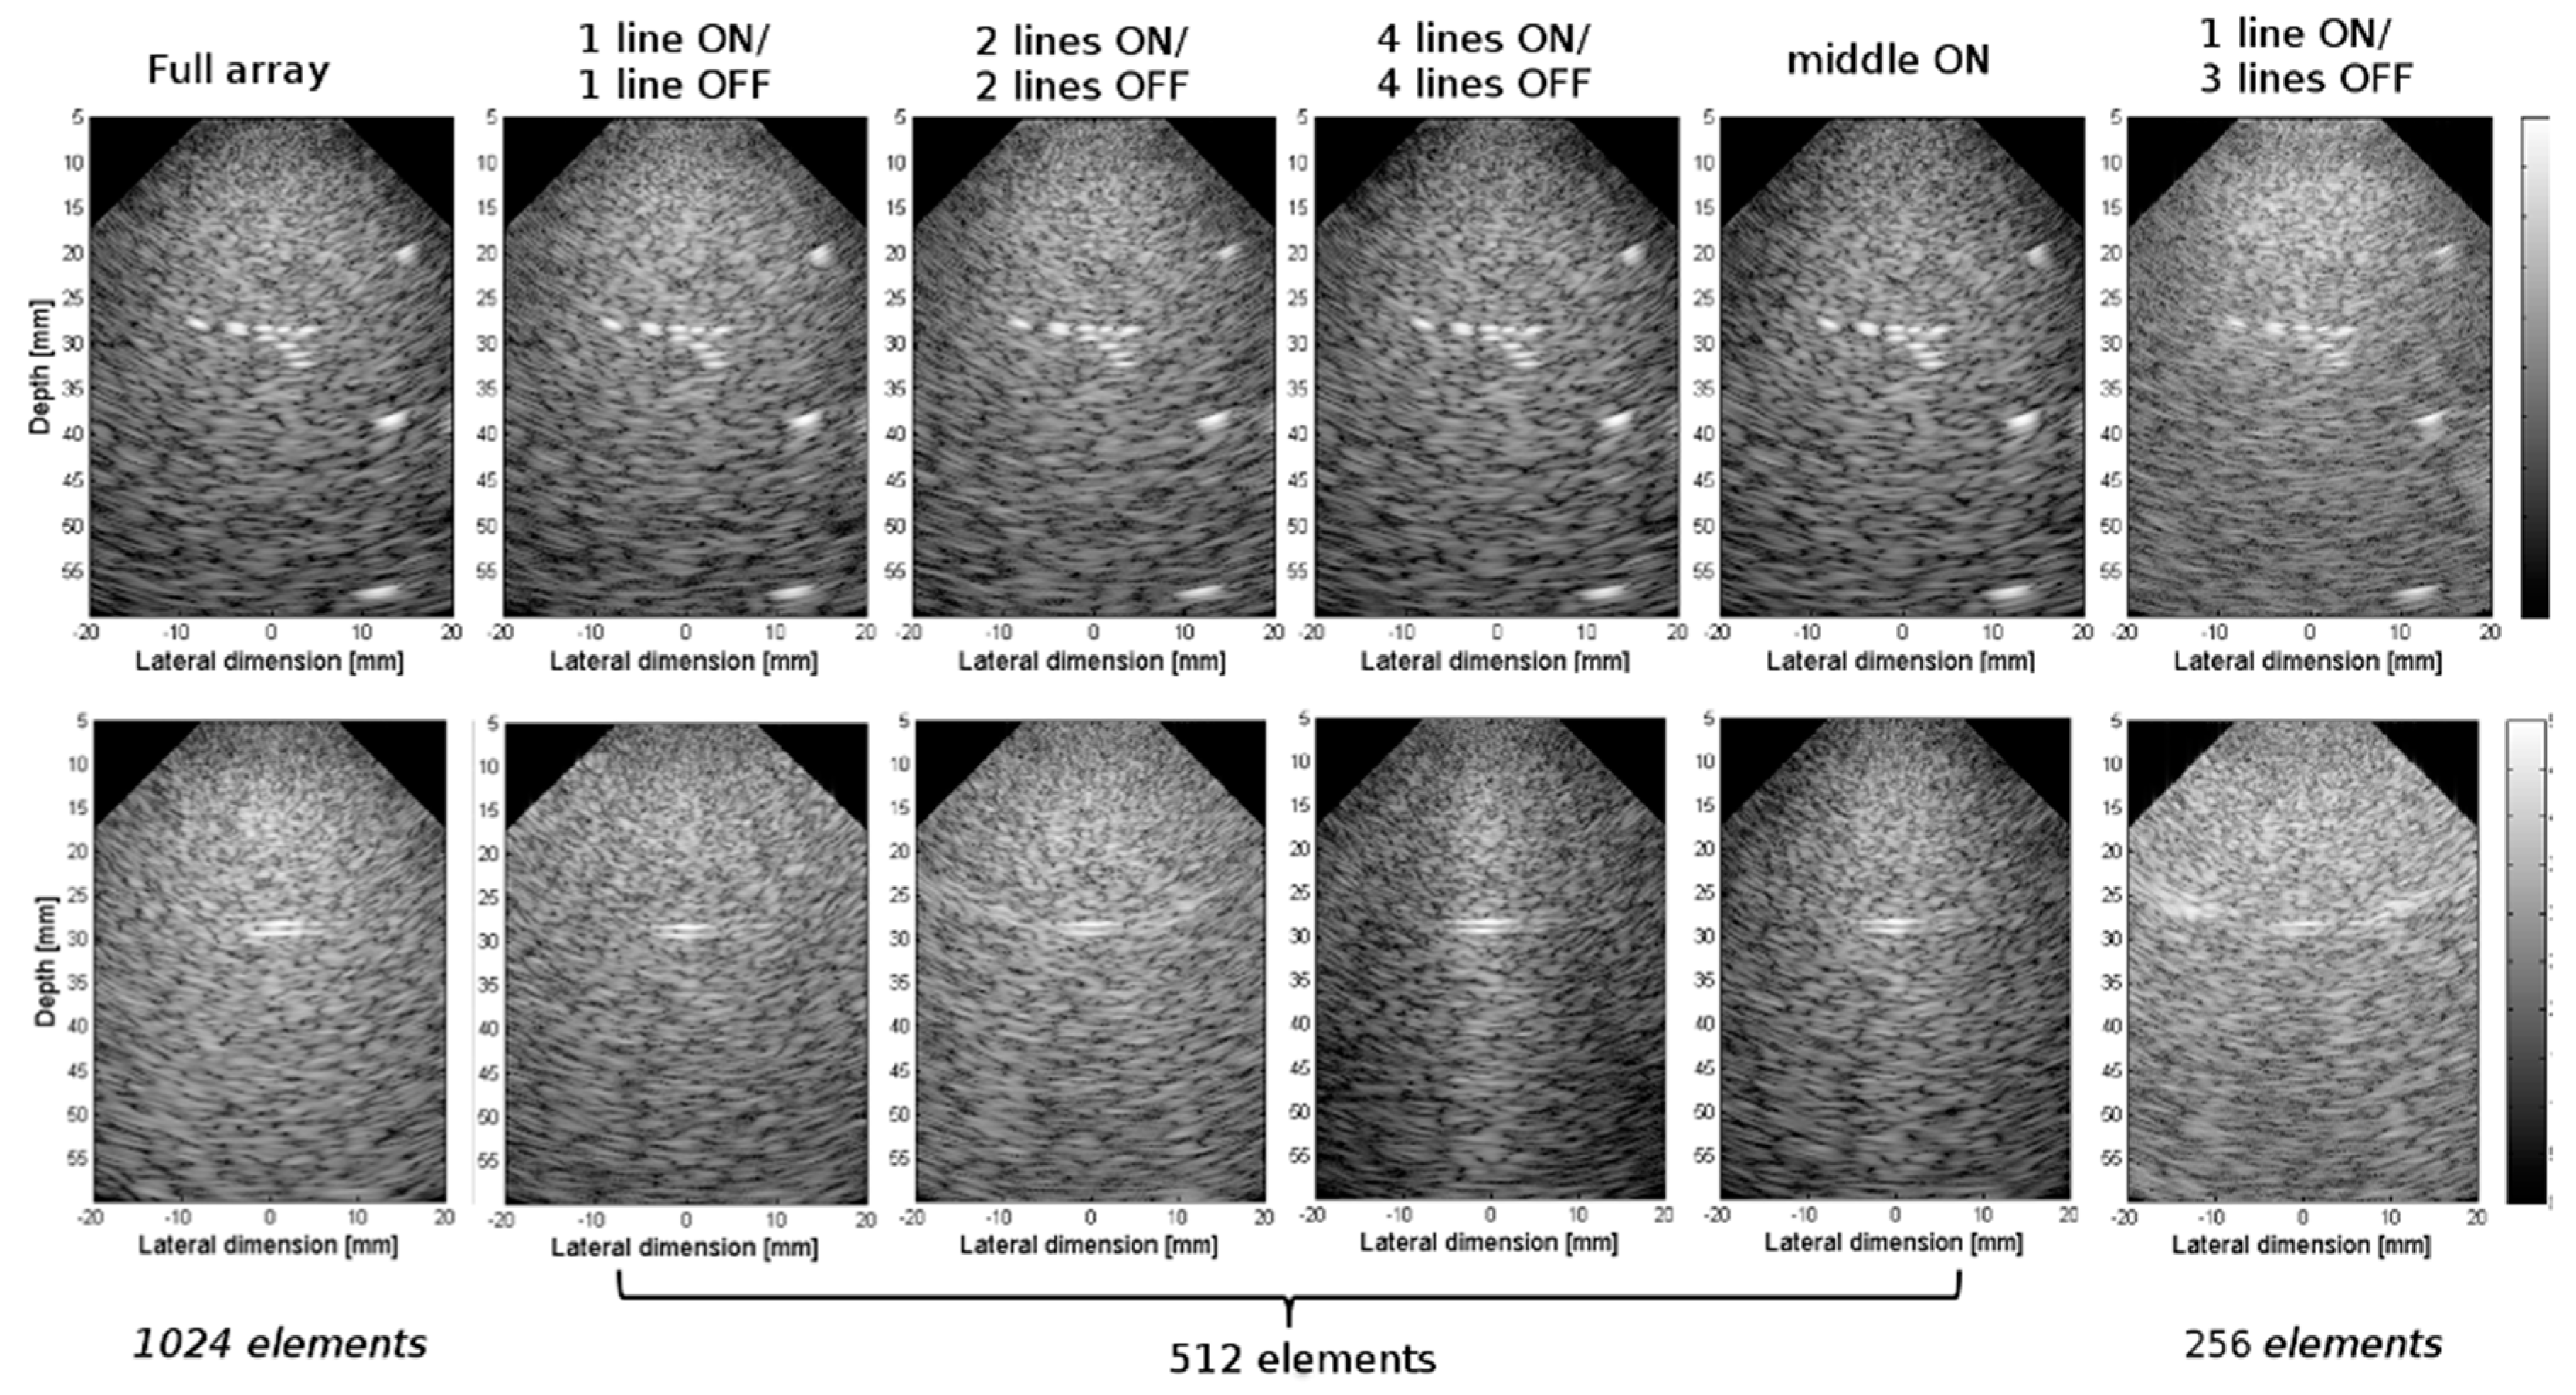
3.2. Experimental Validation of the 4-D US Platform Developped
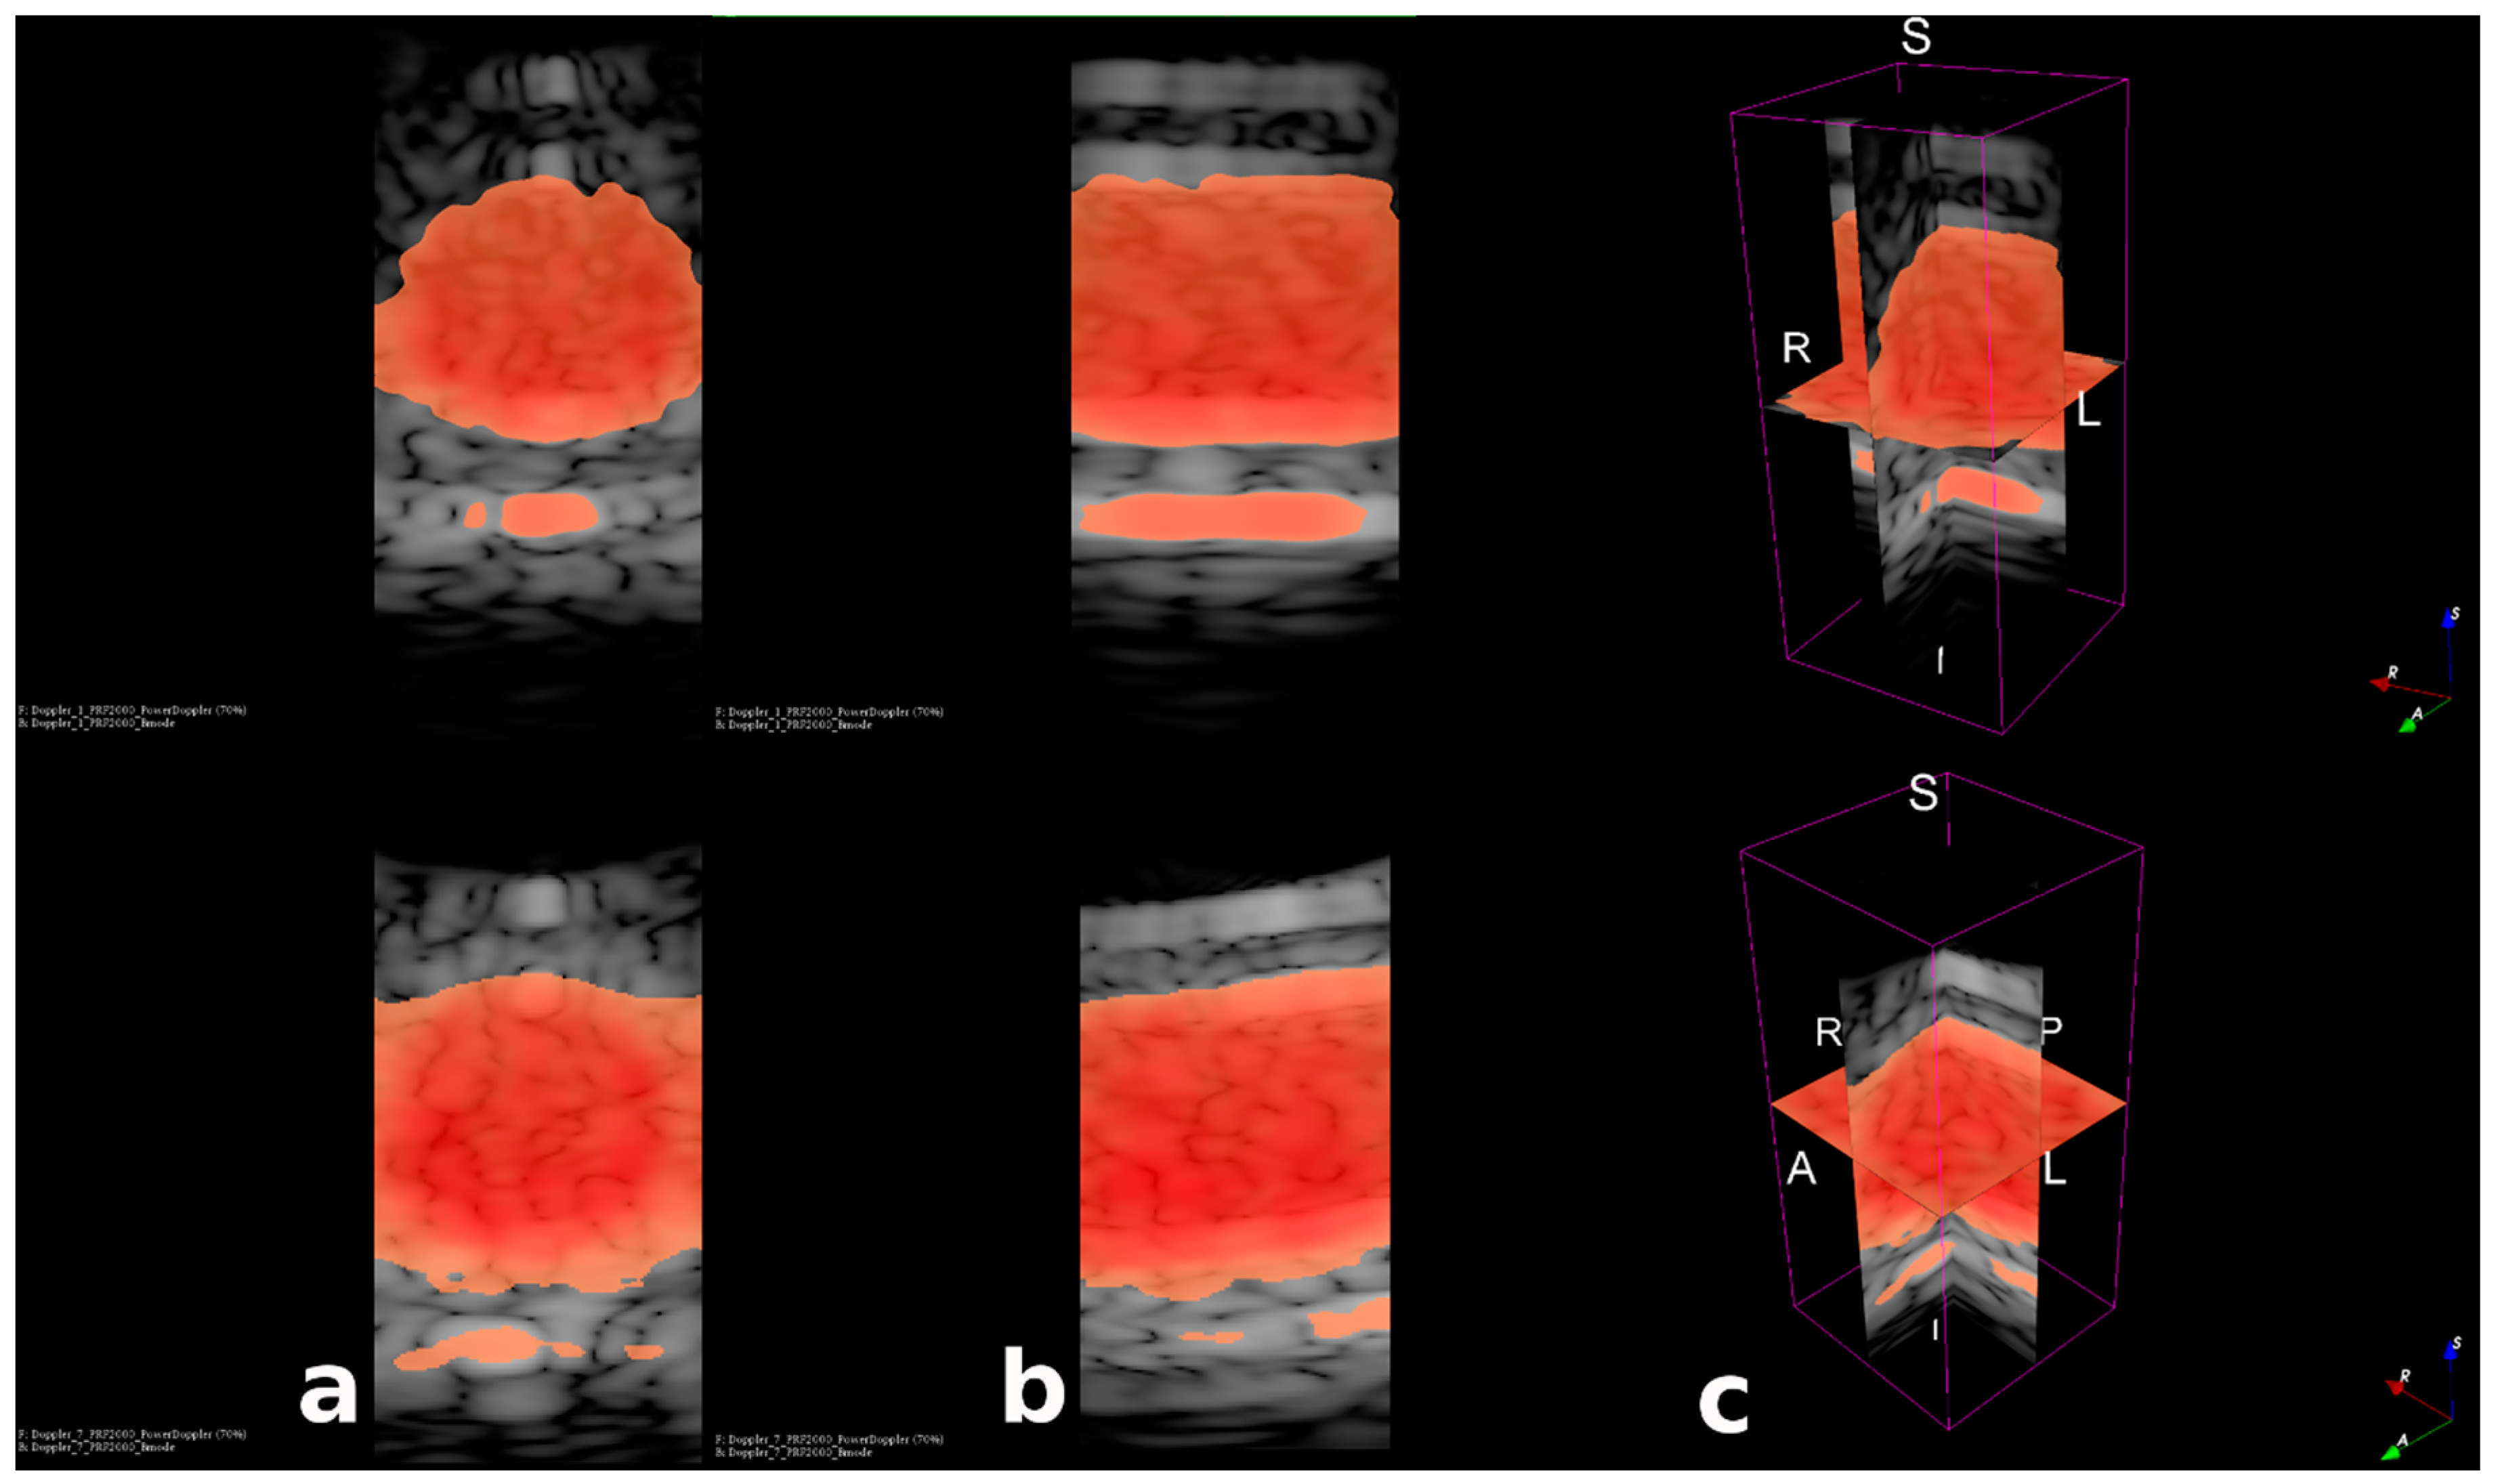
3.3. Fast Volumetric Imaging for Doppler Application
4. Discussion
5. Conclusions
Supplementary Materials
Acknowledgments
Author Contributions
Conflicts of Interest
References
- Tortoli, P.; Bassi, L.; Boni, E.; Dallai, A.; Guidi, F.; Ricci, S. ULA-OP: An advanced open platform for ultrasound research. IEEE Trans. Ultrason. Ferroelectr. Freq. Control 2009, 56, 2207–2216. [Google Scholar] [CrossRef]
- Asef, A.A.; Maia, J.M.; Costa, E.T. A flexible multichannel FPGA and PC-Based ultrasound system for medical imaging research: Initial phantom experiments. Res. Biomed. Eng. 2015, 31, 277–281. [Google Scholar]
- Brunke, S.S.; Insana, M.F.; Dahl, J.J.; Hansen, C.; Ashfaq, M.; Ermert, H. An ultrasound research interface for a clinical system. IEEE Trans. Ultrason. Ferroelectr. Freq. Control 2007, 54, 198–210. [Google Scholar] [CrossRef]
- Roux, E.; Varray, F.; Petrusca, L.; Cachard, C.; Tortoli, P.; Liebgott, H. 3D diverging waves with 2D sparse arrays: A feasibility study. In Proceedings of the IEEE International Ultrasonics Symposium, Washington, DC, USA, 6–9 September 2017. [Google Scholar]
- Roux, E.; Ramalli, A.; Tortoli, P.; Cachard, C.; Robini, M.; Liebgott, H. 2D ultrasound sparse arrays multi-depth radiation optimization using simulated annealing and spiral-array inspired energy functions. IEEE Trans. Ultrason. Ferroelectr. Freq. Control 2016, 63, 2138–2149. [Google Scholar]
- Badescu, E.; Bujoreanu, D.; Petrusca, L.; Friboulet, D.; Liebgott, H. Multi-line transmission for 3D ultrasound imaging: An experimental study. In Proceedings of the IEEE International Ultrasonics Symposium, Washington, DC, USA, 6–9 September 2017. [Google Scholar]
- Zhang, M.; Varray, F.; Besson, A.; Carrillo, R.E.; Viallon, M.; Garcia, D.; Thiran, J.P.; Friboulet, D.; Liebgott, H.; Bernard, O. Extension of fourier-based techniques for ultrafast imaging in ultrasound with diverging waves. IEEE Trans. Ultrason. Ferroelectr. Freq. Control 2016, 63, 2125–2137. [Google Scholar] [CrossRef]
- Salles, S.; Liebgott, H.; Garcia, D.; Vray, D. Full 3D transverse oscillations: A method for tissue motion estimation. IEEE Trans. Ultrason. Ferroelectr. Freq. Control 2015, 62, 1473–1485. [Google Scholar] [CrossRef]
- Tanter, M.; Fink, M. Ultrafast imaging in biomedical ultrasound. IEEE Trans. Ultrason. Ferroelectr. Freq. Control 2014, 61, 102–119. [Google Scholar] [CrossRef]
- Synnevag, J.-F.; Austeng, A.; Holm, G. Adaptive beamforming applied to medical ultrasound imaging. IEEE Trans. Ultrason. Ferroelectr. Freq. Control 2007, 54, 160–1613. [Google Scholar] [CrossRef] [Green Version]
- Provost, J.; Papadacci, C.; Arango, J.E.; Imbault, M.; Fink, M.; Gennisson, J.L.; Tanter, M.; Pernot, M. 3D ultrafast ultrasound imaging in vivo. Phys. Med. Biol. 2014, 59, L1–L13. [Google Scholar] [CrossRef]
- Jensen, J.A.; Holten-Lund, H.; Nilsson, R.T.; Hansen, M.; Larsen, U.D.; Domsten, R.P.; Tomov, B.G.; Stuart, M.B.; Nikolov, S.I.; Pihl, M.J.; et al. SARUS: A synthetic aperture real-time ultrasound system. IEEE Trans. Ultrason. Ferroelectr. Freq. Control 2013, 60, 1838–1852. [Google Scholar] [CrossRef]
- Provost, J.; Papadacci, C.; Demene, C.; Gennisson, J.L.; Tanter, M.; Pernot, M. 3-D ultrafast doppler imaging applied to the noninvasive mapping of blood vessels in vivo. IEEE Trans. Ultrason. Ferroelectr. Freq. Control 2015, 62, 1467–1472. [Google Scholar] [CrossRef] [PubMed]
- Papadacci, C.; Finel, V.; Provost, J.; Villemain, O.; Bruneval, P.; Gennisson, J.L.; Tanter, M.; Fink, M.; Pernot, M. Imaging the dynamics of cardiac fiber orientation in vivo using 3D Ultrasound Backscatter Tensor Imaging. Sci. Rep. 2017, 7, 830. [Google Scholar] [CrossRef] [PubMed]
- Savord, B.; Solomon, R. Fully sampled matrix transducer for real time 3D ultrasonic imaging. In Proceedings of the IEEE Symposium on Ultrasonics, Honolulu, HI, USA, 5–8 October 2003; Volume 1, pp. 945–953. [Google Scholar]
- Bhuyan, A.; Choe, J.W.; Lee, B.C.; Wygant, I.O.; Nikoozadeh, A.; Oralkan, Ö.; Khuri-Yakub, B.T. Integrated circuits for volumetric ultrasound imaging with 2-D CMUT arrays. IEEE Trans. Biomed. Circuits Syst. 2013, 7, 796–804. [Google Scholar] [CrossRef] [PubMed]
- Kortbek, J.; Jensen, J.A.; Gammelmark, K.L. Sequential beamforming for synthetic aperture imaging. Ultrasonics 2013, 53, 1–16. [Google Scholar] [CrossRef] [PubMed] [Green Version]
- Christiansen, T.L.; Rasmussen, M.F.; Bagge, J.P.; Nordahl Moesner, F.; Jensen, J.A.; Thomsen, E.V. 3-D imaging using row-column-addressed arrays with integrated apodization—Part II: Transducer fabrication and experimental results. IEEE Trans. Ultrason. Ferroelectr. Freq. Control 2015, 62, 959–971. [Google Scholar] [CrossRef] [PubMed]
- Didier, D.; Brusseau, E.; Detti, V.; Varray, F.; Basarab, A. Ultrasound medical imaging. In Medical Imaging Based on Magnetic Fields and Ultrasounds; John Wiley & Sons: Hoboken, NJ, USA, 2014; pp. 1–72. [Google Scholar]
- Papadacci, C.; Pernot, M.; Couade, M.; Fink, M.; Tanter, M. High-contrast ultrafast imaging of the heart. IEEE Trans. Ultrason. Ferroelectr. Freq. Control 2014, 61, 288–301. [Google Scholar] [CrossRef] [PubMed]
- Hasegawa, H.; Kanai, H. High-frame-rate echocardiography using diverging transmit beams and parallel receive beamforming. J. Med. Ultrason. 2011, 38, 129–140. [Google Scholar] [CrossRef]
- Tong, L.; Ramalli, A.; Tortoli, P.; Fradella, G.; Caciolli, S.; Luo, J.; D’hooge, J. Wide-angle tissue doppler imaging at high frame rate using multi-line transmit beamforming: An experimental validation in vivo. IEEE Trans. Med. Imaging 2016, 35, 521–528. [Google Scholar] [CrossRef]
- Poree, J.; Posada, D.; Hodzic, A.; Tournoux, F.; Cloutier, G.; Garcia, D. High-frame-rate echocardiography using coherent compounding with doppler-based motion-compensation. IEEE Trans. Med. Imaging 2016, 35, 1647–1657. [Google Scholar] [CrossRef]
- Joos, P.; Liebgott, H.; Varray, F.; Petrusca, L.; Garcia, D.; Vray, D.; Nicolas, B. High-frame-rate 3-D echocardiography based on motion compensation: An in vitro evaluation. In Proceedings of the IEEE International Ultrasonics Symposium, Washington, DC, USA, 6–9 September 2017. [Google Scholar]
- Cikes, M.; Tong, L.; Sutherland, G.R.; D’hooge, J. Ultrafast cardiac ultrasound imaging. JACC Cardiovasc. Imaging 2014, 7, 812–823. [Google Scholar] [CrossRef]
- Vappou, J.; Luo, J.; Konofagou, E.E. Pulse wave imaging for noninvasive and quantitative measurement of arterial stiffness in vivo. Am. J. Hypertens. 2010, 23, 393–398. [Google Scholar] [CrossRef] [PubMed]
- Bercoff, J.; Montaldo, G.; Loupas, T.; Savery, D.; Mézière, F.; Fink, M.; Tanter, M. Ultrafast compound Doppler imaging: Providing full blood flow characterization. IEEE Trans. Ultrason. Ferroelectr. Freq. Control 2011, 58, 134–147. [Google Scholar] [CrossRef] [PubMed]
- Jensen, J.A. Field: A program for simulating ultrasound systems. In Proceedings of the 10th Nordic-Baltic Conference on Biomedical Imaging Published in Medical & Biological Engineering & Computing, Tampere, Finland, 9–13 June 1996; Volume 34, pp. 351–353. [Google Scholar]
- Jensen, J.A.; Svendsen, N.B. Calculation of pressure fields from arbitrarily shaped, apodized, and excited ultrasound transducers. IEEE Trans. Ultrason. Ferroelectr. Freq. Control 1992, 39, 262–267. [Google Scholar] [CrossRef] [PubMed] [Green Version]
- Perrot, V.; Petrusca, L.; Bernard, A.; Vray, D.; Liebgott, H. Simultaneous pulse wave and flow estimation at high-framerate using plane wave and transverse oscillation on carotid phantom. In Proceedings of the IEEE International Ultrasonics Symposium, Washington, DC, USA, 6–9 September 2017. [Google Scholar]
- Fromageau, J.; Gennisson, J.L.; Schmitt, C.; Maurice, R.; Mongrain, R.; Cloutier, G. Estimation of polyvinyl alcohol cryogel mechanical properties with four ultrasound elastography methods and comparison with gold standard testings. IEEE Trans. Ultrason. Ferroelectr. Freq. Control 2007, 54, 498–509. [Google Scholar] [CrossRef] [PubMed]
- Ramnarine, K.V.; Nassiri, D.K.; Hoskins, P.R.; Lubbers, J. Validation of a new blood-mimicking fluid for use in doppler flow test objects. Ultrasound Med. Biol. 1998, 24, 451–459. [Google Scholar] [CrossRef]
- Montaldo, G.; Tanter, M.; Bercoff, J.; Benech, N.; Fink, M. Coherent plane-wave compounding for very high frame rate ultrasonography and transient elastography. IEEE Trans. Ultrason. Ferroelectr. Freq. Control 2009, 56, 489–506. [Google Scholar] [CrossRef] [PubMed]
- Fedorov, A.; Beichel, A.; Kalpathy-Cramer, J.; Finet, J.; Fillion-Robin, J.C.; Pujol, S.; Bauer, C.; Jennings, D.; Fennessy, F.; Sonka, M.; et al. 3D slicer as an image computing platform for the Quantitative Imaging Network. Magn. Reson. Imaging 2012, 30, 1323–1341. [Google Scholar] [CrossRef] [PubMed]
- Tomov, B.G.; Jensen, J.A. Compact implementation of dynamic receive apodization in ultrasound scanners. In Medical Imaging 2004: Ultrasonic Imaging and Signal Processing; SPIE: San Diego, CA, USA, 2004. [Google Scholar]
- Ninet, J.; Roques, X.; Seitelberger, R.; Deville, C.; Pomar, J.L.; Robin, J.; Jegaden, O.; Wellens, F.; Wolner, E.; Vedrinne, C.; et al. Surgical ablation of atrial fibrillation with off-pump, epicardial, high-intensity focused ultrasound: Results of a multicenter trial. J. Thorac. Cardiovasc. Surg. 2005, 130, 803–809. [Google Scholar] [CrossRef] [PubMed]
- Bessiere, F.; N’djin, W.A.; Colas, E.C.; Chavrier, F.; Greillier, P.; Chapelon, J.Y.; Chevalier, P.; Lafon, C. Ultrasound-guided transesophageal high-intensity focused ultrasound cardiac ablation in a beating heart: A pilot feasibility study in pigs. Ultrasound Med. Biol. 2016, 42, 1848–1861. [Google Scholar] [CrossRef] [PubMed]
- Takei, Y.; Muratore, R.; Kalisz, A.; Okajima, K.; Fujimoto, K.; Hasegawa, T.; Arai, K.; Rekhtman, Y.; Berry, G.; Homma, S.; et al. In vitro atrial septal ablation using high-intensity focused ultrasound. J. Am. Soc. Echocardiogr. 2012, 25, 467–472. [Google Scholar] [CrossRef] [PubMed]
- Strickberger, S.A.; Tokano, T.; Kluiwstra, J.U.; Morady, F.; Cain, C. Extracardiac ablation of the canine atrioventricular junction by use of high-intensity focused ultrasound. Circulation 1999, 100, 203–208. [Google Scholar] [CrossRef] [PubMed]


| Parameters | Value |
|---|---|
| Probe parameters Matrix probe number of elements | 32 × 32 |
| Pitch | 0.3 mm |
| Center frequency | 3 MHz |
| Imaging parameters Transmit center frequency | 3 MHz |
| Sampling frequency | 12 MHz |
| Max imaging depth | 60 mm |
| Transmit full aperture Pulse Repetition Frequency (PRF) | 4 × 256 elements 200–2000 Hz |
| Frame-rate | 200–2000 fps |
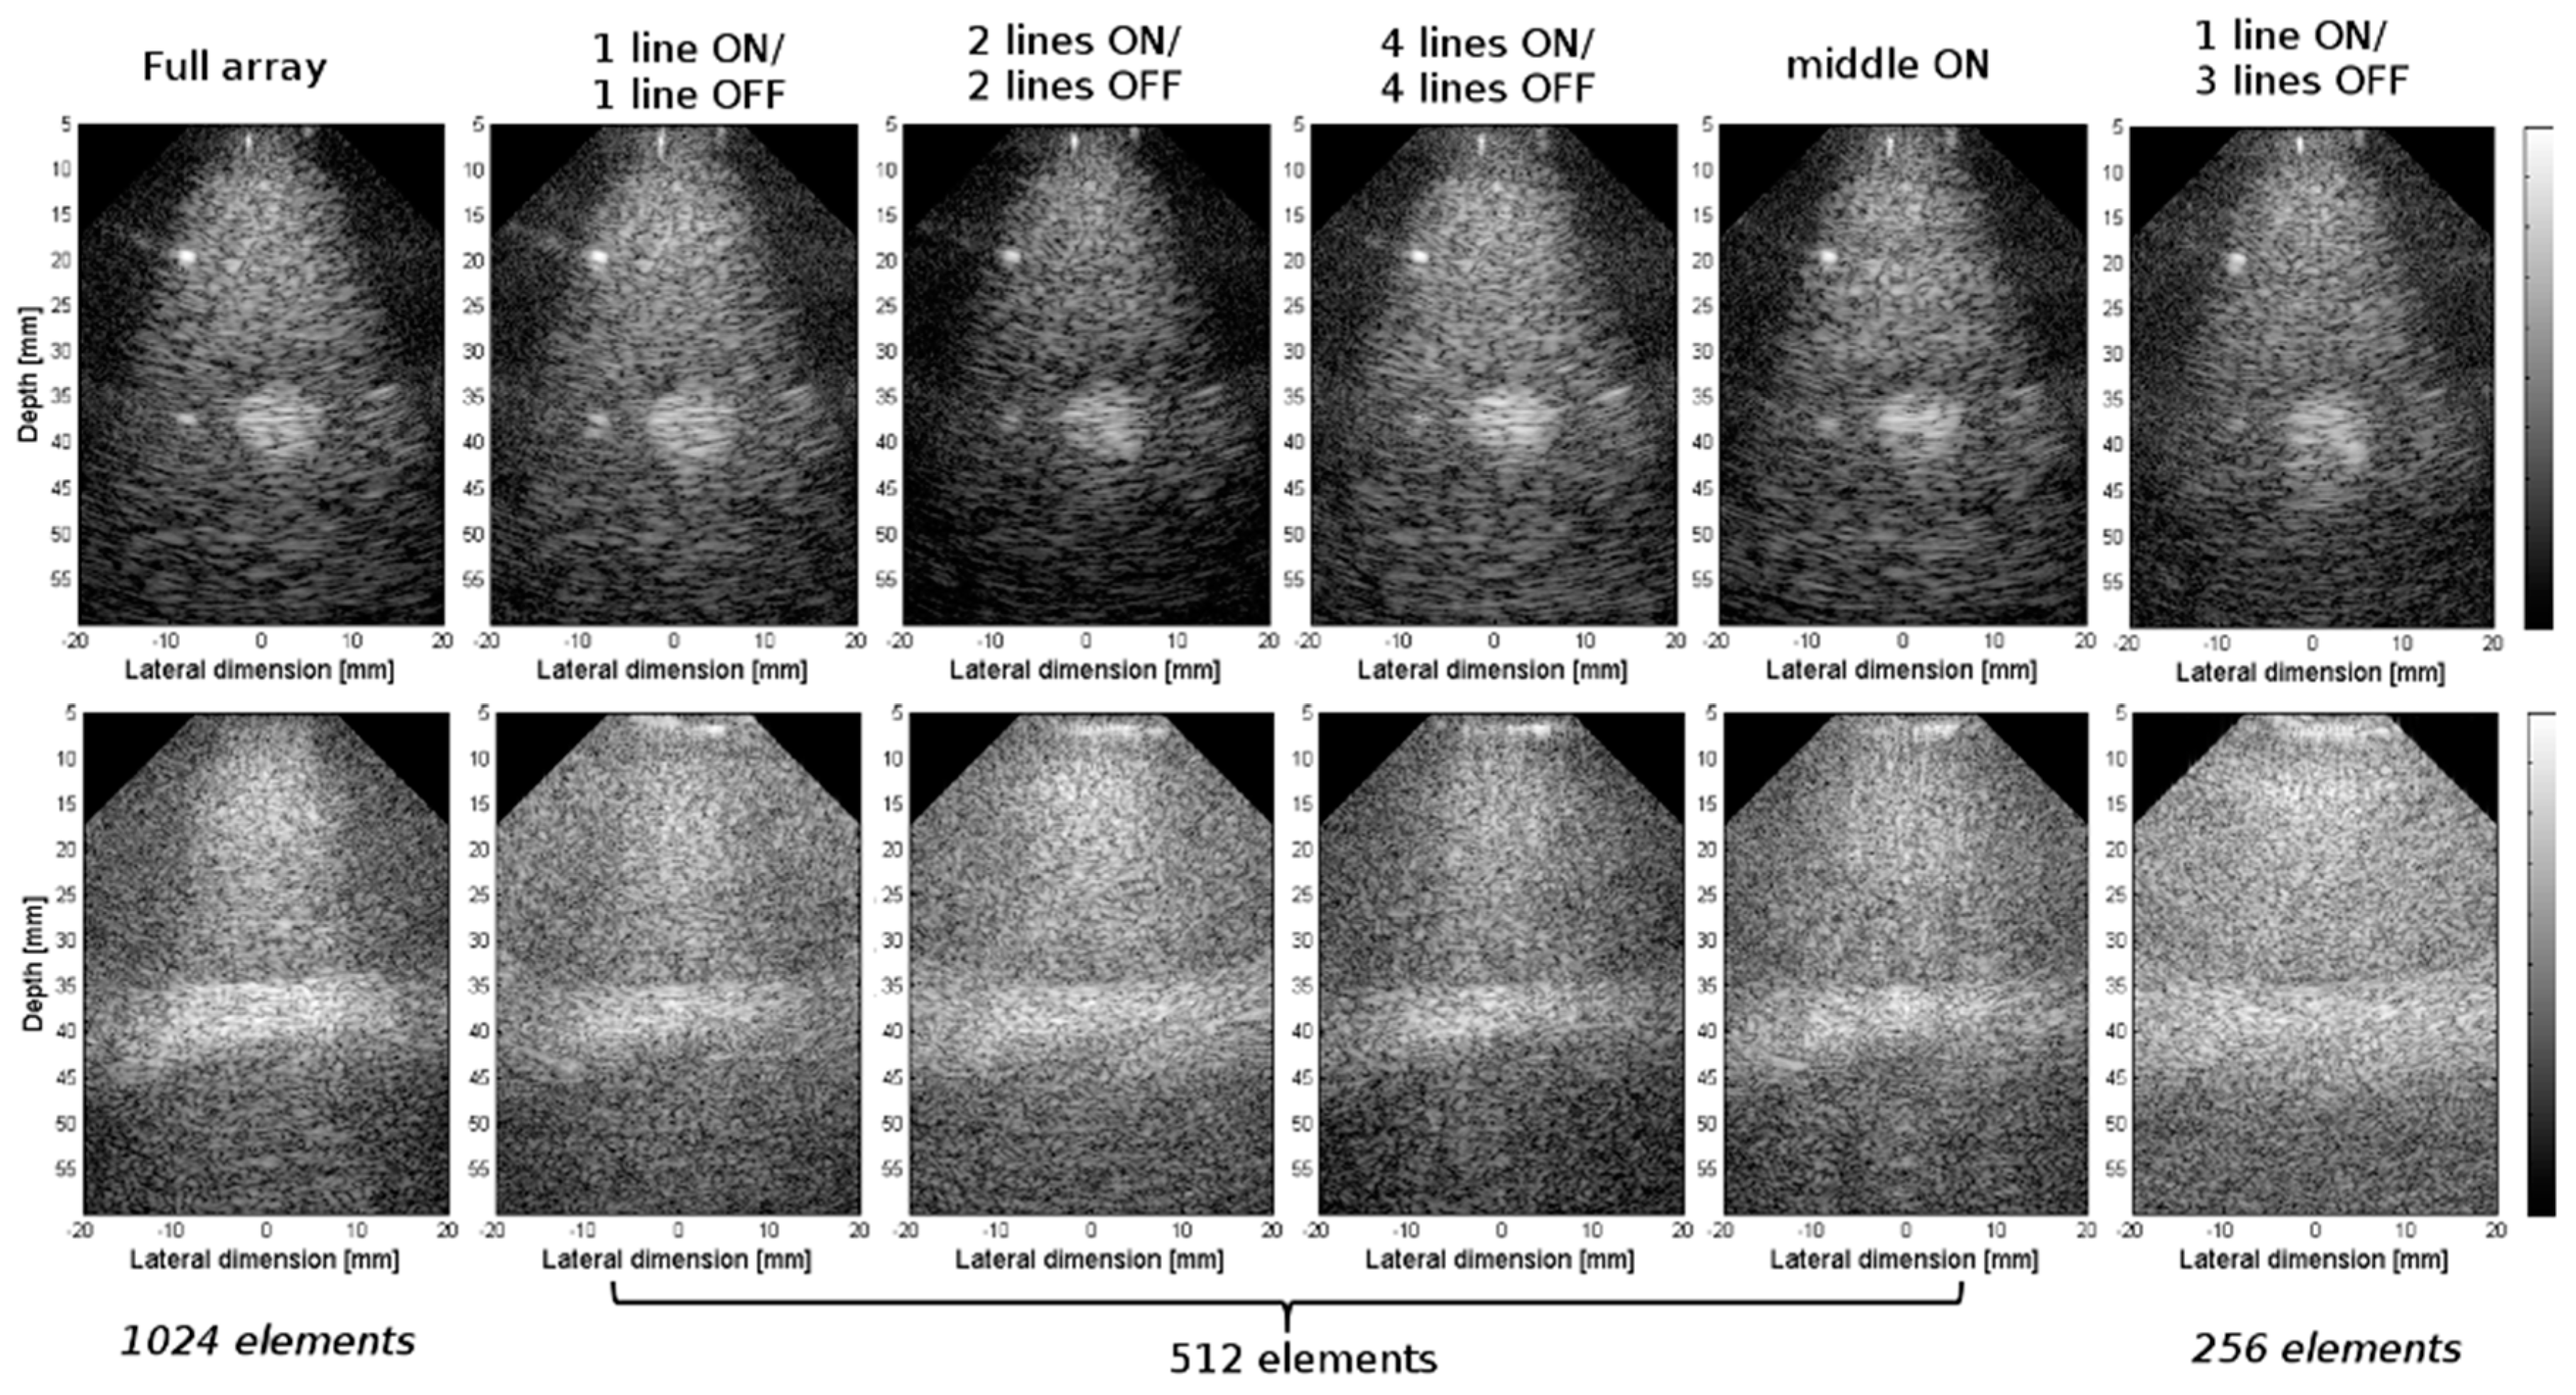
| Array Configuration | Matrix # Columns × #Rows | No. of Active Elements | Connectors (C) Used | No. of Verasonics (V) Systems |
|---|---|---|---|---|
| Full array | 32 × 32 | 1024 | C1:C8 | V1:V4 |
| 1 line ON/1 line OFF | 32 × 16 | 512 | C2,C4,C5,C7 | V1, V3 |
| 2 lines ON/2 lines OFF | 32 × 16 | 512 | C2,C4,C5,C7 | V1, V2 |
| 4 lines ON/4 lines OFF | 32 × 16 | 512 | C1:C8 | V1:V4 |
| Middle ON | 32 × 16 | 512 | C1:C8 | V1:V4 |
| 1 line ON/3 lines OFF | 32 × 8 | 256 | C2,C7 | V2 |
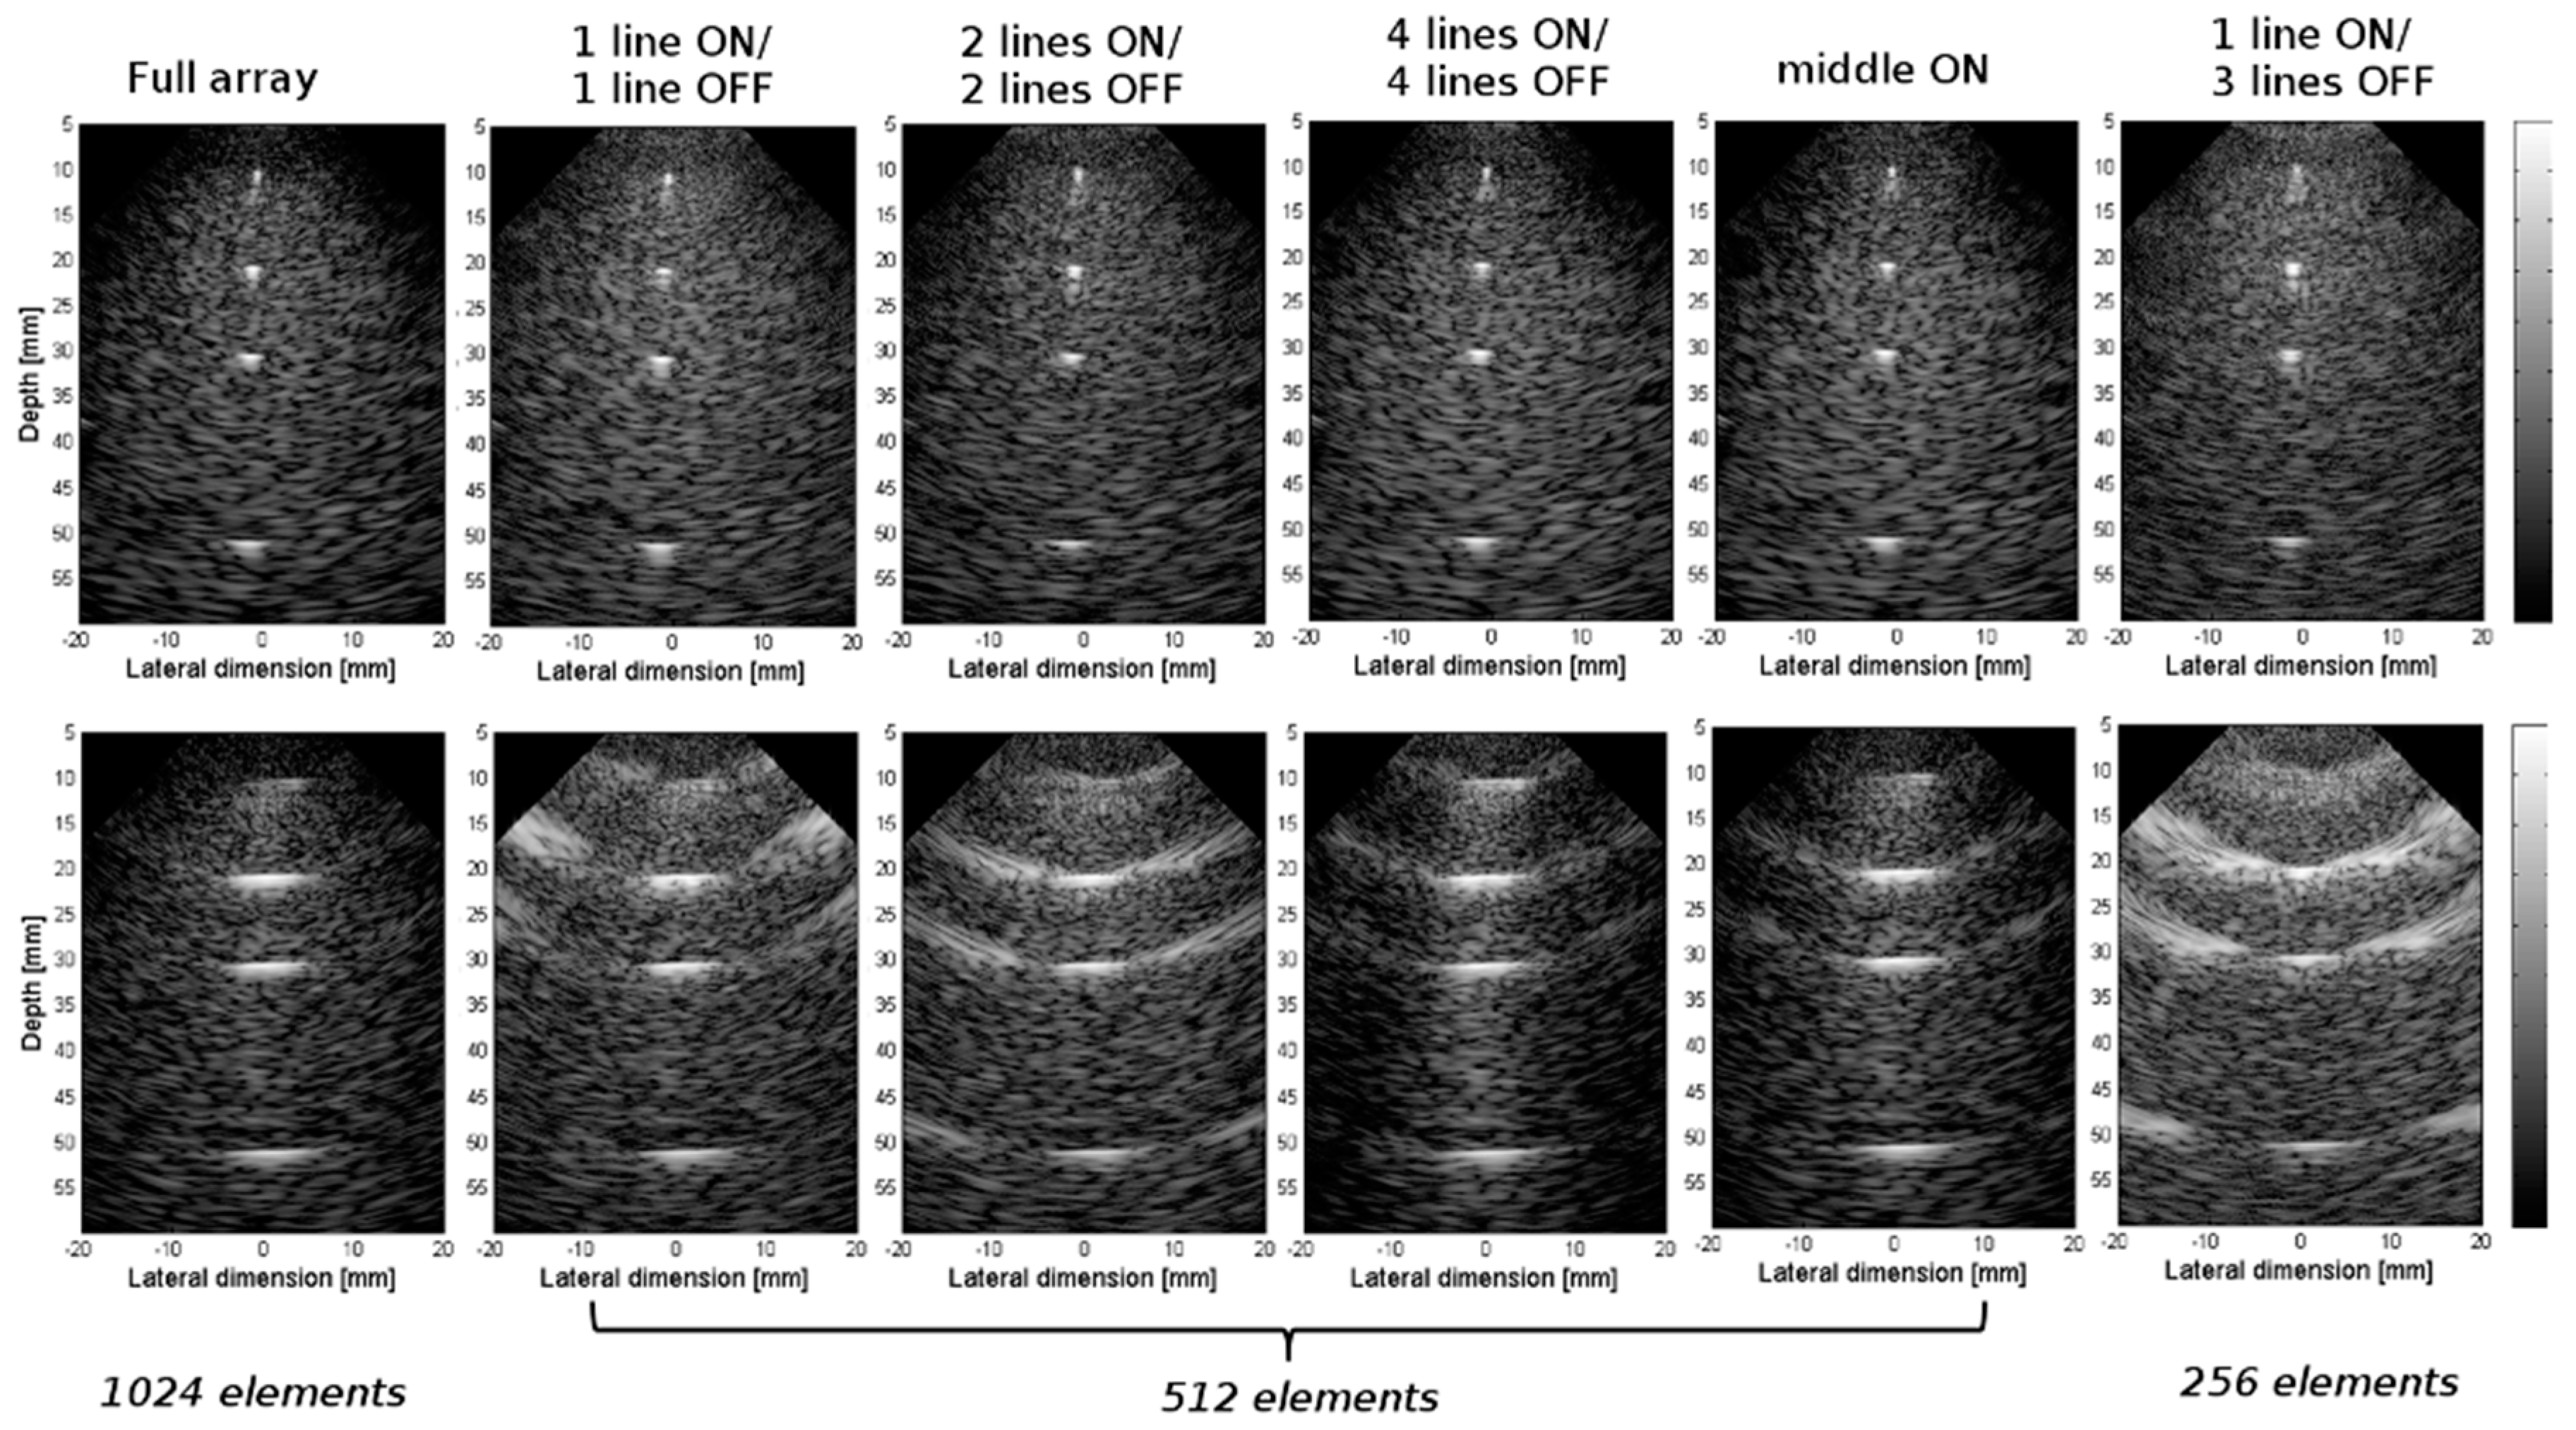
| Axial Resolution (mm) | Full Array | 1 Line ON/1 Line OFF | 4 Lines ON/4 Lines OFF | 2 Lines ON/2 Lines OFF | 1 Line ON/3 Lines OFF | |
|---|---|---|---|---|---|---|
| (y, z) plane | 40 dB | 1.2 | 2 | 4.6 | 2.6 | 2.2 |
| −6 dB | 0.7 | 0.8 | 0.9 | 0.6 | 0.6 | |
| (x, z) plane | 40 dB | 1.2 | 1.2 | 1.2 | 1.2 | 1.2 |
| −6 dB | 0.6 | 0.6 | 0.5 | 0.6 | 0.5 | |
| Resolution (mm) | Full Array | 1 Line ON/1 Line OFF | 2 Lines ON/2 Lines OFF | 4 Lines ON/4 Lines OFF | Middle ON | 1 Line ON/3 Lines OFF | |
|---|---|---|---|---|---|---|---|
| (x, z) plane | axial 10 mm | 1.8 | 2.5 | 2.4 | 2.8 | 2.9 | 4 |
| axial 20 mm | 1.7 | 2.5 | 3.1 | 2.2 | 2.3 | 3.3 | |
| axial 30 mm | 1.9 | 2.5 | 2 | 1.7 | 2.5 | 2.5 | |
| Average | 1.8 | 2.5 | 2.5 | 2.2 | 2.5 | 3.3 | |
| lateral 10 mm | 0.9 | 1.6 | 1.7 | 0.9 | 1 | 2.3 | |
| lateral 20 mm | 3 | 2.9 | 2.8 | 1.9 | 2.9 | 3.1 | |
| lateral 30 mm | 2 | 2.9 | 3 | 3.1 | 3 | 3.4 | |
| Average | 2 | 2.4 | 2.5 | 2 | 2.3 | 2.9 | |
| CR (dB) | Full Array | 1 line ON/1 line OFF | 2 lines ON/2 lines OFF | 4 lines ON/4 lines OFF | Middle ON | 1 line ON/3 lines OFF | |
| (y, z) plane | 7.71 | 2.84 | 2.30 | 4.20 | 3.50 | 2.02 | |
| CNR (dB) | Full array | 1 line ON/1 line OFF | 2 lines ON/2 lines OFF | 4 lines ON/4 lines OFF | Middle ON | 1 line ON/3 lines OFF | |
| (y, z) plane | 2.99 | −5.36 | −6.54 | −2.61 | −4.25 | −7.31 | |
© 2018 by the authors. Licensee MDPI, Basel, Switzerland. This article is an open access article distributed under the terms and conditions of the Creative Commons Attribution (CC BY) license (http://creativecommons.org/licenses/by/4.0/).
Share and Cite
Petrusca, L.; Varray, F.; Souchon, R.; Bernard, A.; Chapelon, J.-Y.; Liebgott, H.; N’Djin, W.A.; Viallon, M. Fast Volumetric Ultrasound B-Mode and Doppler Imaging with a New High-Channels Density Platform for Advanced 4D Cardiac Imaging/Therapy. Appl. Sci. 2018, 8, 200. https://doi.org/10.3390/app8020200
Petrusca L, Varray F, Souchon R, Bernard A, Chapelon J-Y, Liebgott H, N’Djin WA, Viallon M. Fast Volumetric Ultrasound B-Mode and Doppler Imaging with a New High-Channels Density Platform for Advanced 4D Cardiac Imaging/Therapy. Applied Sciences. 2018; 8(2):200. https://doi.org/10.3390/app8020200
Chicago/Turabian StylePetrusca, Lorena, François Varray, Rémi Souchon, Adeline Bernard, Jean-Yves Chapelon, Hervé Liebgott, William Apoutou N’Djin, and Magalie Viallon. 2018. "Fast Volumetric Ultrasound B-Mode and Doppler Imaging with a New High-Channels Density Platform for Advanced 4D Cardiac Imaging/Therapy" Applied Sciences 8, no. 2: 200. https://doi.org/10.3390/app8020200