Correlation between Material Properties and Breakage Rate Parameters Determined from Grinding Tests


School of Mineral Resources Engineering, Technical University of Crete, University Campus, Kounoupidiana, 73100 Chania, Greece
*
Author to whom correspondence should be addressed.
Appl. Sci. 2018, 8(2), 220; https://doi.org/10.3390/app8020220
Submission received: 22 December 2017
/
Revised: 24 January 2018
/
Accepted: 28 January 2018
/
Published: 31 January 2018
Abstract
:The present study investigates four materials, namely quartz, marble, quartzite and metasandstone and aims to establish correlations, with the use of simple and multiple regression analysis, between their properties and breakage rate parameters. The material properties considered in this study derived from the application of destructive and non-destructive tests and include P-wave velocity (Vp), Schmidt rebound value (RL), uniaxial compressive strength (UCS) and tangent modulus of elasticity (Et), while the breakage rate parameters determined from batch grinding tests, include breakage rate Si, maximum breakage rate Sm, αT and α, and optimum particle size xm. The results indicate that the properties of all materials examined show very good correlation and can be used to predict Si or αT. Furthermore, parameter α is well correlated with Vp, RL and Et using inverse exponential functions, while Sm is strongly correlated with RL and UCS. Overall, it is deduced that multiple regression analysis involving two independent variables is a reliable approach and can be used to identify correlations between properties and breakage rate parameters for quartz, quartzite and metasandstone, which are silica rich materials. The only exception shown is the determination of xm for marble.
1. Introduction
Comminution and especially grinding is one of the most important operations of the materials processing industry. For many decades, it has been the subject of intensive research in several industrial sectors including mineral processing [1,2], metallurgy [3], cement, chemicals and ceramics production [4,5]. In addition, interest has been paid in recent years on the production of ultra-fine materials due to their improved physical and mechanical properties [6]. It is also known that comminution is an energy intensive process and has low efficiency, due to the fact that most energy consumed is absorbed by the device and only a small share is used for size reduction [7]. Considering these factors, it is deduced that improvement of process efficiency will definitely have a large impact on the operating cost of the mill, the environment and the conservation of resources.
Scientific research, aiming to improve grinding efficiency, was initiated with the empirical relationships of Rittinger, Kick, Bond as well as Walker and Shaw, which described the energy-particle size relationship [8]. Later, theories which incorporated the concept of particle size distribution were developed [9,10], while recently research focused on the use of the mechanistic approach which is based on the recognition of physical events that take place during grinding [11,12,13]. The mechanistic approach includes the matrix model, which considers grinding as a series of breakage events and the population balance model, which considers grinding as a continuous process. The population balance model considers first order kinetics and uses two functions, namely the breakage rate Si and the breakage function bi,j [14,15]. These functions generate the fundamental size-mass balance equation which is applied for fully mixed batch grinding operations. It is mentioned that many researchers have underlined the advantages of these functions [16,17], while the scale-up from laboratory to industrial mills has also been discussed in a number of studies [18,19,20,21].
The variation of breakage rate Si (min−1) as a function of particle size xi (mm) has been considered by Austin [15] and is expressed with Equation (1), which is accepted by many researchers [22,23,24].
where, xi (mm) is the upper size of class i, x0 is the standard size (1 mm), αT (parameter that depends on milling conditions) is the breakage rate for size xi = 1 mm and α is a characteristic parameter depending on material properties. Qi is a correction factor, which is 1 for small particles (normal breakage) and smaller than one for large particles that need to be nipped and fractured by the grinding media. In the abnormal breakage region, the material behaves as it consists of a soft and a harder fraction [16]. Qi is calculated from Equation (2) [15],
where, µ is a parameter that depends on milling conditions and Λ is a positive number that depends on material type and shows how rapidly the breakage rate decreases as size increases (Λ ≥ 0). In addition, the particle size xm for which the breakage rate reaches its maximum value is related with parameter µ through the following equation [25,26],
Equation (3) shows that xm is directly proportional to μ since for the same material α and Λ are constants.
The physical and mechanical properties of a material play a crucial role in the design of a mineral processing circuit. The reliable determination of these properties enables the prediction of milling results and in this case no extensive milling tests that require large amounts of time and material are needed [27]. In this respect, several researchers [28,29,30,31,32,33,34,35,36] have attempted to identify the relationship between various material properties and P-wave velocity. These studies indicated that sound velocity is closely related to physico-mechanical properties such as uniaxial compressive strength, modulus of elasticity, hardness, effective porosity, water absorption and both saturated and dry density. P-wave velocity test is non-destructive, offers several advantages to researchers and can be easily applied both in laboratory and in situ. It is mentioned that P-wave velocity is related with the characteristics of the whole body of the material tested [29].
The Schmidt hammer test is equally acceptable and used for estimating indirectly material hardness and strength, through the determined RL value, which depends on the properties of the specimen. The operation of the device is based on the principle that the rebound of an elastic mass impacting on a surface depends on its hardness and thus the harder the surface the higher is the rebound distance [37]. Several societies, including the International Society for Rock Mechanics [38,39] and the American Society for Testing and Materials [40], have proposed test methods and standards, respectively, for the proper operation of the device [41]. Other options for determining such material properties with the use of the Schmidt hammer have also been proposed [42,43,44].
Breakage rate parameters depend on material properties, so it is very useful and practical from a laboratory and industrial point of view if correlations between them are established. In this regard, Deniz [45] used limestone as test material and identified the relationship between Bond’s grindability and breakage rate parameters, while Aras [46] established important correlations between the point load index and Bond’s grindability as well as breakage rate parameters. However, so far no correlations between other material properties such as uniaxial compressive strength or modulus of elasticity and breakage rate parameters have been established.
This study has a certain degree of novelty since it attempts to establish potential correlations between material properties derived from the application of destructive and non-destructive tests, and breakage rate parameters.
2. Materials and Methods
The materials used in the present experimental study were obtained from several Greek sites, namely quartz from Assiros, near Thessaloniki; marble from west Crete, Chania region; and quartzite and metasandstone from west Crete, Kissamos area. More than 100 kg of each material was sampled from several locations of the same site in order to obtain representative samples. Mineralogical analyses show that marble consists mainly of calcite, while quartzite and metasandstone of quartz and some mica. The quartz samples used in this study were of high purity white quartz. The main difference between quartzite and metasandstone is the degree of transformation. Quartzite, due to dynamic re-crystallization, consists of fine crystalline and elongated quartz grains, which are well oriented; due to the mechanical strain imposed, individual quartz crystals are present. However, metasandstone consists of a fine crystalline matrix with individual quartz crystals, which exhibit lack of orientation due to the lower degree of transformation compared to quartzite. In addition, large gaps are observed between its grains due to the high porosity. Table 1 presents the porosity and density of each raw material, as determined with the use of Archimedes method [47]; all measurements were carried out in triplicate and average values are shown. The standard deviation of porosity and density was 0.002 and 0.005 respectively, for all materials tested.
Cylindrical cores of representative samples with NX size (diameter 54.7 mm) were used to determine the physico-mechanical properties of each material. Both ends of the core specimens were cut flat and polished using a cut-off and a special polishing machine, respectively. The height to diameter ratio of all specimens was kept equal to 2 in order to minimize the size effect. From each material type 6–8 specimens were cored (Figure 1a,b). Specimens exhibiting cracks, discontinuities, or alteration phenomena as a result of coring were not used in tests and replaced with new specimens.
In this study, the non-destructive P-wave velocity and Schmidt hammer rebound tests were carried out. The P-wave velocity test was performed using the PUNDIT 6 (Portable Ultrasonic Non-destructive Digital Indicating Tester) device (CNS Farnell, London, UK) at a frequency of 1 MHz. According to the procedure, two transducers were placed opposite the two parallel surfaces of the core samples (Figure 2a,b) and the travel time of the ultrasonic waves, from one transducer to the other, was recorded. By taking into account that the distance between the two surfaces of each specimen is known, the velocity of the ultrasonic waves can be calculated [48]. It is known that the ultrasonic velocity depends on density and the elastic properties of each material and is higher when the sample has adequate density, uniformity and homogeneity [49].
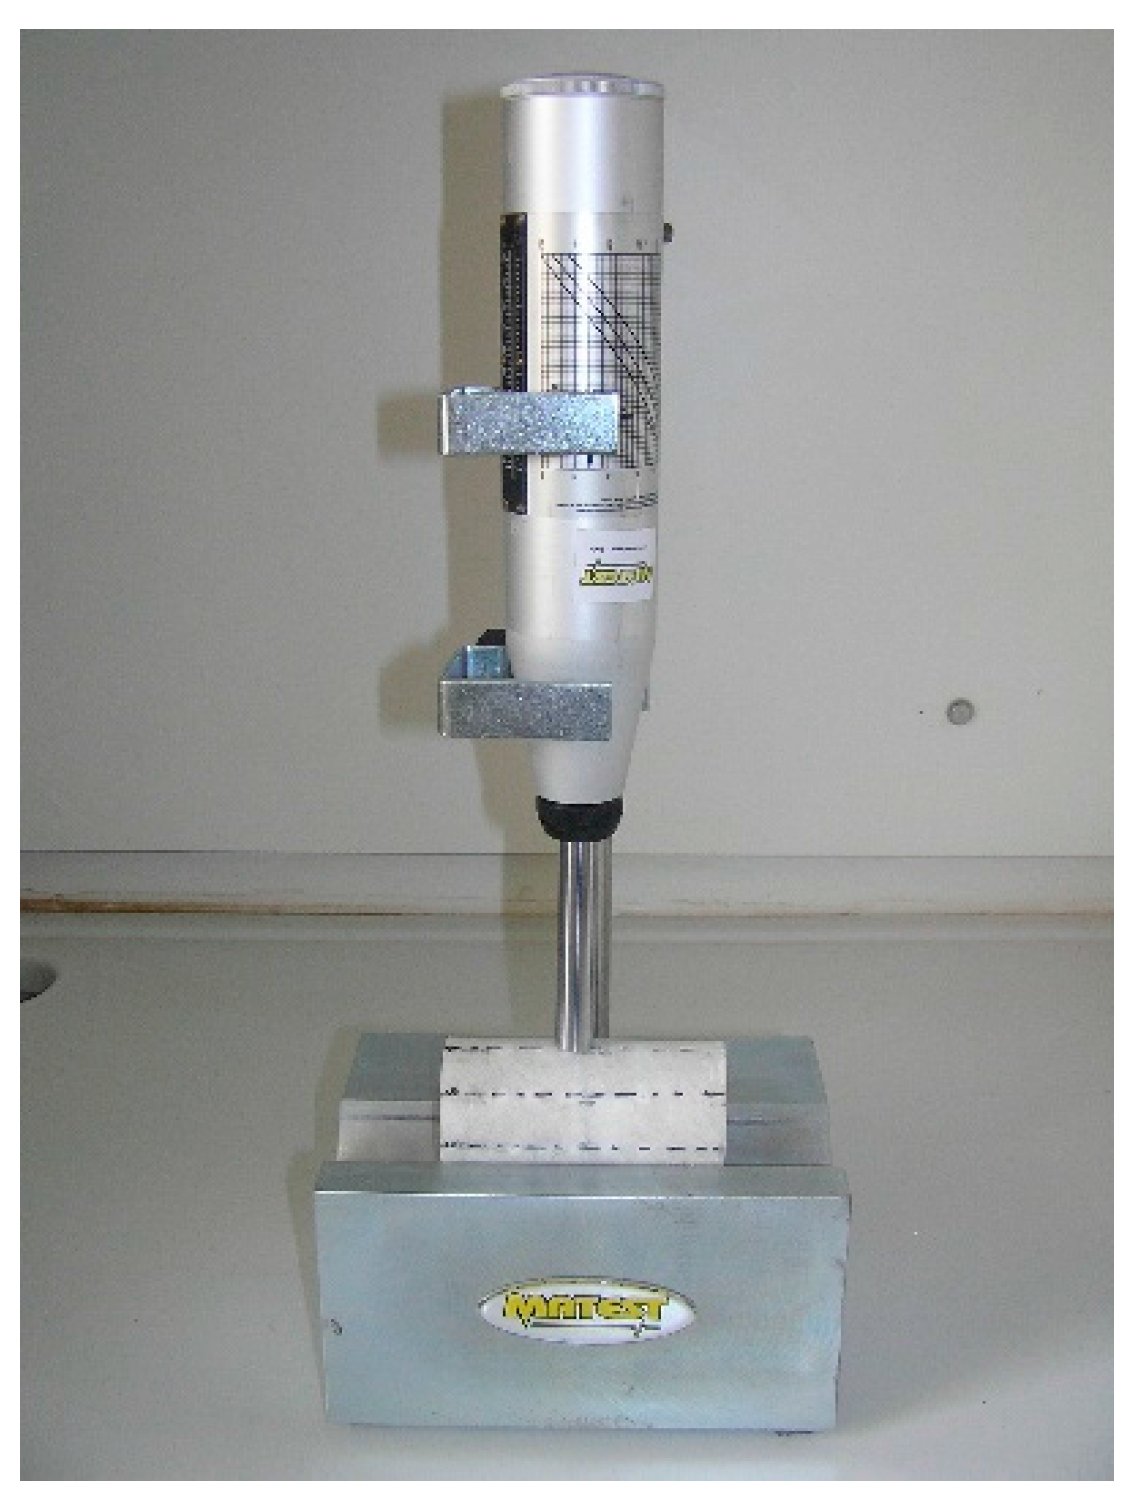
The Schmidt hammer rebound test was performed using an L-type hammer with impact energy 0.735 Nm. Core specimens were tested in a V-shaped cradle block with an approximate weight of 23 kg. Prior to test execution the circular ends of each specimen were divided into eight equal arcs, from the ends of which eight straight parallel lines along their longitudinal axis were drawn (Figure 3). The test was performed by placing the core specimens in the cradle and impacting the hammer vertically along the drawn lines, starting from line No1 (Figure 4). In this manner, five individual impacts were conducted at equal spacing and consequently five rebound values RL were recorded along the first line drawn. Then, the same procedure was repeated by rotating the specimen 45°. In total, depending on the number of the specimens used, 40 rebound values for each specimen and 240 or 280 for each material were recorded. The rebound values given in this study for each material are the average of all recorded values.
After the execution of non-destructive tests, the cylindrical specimens were used for the determination of their uniaxial compressive strength (UCS) and tangent modulus of elasticity (Et). The uniaxial compression tests were performed using a 1600 KN hydraulic device, manufactured by MTS (Mechanical Testing System) corporation (Kalamazoo, MI, USA). According to the procedure, the cylindrical specimens were subjected to a load acting on both ends (Figure 5a), using a loading rate 0.01 mm/s under displacement control mode; the failure of specimens occurred in less than 5 min. The peak stress value and the tangent modulus of elasticity of each specimen were calculated from the complete stress-strain curve (Figure 5b).
For the determination of the breakage rate parameters, experiments were performed in a laboratory-scale ball mill with a volume of 5423 cm3 (Table 2) operating at a constant speed of Ν = 66 rpm (1.1 Hz), which is 70% of its critical speed. The core samples as well as other materials with the same properties (porosity, density, mineralogy etc.) were crushed and prepared for the grinding tests. The mill charge consisted of 25.4 mm (1 inch) stainless steel balls with density ρb = 7.85 g/cm3. The parameters J (ball filling volume) and fc (material filling volume), were calculated from Equations (4) and (5), respectively.
where, ε is the bed porosity of balls and material (assumed to be 40%) [15].
The material filling volume fc was kept constant at 4%, corresponding to 345.0 g, 351.5 g, 342.5 g and 273.3 g of quartz, marble, quartzite and metasandstone, respectively. The fraction of the space between the balls at rest that is filled with material (interstitial filling, U) was calculated from Equation (6); in this study, U was kept constant at 0.5.
Four mono-size fractions of each material (−3.35 + 2.36 mm), (−1.7 + 1.18 mm), (−0.850 + 0.600 mm) and (−0.425 + 0.300 mm) were ground in a laboratory ball mill for various grinding times t (0.5, 1, 2, 4 min). The products obtained after each grinding time t were wet sieved using a series of screens with a ratio of for the determination of particle size distribution. It should be noted that fresh feed was used in each test and the mill was loaded using successive layers of balls and feed [50].
3. Results and Discussion
3.1. P-Wave Velocity of Materials
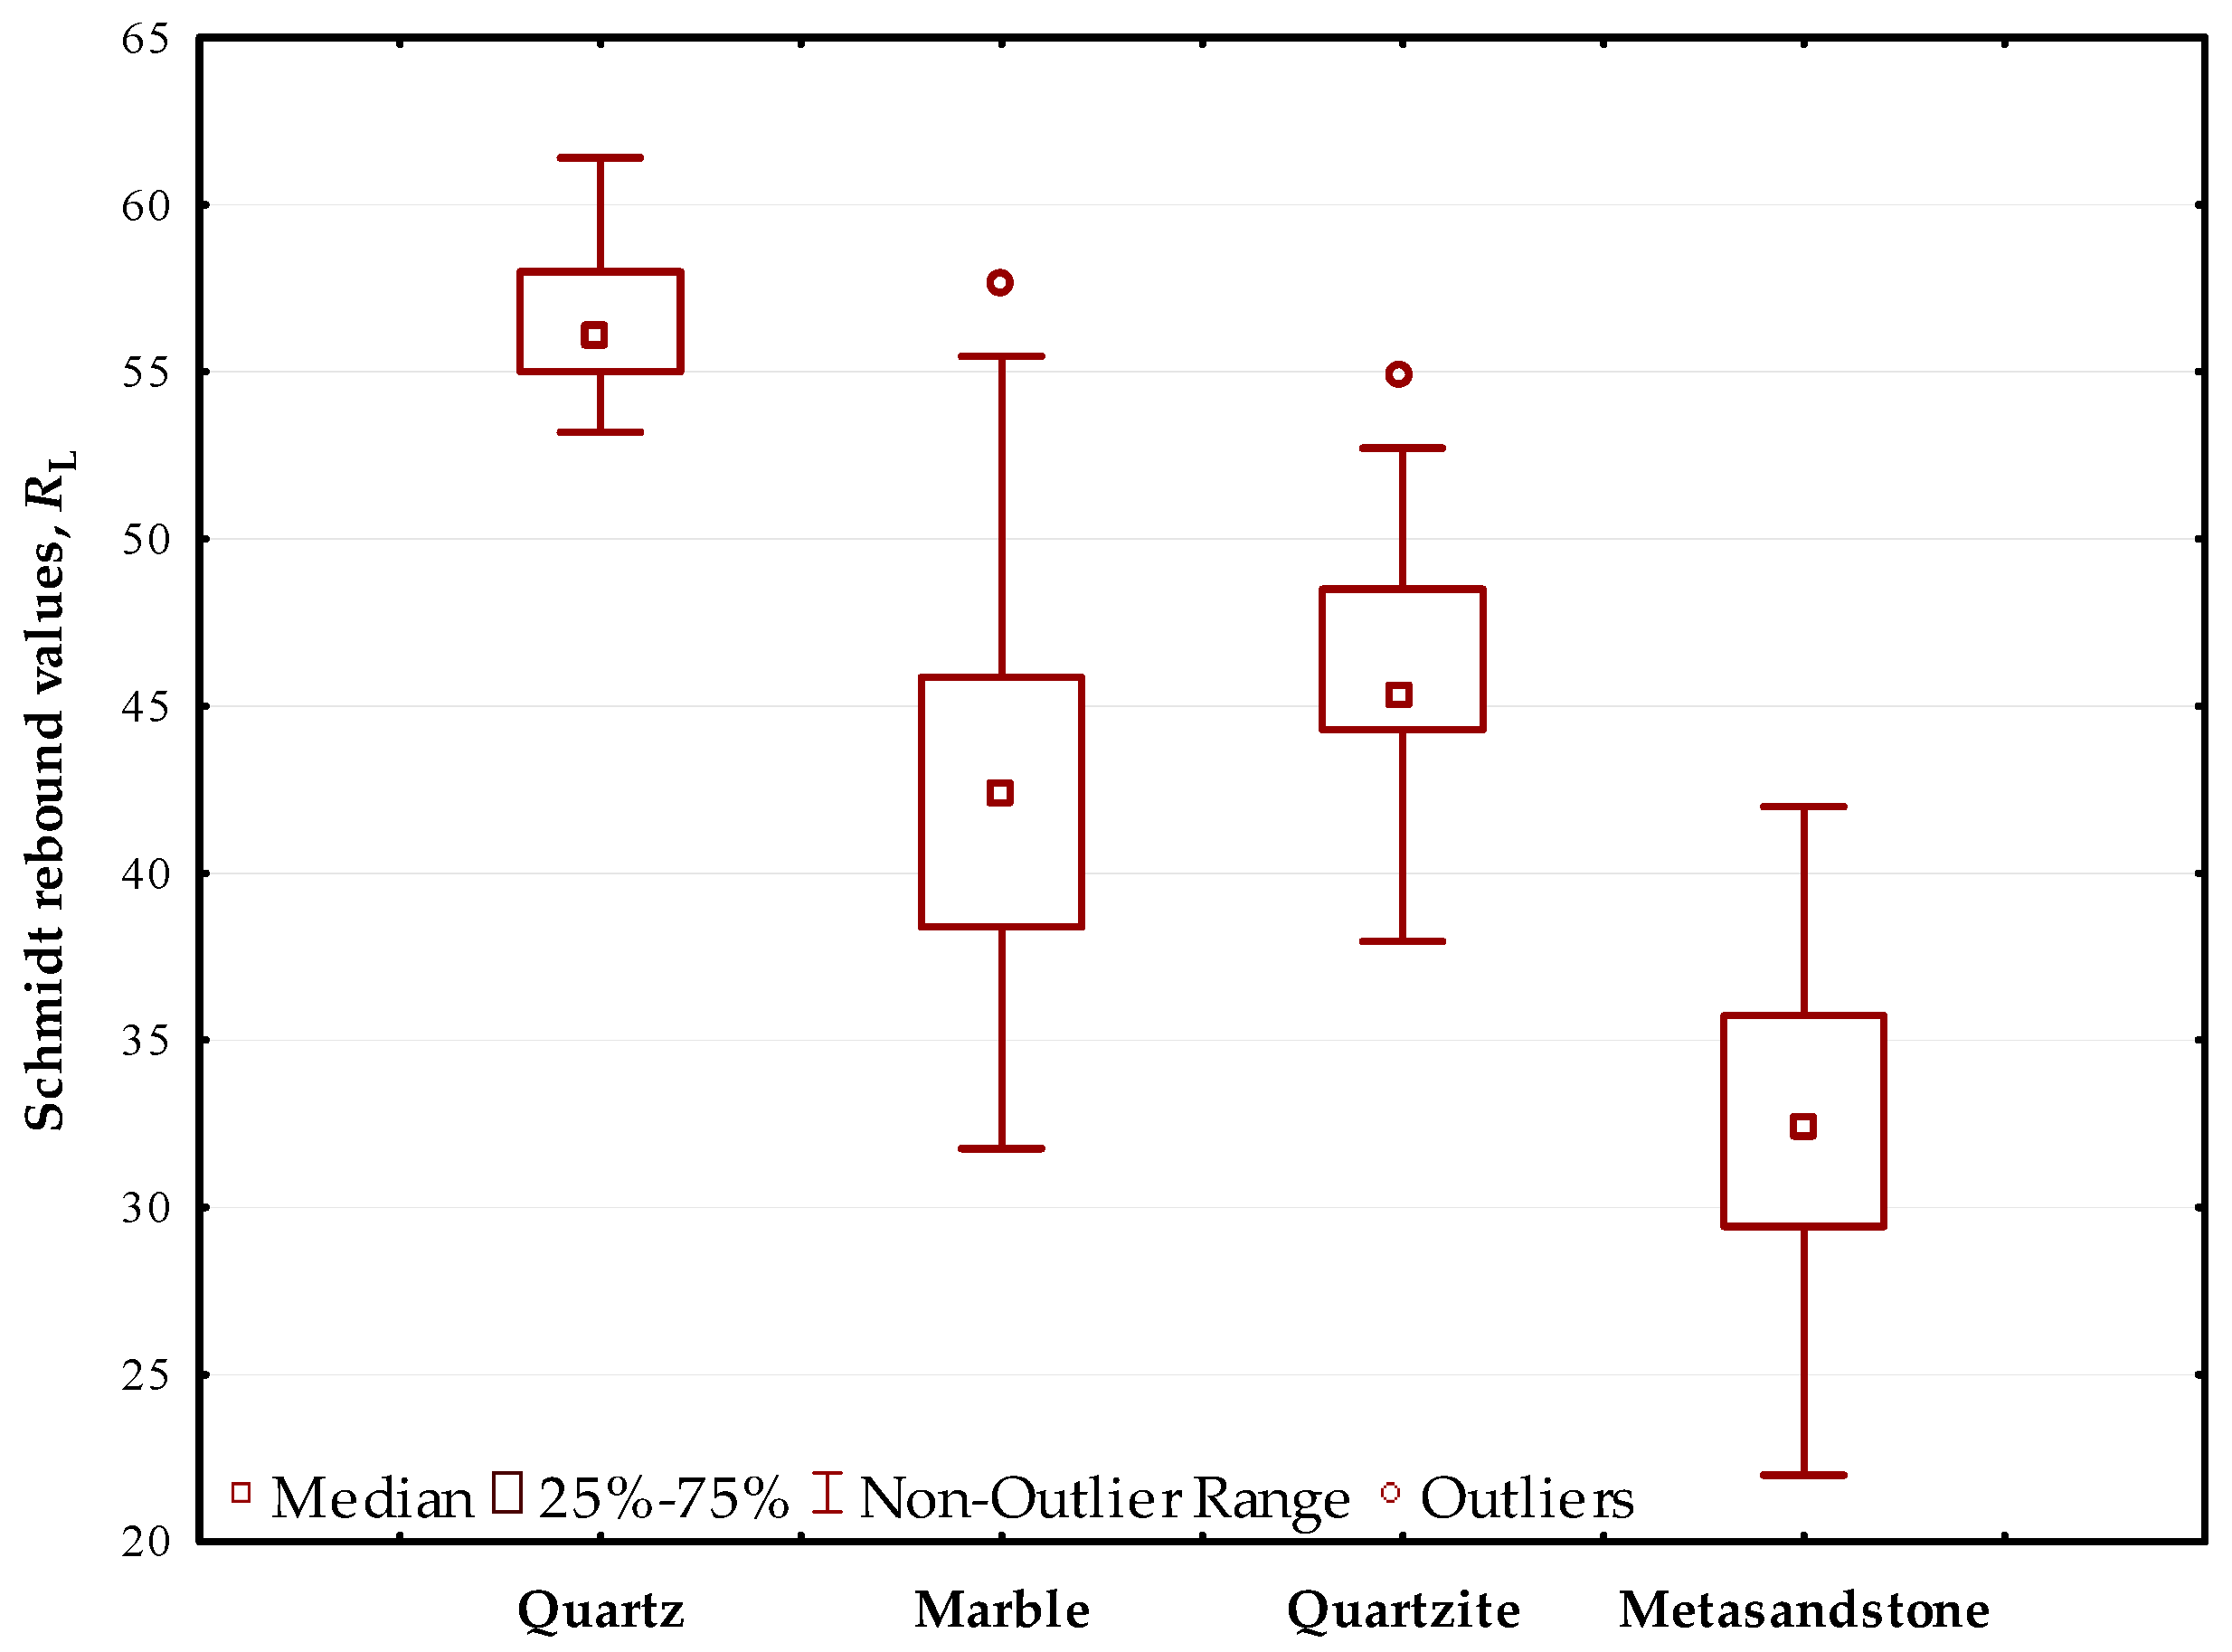
The P-wave velocity for each material is shown in Figure 6 in Box and Whisker plots which were designed with the use of Statistica v.10 software (StatSoft Inc., Tulsa, OK, USA). In these plots the central rectangle spans the first to the third quartile, while the segment inside the rectangle represents the median (second quartile). Whiskers above and below the rectangle show the maximum and minimum values and identify the non-outlier range. Any value outside that range is plotted as independent point and is called outlier.
Figure 6 shows that outliers are present, just below the minimum value, only for quartz and quartzite. It is also observed that the descending order of materials with respect to the median Vp value is quartz, marble, quartzite and metasandstone. The statistical results of P-wave velocity also show that the mean Vp values of the materials follow the same order as the median values. Furthermore, low standard deviation is observed for Vp for all the materials tested and thus the data are clustered around the mean Vp values. It is also mentioned that similar values were obtained in other studies for marble and quartzite [51], sandstone [52] and quartz [53].
3.2. Schmidt Rebound Values
The Schmidt rebound values are shown in Figure 7. It is seen that outliers, more clear in this case, are present only for marble and quartzite. It is also observed that the descending order of materials with respect to the median RL value is quartz, quartzite, marble and metasandstone. The statistical results of RL for the materials tested also show that the mean RL values follow the same descending order as observed for the median values. Finally, it is also indicated that the values obtained in this study are well within the range of values reported in other studies for quartz and quartzite [54], marble [55] and metasandstone [56].
3.3. Uniaxial Compressive Strength and Modulus of Elasticity
The statistical results of UCS and Et for each material are shown in Table 3 and Table 4, respectively. Table 3 shows that the descending order of materials with respect to the mean UCS value is quartz, quartzite, marble and metasandstone. As far as the modulus of elasticity (Et) is concerned, the descending order of materials with respect to the mean Et value is quartz, marble, quartzite and metasandstone (Table 4); this indicates, as expected, that quartz is the stiffest material and thus more resistant to deformation. Similar UCS values have been reported in other studies for quartz [57], quartzite [58], marble and sandstone [59].
3.4. Breakage Rate Parameters
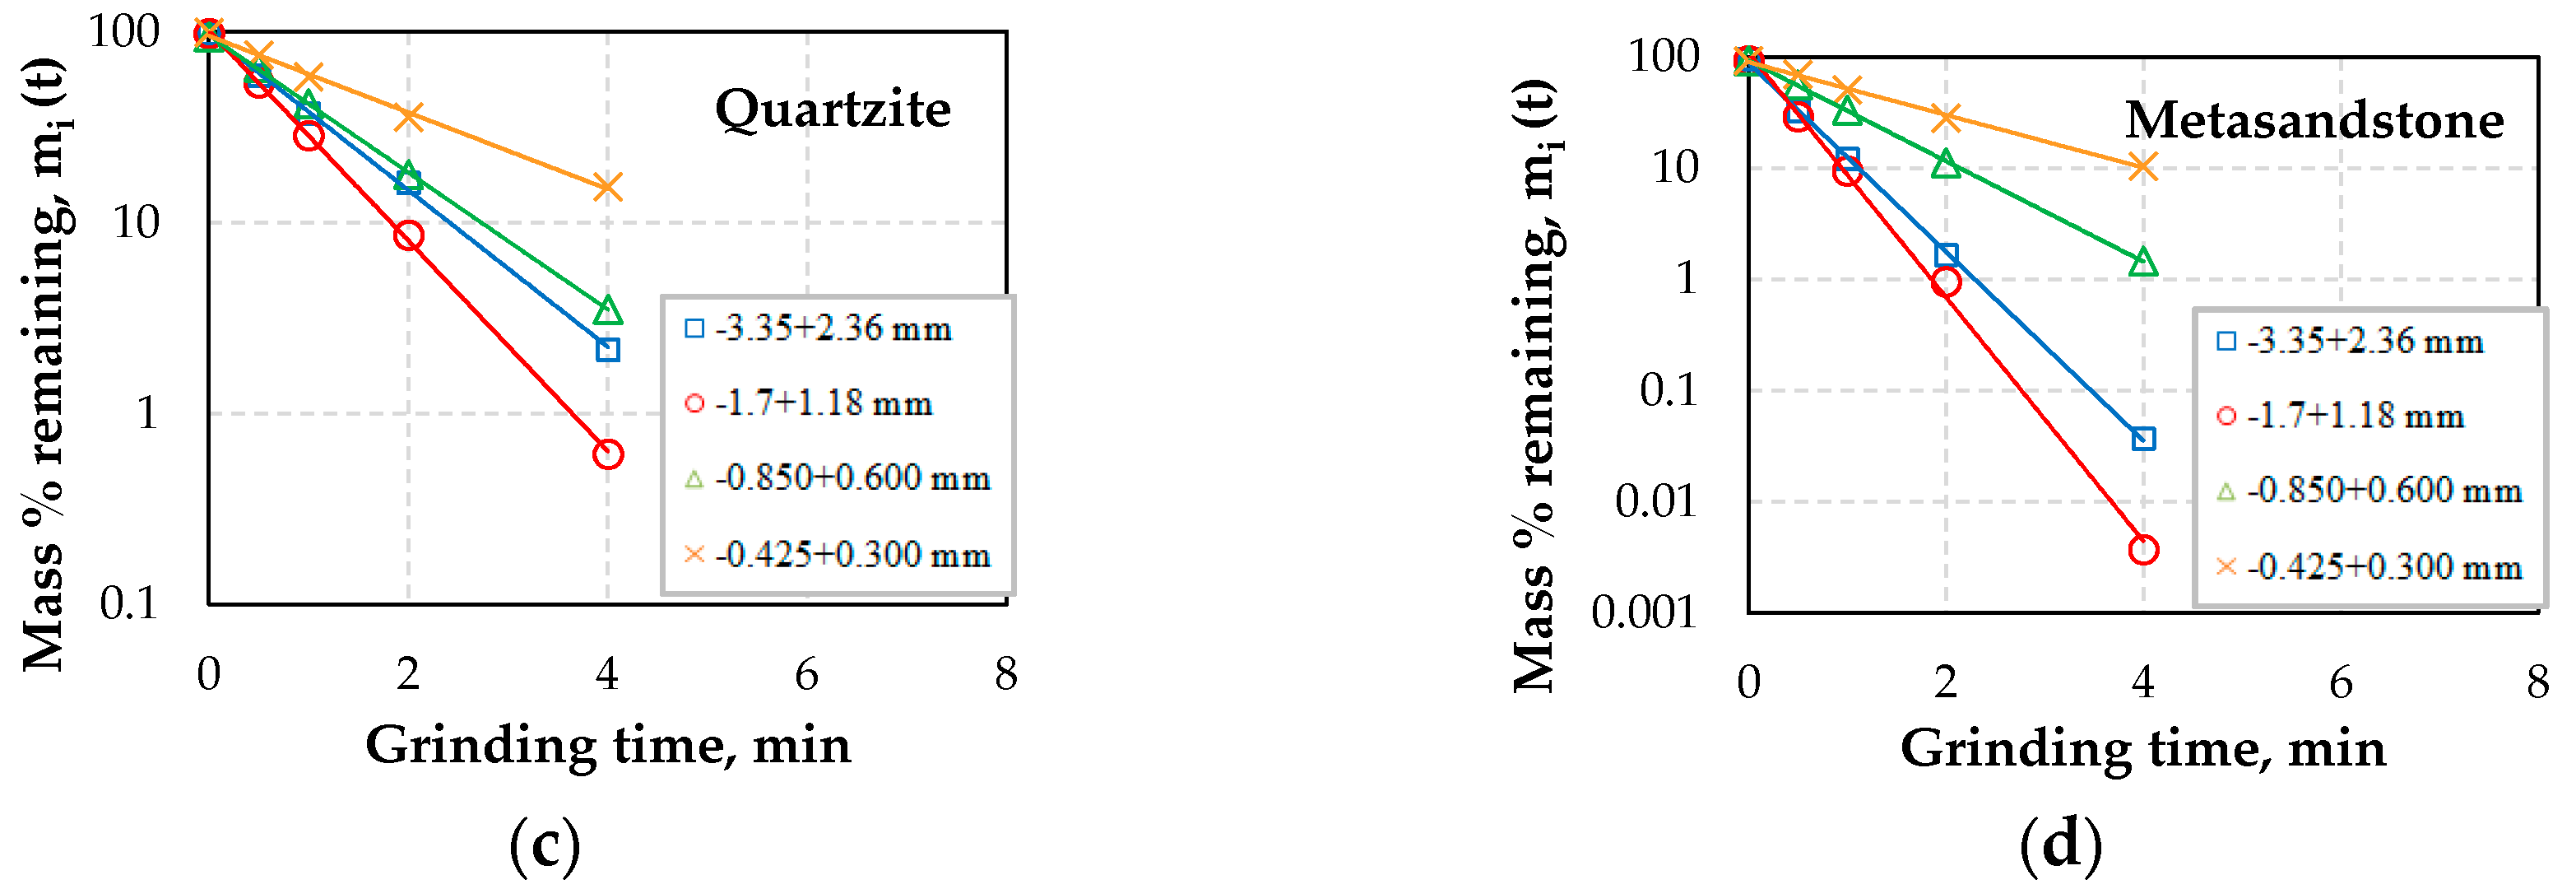
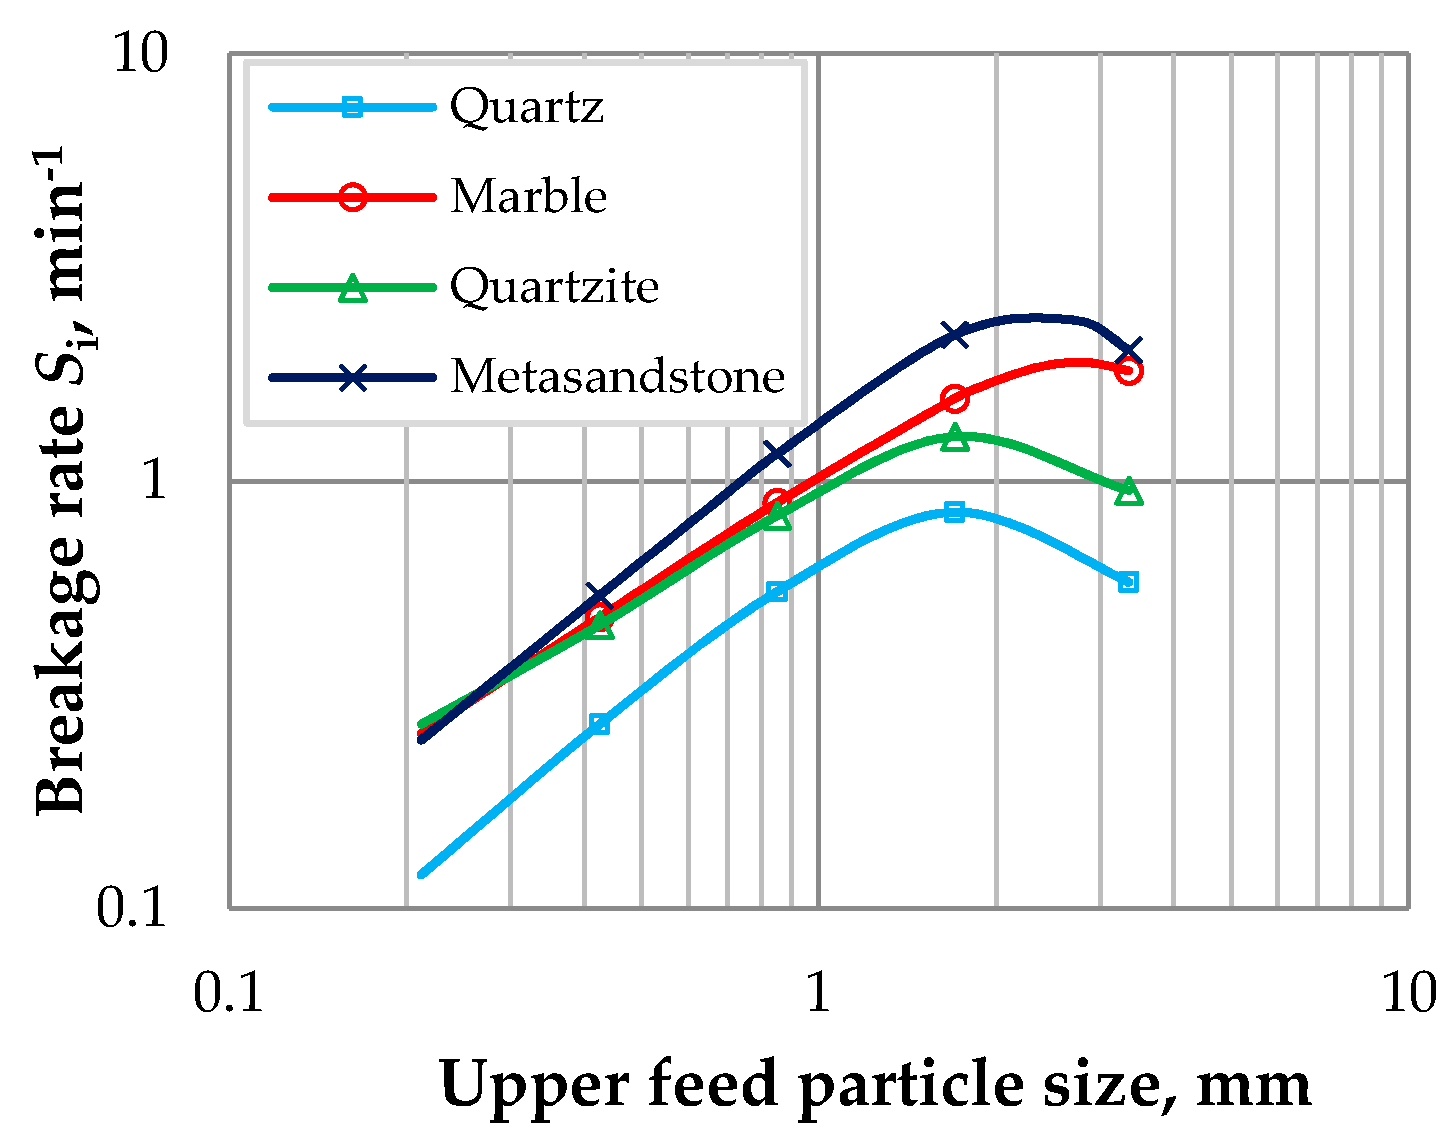
Figure 8a–d shows in normal-log plots the relationship between the remaining mass fraction of each feed size vs. grinding time for all materials used. The feed size is the upper size of the tested size fractions. The results indicate that breakage follows a first order law i.e., the breakage rate Si is independent of time and the Si values can be determined from the slope of the straight lines. Each line refers to a different feed size. Figure 9 shows on log–log scale the variation of Si values, obtained from the first order plots, with the upper feed particle size. It is shown that for each material Si increases up to a specified size xm (optimum feed size), but above this size breakage rates decrease sharply, since particles are too large to be nipped and fractured by the grinding media used. The optimum size xm for each material is the size at which, under normal grinding conditions, the highest breakage rate Sm is reached. It is mentioned that the breakage rate parameters were back calculated using the Moly-Cop Tools™ v.1.0 software and the determined values are presented in Table 5. The back calculation method is described in detail in a previous recent publication of the authors [8].
3.5. Correlation between Material Properties and Breakage Rate Parameters
3.5.1. Simple Regression Analysis
In the first part of this study simple regression analysis involving one dependent and one independent variable was carried out, while Excel software was used to establish potential correlations between material properties and breakage rate parameters. During this part, linear or non-linear functions were used and the equation with the highest correlation coefficient R2 was considered for determining the breakage rate parameters (Si, αΤ, α, Sm and xm). It is mentioned that no similar functions are given so far in other studies in literature.
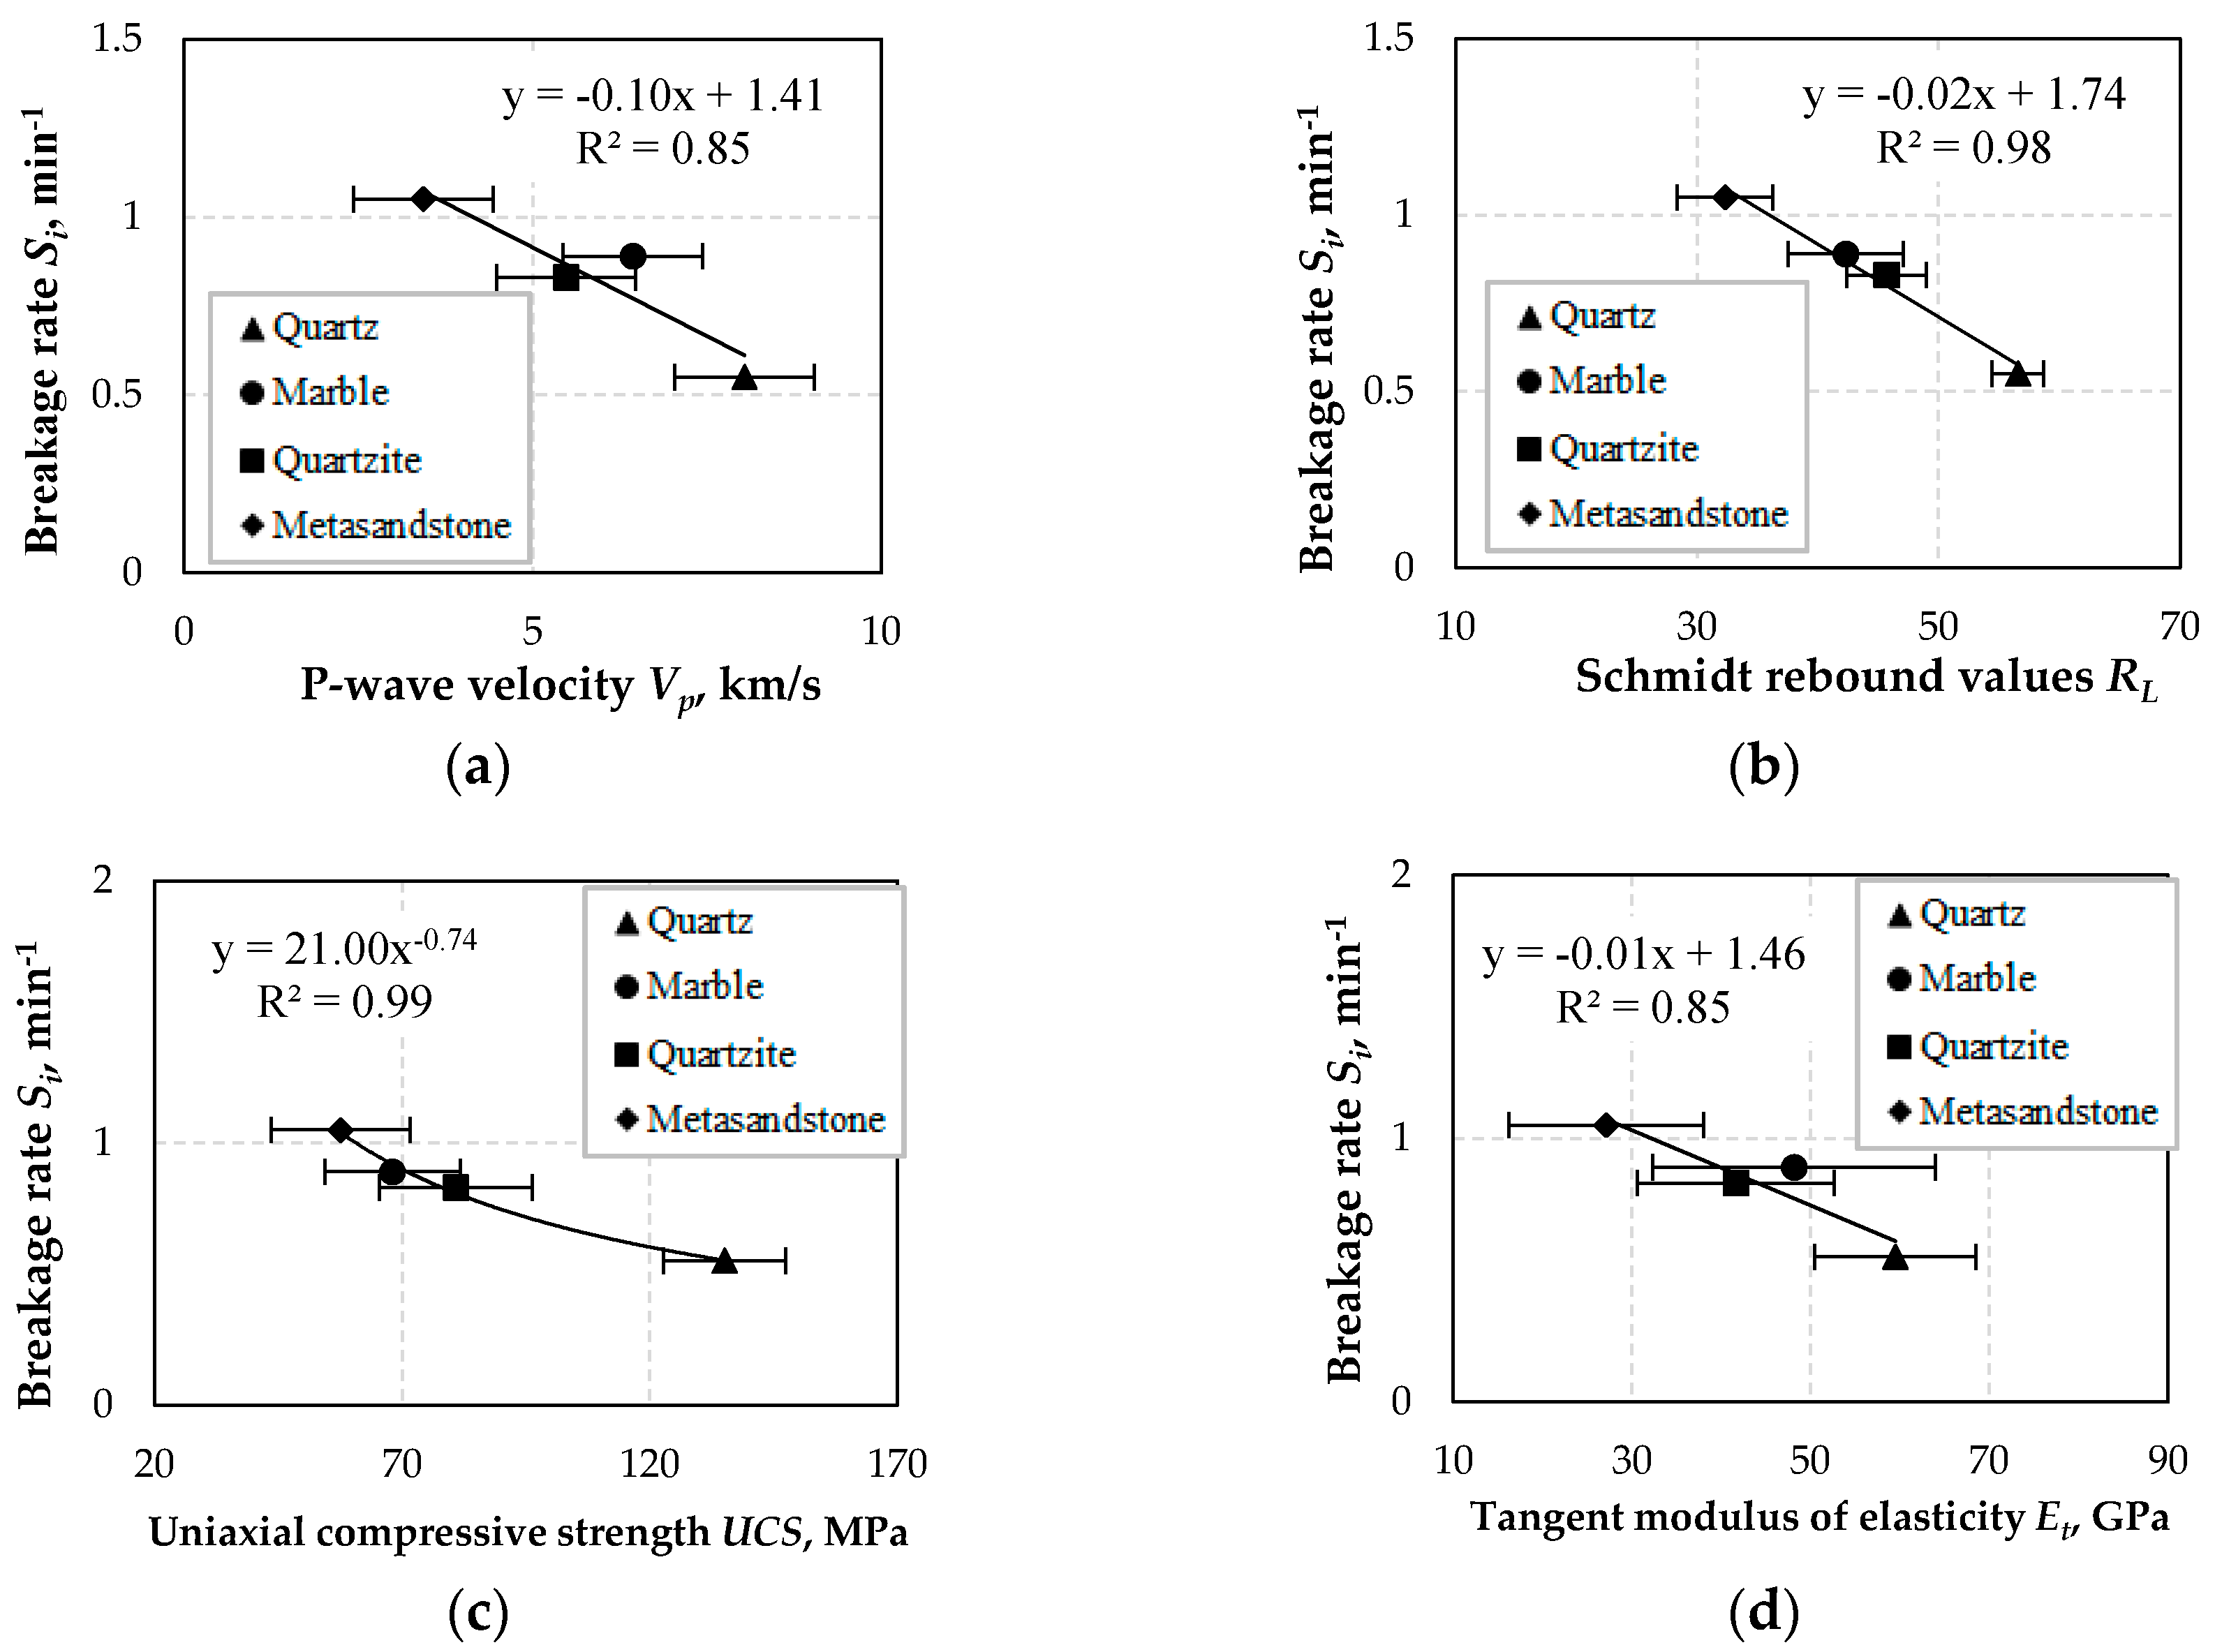
The correlations between Si values and Vp, RL, UCS and Et are presented in Figure 10. It is seen that very strong correlation between Si and RL (R2 = 0.98) and strong correlations between Si and Vp (R2 = 0.85) and Et (R2 = 0.85) are obtained with the use of inverse linear functions. Furthermore, Si is very well correlated with UCS with the use of an inverse exponential function (R2 = 0.99).
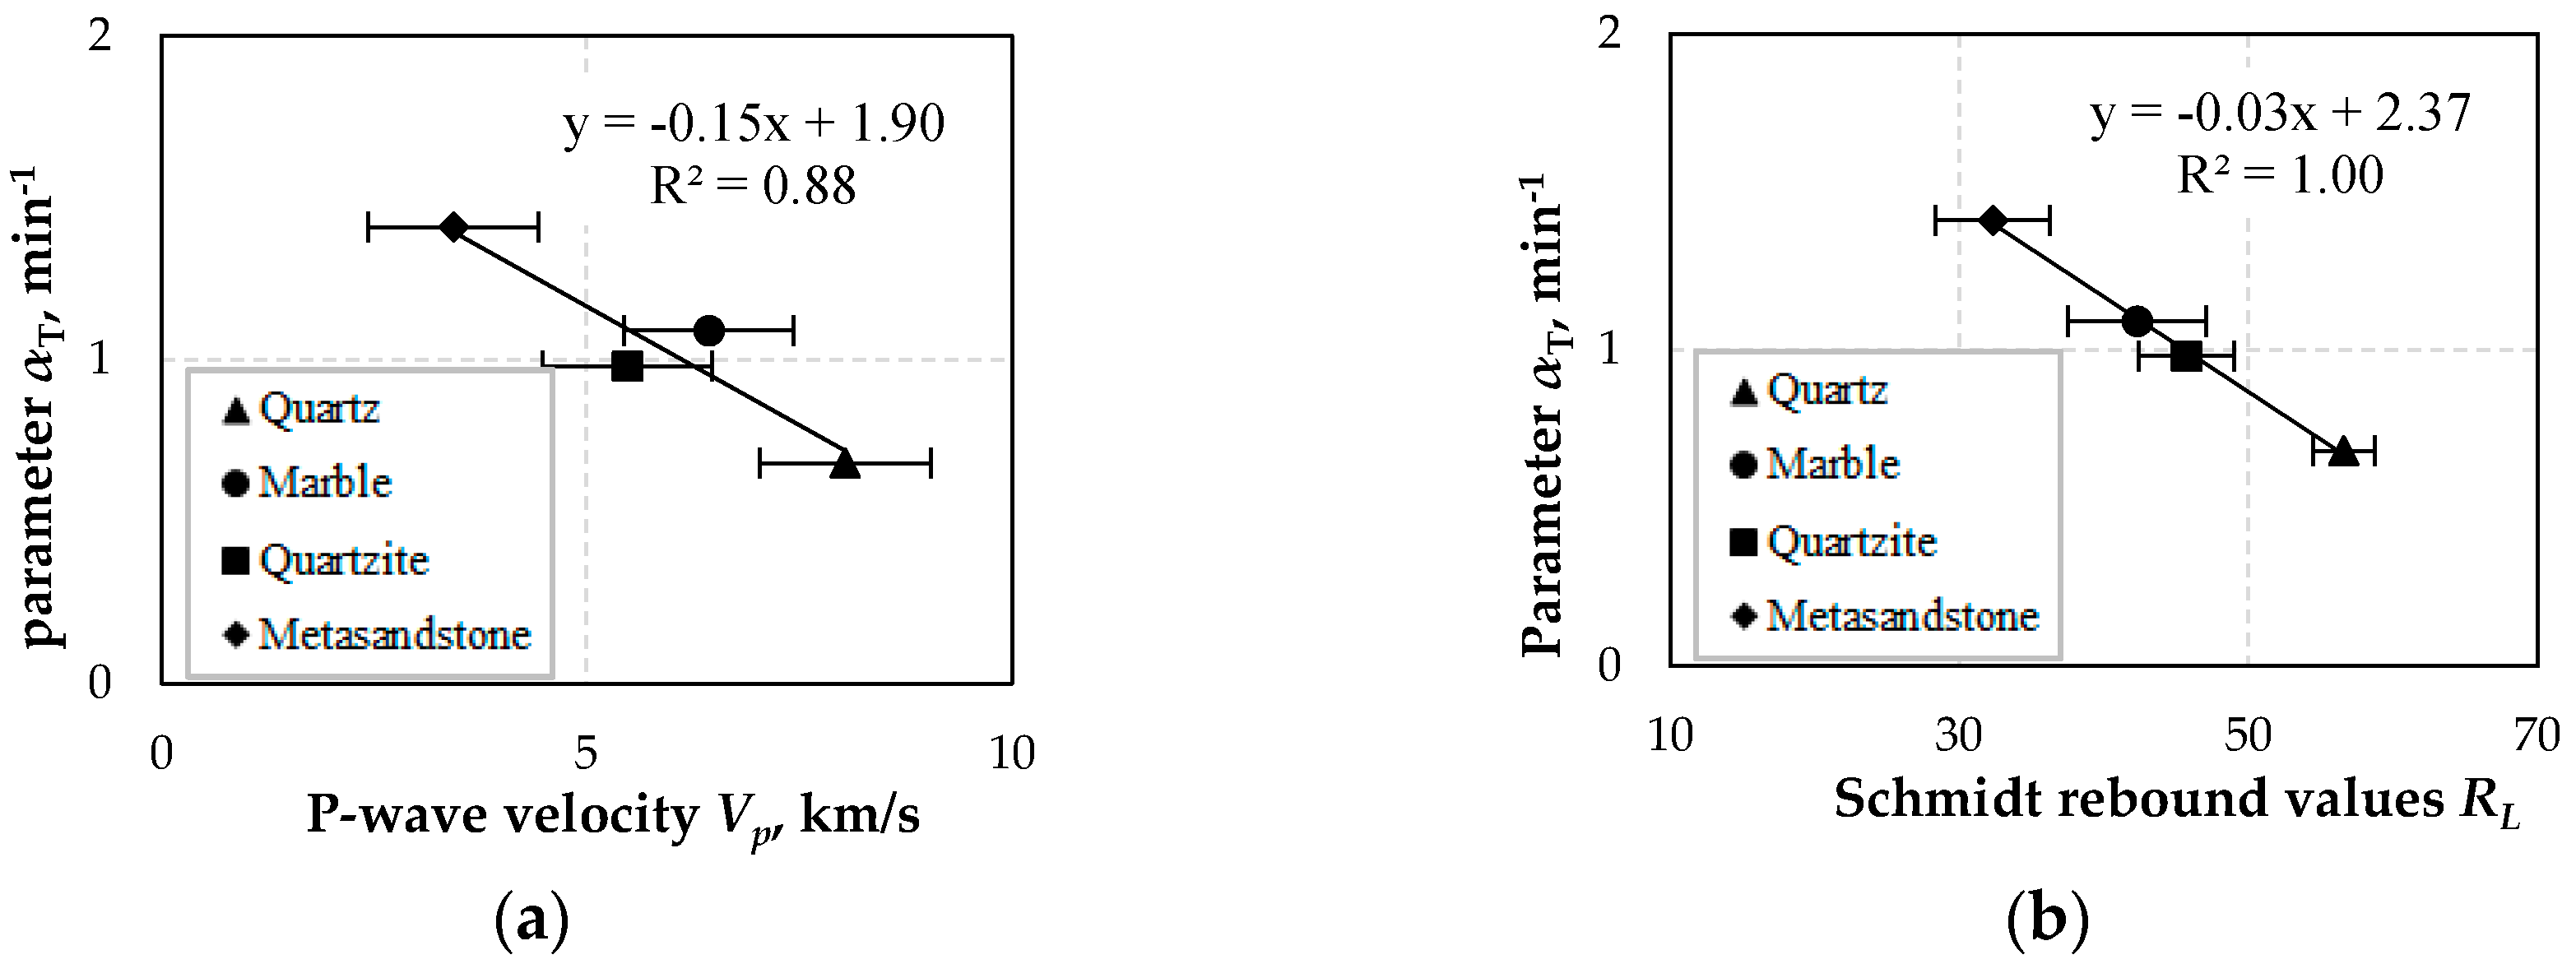
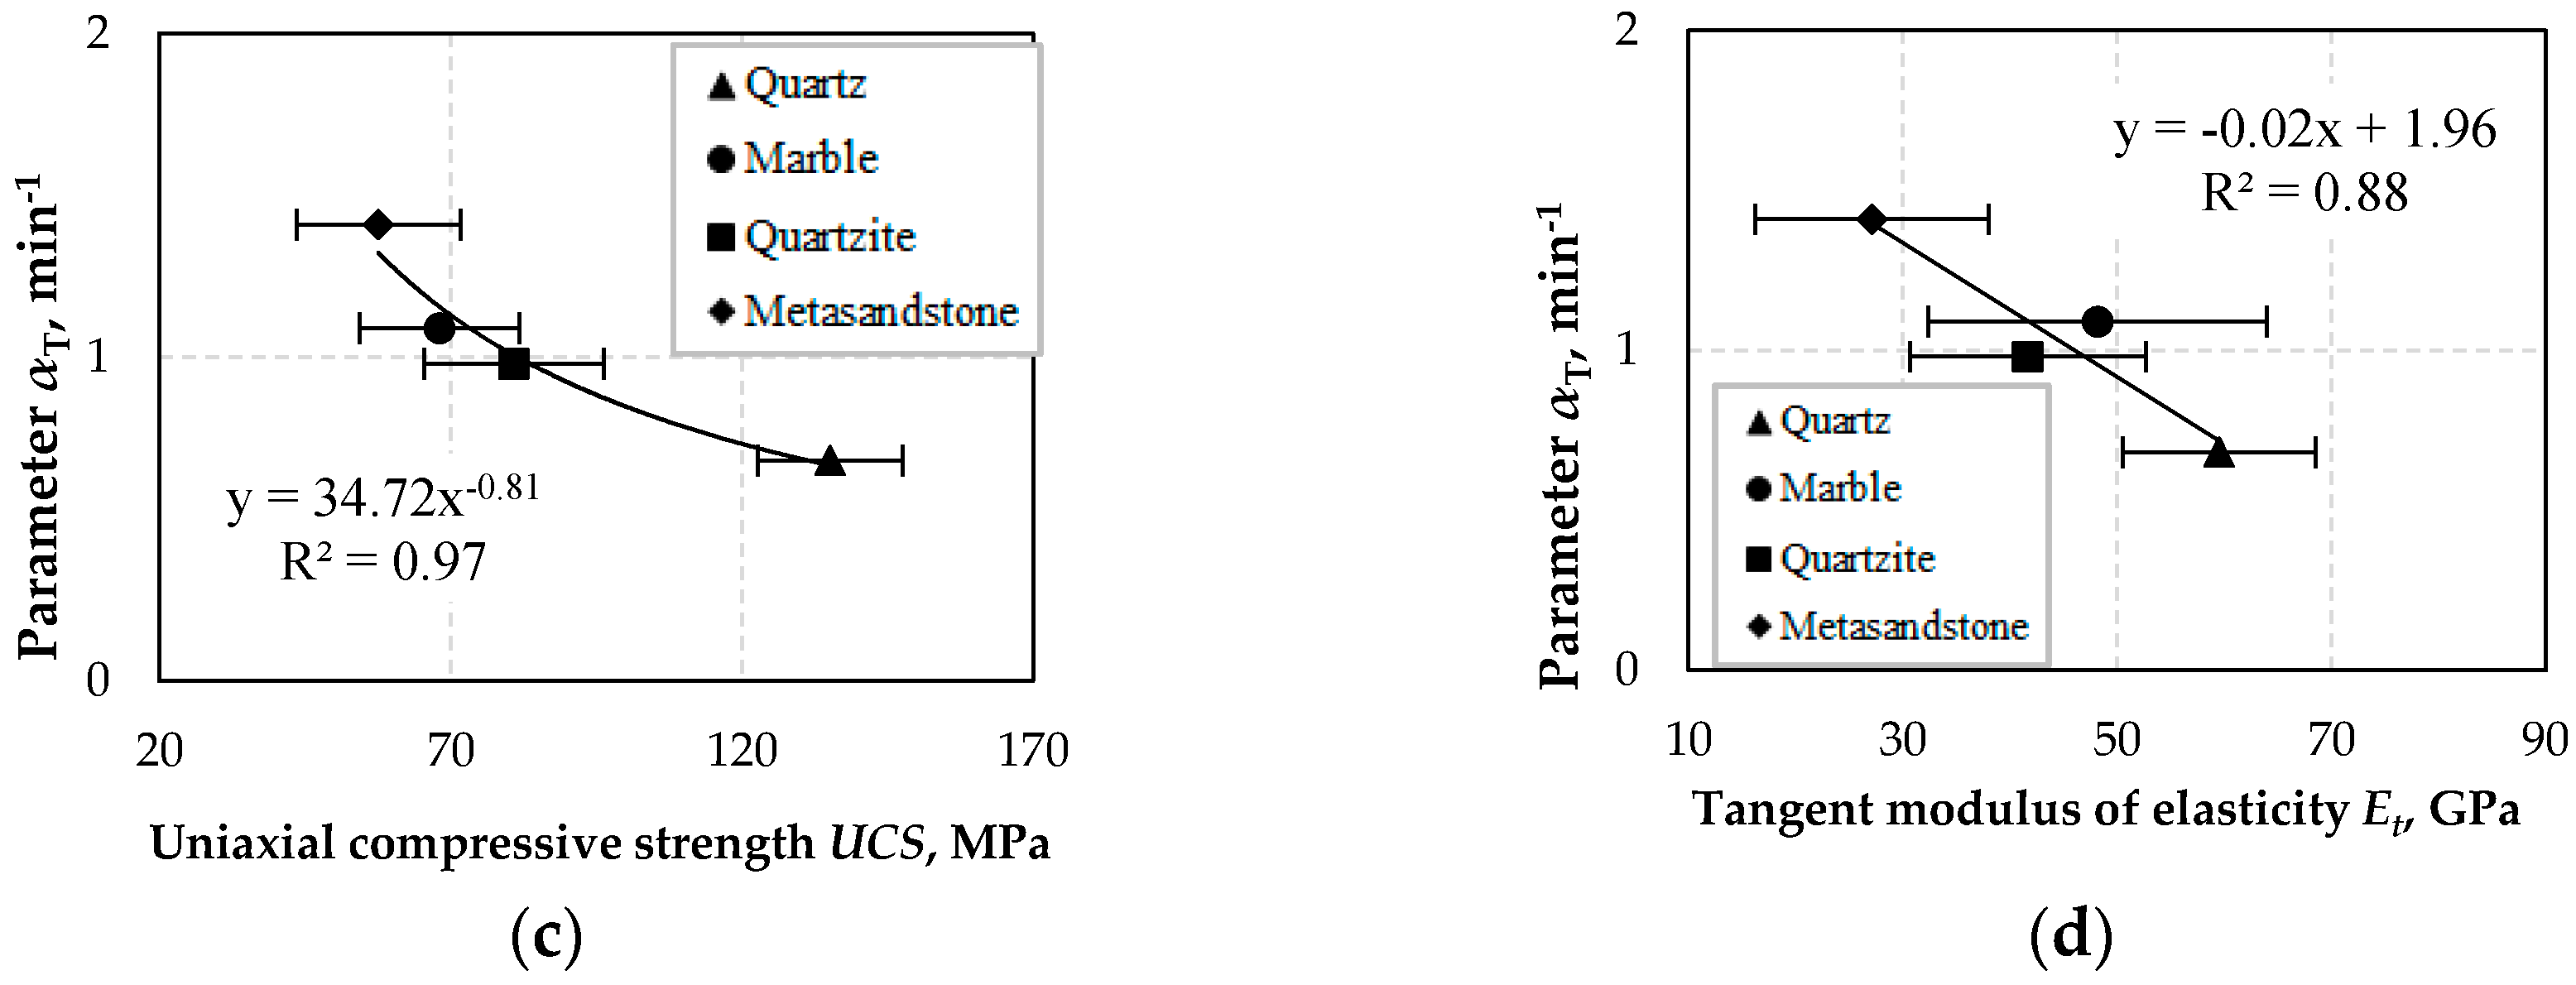
Similar results are obtained for the correlations between αΤ and Vp, RL, UCS and Et (Figure 11). Parameter αΤ, which defines the breakage rate for a feed size of 1 mm, is correlated very well with Vp, RL and Et using an inverse linear relationship. The very strong correlation (R2 = 1) between αT and RL is considered very important for the design of grinding circuits. RL values are obtained from the application of the convenient and low-cost Schmidt hammer test, which can be used both in laboratory and in industrial mills, thus enabling the determination of breakage rate for a specific material in a grinding circuit.
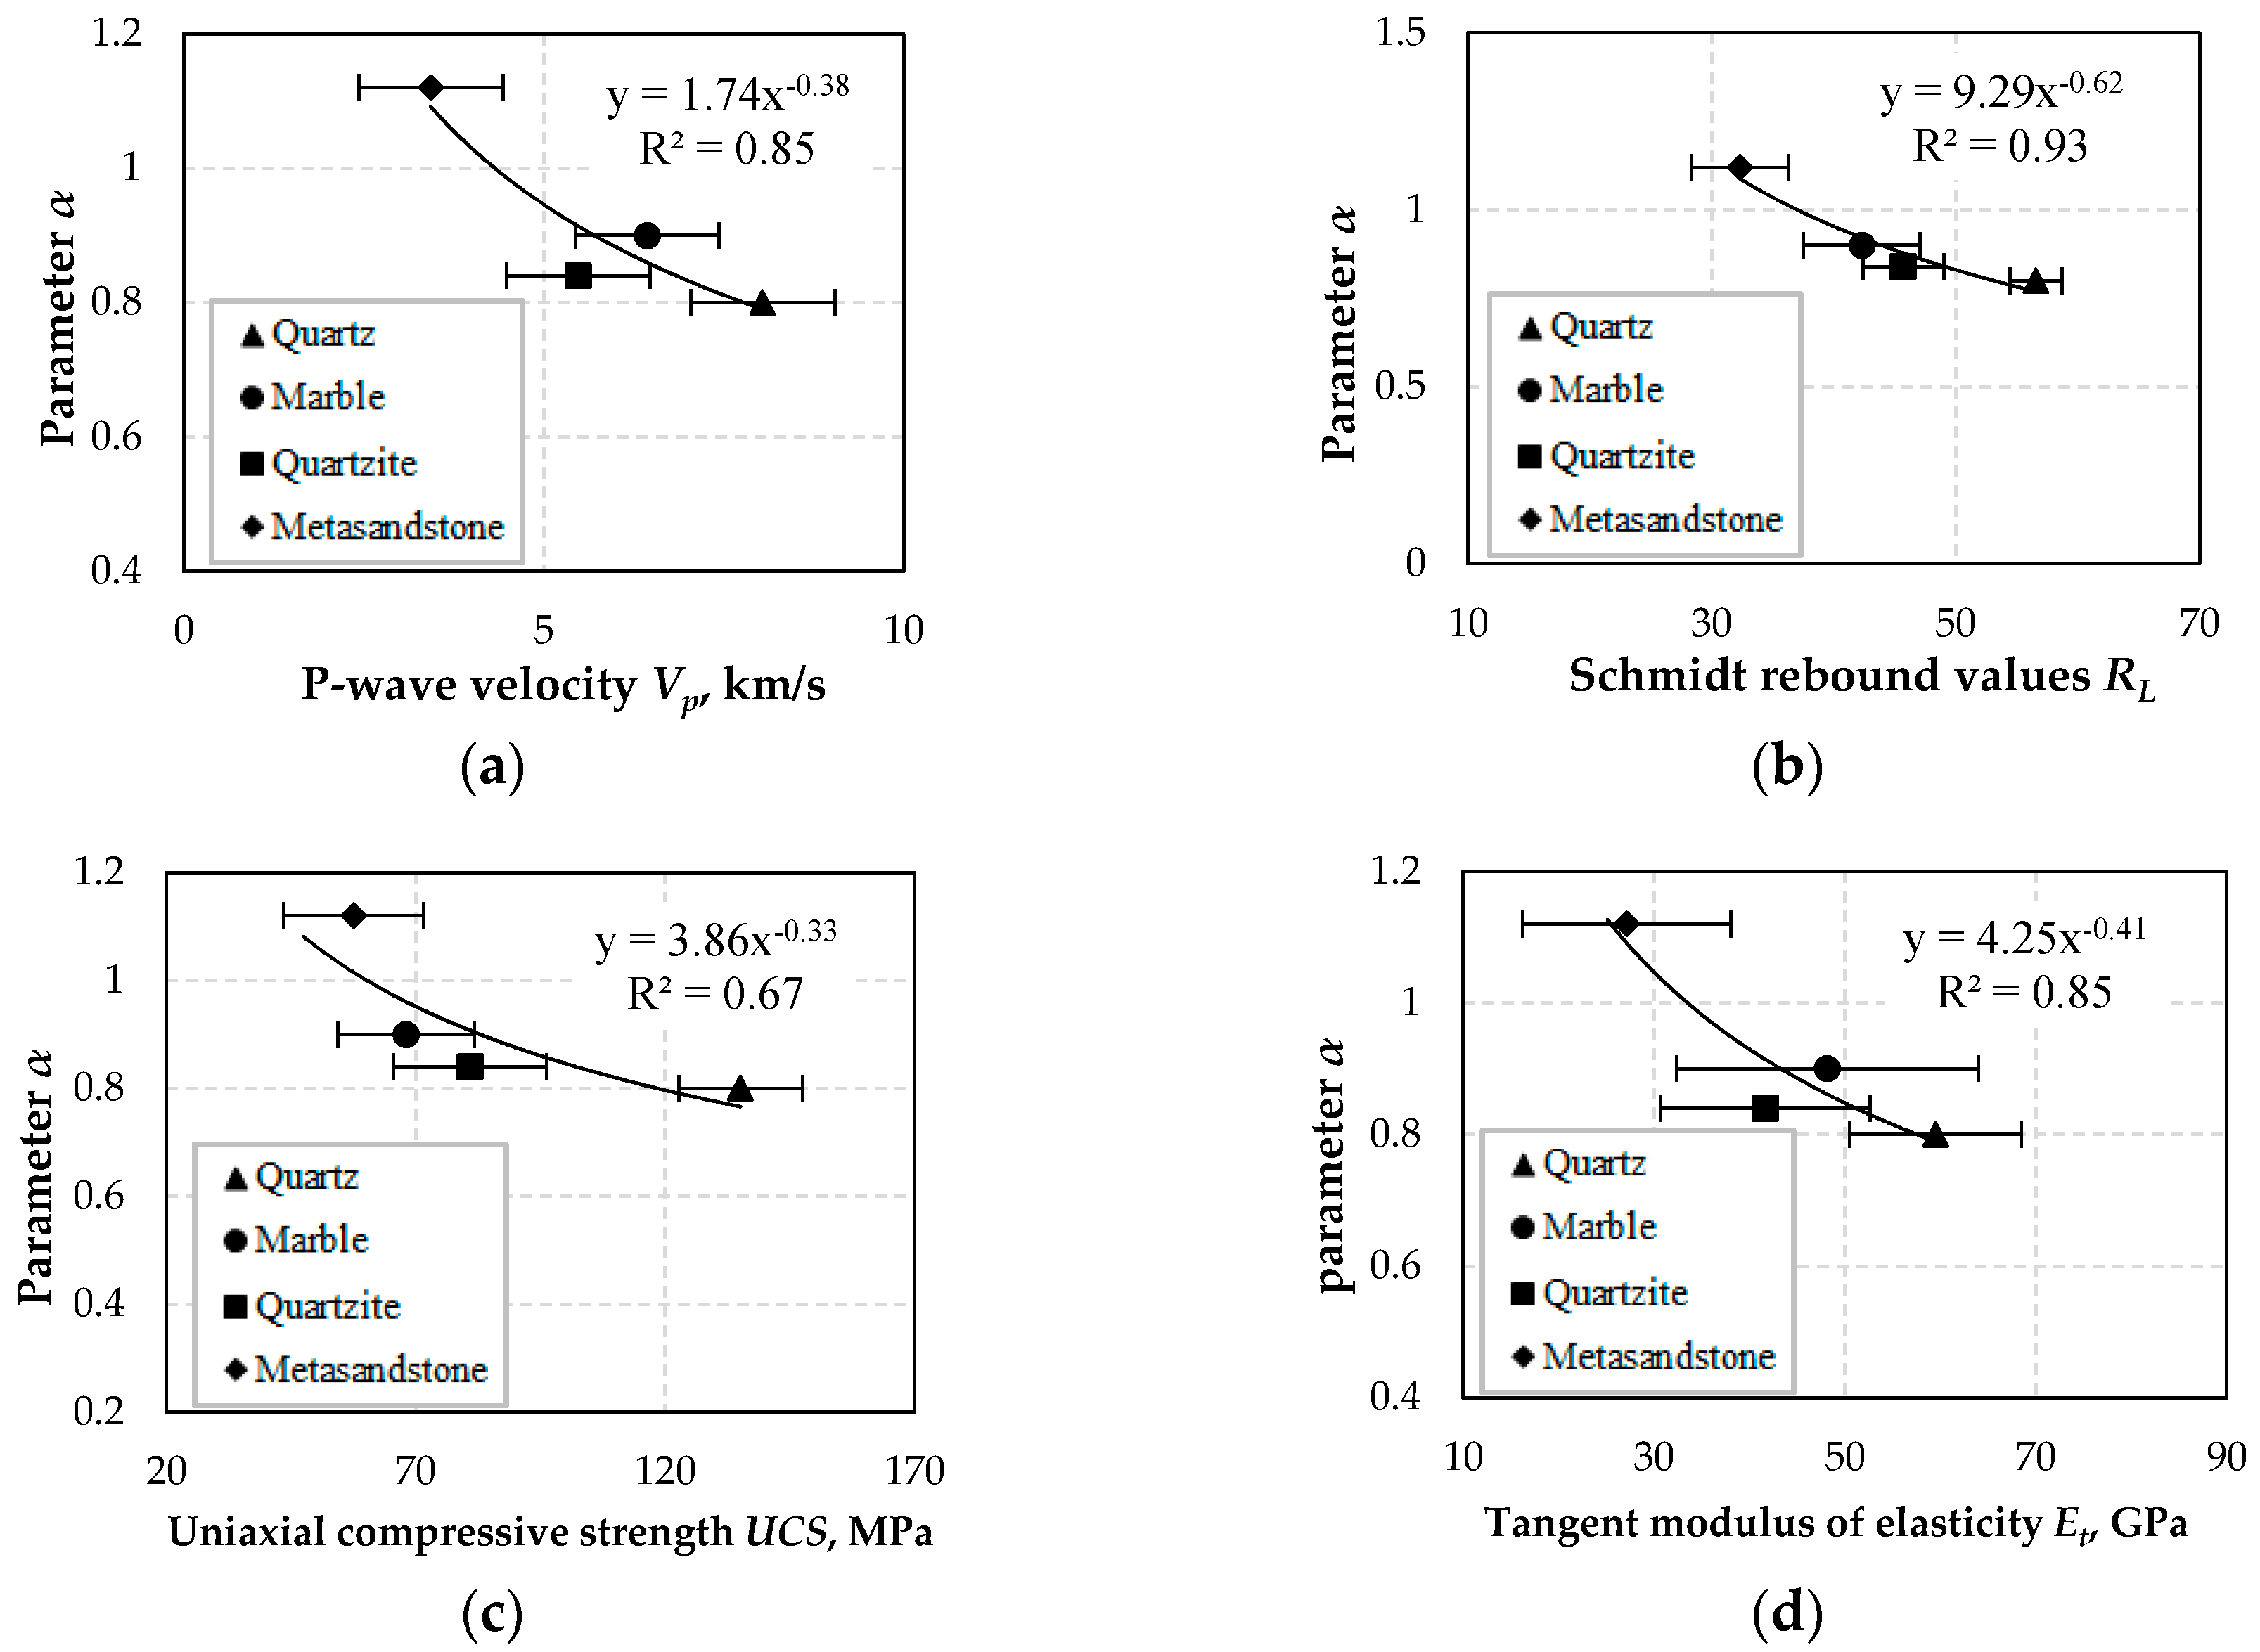
Figure 12 shows the correlations between parameter α and Vp, RL, UCS and Et. It is seen that parameter α is very well correlated with Vp, RL and Et with the use of inverse exponential functions. Parameter α is constant for the same material and therefore the functions obtained can be used independently of grinding conditions. However, a moderate correlation (R2 = 0.67) between α and UCS is indicated.
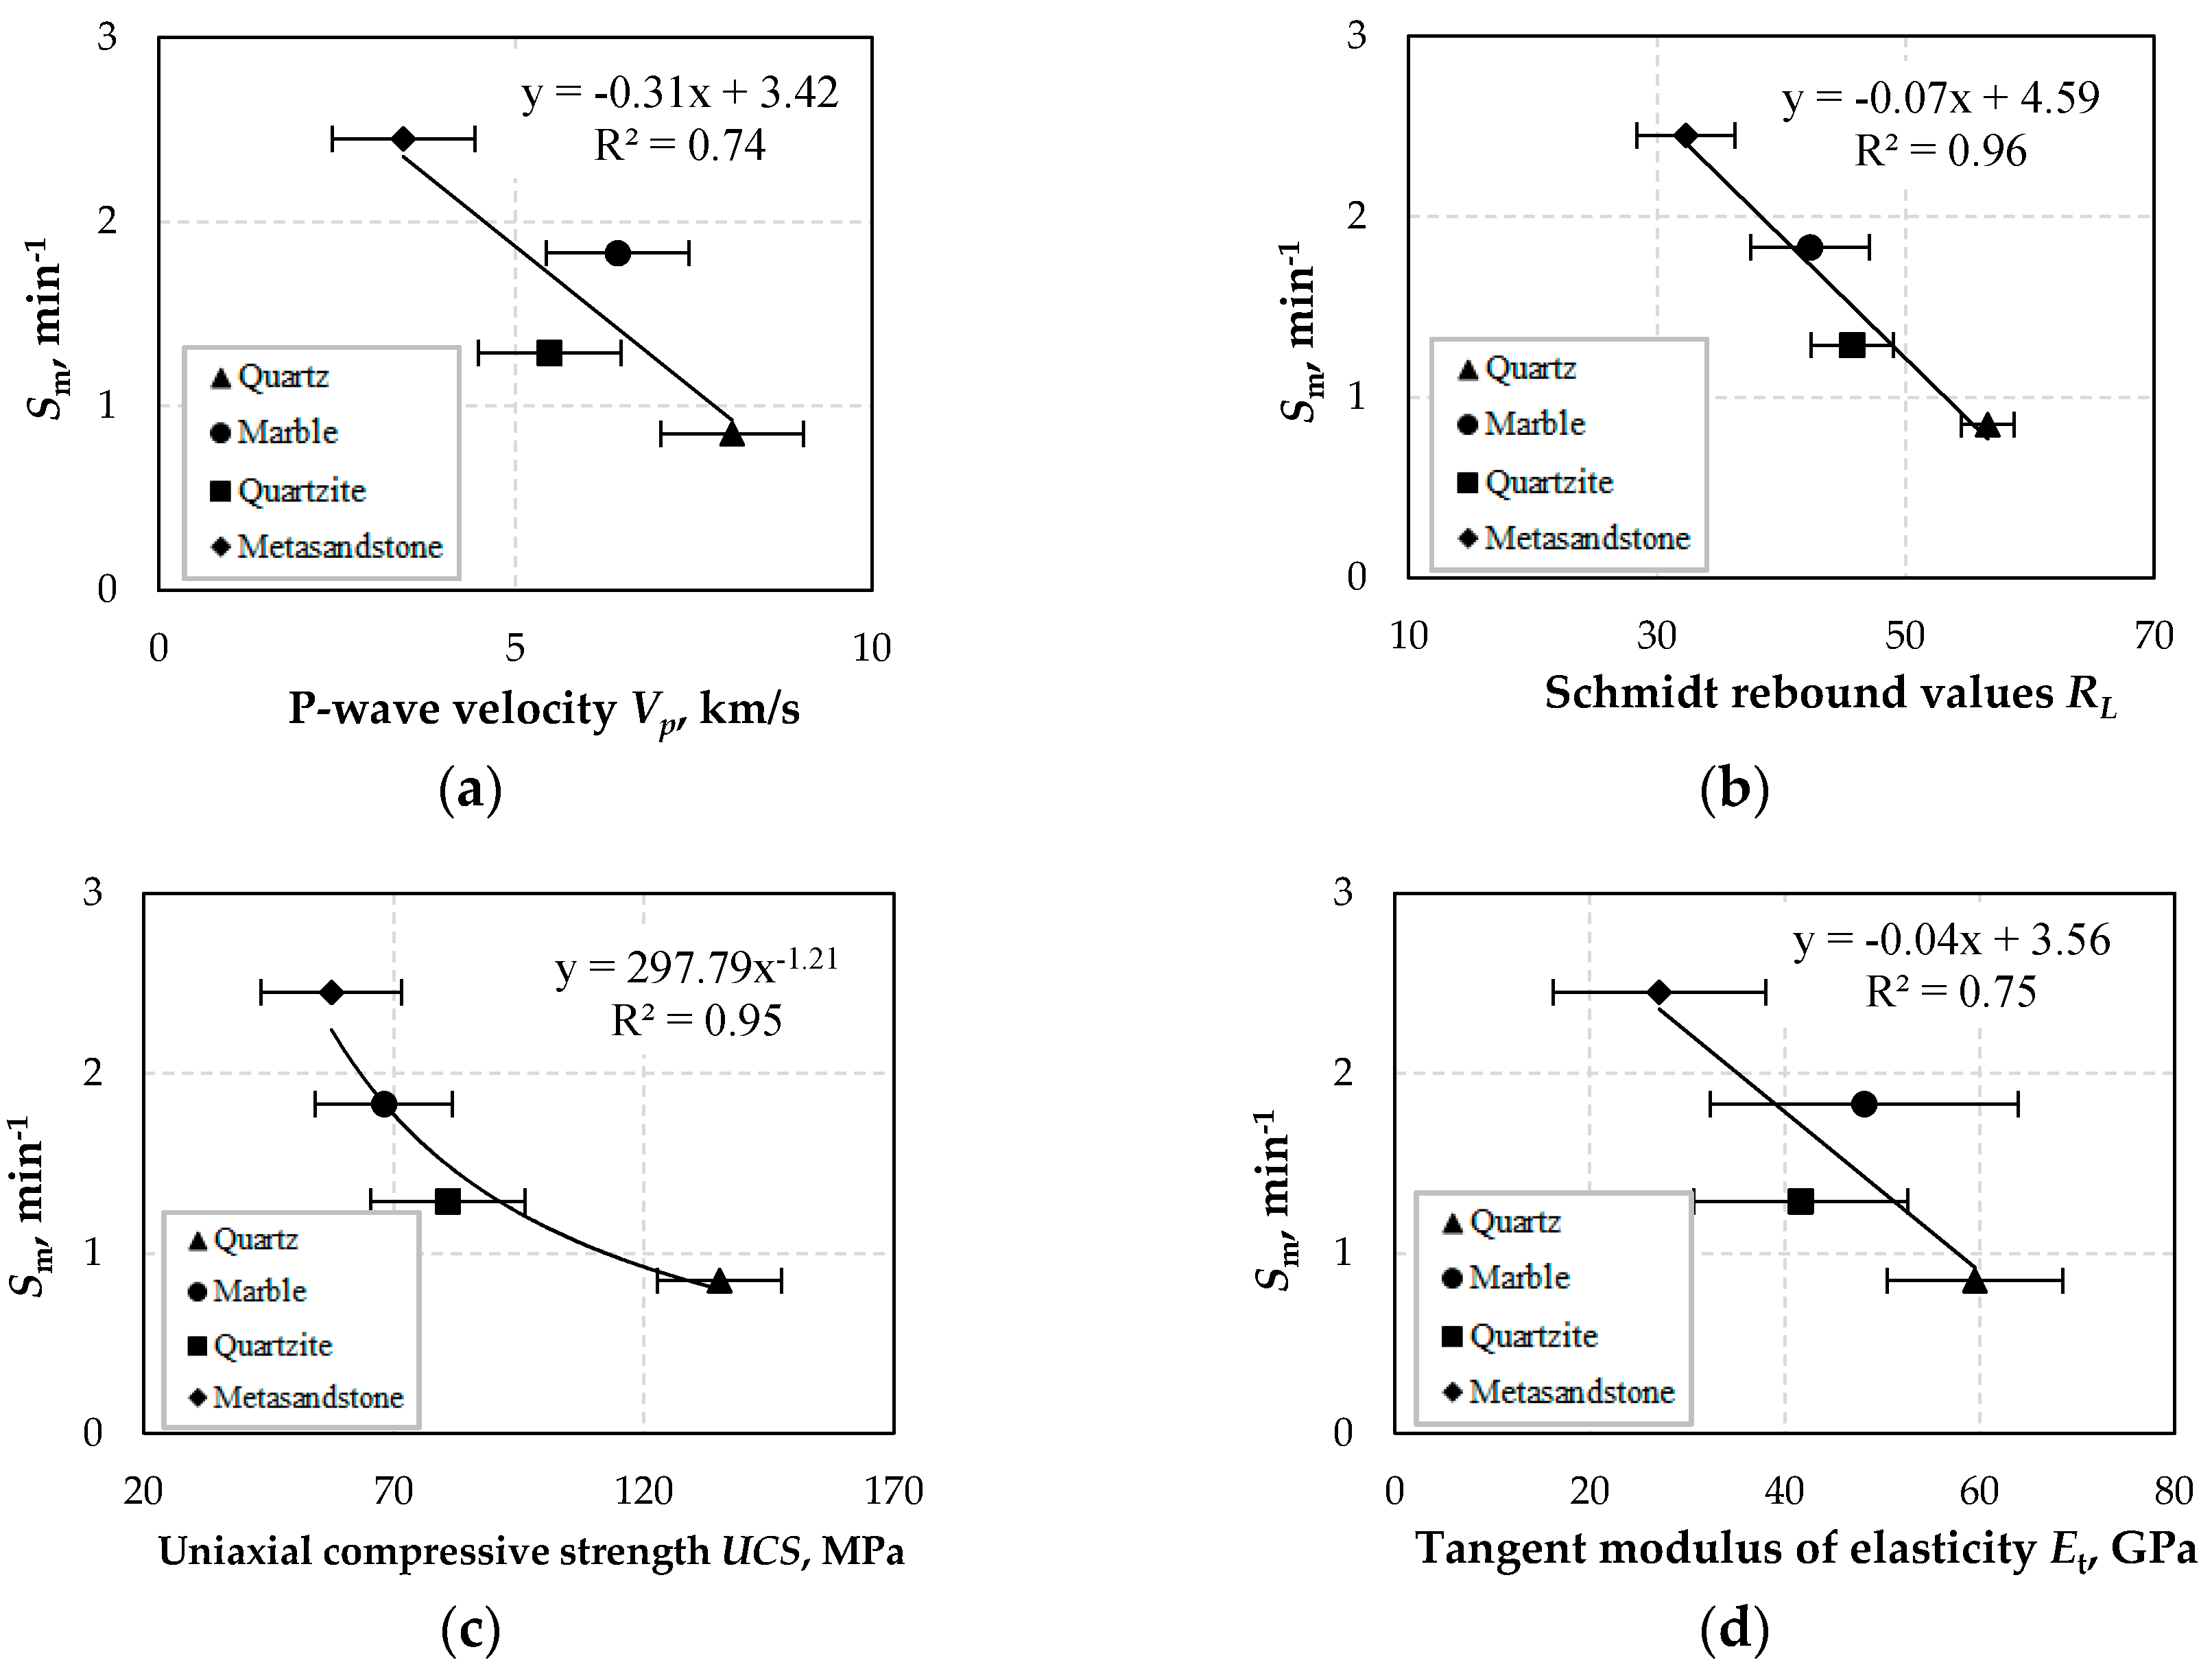
The correlations between maximum breakage rate Sm and Vp, RL, UCS and Et are presented in Figure 13. Very strong correlation (R2 = 0.96) is shown between Sm and RL with the use of an inverse linear function. Furthermore, Sm seems to follow an inverse exponential relationship with UCS, with correlation coefficient R2 = 0.95. However, the prediction of Sm from Vp and Et values is somehow risky due to the moderate correlation between these variables.
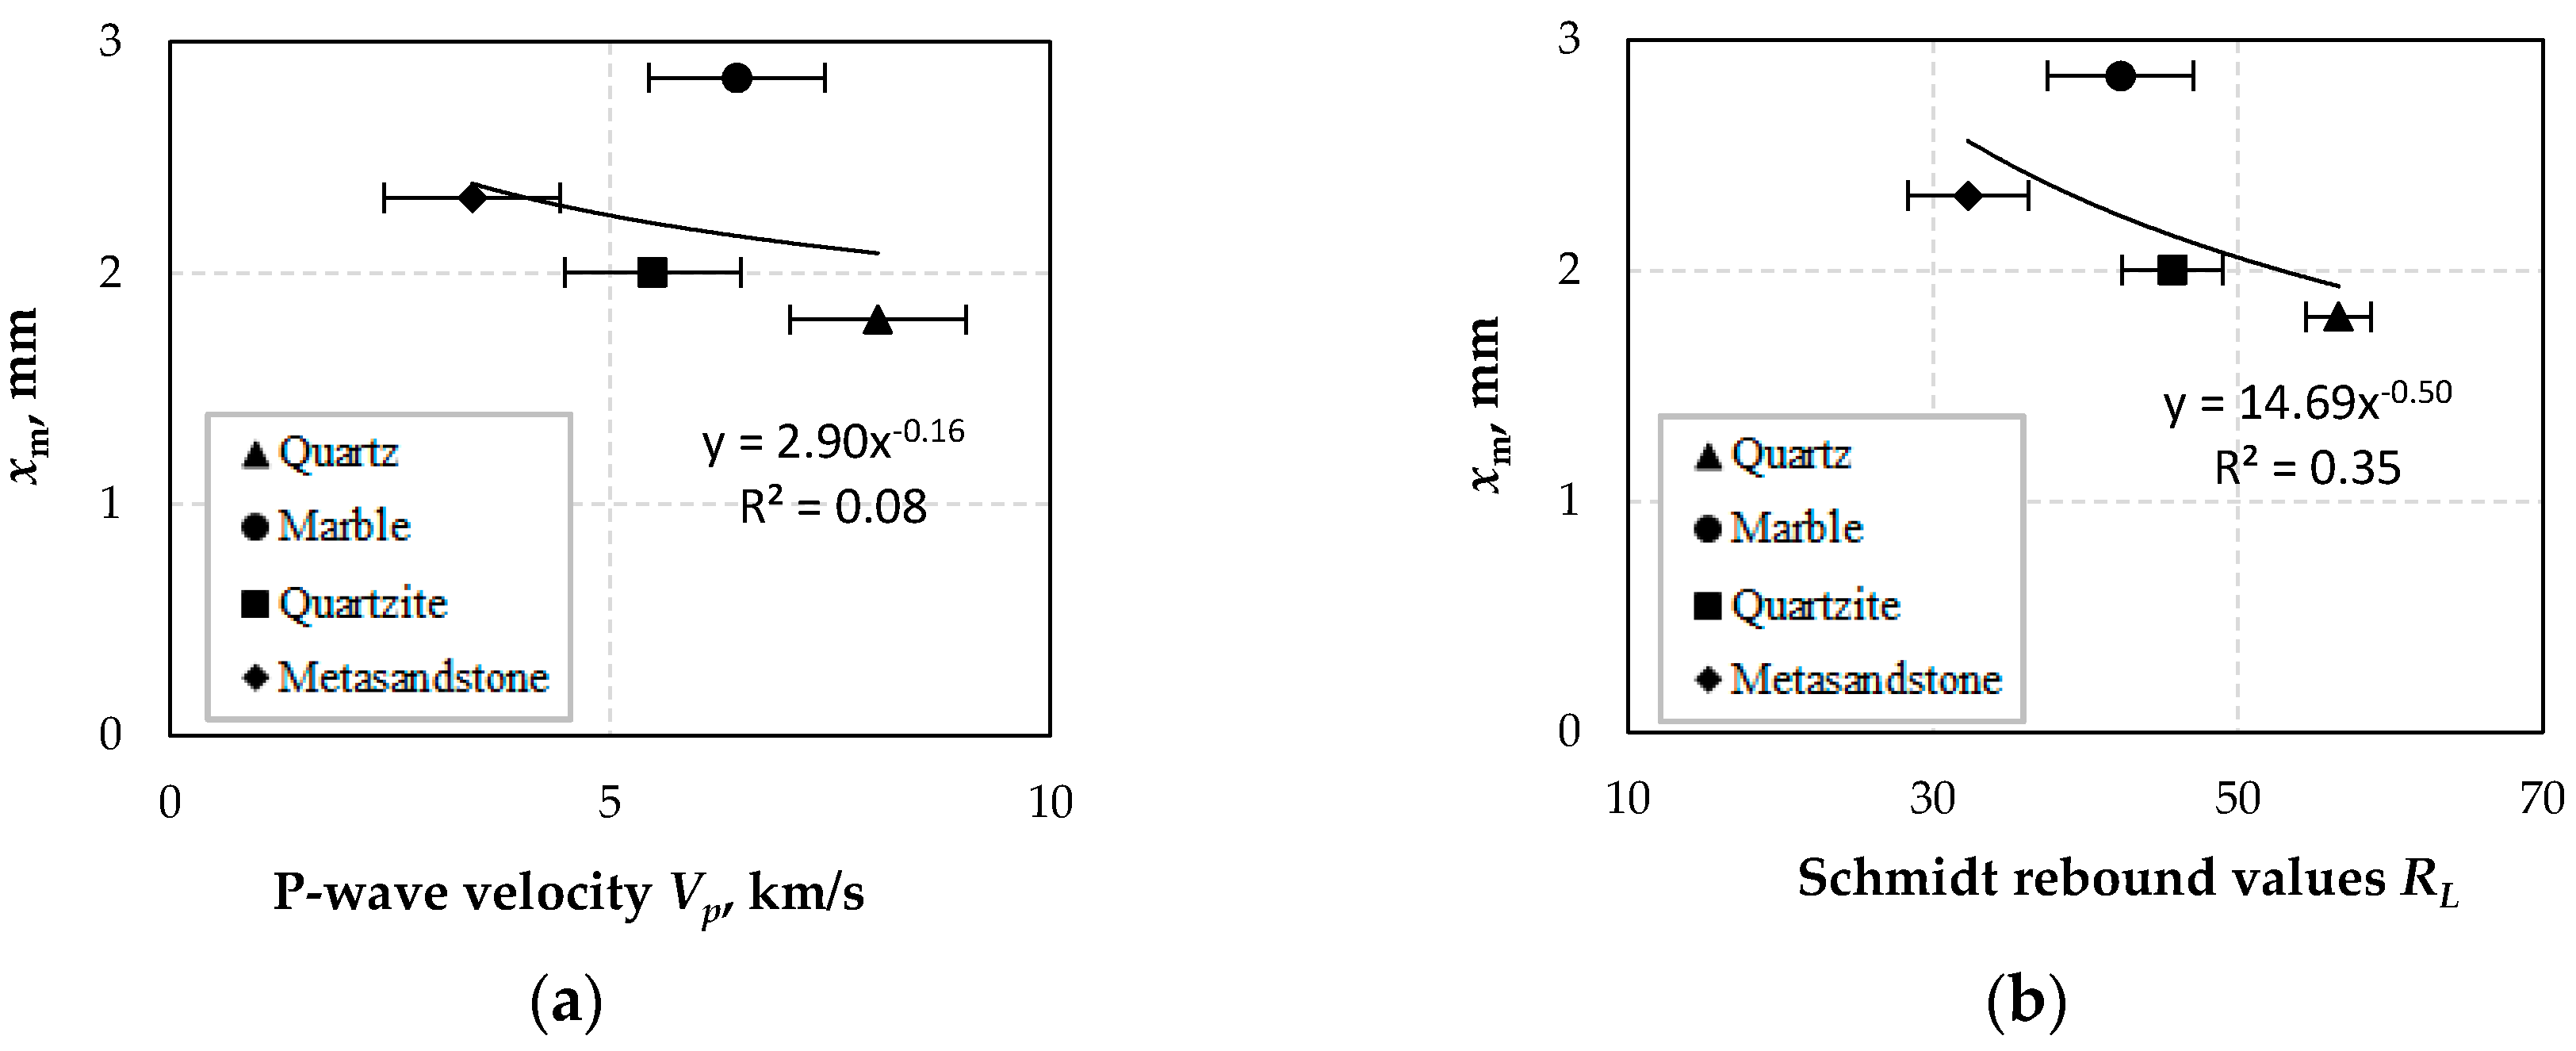
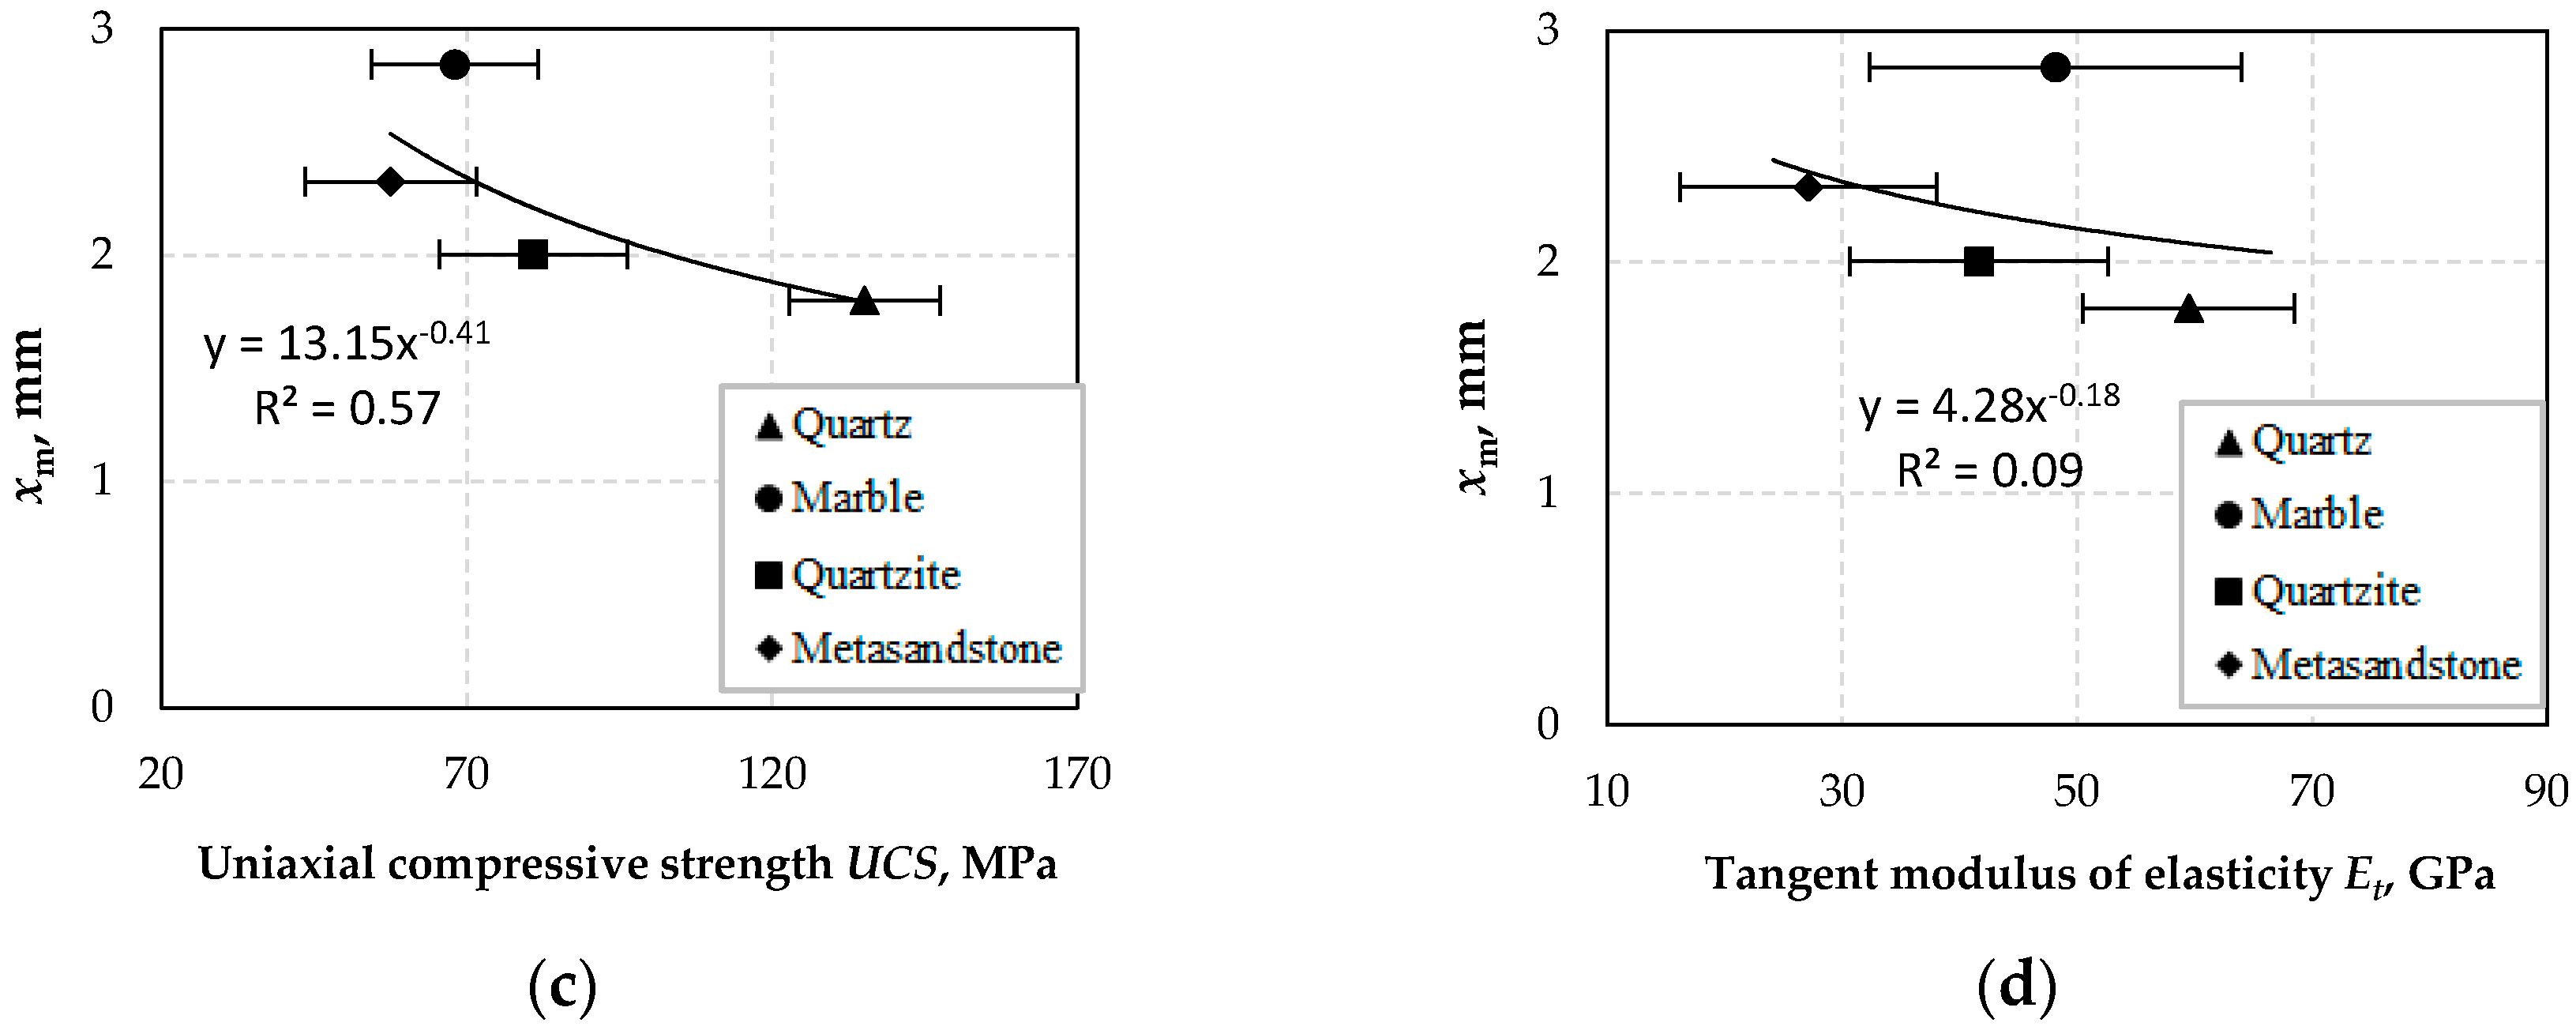
Figure 14 shows the correlations between the optimum size xm and Vp, RL, UCS and Et. It is seen that weak correlations exist between xm and Vp (R2 = 0.08) as well as Et (R2 = 0.09) when inverse functions are used. Furthermore, similar results between xm and RL or UCS are also obtained, with R2 0.35 and 0.57, respectively. It is mentioned that very good to excellent correlations between optimum size xm and other variables are obtained, if marble is excluded from regression analysis. Thus, it is deduced that the optimum size xm increases with decreasing P-wave velocity, Schmidt rebound value, uniaxial compressive strength and tangent modulus of elasticity, for all materials tested except for marble. It is therefore obvious that as strength or stiffness of a material increases the optimum size at which the breakage rate obtains its maximum value becomes finer.
The results for marble are indeed peculiar. It is known that the behavior of a material during breakage depends on several factors including mainly rock size, grain size and microstructure, crystallinity, porosity, mixtures of grinding media, presence of secondary mineral phases and microcracks [26,60,61]. In addition, breakage of mineral grains may be affected by the presence of inter-granular cementations [62]. Furthermore, the energy required for plastic deformation is different for each material and this affects breakage rate [63]. In a recent study, a spheroid model was used to identify the role of shape in particle size analysis [64]. One major difference between marble and the other three materials examined in our study is that the formation of marble is the result of metamorphism of sedimentary carbonate rocks, mainly limestones or dolomites. Twinning planes (planes along which two crystals meet) are also present in marbles. Furthermore, during grinding of marble ultra-fine particles are generated and this may affect breakage rate and final particle size distribution. In a recent study, it has been shown that the initial breakage rate of coarse particles increases with increasing proportion of fines in the mixture; the presence of a big proportion of fines indicates that they exhibit a much smaller collision cross-section compared to coarser particles [65]. All these factors definitely affect the behavior of marble during breakage and thus additional experimental studies are required to elucidate this aspect.
3.5.2. Multiple Regression Analysis
Multiple regression analysis is an extension of simple regression analysis and involves one dependent and two or more independent variables [66]. In our study, multiple regression analysis was performed, using two independent variables, to identify correlations between breakage rate parameters and Vp, RL, UCS and Et. The correlation matrix for breakage rate parameters (Si, αΤ, α and Sm) and Vp, RL, UCS and Et is shown in Table 6. For each dependent variable the two independent variables with the highest correlation coefficients, as shown in the correlation matrix, were used to perform the analysis. Furthermore, because of the weak correlations between optimum size xm and other variables for all tested materials (Figure 14), this dependent variable was not taken into account in our study.
The equations obtained for each dependent variable are the following:
The results of multiple regression analysis indicate that when specific material properties are considered the breakage rate parameters of silica rich materials, namely quartz, quartzite and metasandstone, can be well determined. An exception is shown only for parameter xm for marble.
4. Conclusions
In this study, the correlation between the properties of four materials, namely quartz, marble, quartzite and metasandstone, and breakage rate parameters have been established. The properties of the materials that were taken into account were P-wave velocity, Schmidt rebound values, uniaxial compressive strength and tangent modulus of elasticity. The breakage rate parameters that were determined through batch grinding experiments were breakage rate Si, parameter αT, parameter α, maximum breakage rate Sm and optimum particle size xm. The results can be summarized as follows:
Breakage rate Si or parameter αΤ increase with decreasing uniaxial compressive strength (UCS) and tangent modulus of elasticity (Et). Therefore, it is deduced that as the strength or stiffness of a material is reduced this will be ground faster in a mill. Similar results can be obtained from the P-wave velocity (Vp) and Schmidt rebound values (RL), which are widely considered for the indirect estimation of material’s hardness and strength. The properties of the tested materials can be used for an accurate prediction of Si or αΤ of the ground materials since the obtained correlation coefficients are high.
Parameter α which is constant for the same material and independent of grinding conditions is well correlated with Vp, RL and Et when inverse exponential functions are used. However, the results showed that α has a moderate correlation with UCS (R2 = 0.67) and therefore the results of the functions derived are not very reliable.
Maximum breakage rate Sm is strongly correlated with RL and UCS using inverse functions and therefore either RL or UCS values can be used to predict the maximum breakage rate of each tested material during grinding. However, the prediction of Sm from Vp or Et is not fully reliable due to the moderate correlations between these parameters.
As far as optimum size xm is concerned, the results showed that optimum size xm increases with decreasing P-wave velocity, Schmidt rebound value, uniaxial compressive strength and tangent modulus of elasticity. However, marble seems to deviate from this tendency and further research is required, by considering its properties and other aspects including the presence of twinning planes and the production of ultra-fine material during grinding, to elucidate its behavior. It is mentioned that the behavior of mixed materials and the effect of each material type on the overall breakage rate is now under investigation.
Acknowledgments
The authors would like to thank the anonymous reviewers of this article for their constructive comments and recommendations. The authors also gratefully acknowledge Mr. S. Mavrigiannakis, Mining Engineer, faculty of Rock Mechanics Laboratory, Technical University of Crete, for performing the UCS tests.
Author Contributions
Evangelos Petrakis conceived, designed and performed the experiments, analyzed the data and wrote the paper; Konstantinos Komnitsas critically reviewed the experimental design, the analysis of the results and wrote the paper.
Conflicts of Interest
The authors declare no conflict of interest.
Nomenclature
| D | internal diameter of the mill (m) |
| d | ball diameter (mm) |
| Et | tangent modulus of elasticity (GPa) |
| fc | powder filling volume (%) |
| J | ball filling volume (%) |
| i | size class index |
| N | rotational speed (rpm) |
| Qi | correction factor (-) |
| RL | Schmidt hammer rebound value (-) |
| R2 | correlation coefficient (-) |
| Si | breakage rate (min−1) |
| Sm | maximum breakage rate (min−1) |
| t | grinding time (min) |
| U | interstitial filling (-) |
| UCS | uniaxial compressive strength (MPa) |
| Vp | P-wave velocity (km/s) |
| x0 | standard size 1 mm |
| xi | the upper size of size class i (mm) |
| xm | optimum feed size (mm) |
| α | parameter depending on material properties (-) |
| αT | parameter depending on milling conditions (-) |
| ε | bed porosity (%) |
| Λ | parameter depending on material properties (-) |
| μ | parameter depending on milling conditions (-) |
| ρb | specific gravity of the balls (g/cm3) |
References
- Palm, N.A.; Shackleton, N.J.; Malysiak, V.; O’Connor, C.T. The effect of using different comminution procedures on the flotation of sphalerite. Miner. Eng. 2010, 23, 1053–1057. [Google Scholar] [CrossRef]
- Ozkan, S.G. Further Investigations on Simultaneous Ultrasonic Coal Flotation. Minerals 2017, 7, 177. [Google Scholar] [CrossRef]
- Batchelor, A.R.; Buttress, A.J.; Jones, D.A.; Katrib, J.; Way, D.; Chenje, T.; Stoll, D.; Dodds, C.; Kingman, S.W. Towards large scale microwave treatment of ores: Part 2—Metallurgical testing. Miner. Eng. 2017, 111, 5–24. [Google Scholar] [CrossRef]
- Touil, D.; Belaadi, S.; Frances, C. Energy efficiency of cement finish grinding in a dry batch ball mill. Cem. Concr. Res. 2006, 36, 416–421. [Google Scholar] [CrossRef] [Green Version]
- Ipek, H.; Ucbas, Y.; Yekeler, M.; Hosten, Ç. Grinding of ceramic raw materials by a standard Bond mill: Quartz, kaolin and K-feldspar. Miner. Process. Extr. Metall. 2005, 114, 213–218. [Google Scholar] [CrossRef]
- Kutuk, S. Influence of milling parameters on particle size of ulexite material. Powder Technol. 2016, 301, 421–428. [Google Scholar] [CrossRef]
- Djordjevic, N. Improvement of energy efficiency of rock comminution through reduction of thermal losses. Miner. Eng. 2010, 23, 1237–1244. [Google Scholar] [CrossRef]
- Petrakis, E.; Stamboliadis, E.; Komnitsas, K. Identification of optimal mill operating parameters during grinding of quartz with the use of population balance modelling. KONA Powder Part. J. 2017, 34, 213–223. [Google Scholar] [CrossRef]
- Charles, R.J. Energy-size reduction relationships in comminution. Trans. AIME 1957, 208, 80–88. [Google Scholar]
- Stamboliadis, E. A contribution to the relationship of energy and particle size in the comminution of brittle particulate materials. Miner. Eng. 2002, 15, 707–713. [Google Scholar]
- Fuerstenau, D.W.; Phatak, P.B.; Kapur, P.C.; Abouzeid, A.-Z.M. Simulation of the grinding of coarse/fine (heterogeneous) systems in a ball mill. Int. J. Miner. Process. 2011, 99, 32–38. [Google Scholar] [CrossRef]
- Shi, F.; Kojovic, T.; Brennan, M. Modelling of vertical spindle mills. Part 1: Sub-models for comminution and classification. Fuel 2015, 143, 595–601. [Google Scholar] [CrossRef]
- Petrakis, E.; Komnitsas, K. Improved modeling of the grinding process through the combined use of matrix and population balance models. Minerals 2017, 7, 67. [Google Scholar] [CrossRef]
- Herbst, J.A.; Fuerstenau, D.W. Scale-up procedure for continuous grinding mill design using population balance models. Int. J. Miner. Process. 1980, 7, 1–31. [Google Scholar] [CrossRef]
- Austin, L.G.; Klimpel, R.R.; Luckie, P.T. Process Engineering of Size Reduction: Ball Milling; SME-AIME: New York, NY, USA, 1984. [Google Scholar]
- Ipek, H.; Göktepe, F. Determination of grindability characteristics of zeolite. Physicochem. Probl. Miner. Process. 2011, 47, 183–192. [Google Scholar]
- Gupta, V.K.; Sharma, S. Analysis of ball mill grinding operation using mill power specific kinetic parameters. Adv. Powder Technol. 2014, 25, 625–634. [Google Scholar] [CrossRef]
- Fuerstenau, D.W.; Kapur, P.C.; De, A. Modelling Breakage Kinetics in Various Dry Comminution Systems. KONA Powder Part. J. 2003, 21, 121–132. [Google Scholar] [CrossRef]
- Deniz, V. Comparisons of dry grinding kinetics of lignite, bituminous coal and petroleum coke. Energy Source Part A 2013, 35, 913–920. [Google Scholar] [CrossRef]
- Mulenga, F.K. Sensitivity analysis of Austin’s scale-up model for tumbling ball mills—Part 2. Effects of full-scale milling parameters. Powder Technol. 2017, 317, 6–12. [Google Scholar] [CrossRef]
- Mulenga, F.K. Sensitivity analysis of Austin’s scale-up model for tumbling ball mills—Part 3. A global study using the Monte Carlo paradigm. Powder Technol. 2017, 322, 195–201. [Google Scholar] [CrossRef]
- Mokokha, A.B.; Moys, M.H. Towards optimizing ball-milling capacity: Effect of lifter design. Miner. Eng. 2006, 19, 1439–1445. [Google Scholar] [CrossRef]
- Samanli, S.; Cuhadaroglu, D.; Ipek, H.; Ucbas, Y. The investigation of grinding kinetics of power plant solid fossil fuel in ball mill. Fuel 2010, 89, 703–707. [Google Scholar] [CrossRef]
- Samanli, S. Breakage behavior of two different coal types in a grinding process and importance for thermal power stations. Part. Sci. Technol. 2016. [Google Scholar] [CrossRef]
- Katubilwa, F.M.; Moys, M.H. Effect of ball size distribution on milling rate. Miner. Eng. 2009, 22, 1283–1288. [Google Scholar] [CrossRef]
- Simba, K.P.; Moys, M.H. Effects of mixtures of grinding media of different shapes on milling kinetics. Miner. Eng. 2014, 61, 40–46. [Google Scholar] [CrossRef]
- Vogel, L.; Peukert, W. From single particle impact behaviour to modelling of impact mills. Chem. Eng. Sci. 2005, 60, 5164–5176. [Google Scholar] [CrossRef]
- Sato, J.; Itoh, J.; Aydan, Ö.; Akagi, T. Prediction of time-dependent behaviour of a tunnel in squeezing rocks. In Proceedings of the 4th International Symposium, Bergamo, Italy, 10–12 April 1995; pp. 47–54. [Google Scholar]
- Kahraman, S. A correlation between P-wave velocity, number of joints and Schmidt hammer rebound number. Int. J. Rock Mech. Min. Sci. 2001, 38, 729–733. [Google Scholar] [CrossRef]
- Yasar, E.; Erdogan, Y. Estimation of rock physiomechanical properties using hardness methods. Eng. Geol. 2004, 71, 281–288. [Google Scholar] [CrossRef]
- Karakus, M.; Tutmez, B. Fuzzy and multiple regressions modelling for evaluation of intact rock strength based on point load, Schmidt hammer and sonic velocity. Rock Mech. Rock Eng. 2006, 39, 45–57. [Google Scholar] [CrossRef]
- Kahraman, S.; Yeken, T. Determination of physical properties of carbonate rocks from P-wave velocity. Bull. Eng. Geol. Environ. 2008, 67, 277–281. [Google Scholar] [CrossRef]
- Cobanoglu, I.; Celik, S.B. Estimation of uniaxial compressive strength from point load strength, Schmidt hardness and P-wave velocity. Bull. Eng. Geol. Environ. 2008, 67, 491–498. [Google Scholar] [CrossRef]
- Khandelwal, M.; Singh, T.N. Correlating static properties of coal measures rocks with P-wave velocity. Int. J. Coal Geol. 2009, 79, 55–60. [Google Scholar] [CrossRef]
- Yagiz, S. P-wave Velocity Test for Assessment of Geotechnical Properties of some Rock Materials. Bull. Mater. Sci. 2011, 34, 947–953. [Google Scholar] [CrossRef]
- Sarkar, K.; Vishal, V.; Singh, T.N. An empirical correlation of index geomechanical parameters with the compressional wave velocity. Geotech. Geol. Eng. 2012, 30, 469–479. [Google Scholar] [CrossRef]
- Goktan, R.M.; Gunes, N. A comparative study of Schmidt hammer testing procedures with reference to rock cutting machine performance prediction. Int. J. Rock Mech. Min. Sci. 2005, 42, 466–472. [Google Scholar] [CrossRef]
- ISRM 1978. Suggested methods for determining hardness and abrasiveness of rocks. Int. J. Rock Mech. Min. Sci. Geomech. Abstr. 1978, 15, 89–97. [Google Scholar]
- International Society for Rock Mechanics. The Complete ISRM Suggested Methods for Rock Characterization, Testing and Monitoring: 1974–2006; Hudson, U., Ed.; ISRM Turkish National Group: Ankara, Turkey, 2007. [Google Scholar]
- ASTM. Standard Test Method for Determination of Rock Hardness by Rebound Hammer Method; ASTM D 5873-00; ASTM International: West Conshohocken, PA, USA, 2001. [Google Scholar]
- Buyuksagis, I.S.; Goktan, R.M. The effect of Schmidt hammer type on uniaxial compressive strength prediction of rock. Int. J. Rock Mech. Min. Sci. 2007, 44, 299–307. [Google Scholar] [CrossRef]
- Hucka, V. A rapid method for determining the strength of rocks in situ. Int. J. Rock Mech. Min. Sci. 1965, 2, 127–134. [Google Scholar] [CrossRef]
- Poole, R.W.; Farmer, I.W. Consistency and repeatability of Schmidt hammer rebound data during field testing. Int. J. Rock Mech. Min. Sci. Geomech. Abstr. 1980, 17, 167–171. [Google Scholar] [CrossRef]
- Goktan, R.M.; Ayday, C.A. Suggested improvement to the Schmidt rebound hardness ISRM suggested method with particular reference to rock machineability. Int. J. Rock Mech. Min. Sci. 1993, 30, 321–322. [Google Scholar] [CrossRef]
- Deniz, V. Relationships between Bond’s grindability (Gbg) and breakage parameters of grinding kinetic on limestone. Powder Technol. 2004, 139, 208–213. [Google Scholar] [CrossRef]
- Aras, A.; Ozkan, A.; Aydogan, S. Correlations of Bond and Breakage Parameters of Some Ores with the Corresponding Point Load Index. Part. Part. Syst. Charact. 2012, 29, 204–210. [Google Scholar] [CrossRef]
- British Standards Institution. Natural Stone Test Methods. Determination of Real Density and Apparent Density, and of Total and Open Porosity; BS EN 1936:2006; British Standard Institution (BSI): London, UK, 2017. [Google Scholar]
- Shih, Y.-F.; Wang, Y.-R.; Lin, K.-L.; Chen, C.-W. Improving Non-Destructive Concrete Strength Tests Using Support Vector Machines. Materials 2015, 8, 7169–7178. [Google Scholar] [CrossRef] [PubMed]
- Khandelwal, M.; Ranjith, P.G. Correlating index properties of rocks with P-wave measurements. J. Appl. Geophys. 2010, 71, 1–5. [Google Scholar] [CrossRef]
- Gupta, V.K.; Zouit, H.; Hodouin, D. The effect of ball and mill diameters on grinding rate parameters in dry grinding operation. Powder Technol. 1985, 42, 199–208. [Google Scholar] [CrossRef]
- Kılıç, A.; Teymen, A. Determination of mechanical properties of rocks using simple methods. Bull. Eng. Geol. Environ. 2008, 67, 237–244. [Google Scholar] [CrossRef]
- Kassab, M.A.; Weller, A. Study on P-wave and S-wave velocity in dry and wet sandstones of Tushka region. Egypt. Egypt. J. Petrol. 2015, 24, 1–11. [Google Scholar] [CrossRef]
- Rey, P.F.; Fountain, D.M.; Clement, W.P. P-wave velocity across a noncoaxial ductile shear zone and its associated strain gradient: Consequences for upper crustal reflectivity. J. Geophys. Res. 1994, 99, 4533–4548. [Google Scholar] [CrossRef]
- Tandom, R.S.; Gupta, V. Estimation of strength characteristics of different Himalayan rocks from Schmidt hammer rebound, point load index, and compressional wave velocity. Bull. Eng. Geol. Environ. 2015, 74, 521–533. [Google Scholar] [CrossRef]
- Saptono, S.; Kramadibrata, S.; Sulistianto, B. Using the Schmidt hammer on rock mass characteristic in sedimentary rock at Tutupan coal mine. Procedia Earth Planet. Sci. 2013, 6, 390–395. [Google Scholar] [CrossRef]
- Kahraman, S.; Bilgin, N.; Feridunoglu, C. Dominant rock properties affecting the penetration rate of percussive drills. Int. J. Rock Mech. Min. Sci. 2003, 40, 711–723. [Google Scholar] [CrossRef]
- Behnia, D.; Behnia, M.; Shahriar, K.; Goshtasbi, K. A new predictive model for rock strength parameters utilizing GEP method. Procedia Eng. 2017, 191, 591–599. [Google Scholar] [CrossRef]
- Vishnu, C.S.; Mamtani, M.A.; Basu, A. AMS, ultrasonic P-wave velocity and rock strength analysis in quartzites devoid of mesoscopic foliations—Implications for rock mechanics studies. Tectonophysics 2010, 494, 191–200. [Google Scholar] [CrossRef]
- Zwiessler, R.; Kenkmann, T.; Poelchau, M.H.; Nau, S.; Hess, S. On the use of a split Hopkinson pressure bar in structural geology: High strain rate deformation of Seeberger sandstone and Carrara marble under uniaxial compression. J. Struct. Geol. 2017, 97, 225–236. [Google Scholar] [CrossRef]
- Meng, Q.; Zhang, M.; Han, L.; Pu, H.; Li, H. Effects of size and strain rate on the mechanical behaviors of rock specimens under uniaxial compression. Arab. J. Geosci. 2016, 9, 1–14. [Google Scholar] [CrossRef]
- Aben, F.M.; Doan, M.-L.; Gratier, J.-P.; Renard, F. High strain rate deformation of porous sandstone and the asymmetry of earthquake damage in shallow fault zones. Earth Planet. Sci. Lett. 2017, 463, 81–91. [Google Scholar] [CrossRef]
- He, Z.; Li, G.; Tian, S.; Wang, H.; Shen, Z.; Li, J. SEM analysis on rock failure mechanism by supercritical CO2 jet impingement. J. Pet. Sci. Eng. 2016, 146, 111–120. [Google Scholar] [CrossRef]
- Kanda, Y.; Sano, S.; Saito, F.; Yashima, S. Relationships between particle size and fracture energy for single particle crushing. KONA Powder Part. J. 1985, 3, 26–31. [Google Scholar] [CrossRef]
- Hogg, R. A spheroid model for the role of shape in particle size analysis. KONA Powder Part. J. 2015, 32, 227–235. [Google Scholar] [CrossRef]
- Fuerstenau, D.W.; Abouzeid, A.-Z.M.; Phatak, P.B. Effect of particulate environment on the kinetics and energetics of dry ball milling. Int. J. Miner. Process. 2010, 97, 52–58. [Google Scholar] [CrossRef]
- Tumac, D. Predicting the performance of large diameter circular saws based on Schmidt hammer and other properties for some Turkish carbonate rocks. Int. J. Rock Mech. Min. Sci. 2015, 75, 159–168. [Google Scholar] [CrossRef]
Figure 1.
Core specimens of (a) marble and (b) metasandstone.
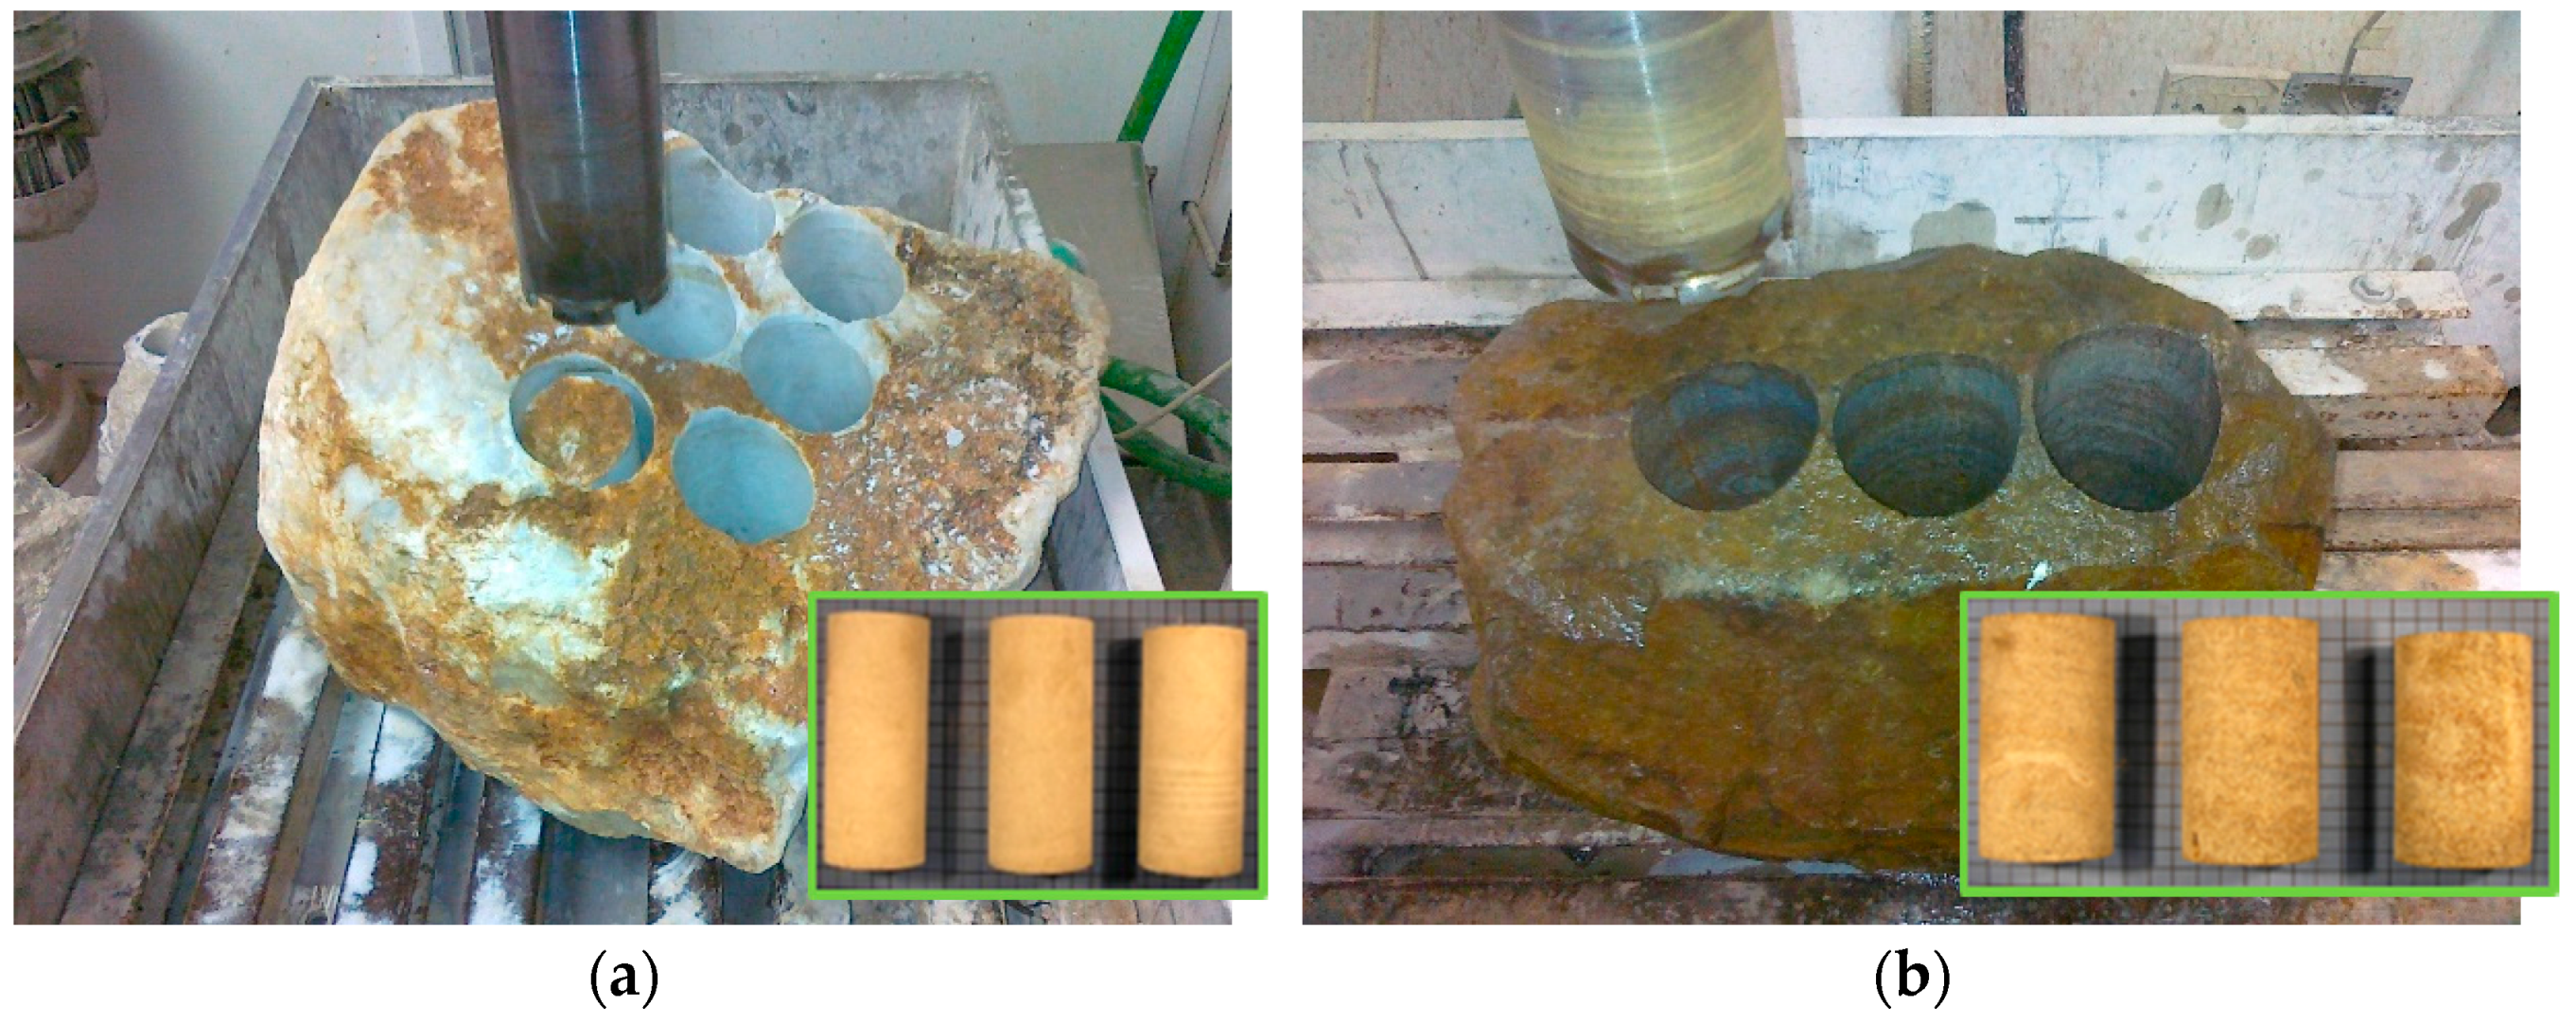
Figure 2.
P-wave velocity test for (a) marble and (b) metasandstone.
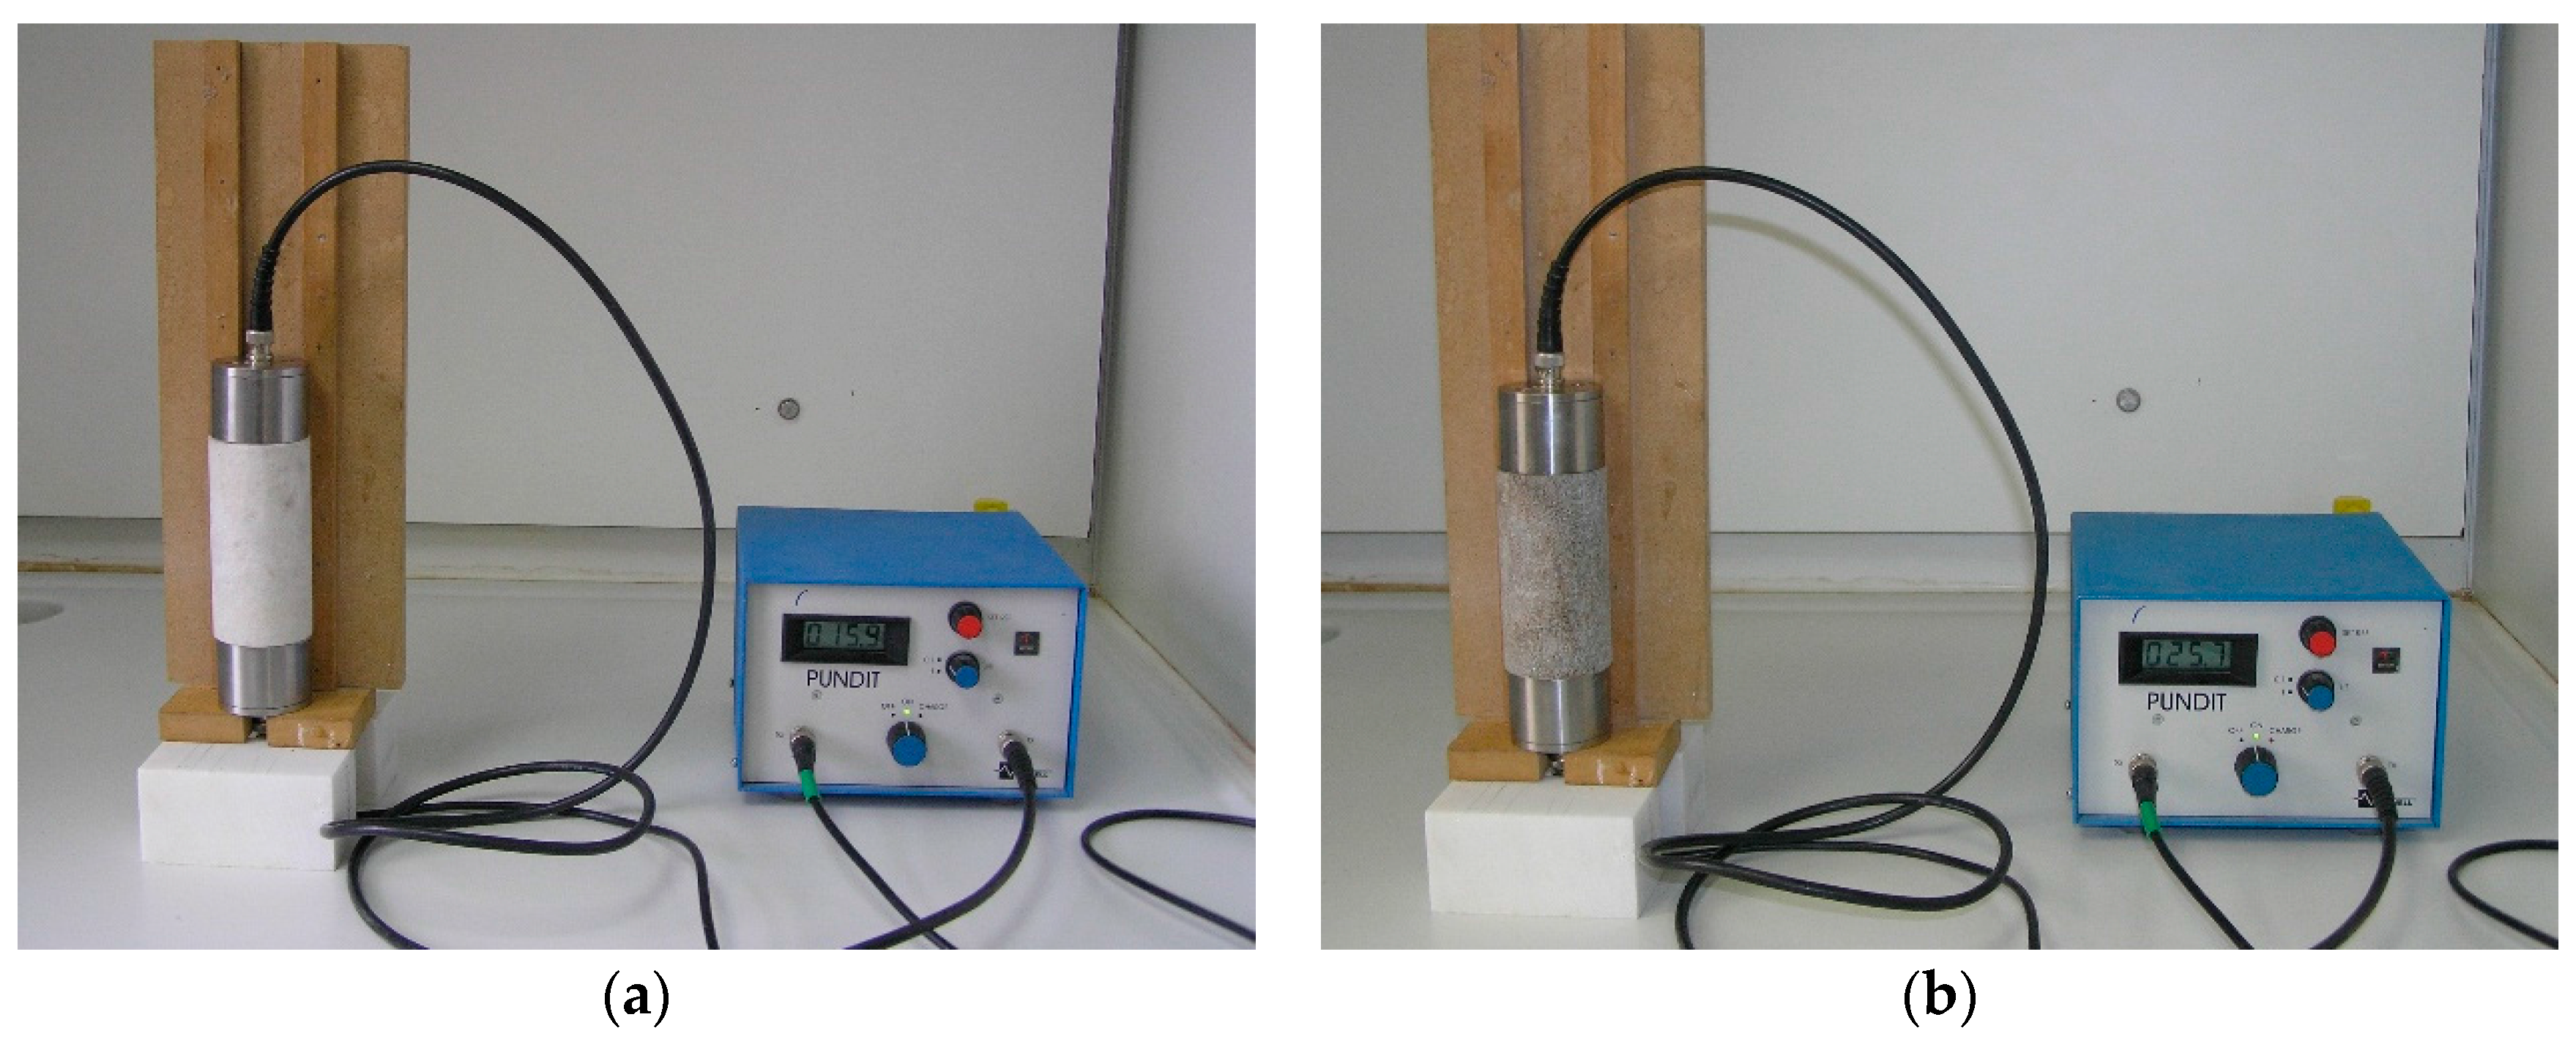
Figure 3.
Straight parallel lines drawn along the longitudinal axis of each specimen.
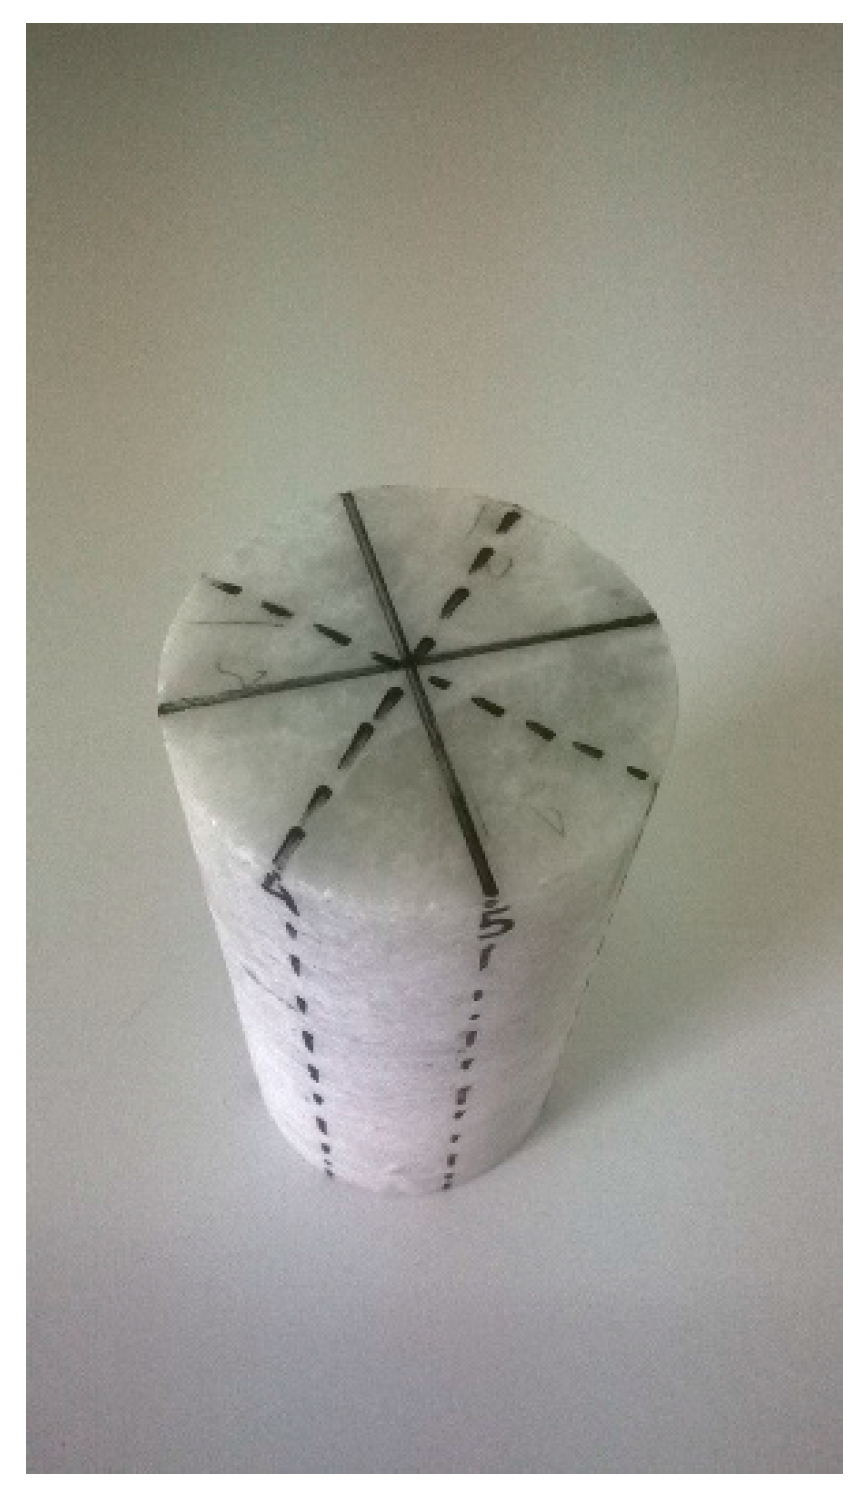
Figure 4.
The Schmidt hammer rebound test.

Figure 5.
(a) Cylindrical specimen subjected to loading; (b) Stress-strain curve for the determination of UCS and Et.
Figure 5.
(a) Cylindrical specimen subjected to loading; (b) Stress-strain curve for the determination of UCS and Et.
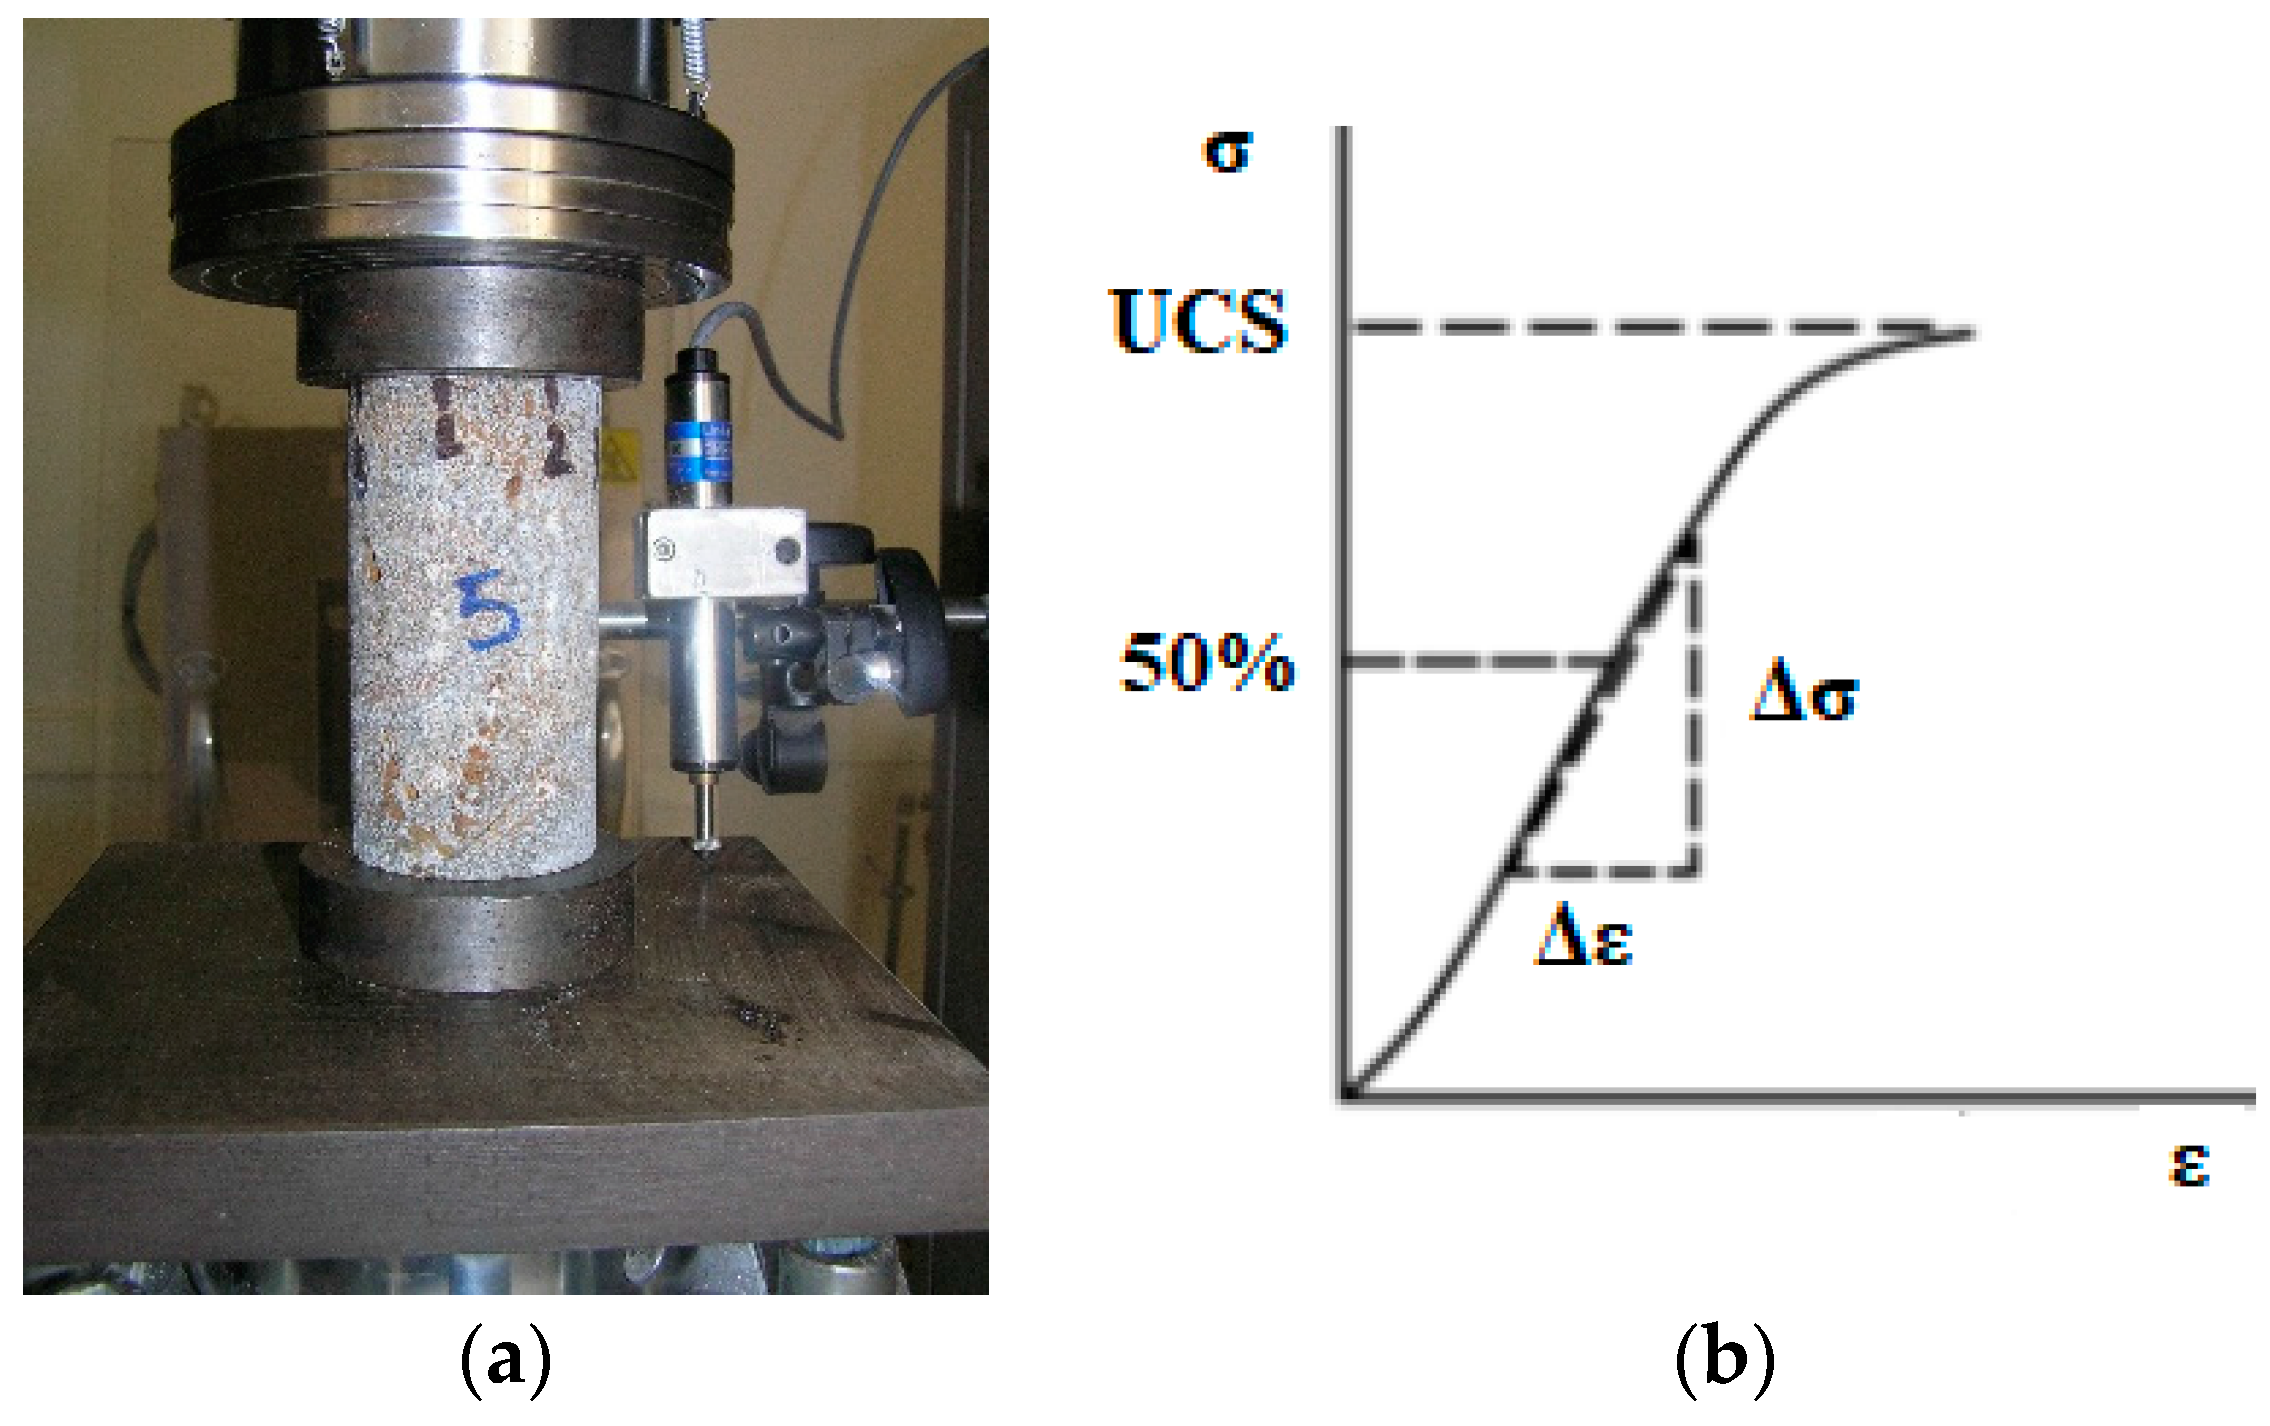
Figure 6.
P-wave velocity of all materials used.
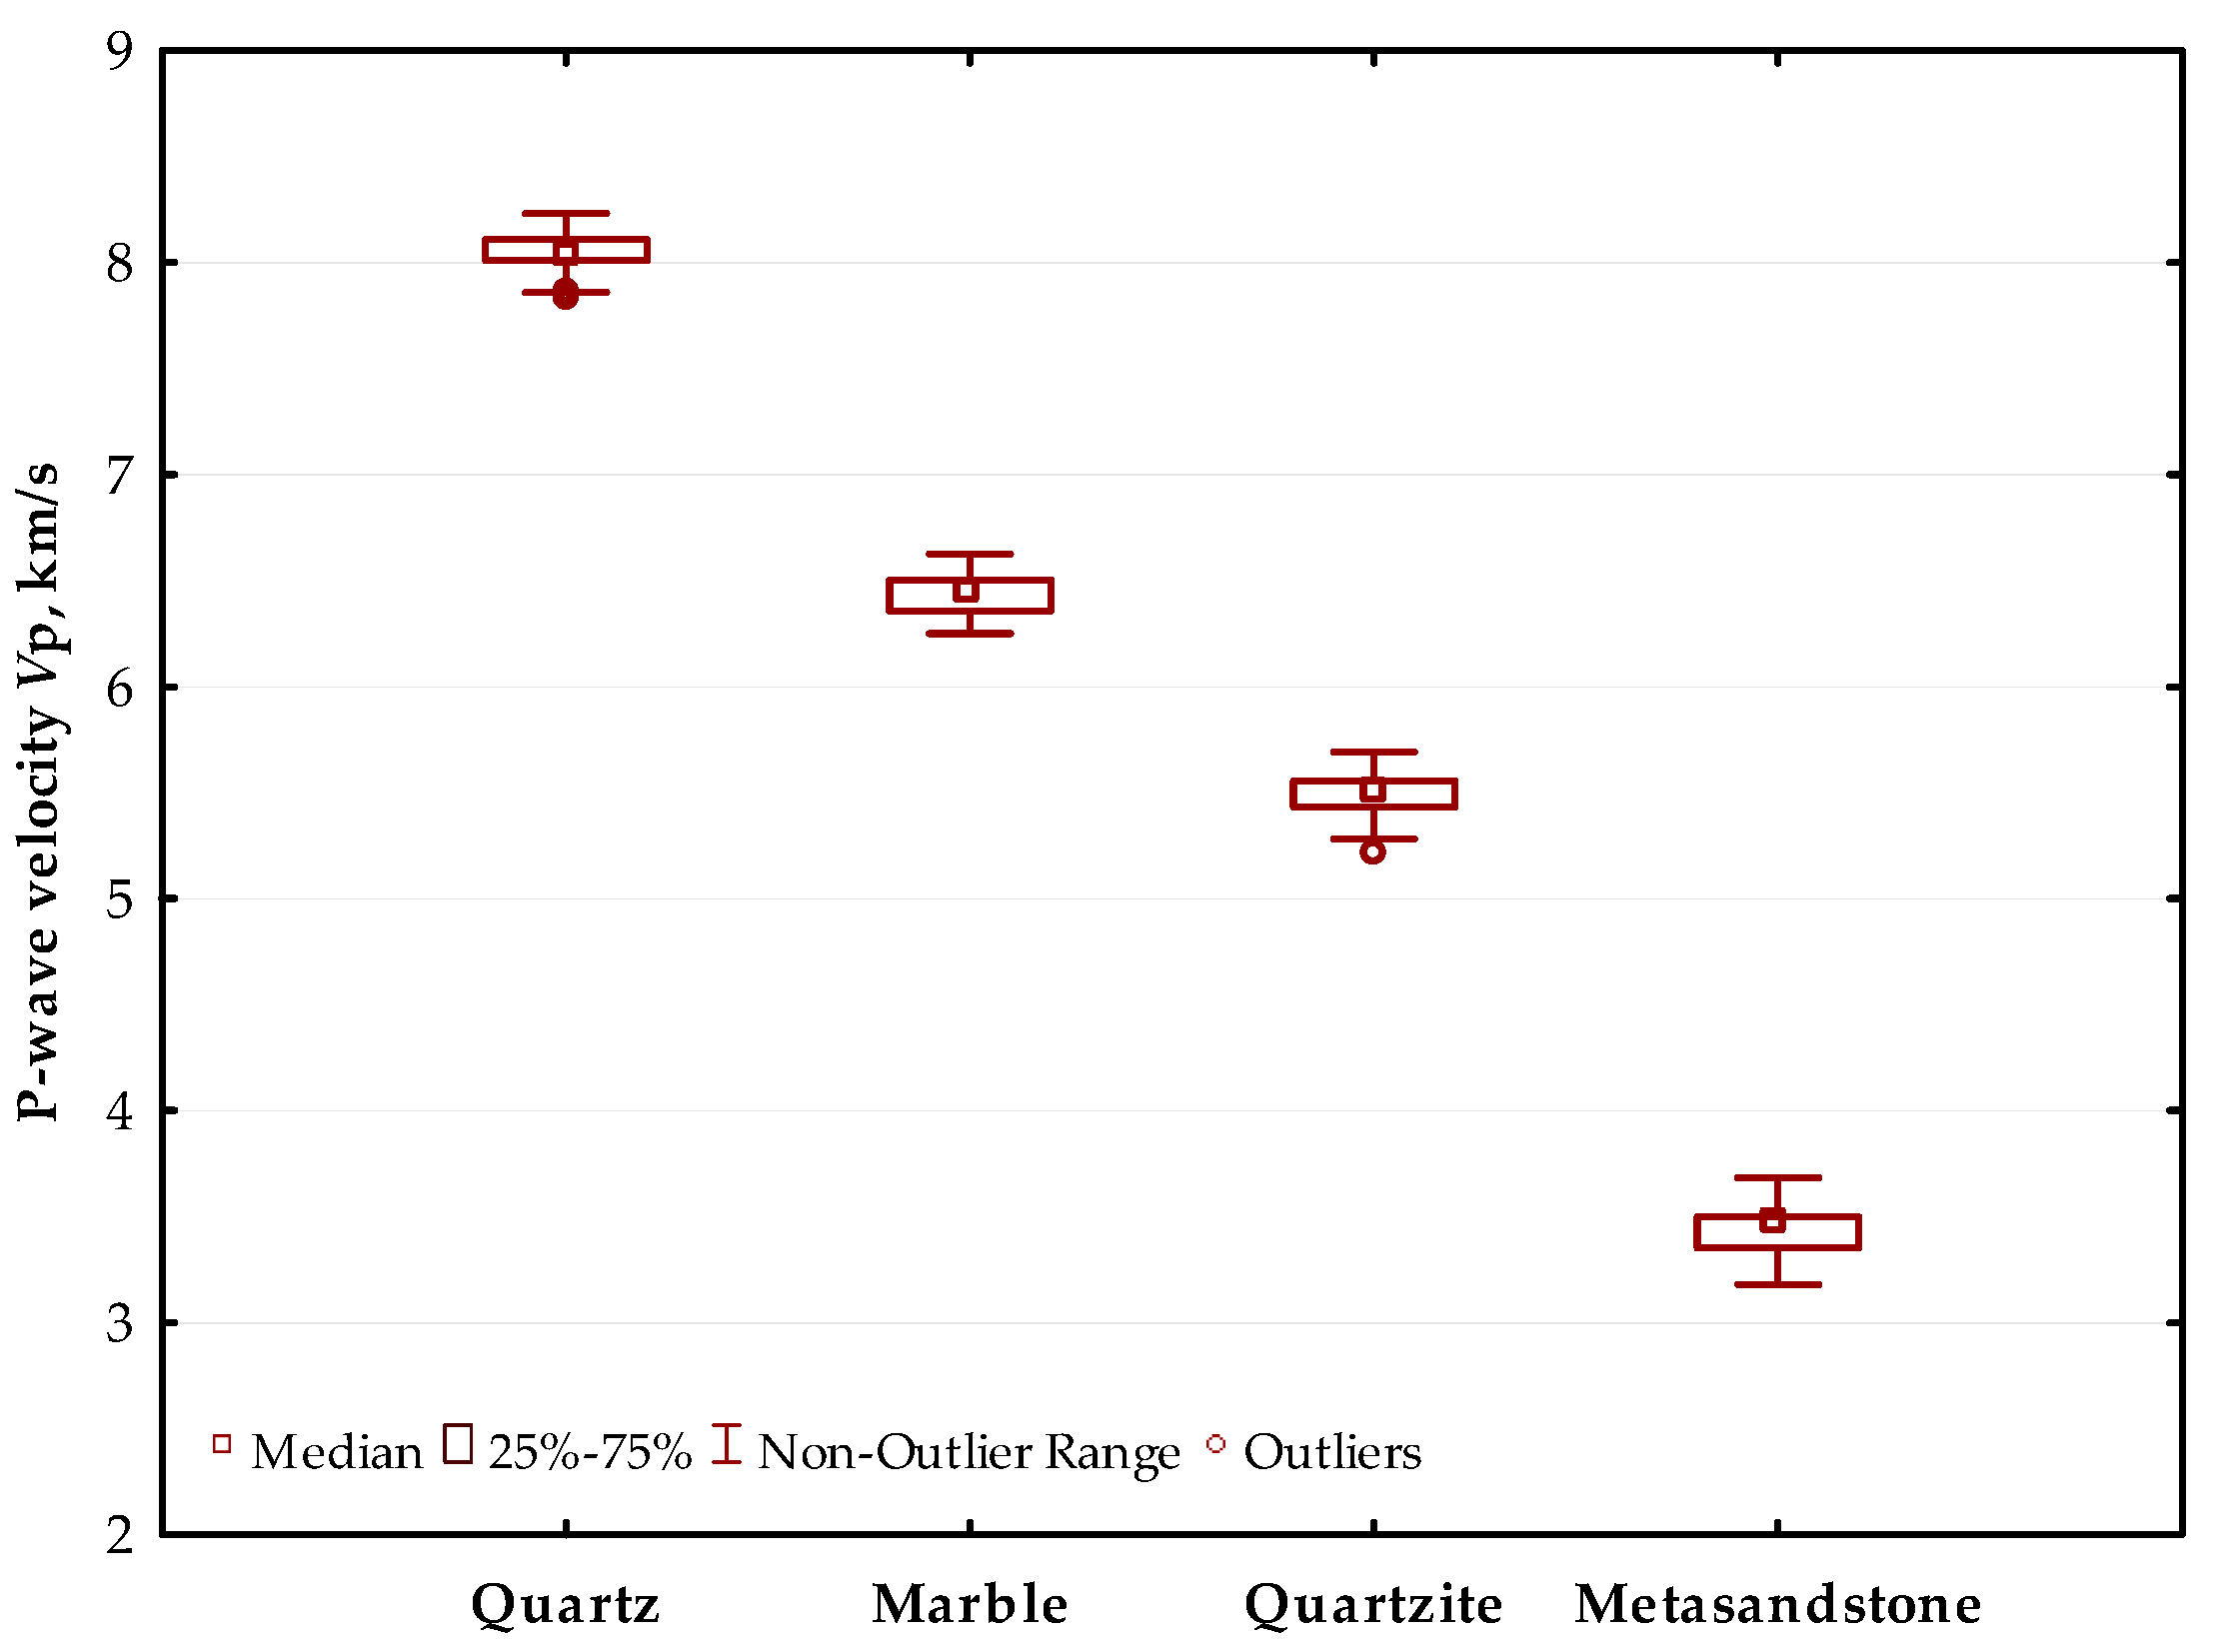
Figure 7.
Schmidt rebound values (RL) of all materials used.

Figure 8.
First order plots showing the mass % remaining for each size fraction of each material vs. grinding time; (a) quartz, (b) marble, (c) quartzite and (d) metasandstone.
Figure 8.
First order plots showing the mass % remaining for each size fraction of each material vs. grinding time; (a) quartz, (b) marble, (c) quartzite and (d) metasandstone.
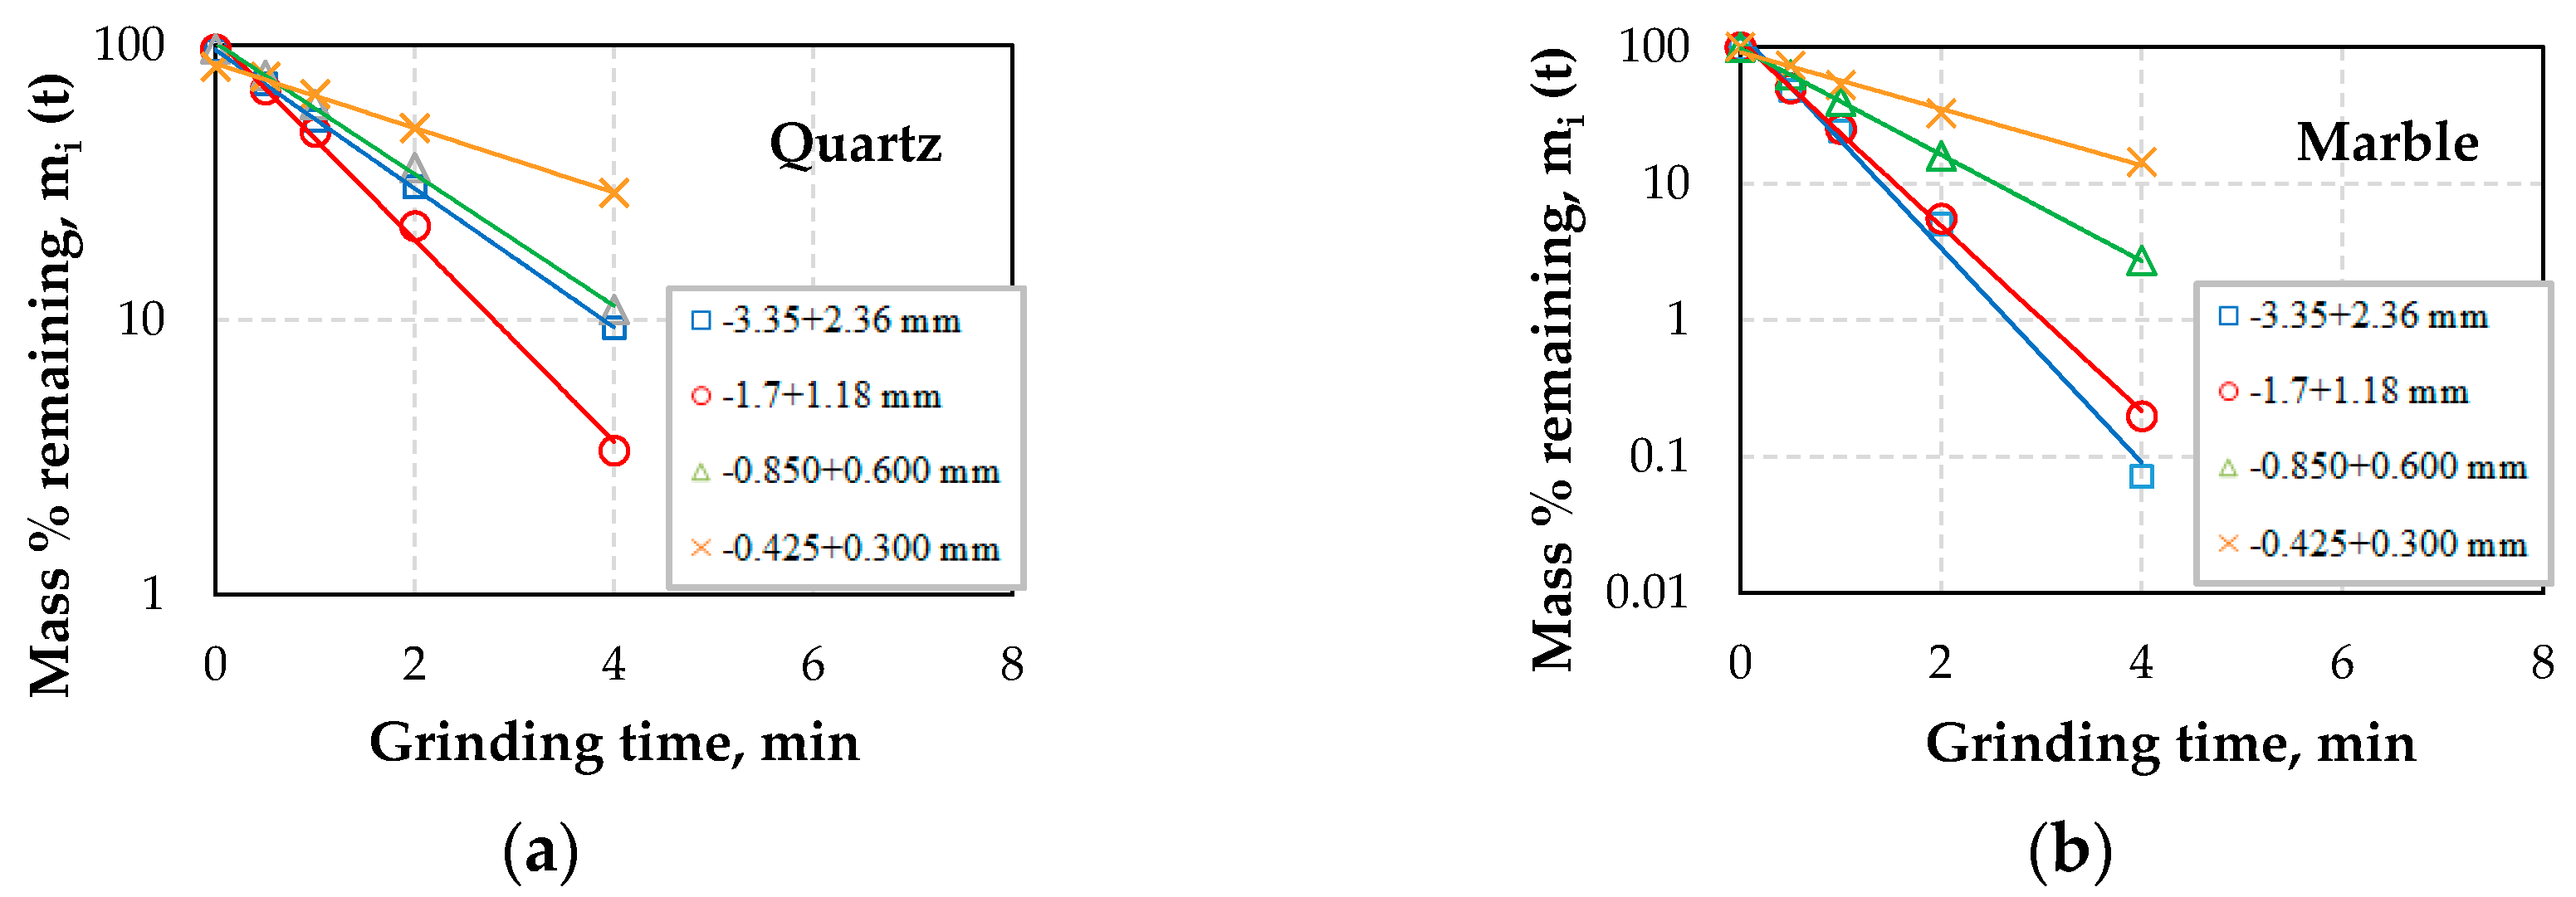

Figure 9.
Variation of breakage rate Si vs. upper feed particle size.

Figure 10.
Correlations between breakage rate Si and (a) P-wave velocity Vp, (b) Schmidt rebound values RL, (c) uniaxial compressive strength UCS and (d) tangent modulus of elasticity Et; horizontal error bars show standard deviation of the measurements.
Figure 10.
Correlations between breakage rate Si and (a) P-wave velocity Vp, (b) Schmidt rebound values RL, (c) uniaxial compressive strength UCS and (d) tangent modulus of elasticity Et; horizontal error bars show standard deviation of the measurements.

Figure 11.
Correlations between parameter αΤ and (a) P-wave velocity Vp, (b) Schmidt rebound values RL, (c) uniaxial compressive strength UCS and (d) tangent modulus of elasticity Et; horizontal error bars show standard deviation of the measurements.
Figure 11.
Correlations between parameter αΤ and (a) P-wave velocity Vp, (b) Schmidt rebound values RL, (c) uniaxial compressive strength UCS and (d) tangent modulus of elasticity Et; horizontal error bars show standard deviation of the measurements.


Figure 12.
Correlations between parameter α and (a) P-wave velocity Vp, (b) Schmidt rebound values RL, (c) uniaxial compressive strength UCS and (d) tangent modulus of elasticity Et; horizontal error bars show standard deviation of the measurements.
Figure 12.
Correlations between parameter α and (a) P-wave velocity Vp, (b) Schmidt rebound values RL, (c) uniaxial compressive strength UCS and (d) tangent modulus of elasticity Et; horizontal error bars show standard deviation of the measurements.

Figure 13.
Correlations between maximum breakage rate Sm and (a) P-wave velocity Vp, (b) Schmidt rebound values RL, (c) uniaxial compressive strength UCS and (d) tangent modulus of elasticity Et; horizontal error bars show standard deviation of the measurements.
Figure 13.
Correlations between maximum breakage rate Sm and (a) P-wave velocity Vp, (b) Schmidt rebound values RL, (c) uniaxial compressive strength UCS and (d) tangent modulus of elasticity Et; horizontal error bars show standard deviation of the measurements.

Figure 14.
Correlations between optimum size xm and (a) P-wave velocity Vp, (b) Schmidt rebound values RL, (c) uniaxial compressive strength UCS and (d) tangent modulus of elasticity Et; horizontal error bars show standard deviation of the measurements.
Figure 14.
Correlations between optimum size xm and (a) P-wave velocity Vp, (b) Schmidt rebound values RL, (c) uniaxial compressive strength UCS and (d) tangent modulus of elasticity Et; horizontal error bars show standard deviation of the measurements.


Table 1.
Porosity and density of the raw materials used.
| Material | Porosity % | Density g/cm3 |
|---|---|---|
| quartz | 0.02 | 2.65 |
| marble | 0.3 | 2.72 |
| quartzite | 0.9 | 2.59 |
| metasandstone | 8.0 | 2.11 |
Table 2.
Grinding conditions.
| Mill | Balls | Material | |||
|---|---|---|---|---|---|
| diameter, D (cm) | 20.4 | diameter, d (mm) | 25.4 | density (g/cm3) | quartz (2.65) |
| length, L (cm) | 16.6 | number | 77 | marble (2.72) | |
| volume, V (cm3) | 5423 | weight (g) | 5149 | quartzite (2.59) | |
| operational speed, Ν (rpm) | 66 | density (g/cm3) | 7.85 | metasandstone (2.11) | |
| critical speed, Νc (rpm) | 93.7 | porosity (%) | 40 | material filling volume, fc (%) | 4 |
| ball filling volume, J (%) | 20 | interstitial filling, U (%) | 50 | ||
Table 3.
The statistical results of uniaxial compressive strength (UCS) (MPa).
| Material | Observations | Mean | Minimum | Maximum | Median | Std. Dev. |
|---|---|---|---|---|---|---|
| Quartz | 7 | 135.1 | 122.0 | 151.5 | 132.0 | 12.4 |
| Marble | 8 | 68.0 | 58.6 | 100.4 | 63.5 | 13.7 |
| Quartzite | 7 | 80.9 | 68.0 | 110.0 | 76.7 | 15.4 |
| Metasandstone | 7 | 57.6 | 42.6 | 74.6 | 64.0 | 14.0 |
Table 4.
The statistical results of Et (GPa).
| Material | Observations | Mean | Minimum | Maximum | Median | Std. Dev. |
|---|---|---|---|---|---|---|
| Quartz | 7 | 59.5 | 47.5 | 71.2 | 62.8 | 9.1 |
| Marble | 8 | 48.2 | 21.5 | 64.9 | 53.0 | 15.8 |
| Quartzite | 7 | 41.7 | 26.7 | 56.2 | 44.8 | 11.0 |
| Metasandstone | 7 | 27.1 | 10.7 | 39.0 | 31.0 | 10.9 |
Table 5.
Breakage rate parameters for all materials used.
| Material | Si | αΤ | α | Sm | xm |
|---|---|---|---|---|---|
| min−1 | min−1 | min−1 | mm | ||
| Quartz | 0.55 | 0.68 | 0.80 | 0.85 | 1.80 |
| Marble | 0.89 | 1.09 | 0.90 | 1.83 | 2.84 |
| Quartzite | 0.83 | 0.98 | 0.84 | 1.29 | 2.00 |
| Metasandstone | 1.05 | 1.41 | 1.12 | 2.45 | 2.32 |
Table 6.
Correlation matrix for study variables.
| Property | Si | αΤ | α | Sm | Vp | Et | RL | UCS |
|---|---|---|---|---|---|---|---|---|
| Si | 1 | |||||||
| αΤ | 0.982 | 1 | ||||||
| α | 0.856 | 0.938 | 1 | |||||
| Sm | 0.950 | 0.983 | 0.947 | 1 | ||||
| Vp | −0.922 | −0.938 | −0.886 | −0.865 | 1 | |||
| Et | −0.923 | −0.939 | −0.886 | −0.866 | 1.000 | 1 | ||
| RL | −0.990 | −0.991 | −0.896 | −0.983 | 0.893 | 0.895 | 1 | |
| UCS | −0.977 | −0.923 | −0.733 | −0.888 | 0.842 | 0.843 | 0.956 | 1 |
© 2018 by the authors. Licensee MDPI, Basel, Switzerland. This article is an open access article distributed under the terms and conditions of the Creative Commons Attribution (CC BY) license (http://creativecommons.org/licenses/by/4.0/).
Share and Cite
MDPI and ACS Style
Petrakis, E.; Komnitsas, K. Correlation between Material Properties and Breakage Rate Parameters Determined from Grinding Tests. Appl. Sci. 2018, 8, 220. https://doi.org/10.3390/app8020220
AMA Style
Petrakis E, Komnitsas K. Correlation between Material Properties and Breakage Rate Parameters Determined from Grinding Tests. Applied Sciences. 2018; 8(2):220. https://doi.org/10.3390/app8020220
Chicago/Turabian StylePetrakis, Evangelos, and Konstantinos Komnitsas. 2018. "Correlation between Material Properties and Breakage Rate Parameters Determined from Grinding Tests" Applied Sciences 8, no. 2: 220. https://doi.org/10.3390/app8020220
Note that from the first issue of 2016, this journal uses article numbers instead of page numbers. See further details here.